Engineering Technology - Chaffey College€¦ · This report draws on the Engineering Technology,...
22
Engineering Technology Needs Assessment Page 1 Engineering Technology August 2015 Needs Assessment Prepared by Danielle Pearson Date: August 11, 2015 Engineering Technology
Transcript of Engineering Technology - Chaffey College€¦ · This report draws on the Engineering Technology,...

Engineering Technology Needs Assessment Page 1
Engineering Technology
August 2015 Needs Assessment
Prepared by Danielle Pearson
Date: August 11, 2015 Engineering Technology
Engineering Technology Needs Assessment Page 2
Scope Data compiled in this report covers San Bernardino, Riverside, Orange, and Los Angeles Counties. Data were drawn from external sources, including the Employment Development Department’s California Labor Market Information and the U.S. Department of Education’s Integrated Postsecondary Education Data System (IPEDS), as well as Chaffey College’s Colleague Administrative database. Data Sources and Calculations Educational Program Data TOP Code Program of Study 0924.00 Engineering Technology, General
The Taxonomy of Programs (TOP) is a standardized system used at the state level to classify programs and courses that are intended to achieve the same outcome at California Community Colleges. The Engineering Technology program at Chaffey College is classified under the Engineering Technology, General TOP code. CIP Code Program of Study
15.0000 Engineering Technology, General The Classification of Instructional Programs (CIP) is a standardized coding system used at the federal level to facilitate accurate tracking, assessment, and reporting of fields of study and program completion at educational institutions throughout the country. This report draws on the Engineering Technology, General CIP code, which maps to the Engineering Technology, General TOP code, to compare Chaffey College to other institutions and examine employment trends. Completions Data Degree and certificate data regarding students at Chaffey College were collected from the Colleague Administrative database. Degree and certificate data for all comparison schools were collected from the U.S. Department of Education’s Integrated Postsecondary Education Data System (IPEDS). All comparison institutions included in this report are postsecondary and have provided data to IPEDS. IPEDS defines postsecondary education as a formal program designed primarily for students beyond high school age. These include academic, vocational, and continuing professional education, and exclude avocational and adult basic education programs. Occupational Data SOC Code Occupational Title
17.3026 Industrial Engineering Technicians
47.1011 Mechanical Engineering Technicians
17.3021 Aerospace Engineering and Operations Technician
17.0322 Civil Engineering Technicians
17.3023 Electrical and Electronic Engineering Technicians
17.3025 Environmental Engineering Technicians
17.3029 Engineering Technicians, Except Drafters, All Other

Engineering Technology Needs Assessment Page 3
The Standard Occupational Classification (SOC) system is used by federal statistical agencies to classify workers into occupational categories. While the Engineering Technology, General CIP code was not mapped to any SOC codes, SOC codes linked with Engineering Technician titles were examined in this report and are listed in the table above. Educational Program to Occupation Crosswalk The TOP-CIP-SOC Crosswalk (Employment Development Department, 2009) was used in this report to map TOP codes to CIP and SOC codes. This crosswalk allows the user to estimate labor market demand for California Community College program completers using SOC-based projections from the California Labor Market Information Division. Industry Data The North American Industry Classification System (NAICS) is used by federal statistical agencies to classify business establishments for the purpose of conducting and reporting research on the U.S. business economy. The Standard Occupation Classification codes are mapped to industry data by the California Labor Market Information Division. Industry information is used to observe trends across the industries that employ the occupations identified above.
Engineering Technology Needs Assessment Page 4
Introduction and Contents Contents Background Information 5 Regional Job Outlook 7 Largest and Fastest Growing Industry Employers 10 Regional Graduation Summary 16 Purpose and Goals Chaffey College currently offers a 29-30 unit Associate of Science degree and a 28-30 unit certificate in Engineering Technology. The Engineering Technology program is designed both for students who will transfer to a four-year college or university and students who will attain employment at the level of technician. The 2015-2016 College Catalog program description reads as follows: “The Engineering Technology Associate Degree program prepares students for employment in technical fields or to transfer to university engineering technology programs. By completing the degree or certificate requirements, students acquire a foundation in the principles of engineering, engineering design, computer-aided design, electronics, manufacturing processes, manufacturing automation, and the application of math and science in technical fields. Careers in engineering technology involve high level technical work in the creation, manufacture, production, utilization, and distribution of industrial materials, products and processes. Engineering technicians/technologists serve as members of the engineering team and engage in the management, design, production, assembly, quality control and sales activities in their respective fields. Graduates accept jobs with titles such as CAD and design technicians, engineering aides, plant maintenance personnel, designers/draftspersons, production assistants, project managers, sales engineers, consultants, design/production assistant, manufacturing support and lab technicians/technologists within many disciplines of engineering technology. With additional experience, promotion to positions such as industrial supervisors, machine and tool designers, technical buyers, production expeditors, and cost estimators is possible.”
The purpose of this report is to integrate and analyze data from multiple sources to determine labor market needs for the Engineering Technology program at Chaffey College. Regional Definitions Inland Empire includes the Riverside-San Bernardino-Ontario Metropolitan Statistical Area (MSA) Los Angeles County includes the Los Angeles-Long Beach-Glendale Metropolitan Division Orange County includes the Santa Ana-Anaheim-Irvine Metropolitan Division Key Terms and Concepts Replacement Jobs: Replacement jobs refer to the number of job openings due to workers leaving an occupation. Annual Openings: Annual openings are calculated by adding the number of new jobs to the number of replacement jobs, divided by the number of years in the projection period. Projections: Projections of employment are calculated by the Employment Development Department and are based on a mathematical formula that includes historical employment and economic indicators along with national, state, and local trends. Occupation: Jobs are grouped into occupations using the federal Standard Occupational Classification (SOC) system. Industry: Occupations are grouped into industries using the North American Industry Classification System (NAICS). Wages: Hourly wages are reported in percentiles and averages. The 25th percentile is a useful proxy of entry-level wages and the 75th percentile of experienced-level wages.

Engineering Technology Needs Assessment Page 5
Background Information
Engineering Technology, General (requires Trigonometry)
Engineering Technology, General, programs in California Community Colleges prepare students for technical support of engineering, including the use of civil and mechanical engineering principles, physical sciences, basic physics, mathematics, surveying, materials testing, hydraulics and pneumatics, and the preparation of plans, specifications, and engineering reports.1 The following occupational categories provide employment opportunities for completers of Engineering Technology, General, programs. The descriptions of job duties are provided by the Occupational Information Network.2
Industrial Engineering Technicians2
Industrial Engineering Technicians apply engineering theory and principles to problems of industrial layout or manufacturing production, usually under the direction of engineering staff. They may perform time and motion studies on worker operations in a variety of industries for purposes such as establishing standard production rates or improving efficiency. Typical Tasks
♦ Design new equipment or materials or recommend revision to methods of operation, material handling, equipment layout, or other changes to increase production or improve standards
♦ Test selected products at specified stages in the production process for performance characteristics or adherence to specifications
♦ Compile and evaluate statistical data to determine and maintain quality and reliability of products
♦ Study time, motion, methods, or speed involved in maintenance, production, or other operations to establish standard production rate or improve efficiency
♦ Interpret engineering drawings, schematic diagrams, or formulas for management or engineering staff
♦ Read worker logs, product processing sheets, or specification sheets to verify that records adhere to quality assurance specifications
♦ Verify that equipment is being operated and maintained according to quality assurance standards by observing worker performance
♦ Evaluate data and write reports to validate or indicate deviations from existing standards
♦ Recommend modifications to existing quality or production standards to achieve optimum quality within limits of equipment capability
♦ Aid in planning work assignments in accordance with worker performance, machine capacity, production schedules, or anticipated delays
Engineering Technology Needs Assessment Page 6
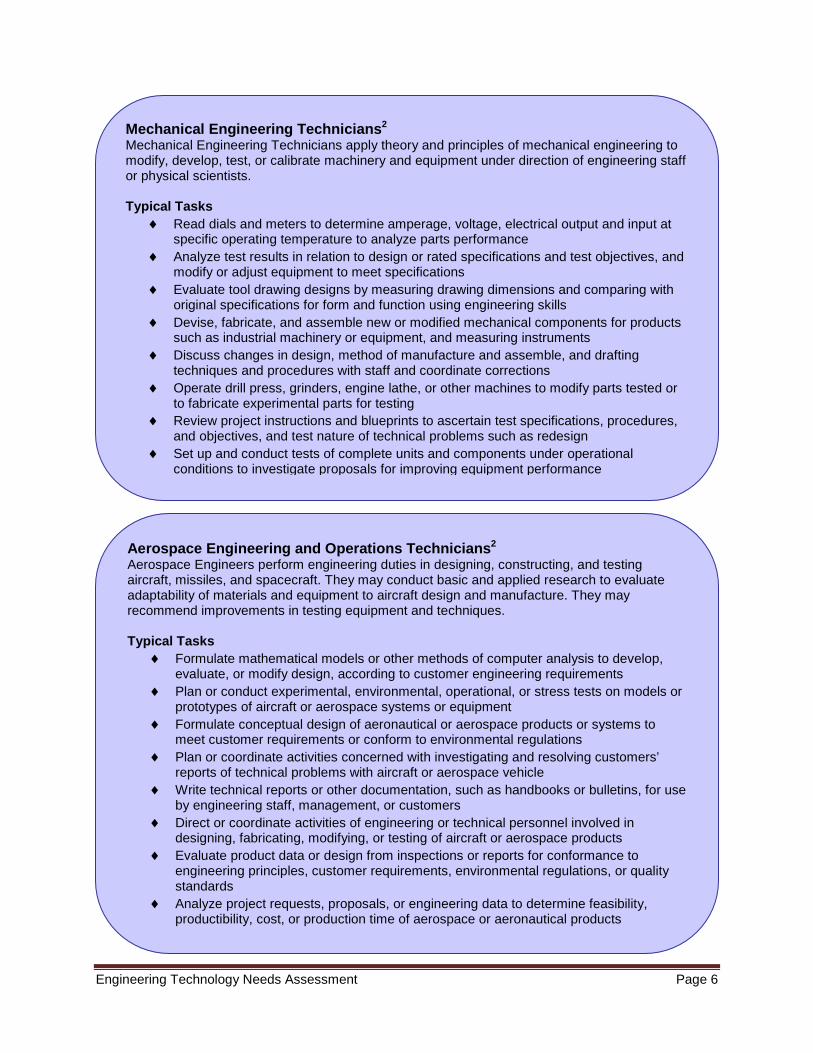
Mechanical Engineering Technicians2
Mechanical Engineering Technicians apply theory and principles of mechanical engineering to modify, develop, test, or calibrate machinery and equipment under direction of engineering staff or physical scientists. Typical Tasks
♦ Read dials and meters to determine amperage, voltage, electrical output and input at specific operating temperature to analyze parts performance
♦ Analyze test results in relation to design or rated specifications and test objectives, and modify or adjust equipment to meet specifications
♦ Evaluate tool drawing designs by measuring drawing dimensions and comparing with original specifications for form and function using engineering skills
♦ Devise, fabricate, and assemble new or modified mechanical components for products such as industrial machinery or equipment, and measuring instruments
♦ Discuss changes in design, method of manufacture and assemble, and drafting techniques and procedures with staff and coordinate corrections
♦ Operate drill press, grinders, engine lathe, or other machines to modify parts tested or to fabricate experimental parts for testing
♦ Review project instructions and blueprints to ascertain test specifications, procedures, and objectives, and test nature of technical problems such as redesign
♦ Set up and conduct tests of complete units and components under operational conditions to investigate proposals for improving equipment performance
Aerospace Engineering and Operations Technicians2
Aerospace Engineers perform engineering duties in designing, constructing, and testing aircraft, missiles, and spacecraft. They may conduct basic and applied research to evaluate adaptability of materials and equipment to aircraft design and manufacture. They may recommend improvements in testing equipment and techniques. Typical Tasks
♦ Formulate mathematical models or other methods of computer analysis to develop, evaluate, or modify design, according to customer engineering requirements
♦ Plan or conduct experimental, environmental, operational, or stress tests on models or prototypes of aircraft or aerospace systems or equipment
♦ Formulate conceptual design of aeronautical or aerospace products or systems to meet customer requirements or conform to environmental regulations
♦ Plan or coordinate activities concerned with investigating and resolving customers’ reports of technical problems with aircraft or aerospace vehicle
♦ Write technical reports or other documentation, such as handbooks or bulletins, for use by engineering staff, management, or customers
♦ Direct or coordinate activities of engineering or technical personnel involved in designing, fabricating, modifying, or testing of aircraft or aerospace products
♦ Evaluate product data or design from inspections or reports for conformance to engineering principles, customer requirements, environmental regulations, or quality standards
♦ Analyze project requests, proposals, or engineering data to determine feasibility, productibility, cost, or production time of aerospace or aeronautical products
Engineering Technology Needs Assessment Page 7
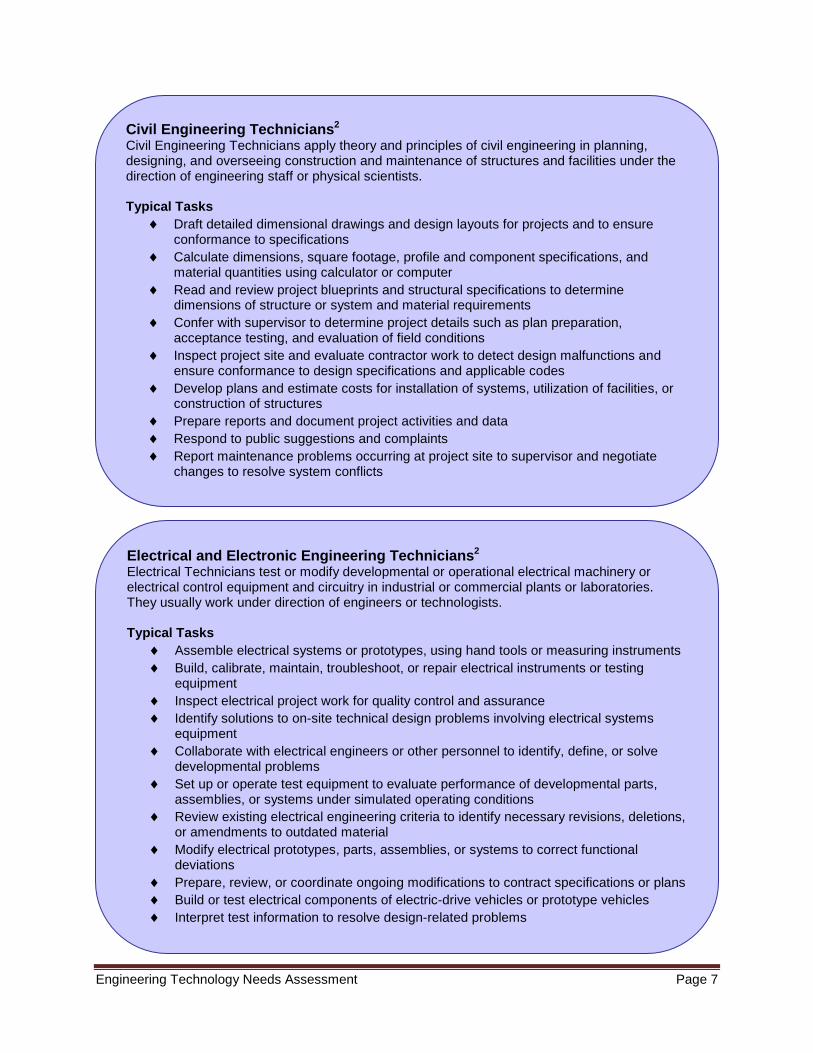
Civil Engineering Technicians2
Civil Engineering Technicians apply theory and principles of civil engineering in planning, designing, and overseeing construction and maintenance of structures and facilities under the direction of engineering staff or physical scientists. Typical Tasks
♦ Draft detailed dimensional drawings and design layouts for projects and to ensure conformance to specifications
♦ Calculate dimensions, square footage, profile and component specifications, and material quantities using calculator or computer
♦ Read and review project blueprints and structural specifications to determine dimensions of structure or system and material requirements
♦ Confer with supervisor to determine project details such as plan preparation, acceptance testing, and evaluation of field conditions
♦ Inspect project site and evaluate contractor work to detect design malfunctions and ensure conformance to design specifications and applicable codes
♦ Develop plans and estimate costs for installation of systems, utilization of facilities, or construction of structures
♦ Prepare reports and document project activities and data ♦ Respond to public suggestions and complaints ♦ Report maintenance problems occurring at project site to supervisor and negotiate
changes to resolve system conflicts
Electrical and Electronic Engineering Technicians2
Electrical Technicians test or modify developmental or operational electrical machinery or electrical control equipment and circuitry in industrial or commercial plants or laboratories. They usually work under direction of engineers or technologists. Typical Tasks
♦ Assemble electrical systems or prototypes, using hand tools or measuring instruments ♦ Build, calibrate, maintain, troubleshoot, or repair electrical instruments or testing
equipment ♦ Inspect electrical project work for quality control and assurance ♦ Identify solutions to on-site technical design problems involving electrical systems
equipment ♦ Collaborate with electrical engineers or other personnel to identify, define, or solve
developmental problems ♦ Set up or operate test equipment to evaluate performance of developmental parts,
assemblies, or systems under simulated operating conditions ♦ Review existing electrical engineering criteria to identify necessary revisions, deletions,
or amendments to outdated material ♦ Modify electrical prototypes, parts, assemblies, or systems to correct functional
deviations ♦ Prepare, review, or coordinate ongoing modifications to contract specifications or plans ♦ Build or test electrical components of electric-drive vehicles or prototype vehicles ♦ Interpret test information to resolve design-related problems
Engineering Technology Needs Assessment Page 8
1 California Community Colleges, Chancellor’s Office, Taxonomy of Programs, Sixth Edition (Corrected Version). 2 O*Net Online: http://www.onetonline.org/find/
Environmental Engineering Technicians2
Environmental Engineering Technicians apply theory and principles of environmental engineering to modify, test, and operate equipment and devices used in the prevention, control, and remediation of environmental problems, including waste treatment and site remediation, under the direction of engineering staff or scientist. They may assist in the development of environmental remediation devices. Typical Tasks
♦ Maintain project logbook records or computer program files ♦ Record laboratory or field data, including numerical data, test results, photographs, or
summaries of visual observations ♦ Perform environmental quality work in field or office settings ♦ Produce environmental assessment reports, tabulating data and preparing charts,
graphs, or sketches ♦ Collect and analyze pollution samples, such as air or ground water ♦ Decontaminate or test field equipment used to clean or test pollutants from soil, air, or
water ♦ Prepare and package environmental samples for shipping or testing ♦ Maintain process parameters and evaluate process anomalies ♦ Review technical documents to ensure completeness and conformance to
requirements ♦ Receive, set up, test, or decontaminate equipment
Engineering Technicians, Except Drafters, All Other2
This job title includes those in occupations with a wide range of characteristics. This includes Non-Destructive Testing Specialists, Electromechanical Engineering Technologists, Manufacturing Engineering Technologists, Photonics Technicians, Manufacturing Production Technicians, Fuel Cell Technicians, Nanotechnology Engineering Technologists and Technicians.

Engineering Technology Needs Assessment Page 9
Regional Job Outlook Projected Regional Job Outlook The table below displays 2012 employment estimates and 2022 projections for Engineering Technology occupations in the state of California, Inland Empire, Los Angeles County, and Orange County. Modest growth and slight declines are expected in all occupations apart from Environmental Engineering Technicians, which is expecting much growth over the next decade.
Total
Estimated 2012 Jobs
Total Projected 2022 Jobs
Projected Growth (%)
Ave. Annual New Job Openings
Ave. Annual Replacement Job Openings
Ave. Annual Total Job Openings
Industrial Engineering Technicians
State of California 4,200 4,300 100 (2.4%) 10 80 90
Inland Empire 280 290 10 (3.6%) 1 6 7
Los Angeles County 1,270 1,230 -40 (-3.2%) -4 30 26
Orange County 540 530 -10 (-1.9%) -1 12 11
Mechanical Engineering Technicians
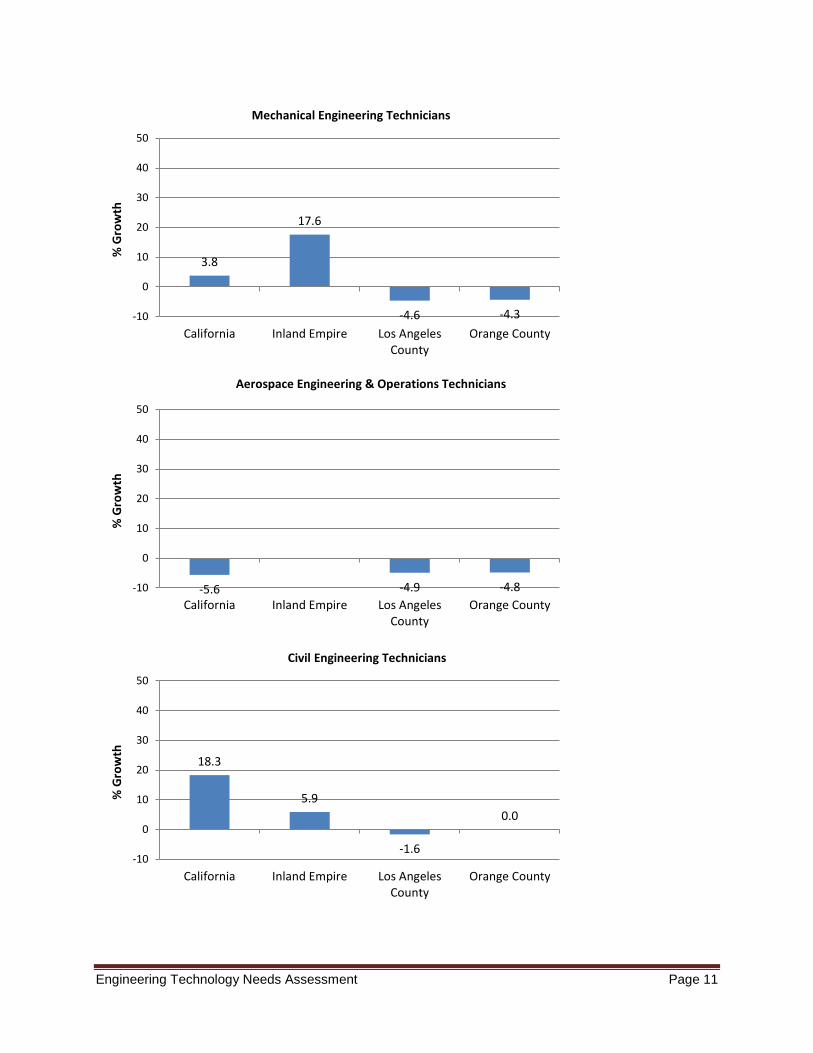
State of California 5,300 5,500 200 (3.8%) 20 110 130
Inland Empire 170 200 30 (17.6%) 3 3 6
Los Angeles County 1,090 1,040 -50 (-4.6%) -5 27 22
Orange County 700 670 -30 (-4.3%) -3 17 14
Aerospace Engineering and Operations Technician
State of California 1,800 1,700 -100 (-5.6%) -10 50 40
Inland Empire -- -- -- -- -- --
Los Angeles County 810 770 -40 (-4.9%) -4 21 17
Orange County 210 200 -10 (-4.8%) -1 5 4
Civil Engineering Technicians
State of California 39,300 46,500 7,200 (18.3%) 720 950 1,670
Inland Empire 340 360 20 (5.9%) 2 7 9
Los Angeles County 1,240 1,220 -20 (-1.6%) -2 28 26
Orange County 740 740 0 (0.0%) 0 15 15
Electrical and Electronic Engineering Technicians
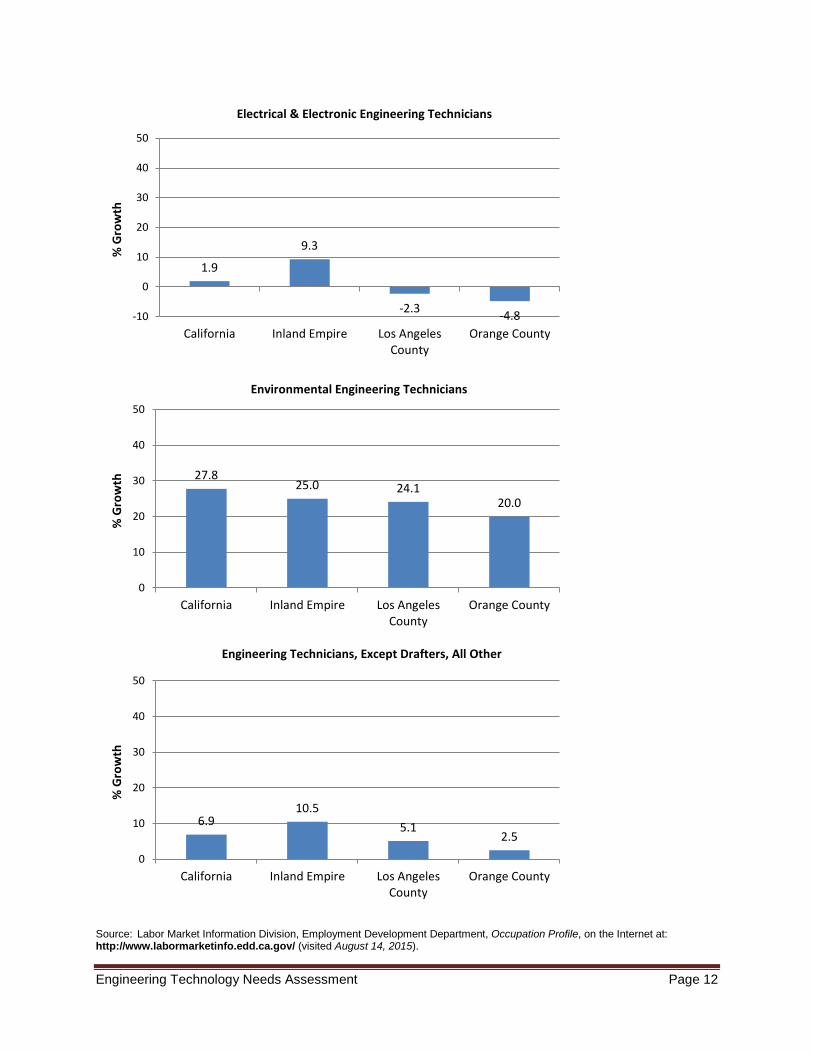
State of California 20,700 21,100 400 (1.9%) 40 430 470
Inland Empire 970 1,060 90 (9.3%) 9 20 29
Los Angeles County 3,510 3,430 -80 (-2.3%) -8 81 73
Orange County 2,490 2,370 -120 (-4.8%) -12 64 52

Engineering Technology Needs Assessment Page 10
Source: Labor Market Information Division, Employment Development Department, Occupation Profile, on the Internet at: http://www.labormarketinfo.edd.ca.gov/ (visited August 14, 2015). Projected Regional Job Growth The graphs below display the projected growth of Engineering jobs from 2012 to 2022. Most occupations are expecting a mix of low-to-modest growth and slight declines. Aerospace Engineering and Operations Technician jobs are expected to decrease across all regions, whereas Engineering Technicians, Except Drafters, are expecting modest growth in all regions and Environmental Engineering Technicians are expecting high growth in all regions.
2.4 3.6
-3.2 -1.9 -10
0
10
20
30
40
50
California Inland Empire Los AngelesCounty
Orange County
% G
row
th
Industrial Engineering Technicians
Environmental Engineering Technicians
State of California 1,800 2,300 500 (27.8%) 50 40 90
Inland Empire 200 250 50 (25.0%) 5 5 10
Los Angeles County 290 360 70 (24.1%) 7 6 13
Orange County 150 180 30 (20.0%) 3 3 6
Engineering Technicians, Except Drafters, All Other
State of California 8,700 9,300 600 (6.9%) 60 180 240
Inland Empire 570 630 60 (10.5%) 6 12 18
Los Angeles County 1,770 1,860 90 (5.1%) 9 36 45
Orange County 790 810 20 (2.5%) 2 16 18
Engineering Technology Needs Assessment Page 11
3.8
17.6
-4.6 -4.3 -10
0
10
20
30
40
50
California Inland Empire Los AngelesCounty
Orange County
% G
row
th
Mechanical Engineering Technicians
-5.6 -4.9 -4.8 -10
0
10
20
30
40
50
California Inland Empire Los AngelesCounty
Orange County
% G
row
th
Aerospace Engineering & Operations Technicians
18.3
5.9
-1.6
0.0
-10
0
10
20
30
40
50
California Inland Empire Los AngelesCounty
Orange County
% G
row
th
Civil Engineering Technicians
Engineering Technology Needs Assessment Page 12
Source: Labor Market Information Division, Employment Development Department, Occupation Profile, on the Internet at: http://www.labormarketinfo.edd.ca.gov/ (visited August 14, 2015).
1.9
9.3
-2.3 -4.8 -10
0
10
20
30
40
50
California Inland Empire Los AngelesCounty
Orange County
% G
row
th
Electrical & Electronic Engineering Technicians
27.8 25.0 24.1
20.0
0
10
20
30
40
50
California Inland Empire Los AngelesCounty
Orange County
% G
row
th
Environmental Engineering Technicians
6.9 10.5
5.1 2.5
0
10
20
30
40
50
California Inland Empire Los AngelesCounty
Orange County
% G
row
th
Engineering Technicians, Except Drafters, All Other
Engineering Technology Needs Assessment Page 13
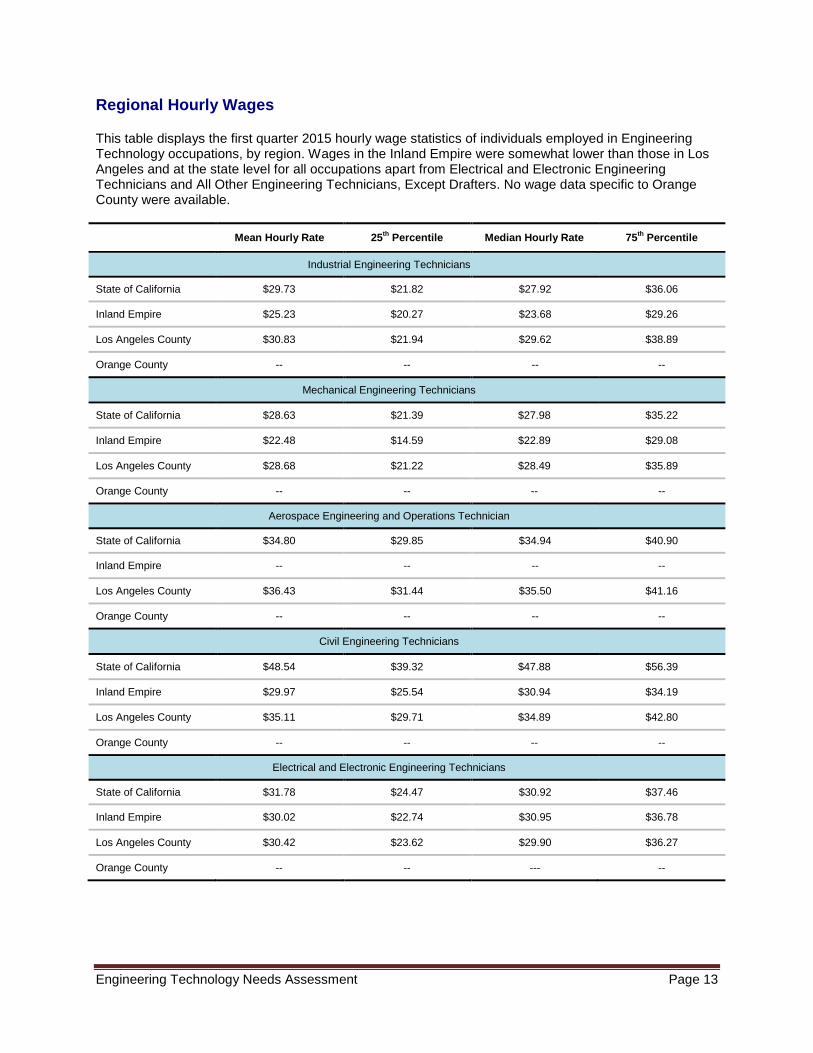
Regional Hourly Wages This table displays the first quarter 2015 hourly wage statistics of individuals employed in Engineering Technology occupations, by region. Wages in the Inland Empire were somewhat lower than those in Los Angeles and at the state level for all occupations apart from Electrical and Electronic Engineering Technicians and All Other Engineering Technicians, Except Drafters. No wage data specific to Orange County were available.
Mean Hourly Rate 25th Percentile Median Hourly Rate 75th Percentile
Industrial Engineering Technicians
State of California $29.73 $21.82 $27.92 $36.06
Inland Empire $25.23 $20.27 $23.68 $29.26
Los Angeles County $30.83 $21.94 $29.62 $38.89
Orange County -- -- -- --
Mechanical Engineering Technicians
State of California $28.63 $21.39 $27.98 $35.22
Inland Empire $22.48 $14.59 $22.89 $29.08
Los Angeles County $28.68 $21.22 $28.49 $35.89
Orange County -- -- -- --
Aerospace Engineering and Operations Technician
State of California $34.80 $29.85 $34.94 $40.90
Inland Empire -- -- -- --
Los Angeles County $36.43 $31.44 $35.50 $41.16
Orange County -- -- -- --
Civil Engineering Technicians
State of California $48.54 $39.32 $47.88 $56.39
Inland Empire $29.97 $25.54 $30.94 $34.19
Los Angeles County $35.11 $29.71 $34.89 $42.80
Orange County -- -- -- --
Electrical and Electronic Engineering Technicians
State of California $31.78 $24.47 $30.92 $37.46
Inland Empire $30.02 $22.74 $30.95 $36.78
Los Angeles County $30.42 $23.62 $29.90 $36.27
Orange County -- -- --- --

Engineering Technology Needs Assessment Page 14
Mean Hourly Rate 25th Percentile Median Hourly Rate 75th Percentile
Environmental Engineering Technicians
State of California $29.68 $21.10 $27.62 $36.19
Inland Empire $24.98 $18.65 $23.02 $29.98
Los Angeles County $30.44 $21.55 $27.44 $35.81
Orange County -- -- -- --
Engineering Technicians, Except Drafters, All Other
State of California $33.02 $24.69 $32.69 $40.55
Inland Empire $32.21 $27.65 $32.63 $36.74
Los Angeles County $32.07 $23.35 $31.54 $40.11
Orange County -- -- -- --
Note: ‘- -‘ indicates that these data were not available. Source: Labor Market Information Division, Employment Development Department, Occupation Profile, on the Internet at: http://www.labormarketinfo.edd.ca.gov/ (visited August 14, 2015).
Engineering Technology Needs Assessment Page 15
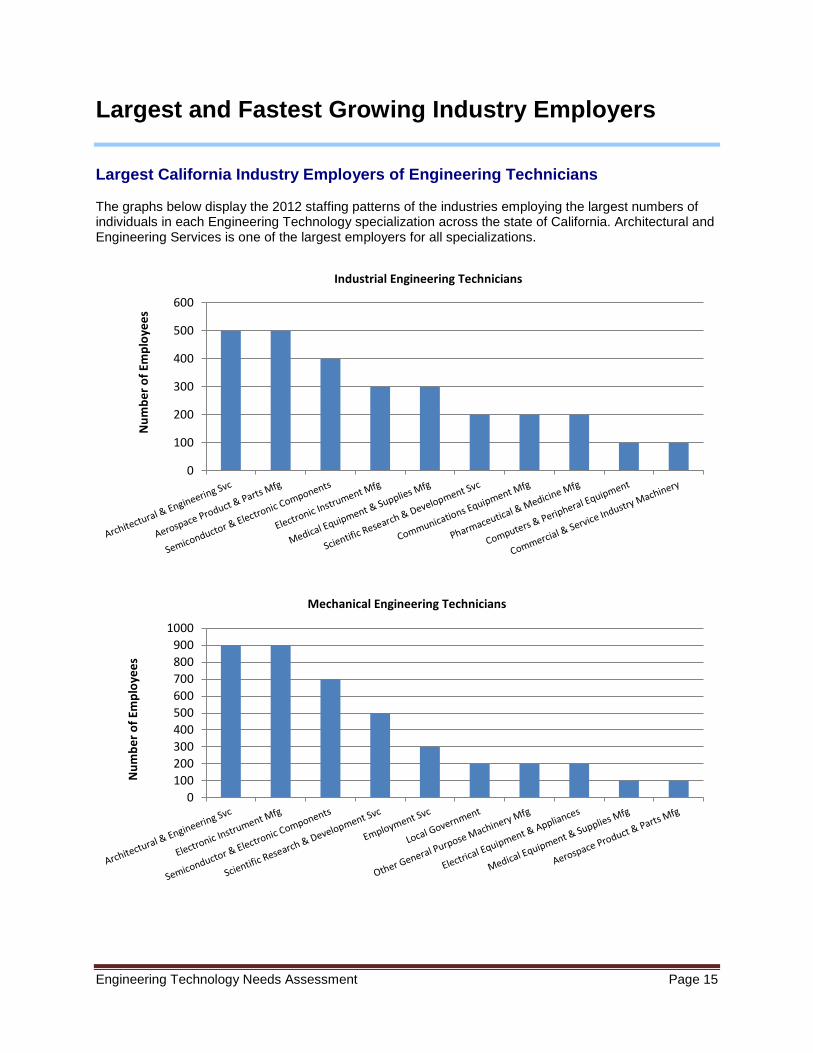
Largest and Fastest Growing Industry Employers
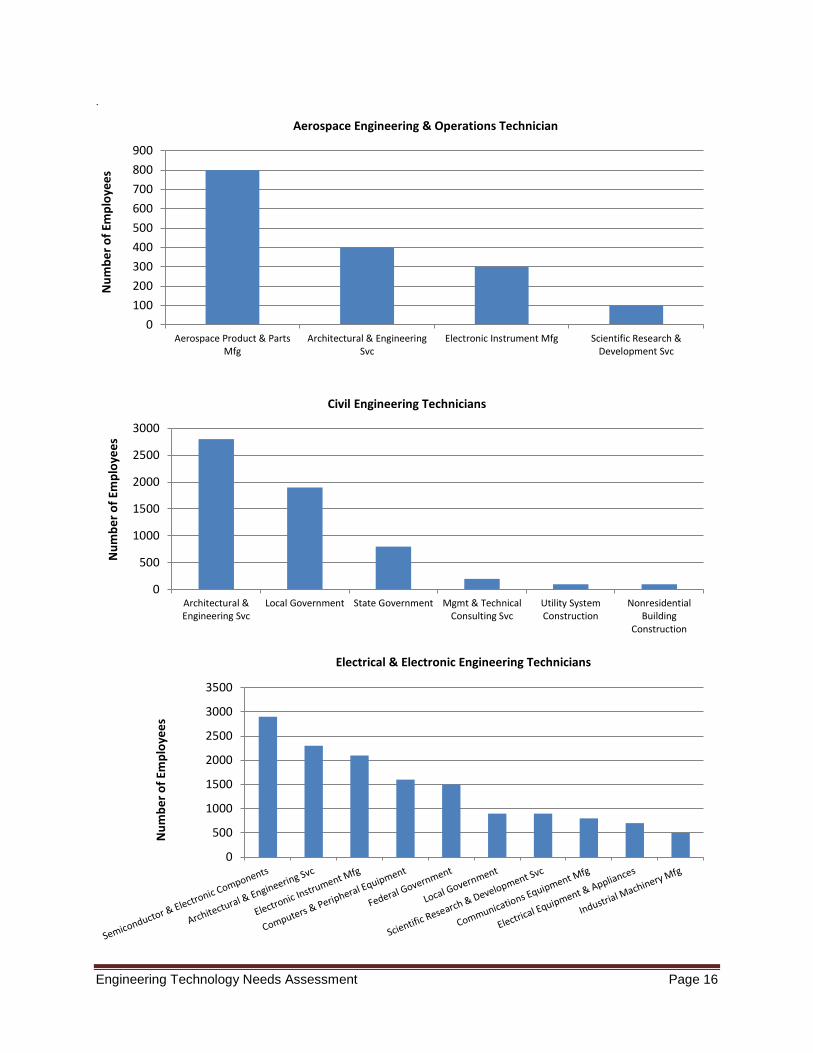
Largest California Industry Employers of Engineering Technicians The graphs below display the 2012 staffing patterns of the industries employing the largest numbers of individuals in each Engineering Technology specialization across the state of California. Architectural and Engineering Services is one of the largest employers for all specializations.
0
100
200
300
400
500
600
Num
ber o
f Em
ploy
ees
Industrial Engineering Technicians
0100200300400500600700800900
1000
Num
ber o
f Em
ploy
ees
Mechanical Engineering Technicians
Engineering Technology Needs Assessment Page 16
.
0100200300400500600700800900
Aerospace Product & PartsMfg
Architectural & EngineeringSvc
Electronic Instrument Mfg Scientific Research &Development Svc
Num
ber o
f Em
ploy
ees
Aerospace Engineering & Operations Technician
0
500
1000
1500
2000
2500
3000
Architectural &Engineering Svc
Local Government State Government Mgmt & TechnicalConsulting Svc
Utility SystemConstruction
NonresidentialBuilding
Construction
Num
ber o
f Em
ploy
ees
Civil Engineering Technicians
0
500
1000
1500
2000
2500
3000
3500
Num
ber o
f Em
ploy
ees
Electrical & Electronic Engineering Technicians
Engineering Technology Needs Assessment Page 17
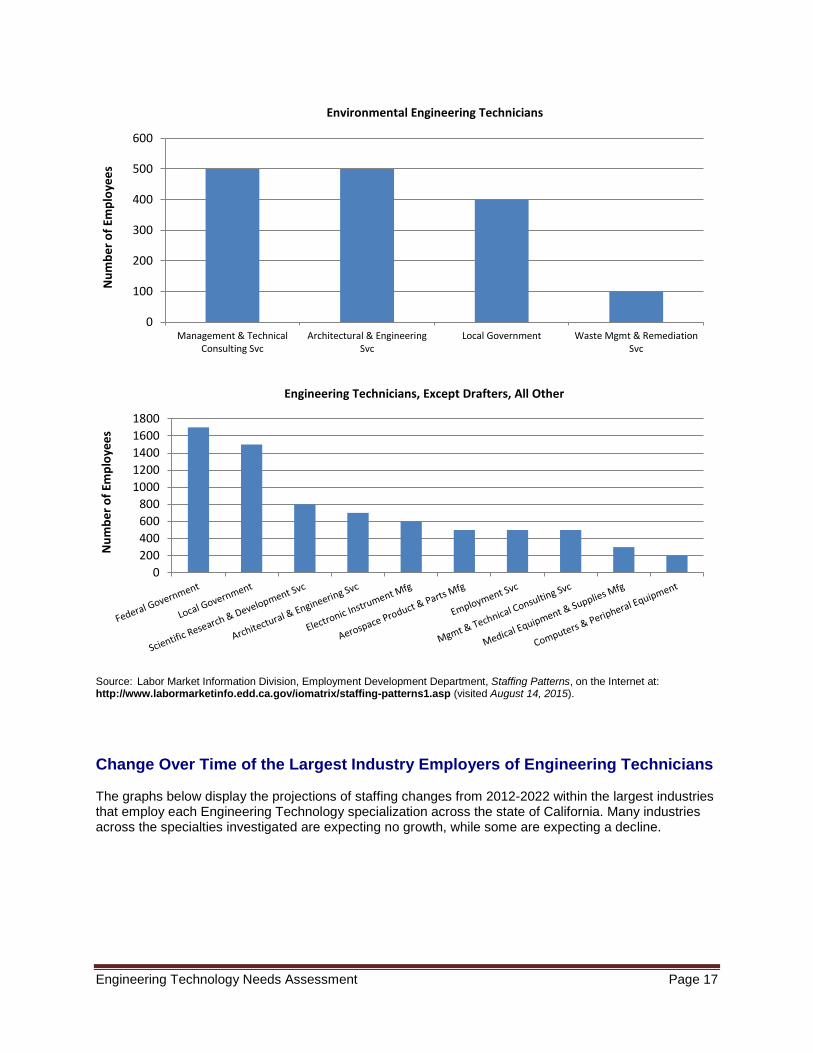
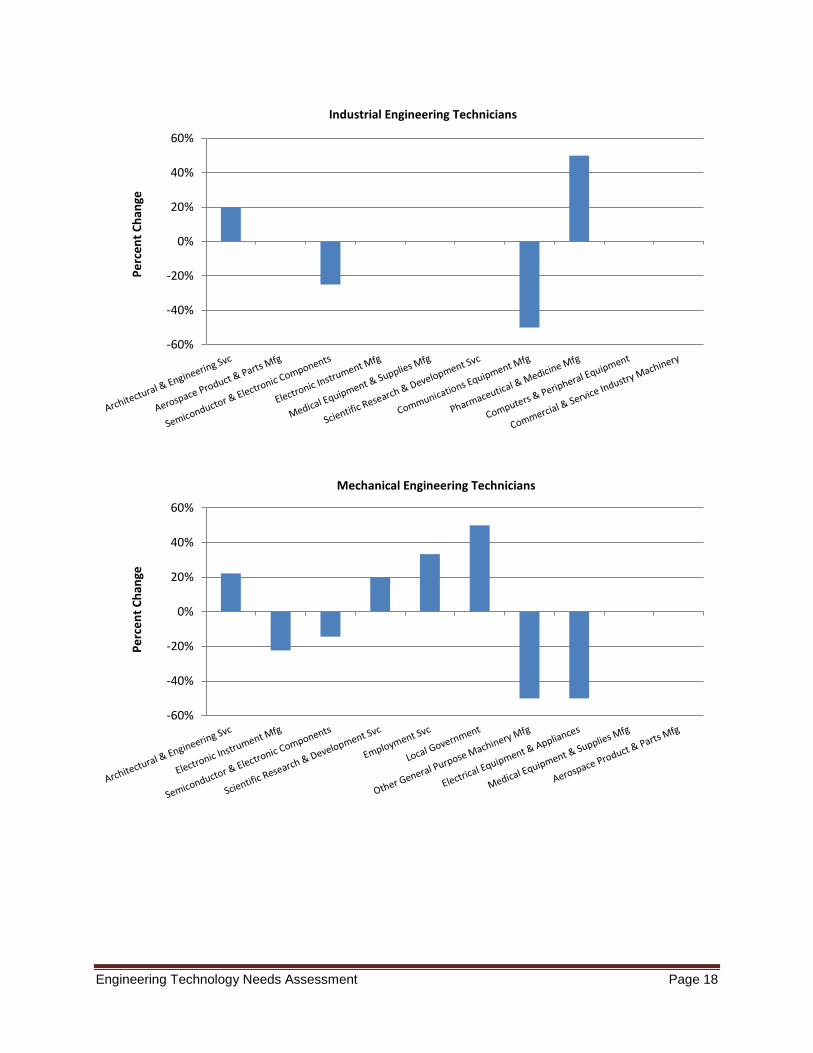
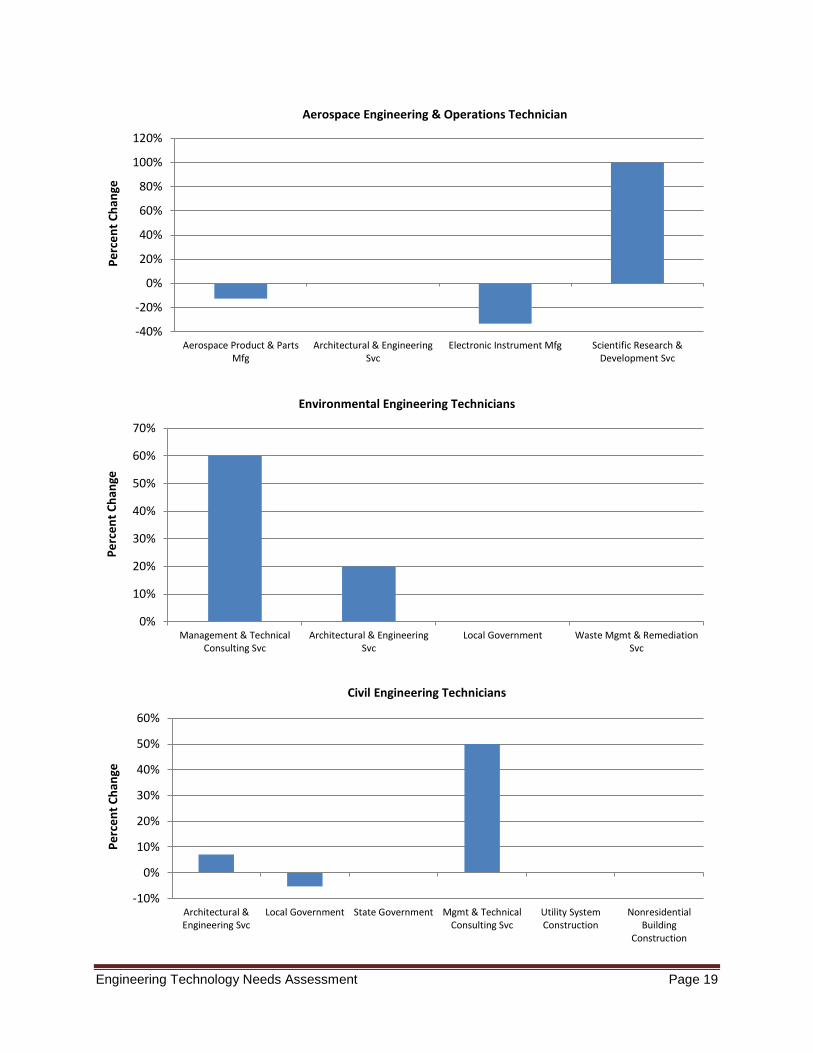
Source: Labor Market Information Division, Employment Development Department, Staffing Patterns, on the Internet at: http://www.labormarketinfo.edd.ca.gov/iomatrix/staffing-patterns1.asp (visited August 14, 2015). Change Over Time of the Largest Industry Employers of Engineering Technicians The graphs below display the projections of staffing changes from 2012-2022 within the largest industries that employ each Engineering Technology specialization across the state of California. Many industries across the specialties investigated are expecting no growth, while some are expecting a decline.
0
100
200
300
400
500
600
Management & TechnicalConsulting Svc
Architectural & EngineeringSvc
Local Government Waste Mgmt & RemediationSvc
Num
ber o
f Em
ploy
ees
Environmental Engineering Technicians
0200400600800
10001200140016001800
Num
ber o
f Em
ploy
ees
Engineering Technicians, Except Drafters, All Other
Engineering Technology Needs Assessment Page 18
-60%
-40%
-20%
0%
20%
40%
60%Pe
rcen
t Cha
nge
Industrial Engineering Technicians
-60%
-40%
-20%
0%
20%
40%
60%
Perc
ent C
hang
e
Mechanical Engineering Technicians
Engineering Technology Needs Assessment Page 19
-40%
-20%
0%
20%
40%
60%
80%
100%
120%
Aerospace Product & PartsMfg
Architectural & EngineeringSvc
Electronic Instrument Mfg Scientific Research &Development Svc
Perc
ent C
hang
e Aerospace Engineering & Operations Technician
0%
10%
20%
30%
40%
50%
60%
70%
Management & TechnicalConsulting Svc
Architectural & EngineeringSvc
Local Government Waste Mgmt & RemediationSvc
Perc
ent C
hang
e
Environmental Engineering Technicians
-10%
0%
10%
20%
30%
40%
50%
60%
Architectural &Engineering Svc
Local Government State Government Mgmt & TechnicalConsulting Svc
Utility SystemConstruction
NonresidentialBuilding
Construction
Perc
ent C
hang
e
Civil Engineering Technicians

Engineering Technology Needs Assessment Page 20
Source: Labor Market Information Division, Employment Development Department, Staffing Patterns, on the Internet at: http://www.labormarketinfo.edd.ca.gov/iomatrix/staffing-patterns1.asp (visited August 14, 2015).
-30%
-20%
-10%
0%
10%
20%
30%
40%
Perc
ent C
hang
e
Electrical & Electronic Engineering Technicians
-30%-20%-10%
0%10%20%30%40%50%
Perc
ent C
hang
e
Engineering Technicians, Except Drafters, All Other
Engineering Technology Needs Assessment Page 21
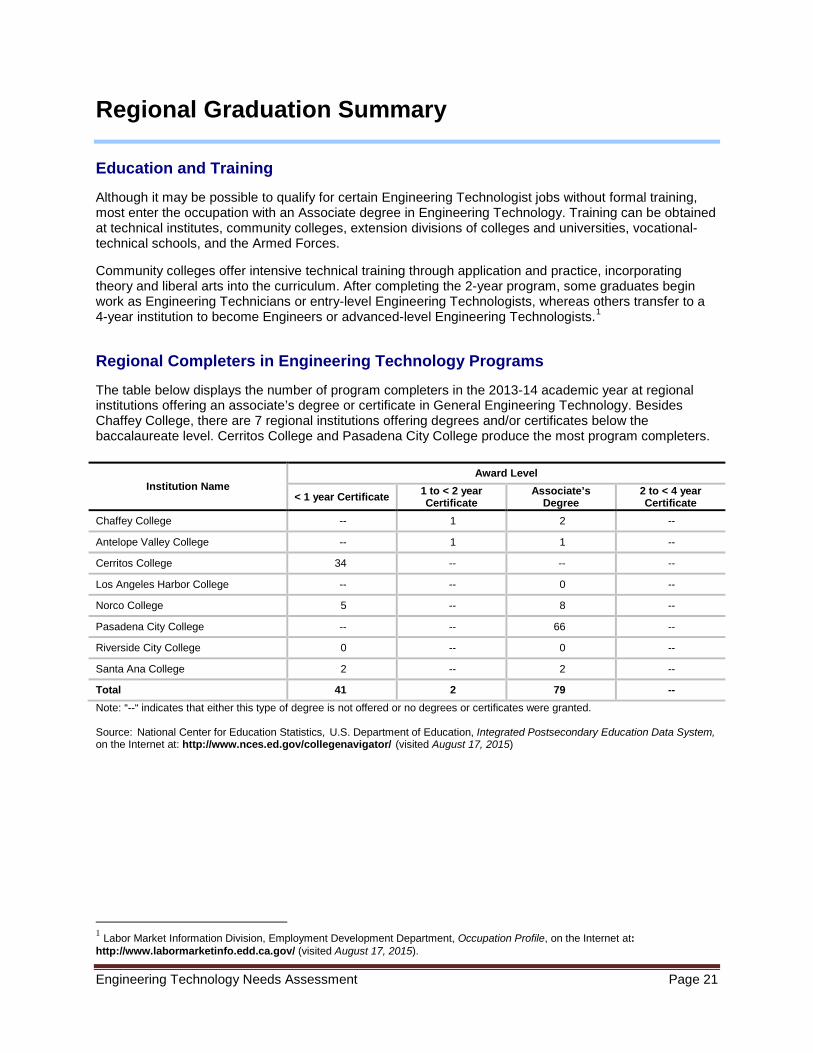
Regional Graduation Summary Education and Training Although it may be possible to qualify for certain Engineering Technologist jobs without formal training, most enter the occupation with an Associate degree in Engineering Technology. Training can be obtained at technical institutes, community colleges, extension divisions of colleges and universities, vocational-technical schools, and the Armed Forces. Community colleges offer intensive technical training through application and practice, incorporating theory and liberal arts into the curriculum. After completing the 2-year program, some graduates begin work as Engineering Technicians or entry-level Engineering Technologists, whereas others transfer to a 4-year institution to become Engineers or advanced-level Engineering Technologists.1 Regional Completers in Engineering Technology Programs The table below displays the number of program completers in the 2013-14 academic year at regional institutions offering an associate’s degree or certificate in General Engineering Technology. Besides Chaffey College, there are 7 regional institutions offering degrees and/or certificates below the baccalaureate level. Cerritos College and Pasadena City College produce the most program completers.
Institution Name Award Level
< 1 year Certificate 1 to < 2 year Certificate
Associate’s Degree
2 to < 4 year Certificate
Chaffey College -- 1 2 --
Antelope Valley College -- 1 1 --
Cerritos College 34 -- -- --
Los Angeles Harbor College -- -- 0 --
Norco College 5 -- 8 --
Pasadena City College -- -- 66 --
Riverside City College 0 -- 0 --
Santa Ana College 2 -- 2 --
Total 41 2 79 -- Note: “--“ indicates that either this type of degree is not offered or no degrees or certificates were granted. Source: National Center for Education Statistics, U.S. Department of Education, Integrated Postsecondary Education Data System, on the Internet at: http://www.nces.ed.gov/collegenavigator/ (visited August 17, 2015)
1 Labor Market Information Division, Employment Development Department, Occupation Profile, on the Internet at: http://www.labormarketinfo.edd.ca.gov/ (visited August 17, 2015).
Engineering Technology Needs Assessment Page 22
Chaffey College’s Performance on Core Indicators
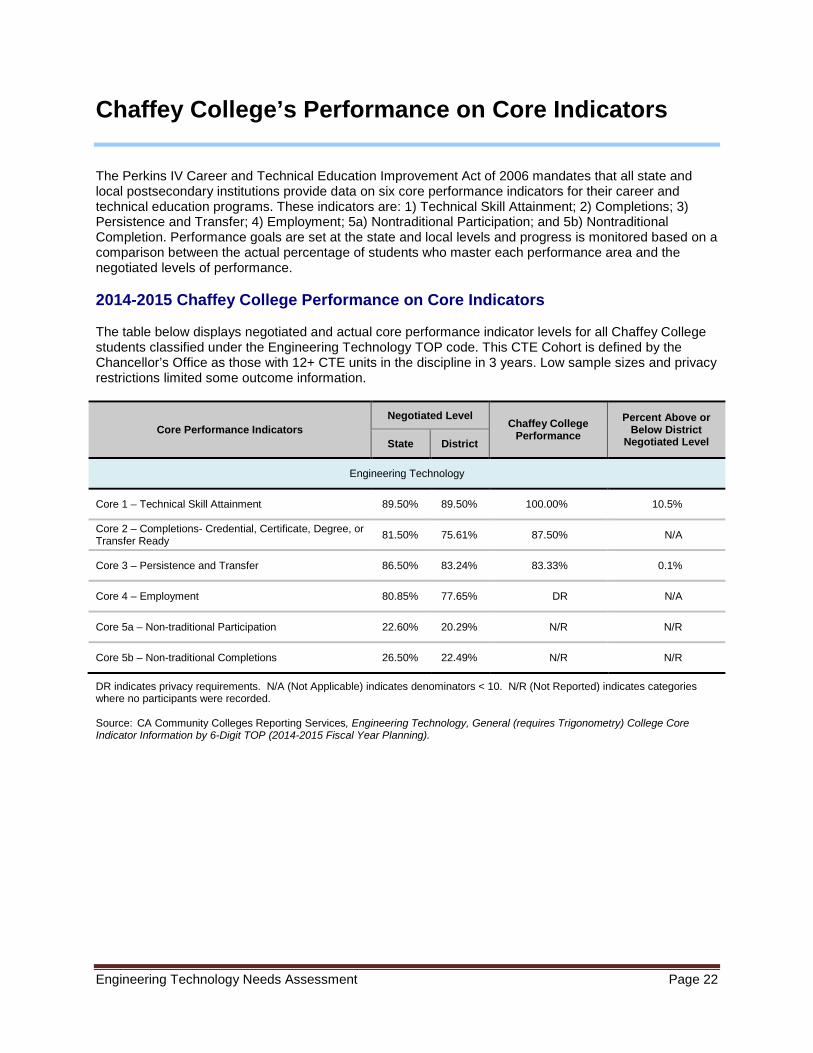
The Perkins IV Career and Technical Education Improvement Act of 2006 mandates that all state and local postsecondary institutions provide data on six core performance indicators for their career and technical education programs. These indicators are: 1) Technical Skill Attainment; 2) Completions; 3) Persistence and Transfer; 4) Employment; 5a) Nontraditional Participation; and 5b) Nontraditional Completion. Performance goals are set at the state and local levels and progress is monitored based on a comparison between the actual percentage of students who master each performance area and the negotiated levels of performance. 2014-2015 Chaffey College Performance on Core Indicators The table below displays negotiated and actual core performance indicator levels for all Chaffey College students classified under the Engineering Technology TOP code. This CTE Cohort is defined by the Chancellor’s Office as those with 12+ CTE units in the discipline in 3 years. Low sample sizes and privacy restrictions limited some outcome information.
Core Performance Indicators Negotiated Level
Chaffey College Performance
Percent Above or Below District
Negotiated Level State District
Engineering Technology
Core 1 – Technical Skill Attainment 89.50% 89.50% 100.00% 10.5%
Core 2 – Completions- Credential, Certificate, Degree, or Transfer Ready 81.50% 75.61% 87.50% N/A
Core 3 – Persistence and Transfer 86.50% 83.24% 83.33% 0.1%
Core 4 – Employment 80.85% 77.65% DR N/A
Core 5a – Non-traditional Participation 22.60% 20.29% N/R N/R
Core 5b – Non-traditional Completions 26.50% 22.49% N/R N/R
DR indicates privacy requirements. N/A (Not Applicable) indicates denominators < 10. N/R (Not Reported) indicates categories where no participants were recorded. Source: CA Community Colleges Reporting Services, Engineering Technology, General (requires Trigonometry) College Core Indicator Information by 6-Digit TOP (2014-2015 Fiscal Year Planning).