
ENGINEERING PROPERTIES OF POFA GGBS-BASED FIBRE...
166
ENGINEERING PROPERTIES OF POFA-GGBS-BASED FIBRE REINFORCED STRUCTURAL LIGHTWEIGHT GEOPOLYMER CONCRETE AZIZUL ISLAM FACULTY OF ENGINEERING UNIVERSITY OF MALAYA KUALA LUMPUR 2014
Transcript of ENGINEERING PROPERTIES OF POFA GGBS-BASED FIBRE...
ENGINEERING PROPERTIES OF POFA-GGBS-BASED
FIBRE REINFORCED STRUCTURAL LIGHTWEIGHT
GEOPOLYMER CONCRETE
AZIZUL ISLAM
FACULTY OF ENGINEERING
UNIVERSITY OF MALAYA
KUALA LUMPUR
2014
ENGINEERING PROPERTIES OF POFA-GGBS-BASED FIBRE REINFORCED STRUCTURAL LIGHTWEIGHT
GEOPOLYMER CONCRETE
AZIZUL ISLAM
DISSERTATION SUBMITTED IN FULFILMENT OF THE REQUIREMENT FOR THE DEGREE OF MASTER OF
ENGINEERING SCIENCE
FACULTY OF ENGINEERING UNIVERSITY OF MALAYA
KUALA LUMPUR
2014

ii
University of Malaya
ORIGINAL LITERARY WORK DECLARATION
Name of the Candidate: Azizul Islam
Passport No:
Registration /Metric No: KGA120024
Name of the degree: Master of Engineering Science
Title of Dissertation:
ENGINEERING PROPERTIES OF POFA-GGBS-BASED FIBRE REINFORCED
STRUCTURAL LIGHTWEIGHT GEOPOLYMER CONCRETE
Field of study: Structural Engineering and Materials
I do solemnly and sincerely declare that: 1. I am the sole author/writer of this work;2. This work is original;3. Any use of any work in which copy exists was done by way of fair dealing and
for permitted purposes and any excerpt or extract from, or reference to orreproduction of any copyright work has been disclosed expressly and sufficientlyand the title of the work and its authorship have been acknowledged;
4. I do not have any actual knowledge nor do I ought reasonably to know that themaking of this work constitutes an infringement of any copyright work;
5. I hereby assign all and every rights in the copyright to this work to the Universityof Malaya (UM), who henceforth shall be owner of the copyright of this work andthat any reproduction or use in any form or by any means whatsoever is prohibitedwithout the written consent of UM having been first had and obtained;
6. I am fully aware that if in the course of making this work I have infringed anycopyright whether intentionally or otherwise, I may be subject to legal action orany other action as may be determined by UM.
Candidate’s Signature Date:
Subscribed and solemnly declared before,
Witness’s Signature Date:
Name:
Designation:
iii
ABSTRACT
The use of ordinary Portland cement (OPC) in concrete construction is under critical
review due to the release of high amount of carbon dioxide (CO2) gas in to the
atmosphere. Geopolymer concrete (GC) is a novel green material that uses waste
materials as the binder instead of OPC. This research focuses on utilizing locally available
waste materials – palm oil fuel ash (POFA), ground granulated blast furnace slag (GGBS)
and fly ash (FA) – as the binder, manufactured sand (MS) and quarry dust (QD) as
replacement materials for the fine aggregate, and oil palm shell (OPS) as the coarse
aggregate, which were activated by alkaline liquids to produce sustainable concrete,
hereafter called OPSGC (oil palm shell geopolymer concrete).
This investigation reports the development of mix design, effect of steel fibre to the
impact resistance of POFA-GGBS-based lightweight geopolymer concrete. The
engineering properties of OPSGC – compressive, flexural and splitting tensile strength,
modulus of elasticity and Poisson’s ratio – were investigated; in addition, the quantity of
OPS in impact resistance of steel fibre reinforced geopolymer concrete were studied and
reported.
Initially, three binders – POFA, GGBS and FA were used to develop an appropriate
geopolymer mortar mix. Eleven mixes were prepared with varying binder contents. The
other constituent materials such as fine aggregate and water were kept constant. After
obtaining the appropriate mix proportion of mortar, nine concrete mixes were prepared
for structural grade geopolymer concrete using OPS, crushed granite, MS, QD and
iv
conventional sand (NS). The impact behaviour of GC was investigated based on fourteen
concrete mixes prepared with and without fibre using different OPS contents. The other
constituent materials – fine aggregate (MS), activator and water were kept constant.
All the specimens of geopolymer mortar were cured in oven for 24 h at 65 oC and
thereafter kept in room temperature (about 26–29 oC) before testing for the compressive
strength. However, for the structural grade concrete two curing conditions, oven-dry and
ambient curing were observed. Since the ambient curing produced better results than
oven cured specimens, the specimens of impact resistance test were cured using ambient
condition.
The highest compressive strength of about 66 MPa was achieved for the mortar containing
30% of POFA and 70% of GGBS with a total binder content of 460 kg/m3. For structural
grade concrete with 40% of POFA and 60% of GGBS, the highest compressive strength
of about 33 MPa and 42 MPa for OPSGC and NWGC (normal weight geopolymer
concrete), respectively; the binder contents in these mixes were 425 kg/m3 and 220 kg/m3
respectively. The tensile strength of OPSGC was found satisfactorily as the splitting
tensile strength of 2.74 MPa fulfilled the minimum requirement of 2 MPa. Its flexural
strength of 3.19 MPa was comparable to that of NWGC. In addition, the Young’s modulus
of elasticity of 11.12 GPa was obtained for OPSGC.
Finally, after adding steel fibre the impact behaviour also investigated. Result shows that
the highest compressive strength of about 28 MPa was achieved for the OPSGC
containing 50% of POFA and 50% of GGBS with a total binder content of 454 kg/m3
v
with the lowest OPS content of 181 kg/m3. In contrast, about 40 MPa was achieved for
NWGC with a total binder content of 308 kg/m3. The impact energy of 5,945 J for OPSGC
specimens with 0.5% steel fibres was found. The tensile strength of OPSGC increases
significantly after adding 0.5% of steel fibre as well. The highest splitting tensile strength
of 2.72 MPa and flexural strength of 4.11 MPa was found, which was 19% and 39%
higher than its control mix.
The research shows that POFA could be used as an ideal binder in the development of
geopolymer concrete (GC) with GGBS. The development of structural grade OPSGC and
its comparable mechanical properties as that of NWGC shows that the former could be
used for structural purpose. In addition, the fibre enhanced the impact resistance and other
mechanical properties of the OPSGC.
vi
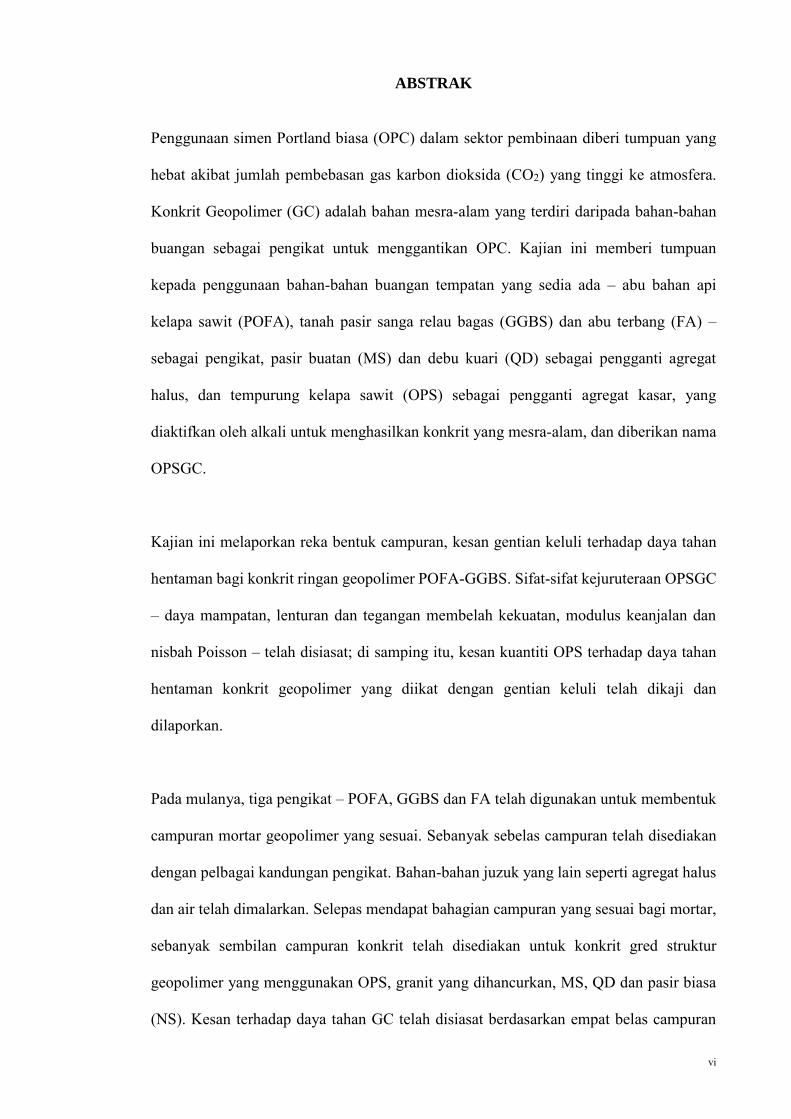
ABSTRAK
Penggunaan simen Portland biasa (OPC) dalam sektor pembinaan diberi tumpuan yang
hebat akibat jumlah pembebasan gas karbon dioksida (CO2) yang tinggi ke atmosfera.
Konkrit Geopolimer (GC) adalah bahan mesra-alam yang terdiri daripada bahan-bahan
buangan sebagai pengikat untuk menggantikan OPC. Kajian ini memberi tumpuan
kepada penggunaan bahan-bahan buangan tempatan yang sedia ada – abu bahan api
kelapa sawit (POFA), tanah pasir sanga relau bagas (GGBS) dan abu terbang (FA) –
sebagai pengikat, pasir buatan (MS) dan debu kuari (QD) sebagai pengganti agregat
halus, dan tempurung kelapa sawit (OPS) sebagai pengganti agregat kasar, yang
diaktifkan oleh alkali untuk menghasilkan konkrit yang mesra-alam, dan diberikan nama
OPSGC.
Kajian ini melaporkan reka bentuk campuran, kesan gentian keluli terhadap daya tahan
hentaman bagi konkrit ringan geopolimer POFA-GGBS. Sifat-sifat kejuruteraan OPSGC
– daya mampatan, lenturan dan tegangan membelah kekuatan, modulus keanjalan dan
nisbah Poisson – telah disiasat; di samping itu, kesan kuantiti OPS terhadap daya tahan
hentaman konkrit geopolimer yang diikat dengan gentian keluli telah dikaji dan
dilaporkan.
Pada mulanya, tiga pengikat – POFA, GGBS dan FA telah digunakan untuk membentuk
campuran mortar geopolimer yang sesuai. Sebanyak sebelas campuran telah disediakan
dengan pelbagai kandungan pengikat. Bahan-bahan juzuk yang lain seperti agregat halus
dan air telah dimalarkan. Selepas mendapat bahagian campuran yang sesuai bagi mortar,
sebanyak sembilan campuran konkrit telah disediakan untuk konkrit gred struktur
geopolimer yang menggunakan OPS, granit yang dihancurkan, MS, QD dan pasir biasa
(NS). Kesan terhadap daya tahan GC telah disiasat berdasarkan empat belas campuran

vii
konkrit yang disediakan dengan kandungan OPS berbeza yang diikat dengan gentian
berserta yang tanpa gentian keluli. Bahan-bahan lain juzuk – agregat halus (MS),
pengaktif dan air telah dimalarkan.
Semua spesimen mortar geopolimer telah dirawat dalam ketuhar selama 24 jam pada suhu
65oC dan selepas itu dikekalkan dalam suhu bilik (kira-kira 26–29oC) sebelum ujian
kekuatan mampatan dijalankan. Walau bagaimanapun, bagi konkrit gred struktur konkrit,
dua kaedah rawatan iaitu kaedah pengeringan dalam ketuhar dan pengeringan dalam suhu
bilik telah diberikan perhatian. Oleh sebab kaedah pengeringan dalam suhu bilik
menghasilkan keputusan yang lebih baik daripada keadah pengeringan dalam ketuhar,
specimen konkrit untuk ujian daya tahan hentaman dirawat dengan kaedah pengeringan
dalam suhu bilik.
Daya tahan mampatan yang paling tinggi iaitu kira-kira 66 MPa telah dicapai bagi mortar
yang mengandungi 30% POFA dan 70% GGBS dan jumlah kandungan pengikat
sebanyak 460 kg/m3. Bagi konkrit gred struktur yang terdiri daripada 40% POFA dan
60% GGBS, daya tahan mampatan yang paling tinggi sebanyak kira-kira 33 MPa dan 42
MPa telah dilaporkan untuk OPSGC dan NWGC (konkrit biasa geopolimer) masing-
masing; kandungan pengikat dalam campuran ini adalah sebanyak 425 kg/m3 dan 220
kg/m3 masing-masing. Daya tahan tegangan OPSGC didapati memuaskan dengan daya
tahan tegangan pembelahan setinggi 2.74 MPa, lantas memenuhi syarat minimum
sebanyak 2 MPa. Daya tahan lenturan sebanyak 3.19 MPa adalah setanding dengan
NWGC. Di samping itu, modulus Young keanjalan 11.12 GPa telah diperolehi bagi
OPSGC.

viii
Akhirnya, selepas menambah gentian keluli, ciri-ciri hentaman juga disiasat. Keputusan
menunjukkan bahawa daya tahan mampatan yang paling tinggi kira-kira 28 MPa telah
dicapai untuk OPSGC yang mengandungi 50% POFA dan 50% GGBS dengan jumlah
kandungan pengikat sebanyak 454 kg/m3 dengan kandungan OPS yang paling rendah 181
kg/m3. Sebaliknya, kira-kira 40 MPa telah dicapai untuk NWGC dengan jumlah
kandungan pengikat sebanyak 308 kg/m3. Tenaga hentaman setinggi 5,945 J didapati
untuk specimen OPSGC dengan 0.5% gentian keluli. Daya tahan tegangan OPSGC
menunjukkan peningkatan yang ketara selepas menambah 0.5% gentian keluli juga. Daya
tahan tegangan pembelahan sebanyak 2.72 MPa dan daya tahan lenturan 4.11 MPa telah
diperolehi dan ia adalah 19% dan 39% lebih tinggi daripada campuran kawalannya.
Kajian ini menunjukkan bahawa POFA sesuai digunakan sebagai pengikat dalam
pembentukan konkrit geopolimer (GC) dengan GGBS. OPSGC gred struktur dan sifat-
sifat mekanikalnya yang setanding dengan NWGC menunjukkan bahawa OPSGC boleh
digunakan untuk tujuan struktur. Di samping itu, gentian keluli didapati meningkatkan
daya tahan hentaman dan sifat-sifat mekanikal OPSGC.
.

ix
ACKNOWLEDGEMENT
I would like to thank Almighty Allah (SWT) for providing me the opportunity to pursue
my studies as well as instilling the patience and persistence during my research work.
I wish to express my sincere thanks and profound appreciation to my supervisor, Dr.
Ubagaram Johnson Alengaram for his guidance, encouragement and valuable time spent
on the fruitful discussion throughout the work, which was extremely valuable in
conducting this research work.
I would also like to express my gratefulness to my co-supervisor Prof. Ir. Dr. Mohd Zamin
Bin Jumaat for his treasured and relevant advice throughout the study.
I would like to acknowledge the grant (UMRG) provided by the University of Malaya to
fulfil the study as well as the research works.
Finally, I would like to thank the most important people in my life, my parents, brothers,
my wife and my daughter Tanisha Tabassum who have provided their endless support
and patience throughout the years.

x
TABLE OF CONTENTS
Original literary work declaration ..................................................................................... ii
Abstract ............................................................................................................................ iii
Abstrak ............................................................................................................................. vi
Acknowledgement............................................................................................................ ix
Table of contents ............................................................................................................... x
List of figures .................................................................................................................. xv
List of tables ................................................................................................................... xix
List of symbols and abbreviations.................................................................................. xxi
CHAPTER 1 : INTRODUCTION .............................................................................. 1
1.1 Background .............................................................................................................. 1
1.2 Geopolymers ............................................................................................................ 2
1.3 Usage of local waste materials in geopolymer concrete .......................................... 3
1.3.1 Binders from industrial by-products .............................................................. 3
1.3.2 Wastes from palm oil factories....................................................................... 4
1.3.3 Fine aggregates ............................................................................................... 5
1.3.4 Oil palm shell as coarse aggregate ................................................................. 5
1.4 Problem statement ................................................................................................... 6
1.5 Research objectives ................................................................................................. 7
1.6 Scope of study.......................................................................................................... 8
1.7 Structure of the dissertation ..................................................................................... 9
CHAPTER 2 : LITERATURE REVIEW .................................................................. 11
2.1 General ................................................................................................................... 11
2.2 Geopolymers .......................................................................................................... 12
2.3 Properties of geopolymer ....................................................................................... 13
2.4 Source materials..................................................................................................... 14

xi
2.5 Mixture proportions of geopolymer concrete ........................................................ 18
2.6 Mortar for geopolymer .......................................................................................... 20
2.7 Effect of water-to-geopolymer solids ratio ............................................................ 21
2.8 Curing of geopolymer concrete ............................................................................. 22
2.9 Lightweight concrete ............................................................................................. 23
2.10 Development of new LWC and OPS used as a coarse aggregate .......................... 24
2.11 Fibre reinforced geopolymer concrete ................................................................... 24
2.12 Impact Test ............................................................................................................ 26
2.13 Application of geopolymer concrete ..................................................................... 27
2.14 Research gap addressed in this research ................................................................ 30
CHAPTER 3 : MATERIALS AND METHODS ...................................................... 32
3.1 Introduction............................................................................................................ 32
3.2 Materials used to develop geopolymer mortar and concrete ................................. 33
3.2.1 Characterisation of materials ........................................................................ 33
3.2.2 Ground granulated blastfurnace slag ............................................................ 33
3.2.3 Palm oil fuel ash ........................................................................................... 34
3.2.4 Fly ash .......................................................................................................... 36
3.2.5 Fine aggregates ............................................................................................. 37
3.2.6 Coarse aggregates ......................................................................................... 38
3.3 Activator solution .................................................................................................. 40
3.4 Water...................................................................................................................... 41
3.5 Fibres ..................................................................................................................... 41
3.6 Mix proportion and casting of specimens .............................................................. 41
3.6.1 Preparation of fresh geopolymer mortar and casting ................................... 42
3.6.2 Mix proportions of geopolymer concrete ..................................................... 44
3.6.3 Mix proportions of geopolymer concrete with and without fibre ................ 47
xii
3.7 Workability and oven-dry density tests ................................................................. 50
3.8 Curing regime ........................................................................................................ 50
3.8.1 Curing of 50-mm cube specimens for geopolymer mortar .......................... 50
3.8.2 Curing of geopolymer concrete specimens .................................................. 51
3.8.3 Curing of geopolymer concrete with and without fibre ............................... 51
3.9 Specimen moulding and testing ............................................................................. 52
3.9.1 Compressive strength test of mortar............................................................. 52
3.9.2 Mechanical properties tests of geopolymer concrete ................................... 52
3.9.3 Mechanical properties tests of geopolymer concrete with and without fibre
53
3.9.4 Ultrasonic pulse velocity (UPV) .................................................................. 53
3.9.5 Poisson’s ratio .............................................................................................. 54
3.9.6 Drop hammer impact test of fibre reinforced oil palm shell geopolymer
concrete (FROPSGC) ................................................................................... 54
3.10 Data collection and analysis .................................................................................. 56
3.11 Carbon footprint..................................................................................................... 57
CHAPTER 4 : RESULTS AND DISCUSSION ....................................................... 58
4.1 Introduction............................................................................................................ 58
4.2 Density of the source materials of geopolymer mortar mix .................................. 58
4.2.1 Effect of specific gravity and fineness on the density .................................. 58
4.2.2 Density reduction ......................................................................................... 59
4.3 Development of compressive strength in geopolymer mortar ............................... 59
4.4 Effect of GGBS on the compressive strength of the mortar .................................. 62
4.5 Effect of POFA on the compressive strength of the mortar .................................. 64
4.6 Analysis of chemical composition ......................................................................... 65
4.7 Properties of geopolymer concrete with OPS as coarse aggregate........................ 68
xiii
4.7.1 Workability................................................................................................... 68
4.7.2 Density ......................................................................................................... 69
4.8 Mechanical properties of geopolymer concrete ..................................................... 69
4.8.1 Development of compressive strength in geopolymer concrete .................. 69
4.8.2 Ultrasonic pulse velocity (UPV) .................................................................. 81
4.8.3 Splitting Tensile Strength (STS) .................................................................. 82
4.8.4 Flexural Strength .......................................................................................... 89
4.8.5 Modulus of elasticity (E- value) ................................................................... 94
4.8.6 Poisson’s ratio ............................................................................................ 100
4.9 Mechanical properties of OPSGC with and without fibre ................................... 101
4.9.1 Density ....................................................................................................... 101
4.9.2 Development of compressive strength in steel fibre reinforced OPSGC ... 104
4.9.3 Splitting tensile strength ............................................................................. 108
4.9.4 Flexural strength ......................................................................................... 110
4.9.5 Modulus of elasticity (E- value) for OPSGC with and without steel fibres
112
4.10 Impact energy ...................................................................................................... 112
4.10.1 First crack impact energy .......................................................................... 113
4.10.2 Ultimate impact energy ............................................................................. 115
4.10.3 Failure mode.............................................................................................. 117
4.10.4 Crack development resistance ................................................................... 118
CHAPTER 5 : CONCLUSIONS AND RECOMMENDATIONS ......................... 120
5.1 Introduction.......................................................................................................... 120
5.2 Summary of Conclusions ..................................................................................... 120
5.3 Recommendations for the future works ............................................................... 125
REFERENCES .............................................................................................................. 126

xiv
LIST OF PUBLICATIONS AND PAPERS PRESENTED ......................................... 135
APPENDICES .............................................................................................................. 136
xv
LIST OF FIGURES
Figure 2.1: Structural models of geopolymer concrete-Davidovits (Davidovits, 2011) . 13
Figure 2.2: The slag floats above the pig iron at the bottom of the blast furnace
(Davidovits, 2011) ........................................................................................ 16
Figure 2.3: Order of tamping in moulding of test specimens [ASTM:C109/C109M-12]
...................................................................................................................... 21
Figure 2.4: Effect of water-to-geopolymer solids ratio by mass on compressive strength
of geopolymer concrete (Hardjito & Rangan, 2005).................................... 22
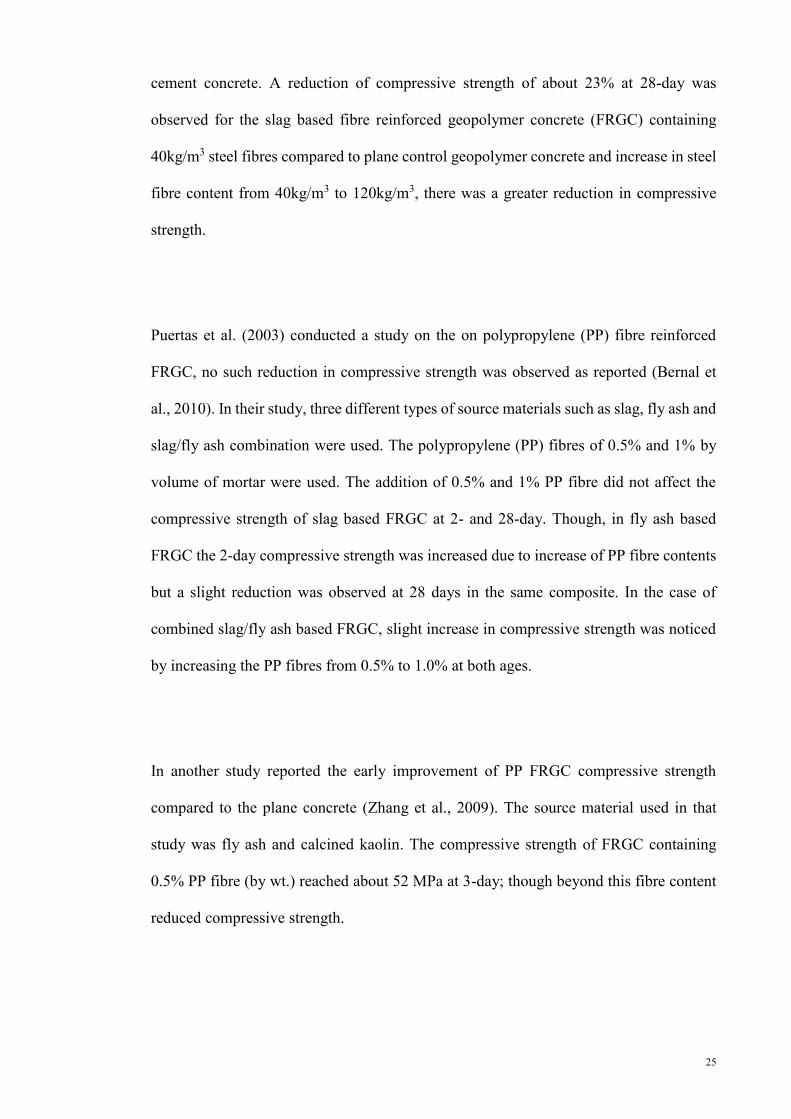
Figure 2.5: Finite element model of impact test (Nia et al., 2012) ................................. 26
Figure 2.6: (a) Queensland’s University GCI building with 3 suspended floors made from
structural geopolymer concrete, (b) precast slag/fly ash - based geopolymer
concrete floor parts, Australia (Aldred & Day, 2012) .................................. 28
Figure 2.7: Composite pultruded girder and Grade 40 geopolymer deck bridge in Brisbane
(Aldred & Day, 2012) .................................................................................. 28
Figure 3.1: Source materials used in the present study ................................................... 35
Figure 3.2: Particle size distribution of GGBS, POFA and FA ...................................... 36
Figure 3.3: Fineness of POFA with different grinding periods ...................................... 36
Figure 3.4: Particle size distribution of NS, MS and QD................................................ 38
Figure 3.5: Coarse fraction of fine aggregate (a) Mining sand (NS); (b) Manufactured
sand (MS) and (c) Quarry dust (QD) ........................................................... 38
Figure 3.6: Coarse aggregate (a) uncrushed OPS; (b) crushed OPS; and (c) crushed granite
...................................................................................................................... 39
Figure 3.7: Steel fibres used to reinforced geopolymer concrete.................................... 41
Figure 3.8: Preparation of geopolymer mortar ................................................................ 43
Figure 3.9: Graphical representation of fresh concrete mix ratio by volume (a) OPSGC;
(b) NWGC .................................................................................................... 46

xvi
Figure 3.10: Casting specimens for compressive strength, splitting tensile strength,
flexural strength and Young’s modulus test ................................................. 46
Figure 3.11: Casting specimens for impact test, compressive strength, splitting tensile
strength, flexural strength and Young’s modulus test .................................. 48
Figure 3.12: Graphical representation of fresh concrete mix ratio by volume (a) 1:2.5:0.4
(OPSGC); (b) 1:2.5:0.6 (OPSGC); (c) 1:2.5:0.8 (OPSGC); and (d) NWGC
...................................................................................................................... 49
Figure 3.13: Slump test ................................................................................................... 50
Figure 3.14: Test specimens covered with plastic film and specimens in air drying
condition ....................................................................................................... 51
Figure 3.15: Compression testing machine and failure mode of cubes .......................... 52
Figure 3.16: Measurement of UPV ................................................................................. 53
Figure 3.17: Poisson’s ratio ............................................................................................ 54
Figure 3.18: Impact test arrangement.............................................................................. 55
Figure 3.19: Crack width measurement (a) microscope, (b) laptop, and (c) impact test
specimen ....................................................................................................... 56
Figure 4.1: Reduction in density of mortar specimen ..................................................... 59
Figure 4.2: Development of compressive strength of mortar with varying binder content
ratio............................................................................................................... 61
Figure 4.3: The effect of GGBS on the compressive strength of mortar mixed with POFA
and FA at 28-day .......................................................................................... 63
Figure 4.4: The effect of POFA on the compressive strength of mortar mixed with GGBS
and FA at 28-day .......................................................................................... 65
Figure 4.5: The comparison between major chemical composition and compressive
strength of mortar ......................................................................................... 67
Figure 4.6: Development of compressive strength at initial 24 h oven-dry curing......... 72
xvii
Figure 4.7: Development of compressive strength at ambient curing ............................ 72
Figure 4.8: Failure mode of 100-mm cube (a) satisfactory failure (BS EN 12390-3, 2009);
and (b) experimental specimen failure. ........................................................ 73
Figure 4.9: Compressive strength at 28 days of age of geopolymer concrete subjected to
initial 24 h OD in relative to those of AD curing ......................................... 75
Figure 4.10: Relationship between 28-day compressive strength of NWGC and OPSGC
under AD and OD curing conditions............................................................ 78
Figure 4.11. 28-day compressive strength of OPSGC (initial 24 h OD curing) ............. 80
Figure 4.12. 28-day compressive strength of OPSGC (ambient curing) ........................ 80
Figure 4.13. Relationship between splitting tensile and compressive strength of NWGC
at 28-day ....................................................................................................... 85
Figure 4.14: (a) Splitting tensile testing; (b) placement of cylinder specimen; (c) specimen
after testing ................................................................................................... 87
Figure 4.15. Relationship between splitting tensile and compressive strength of OPSGC
at 28-day ....................................................................................................... 88
Figure 4.16: (a) Flexural strength testing and (b) specimen after testing ....................... 91
Figure 4.17: Relationship between flexural strength and compressive strength of OPSGC
...................................................................................................................... 93
Figure 4.18. The relationship of MOE and compressive strength at 28-day .................. 95
Figure 4.19. Stress-strain curve ....................................................................................... 99
Figure 4.20: Relationship of density and compressive strength of steel fibre reinforced
OPSGC ....................................................................................................... 103
Figure 4.21: Compressive strength with respect to density and OPS contents ............. 103
Figure 4.22: Relationship of compressive strength and OPS contents of non and steel fibre
reinforced OPSGC...................................................................................... 106
Figure 4.23: Development of compressive strength of OPSGC with 0.0% steel fibre . 107
xviii
Figure 4.24: Development of compressive strength of OPSGC with 0.5% steel fibre . 107
Figure 4.25: Relationship between splitting tensile, flexural and compressive strength of
OPSGC with and without fibres at 28-day ................................................. 109
Figure 4.26: Flexural and splitting tensile strength with respect to compressive strength
and OPS contents ....................................................................................... 111
Figure 4.27. The relationship between MOE and compressive strength (at 28-day) of
OPSGC with and without steel fibres ........................................................ 112
Figure 4.28: Relationship between OPS content and blow number to cause first crack
under impact test ........................................................................................ 114
Figure 4.29: Relationship between OPS content and blow number to cause specimen
failure under impact test ............................................................................. 116
Figure 4.30. Origination process of crack through OPS aggregates at late age (Teo et al.,
2006)........................................................................................................... 117
Figure 4.31: (a) Primary cracks in OPSGC panel; and (b) primary and secondary cracks
in FROPSGC panel .................................................................................... 119
xix
LIST OF TABLES
Table 1.1: Summary of mixes ........................................................................................... 9
Table 2.1: Summary of mix proportion (by weight) of geopolymer concrete ................ 20
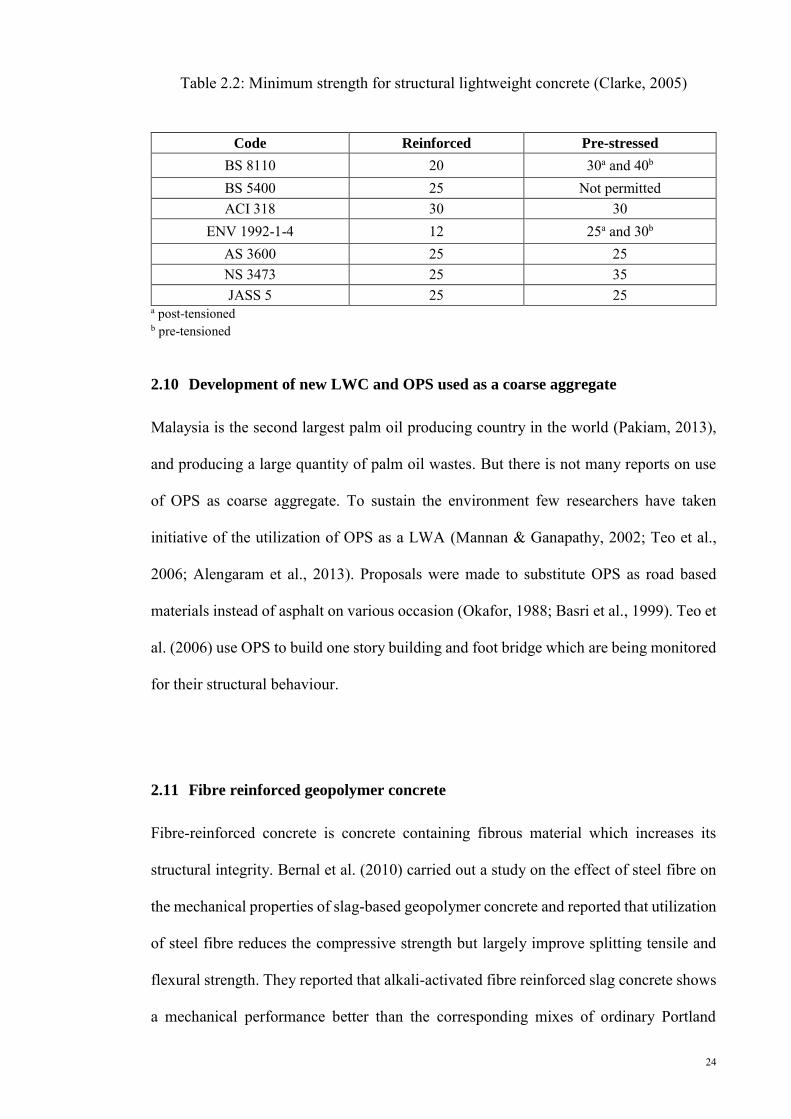
Table 2.2: Minimum strength for structural lightweight concrete (Clarke, 2005) .......... 24
Table 3.1: Specimen details and test conducted with code of practice ........................... 32
Table 3.2: Chemical compositions of source materials as determined by X-ray
fluorescence (XRF) analysis (wt. %) ........................................................... 34
Table 3.3: Physical properties of source materials.......................................................... 35
Table 3.4: Physical properties of mining sand, manufactured sand and quarry dust ...... 37
Table 3.5: Physical properties of OPS and crushed granite ............................................ 39
Table 3.6: Mixture proportion of geopolymer mortar (kg/m3) ....................................... 43
Table 3.7: Experimental parameters for geopolymer mortar .......................................... 44
Table 3.8: Mixture proportion of geopolymer concrete (kg/m3)..................................... 45
Table 3.9: Experimental parameters of geopolymer concrete ........................................ 45
Table 3.10: Mixture proportion of geopolymer concrete with and without fibre (kg/m3)
...................................................................................................................... 47
Table 3.11: Experimental parameters of geopolymer concrete with and without fibre .. 48
Table 4.1: Average oven-dry density (ODD) (kg/m3) of geopolymer mortar at 3-day .. 59
Table 4.2: Development of the compressive strength (MPa) and standard deviation of 3
mortar cubes at different ages ...................................................................... 61
Table 4.3: The comparison of increase in the compressive strength (%) with respect to
that of 28 days .............................................................................................. 62
Table 4.4: Oxide-mole ratios of the reactant mixture (Khale & Chaudhary, 2007;
Davidovits, 2011) ......................................................................................... 65
Table 4.5: Major chemical composition of mortar and 28-day compressive strength .... 67
Table 4.6: SiO2/Al2O3 and CaO/Al2O3 ratios of mortar mixes ....................................... 68

xx
Table 4.7: Chemical composition of binder based on 60% of GGBS and 40% of POFA
...................................................................................................................... 70
Table 4.8: Comparison of oxide-mole ratio proposed by Davidovits (2011) and those
obtained from experimental ......................................................................... 71
Table 4.9: Workability, oven-dry density (ODD) and compressive strength of NWGC and
OPSGC ......................................................................................................... 76
Table 4.10: Development of ultrasonic pulse velocity (UPV) of NWGC and OPSGC at
28-day ........................................................................................................... 81
Table 4.11: Splitting tensile strength of NWGC ............................................................. 84
Table 4.12: Splitting tensile strength of OPSGC ............................................................ 88
Table 4.13: Comparison of compressive strength, splitting tensile strength, flexural
strength and elastic modulus ........................................................................ 90
Table 4.14: Flexural strength of OPSGC ........................................................................ 93
Table 4.15: Elastic moduli and Poisson’s ratios of concrete at 28-day .......................... 96
Table 4.16: Density and compressive strength of OPSGC and NWGC with 0% and 0.5%
steel fibre .................................................................................................... 102
Table 4.17: Comparison of compressive strength, splitting tensile strength, flexural
strength and elastic modulus at 28-day for OPSGC with and without steel
fibres ........................................................................................................... 109
Table 4.18: Impact test results tested on OPSGC with and without steel fibre ............ 114
Table 4.19: Crack widths and number of secondary cracks prior to failure of all mixes
.................................................................................................................... 118

xxi
LIST OF SYMBOLS AND ABBREVIATIONS
Symbols Descriptions
fc' compressive strength
ft' splitting tensile strength
fr' flexural strength
E modulus of elasticity (Young’s modulus)
µi Impact ductile index
Ø diameter
ρ Density of the fresh specimen
ρodd Oven-dry density
F Maximum load at failure
P Maximum applied load indicated by the testing machine
Abbreviations Descriptions
FA fly ash
GGBS ground granulated blast furnace slag
POFA palm oil fuel ash
RHA rice husk ash
LWC lightweight concrete
LWA lightweight aggregate
OPS oil palm shell
NS conventional mining sand (normal sand)
MS manufactured sand (MS)
QD quarry dust (Q-dust)
OPSGC oil palm shell geopolymer concrete
NWGC normal weight geopolymer concrete
OPSC oil palm shell concrete
xxii
FRC fibre reinforced concrete
AD air-dry
OD oven-dry
ODD oven-dry density
FROPSGC fibre reinforced oil palm shell geopolymer concrete
M molarity
MOE modulus of elasticity
CSH calcium-silicate-hydrates
NaOH sodium hydroxide
OPC ordinary Portland cement
PKS palm kernel shell
PP polypropylene
SP superplasticizer
SSD saturated surface dry
XRF X-ray fluorescence
Al aluminium
Al2O3 aluminium oxide (Alumina)
Ca calcium
CaO calcium oxide
Ca (OH) 2 calcium hydroxide
CO2 carbon dioxide
Fe2O3 ferric oxide
H2O water
KOH potassium hydroxide
K2O potassium oxide
LOI loss on ignition

xxiii
Na sodium
Na2SiO3 sodium silicate
Si silicon
SiO2 silica or quartz
SO3 sulphuric anhydride
1
CHAPTER 1 : INTRODUCTION
1.1 Background
Rapid industrialization during the last 100 years caused tremendous changes in the
construction; over 11 billion tonnes of concrete is being used annually (Mehta &
Monteiro, 2006), thus leading it to one of the most widely used construction materials.
However, the developmental activities were accompanied by exploitation of natural
resources in the production of concrete. The realization of overuse of construction
materials in concrete had alarmed the entire world to minimize the natural materials and
this also led to search for alternate construction materials to achieve sustainability. One
of the major constituent materials in concrete is cement and its production and energy
demand are well established.
The huge demand for concrete using Ordinary Portland Cement (OPC) has resulted in
high volume of CO2 emission, and lead to ecological imbalance due to continuous
depletion of natural resources. The reality of air pollution through carbon dioxide (CO2)
emission into the atmosphere from the production of cement has been told innumerable
times. The carbon di-oxide (CO2) emissions from the production of OPC is approximately
5–7% of global anthropogenic emissions (Huntzinger & Eatmon, 2009; Meyer, 2009). It
was reported (Davidovits, 1994) that 1 tonne of cement produces 1 tonne of CO2.
The process of formation of CO2 by calcining can be expressed by the following equation:
CaCO3 → CaO + CO2 (1)
(1 kg) (0.56 kg) (0.44 kg)

2
The share of CaO in clinker amounts varies from 64%–67%. The remainder consists of
silicon oxides, iron oxides, and aluminium oxides. Therefore, CO2 emission from clinker
production amounts to about 0.5 kg/kg. The CO2 emission per tonne of cement depends
on the ratio of clinker to cement. This ratio varies normally from 0.5 to 0.95 (Ernst
Worrell et al., 2001)
In addition, the depletion of natural sand due to quarrying activities has already caused
flooding in many parts of the world; the need for alternate materials for natural sand
through the use of recycling of old mortar (Meyer, 2009; Kou & Poon, 2013) has also
been investigated; however there have been efforts to utilize the manufactured sand,
commonly known as MS from the waste of crushed granite aggregates as a replacement
for conventional sand.
One of the main goals in achieving sustainable construction materials is to reduce the
overuse of virgin materials used to produce cement, coarse and fine aggregates. The
utilization of industrial by-products such as fly ash (FA), silica fume and ground
granulated blast furnace slag (GGBS) as the cement replacement or as the additional
cementitious materials has had a constructive effect in minimizing greenhouse gas
emissions. In order to achieve an environmentally friendly concrete the alternate material
like geopolymer concrete through the use of industrial waste materials could be an ideal
solution.
1.2 Geopolymers
Geopolymers are new materials for coatings and adhesives, new binders for fibre
composites, waste encapsulation and new cementing material for concrete. The
3
geopolymer technology proposed by Davidovits (Davidovits, 2002), illustrates
considerable promise for application in concrete industry as an alternative binder
to the Portland cement. In terms of global warming the geopolymer technology could
reduce the CO2 emission to the atmosphere caused by cement industries. The wide
variety of geopolymer concrete’s potential applications includes: fire resistant materials,
decorative stone artefacts, thermal insulation, low-tech building materials, low energy
ceramic tiles, refractory items, thermal shock refractories, bio-technologies (materials for
medicinal applications) (Davidovits, 2011).
1.3 Usage of local waste materials in geopolymer concrete
1.3.1 Binders from industrial by-products
Every year millions of tons of industrial wastes are generated and most of these wastes
are unutilized or underutilized. These wastes cause environmental issues due to storage
problem and pollution to the surrounding field. Increasing concern about the
environmental consequences of waste disposal has led researchers to investigate the
utilization of the wastes as potential construction materials (Khale & Chaudhary, 2007).
Inspired by the geopolymer technology and the fact that the palm oil fuel ash (POFA)
is a waste material, rich in silica abundantly available in Malaysia, could be used as a
pozzolanic material as an alternative to Portland cement.
The other waste material that is abundant in Malaysia is Ground granulated blast furnace
slag (GGBS), a by-product of the production of iron in a blast furnace and it is composed
chiefly of calcium and magnesium silicates and aluminosilicate. GGBS is a low
performance cementitious material, which can achieve high compression strength when
an alkaline activator is used. FA is a fine powder of mainly spherical glass particles
4
having pozzolanic properties which shall consist essentially of reactive silicon dioxide
(SiO2) and aluminium oxide (Al2O3). The government of Malaysia decided that by 2010
the share of coal in the fuel mix for electricity generation would rise to about 40% (Kupaei
et al., 2013). The increased use of coal burning in thermal power plants has increased the
production of FA to an estimated 3 million tons per annum. The abundance of FA in
Malaysia could pave way for the development of geopolymer concrete.
1.3.2 Wastes from palm oil factories
Malaysia is currently producing more than half of the world’s total output of palm oil,
planted over 5 million hectares of land, yielding about 18.89 tonnes/hectare of fresh fruit
bunch (FEB) (MPOB, 2012). The wastes produced from the palm oil factories include
empty fruit bunches (EFB), oil palm shell (OPS), palm oil clinker (POC) and palm oil
fuel ash (POFA). OPS and POC have been used as coarse aggregates in the development
of lightweight concrete (Mohammed et al., 2011; Shafigh et al., 2011a; Nazari & Khalaj,
2012; Alengaram et al., 2013; Kupaei et al., 2013; Mohammed et al., 2013; Kanadasan &
Razak, 2014; Mo et al., 2014b; Mohammed et al., 2014). The empty fruit bunches (EFB),
have traditionally been burnt and their ash commonly known as palm oil fuel ash (POFA)
recycled into the plantation as fertilizer, which is about 5% of solid waste product. This
ash have the potentiality to be used as pozzolanic materials in concrete industry (Sata et
al., 2010). POFA has been used as cement replacement material in concrete and it has
pozzolanic properties that not only enables the replacement of cement but also plays an
important role in making strong and durable concrete.
5
1.3.3 Fine aggregates
Quarrying of natural sand has a great irreversible environment impact (Short &
Kinniburgh, 1978) as it causes reduction in the ground water that affects the moisture
content of the soil. During the year 2010, Malaysia consumed 2.76 billion metric tons of
natural aggregate of this amount 1.17 billion metric tons or 42.4%, was sand (Ashraf et
al., 2011). In many regions of the world, the extraction of sand and gravel is heavily taxed
or banned completely to try to preserve remaining deposits (Sreenivasa, 2012). Thus, it
is imperative for the construction industries should find alternatives to meet the growing
demand for fine aggregates.
One of the options is to utilize the waste materials from the crushing of granite aggregates
(Celik & Marar, 1996), commonly known as manufactured sand (MS) as the fine
aggregates. Generally, the quarry dust (QD) obtained during the crushing of granite
aggregate is considered waste and sometime used in land filling; however, recently there
is a renewed interest to reuse the QD. Thus, the QD is processed through centrifuge action
to smoothen the angular edges and the resulting particles are rounded and it is used to
replace for natural sand. The processed QD is christened as MS and widely used in
Singapore, India and some other countries to replace conventional sand where the demand
for sand is high/not available in abundance.
1.3.4 Oil palm shell as coarse aggregate
Malaysia is currently producing more than half of the world’s total output of palm oil,
planted over 5 million hectares of land, yielding about 18.89 tonnes/hectare of fresh fruit
bunch (FEB) (MPOB, 2012). The wastes produced from the palm oil factories include
6
empty fruit bunches (EFB), oil palm shells (OPS), palm oil clinker (POC) and palm oil
fuel ash (POFA). OPS and POC have been used as coarse aggregates in the development
of lightweight concrete (Mohammed et al., 2011; Shafigh et al., 2011a; Nazari & Khalaj,
2012; Alengaram et al., 2013; Kupaei et al., 2013; Mohammed et al., 2013; Kanadasan &
Razak, 2014; Mo et al., 2014b; Mohammed et al., 2014). OPS is hard in nature and does
not deteriorate easily once bound in concrete and therefore, it does not contaminate or
leach to produce toxic substances (Basri et al., 1999). The density of OPS concrete is
around 20 - 25% lower than normal weight concrete and it could be used to develop
lightweight concrete.
1.4 Problem statement
Throughout the world, much research is being conducted on the use of industrial by-
products such as fly ash (FA), silica fume, ground granulated blast furnace slag (GGBS),
and rice husk ash, as the cement replacement or as the additional cementitious materials
has had a constructive effect in minimizing greenhouse gas emissions or to streamline
present waste disposal techniques by making them more affordable. The greatest problem
faced by industries, as far as waste disposal is concerned in the safe and effective disposal
of its effluent, sludge and by-products such as large quantities of fly ash that are produced
during the combustion of coal used for electricity generation. Most of this ash is disposed
in landfills at suitable sites (Woolard et al., 2000).
The increasing load of toxic metals in the landfill potentially increases the threat to ground
water contamination. On the other hand, Malaysia is currently producing more than half
of the world’s total output of palm oil and palm oil fuel ash is commonly known as POFA,
7
which is about 5% of solid waste product, have the potentiality to be used as pozzolanic
materials in concrete industry (Sata et al., 2010). A large area is required to dispose these
waste materials. But there are very few research have been conducted on the utilization
of POFA as a source material to produce environmentally friendly concrete and MS in
the replacement of normal sand. Another waste material produced from the palm oil
industry, OPS, that could be an alternative to the conventional coarse aggregate other than
landfilling and can reduce the cost of construction. Hence, in this research have designed
some objectives to figure out different aspects to investigate the performance of these
waste materials to produce structural grade concrete.
1.5 Research objectives
1. To develop appropriate mixture design for geopolymer mortar using ground
granulated blastfurnace slag (GGBS), palm oil fuel ash (POFA) and fly ash (FA) as
binder.
2. To study the effect of crushed and uncrushed oil palm shell (OPS) as a coarse
aggregate and three types of sand (mining sand, manufactured sand and quarry dust)
in the geopolymer structural concrete.
3. To investigate the effect of curing on the mechanical properties of geopolymer
concrete.
4. To investigate the effect of variation in OPS contents and steel fibre on the mechanical
properties of geopolymer concrete.
5. To study the impact behaviour of the fibre reinforced geopolymer concrete panels
with varying crushed and uncrushed OPS contents.
8
1.6 Scope of study
The scope of the research is based on the objectives set above and it is given below:
The chemical and physical properties (particle size distribution) tests for palm oil fuel ash
(POFA), ground granulated Blastfurnace slag (GGBS) and fly ash (FA) were conducted
using X-Ray Fluorescence (XRF) and particle size analyser, respectively.
A total of eleven mixes were performed for POFA-GGBS-FA based mortar to obtain the
optimum mix proportion. The variables were the contents of local waste materials
(POFA/GGBS/FA). Manufactured sand (MS) was used instead of conventional mining
sand (NS). NaOH and Na2SiO3 were used as alkaline activator for geopolymerization.
After obtaining the optimum mix from the mortar, another nine more mixes were prepared
using POFA and GGBS as source materials. The variables were 3 types of sand – miming
sand (NS), manufactured sand (MS), quarry dust (QD) and coarse aggregate – crushed
and uncrushed OPS. A control mix using normal weight aggregate (NWA) was also
prepared.
Another fourteen mixes were prepared using the following:
- Binder/MS ratio: 1:2.5
- OPS/binder ratio: 0.4, 0.6, 0.8 (for both in crushed and uncrushed OPS)
- A control mix of with and without fibre

9
- Panels of 600×600×50 mm were prepared for impact test
The salient feature of this group of mixes (step 3 in Table 1.1) is to include the steel fibre
to investigate the effect of fibre under impact test.
Table 1.1: Summary of mixes
No. of mixes Variables Non-variables
Step 1: 11 mixes POFA, GGBS, FA MS
Step 2: 9 mixes NS, MS, QD uncrushed OPS, crushed OPS, NWA POFA, GGBS
Step 3: 14 mixes uncrushed OPS, crushed OPS POFA, GGBS, MS, NWA, steel fibre
Tests included:
- Mechanical properties – cube compressive strength, splitting tensile strength,
flexural strength, Young’s modulus and Poisson’s ratio.
- Panels were subjected to impact test using drop hammer test.
1.7 Structure of the dissertation
Chapter 1 provides a brief background and discussion of geopolymer concrete, the
problem statement, and objectives of present study and scope of work.
Chapter 2 presents background and literature review to justify the research gaps found for
the research work in this thesis. Literature review on geopolymer, lightweight concrete
10
(LWC), oil palm shell concrete (OPSC), fibre reinforced concrete (FRC), their
mechanical properties and impact resistant characteristics are presented. Materials used
in this research such as POFA, GGBS, FA, NS, MS, QD, OPS, crushed granite and steel
fibre are discussed. The available published literature on geopolymer technology is also
briefly reviewed.
Chapter 3 describes the methodology of developing mix design and the structural
lightweight geopolymer concrete. This chapter also outlines a number of series of
specimens and variables adopted.
Chapter 4 reports the results and discussion of the study, comparison of different results
with crushed and uncrushed OPS along with three different fine aggregate – NS, MS, QD.
Chapter 5 outlines the conclusions and recommendations for future works.

11
CHAPTER 2 : LITERATURE REVIEW
2.1 General
The discovery of a new class of inorganic materials, geopolymer resins, binders, cements
and concretes, resulted in wide scientific interest and kaleidoscopic development of its
applications. From the first industrial research efforts in 1972 at the Cordi-Géopolymère
private research laboratory, Saint-Quentin, France, until the end of 2006, hundreds of
papers and patents were published dealing with geopolymer science and technology
(Davidovits, 2011). Today, people are more concerned about the environment than any
other issues that face us, including the economy. The industrialized countries of Latin
America and Asia are experiencing very quickly economic and social development that
is bringing modern civilization environmental problems, as well as water, air pollution
and decay problems, to over-all the world (UNEP, 2012). Malaysia is one of the rapid
economical and civilization growth countries. In the long term, "progress" works opposite
to us if it continues to be disturbing to nature. This realization will find increasing
acceptance. In the 21st century environmental protection will act a fundamental role and
politicians and scientists will be face a major challenge (UNEP, 2012).
In this chapter, background and literature review has been presented to justify the research
gaps found for the research work in this thesis. Literature review on geopolymer,
lightweight concrete (LWC), oil palm shell concrete (OPSC), fibre reinforced concrete
(FRC), their mechanical properties and impact resistant characteristics are presented.
Materials used in this research such as POFA, GGBS, FA, NS, MS, QD, OPS, crushed
granite and steel fibre are discussed. The available published literature on geopolymer
technology is also briefly reviewed.
12
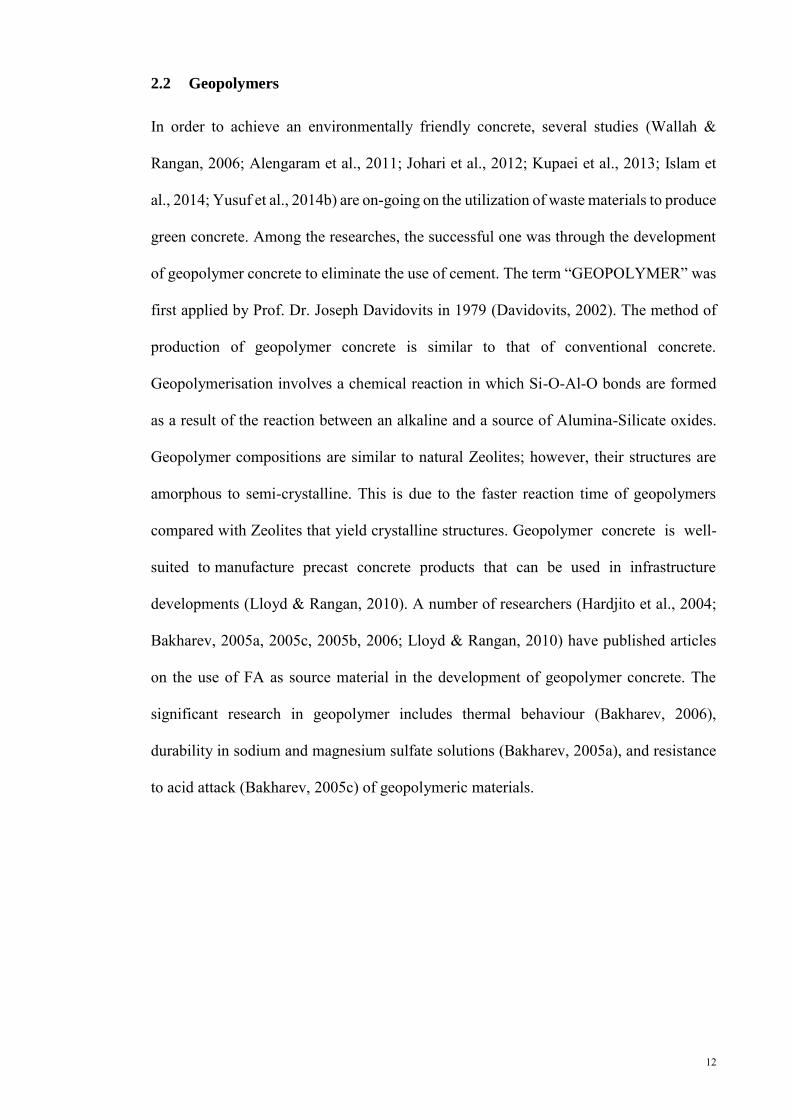
2.2 Geopolymers
In order to achieve an environmentally friendly concrete, several studies (Wallah &
Rangan, 2006; Alengaram et al., 2011; Johari et al., 2012; Kupaei et al., 2013; Islam et
al., 2014; Yusuf et al., 2014b) are on-going on the utilization of waste materials to produce
green concrete. Among the researches, the successful one was through the development
of geopolymer concrete to eliminate the use of cement. The term “GEOPOLYMER” was
first applied by Prof. Dr. Joseph Davidovits in 1979 (Davidovits, 2002). The method of
production of geopolymer concrete is similar to that of conventional concrete.
Geopolymerisation involves a chemical reaction in which Si-O-Al-O bonds are formed
as a result of the reaction between an alkaline and a source of Alumina-Silicate oxides.
Geopolymer compositions are similar to natural Zeolites; however, their structures are
amorphous to semi-crystalline. This is due to the faster reaction time of geopolymers
compared with Zeolites that yield crystalline structures. Geopolymer concrete is well-
suited to manufacture precast concrete products that can be used in infrastructure
developments (Lloyd & Rangan, 2010). A number of researchers (Hardjito et al., 2004;
Bakharev, 2005a, 2005c, 2005b, 2006; Lloyd & Rangan, 2010) have published articles
on the use of FA as source material in the development of geopolymer concrete. The
significant research in geopolymer includes thermal behaviour (Bakharev, 2006),
durability in sodium and magnesium sulfate solutions (Bakharev, 2005a), and resistance
to acid attack (Bakharev, 2005c) of geopolymeric materials.

13
Figure 2.1: Structural models of geopolymer concrete-Davidovits (Davidovits, 2011)
Geopolymer is an inorganic alumino-hydroxide polymer synthesized from predominantly
silicon and aluminium materials of geological origin and industrial by-product material
such as FA (with low calcium) as shown in Figure 2.1.
2.3 Properties of geopolymer
Earlier researchers reported that geopolymer enables high early strength, low shrinkage,
freeze-thaw resistance, sulphate resistance, corrosion resistance, acid resistance, fire
resistance, and no dangerous alkali-aggregate reaction (Hardjito & Rangan, 2005; Wallah
& Rangan, 2006).
14
Dangerous alkali-aggregate-reaction could be produced due to the addition of alkalis in
the normal Portland cement or concrete. But the geopolymeric system even with higher
alkali content is safer from that criteria (Wallah & Rangan, 2006). Davidovits (2011)
opined that bar expansion test in accordance with ASTM:C227-10 (2010) shows
geopolymer cements with higher alkali content did not produce any dangerous alkali-
aggregate reaction compared to Portland cement.
As the human population of the world increases so does the need for housing and
infrastructure increase and consequently so does the use of cement.
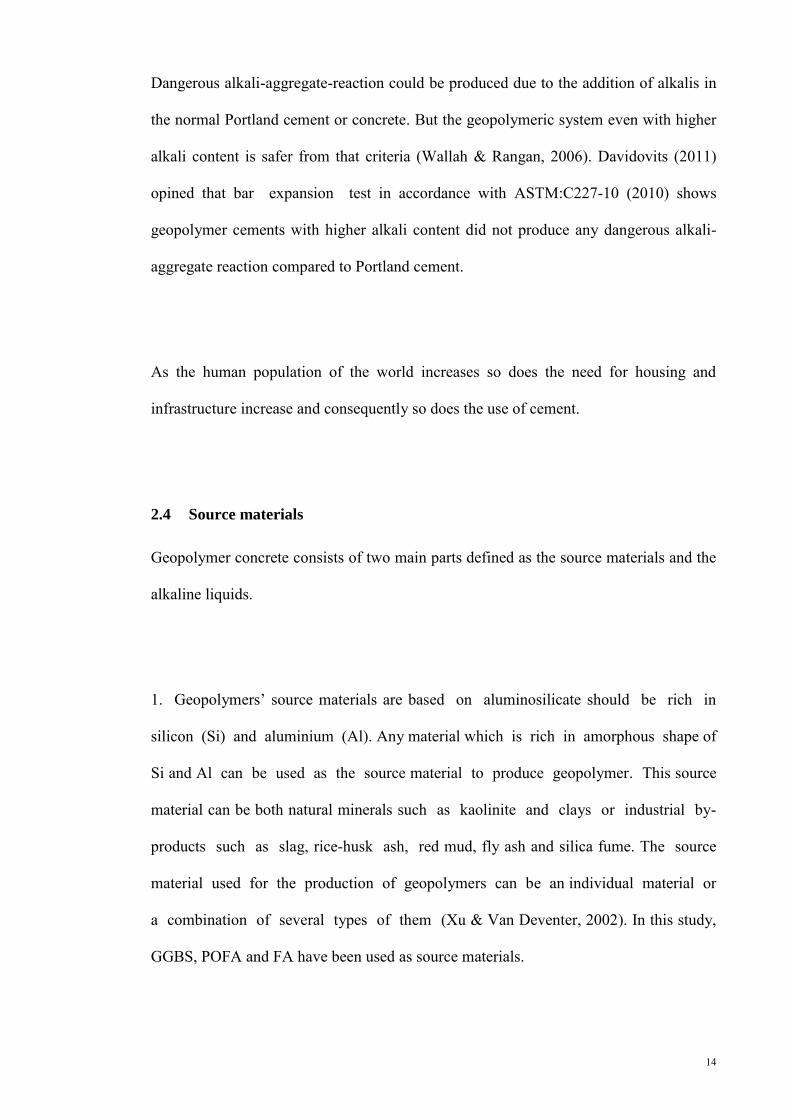
2.4 Source materials
Geopolymer concrete consists of two main parts defined as the source materials and the
alkaline liquids.
1. Geopolymers’ source materials are based on aluminosilicate should be rich in
silicon (Si) and aluminium (Al). Any material which is rich in amorphous shape of
Si and Al can be used as the source material to produce geopolymer. This source
material can be both natural minerals such as kaolinite and clays or industrial by-
products such as slag, rice-husk ash, red mud, fly ash and silica fume. The source
material used for the production of geopolymers can be an individual material or
a combination of several types of them (Xu & Van Deventer, 2002). In this study,
GGBS, POFA and FA have been used as source materials.
15
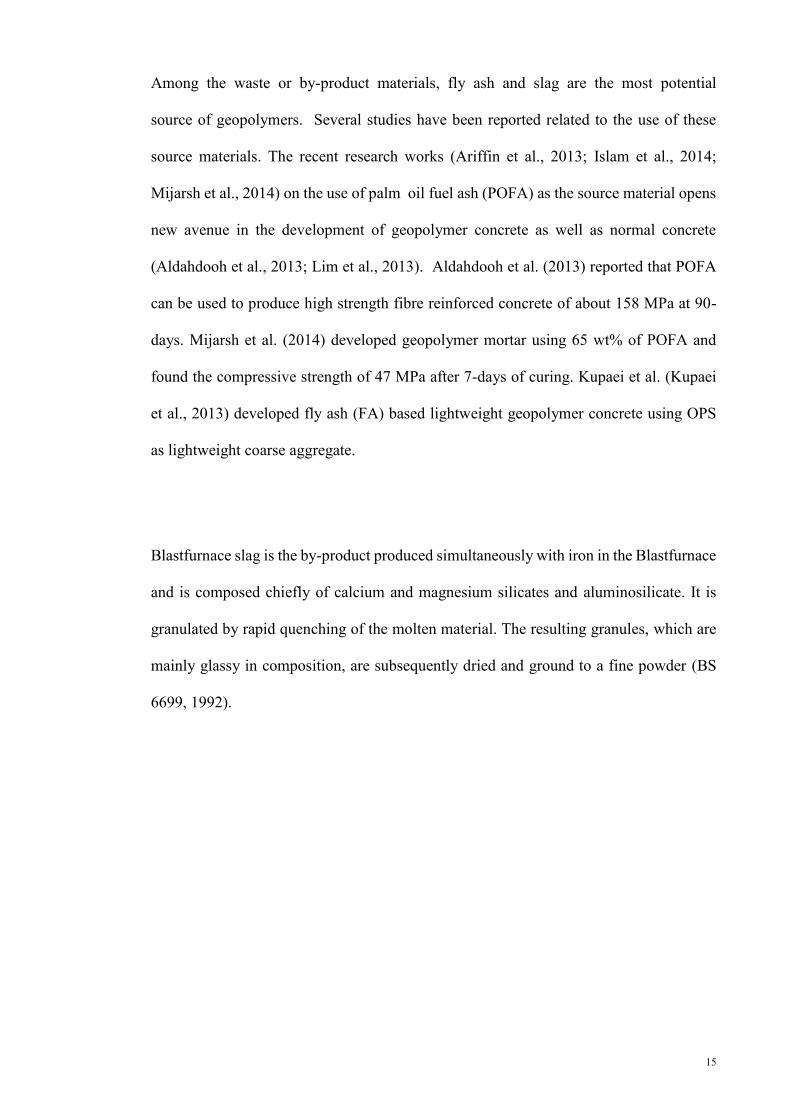
Among the waste or by-product materials, fly ash and slag are the most potential
source of geopolymers. Several studies have been reported related to the use of these
source materials. The recent research works (Ariffin et al., 2013; Islam et al., 2014;
Mijarsh et al., 2014) on the use of palm oil fuel ash (POFA) as the source material opens
new avenue in the development of geopolymer concrete as well as normal concrete
(Aldahdooh et al., 2013; Lim et al., 2013). Aldahdooh et al. (2013) reported that POFA
can be used to produce high strength fibre reinforced concrete of about 158 MPa at 90-
days. Mijarsh et al. (2014) developed geopolymer mortar using 65 wt% of POFA and
found the compressive strength of 47 MPa after 7-days of curing. Kupaei et al. (Kupaei
et al., 2013) developed fly ash (FA) based lightweight geopolymer concrete using OPS
as lightweight coarse aggregate.
Blastfurnace slag is the by-product produced simultaneously with iron in the Blastfurnace
and is composed chiefly of calcium and magnesium silicates and aluminosilicate. It is
granulated by rapid quenching of the molten material. The resulting granules, which are
mainly glassy in composition, are subsequently dried and ground to a fine powder (BS
6699, 1992).

16
Iron ore + coke + limestone gas gas
air air
slag pig iron
Figure 2.2: The slag floats above the pig iron at the bottom of the blast furnace
(Davidovits, 2011)
The blast furnace slag is a molten material that is formed from the manufacturing of the
siliceous gangue found in iron ore, the residue of coke combustion, the limestone and
other added ingredients. The temperature is in the range between 1400o and 1600o C and
is close to that of the molten iron. In the blast furnace, it appears above the pig iron (Figure
2.2) (Davidovits, 2011).
Slag becomes suitable for geopolymeric reaction when quenched from the melt. It is
called granulated slag or ground granulated blast furnace slag GGBS. The glassy material
is obtained either poured into pits filed with water or by high-pressure water jets at the
blast furnace, when it flows out of the spout.
200o C
Blast furnace 1600o C
17
Guidance on its use in concretes, either as a component of composite cements such as
Portland blastfurnace cements conforming to BS 146 and BS 42461) or as a direct
addition to the concrete mix, can be found in BS 5328, BS 6543 and BS 8110-1. Guidance
on its use in mortar as a component of composite cements, such as those conforming to
BS 146 and BS 42461) or as a direct addition to the mortar mix, can be found in BS 5262
and BS 5628.
Fly ash (FA), one of the source materials for geopolymer binders, is available abundantly
worldwide, and yet its use to date is limited. From the 1998 estimation, the global coal
ash production was more than 390 million tonnes annually, but its use was less than 15%
(Malhotra, 1999). In the future, fly ash production will increase, especially in countries
such as China and India. From these two countries alone, it is estimated that by the year
2010, the amount of the fly ash produced will be 780 million tonnes annually (Malhotra,
2002; Hardjito et al., 2004). Accordingly, efforts to use this by-product material in
concrete manufacture are important to make concrete more environmentally friendly. Fly
ash is normally grey in colour and can be light dark or even beige depending on the type
of coal and the efficiency of combustion. Fly ash is divided into two distinct categories ‒
Class F (low calcium CaO<10%) and Class C (high calcium CaO >10%) ASTM:C618-
12a.
2. For conventional concrete, water used for hydration of cement. But in the case of
geopolymer, the source materials would not react with the presence of water. Alkaline
activator are used as a substitute of water during the mixing of the raw materials of
geopolymer concrete. The hydroxyl ions (OH ) from the alkaline activator are known
18
to increase the hydration rate by enhancing the dissolution of aluminate and silicate
in the source materials.
2.5 Mixture proportions of geopolymer concrete
Geopolymer concrete is a new type of concrete, and there is no standard mix
design or well-known method available (Hardjito & Rangan, 2005). The principal
difference between the OPC concrete and the geopolymer concrete is the cement or
binder. To produce geopolymer concrete, the source material reacts with alkaline
activator to form geopolymer paste that binds the fine, coarse and other un-reacted
materials. The volume of coarse and fine aggregates represents about 75 to 80 per cent of
the overall volume to be geopolymer concrete (Hardjito & Rangan, 2005), similar to the
conventional OPC concrete. The mechanism of OPC concrete, its hydration process and
reactions are well established due to vast number of researches performed during the last
century. On the contrary, the mechanism of geopolymer concrete are still not recognized.
Therefore, the mix proportion of this novel concrete needs more attention due to its
constituent materials.
Hardjito & Rangan (Hardjito & Rangan, 2005) conducted a study on the low-calcium fly
ash-based geopolymer concrete and open a new milestone in the field of geopolymer
concrete. They reported:
Higher concentration of NaOH solution produce higher compressive strength of
geopolymer concrete.
Higher the ratio of Na2SiO3 solution-to-NaOH solution by mass, produce higher
compressive strength of geopolymer concrete.
The addition of naphthalene sulphonate-based super plasticizer, up to
approximately 4% of fly ash by mass, improves the workability of the fresh

19
geopolymer concrete; however, there is a slight degradation in the compressive
strength of hardened concrete when the super plasticizer dosage is greater than
2%.
The slump value of the fresh geopolymer concrete increases when the water
content of the mixture increases.
As the H2O-to-Na2O molar ratio increases, the compressive strength of
geopolymer concrete decreases.
Kupaei et al. (2013) developed fly ash (FA) based OPS geopolymer concrete. They
reported:
The conventional mixture methods are not suitable for OPSGC.
Loss of water during heat curing would result in strength reduction in OPSGC
The strength of OPSGC are significantly decreases as the increase in water, OPS
and fine aggregate contents increases.
The strength of OPSGC beyond 14 M of activator solution does not increase
significantly.
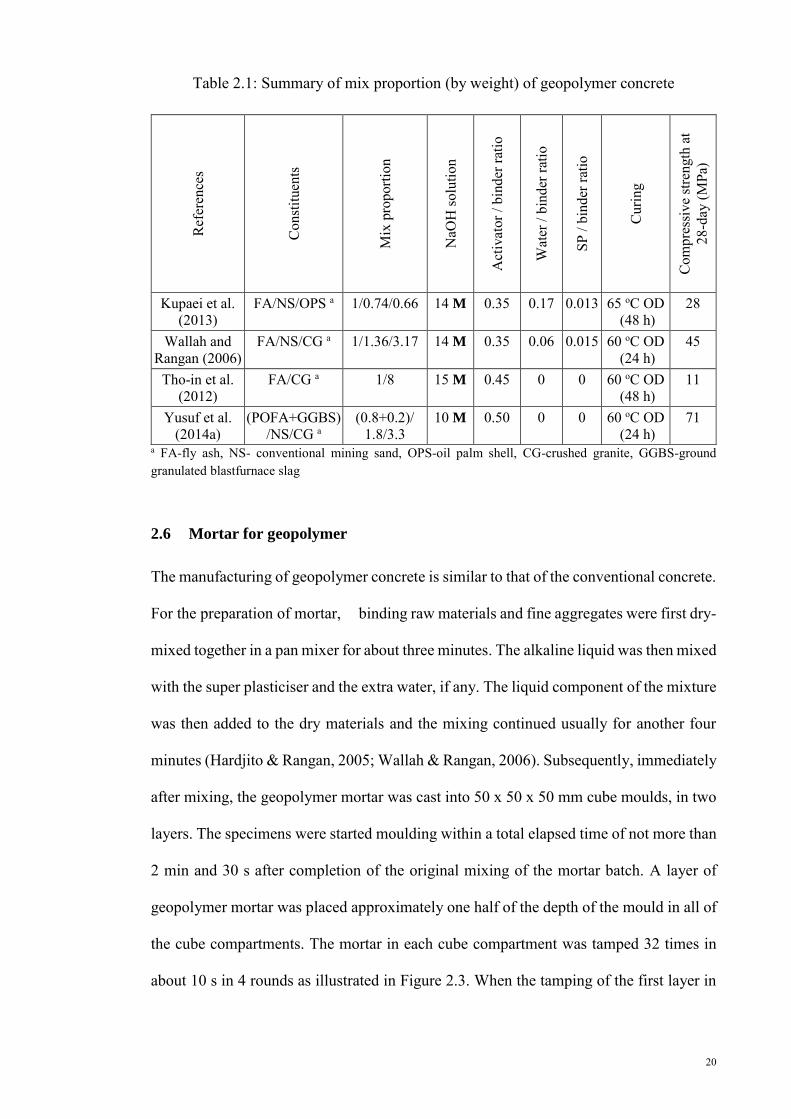
Table 2.1 shows the summary of mix proportion of geopolymer concrete carried out by
previous researchers. It is revealed that molarity of NaOH and oven curing temperature
used in their mixes were 10 – 15 M and 60 – 65 oC, respectively. The quantity of water
used is very low.
20
Table 2.1: Summary of mix proportion (by weight) of geopolymer concrete
Ref
eren
ces
Con
stitu
ents
Mix
pro
porti
on
NaO
H so
lutio
n
Act
ivat
or /
bind
er ra
tio
Wat
er /
bind
er ra
tio
SP /
bind
er ra
tio
Cur
ing
Com
pres
sive
stre
ngth
at
28-d
ay (M
Pa)
Kupaei et al. (2013)
FA/NS/OPS a 1/0.74/0.66 14 M 0.35 0.17 0.013 65 oC OD (48 h)
28
Wallah and Rangan (2006)
FA/NS/CG a 1/1.36/3.17 14 M 0.35 0.06 0.015 60 oC OD (24 h)
45
Tho-in et al. (2012)
FA/CG a 1/8 15 M 0.45 0 0 60 oC OD (48 h)
11
Yusuf et al. (2014a)
(POFA+GGBS) /NS/CG a
(0.8+0.2)/ 1.8/3.3
10 M 0.50 0 0 60 oC OD (24 h)
71
a FA-fly ash, NS- conventional mining sand, OPS-oil palm shell, CG-crushed granite, GGBS-ground granulated blastfurnace slag
2.6 Mortar for geopolymer
The manufacturing of geopolymer concrete is similar to that of the conventional concrete.
For the preparation of mortar, binding raw materials and fine aggregates were first dry-
mixed together in a pan mixer for about three minutes. The alkaline liquid was then mixed
with the super plasticiser and the extra water, if any. The liquid component of the mixture
was then added to the dry materials and the mixing continued usually for another four
minutes (Hardjito & Rangan, 2005; Wallah & Rangan, 2006). Subsequently, immediately
after mixing, the geopolymer mortar was cast into 50 x 50 x 50 mm cube moulds, in two
layers. The specimens were started moulding within a total elapsed time of not more than
2 min and 30 s after completion of the original mixing of the mortar batch. A layer of
geopolymer mortar was placed approximately one half of the depth of the mould in all of
the cube compartments. The mortar in each cube compartment was tamped 32 times in
about 10 s in 4 rounds as illustrated in Figure 2.3. When the tamping of the first layer in

21
the entire cube compartment was completed, the compartments with the remaining mortar
was then filled and tamped as specified for the first layer [ASTM:C109/C109M-12].
1 2 3 4
8 7 6 5
Figure 2.3: Order of tamping in moulding of test specimens [ASTM:C109/C109M-12]
The compressive strength of geopolymer concrete is influenced by the wet-mixing time.
Test results show that the compressive strength increased as the wet-mixing time
increased (Hardjito & Rangan, 2005).
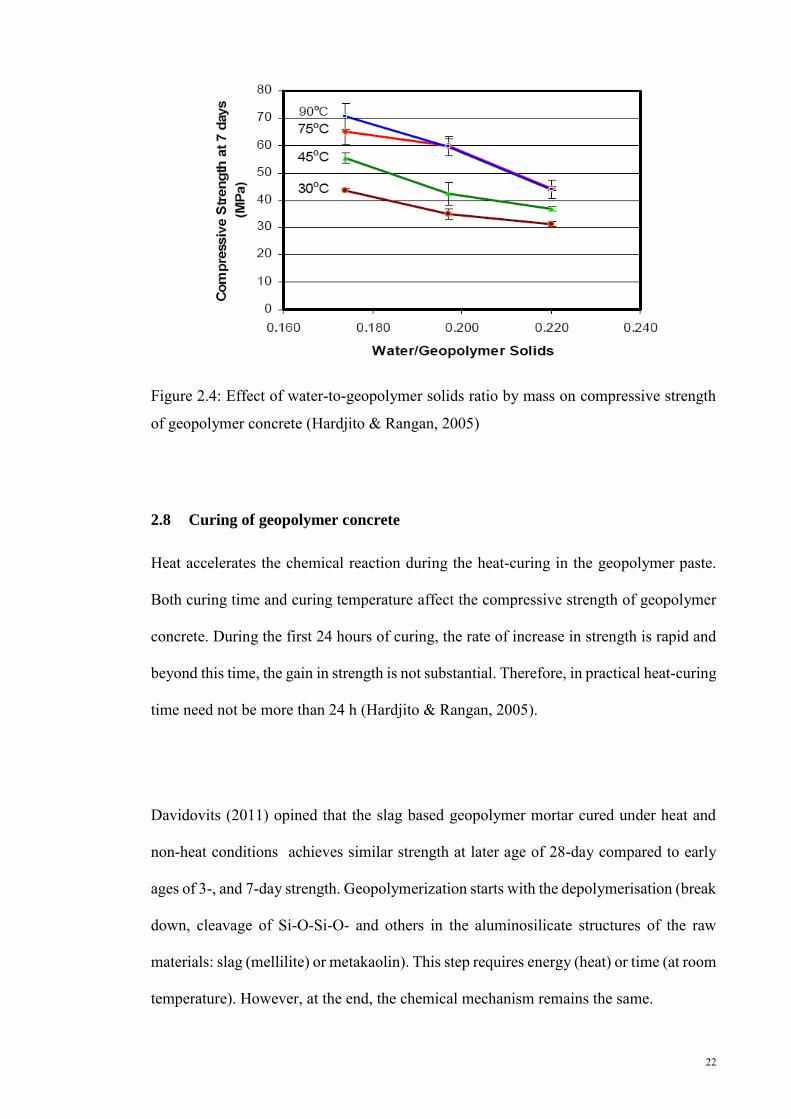
2.7 Effect of water-to-geopolymer solids ratio
Hardjito and Rangan (2005) conducted a study on the effect of water-to-geopolymer
solids ratio by mass on the compressive strength and the workability of geopolymer
concrete. Figure 2.4 shows that the compressive strength decreases as the water-to-
geopolymer solids ratio by mass increases.
22
Figure 2.4: Effect of water-to-geopolymer solids ratio by mass on compressive strength
of geopolymer concrete (Hardjito & Rangan, 2005)
2.8 Curing of geopolymer concrete
Heat accelerates the chemical reaction during the heat-curing in the geopolymer paste.
Both curing time and curing temperature affect the compressive strength of geopolymer
concrete. During the first 24 hours of curing, the rate of increase in strength is rapid and
beyond this time, the gain in strength is not substantial. Therefore, in practical heat-curing
time need not be more than 24 h (Hardjito & Rangan, 2005).
Davidovits (2011) opined that the slag based geopolymer mortar cured under heat and
non-heat conditions achieves similar strength at later age of 28-day compared to early
ages of 3-, and 7-day strength. Geopolymerization starts with the depolymerisation (break
down, cleavage of Si-O-Si-O- and others in the aluminosilicate structures of the raw
materials: slag (mellilite) or metakaolin). This step requires energy (heat) or time (at room
temperature). However, at the end, the chemical mechanism remains the same.

23
2.9 Lightweight concrete
Lightweight concrete (LWC) is a concrete which has been made lighter than conventional
concrete. LWC has been in use in construction industry for many years in Europe and
America but did not find enough attention due to lack of understanding about the
production techniques and structural performance of lightweight aggregates (LWA)
(Chandra & Berntsson, 2002). Structural lightweight concrete have been in use in both
reinforced and pre-stressed concrete for many years. The use of LWC permits greater
design flexibility, reduced dead load, improved cyclic loading for structural response,
longer spans, better fire rating, thinner sections, smaller structural sections, less
reinforcing steel, 10-20% cost saving and lower foundation cost.
For structural concrete, the pragmatic requirements are generally that any lightweight
aggregate is suitable that has a crushing strength sufficient to have reasonable resistance
to fragmentation while enabling concrete strength in excess of 20 N/mm2 (Newman &
Choo, 2003; Clarke, 2005). The density of structural lightweight aggregate concretes
can range from approximately 1200 - 2000 kg/m3 compared with 2300 to 2500 kg/m3
for normal weight concrete (NWC) (Clarke, 2005). The oven-dry density range as
specified in EN 206-1 (2000) for lightweight concrete and NWC are 800 - 2000 kg/m3
and 2000 - 2600 kg/m3, respectively. The density of concrete that exceeds 2600 kg/m3 is
known as heavyweight concrete. The minimum strength for structural lightweight
concrete, as identified by several codes are shown in Table 2.2 (Clarke, 2005).
24
Table 2.2: Minimum strength for structural lightweight concrete (Clarke, 2005)
Code Reinforced Pre-stressed
BS 8110 20 30a and 40b BS 5400 25 Not permitted ACI 318 30 30
ENV 1992-1-4 12 25a and 30b AS 3600 25 25 NS 3473 25 35 JASS 5 25 25
a post-tensioned b pre-tensioned
2.10 Development of new LWC and OPS used as a coarse aggregate
Malaysia is the second largest palm oil producing country in the world (Pakiam, 2013),
and producing a large quantity of palm oil wastes. But there is not many reports on use
of OPS as coarse aggregate. To sustain the environment few researchers have taken
initiative of the utilization of OPS as a LWA (Mannan & Ganapathy, 2002; Teo et al.,
2006; Alengaram et al., 2013). Proposals were made to substitute OPS as road based
materials instead of asphalt on various occasion (Okafor, 1988; Basri et al., 1999). Teo et
al. (2006) use OPS to build one story building and foot bridge which are being monitored
for their structural behaviour.
2.11 Fibre reinforced geopolymer concrete
Fibre-reinforced concrete is concrete containing fibrous material which increases its
structural integrity. Bernal et al. (2010) carried out a study on the effect of steel fibre on
the mechanical properties of slag-based geopolymer concrete and reported that utilization
of steel fibre reduces the compressive strength but largely improve splitting tensile and
flexural strength. They reported that alkali-activated fibre reinforced slag concrete shows
a mechanical performance better than the corresponding mixes of ordinary Portland
25
cement concrete. A reduction of compressive strength of about 23% at 28-day was
observed for the slag based fibre reinforced geopolymer concrete (FRGC) containing
40kg/m3 steel fibres compared to plane control geopolymer concrete and increase in steel
fibre content from 40kg/m3 to 120kg/m3, there was a greater reduction in compressive
strength.
Puertas et al. (2003) conducted a study on the on polypropylene (PP) fibre reinforced
FRGC, no such reduction in compressive strength was observed as reported (Bernal et
al., 2010). In their study, three different types of source materials such as slag, fly ash and
slag/fly ash combination were used. The polypropylene (PP) fibres of 0.5% and 1% by
volume of mortar were used. The addition of 0.5% and 1% PP fibre did not affect the
compressive strength of slag based FRGC at 2- and 28-day. Though, in fly ash based
FRGC the 2-day compressive strength was increased due to increase of PP fibre contents
but a slight reduction was observed at 28 days in the same composite. In the case of
combined slag/fly ash based FRGC, slight increase in compressive strength was noticed
by increasing the PP fibres from 0.5% to 1.0% at both ages.
In another study reported the early improvement of PP FRGC compressive strength
compared to the plane concrete (Zhang et al., 2009). The source material used in that
study was fly ash and calcined kaolin. The compressive strength of FRGC containing
0.5% PP fibre (by wt.) reached about 52 MPa at 3-day; though beyond this fibre content
reduced compressive strength.
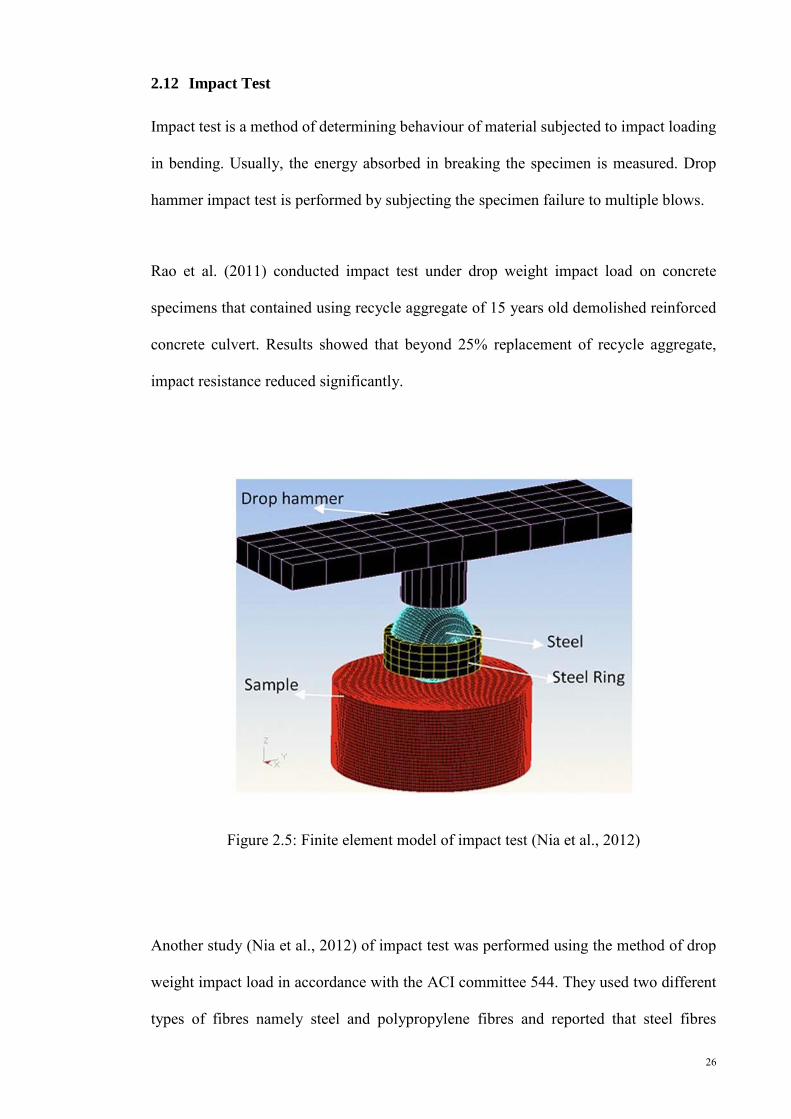
26
2.12 Impact Test
Impact test is a method of determining behaviour of material subjected to impact loading
in bending. Usually, the energy absorbed in breaking the specimen is measured. Drop
hammer impact test is performed by subjecting the specimen failure to multiple blows.
Rao et al. (2011) conducted impact test under drop weight impact load on concrete
specimens that contained using recycle aggregate of 15 years old demolished reinforced
concrete culvert. Results showed that beyond 25% replacement of recycle aggregate,
impact resistance reduced significantly.
Figure 2.5: Finite element model of impact test (Nia et al., 2012)
Another study (Nia et al., 2012) of impact test was performed using the method of drop
weight impact load in accordance with the ACI committee 544. They used two different
types of fibres namely steel and polypropylene fibres and reported that steel fibres

27
significantly increased impact resistance compared to polypropylene fibres. This could
be attributed to larger length of hooked-ends steel fibres, high tensile strength and better
cohesion due to their hooked-ends. They compared numerical and experimental data
(Figure 2.5) and found that the impact resistance development for normal strength
concrete is higher than high-strength concrete.
There is no study has been done on impact test on geopolymer concrete and OPS in
geopolymer concrete. The drop weight impact test for OPS conventional concrete with
conventional mining sand and OPC was performed by Mo et al. (2014b). They produced
OPS concrete using two different sizes of OPS coarse aggregates called uncrushed and
crushed OPS of maximum sizes 14 mm and 9 mm, respectively. They reported that the
impact energy of the concrete produced by uncrushed OPS is higher compared to crushed
OPS because of its energy absorption capability compared to the corresponding crushed
OPS.
2.13 Application of geopolymer concrete
Geopolymer concrete is well-suited to manufacture precast concrete products that
can be used in infrastructure developments (Lloyd & Rangan, 2010) and main building
structure (Aldred & Day, 2012) as well. The University of Queensland’s Global Change
Institute (GCI), Australia is the world’s first building to successfully use slag/fly ash-
based geopolymer concrete for structural purpose (Figure 2.6). This precast geopolymer
concrete is useful for faster construction process, better quality maintain due to factory
production, reuse of formwork as well as saving of formwork cost.
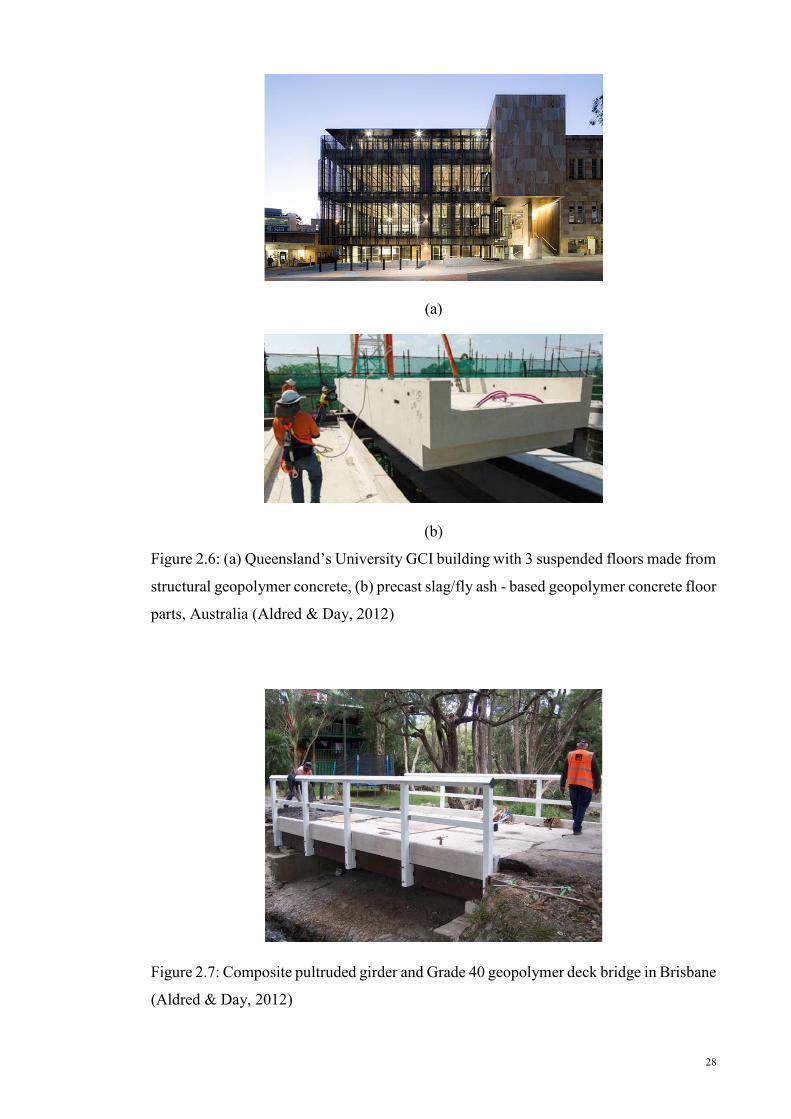
28
(a)
(b)
Figure 2.6: (a) Queensland’s University GCI building with 3 suspended floors made from
structural geopolymer concrete, (b) precast slag/fly ash - based geopolymer concrete floor
parts, Australia (Aldred & Day, 2012)
Figure 2.7: Composite pultruded girder and Grade 40 geopolymer deck bridge in Brisbane
(Aldred & Day, 2012)

29
Another application of geopolymer concrete is the precast deck bridge (Aldred & Day,
2012). Figure 2.7 shows a composite pultruded girder and Grade 40 geopolymer deck
bridge structure constructed in West Moggill, Brisbane, Australia.
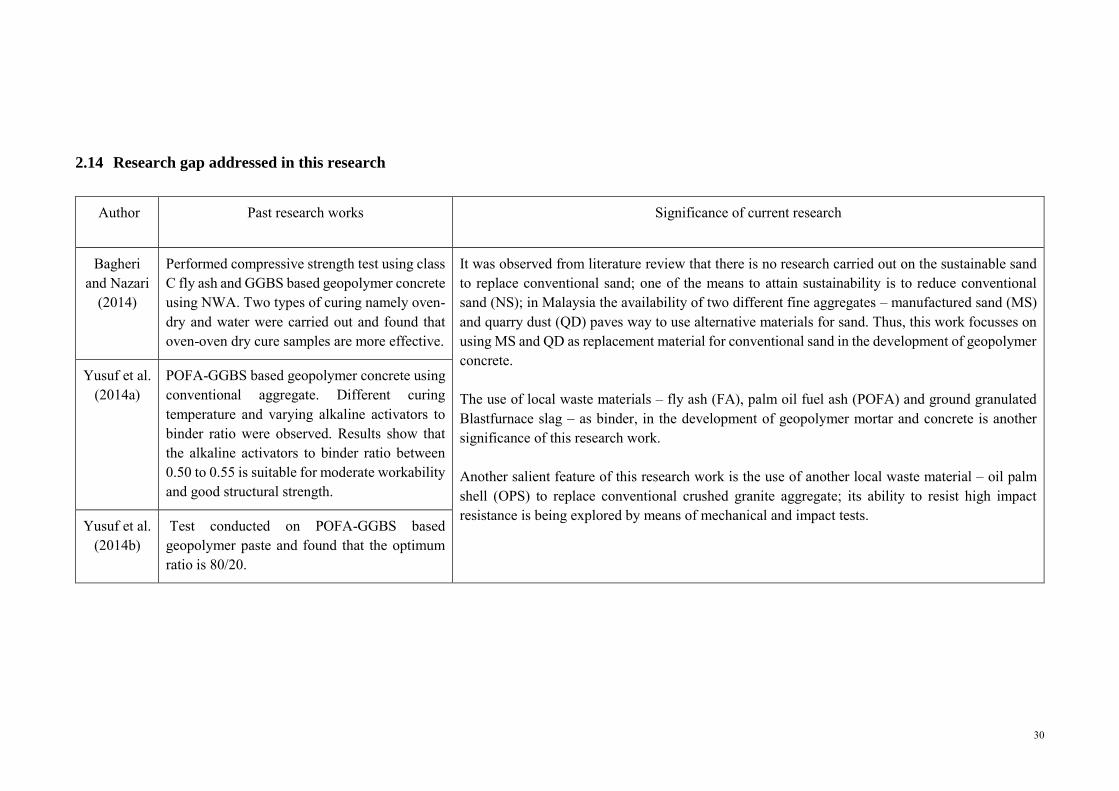
30
2.14 Research gap addressed in this research
Author Past research works Significance of current research
Bagheri and Nazari
(2014)
Performed compressive strength test using class C fly ash and GGBS based geopolymer concrete using NWA. Two types of curing namely oven-dry and water were carried out and found that oven-oven dry cure samples are more effective.
It was observed from literature review that there is no research carried out on the sustainable sand to replace conventional sand; one of the means to attain sustainability is to reduce conventional sand (NS); in Malaysia the availability of two different fine aggregates ‒ manufactured sand (MS) and quarry dust (QD) paves way to use alternative materials for sand. Thus, this work focusses on using MS and QD as replacement material for conventional sand in the development of geopolymer concrete. The use of local waste materials ‒ fly ash (FA), palm oil fuel ash (POFA) and ground granulated Blastfurnace slag ‒ as binder, in the development of geopolymer mortar and concrete is another significance of this research work. Another salient feature of this research work is the use of another local waste material ‒ oil palm shell (OPS) to replace conventional crushed granite aggregate; its ability to resist high impact resistance is being explored by means of mechanical and impact tests.
Yusuf et al. (2014a)
POFA-GGBS based geopolymer concrete using conventional aggregate. Different curing temperature and varying alkaline activators to binder ratio were observed. Results show that the alkaline activators to binder ratio between 0.50 to 0.55 is suitable for moderate workability and good structural strength.
Yusuf et al. (2014b)
Test conducted on POFA-GGBS based geopolymer paste and found that the optimum ratio is 80/20.
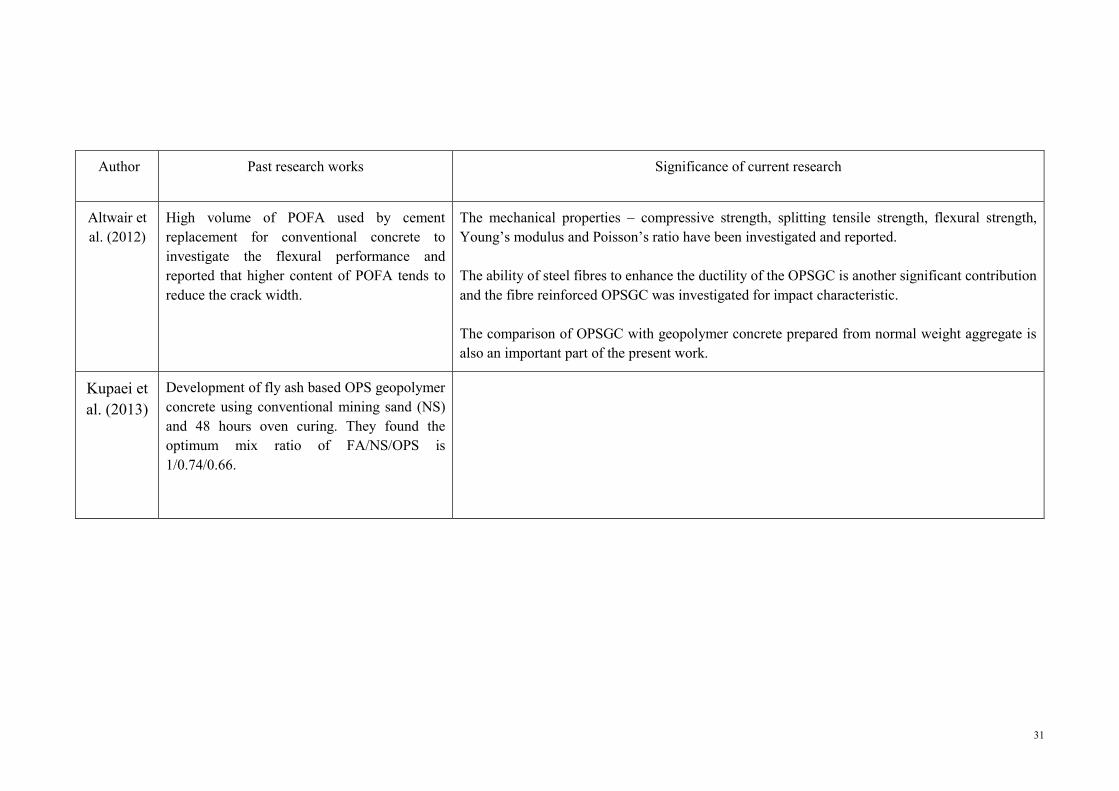
31
Author Past research works Significance of current research
Altwair et al. (2012)
High volume of POFA used by cement replacement for conventional concrete to investigate the flexural performance and reported that higher content of POFA tends to reduce the crack width.
The mechanical properties ‒ compressive strength, splitting tensile strength, flexural strength, Young’s modulus and Poisson’s ratio have been investigated and reported. The ability of steel fibres to enhance the ductility of the OPSGC is another significant contribution and the fibre reinforced OPSGC was investigated for impact characteristic. The comparison of OPSGC with geopolymer concrete prepared from normal weight aggregate is also an important part of the present work.
Kupaei et al. (2013)
Development of fly ash based OPS geopolymer concrete using conventional mining sand (NS) and 48 hours oven curing. They found the optimum mix ratio of FA/NS/OPS is 1/0.74/0.66.
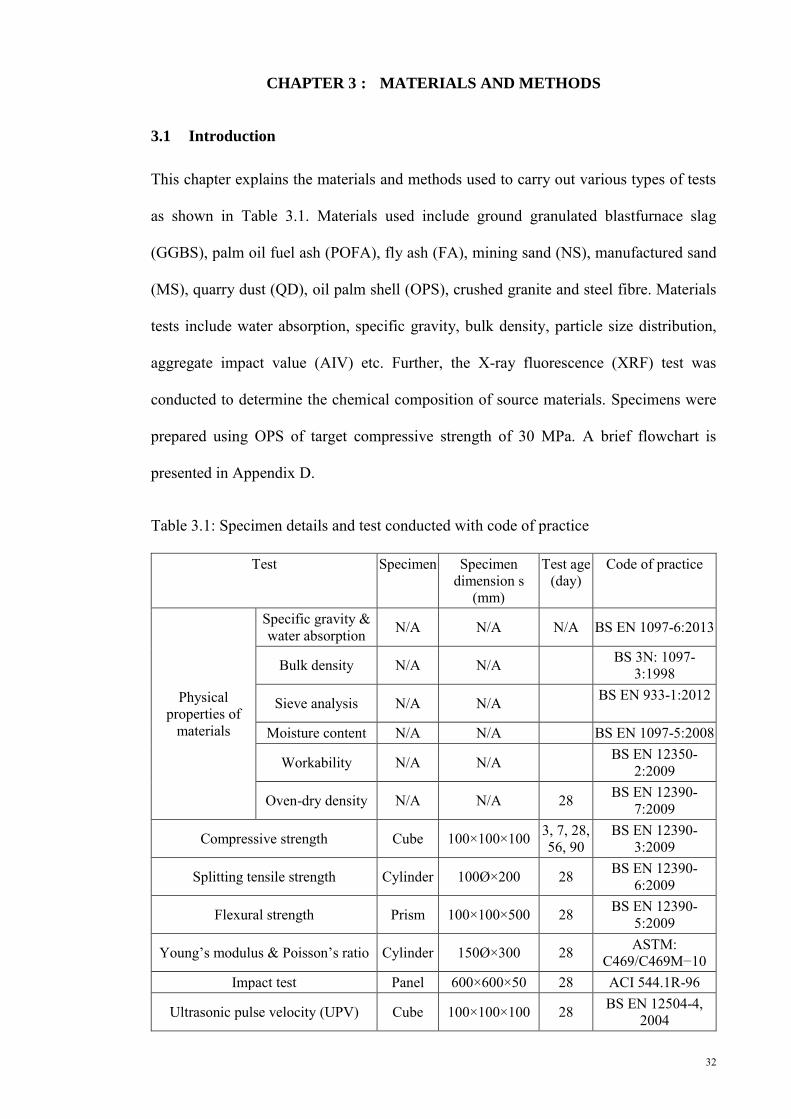
32
CHAPTER 3 : MATERIALS AND METHODS
3.1 Introduction
This chapter explains the materials and methods used to carry out various types of tests
as shown in Table 3.1. Materials used include ground granulated blastfurnace slag
(GGBS), palm oil fuel ash (POFA), fly ash (FA), mining sand (NS), manufactured sand
(MS), quarry dust (QD), oil palm shell (OPS), crushed granite and steel fibre. Materials
tests include water absorption, specific gravity, bulk density, particle size distribution,
aggregate impact value (AIV) etc. Further, the X-ray fluorescence (XRF) test was
conducted to determine the chemical composition of source materials. Specimens were
prepared using OPS of target compressive strength of 30 MPa. A brief flowchart is
presented in Appendix D.
Table 3.1: Specimen details and test conducted with code of practice
Test Specimen Specimen dimension s
(mm)
Test age (day)
Code of practice
Physical properties of
materials
Specific gravity & water absorption N/A N/A N/A BS EN 1097-6:2013
Bulk density N/A N/A BS 3N: 1097-3:1998
Sieve analysis N/A N/A BS EN 933-1:2012
Moisture content N/A N/A BS EN 1097-5:2008
Workability N/A N/A BS EN 12350-2:2009
Oven-dry density N/A N/A 28 BS EN 12390-7:2009
Compressive strength Cube 100×100×100 3, 7, 28, 56, 90
BS EN 12390-3:2009
Splitting tensile strength Cylinder 100Ø×200 28 BS EN 12390-6:2009
Flexural strength Prism 100×100×500 28 BS EN 12390-5:2009
Young’s modulus & Poisson’s ratio Cylinder 150Ø×300 28 ASTM: C469/C469M−10
Impact test Panel 600×600×50 28 ACI 544.1R-96
Ultrasonic pulse velocity (UPV) Cube 100×100×100 28 BS EN 12504-4, 2004
33
3.2 Materials used to develop geopolymer mortar and concrete
3.2.1 Characterisation of materials
The materials used for this study are ground granulated blastfurnace slag (GGBS), palm
oil fuel ash (POFA), fly ash (FA), mining sand (NS), manufactured sand (MS), quarry
dust (QD), oil palm shell (OPS), crushed granite and steel fibre. The followings explain
each material used and its characteristics. A brief introductory is shown in Appendix E.
3.2.2 Ground granulated blastfurnace slag
Ground granulated blast furnace slag (GGBS) (Figure 3.1a) was obtained from YTL
Cement Marketing Sdn Bhd, Malaysia. The slag activity index of GGBS was 62% and
108% for 7 and 28 days respectively. The specific gravity was 2.89 g/cm3, specific surface
area was 405 m2/kg and the soundness was 1 mm. The particle size distribution of GGBS
is shown in Figure 3.2. It is off-white in colour and substantially lighter than Portland
cement. The chemical composition of GGBS is shown in Table 3.2; while its physical
properties are given in Table 3.3. GGBS shall contain at least two-thirds by mass of glassy
slag. The slag shall consist of at least two-thirds by mass of the sum of CaO, MgO and
SiO2. The remainder contains Al2O3 together with small amounts of other oxides. The
ratio by mass (CaO + MgO)/(SiO2) shall exceed 1.0 (BS 146, 1996). This GGBS fulfil
these requirements.
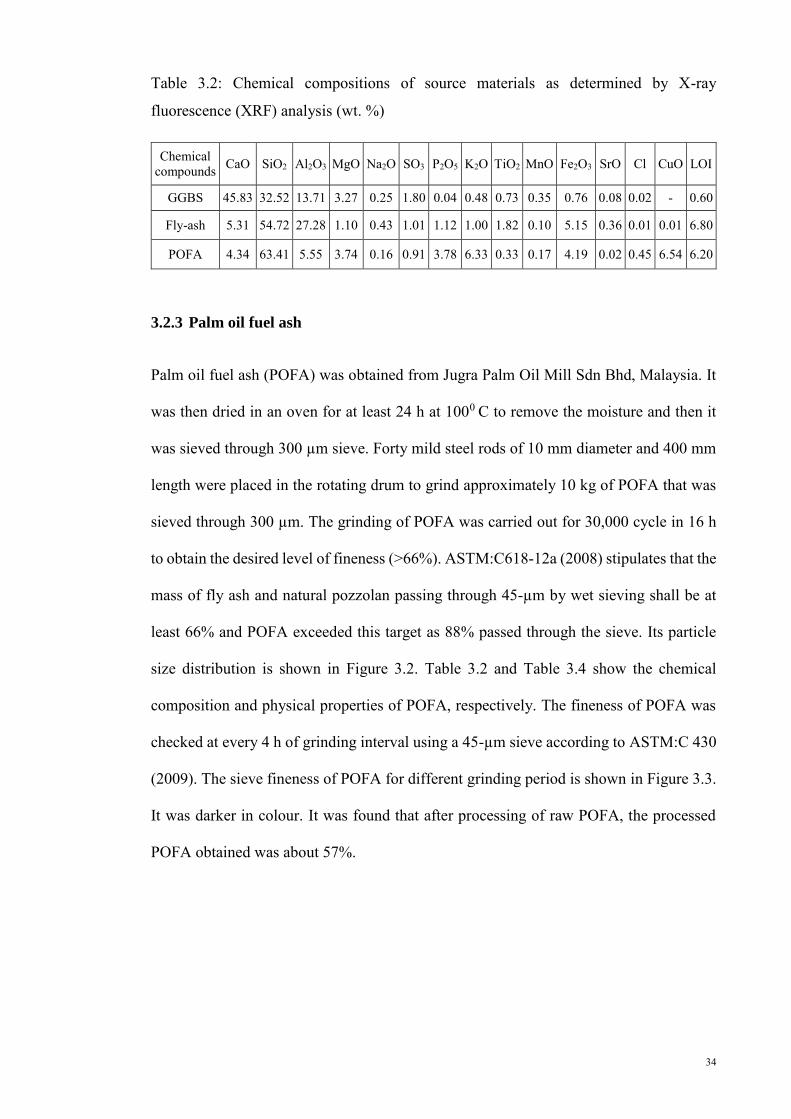
34
Table 3.2: Chemical compositions of source materials as determined by X-ray
fluorescence (XRF) analysis (wt. %)
Chemical compounds CaO SiO2 Al2O3 MgO Na2O SO3 P2O5 K2O TiO2 MnO Fe2O3 SrO Cl CuO LOI
GGBS 45.83 32.52 13.71 3.27 0.25 1.80 0.04 0.48 0.73 0.35 0.76 0.08 0.02 - 0.60
Fly-ash 5.31 54.72 27.28 1.10 0.43 1.01 1.12 1.00 1.82 0.10 5.15 0.36 0.01 0.01 6.80
POFA 4.34 63.41 5.55 3.74 0.16 0.91 3.78 6.33 0.33 0.17 4.19 0.02 0.45 6.54 6.20
3.2.3 Palm oil fuel ash
Palm oil fuel ash (POFA) was obtained from Jugra Palm Oil Mill Sdn Bhd, Malaysia. It
was then dried in an oven for at least 24 h at 1000 C to remove the moisture and then it
was sieved through 300 µm sieve. Forty mild steel rods of 10 mm diameter and 400 mm
length were placed in the rotating drum to grind approximately 10 kg of POFA that was
sieved through 300 µm. The grinding of POFA was carried out for 30,000 cycle in 16 h
to obtain the desired level of fineness (>66%). ASTM:C618-12a (2008) stipulates that the
mass of fly ash and natural pozzolan passing through 45-µm by wet sieving shall be at
least 66% and POFA exceeded this target as 88% passed through the sieve. Its particle
size distribution is shown in Figure 3.2. Table 3.2 and Table 3.4 show the chemical
composition and physical properties of POFA, respectively. The fineness of POFA was
checked at every 4 h of grinding interval using a 45-µm sieve according to ASTM:C 430
(2009). The sieve fineness of POFA for different grinding period is shown in Figure 3.3.
It was darker in colour. It was found that after processing of raw POFA, the processed
POFA obtained was about 57%.
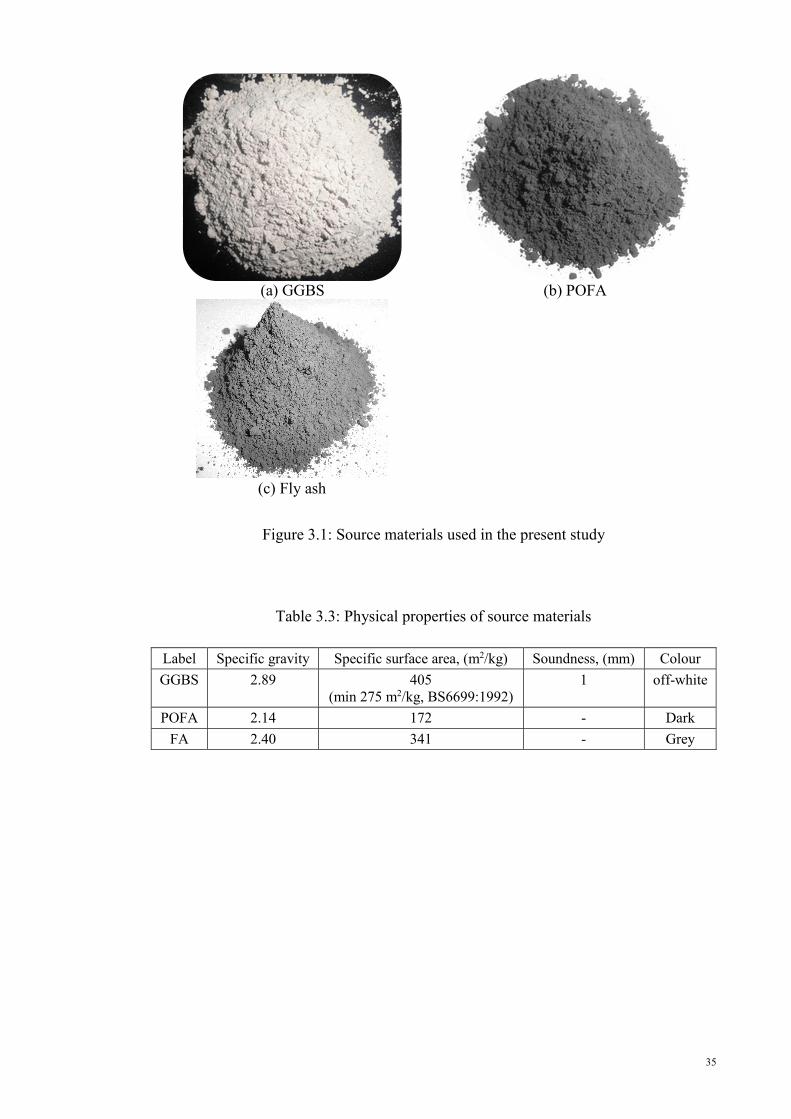
35
(a) GGBS
(b) POFA
(c) Fly ash
Figure 3.1: Source materials used in the present study
Table 3.3: Physical properties of source materials
Label Specific gravity Specific surface area, (m2/kg) Soundness, (mm) Colour GGBS 2.89 405
(min 275 m2/kg, BS6699:1992) 1 off-white
POFA 2.14 172 - Dark FA 2.40 341 - Grey
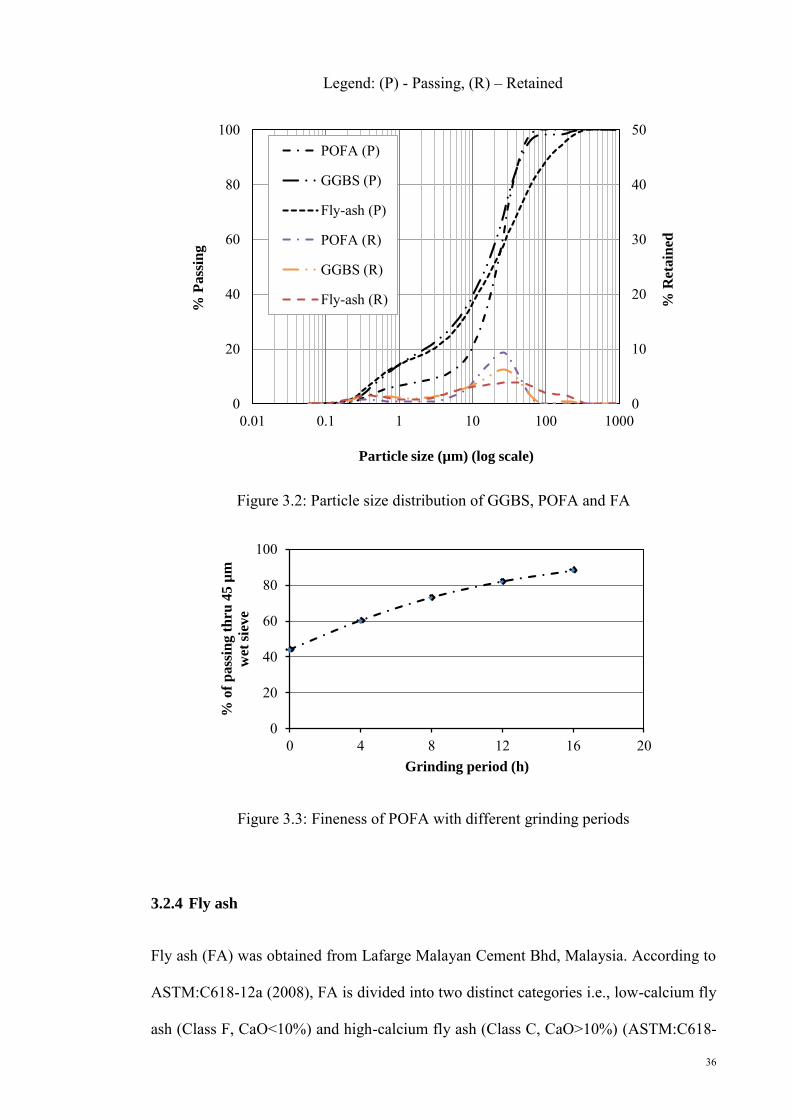
36
Legend: (P) - Passing, (R) – Retained
Figure 3.2: Particle size distribution of GGBS, POFA and FA
Figure 3.3: Fineness of POFA with different grinding periods
3.2.4 Fly ash
Fly ash (FA) was obtained from Lafarge Malayan Cement Bhd, Malaysia. According to
ASTM:C618-12a (2008), FA is divided into two distinct categories i.e., low-calcium fly
ash (Class F, CaO<10%) and high-calcium fly ash (Class C, CaO>10%) (ASTM:C618-
0
10
20
30
40
50
0
20
40
60
80
100
0.01 0.1 1 10 100 1000
% R
etain
ed
% P
ass
ing
Particle size (µm) (log scale)
POFA (P)
GGBS (P)
Fly-ash (P)
POFA (R)
GGBS (R)
Fly-ash (R)
0
20
40
60
80
100
0 4 8 12 16 20
% o
f p
ass
ing t
hru
45 µ
m
wet
sie
ve
Grinding period (h)
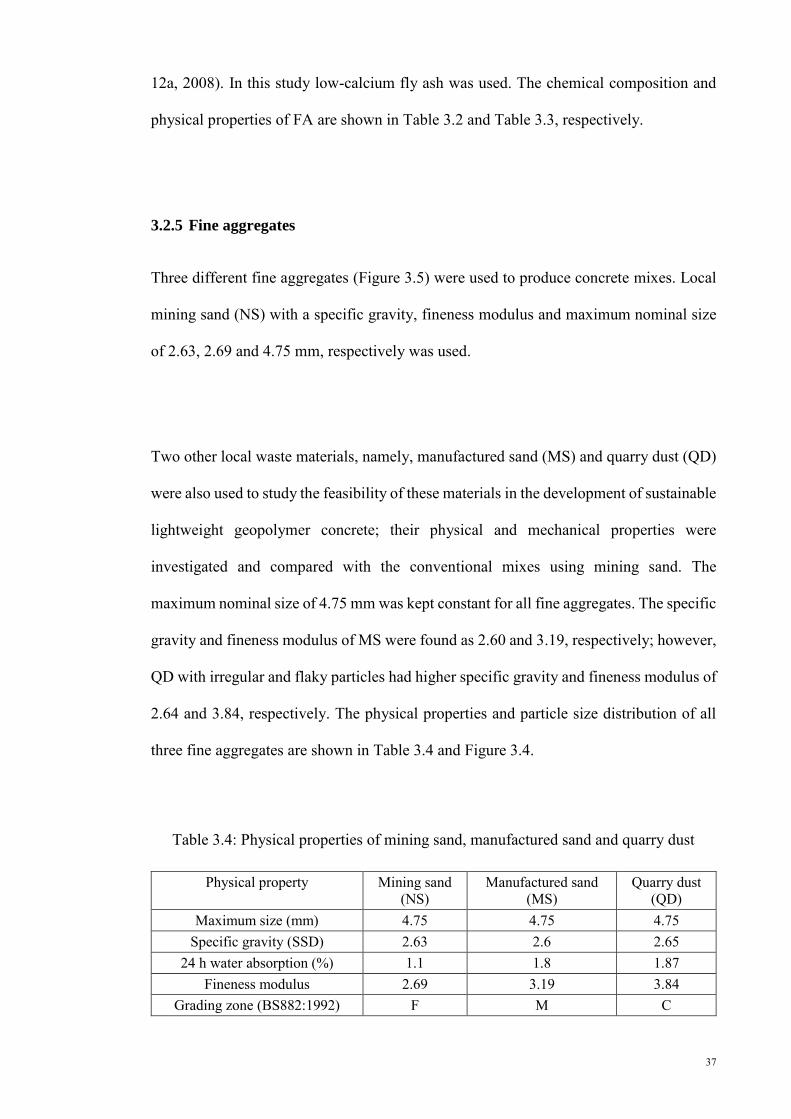
37
12a, 2008). In this study low-calcium fly ash was used. The chemical composition and
physical properties of FA are shown in Table 3.2 and Table 3.3, respectively.
3.2.5 Fine aggregates
Three different fine aggregates (Figure 3.5) were used to produce concrete mixes. Local
mining sand (NS) with a specific gravity, fineness modulus and maximum nominal size
of 2.63, 2.69 and 4.75 mm, respectively was used.
Two other local waste materials, namely, manufactured sand (MS) and quarry dust (QD)
were also used to study the feasibility of these materials in the development of sustainable
lightweight geopolymer concrete; their physical and mechanical properties were
investigated and compared with the conventional mixes using mining sand. The
maximum nominal size of 4.75 mm was kept constant for all fine aggregates. The specific
gravity and fineness modulus of MS were found as 2.60 and 3.19, respectively; however,
QD with irregular and flaky particles had higher specific gravity and fineness modulus of
2.64 and 3.84, respectively. The physical properties and particle size distribution of all
three fine aggregates are shown in Table 3.4 and Figure 3.4.
Table 3.4: Physical properties of mining sand, manufactured sand and quarry dust
Physical property Mining sand (NS)
Manufactured sand (MS)
Quarry dust (QD)
Maximum size (mm) 4.75 4.75 4.75 Specific gravity (SSD) 2.63 2.6 2.65
24 h water absorption (%) 1.1 1.8 1.87 Fineness modulus 2.69 3.19 3.84
Grading zone (BS882:1992) F M C

38
Figure 3.4: Particle size distribution of NS, MS and QD
(a) Mining sand (NS)
(b) Manufactured sand (MS)
(c) Quarry dust (QD)
Figure 3.5: Coarse fraction of fine aggregate (a) Mining sand (NS); (b) Manufactured
sand (MS) and (c) Quarry dust (QD)
3.2.6 Coarse aggregates
The coarse aggregate used in this study were oil palm shell (OPS) collected from local
palm oil factory, in both uncrushed and crushed conditions (Figure 3.6), with maximum
0
20
40
60
80
100
0 1 10
% F
iner
Particle size (mm) (log scale)
NS
MS
QD
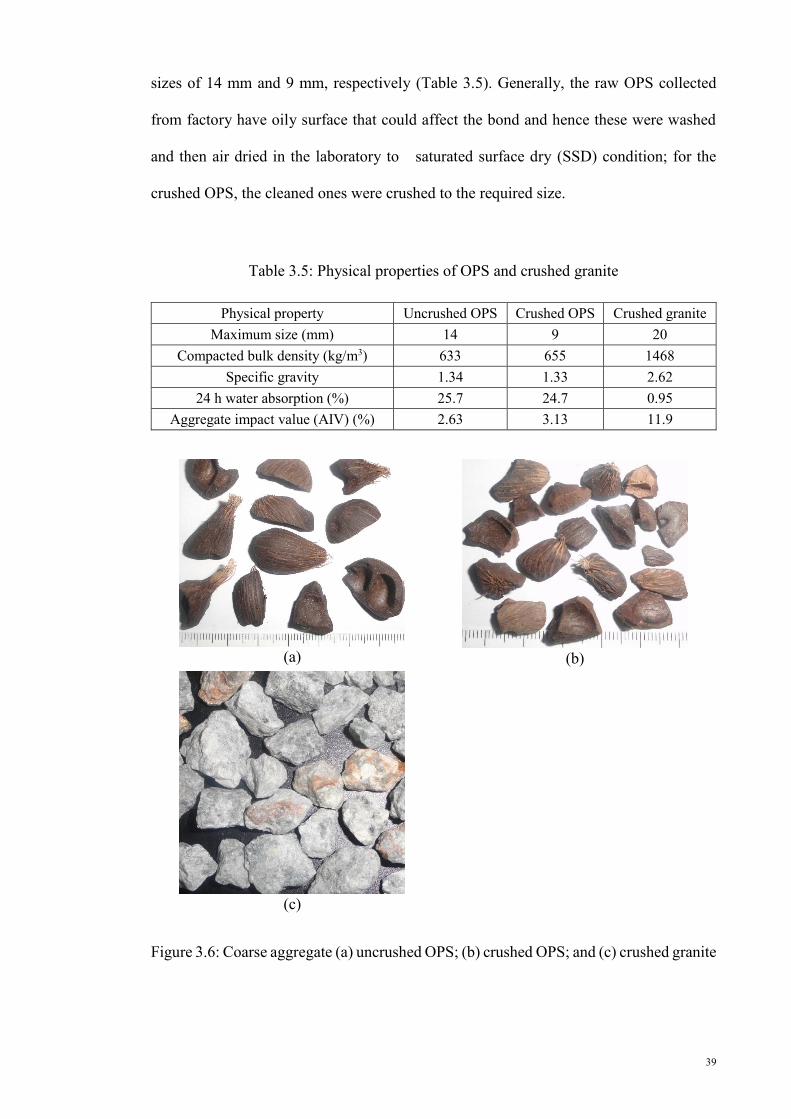
39
sizes of 14 mm and 9 mm, respectively (Table 3.5). Generally, the raw OPS collected
from factory have oily surface that could affect the bond and hence these were washed
and then air dried in the laboratory to saturated surface dry (SSD) condition; for the
crushed OPS, the cleaned ones were crushed to the required size.
Table 3.5: Physical properties of OPS and crushed granite
Physical property Uncrushed OPS Crushed OPS Crushed granite Maximum size (mm) 14 9 20
Compacted bulk density (kg/m3) 633 655 1468 Specific gravity 1.34 1.33 2.62
24 h water absorption (%) 25.7 24.7 0.95 Aggregate impact value (AIV) (%) 2.63 3.13 11.9
(a)
(b)
(c)
Figure 3.6: Coarse aggregate (a) uncrushed OPS; (b) crushed OPS; and (c) crushed granite

40
The uncrushed OPS have concave and convex surfaces and the outer convex surface has
smoother surface compared to concave surface. The crushed OPS have more spiky edges
than the uncrushed OPS (Figure 3.6) (Mo et al., 2014b). The physical properties of the
uncrushed and crushed OPS along with conventional crushed granite aggregate are given
in Table 3.5. Both the crushed and the uncrushed OPS have lower aggregate impact value
(AIV) and bulk density than the crushed granite aggregate. As seen from Table 3.5, the
24 h water absorption of OPS is very high (about 25%) compared to NWA (0.95%).
Higher water absorption characteristics of OPS shows that pre-soaking is necessary
or higher water content must be used to compensate for loss of water due to absorption
(Alengaram et al., 2010a).
3.3 Activator solution
A combination of sodium silicate (Na2O= 12%, SiO2=30%, and water = 57% by mass)
and sodium hydroxide solution (NaOH) was used as alkaline activator. The solution of
12 molarity (M) NaOH prepared with 99% purity such that 361 g of pellets was dissolved
in 1 kg of solution (Wallah & Rangan, 2006). The ratio of Na2SiO3/NaOH was kept
constant at 2.5 for all the mixes and the mixture contained additional water.
The specific gravity of the combined alkaline activators was found about 1.57; while the
specific gravities of Na2SiO3 and NaOH were 1.65 and 1.38, respectively. The specific
gravity of NaOH solution varied depends on the molarity of the solution. The increase in
concentration, increase in specific gravity and vice-versa. The formula for the combined
specific gravity is as follows:
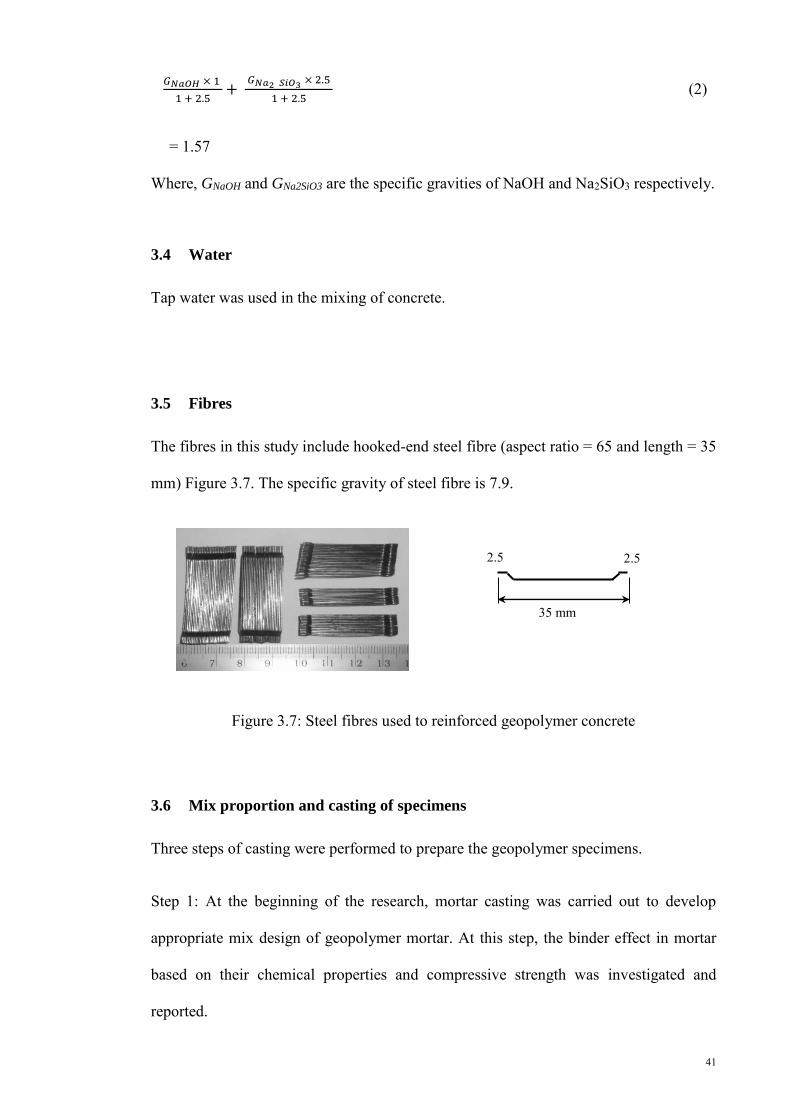
41
𝐺𝑁𝑎𝑂𝐻 × 1
1 + 2.5+
𝐺𝑁𝑎2 𝑆𝑖𝑂3 × 2.5
1 + 2.5 (2)
= 1.57
Where, GNaOH and GNa2SiO3 are the specific gravities of NaOH and Na2SiO3 respectively.
3.4 Water
Tap water was used in the mixing of concrete.
3.5 Fibres
The fibres in this study include hooked-end steel fibre (aspect ratio = 65 and length = 35
mm) Figure 3.7. The specific gravity of steel fibre is 7.9.
Figure 3.7: Steel fibres used to reinforced geopolymer concrete
3.6 Mix proportion and casting of specimens
Three steps of casting were performed to prepare the geopolymer specimens.
Step 1: At the beginning of the research, mortar casting was carried out to develop
appropriate mix design of geopolymer mortar. At this step, the binder effect in mortar
based on their chemical properties and compressive strength was investigated and
reported.
35 mm
2.5 2.5
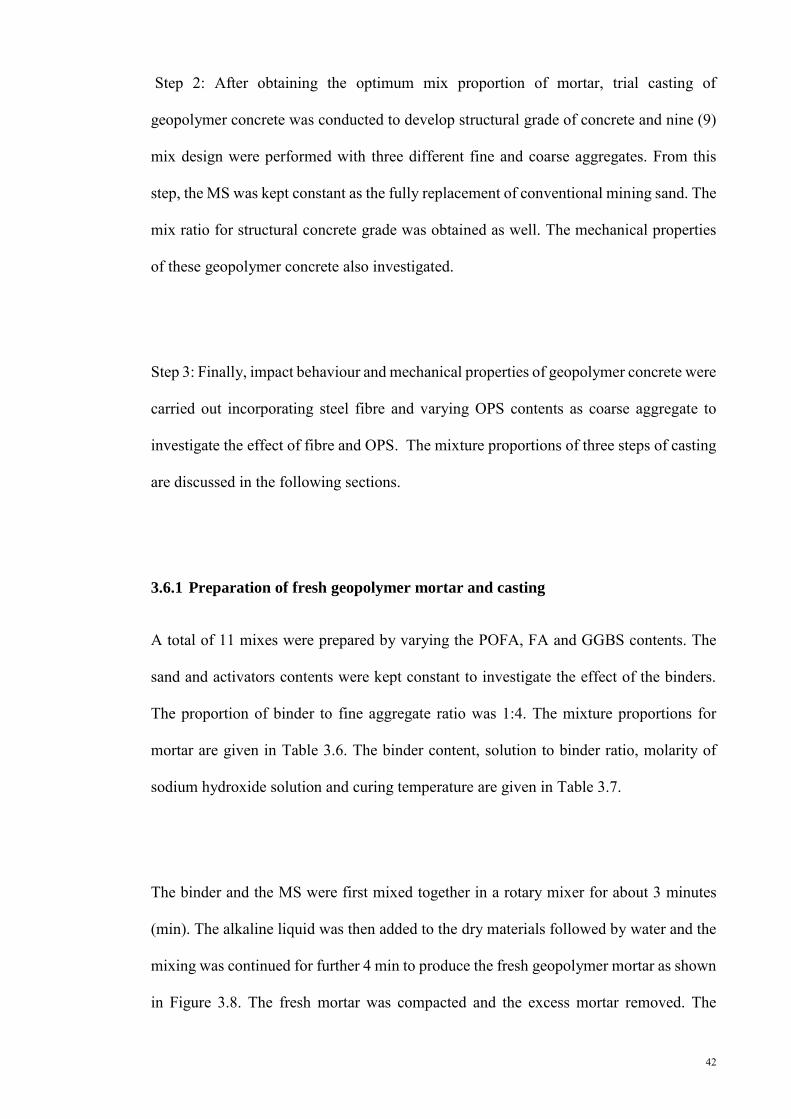
42
Step 2: After obtaining the optimum mix proportion of mortar, trial casting of
geopolymer concrete was conducted to develop structural grade of concrete and nine (9)
mix design were performed with three different fine and coarse aggregates. From this
step, the MS was kept constant as the fully replacement of conventional mining sand. The
mix ratio for structural concrete grade was obtained as well. The mechanical properties
of these geopolymer concrete also investigated.
Step 3: Finally, impact behaviour and mechanical properties of geopolymer concrete were
carried out incorporating steel fibre and varying OPS contents as coarse aggregate to
investigate the effect of fibre and OPS. The mixture proportions of three steps of casting
are discussed in the following sections.
3.6.1 Preparation of fresh geopolymer mortar and casting
A total of 11 mixes were prepared by varying the POFA, FA and GGBS contents. The
sand and activators contents were kept constant to investigate the effect of the binders.
The proportion of binder to fine aggregate ratio was 1:4. The mixture proportions for
mortar are given in Table 3.6. The binder content, solution to binder ratio, molarity of
sodium hydroxide solution and curing temperature are given in Table 3.7.
The binder and the MS were first mixed together in a rotary mixer for about 3 minutes
(min). The alkaline liquid was then added to the dry materials followed by water and the
mixing was continued for further 4 min to produce the fresh geopolymer mortar as shown
in Figure 3.8. The fresh mortar was compacted and the excess mortar removed. The
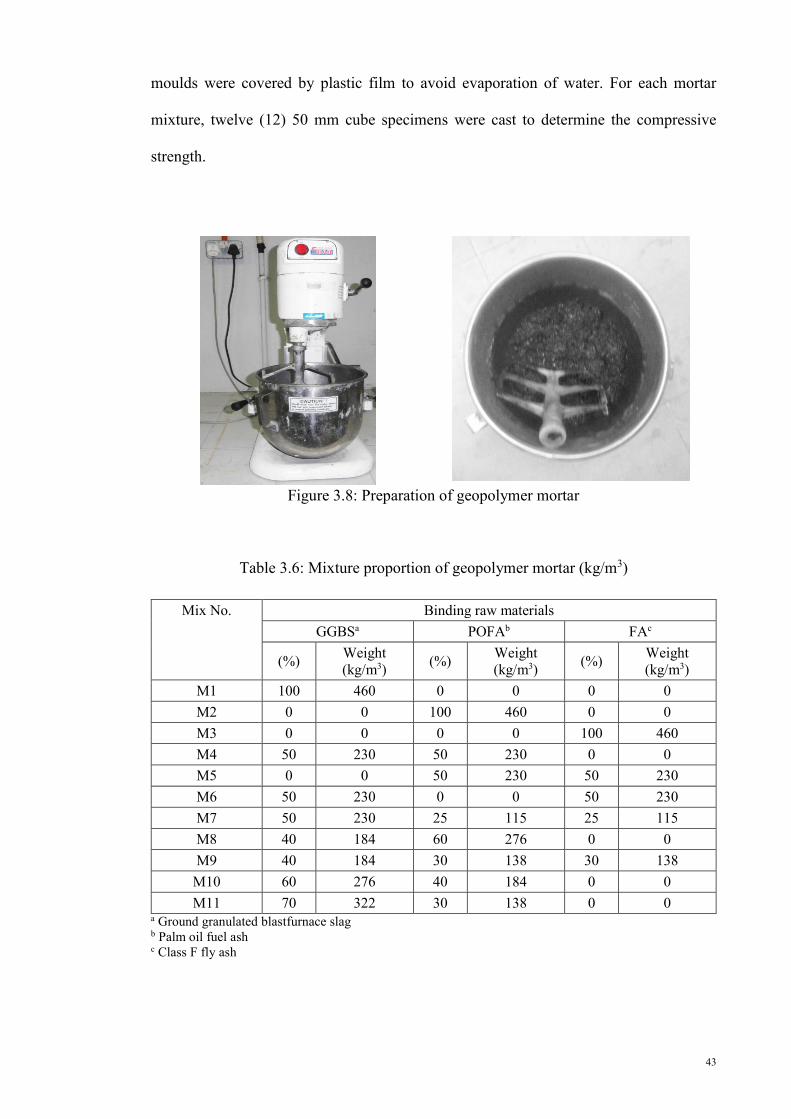
43
moulds were covered by plastic film to avoid evaporation of water. For each mortar
mixture, twelve (12) 50 mm cube specimens were cast to determine the compressive
strength.
Figure 3.8: Preparation of geopolymer mortar
Table 3.6: Mixture proportion of geopolymer mortar (kg/m3)
Mix No. Binding raw materials GGBSa POFAb FAc
(%) Weight (kg/m3) (%) Weight
(kg/m3) (%) Weight (kg/m3)
M1 100 460 0 0 0 0 M2 0 0 100 460 0 0 M3 0 0 0 0 100 460 M4 50 230 50 230 0 0 M5 0 0 50 230 50 230 M6 50 230 0 0 50 230 M7 50 230 25 115 25 115 M8 40 184 60 276 0 0 M9 40 184 30 138 30 138
M10 60 276 40 184 0 0 M11 70 322 30 138 0 0
a Ground granulated blastfurnace slag b Palm oil fuel ash c Class F fly ash
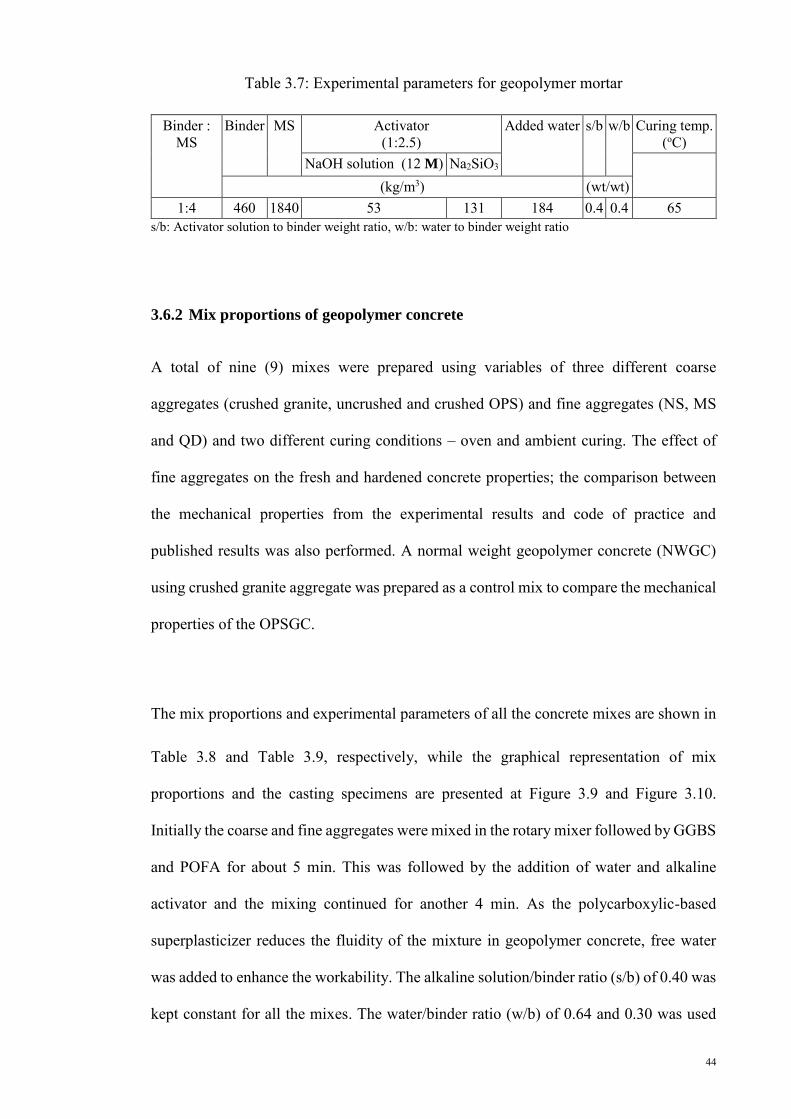
44
Table 3.7: Experimental parameters for geopolymer mortar
Binder : MS
Binder MS Activator (1:2.5)
Added water s/b w/b Curing temp. (oC)
NaOH solution (12 M) Na2SiO3 (kg/m3) (wt/wt)
1:4 460 1840 53 131 184 0.4 0.4 65 s/b: Activator solution to binder weight ratio, w/b: water to binder weight ratio
3.6.2 Mix proportions of geopolymer concrete
A total of nine (9) mixes were prepared using variables of three different coarse
aggregates (crushed granite, uncrushed and crushed OPS) and fine aggregates (NS, MS
and QD) and two different curing conditions – oven and ambient curing. The effect of
fine aggregates on the fresh and hardened concrete properties; the comparison between
the mechanical properties from the experimental results and code of practice and
published results was also performed. A normal weight geopolymer concrete (NWGC)
using crushed granite aggregate was prepared as a control mix to compare the mechanical
properties of the OPSGC.
The mix proportions and experimental parameters of all the concrete mixes are shown in
Table 3.8 and Table 3.9, respectively, while the graphical representation of mix
proportions and the casting specimens are presented at Figure 3.9 and Figure 3.10.
Initially the coarse and fine aggregates were mixed in the rotary mixer followed by GGBS
and POFA for about 5 min. This was followed by the addition of water and alkaline
activator and the mixing continued for another 4 min. As the polycarboxylic-based
superplasticizer reduces the fluidity of the mixture in geopolymer concrete, free water
was added to enhance the workability. The alkaline solution/binder ratio (s/b) of 0.40 was
kept constant for all the mixes. The water/binder ratio (w/b) of 0.64 and 0.30 was used
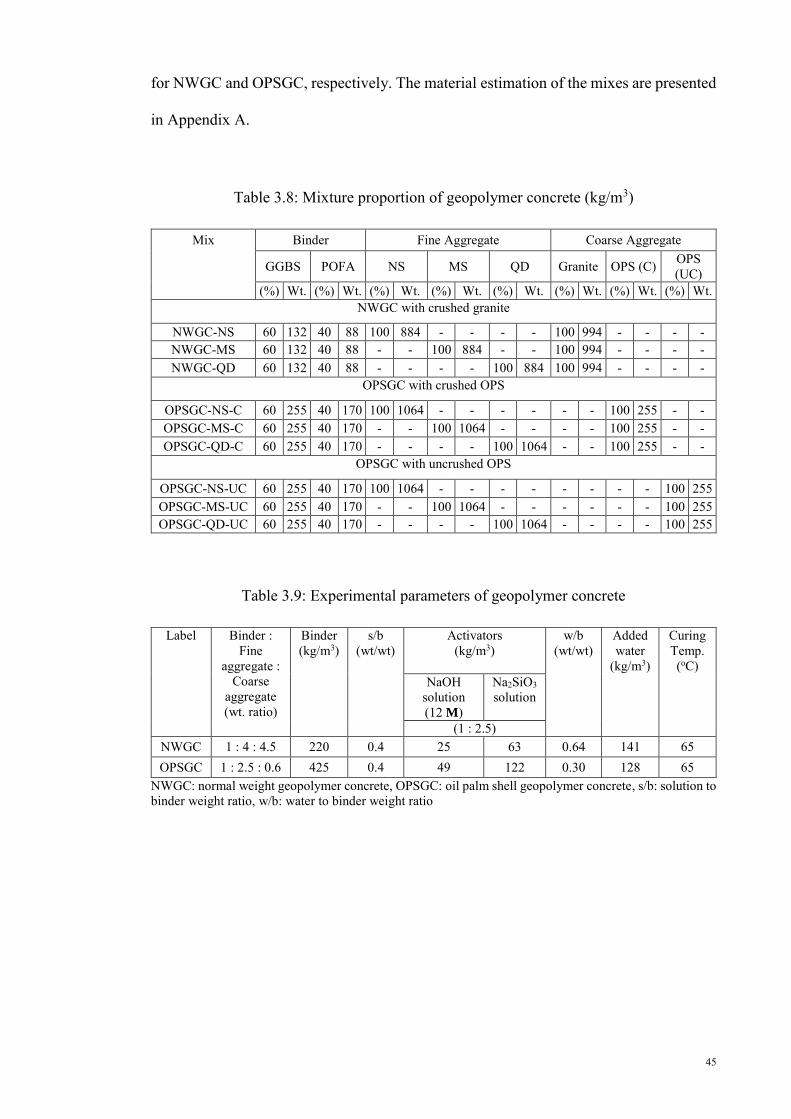
45
for NWGC and OPSGC, respectively. The material estimation of the mixes are presented
in Appendix A.
Table 3.8: Mixture proportion of geopolymer concrete (kg/m3)
Mix Binder Fine Aggregate Coarse Aggregate
GGBS POFA NS MS QD Granite OPS (C) OPS (UC)
(%) Wt. (%) Wt. (%) Wt. (%) Wt. (%) Wt. (%) Wt. (%) Wt. (%) Wt. NWGC with crushed granite
NWGC-NS 60 132 40 88 100 884 - - - - 100 994 - - - - NWGC-MS 60 132 40 88 - - 100 884 - - 100 994 - - - - NWGC-QD 60 132 40 88 - - - - 100 884 100 994 - - - -
OPSGC with crushed OPS
OPSGC-NS-C 60 255 40 170 100 1064 - - - - - - 100 255 - - OPSGC-MS-C 60 255 40 170 - - 100 1064 - - - - 100 255 - - OPSGC-QD-C 60 255 40 170 - - - - 100 1064 - - 100 255 - -
OPSGC with uncrushed OPS
OPSGC-NS-UC 60 255 40 170 100 1064 - - - - - - - - 100 255 OPSGC-MS-UC 60 255 40 170 - - 100 1064 - - - - - - 100 255 OPSGC-QD-UC 60 255 40 170 - - - - 100 1064 - - - - 100 255
Table 3.9: Experimental parameters of geopolymer concrete
Label Binder : Fine
aggregate : Coarse
aggregate (wt. ratio)
Binder (kg/m3)
s/b (wt/wt)
Activators (kg/m3)
w/b (wt/wt)
Added water
(kg/m3)
Curing Temp. (oC)
NaOH solution (12 M)
Na2SiO3 solution
(1 : 2.5) NWGC 1 : 4 : 4.5 220 0.4 25 63 0.64 141 65 OPSGC 1 : 2.5 : 0.6 425 0.4 49 122 0.30 128 65
NWGC: normal weight geopolymer concrete, OPSGC: oil palm shell geopolymer concrete, s/b: solution to binder weight ratio, w/b: water to binder weight ratio
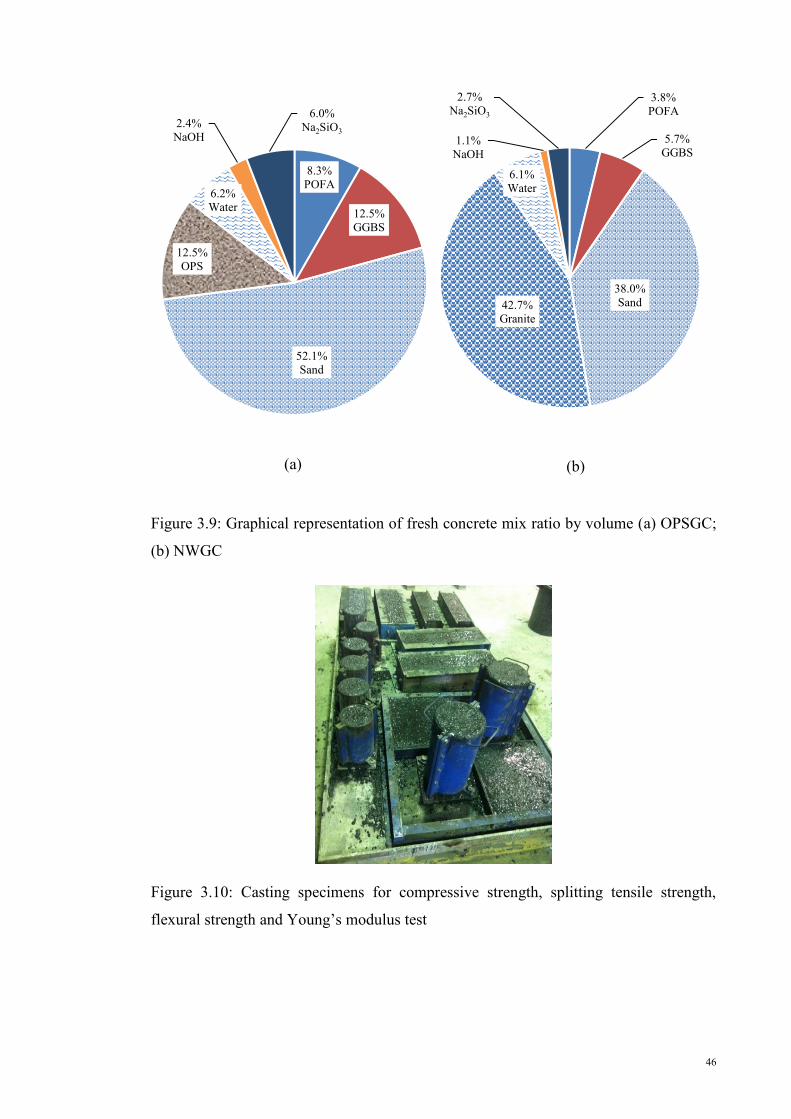
46
(a)
(b)
Figure 3.9: Graphical representation of fresh concrete mix ratio by volume (a) OPSGC;
(b) NWGC
Figure 3.10: Casting specimens for compressive strength, splitting tensile strength,
flexural strength and Young’s modulus test
8.3%POFA
12.5%GGBS
52.1%Sand
12.5%OPS
6.2%Water
2.4%NaOH
6.0%Na2SiO3
3.8%POFA
5.7%GGBS
38.0%Sand42.7%
Granite
6.1%Water
1.1%NaOH
2.7%Na2SiO3
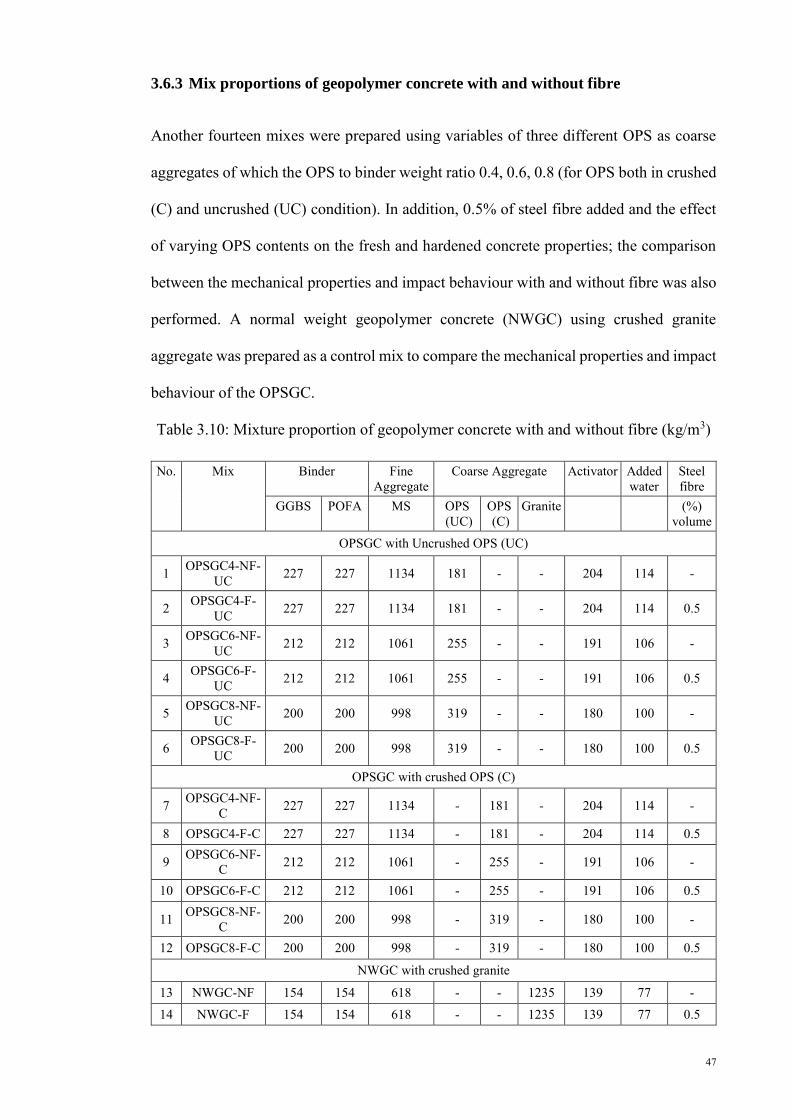
47
3.6.3 Mix proportions of geopolymer concrete with and without fibre
Another fourteen mixes were prepared using variables of three different OPS as coarse
aggregates of which the OPS to binder weight ratio 0.4, 0.6, 0.8 (for OPS both in crushed
(C) and uncrushed (UC) condition). In addition, 0.5% of steel fibre added and the effect
of varying OPS contents on the fresh and hardened concrete properties; the comparison
between the mechanical properties and impact behaviour with and without fibre was also
performed. A normal weight geopolymer concrete (NWGC) using crushed granite
aggregate was prepared as a control mix to compare the mechanical properties and impact
behaviour of the OPSGC.
Table 3.10: Mixture proportion of geopolymer concrete with and without fibre (kg/m3)
No. Mix Binder Fine Aggregate
Coarse Aggregate Activator Added water
Steel fibre
GGBS POFA MS OPS (UC)
OPS (C)
Granite (%) volume
OPSGC with Uncrushed OPS (UC)
1 OPSGC4-NF-UC 227 227 1134 181 - - 204 114 -
2 OPSGC4-F- UC 227 227 1134 181 - - 204 114 0.5
3 OPSGC6-NF- UC 212 212 1061 255 - - 191 106 -
4 OPSGC6-F- UC 212 212 1061 255 - - 191 106 0.5
5 OPSGC8-NF- UC 200 200 998 319 - - 180 100 -
6 OPSGC8-F- UC 200 200 998 319 - - 180 100 0.5
OPSGC with crushed OPS (C)
7 OPSGC4-NF-C 227 227 1134 - 181 - 204 114 -
8 OPSGC4-F-C 227 227 1134 - 181 - 204 114 0.5
9 OPSGC6-NF-C 212 212 1061 - 255 - 191 106 -
10 OPSGC6-F-C 212 212 1061 - 255 - 191 106 0.5
11 OPSGC8-NF-C 200 200 998 - 319 - 180 100 -
12 OPSGC8-F-C 200 200 998 - 319 - 180 100 0.5
NWGC with crushed granite
13 NWGC-NF 154 154 618 - - 1235 139 77 -
14 NWGC-F 154 154 618 - - 1235 139 77 0.5
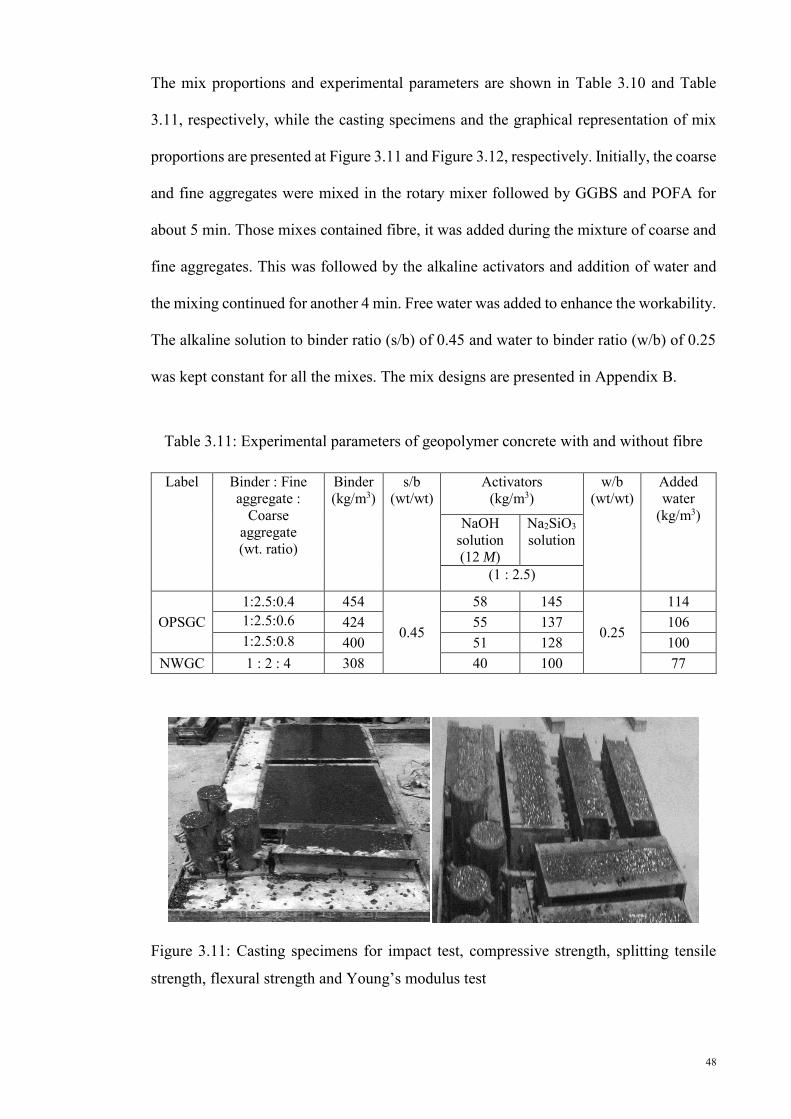
48
The mix proportions and experimental parameters are shown in Table 3.10 and Table
3.11, respectively, while the casting specimens and the graphical representation of mix
proportions are presented at Figure 3.11 and Figure 3.12, respectively. Initially, the coarse
and fine aggregates were mixed in the rotary mixer followed by GGBS and POFA for
about 5 min. Those mixes contained fibre, it was added during the mixture of coarse and
fine aggregates. This was followed by the alkaline activators and addition of water and
the mixing continued for another 4 min. Free water was added to enhance the workability.
The alkaline solution to binder ratio (s/b) of 0.45 and water to binder ratio (w/b) of 0.25
was kept constant for all the mixes. The mix designs are presented in Appendix B.
Table 3.11: Experimental parameters of geopolymer concrete with and without fibre
Label Binder : Fine aggregate :
Coarse aggregate (wt. ratio)
Binder (kg/m3)
s/b (wt/wt)
Activators (kg/m3)
w/b (wt/wt)
Added water
(kg/m3) NaOH solution (12 M)
Na2SiO3
solution
(1 : 2.5)
OPSGC 1:2.5:0.4 454
0.45
58 145
0.25
114 1:2.5:0.6 424 55 137 106 1:2.5:0.8 400 51 128 100
NWGC 1 : 2 : 4 308 40 100 77
Figure 3.11: Casting specimens for impact test, compressive strength, splitting tensile
strength, flexural strength and Young’s modulus test

49
(a)
(b)
(c)
(d)
Figure 3.12: Graphical representation of fresh concrete mix ratio by volume (a) 1:2.5:0.4
(OPSGC); (b) 1:2.5:0.6 (OPSGC); (c) 1:2.5:0.8 (OPSGC); and (d) NWGC
10.9%POFA
10.9%GGBS
54.3%MS
8.7%OPS
5.4%Water
2.8%NaOH
7.0%Na2SiO3
Mix 1:2.5:0.4 (OPSGC)
10.4%POFA
10.4%GGBS
52.1%MS
12.5%OPS
5.2%Water
2.7%NaOH 6.7%
Na2SiO3
Mix 1:2.5:0.6 (OPSGC)
10.0% POFA
10.0% GGBS
50.0% MS
16.0% OPS
5.0% Water
2.6% NaOH
6.4% Na2SiO3
Mat
eria
ls
0% 10% 20% 30% 40% 50% 60%
Mix 1:2.5:0.8 (OPSGC)
6.5% POFA
6.5% GGBS
26.0% MS
51.9% Crushed granite
3.2% Water
1.7% NaOH
4.2% Na2SiO3
Mat
eria
ls
0% 10% 20% 30% 40% 50% 60%
Mix 1:2:4 (NWGC)
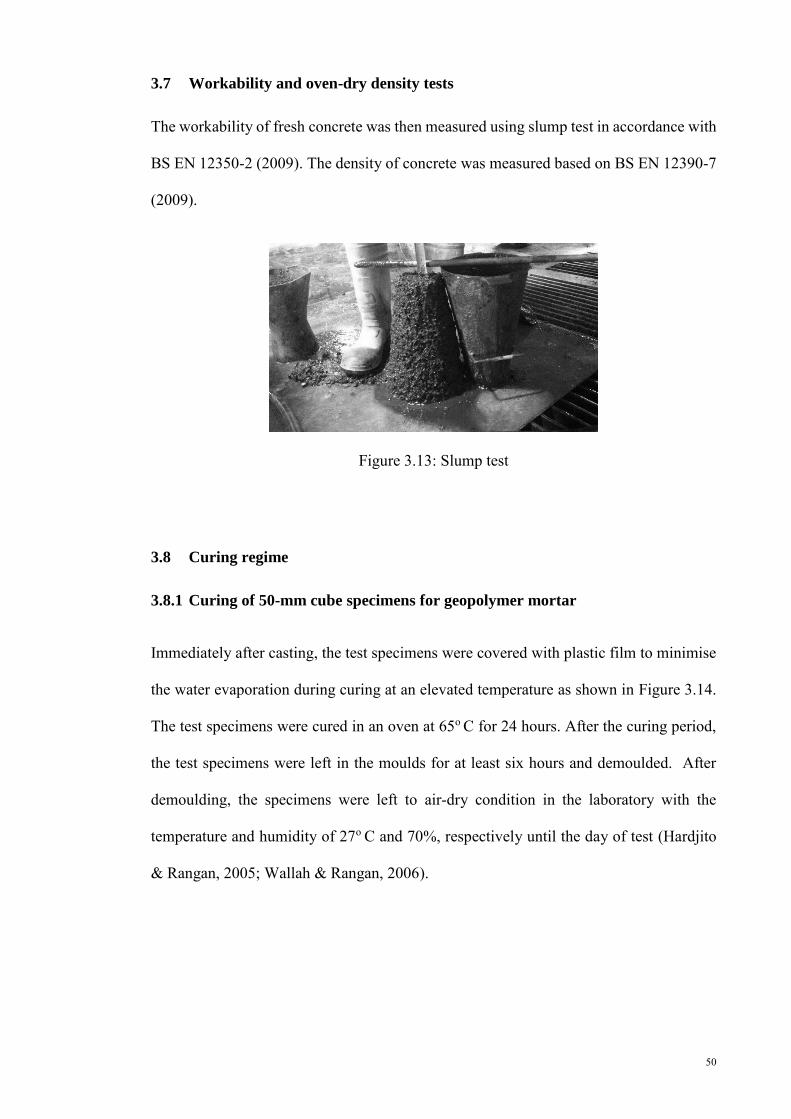
50
3.7 Workability and oven-dry density tests
The workability of fresh concrete was then measured using slump test in accordance with
BS EN 12350-2 (2009). The density of concrete was measured based on BS EN 12390-7
(2009).
Figure 3.13: Slump test
3.8 Curing regime
3.8.1 Curing of 50-mm cube specimens for geopolymer mortar
Immediately after casting, the test specimens were covered with plastic film to minimise
the water evaporation during curing at an elevated temperature as shown in Figure 3.14.
The test specimens were cured in an oven at 65o C for 24 hours. After the curing period,
the test specimens were left in the moulds for at least six hours and demoulded. After
demoulding, the specimens were left to air-dry condition in the laboratory with the
temperature and humidity of 27o C and 70%, respectively until the day of test (Hardjito
& Rangan, 2005; Wallah & Rangan, 2006).
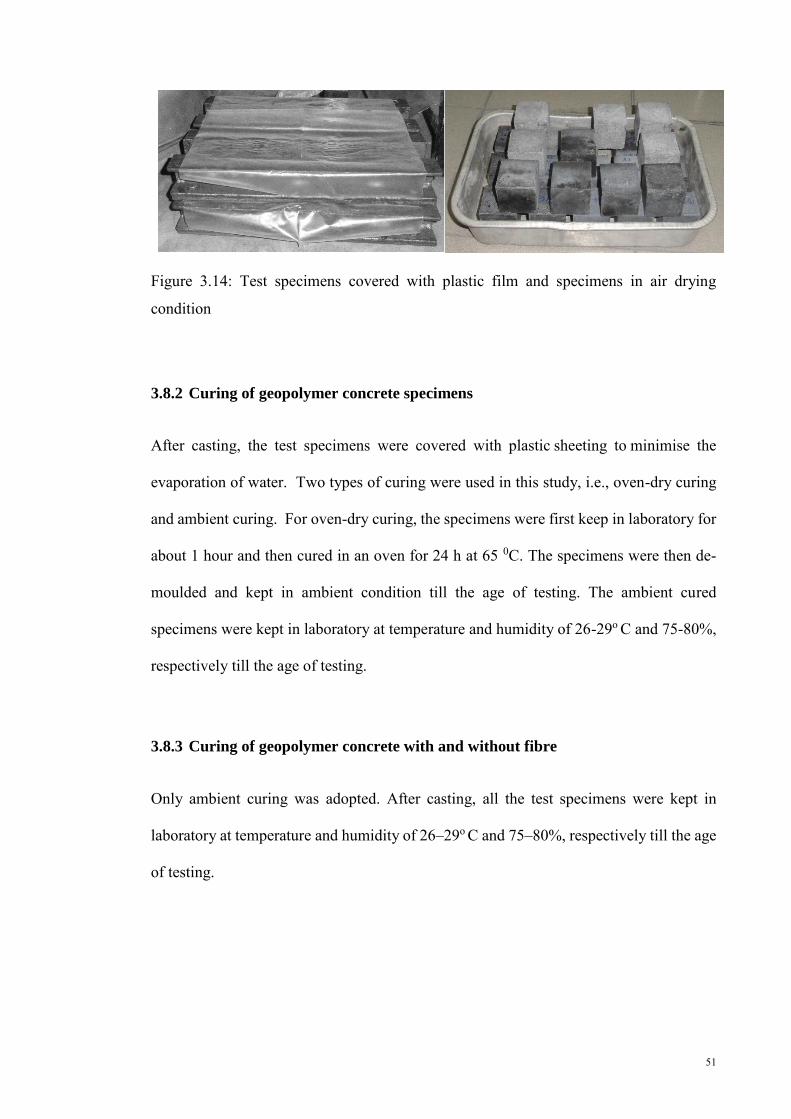
51
Figure 3.14: Test specimens covered with plastic film and specimens in air drying
condition
3.8.2 Curing of geopolymer concrete specimens
After casting, the test specimens were covered with plastic sheeting to minimise the
evaporation of water. Two types of curing were used in this study, i.e., oven-dry curing
and ambient curing. For oven-dry curing, the specimens were first keep in laboratory for
about 1 hour and then cured in an oven for 24 h at 65 0C. The specimens were then de-
moulded and kept in ambient condition till the age of testing. The ambient cured
specimens were kept in laboratory at temperature and humidity of 26-29o C and 75-80%,
respectively till the age of testing.
3.8.3 Curing of geopolymer concrete with and without fibre
Only ambient curing was adopted. After casting, all the test specimens were kept in
laboratory at temperature and humidity of 26–29o C and 75–80%, respectively till the age
of testing.
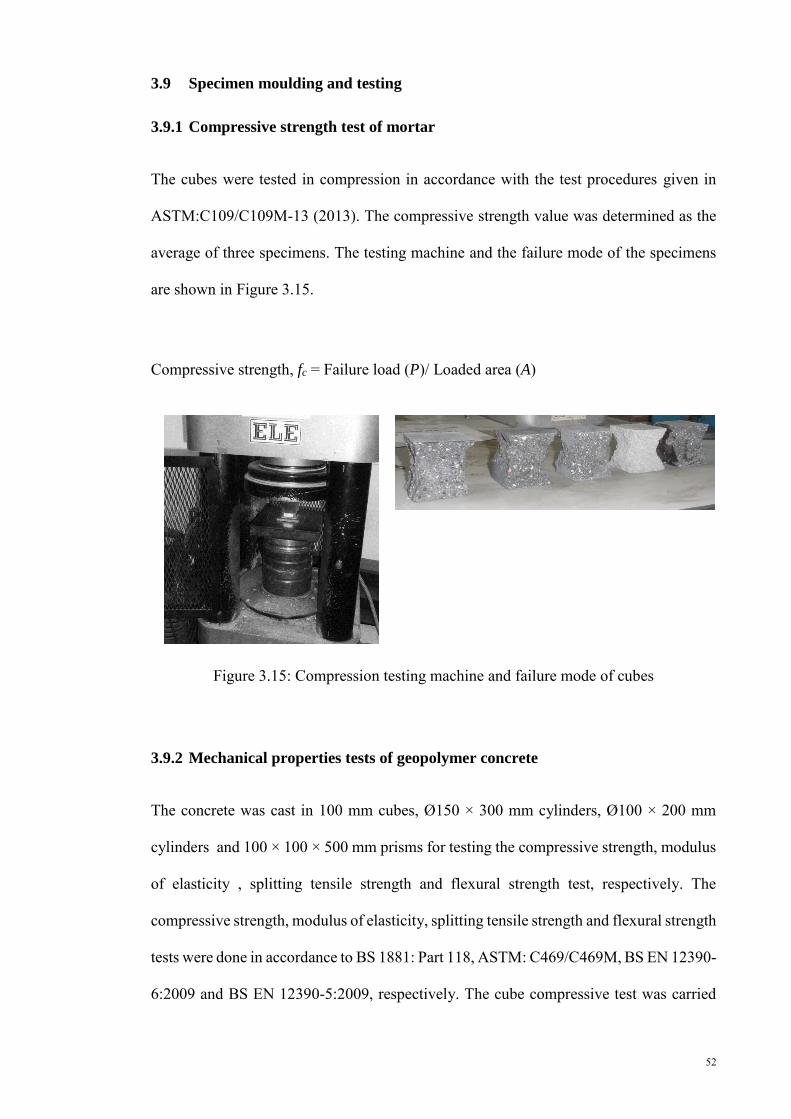
52
3.9 Specimen moulding and testing
3.9.1 Compressive strength test of mortar
The cubes were tested in compression in accordance with the test procedures given in
ASTM:C109/C109M-13 (2013). The compressive strength value was determined as the
average of three specimens. The testing machine and the failure mode of the specimens
are shown in Figure 3.15.
Compressive strength, fc = Failure load (P)/ Loaded area (A)
Figure 3.15: Compression testing machine and failure mode of cubes
3.9.2 Mechanical properties tests of geopolymer concrete
The concrete was cast in 100 mm cubes, Ø150 × 300 mm cylinders, Ø100 × 200 mm
cylinders and 100 × 100 × 500 mm prisms for testing the compressive strength, modulus
of elasticity , splitting tensile strength and flexural strength test, respectively. The
compressive strength, modulus of elasticity, splitting tensile strength and flexural strength
tests were done in accordance to BS 1881: Part 118, ASTM: C469/C469M, BS EN 12390-
6:2009 and BS EN 12390-5:2009, respectively. The cube compressive test was carried

53
out at 3-, 7- and 28-days, while the modulus of elasticity, splitting tensile strength and
flexural strength were tested at the age of 28-day.
3.9.3 Mechanical properties tests of geopolymer concrete with and without fibre
This section is similar to that of the Sec 3.9.2 . The difference is only the incorporation
of steel fibre, variation of OPS content to investigate their effectiveness and subsequently
material mixing proportion during casting that already described in Section 3.6.3
3.9.4 Ultrasonic pulse velocity (UPV)
Ultrasonic pulse velocity (UPV) test is a non-destructive test of concrete. UPV test is
based on the pulse velocity method to provide information on the uniformity of concrete,
cavities, cracks and defects. The pulse velocity in a material depends on its density and
its elastic properties which in turn are related to the quality and the compressive strength
of the concrete. It is easy to use and the results can be quickly obtained on site. The UPV
of a homogeneous solid can be easily related to its physical and mechanical properties.
Figure 3.16: Measurement of UPV
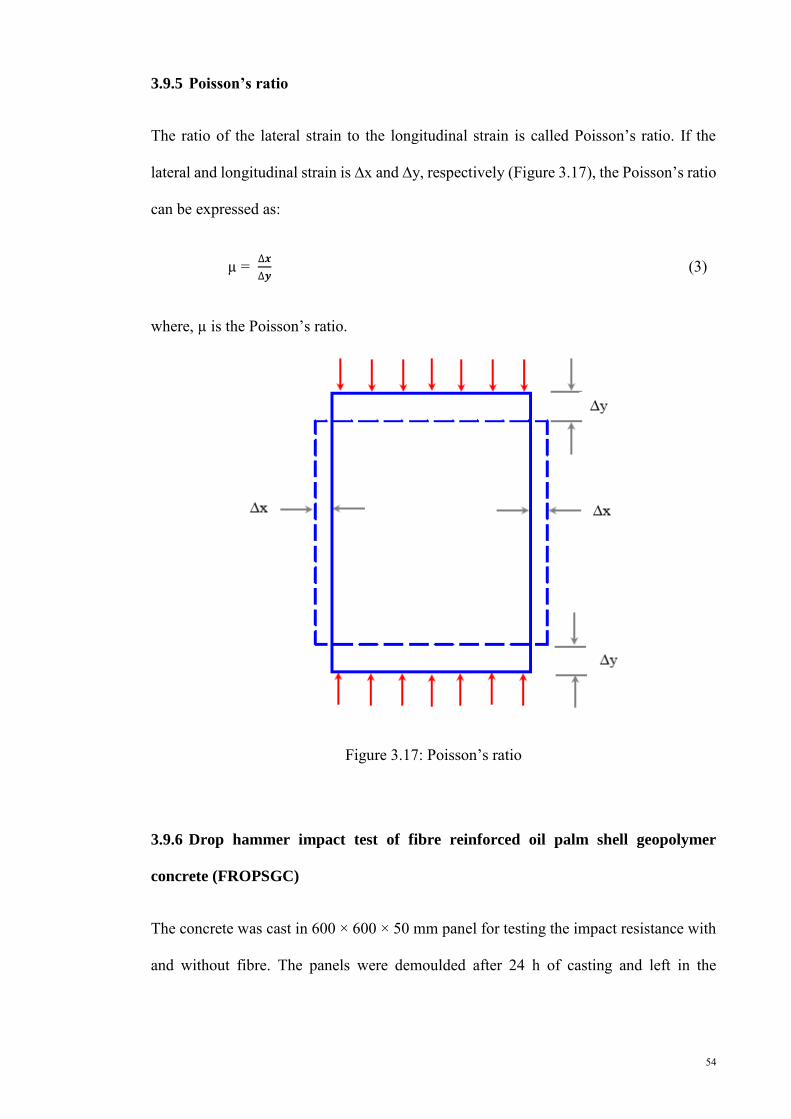
54
3.9.5 Poisson’s ratio
The ratio of the lateral strain to the longitudinal strain is called Poisson’s ratio. If the
lateral and longitudinal strain is ∆x and ∆y, respectively (Figure 3.17), the Poisson’s ratio
can be expressed as:
µ = ∆𝒙
∆𝒚 (3)
where, µ is the Poisson’s ratio.
Figure 3.17: Poisson’s ratio
3.9.6 Drop hammer impact test of fibre reinforced oil palm shell geopolymer
concrete (FROPSGC)
The concrete was cast in 600 × 600 × 50 mm panel for testing the impact resistance with
and without fibre. The panels were demoulded after 24 h of casting and left in the
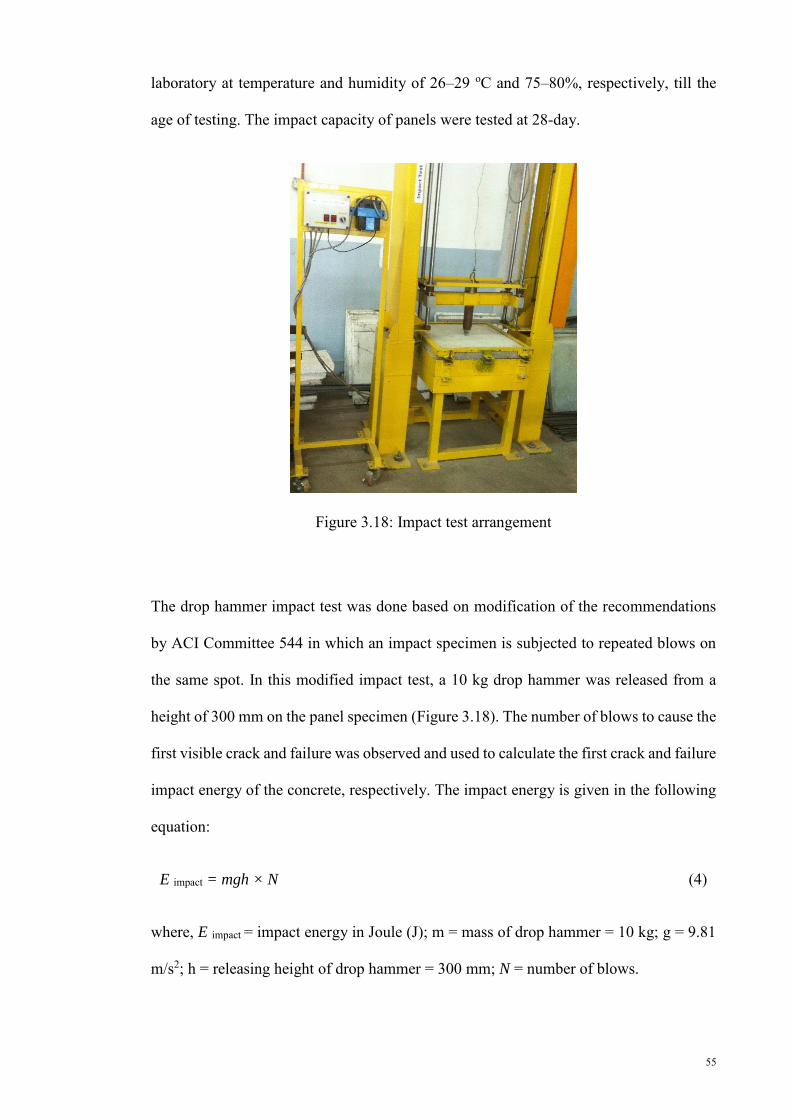
55
laboratory at temperature and humidity of 26–29 oC and 75–80%, respectively, till the
age of testing. The impact capacity of panels were tested at 28-day.
Figure 3.18: Impact test arrangement
The drop hammer impact test was done based on modification of the recommendations
by ACI Committee 544 in which an impact specimen is subjected to repeated blows on
the same spot. In this modified impact test, a 10 kg drop hammer was released from a
height of 300 mm on the panel specimen (Figure 3.18). The number of blows to cause the
first visible crack and failure was observed and used to calculate the first crack and failure
impact energy of the concrete, respectively. The impact energy is given in the following
equation:
E impact = mgh × N (4)
where, E impact = impact energy in Joule (J); m = mass of drop hammer = 10 kg; g = 9.81
m/s2; h = releasing height of drop hammer = 300 mm; N = number of blows.

56
The ratio of the number of blows to cause failure, Nf to the number of blows to cause the
first crack, Nc is defined as impact ductile index, µi = Nf / Nc (Mo et al., 2014b). Crack
widths of all the geopolymer panel were measured using a high magnification crack
microscope, immediately after the first crack development and during the propagation of
cracks to the panel. Figure 3.19 shows the crack width measurement system using
magnification microscope.
(b) (c)
Figure 3.19: Crack width measurement (a) microscope, (b) laptop, and (c) impact test
specimen
3.10 Data collection and analysis
From the impact test, a number of data have been collected and analysed for the suitability
of new developed concrete on the impact resistance, such as first crack impact energy,
ultimate (final) impact energy, failure mode of geopolymer concrete specimens, crack
development resistance. Impact resistance of concrete specimens using crushed and
uncrushed OPS and the effects of the variation of OPS contents with and without steel
fibre have been compared and reported in Section 4.10 .
(a)

57
3.11 Carbon footprint
A carbon footprint is historically defined as “the total sets of greenhouse gas emissions
caused by an organization, event, product or person”. A details calculation of carbon
footprint is presented in Appendix C.
58
CHAPTER 4 : RESULTS AND DISCUSSION
4.1 Introduction
The results obtained for all the five objectives are listed and discussed in this chapter; the
results include the material characteristics, compressive strength of mortar, mechanical
properties of geopolymer concrete, the effect of fibre etc. The effects of materials
properties in the development of concrete strength are discussed. The impact behaviour
of lightweight concrete incorporating steel fibre and three different proportions of OPS
aggregates are also discussed and compared with control mix. In addition, the effect of
crushed and uncrushed OPS on the mechanical properties and impact behaviour are
discussed and reported.
4.2 Density of the source materials of geopolymer mortar mix
4.2.1 Effect of specific gravity and fineness on the density
Table 4.1 shows the 3-day oven-dry density (ODD) of the specimens. The ODD depends
on the specific gravity and fineness of the materials. The mix with 100% GGBS that has
higher specific gravity and fineness produced the highest density of 2163 kg/m3 (mix M1).
On the contrary, the mix M2 with 100% POFA produced the lowest density of 2014
kg/m3. Another factor that influences the density is the ability of finer particle to fill the
voids within the mortar. Figure 3.2 (Chapter 3) shows that POFA has relatively coarser
particles within a narrow range compared to that of GGBS and FA. Thus, GGBS with
finer particles enhanced its density of about 7.5% compared to mortar with POFA. It was
observed that the density of mortar varies between 2014 kg/m3 and 2163 kg/m3. As
indicated earlier, in the previous works (Sata et al., 2004; Tangchirapat et al., 2009;
Tangchirapat et al., 2012) investigations on the effects of ash particle size on properties
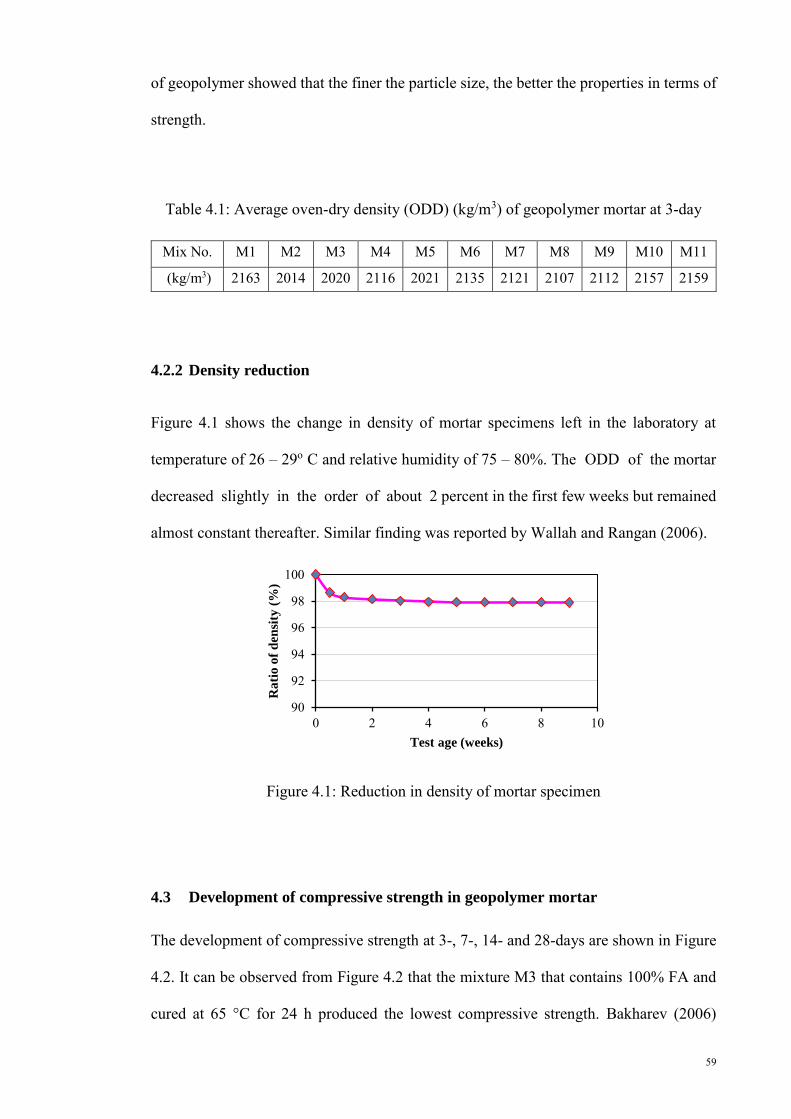
59
of geopolymer showed that the finer the particle size, the better the properties in terms of
strength.
Table 4.1: Average oven-dry density (ODD) (kg/m3) of geopolymer mortar at 3-day
Mix No. M1 M2 M3 M4 M5 M6 M7 M8 M9 M10 M11
(kg/m3) 2163 2014 2020 2116 2021 2135 2121 2107 2112 2157 2159
4.2.2 Density reduction
Figure 4.1 shows the change in density of mortar specimens left in the laboratory at
temperature of 26 – 29o C and relative humidity of 75 – 80%. The ODD of the mortar
decreased slightly in the order of about 2 percent in the first few weeks but remained
almost constant thereafter. Similar finding was reported by Wallah and Rangan (2006).
Figure 4.1: Reduction in density of mortar specimen
4.3 Development of compressive strength in geopolymer mortar
The development of compressive strength at 3-, 7-, 14- and 28-days are shown in Figure
4.2. It can be observed from Figure 4.2 that the mixture M3 that contains 100% FA and
cured at 65 °C for 24 h produced the lowest compressive strength. Bakharev (2006)
90
92
94
96
98
100
0 2 4 6 8 10
Ra
tio
of
den
sity
(%
)
Test age (weeks)
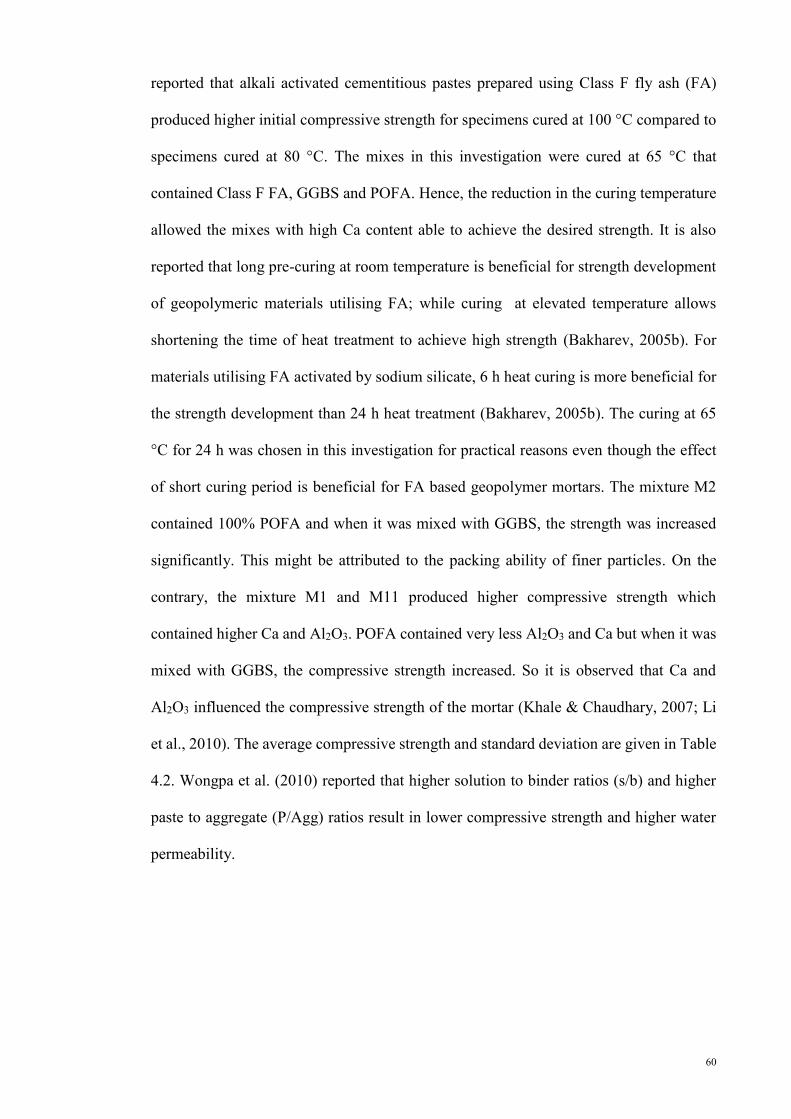
60
reported that alkali activated cementitious pastes prepared using Class F fly ash (FA)
produced higher initial compressive strength for specimens cured at 100 °C compared to
specimens cured at 80 °C. The mixes in this investigation were cured at 65 °C that
contained Class F FA, GGBS and POFA. Hence, the reduction in the curing temperature
allowed the mixes with high Ca content able to achieve the desired strength. It is also
reported that long pre-curing at room temperature is beneficial for strength development
of geopolymeric materials utilising FA; while curing at elevated temperature allows
shortening the time of heat treatment to achieve high strength (Bakharev, 2005b). For
materials utilising FA activated by sodium silicate, 6 h heat curing is more beneficial for
the strength development than 24 h heat treatment (Bakharev, 2005b). The curing at 65
°C for 24 h was chosen in this investigation for practical reasons even though the effect
of short curing period is beneficial for FA based geopolymer mortars. The mixture M2
contained 100% POFA and when it was mixed with GGBS, the strength was increased
significantly. This might be attributed to the packing ability of finer particles. On the
contrary, the mixture M1 and M11 produced higher compressive strength which
contained higher Ca and Al2O3. POFA contained very less Al2O3 and Ca but when it was
mixed with GGBS, the compressive strength increased. So it is observed that Ca and
Al2O3 influenced the compressive strength of the mortar (Khale & Chaudhary, 2007; Li
et al., 2010). The average compressive strength and standard deviation are given in Table
4.2. Wongpa et al. (2010) reported that higher solution to binder ratios (s/b) and higher
paste to aggregate (P/Agg) ratios result in lower compressive strength and higher water
permeability.
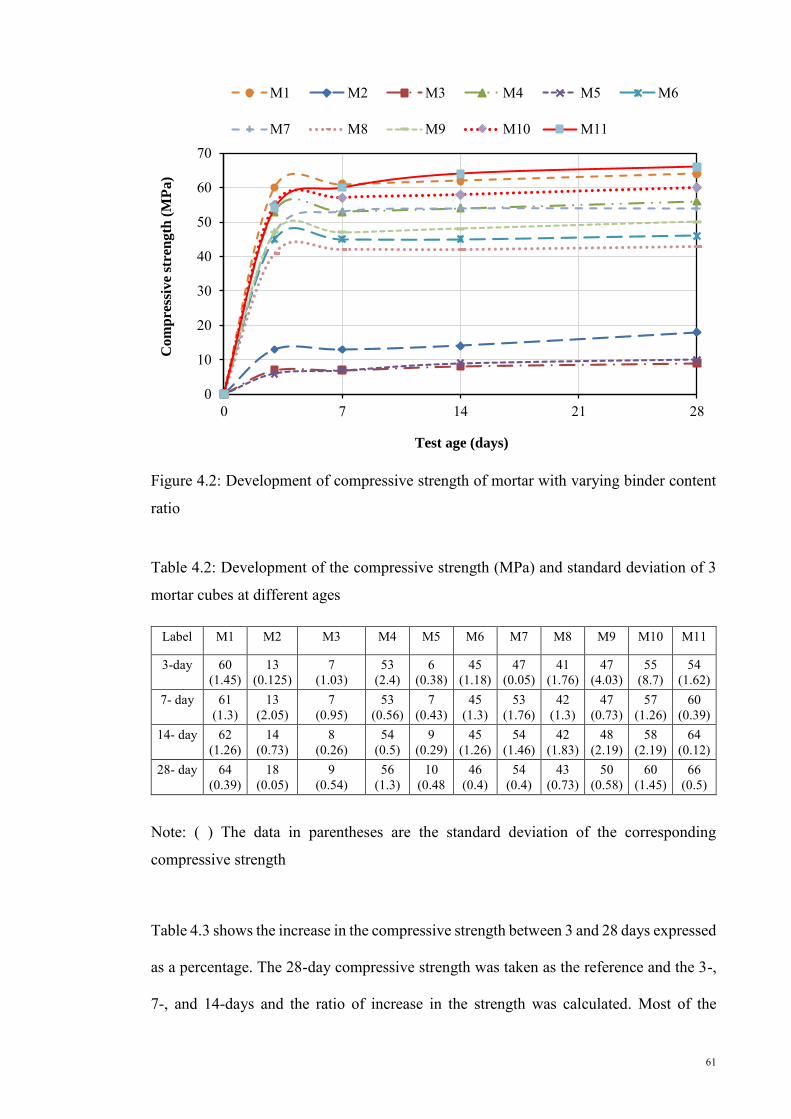
61
Figure 4.2: Development of compressive strength of mortar with varying binder content
ratio
Table 4.2: Development of the compressive strength (MPa) and standard deviation of 3
mortar cubes at different ages
Label M1 M2 M3 M4 M5 M6 M7 M8 M9 M10 M11
3-day 60 (1.45)
13 (0.125)
7 (1.03)
53 (2.4)
6 (0.38)
45 (1.18)
47 (0.05)
41 (1.76)
47 (4.03)
55 (8.7)
54 (1.62)
7- day 61 (1.3)
13 (2.05)
7 (0.95)
53 (0.56)
7 (0.43)
45 (1.3)
53 (1.76)
42 (1.3)
47 (0.73)
57 (1.26)
60 (0.39)
14- day 62 (1.26)
14 (0.73)
8 (0.26)
54 (0.5)
9 (0.29)
45 (1.26)
54 (1.46)
42 (1.83)
48 (2.19)
58 (2.19)
64 (0.12)
28- day 64 (0.39)
18 (0.05)
9 (0.54)
56 (1.3)
10 (0.48
46 (0.4)
54 (0.4)
43 (0.73)
50 (0.58)
60 (1.45)
66 (0.5)
Note: ( ) The data in parentheses are the standard deviation of the corresponding
compressive strength
Table 4.3 shows the increase in the compressive strength between 3 and 28 days expressed
as a percentage. The 28-day compressive strength was taken as the reference and the 3-,
7-, and 14-days and the ratio of increase in the strength was calculated. Most of the
0
10
20
30
40
50
60
70
0 7 14 21 28
Co
mp
ress
ive
stre
ng
th (
MP
a)
Test age (days)
M1 M2 M3 M4 M5 M6
M7 M8 M9 M10 M11

62
specimen achieved 86% of the 28-day strength at 3-day. Similarly the 7-day and 14-day
strength were 90% and 94%, respectively of the 28-day strength.
Table 4.3: The comparison of increase in the compressive strength (%) with respect to
that of 28 days
Test age (day) M1 M2 M3 M4 M5 M6 M7 M8 M9 M10 M11
3 94 72 78 95 60 98 87 95 94 92 82
7 95 72 78 95 70 98 98 98 94 95 91
14 97 78 89 96 90 98 100 98 96 97 97
4.4 Effect of GGBS on the compressive strength of the mortar
The ground blast furnace slag employed is a latent hydraulic product, which can be
activated by suitable activators. Without an activation, the development of the strength of
the GGBS is extremely slow and the development of the slag necessitates a pH ≥12
(Davidovits, 2011). GGBS plays an important role in the development of the compressive
strength. Higher concentrations of GGBS (slag) result in higher compressive strength of
geopolymer concrete (Naidu et al., 2012). Figure 4.3 shows that the compressive strength
of mortar with 70% of GGBS (mix no. M11) produced the highest strength while further
increase in the GGBS content (mix no. M1) reduces the compressive strength. The
mixture M1 contains 100% GGBS while the mix M11 contains 70% GGBS and 30%
POFA. A comparison between the mixes M1 and M11 shows that the former with 100%
GGBS produces 3% lower compressive strength compared to the mix with 70% GGBS
and 30% POFA. The mixes M10, M4 and M8 show that the reduction of GGBS contents
of 10%, 20% and 30%, respectively and the remainder is replaced by POFA. Thus, the
effect of GGBS replacement with POFA shows that the mixes M10, M4 and M8 with
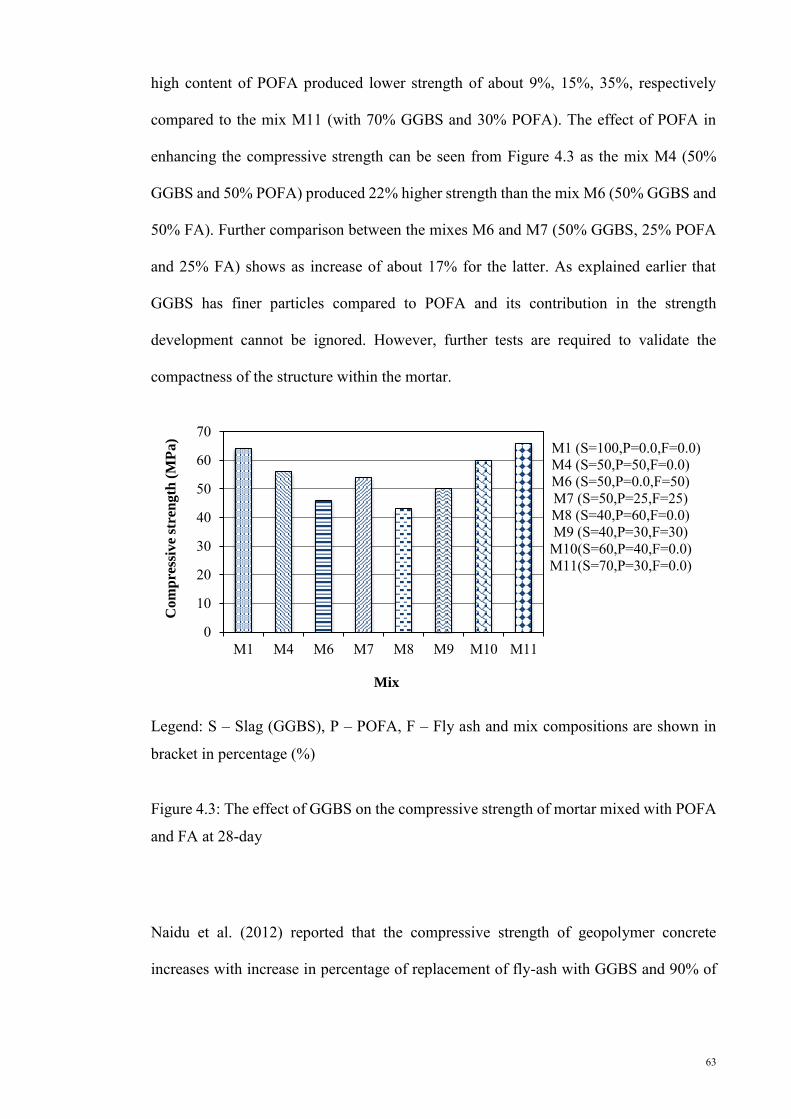
63
high content of POFA produced lower strength of about 9%, 15%, 35%, respectively
compared to the mix M11 (with 70% GGBS and 30% POFA). The effect of POFA in
enhancing the compressive strength can be seen from Figure 4.3 as the mix M4 (50%
GGBS and 50% POFA) produced 22% higher strength than the mix M6 (50% GGBS and
50% FA). Further comparison between the mixes M6 and M7 (50% GGBS, 25% POFA
and 25% FA) shows as increase of about 17% for the latter. As explained earlier that
GGBS has finer particles compared to POFA and its contribution in the strength
development cannot be ignored. However, further tests are required to validate the
compactness of the structure within the mortar.
Legend: S – Slag (GGBS), P – POFA, F – Fly ash and mix compositions are shown in
bracket in percentage (%)
Figure 4.3: The effect of GGBS on the compressive strength of mortar mixed with POFA
and FA at 28-day
Naidu et al. (2012) reported that the compressive strength of geopolymer concrete
increases with increase in percentage of replacement of fly-ash with GGBS and 90% of
0
10
20
30
40
50
60
70
M1 M4 M6 M7 M8 M9 M10 M11
Com
pre
ssiv
e st
ren
gth
(M
Pa)
Mix
M1 (S=100,P=0.0,F=0.0)M4 (S=50,P=50,F=0.0)M6 (S=50,P=0.0,F=50)M7 (S=50,P=25,F=25)M8 (S=40,P=60,F=0.0)M9 (S=40,P=30,F=30)M10(S=60,P=40,F=0.0)M11(S=70,P=30,F=0.0)
64
the compressive strength was achieved in 14 days and from this investigation most of the
mortar specimens achieved it in 7 days.
Shafigh et al. (2013b) used lightweight concrete with high volume of GGBS and reported
that 30% of cement replacement by GGBS increased the workability of OPS concrete.
However, they reported further increase in GGBS content decreased the workability.
They also reported that by introducing initial heating at 60 oC for 20 h after demoulding,
it is possible to improve the compressive strength of GGBS OPS concrete at early ages.
4.5 Effect of POFA on the compressive strength of the mortar
Figure 4.4 shows the effect of POFA content on the compressive strength at 28-day. The
compressive strength of the mixes M2 and M3 that contain 100% POFA and 100% FA,
respectively shows that the latter produced about 50% lower compressive strength than
the mix M2. As seen from the Figure 4.4, increase beyond 30% in POFA content
decreases the strength. Safiuddin et al. (2011) reported that a POFA content higher than
40% may adversely affect the properties and durability of concrete which was reflected
in the geopolymer mortar as well. The mix M11 with 30% of POFA and 70% of GGBS
produced the highest strength of 66 MPa. The coarser particles of the POFA with cohesive
characteristic could not be mixed properly and hence the strength development was poor.
The ground POFA with high fineness (d50 = 10.1 µm) is a reactive pozzolanic material
and can be used to produce high-strength concrete. The suggested level of POFA content
as cement replacement in normal concrete was 20% to produce high-strength concrete
(Sata et al., 2004; Kroehong et al., 2011).

65
Legend: S – Slag (GGBS), P – POFA, F – Fly ash and mix compositions are shown in
bracket in percentage (%)
Figure 4.4: The effect of POFA on the compressive strength of mortar mixed with GGBS
and FA at 28-day
4.6 Analysis of chemical composition
The rate of polymerization is influenced by parameters such as curing temperature, water
content, alkali concentration, initial solids content, silicate and aluminate ratio, pH and
the type of activators used. Khale and Chaudhary (2007) reported in their review that
certain synthesis limits existed in the formation of strong geopolymer products (Table
4.4) but the ratio changes while working with the waste.
Table 4.4: Oxide-mole ratios of the reactant mixture (Khale & Chaudhary, 2007;
Davidovits, 2011)
Composition M2O/SiO2 SiO2/Al2O3 H2O/M2O M2O/Al2O3
Range 0.2 to 0.48 3.3 to 4.5 10 to 25 0.8 to 1.6
where, M2O represents either Na2O, or K2O, or the mixture (Na2O,K2O).
0
10
20
30
40
50
60
70
M2 M3 M4 M5 M7 M8 M9 M10 M11
Co
mp
ress
ive
stre
ng
th (
MP
a)
Mix
M2 (P=100,S=0.0,F=0.0)M3 (P=0.0,S=0.0,F=100)M4 (P=50,S=50,F=0.0)M5 (P=50,S=0.0,F=50)M7 (P=25,S=50,F=25)M8 (P=60,S=40,F=0.0)M9 (P=30,S=40,F=30)M10 (P=40,S=60,F=0.0)M11 (P=30,S=70,F=0.0)

66
Table 4.5 and Figure 4.5 represent the major oxide composition of the three materials i.e.,
GGBS, POFA and FA. The mixes M1 and M11 achieved higher strength and the mix M3
achieved the lowest strength compared to other mixes. However, the mix M11 produced
slightly higher strength than the mix M1. It can be seen in Table 4.5 and Figure 4.5, the
mix M1 contains more lime (CaO) than the mix M11. Nevertheless, the SiO2 content in
the mix M11 is slightly higher than the M1 and the ratio of SiO2/Al2O3 of M11 is 3.7
(Table 4.6) which compiled those tabulated in Table 4.4. On the contrary, this ratio
(SiO2/Al2O3) for M1 is 2.37 and for M3 is 2.01. The lowest compressive strength of mix
M3 that contains 100% FA might be attributed to the lowest SiO2/Al2O3 ratio of 2.01 as
seen from Table 4.6. Lime (CaO) plays a very important role. It controls strength and
soundness but any excess in the lime content makes the material unsound and causes
expansion and disintegration. Excessive quantity of lime (CaO) is the essence of the
hardening mechanism of mortar (Davidovits, 2011). It has been reported that the
formation of Ca compounds in geopolymers is greatly dependent on the pH and Si/Al
ratio (Yip et al., 2005). The SiO2 content provides greater strength but at the same time it
prolongs its setting time though mix M2 contains the maximum percentages (%) of SiO2
among all the mixes but the silicate and aluminate ratio is very high (11.4). Also M2
contains higher percentages of K2O and MgO which are harmful ingredients in cement.
If the amount of Na2O and K2O exceeds 1%, it leads to the failure of concrete and if the
content of MgO exceeds 5%, it causes cracks in the hardened concrete.

67
Table 4.5: Major chemical composition of mortar and 28-day compressive strength
Mix No. CaO SiO2 Al2O3 MgO Fe2O3 Na2O K2O 28-d Comp. Strength (MPa)
M1 45.83 32.52 13.71 3.27 0.76 0.25 0.48 64
M2 4.34 63.41 5.55 3.74 4.19 0.16 6.33 18
M3 5.31 54.72 27.28 1.10 5.15 0.43 1.00 9
M4 25.09 47.97 9.63 3.51 2.48 0.21 3.41 56
M5 4.83 59.07 16.42 2.42 4.67 0.30 3.67 10
M6 25.57 43.62 20.50 2.19 2.96 0.34 0.74 46
M7 25.33 45.79 15.06 2.85 2.72 0.27 2.07 54
M8 20.94 51.05 8.81 3.55 2.82 0.20 3.99 43
M9 21.23 48.447 15.333 2.76 3.11 0.28 2.39 50
M10 29.23 44.88 10.45 3.46 2.13 0.21 2.82 60
M11 33.38 41.79 11.26 3.41 1.79 0.22 2.24 66
Figure 4.5: The comparison between major chemical composition and compressive
strength of mortar
0
10
20
30
40
50
60
70
0
10
20
30
40
50
60
70
M1 M2 M3 M4 M5 M6 M7 M8 M9 M10 M11
Co
mp
ress
ive
stre
ngth
(M
Pa)
Ch
emic
al
com
posi
tion
(w
t %
)
Mixture no.
CaO SiO2 Al2O3
MgO Fe2O3 Na2O
K2O 28-d Comp. Strength
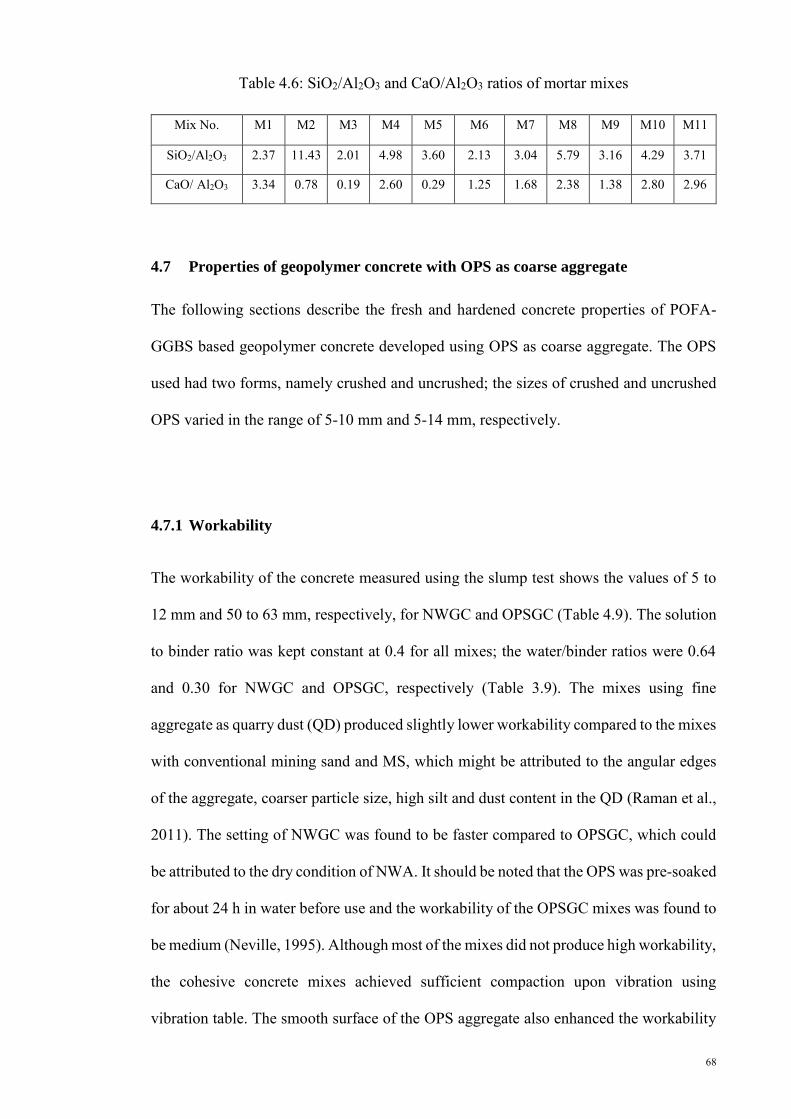
68
Table 4.6: SiO2/Al2O3 and CaO/Al2O3 ratios of mortar mixes
Mix No. M1 M2 M3 M4 M5 M6 M7 M8 M9 M10 M11
SiO2/Al2O3 2.37 11.43 2.01 4.98 3.60 2.13 3.04 5.79 3.16 4.29 3.71
CaO/ Al2O3 3.34 0.78 0.19 2.60 0.29 1.25 1.68 2.38 1.38 2.80 2.96
4.7 Properties of geopolymer concrete with OPS as coarse aggregate
The following sections describe the fresh and hardened concrete properties of POFA-
GGBS based geopolymer concrete developed using OPS as coarse aggregate. The OPS
used had two forms, namely crushed and uncrushed; the sizes of crushed and uncrushed
OPS varied in the range of 5-10 mm and 5-14 mm, respectively.
4.7.1 Workability
The workability of the concrete measured using the slump test shows the values of 5 to
12 mm and 50 to 63 mm, respectively, for NWGC and OPSGC (Table 4.9). The solution
to binder ratio was kept constant at 0.4 for all mixes; the water/binder ratios were 0.64
and 0.30 for NWGC and OPSGC, respectively (Table 3.9). The mixes using fine
aggregate as quarry dust (QD) produced slightly lower workability compared to the mixes
with conventional mining sand and MS, which might be attributed to the angular edges
of the aggregate, coarser particle size, high silt and dust content in the QD (Raman et al.,
2011). The setting of NWGC was found to be faster compared to OPSGC, which could
be attributed to the dry condition of NWA. It should be noted that the OPS was pre-soaked
for about 24 h in water before use and the workability of the OPSGC mixes was found to
be medium (Neville, 1995). Although most of the mixes did not produce high workability,
the cohesive concrete mixes achieved sufficient compaction upon vibration using
vibration table. The smooth surface of the OPS aggregate also enhanced the workability
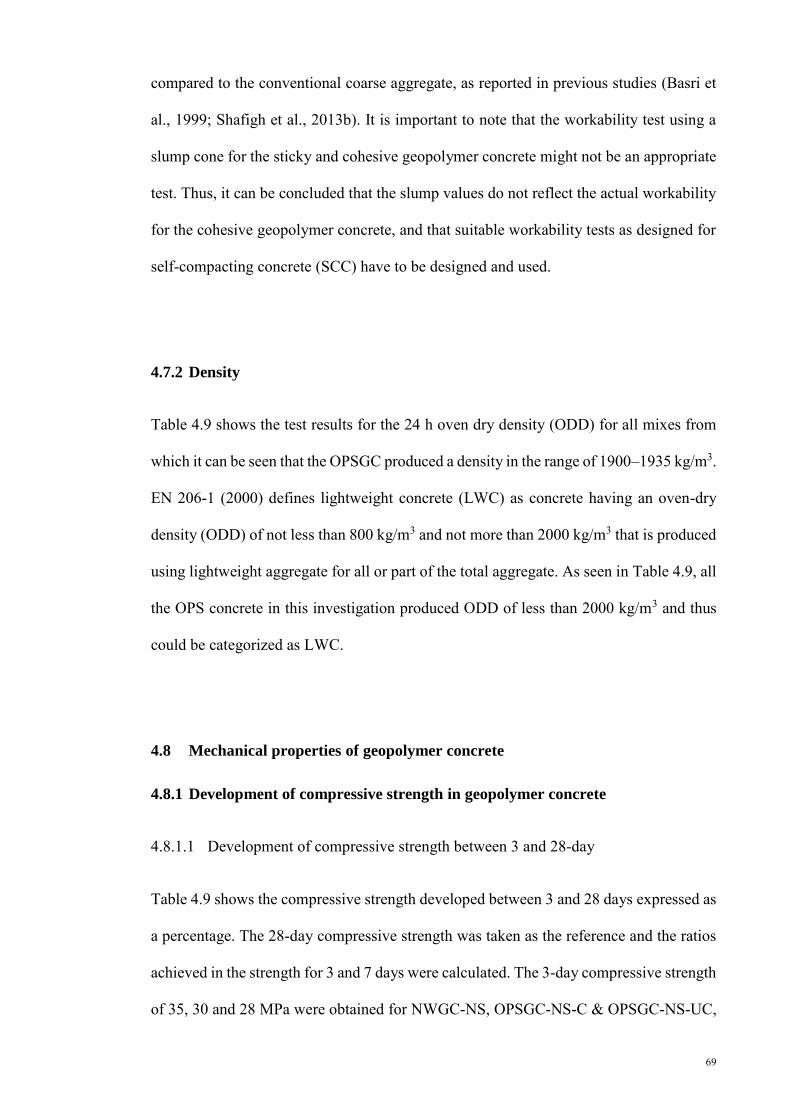
69
compared to the conventional coarse aggregate, as reported in previous studies (Basri et
al., 1999; Shafigh et al., 2013b). It is important to note that the workability test using a
slump cone for the sticky and cohesive geopolymer concrete might not be an appropriate
test. Thus, it can be concluded that the slump values do not reflect the actual workability
for the cohesive geopolymer concrete, and that suitable workability tests as designed for
self-compacting concrete (SCC) have to be designed and used.
4.7.2 Density
Table 4.9 shows the test results for the 24 h oven dry density (ODD) for all mixes from
which it can be seen that the OPSGC produced a density in the range of 1900–1935 kg/m3.
EN 206-1 (2000) defines lightweight concrete (LWC) as concrete having an oven-dry
density (ODD) of not less than 800 kg/m3 and not more than 2000 kg/m3 that is produced
using lightweight aggregate for all or part of the total aggregate. As seen in Table 4.9, all
the OPS concrete in this investigation produced ODD of less than 2000 kg/m3 and thus
could be categorized as LWC.
4.8 Mechanical properties of geopolymer concrete
4.8.1 Development of compressive strength in geopolymer concrete
4.8.1.1 Development of compressive strength between 3 and 28-day
Table 4.9 shows the compressive strength developed between 3 and 28 days expressed as
a percentage. The 28-day compressive strength was taken as the reference and the ratios
achieved in the strength for 3 and 7 days were calculated. The 3-day compressive strength
of 35, 30 and 28 MPa were obtained for NWGC-NS, OPSGC-NS-C & OPSGC-NS-UC,
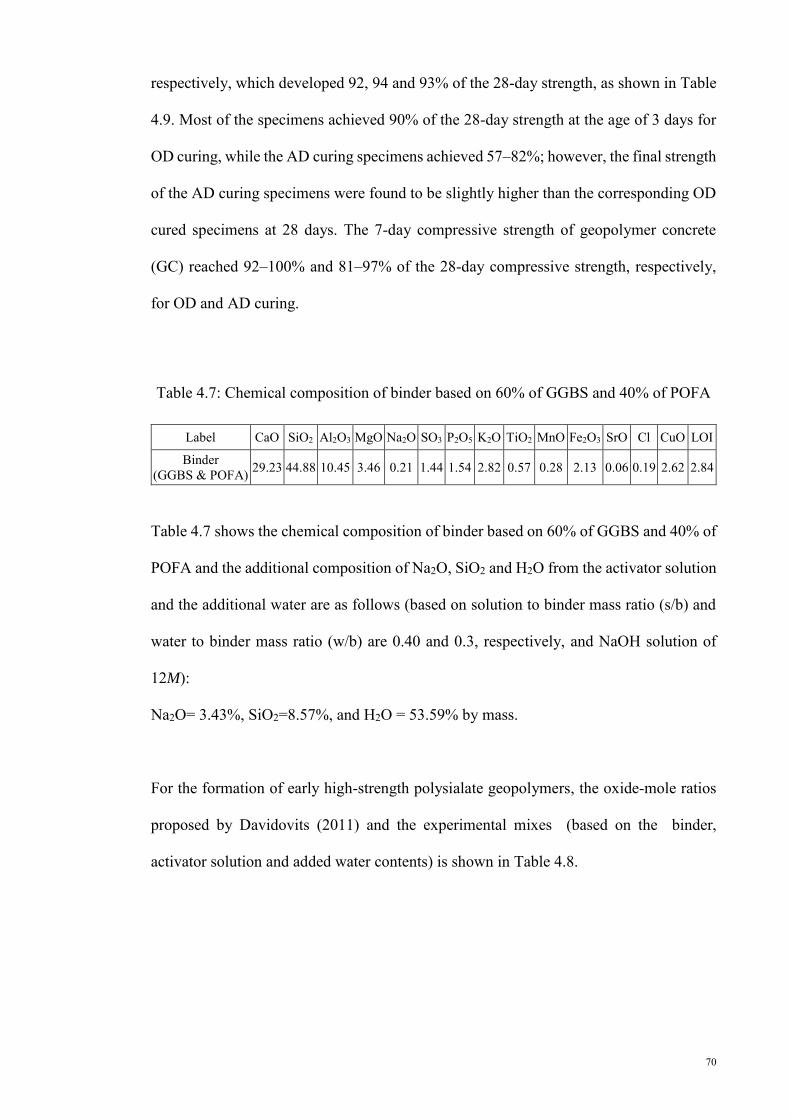
70
respectively, which developed 92, 94 and 93% of the 28-day strength, as shown in Table
4.9. Most of the specimens achieved 90% of the 28-day strength at the age of 3 days for
OD curing, while the AD curing specimens achieved 57–82%; however, the final strength
of the AD curing specimens were found to be slightly higher than the corresponding OD
cured specimens at 28 days. The 7-day compressive strength of geopolymer concrete
(GC) reached 92–100% and 81–97% of the 28-day compressive strength, respectively,
for OD and AD curing.
Table 4.7: Chemical composition of binder based on 60% of GGBS and 40% of POFA
Label CaO SiO2 Al2O3 MgO Na2O SO3 P2O5 K2O TiO2 MnO Fe2O3 SrO Cl CuO LOI
Binder (GGBS & POFA) 29.23 44.88 10.45 3.46 0.21 1.44 1.54 2.82 0.57 0.28 2.13 0.06 0.19 2.62 2.84
Table 4.7 shows the chemical composition of binder based on 60% of GGBS and 40% of
POFA and the additional composition of Na2O, SiO2 and H2O from the activator solution
and the additional water are as follows (based on solution to binder mass ratio (s/b) and
water to binder mass ratio (w/b) are 0.40 and 0.3, respectively, and NaOH solution of
12M):
Na2O= 3.43%, SiO2=8.57%, and H2O = 53.59% by mass.
For the formation of early high-strength polysialate geopolymers, the oxide-mole ratios
proposed by Davidovits (2011) and the experimental mixes (based on the binder,
activator solution and added water contents) is shown in Table 4.8.
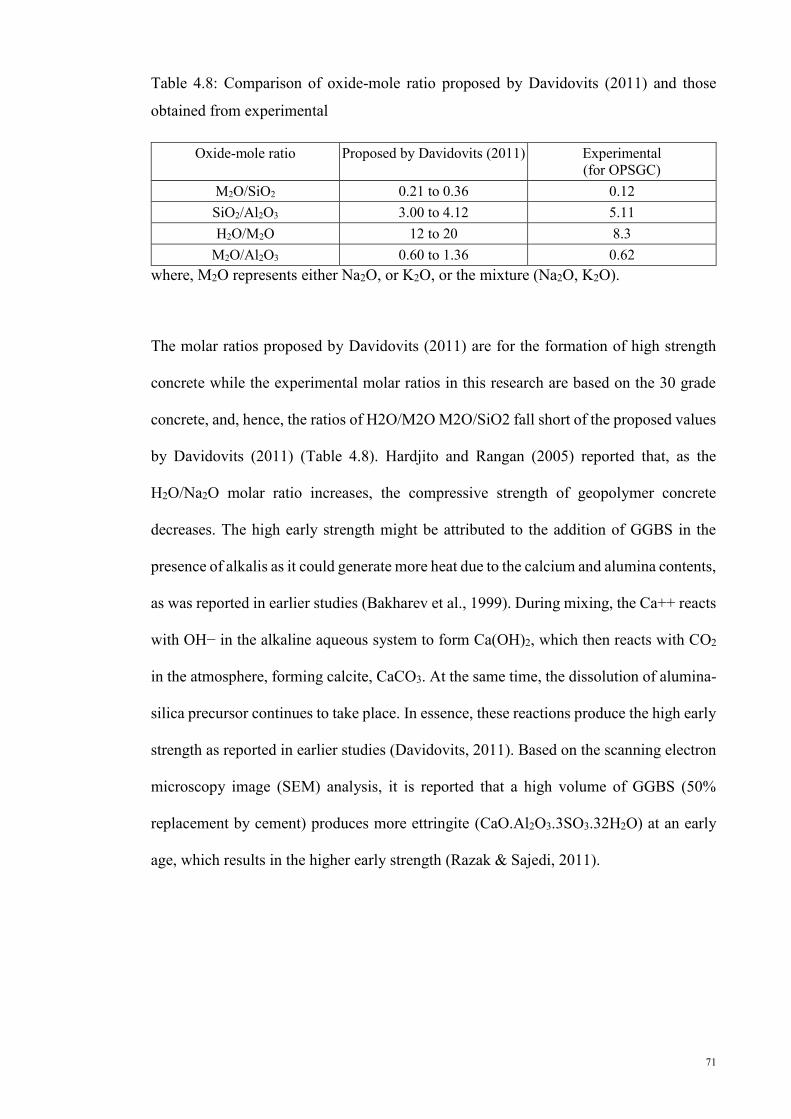
71
Table 4.8: Comparison of oxide-mole ratio proposed by Davidovits (2011) and those
obtained from experimental
Oxide-mole ratio Proposed by Davidovits (2011) Experimental (for OPSGC)
M2O/SiO2 0.21 to 0.36 0.12 SiO2/Al2O3 3.00 to 4.12 5.11 H2O/M2O 12 to 20 8.3
M2O/Al2O3 0.60 to 1.36 0.62 where, M2O represents either Na2O, or K2O, or the mixture (Na2O, K2O).
The molar ratios proposed by Davidovits (2011) are for the formation of high strength
concrete while the experimental molar ratios in this research are based on the 30 grade
concrete, and, hence, the ratios of H2O/M2O M2O/SiO2 fall short of the proposed values
by Davidovits (2011) (Table 4.8). Hardjito and Rangan (2005) reported that, as the
H2O/Na2O molar ratio increases, the compressive strength of geopolymer concrete
decreases. The high early strength might be attributed to the addition of GGBS in the
presence of alkalis as it could generate more heat due to the calcium and alumina contents,
as was reported in earlier studies (Bakharev et al., 1999). During mixing, the Ca++ reacts
with OH− in the alkaline aqueous system to form Ca(OH)2, which then reacts with CO2
in the atmosphere, forming calcite, CaCO3. At the same time, the dissolution of alumina-
silica precursor continues to take place. In essence, these reactions produce the high early
strength as reported in earlier studies (Davidovits, 2011). Based on the scanning electron
microscopy image (SEM) analysis, it is reported that a high volume of GGBS (50%
replacement by cement) produces more ettringite (CaO.Al2O3.3SO3.32H2O) at an early
age, which results in the higher early strength (Razak & Sajedi, 2011).
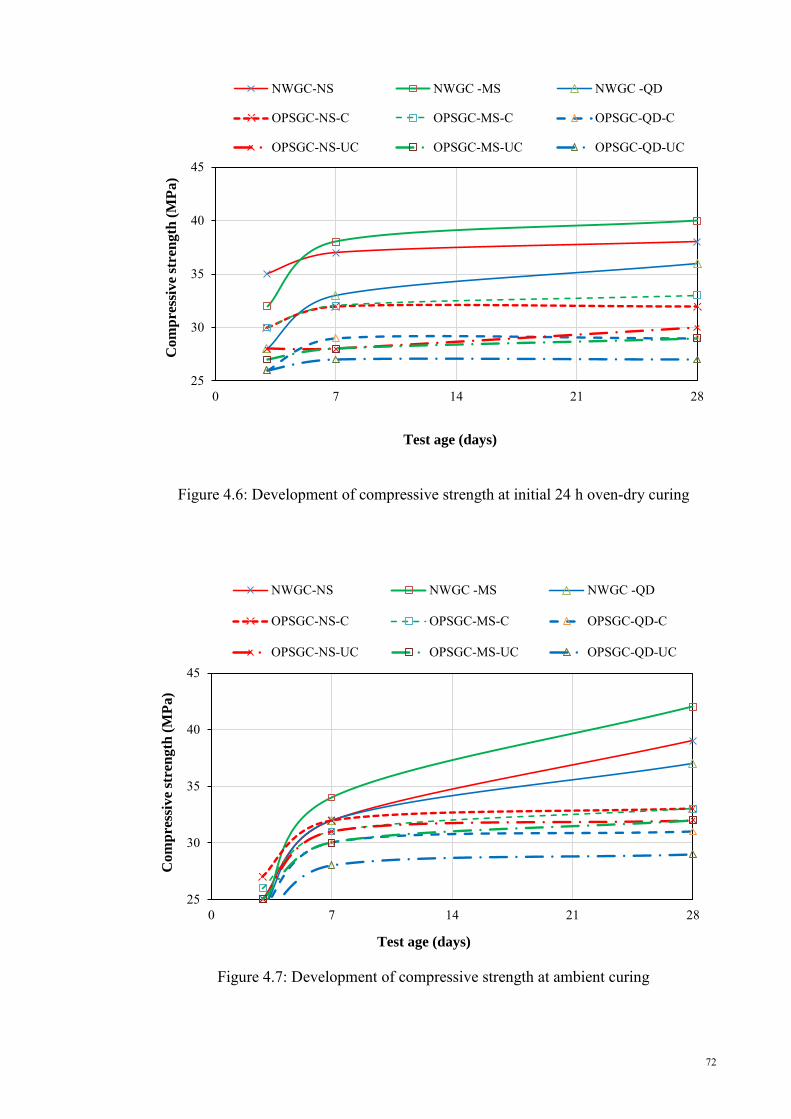
72
Figure 4.6: Development of compressive strength at initial 24 h oven-dry curing
Figure 4.7: Development of compressive strength at ambient curing
25
30
35
40
45
0 7 14 21 28
Com
pre
ssiv
e st
ren
gth
(M
Pa)
Test age (days)
NWGC-NS NWGC -MS NWGC -QD
OPSGC-NS-C OPSGC-MS-C OPSGC-QD-C
OPSGC-NS-UC OPSGC-MS-UC OPSGC-QD-UC
25
30
35
40
45
0 7 14 21 28
Co
mp
ress
ive
stre
ngth
(M
Pa)
Test age (days)
NWGC-NS NWGC -MS NWGC -QD
OPSGC-NS-C OPSGC-MS-C OPSGC-QD-C
OPSGC-NS-UC OPSGC-MS-UC OPSGC-QD-UC
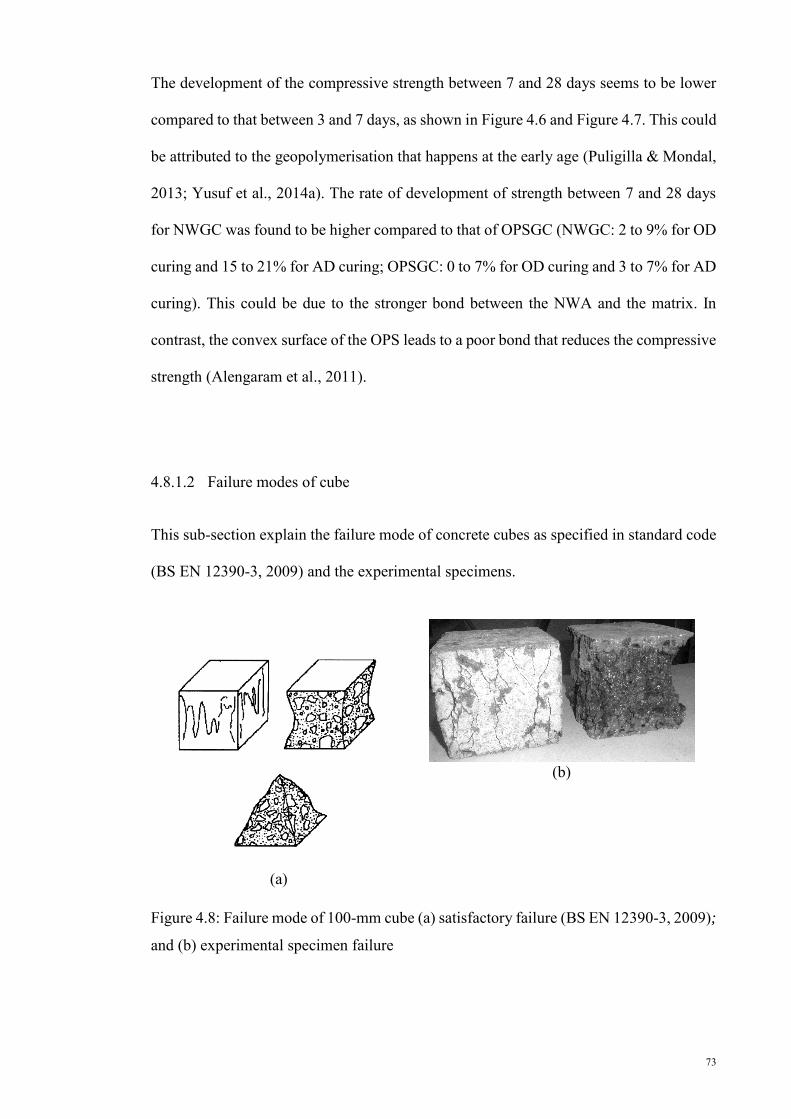
73
The development of the compressive strength between 7 and 28 days seems to be lower
compared to that between 3 and 7 days, as shown in Figure 4.6 and Figure 4.7. This could
be attributed to the geopolymerisation that happens at the early age (Puligilla & Mondal,
2013; Yusuf et al., 2014a). The rate of development of strength between 7 and 28 days
for NWGC was found to be higher compared to that of OPSGC (NWGC: 2 to 9% for OD
curing and 15 to 21% for AD curing; OPSGC: 0 to 7% for OD curing and 3 to 7% for AD
curing). This could be due to the stronger bond between the NWA and the matrix. In
contrast, the convex surface of the OPS leads to a poor bond that reduces the compressive
strength (Alengaram et al., 2011).
4.8.1.2 Failure modes of cube
This sub-section explain the failure mode of concrete cubes as specified in standard code
(BS EN 12390-3, 2009) and the experimental specimens.
(a)
(b)
Figure 4.8: Failure mode of 100-mm cube (a) satisfactory failure (BS EN 12390-3, 2009);
and (b) experimental specimen failure
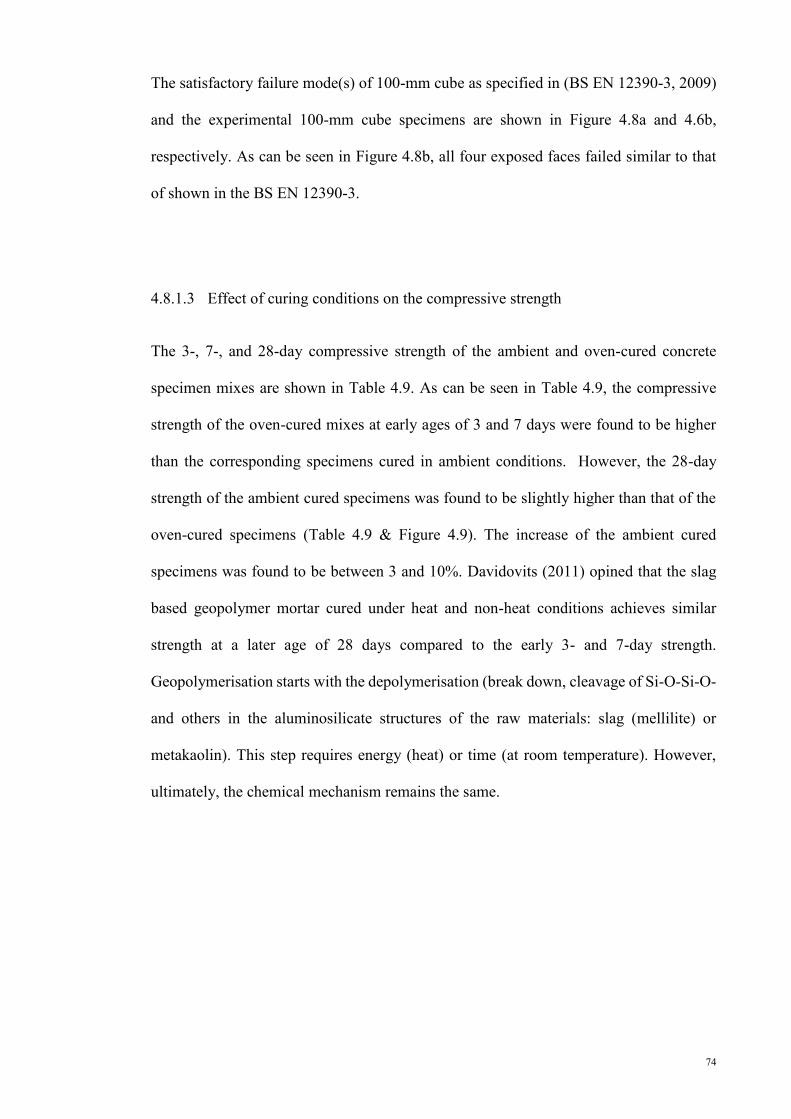
74
The satisfactory failure mode(s) of 100-mm cube as specified in (BS EN 12390-3, 2009)
and the experimental 100-mm cube specimens are shown in Figure 4.8a and 4.6b,
respectively. As can be seen in Figure 4.8b, all four exposed faces failed similar to that
of shown in the BS EN 12390-3.
4.8.1.3 Effect of curing conditions on the compressive strength
The 3-, 7-, and 28-day compressive strength of the ambient and oven-cured concrete
specimen mixes are shown in Table 4.9. As can be seen in Table 4.9, the compressive
strength of the oven-cured mixes at early ages of 3 and 7 days were found to be higher
than the corresponding specimens cured in ambient conditions. However, the 28-day
strength of the ambient cured specimens was found to be slightly higher than that of the
oven-cured specimens (Table 4.9 & Figure 4.9). The increase of the ambient cured
specimens was found to be between 3 and 10%. Davidovits (2011) opined that the slag
based geopolymer mortar cured under heat and non-heat conditions achieves similar
strength at a later age of 28 days compared to the early 3- and 7-day strength.
Geopolymerisation starts with the depolymerisation (break down, cleavage of Si-O-Si-O-
and others in the aluminosilicate structures of the raw materials: slag (mellilite) or
metakaolin). This step requires energy (heat) or time (at room temperature). However,
ultimately, the chemical mechanism remains the same.
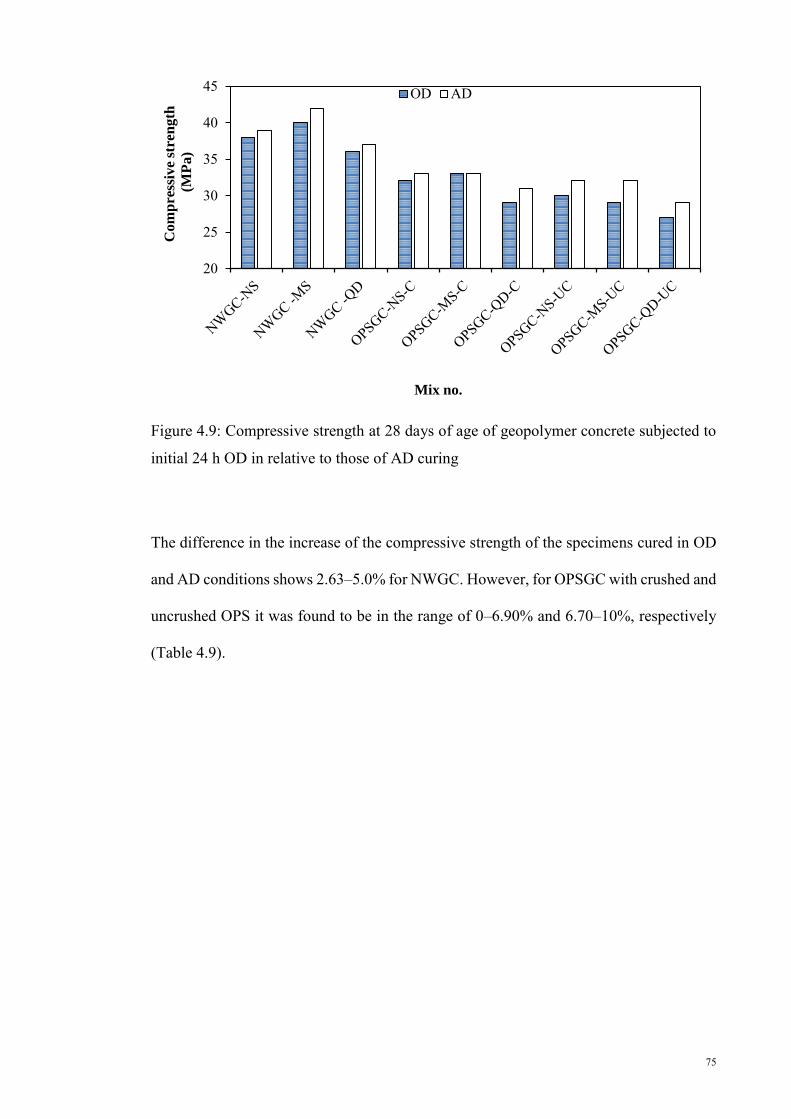
75
Figure 4.9: Compressive strength at 28 days of age of geopolymer concrete subjected to
initial 24 h OD in relative to those of AD curing
The difference in the increase of the compressive strength of the specimens cured in OD
and AD conditions shows 2.63–5.0% for NWGC. However, for OPSGC with crushed and
uncrushed OPS it was found to be in the range of 0–6.90% and 6.70–10%, respectively
(Table 4.9).
20
25
30
35
40
45
Co
mp
ress
ive
stre
ng
th
(MP
a)
Mix no.
OD AD
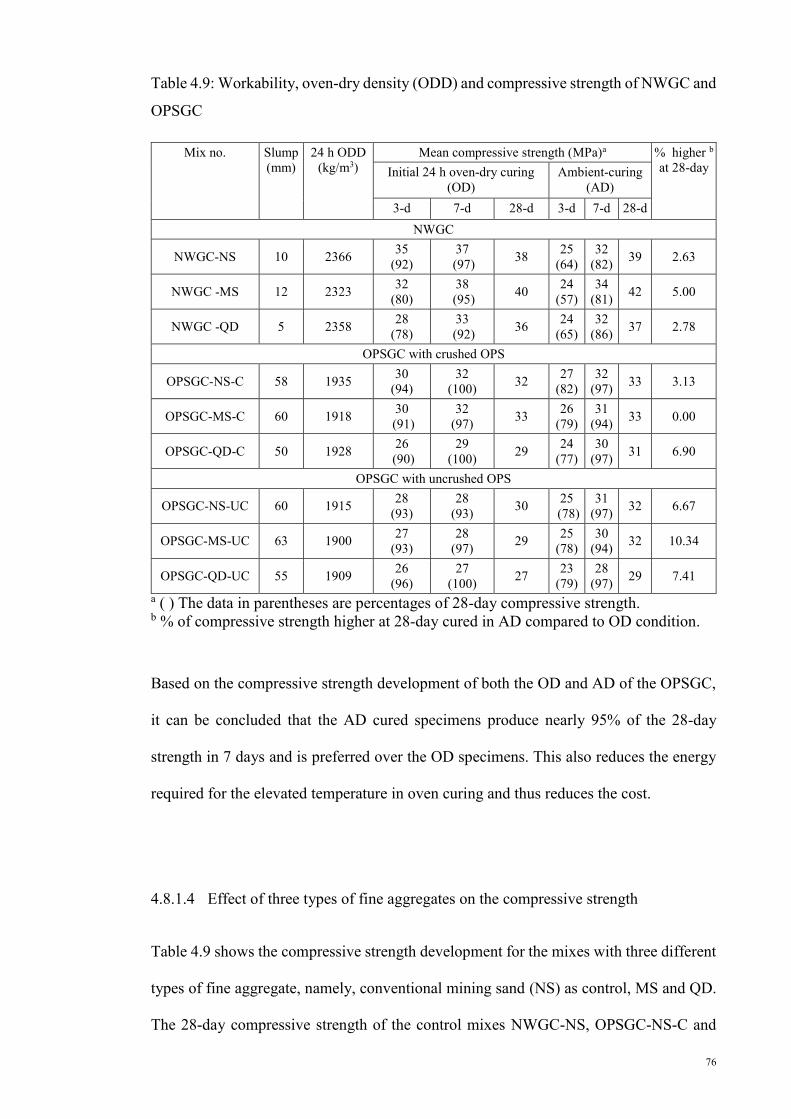
76
Table 4.9: Workability, oven-dry density (ODD) and compressive strength of NWGC and
OPSGC
Mix no. Slump (mm)
24 h ODD (kg/m3)
Mean compressive strength (MPa)a % higher b
at 28-day
Initial 24 h oven-dry curing (OD)
Ambient-curing (AD)
3-d 7-d 28-d 3-d 7-d 28-d NWGC
NWGC-NS 10 2366 35 (92)
37 (97) 38 25
(64) 32
(82) 39 2.63
NWGC -MS 12 2323 32 (80)
38 (95) 40 24
(57) 34
(81) 42 5.00
NWGC -QD 5 2358 28 (78)
33 (92) 36 24
(65) 32
(86) 37 2.78
OPSGC with crushed OPS
OPSGC-NS-C 58 1935 30 (94)
32 (100) 32 27
(82) 32
(97) 33 3.13
OPSGC-MS-C 60 1918 30 (91)
32 (97) 33 26
(79) 31
(94) 33 0.00
OPSGC-QD-C 50 1928 26 (90)
29 (100) 29 24
(77) 30
(97) 31 6.90
OPSGC with uncrushed OPS
OPSGC-NS-UC 60 1915 28 (93)
28 (93) 30 25
(78) 31
(97) 32 6.67
OPSGC-MS-UC 63 1900 27 (93)
28 (97) 29 25
(78) 30
(94) 32 10.34
OPSGC-QD-UC 55 1909 26 (96)
27 (100) 27 23
(79) 28
(97) 29 7.41 a ( ) The data in parentheses are percentages of 28-day compressive strength. b % of compressive strength higher at 28-day cured in AD compared to OD condition.
Based on the compressive strength development of both the OD and AD of the OPSGC,
it can be concluded that the AD cured specimens produce nearly 95% of the 28-day
strength in 7 days and is preferred over the OD specimens. This also reduces the energy
required for the elevated temperature in oven curing and thus reduces the cost.
4.8.1.4 Effect of three types of fine aggregates on the compressive strength
Table 4.9 shows the compressive strength development for the mixes with three different
types of fine aggregate, namely, conventional mining sand (NS) as control, MS and QD.
The 28-day compressive strength of the control mixes NWGC-NS, OPSGC-NS-C and
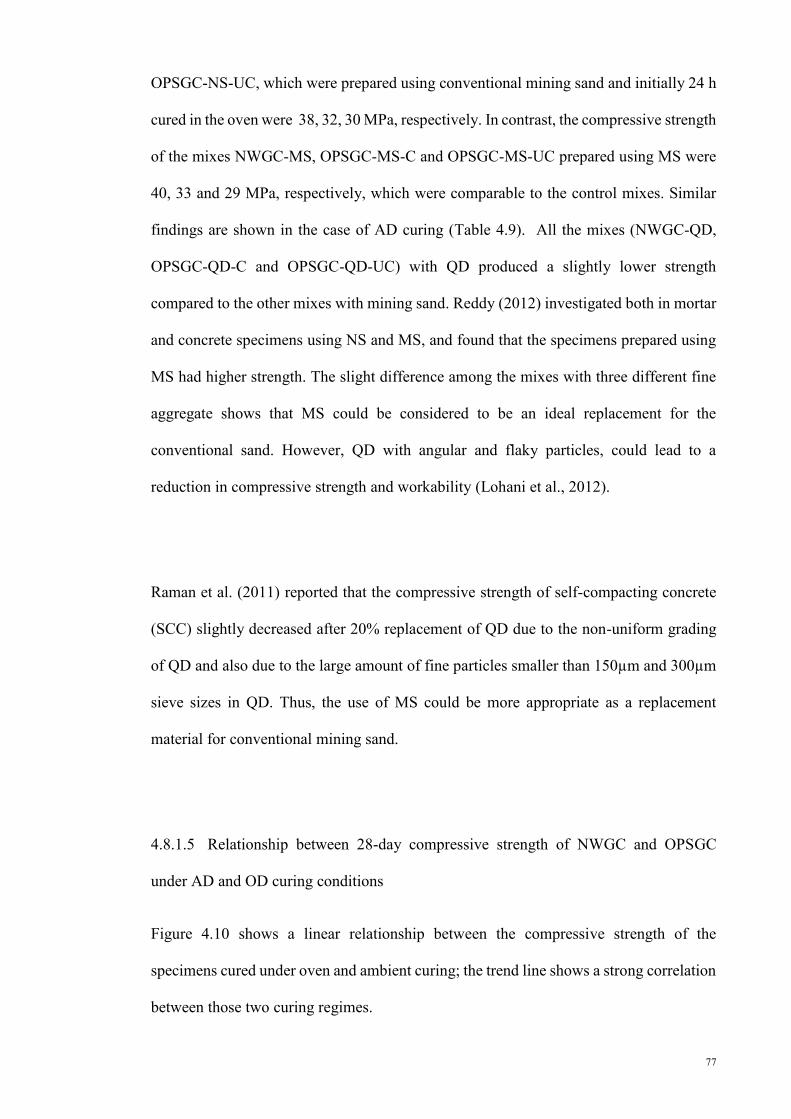
77
OPSGC-NS-UC, which were prepared using conventional mining sand and initially 24 h
cured in the oven were 38, 32, 30 MPa, respectively. In contrast, the compressive strength
of the mixes NWGC-MS, OPSGC-MS-C and OPSGC-MS-UC prepared using MS were
40, 33 and 29 MPa, respectively, which were comparable to the control mixes. Similar
findings are shown in the case of AD curing (Table 4.9). All the mixes (NWGC-QD,
OPSGC-QD-C and OPSGC-QD-UC) with QD produced a slightly lower strength
compared to the other mixes with mining sand. Reddy (2012) investigated both in mortar
and concrete specimens using NS and MS, and found that the specimens prepared using
MS had higher strength. The slight difference among the mixes with three different fine
aggregate shows that MS could be considered to be an ideal replacement for the
conventional sand. However, QD with angular and flaky particles, could lead to a
reduction in compressive strength and workability (Lohani et al., 2012).
Raman et al. (2011) reported that the compressive strength of self-compacting concrete
(SCC) slightly decreased after 20% replacement of QD due to the non-uniform grading
of QD and also due to the large amount of fine particles smaller than 150µm and 300µm
sieve sizes in QD. Thus, the use of MS could be more appropriate as a replacement
material for conventional mining sand.
4.8.1.5 Relationship between 28-day compressive strength of NWGC and OPSGC
under AD and OD curing conditions
Figure 4.10 shows a linear relationship between the compressive strength of the
specimens cured under oven and ambient curing; the trend line shows a strong correlation
between those two curing regimes.
78
Figure 4.10: Relationship between 28-day compressive strength of NWGC and OPSGC
under AD and OD curing conditions
Based on the experimental results the following equations could be obtained to relate the
compressive strength of the specimens cured under two different regimes:
NWGC,
y (OD) = 0.9656 x (AD) R² = 0.94 (5)
OPSGC,
y (OD) = 0.9557 x (AD) R² = 0.95 (6)
Atiş and Bilim (2007) proposed the following equations for normal Portland cement
(NPC) concrete and GGBS concrete.
NPC concrete:
y (dry) = 0.94 x (wet) R² = 0.87 (7)
GGBS concrete (up to 80% replacement of cement):
OPSGCy (OD) = 0.96 x(AD)
R² = 0.95
NWGCy (OD) = 0.97 x (AD)
R² = 0.94
25
28
31
34
37
40
43
25 28 31 34 37 40 43
28
-da
y c
om
pre
ssiv
e st
ren
gth
of
init
ial
24
h O
D
curi
ng
(M
Pa
)
28-day compressive strength under AD curing (MPa)
79
y (dry) = 0.85 x (wet) R² = 0.89 (8)
Shafigh et al. (2013a) reported the following relationship between OPS concrete
containing GGBS up to 50% replacement of cement under two different curing conditions
(air-dry and wet curing):
y (dry) = 0.80 x (wet) R² = 0.94 (9)
A similar type of equation proposed by Shafigh et al. (2013a) shows a good correlation
could be established between the compressive strength of specimens cured under two
different environments. The following equation proposed to predict the compressive
strength for OPS concrete containing fly ash up to 50% replacement of cement:
f’c (dry) = 0.81 f’c (wet) R² = 0.93 (10)
Based on the above equations for two different lightweight concretes of OPSGC and
OPSC, the relationship between the oven and air cured specimens of OPSGC shows a
stronger relationship compared to the air and wet curing. This could be attributed to the
geopolymerization of the specimens cured in oven and ambient conditions. For OPSC,
the compressive strength depends on the hydration of cement and subsequent formation
of C-S-H gel, while for the OPSGC, the strength development is dependent on the
formation of calcium-silicate-hydrate (C-S-H) and aluminosilicate-hydrate (A-S-H) that
enhanced the compressive-strength (Pangdaeng et al., 2014; Yusuf et al., 2014a). In the
presence of alkaline activator and calcium from GGBS, the additional SiO2 and Al2O3
could react and form C-S-H or C-A-S-H and N-A-S-H gels and led to a higher strength
geopolymer (Phoo-ngernkham et al., 2014).
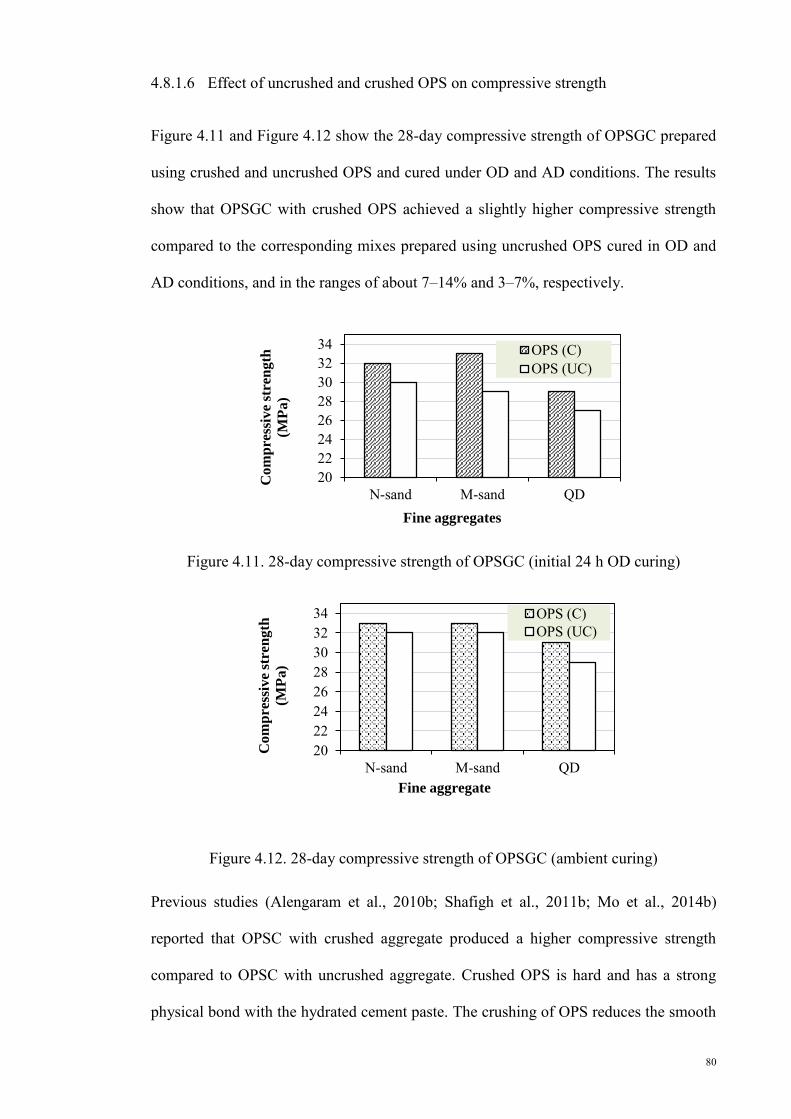
80
4.8.1.6 Effect of uncrushed and crushed OPS on compressive strength
Figure 4.11 and Figure 4.12 show the 28-day compressive strength of OPSGC prepared
using crushed and uncrushed OPS and cured under OD and AD conditions. The results
show that OPSGC with crushed OPS achieved a slightly higher compressive strength
compared to the corresponding mixes prepared using uncrushed OPS cured in OD and
AD conditions, and in the ranges of about 7–14% and 3–7%, respectively.
Figure 4.11. 28-day compressive strength of OPSGC (initial 24 h OD curing)
Figure 4.12. 28-day compressive strength of OPSGC (ambient curing)
Previous studies (Alengaram et al., 2010b; Shafigh et al., 2011b; Mo et al., 2014b)
reported that OPSC with crushed aggregate produced a higher compressive strength
compared to OPSC with uncrushed aggregate. Crushed OPS is hard and has a strong
physical bond with the hydrated cement paste. The crushing of OPS reduces the smooth
2022242628303234
N-sand M-sand QD
Com
pre
ssiv
e st
ren
gth
(MP
a)
Fine aggregates
OPS (C)OPS (UC)
2022242628303234
N-sand M-sand QD
Com
pre
ssiv
e st
ren
gth
(MP
a)
Fine aggregate
OPS (C)OPS (UC)
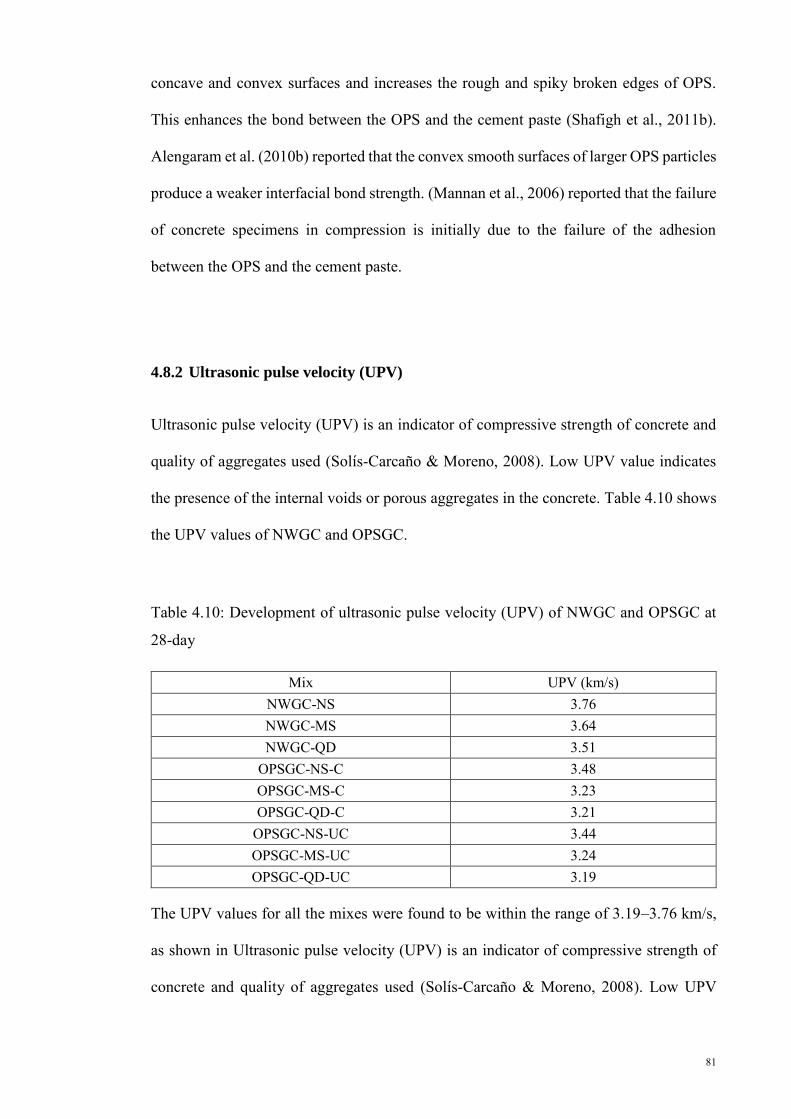
81
concave and convex surfaces and increases the rough and spiky broken edges of OPS.
This enhances the bond between the OPS and the cement paste (Shafigh et al., 2011b).
Alengaram et al. (2010b) reported that the convex smooth surfaces of larger OPS particles
produce a weaker interfacial bond strength. (Mannan et al., 2006) reported that the failure
of concrete specimens in compression is initially due to the failure of the adhesion
between the OPS and the cement paste.
4.8.2 Ultrasonic pulse velocity (UPV)
Ultrasonic pulse velocity (UPV) is an indicator of compressive strength of concrete and
quality of aggregates used (Solís-Carcaño & Moreno, 2008). Low UPV value indicates
the presence of the internal voids or porous aggregates in the concrete. Table 4.10 shows
the UPV values of NWGC and OPSGC.
Table 4.10: Development of ultrasonic pulse velocity (UPV) of NWGC and OPSGC at
28-day
Mix UPV (km/s) NWGC-NS 3.76 NWGC-MS 3.64 NWGC-QD 3.51
OPSGC-NS-C 3.48 OPSGC-MS-C 3.23 OPSGC-QD-C 3.21
OPSGC-NS-UC 3.44 OPSGC-MS-UC 3.24 OPSGC-QD-UC 3.19
The UPV values for all the mixes were found to be within the range of 3.19–3.76 km/s,
as shown in Ultrasonic pulse velocity (UPV) is an indicator of compressive strength of
concrete and quality of aggregates used (Solís-Carcaño & Moreno, 2008). Low UPV
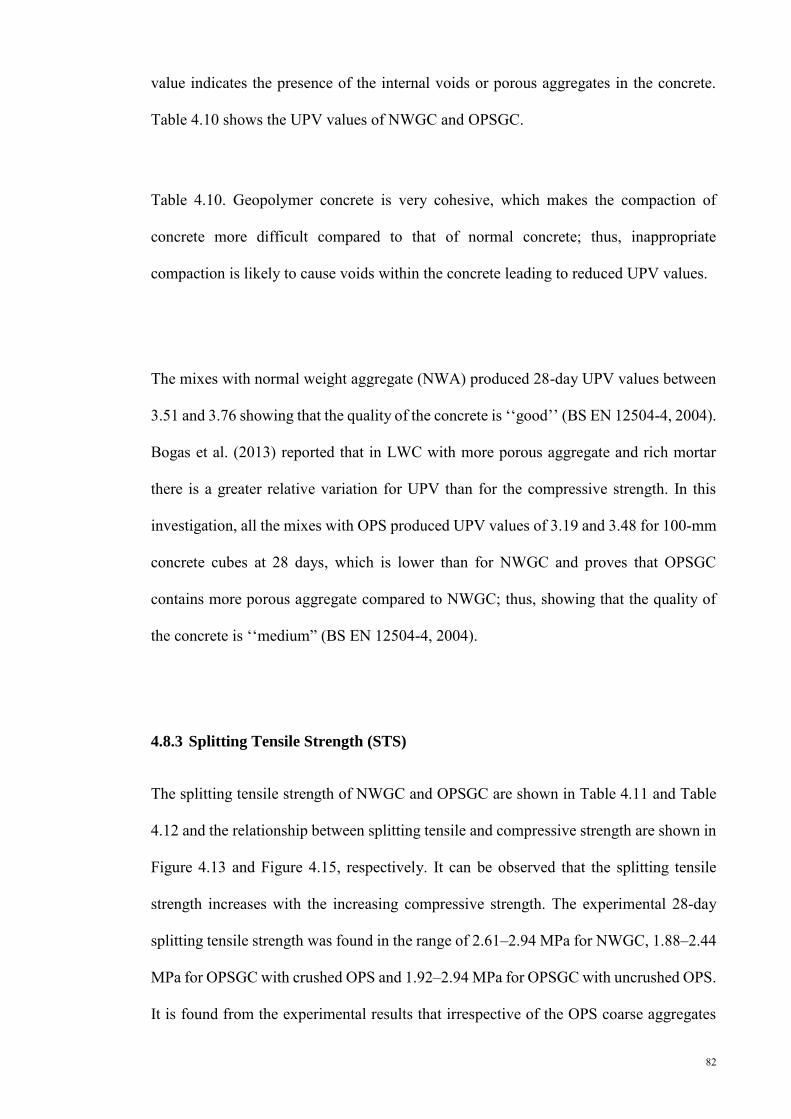
82
value indicates the presence of the internal voids or porous aggregates in the concrete.
Table 4.10 shows the UPV values of NWGC and OPSGC.
Table 4.10. Geopolymer concrete is very cohesive, which makes the compaction of
concrete more difficult compared to that of normal concrete; thus, inappropriate
compaction is likely to cause voids within the concrete leading to reduced UPV values.
The mixes with normal weight aggregate (NWA) produced 28-day UPV values between
3.51 and 3.76 showing that the quality of the concrete is ‘‘good’’ (BS EN 12504-4, 2004).
Bogas et al. (2013) reported that in LWC with more porous aggregate and rich mortar
there is a greater relative variation for UPV than for the compressive strength. In this
investigation, all the mixes with OPS produced UPV values of 3.19 and 3.48 for 100-mm
concrete cubes at 28 days, which is lower than for NWGC and proves that OPSGC
contains more porous aggregate compared to NWGC; thus, showing that the quality of
the concrete is ‘‘medium” (BS EN 12504-4, 2004).
4.8.3 Splitting Tensile Strength (STS)
The splitting tensile strength of NWGC and OPSGC are shown in Table 4.11 and Table
4.12 and the relationship between splitting tensile and compressive strength are shown in
Figure 4.13 and Figure 4.15, respectively. It can be observed that the splitting tensile
strength increases with the increasing compressive strength. The experimental 28-day
splitting tensile strength was found in the range of 2.61–2.94 MPa for NWGC, 1.88–2.44
MPa for OPSGC with crushed OPS and 1.92–2.94 MPa for OPSGC with uncrushed OPS.
It is found from the experimental results that irrespective of the OPS coarse aggregates

83
(crushed or uncrushed), the mixes containing conventional mining sand (NS) produced
higher tensile strength compared to the splitting tensile strength of the mixes prepared
with MS and QD.
The mixes NWGC-QD, OPSGC-QD-C and OPSGC-QD-UC produced lower tensile
strength of about 11%, 23% and 30 % compared to NWGC-NS, OPSGC-NS-C and
OPSGC-NS-UC, respectively. This might be due to the angular and flaky particles of QD
that could influence the bond between the aggregate and matrix in the interfacial transition
zone (ITZ), which has a significant role in the tensile strength of concrete.
The empirical formulae proposed in Eq. (11) shows the relationship between the
compressive strength (f’c) and splitting tensile strength (ft) (Zain et al., 2002).
ft = k (f’c)n (11)
where, ft is the splitting tensile strength (MPa); f’c is the compressive strength (MPa); k,
n: constants. The constants k and n are obtained through a regression analysis of the
experimental data. In general, the value of n ranges between 0.5 and 0.75.
4.8.3.1 Splitting tensile strength for NWGC
Based on the basic equation, ACI 363R-92 (1992) and CEB-FIP (1993), the models as
expressed in Eqs. (12) and (13) to predict the cylinder splitting tensile strength (ft) from

84
the compressive strength of cylinder for normal weight concrete. Ryu et al. (2013)
suggested a formula to predict cylinder splitting tensile strength from the cylinder
compressive strength for fly ash-based geopolymer concrete as shown in Eq. (14).
ACI 363R-92: 𝑓𝑡 = 0.590 √𝑓′𝑐 (for 21 MPa < f’c < 83 MPa) (12)
CEB-FIP (1993): 𝑓𝑡 = 0.301 (𝑓′𝑐)2
3 (13)
Ryu et al. (2013): 𝑓𝑡 = 0.170 (𝑓′𝑐)3
4 (14)
Table 4.11: Splitting tensile strength of NWGC
Mix no. Compressive strength, fc (MPa)
Splitting tensile strength, ft (MPa)
(𝑓 𝑡 𝑓′ 𝑐
×1
00
)%
Expe
rimen
tal
Pred
icte
d by
Eq.
(12)
𝑓 𝑡
=0
.59
√𝑓
′ 𝑐
Pred
icte
d by
Eq.
(13)
𝑓 𝑡=
0.3
01
(𝑓
′ 𝑐)2 3
Pred
icte
d by
Eq.
(1
4)
𝑓 𝑡=
0.1
7 (
𝑓′ 𝑐
)3 4
Using conversion factor 0.77*
NWGC-NS 38 2.94 3.19 2.89 2.14 7.74 NWGC –MS 40 2.87 3.27 2.99 2.22 7.18 NWGC –QD 36 2.61 3.11 2.79 2.05 7.25
*Conversion factor is to convert cube compressive strength to cylinder compressive strength. Lower value of conversion for 100 mm cube compressive strength to 150 mm diameter cylinder was taken based on previous data from published researchers (Wong, 2013).

85
Figure 4.13. Relationship between splitting tensile and compressive strength of NWGC
at 28-day
The comparison of the experimental results and the formulae proposed by ACI 363R-92
(ACI 363R-92, 1992), CEB-FIP (CEB-FIP, 1993) and the other researchers (Ryu et al.,
2013) is shown in Table 4.11 and Figure 4.13. It is found that the splitting tensile strength
obtained from the experimental results for POFA-GGBS-based geopolymer concrete is
lower than that the values calculated using the proposed formula by ACI 363R-92.
However, it was found closer values obtained from the equations proposed by CEB-FIP.
Ryu et al. (2013) proposed an equation to predict the splitting tensile strength for fly ash
based geopolymer normal weight aggregate concrete. The experimental results of GGBS-
POFA based geopolymer concrete produced higher splitting tensile strength than that of
the equation proposed by Ryu et al. (2013). The difference between the splitting tensile
strength of specimens prepared using MS and NS is negligible compared to the specimen
with QD. As mentioned earlier in Section 4.8.1.4, the QD particles have angular and flaky
1.5
2.0
2.5
3.0
3.5
35 36 37 38 39 40
Sp
litt
ing
ten
sile
str
eng
th (
MP
a),
f t
Compressive strength (MPa), f’c
Experimental ACI 363R-92CEB-FIP (1993) Ryu et al. (2013)

86
particles that could result in more air voids entrapped surrounding QD and hence the
interfacial zone is weaker compared to specimens with MS and NS.
4.8.3.2 Splitting tensile strength of lightweight OPSGC
The ratio of 28-day splitting tensile strength to compressive strength expressed as
percentage of the crushed OPSGC was found in the range of 6–8%; while the uncrushed
OPSGC produced slightly higher values of 7–9%. The lower range in crushed OPSGC
might be due to the large quantity of OPS used in these mixes. The smaller size of crushed
OPS, which leads to larger number of crushed OPS particles compared to that of
uncrushed OPS for a given weight of OPS. Generally, the splitting tensile strength of
normal weight concrete (NWC) is 8–14% of the compressive strength (Kosmatka et al.,
2002). In comparison to NWC, the tensile/compressive strength ratio is lower for LWAC
of equivalent grade (Haque et al., 2004). It could be due to the weaker bond between the
OPS and the matrix than that of NWGC. Figure 4.14 shows the experiment of splitting
tensile strength and the failure of the specimen after the test. It can be seen that the
generally the bond failure between the OPS and the matrix occurred along with failure of
the OPS itself. However, the tensile/compressive strength ratio of OPSGC obtained in
this study is comparable with that of the OPS concrete (not geopolymer, but lightweight
OPS concrete prepared from OPC) containing fly ash of an equivalent grade, as reported
by Shafigh et al. (2013a).
The following equation was suggested to predict the splitting tensile strength from the
compressive strength of OPS normal concretes made from OPC (Shafigh et al., 2012).
𝑓𝑡 = 0.49 √𝑓′𝑐 (15)

87
where ft is the splitting tensile strength obtained from 100×200-mm cylinders and fc’ is
the 100-mm cube compressive strength at 28-day.
(a)
(b)
(c)
Figure 4.14: (a) Splitting tensile testing; (b) placement of cylinder specimen; (c) specimen
after testing
For OPS normal concrete containing fly ash, the following equation is proposed to predict
the splitting tensile strength based on the compressive strength (Shafigh et al., 2013a).
𝑓𝑡 = 0.23 𝑓′𝑐0.64 R2 = 0.91 (16)
Gesoğlu et al. (2004) suggested the following equation for structural lightweight
aggregate normal concrete made of an artificial lightweight aggregate, namely, cold-
bonded fly ash, to predict the splitting tensile strength from the compressive strength
(compressive strength in the range of 21–47 MPa):
OPS failure
Bond failure

88
𝑓𝑡 = 0.27 𝑓′𝑐0.67 (17)
Table 4.12: Splitting tensile strength of OPSGC
Mix Compressive strength, f’c
(MPa)
Splitting tensile strength, ft (MPa)
Exp
erim
enta
l:
(𝑓 𝑡 𝑓′ 𝑐
×1
00
)%
Expe
rimen
tal
Pred
icte
d by
Eq.
(15)
𝑓 𝑡
=0
.49
√𝑓
′ 𝑐
Pred
icte
d by
Eq.
(16)
𝑓 𝑡
=0
.23
𝑓′ 𝑐0
.64
Pred
icte
d by
Eq.
(17)
𝑓 𝑡
=0
.27
𝑓′ 𝑐0
.67
OPSGC-NS-C 32 2.44 2.77 2.11 2.75 7.63 OPSGC-MS-C 33 2.09 2.81 2.16 2.81 6.33 OPSGC-QD-C 29 1.88 2.64 1.98 2.58 6.48
OPSGC-NS-UC 30 2.74 2.68 2.03 2.64 9.13 OPSGC-MS-UC 29 2.37 2.64 1.98 2.58 8.17 OPSGC-QD-UC 27 1.92 2.55 1.90 2.46 7.11
Figure 4.15. Relationship between splitting tensile and compressive strength of OPSGC
at 28-day
Table 4.12 and Figure 4.15 show the comparison among the experimental results with the
formulae proposed by other researchers (Eq. (15), (16) and (17)) and results show that the
1.5
2.0
2.5
3.0
25 27 29 31 33 35
Sp
litt
ing t
ensi
le s
tren
gth
(M
Pa),
ft
Compressive strength (MPa), f’c
Experimental Eq. (15)Eq. (16) Eq. (17)
89
splitting tensile strength produced by the POFA-GGBS-based OPSGC based on the
compressive strength is lower than that provided by the formulae Eq. (15) and (17) and
comparable with the formulae Eq. (16). It should be noted that the specimens prepared in
this investigation has two variables namely, the crushed and uncrushed OPS and three
different types of sand (NS, MS and QD). The equations proposed by researchers are for
the lightweight concrete prepared with OPC, conventional sand, OPS and cold bonded
lightweight fly ash aggregate.
It is worth noting that according to ASTM:C330 , a minimum splitting tensile strength of
2.0 MPa is a requirement for structural grade lightweight aggregate concrete. It can be
seen that according to this criteria, all mixes except OPSGC-QD-C and OPSGC-QD-UC
fulfilled the criterion for minimum splitting tensile strength.
4.8.4 Flexural Strength
The flexural strength of NWGC and OPSGC and its comparison with compressive
strength is shown in Table 4.13. Generally for conventional concrete having a
compressive strength of more than 25 MPa, the ratio of flexural strength to compressive
strength expressed as percentage is in the range of 8–11% (Shetty, 2005). As can be seen
in Table 4.13, this ratio was found within this range for all the mixes.

90
Table 4.13: Comparison of compressive strength, splitting tensile strength, flexural
strength and elastic modulus
Mix no. Compressive strength, f’c
(MPa)
Splitting tensile
strength, ft
(MPa)
Flexural strength,
fr (MPa)
Elastic modulus,
E (GPa)
(𝑓𝑡
𝑓′𝑐
× 100) %
(𝑓𝑟
𝑓′𝑐
× 100) %
( 𝑓𝑟
𝑓𝑡
)
NWGC-NS 38 2.94 3.62 16.86 7.74 9.53 1.231 NWGC -MS 40 2.87 3.83 14.80 7.18 9.58 1.334 NWGC -QD 36 2.61 3.20 13.74 7.25 8.89 1.226
OPSGC-NS-C 32 2.44 3.00 11.12 7.63 9.38 1.229 OPSGC-MS-C 33 2.09 3.03 8.93 6.33 9.18 1.450 OPSGC-QD-C 29 1.88 2.79 8.51 6.48 9.62 1.485
OPSGC-NS-UC 30 2.74 3.10 10.08 9.13 10.33 1.131 OPSGC-MS-UC 29 2.37 3.19 8.05 8.17 11.00 1.346 OPSGC-QD-UC 27 1.92 2.94 7.36 7.11 10.89 1.532
In this investigation, the flexural/splitting tensile strength ratios for NWGC–NS, NWGC–
MS and NWGC–QD mixes were found as 1.23, 1.33 and 1.23, respectively; while for
OPSGC-NS-C, OPSGC-MS-C, OPSGC-QD-C, OPSGC-NS-UC, OPSGC-MS-UC and
OPSGC-QD-UC mixes the ratios were 1.23, 1.45, 1.48, 1.13, 1.35 and 1.53, respectively.
Alengaram et al. (2008b) reported that the ratio (𝑓𝑟
𝑓𝑡 ) for OPC based OPS concrete
between 1.4 and 1.7. In general, as reported by Zheng et al. (2001), the flexural strength
of concrete is 35% higher than the splitting tensile strength.

91
(a)
(b)
Figure 4.16: (a) Flexural strength testing and (b) specimen after testing
The mixes NWGC-NS, OPSGC-NS-C and OPSGC-NS-UC using conventional mining
sand show the flexural strength of 3.62, 3.00 and 3.10 MPa. On the contrary, the flexural
strength of the mixes using MS (NWGC-MS, OPSGC-MS-C, OPSGC-MS-UC) and QD
(NWGC-QD, OPSGC-QD-C, OPSGC-QD-UC) were 3.83, 3.03, 3.19 and 3.20, 2.79,
2.94, respectively. The result shows that the mixes NWGC-MS, OPSGC-MS-C and
OPSGC-MS-UC are 6, 1.0 and 3% higher than the corresponding mixes using
conventional mining sand. In contrast, the corresponding mixes using QD show 12, 7 and
5% lower flexural strength compared to the corresponding mixes using conventional
OPS failure
Bond failure
92
mining sand. Hence, it can be concluded that the use of MS could be considered as an
ideal replacement for conventional mining sand.
Figure 4.16 shows that bond failure occurred between the OPS and the mortar and it could
be due to the smooth surface of the OPS. And as explained in the Section 4.8.3.2, OPS
failure along the failure plane is visible and it is due to the weaker stiffness of OPS. The
weaker bond and OPS failure result in lower flexural strength value of OPSGC compared
to NWGC.
Previous researchers proposed following relationship to predict the flexural strength from
the compressive strength of OPS concrete.
Alengaram et al. (2008b) have reported OPS concrete with compressive strength ranging
from 15 to 37 MPa and the relationship with the flexural strength can be expressed as
follows:
𝑓𝑟 = 0.30√𝑓′𝑐23 (18)
Meanwhile, Lo et al. (2004) have reported expanded clay lightweight aggregate concrete
with cube compressive strength ranging from 29 to 43 MPa and the relationship with the
flexural strength can be expressed as follows:
𝑓𝑟 = 0.69 √𝑓′𝑐 (19)
Smadi and Migdady (1991) reported high strength lightweight concrete with compressive
strength of 60 MPa, which was prepared with Tuff lightweight aggregate and the
relationship with the flexural strength can be expressed as follows:
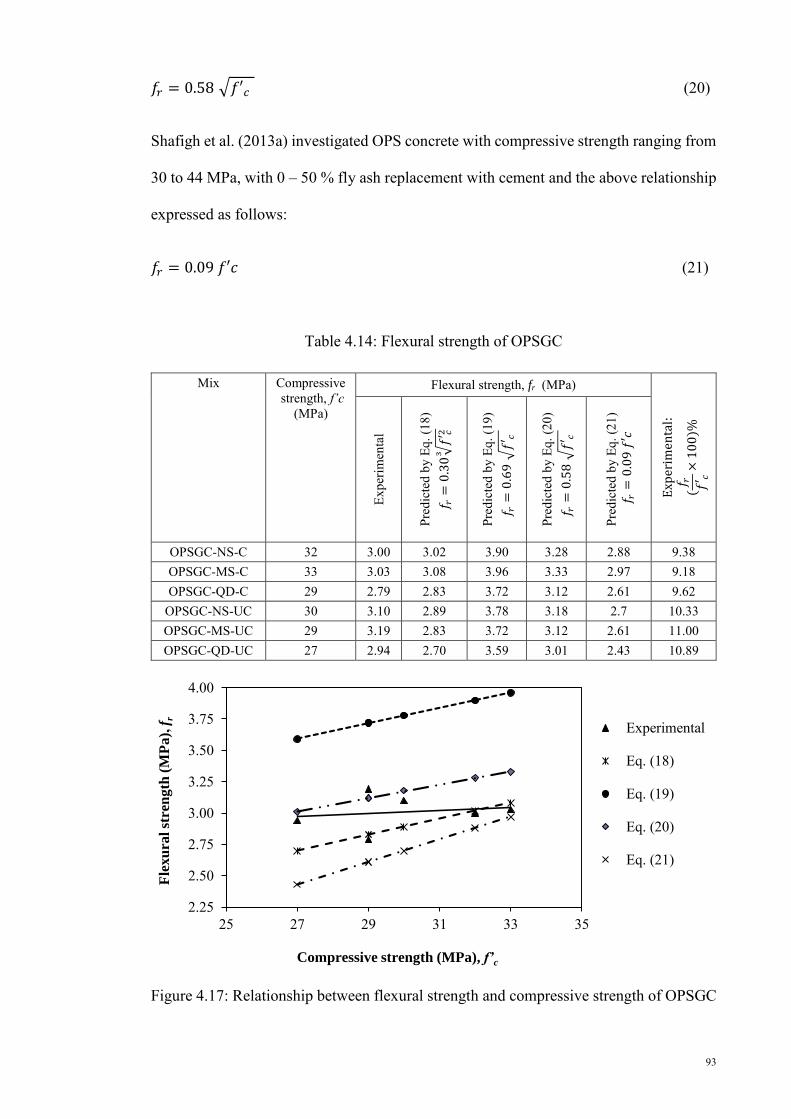
93
𝑓𝑟 = 0.58 √𝑓′𝑐 (20)
Shafigh et al. (2013a) investigated OPS concrete with compressive strength ranging from
30 to 44 MPa, with 0 – 50 % fly ash replacement with cement and the above relationship
expressed as follows:
𝑓𝑟 = 0.09 𝑓′𝑐 (21)
Table 4.14: Flexural strength of OPSGC
Mix Compressive strength, f’c
(MPa)
Flexural strength, fr (MPa)
Exp
erim
enta
l:
(𝑓 𝑟 𝑓′ 𝑐
×1
00
)%
Expe
rimen
tal
Pred
icte
d by
Eq.
(18)
𝑓 𝑟
=0
.30
√𝑓
′ 𝑐23
Pred
icte
d by
Eq.
(19)
𝑓 𝑟
=0
.69
√𝑓
′ 𝑐
Pred
icte
d by
Eq.
(20)
𝑓 𝑟
=0
.58
√𝑓
′ 𝑐
Pred
icte
d by
Eq.
(21)
𝑓 𝑟
=0
.09
𝑓′𝑐
OPSGC-NS-C 32 3.00 3.02 3.90 3.28 2.88 9.38 OPSGC-MS-C 33 3.03 3.08 3.96 3.33 2.97 9.18 OPSGC-QD-C 29 2.79 2.83 3.72 3.12 2.61 9.62
OPSGC-NS-UC 30 3.10 2.89 3.78 3.18 2.7 10.33 OPSGC-MS-UC 29 3.19 2.83 3.72 3.12 2.61 11.00 OPSGC-QD-UC 27 2.94 2.70 3.59 3.01 2.43 10.89
Figure 4.17: Relationship between flexural strength and compressive strength of OPSGC
2.25
2.50
2.75
3.00
3.25
3.50
3.75
4.00
25 27 29 31 33 35
Fle
xu
ral
stre
ng
th (
MP
a),
fr
Compressive strength (MPa), f’c
Experimental
Eq. (18)
Eq. (19)
Eq. (20)
Eq. (21)
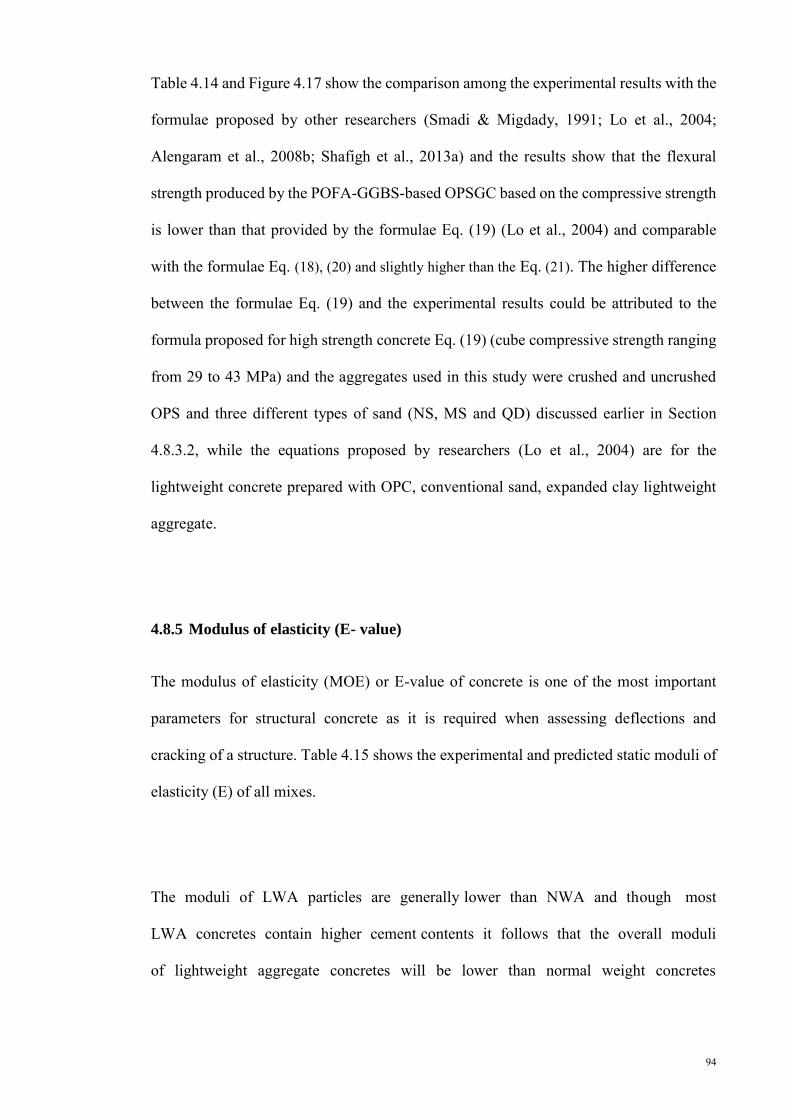
94
Table 4.14 and Figure 4.17 show the comparison among the experimental results with the
formulae proposed by other researchers (Smadi & Migdady, 1991; Lo et al., 2004;
Alengaram et al., 2008b; Shafigh et al., 2013a) and the results show that the flexural
strength produced by the POFA-GGBS-based OPSGC based on the compressive strength
is lower than that provided by the formulae Eq. (19) (Lo et al., 2004) and comparable
with the formulae Eq. (18), (20) and slightly higher than the Eq. (21). The higher difference
between the formulae Eq. (19) and the experimental results could be attributed to the
formula proposed for high strength concrete Eq. (19) (cube compressive strength ranging
from 29 to 43 MPa) and the aggregates used in this study were crushed and uncrushed
OPS and three different types of sand (NS, MS and QD) discussed earlier in Section
4.8.3.2, while the equations proposed by researchers (Lo et al., 2004) are for the
lightweight concrete prepared with OPC, conventional sand, expanded clay lightweight
aggregate.
4.8.5 Modulus of elasticity (E- value)
The modulus of elasticity (MOE) or E-value of concrete is one of the most important
parameters for structural concrete as it is required when assessing deflections and
cracking of a structure. Table 4.15 shows the experimental and predicted static moduli of
elasticity (E) of all mixes.
The moduli of LWA particles are generally lower than NWA and though most
LWA concretes contain higher cement contents it follows that the overall moduli
of lightweight aggregate concretes will be lower than normal weight concretes
95
(Clarke, 2005). Generally, for LWAC with natural and artificial LWA, the value of the
static MOE ranges between 10 and 24 kN/mm2 (FIP Manual, 1983).
Figure 4.18. The relationship of MOE and compressive strength at 28-day
The experimental E-values for the OPSGC and NWGC vary in the range of 7.4–11.12
GPa and 13.74 –16.86 GPa, respectively (Table 4.15), and the MOE increases as the
compressive strength increases (Figure 4.18). The E-values of OPSGC are lower than the
values obtained for NWGC; as stated, NWA has higher stiffness and establishes a
stronger bond between the aggregate surface and the matrix compared to the OPS. The
E-values of OPSGC depend on the stiffness of the aggregate, the hardened cement matrix,
the bond between the OPS and the cement matrix and the quantity of OPS. A higher LWA
content lowers the modulus value, because the concrete stiffness decreases (Short &
Kinniburgh, 1978; FIP Manual, 1983). Alengaram et al. (2011) opined that the use of
higher OPS content in mixes reduces the E-values. They reported values ranging between
5.5 and 7.1 kN/mm2. The E-values reported in this investigation were higher than the
values reported by Alengaram et al. (2011) for OPSC, which could be attributed to
reasons such as water to binder (w/b) ratio, sand to binder (s/b) ratio and the quantity of
OPS in the OPSGC.
y = 0.0095x2.0195
R² = 0.8639
5
10
15
20
25 30 35 40
Mo
du
lus
of
Ela
stic
ity
(M
OE
), G
Pa
Compressive strength of 100-mm cube (MPa), f’c
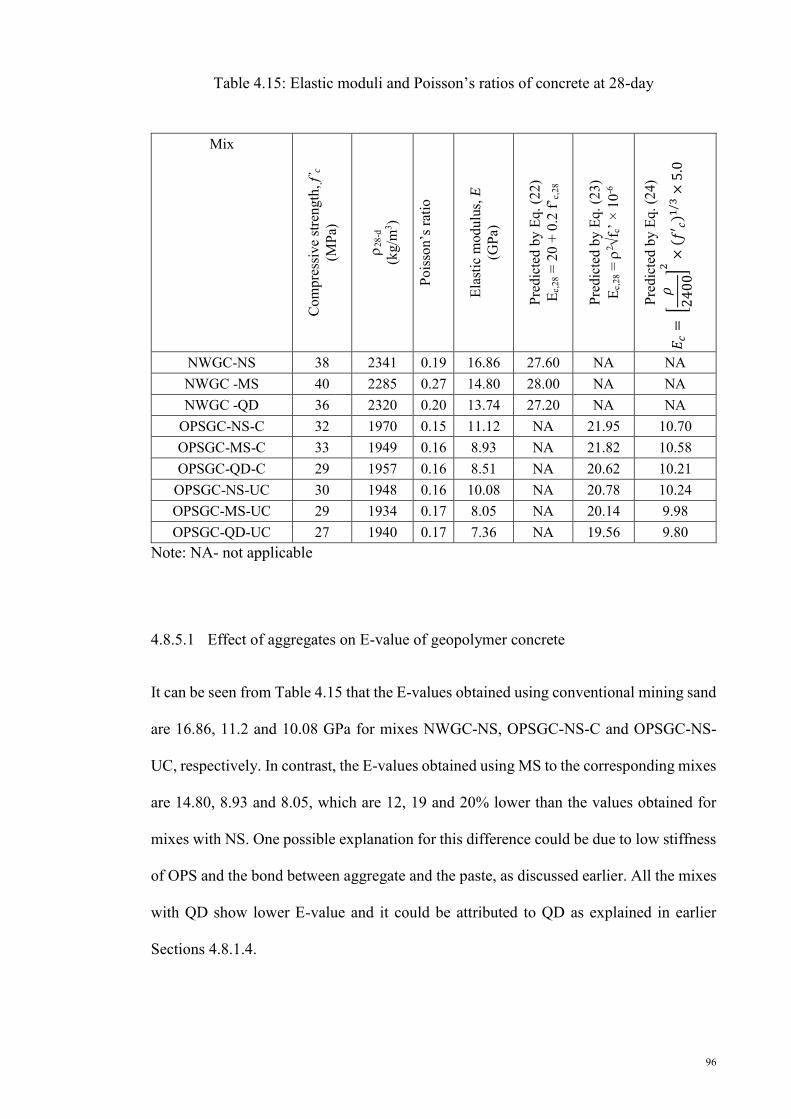
96
Table 4.15: Elastic moduli and Poisson’s ratios of concrete at 28-day
Mix
Com
pres
sive
stre
ngth
, f’ c
(M
Pa)
28
-d
(kg/
m3 )
Po
isso
n’s
rat
io
Elas
tic m
odul
us, E
(G
Pa)
Pred
icte
d by
Eq.
(22)
E c
,28 =
20
+ 0
.2 f
’ c,2
8
Pred
icte
d by
Eq.
(23)
E c
,28 =
2
f c’ ×
10
-6
Pred
icte
d by
Eq.
(24)
𝐸𝑐
= [
𝜌
24
00
]2
×( 𝑓
′ 𝑐)1
/3×
5.0
NWGC-NS 38 2341 0.19 16.86 27.60 NA NA NWGC -MS 40 2285 0.27 14.80 28.00 NA NA NWGC -QD 36 2320 0.20 13.74 27.20 NA NA
OPSGC-NS-C 32 1970 0.15 11.12 NA 21.95 10.70 OPSGC-MS-C 33 1949 0.16 8.93 NA 21.82 10.58 OPSGC-QD-C 29 1957 0.16 8.51 NA 20.62 10.21
OPSGC-NS-UC 30 1948 0.16 10.08 NA 20.78 10.24 OPSGC-MS-UC 29 1934 0.17 8.05 NA 20.14 9.98 OPSGC-QD-UC 27 1940 0.17 7.36 NA 19.56 9.80
Note: NA- not applicable
4.8.5.1 Effect of aggregates on E-value of geopolymer concrete
It can be seen from Table 4.15 that the E-values obtained using conventional mining sand
are 16.86, 11.2 and 10.08 GPa for mixes NWGC-NS, OPSGC-NS-C and OPSGC-NS-
UC, respectively. In contrast, the E-values obtained using MS to the corresponding mixes
are 14.80, 8.93 and 8.05, which are 12, 19 and 20% lower than the values obtained for
mixes with NS. One possible explanation for this difference could be due to low stiffness
of OPS and the bond between aggregate and the paste, as discussed earlier. All the mixes
with QD show lower E-value and it could be attributed to QD as explained in earlier
Sections 4.8.1.4.
97
4.8.5.2 Comparison of E-value with the previous research
In the literature, the following equations were suggested to predict the elastic modulus of
concrete from the compressive strength.
For normal-weight concrete,
BS8110 : Ec,28 = K0 + 0.2 f’c,28 (22)
where
Ec,28 is the static modulus of elasticity at 28 days (in kN/mm2);
f 'c, 28 is the characteristic cube strength at 28 days (in N/mm2);
Ko is a constant closely related to the modulus of elasticity of the aggregate
(taken as 20 kN/mm2 for normal-weight concrete and 14 to 26 kN/mm2 for
unknown aggregates)
For structural lightweight aggregate concrete, it is reported (Clarke, 2005):
Ec,28 = 2fc’ × 10-6 (23)
where E, and f’c are modulus of elasticity (GPa), nominal density (kg/m3) and cube
strength (MPa), respectively.
Kosmatka et al. (2002) reported for structural lightweight conventional concrete, the
MOE varied between 7 and 17 GPa.
Alengaram et al. (2011) established for OPS lightweight normal concrete incorporated
cement, fly ash and silica fume, the MOE can be expressed as:
𝐸𝑐 = [𝜌
2400]
2
× (𝑓′𝑐)1/3 × 5.0 (24)
where, f’c = cube compressive strength (MPa)
98
Based on the Young’s modulus comparisons between experimental and three equations
(Eq. (22), (23) and (24)), it could be concluded that the equation proposed by Alengaram
et al. (2011) (modified based on FIP manual) predicts the E-values closer to the
experimental. The difference between the experimental and predicted values are
0.16−2.44 MPa.
4.8.5.3 Stress-strain relationship
Figure 4.19 shows the stress-strain relationship for all nine mixes including NWGC. The
draft European code (ENV 1992–1–1: Part 1, 1991) gives special provisions for
lightweight aggregate concrete. It defines an idealised bilinear stress-strain diagram for
concrete, with a peak stress of 0.77 times the design strength of the concrete in most
situations. For normal weight concrete, the factor is 0.85. The transition from the
linearly increasing portion of the curve to the uniform is at a strain of 0.00135
for normal weight concrete, but increases to 0.0022 for lightweight aggregate
concrete. The ultimate strain for most structural concretes is approximately 0.0035,
irrespective of the strength of the concrete (Mosley & Bungey, 1990).
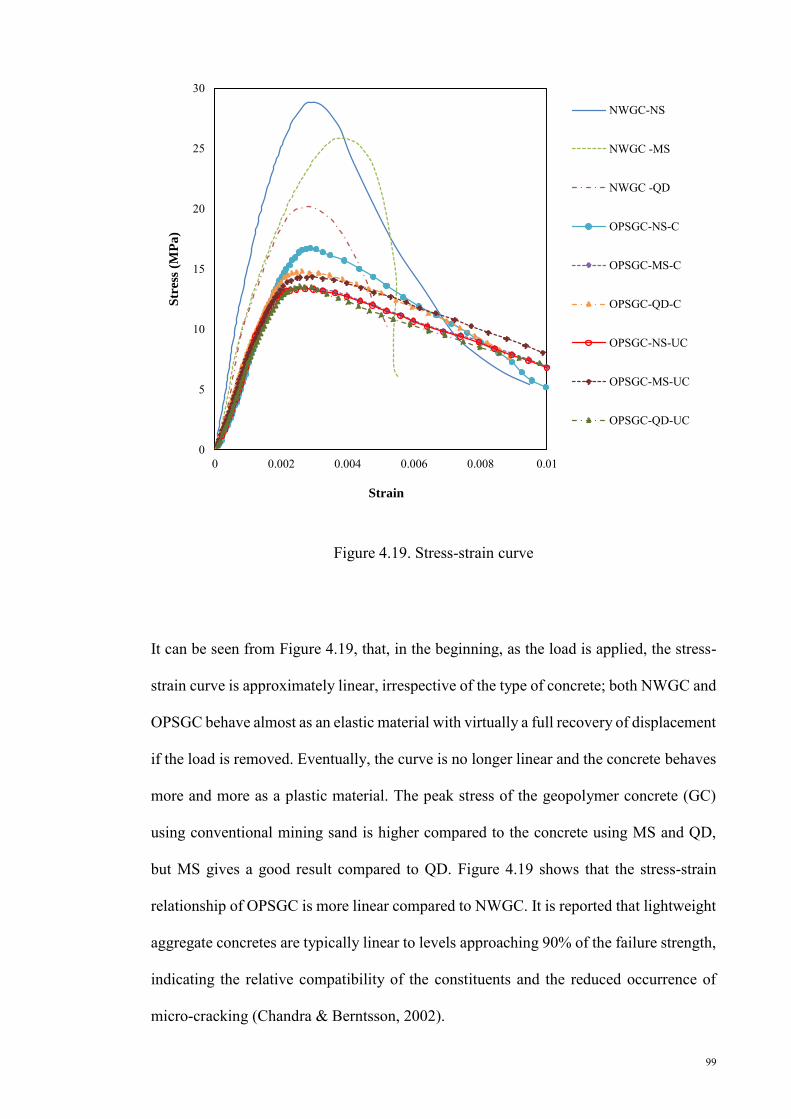
99
Figure 4.19. Stress-strain curve
It can be seen from Figure 4.19, that, in the beginning, as the load is applied, the stress-
strain curve is approximately linear, irrespective of the type of concrete; both NWGC and
OPSGC behave almost as an elastic material with virtually a full recovery of displacement
if the load is removed. Eventually, the curve is no longer linear and the concrete behaves
more and more as a plastic material. The peak stress of the geopolymer concrete (GC)
using conventional mining sand is higher compared to the concrete using MS and QD,
but MS gives a good result compared to QD. Figure 4.19 shows that the stress-strain
relationship of OPSGC is more linear compared to NWGC. It is reported that lightweight
aggregate concretes are typically linear to levels approaching 90% of the failure strength,
indicating the relative compatibility of the constituents and the reduced occurrence of
micro-cracking (Chandra & Berntsson, 2002).
0
5
10
15
20
25
30
0 0.002 0.004 0.006 0.008 0.01
Str
ess
(MP
a)
Strain
NWGC-NS
NWGC -MS
NWGC -QD
OPSGC-NS-C
OPSGC-MS-C
OPSGC-QD-C
OPSGC-NS-UC
OPSGC-MS-UC
OPSGC-QD-UC
100
4.8.6 Poisson’s ratio
The Poisson’s ratio of NWGC and OPSGC are presented in Table 4.15. The values of
Poisson’s ratio for OPSGC (mixes OPSGC-NS-C, OPSGC-MS-C, OPSGC-QD-C,
OPSGC-NS-UC, OPSGC-MS-UC and OPSGC-QD-UC) were found within the range of
0.15–0.17, while in the case of NWGC (mixes NWGC-NS, NWGC –MS and NWGC -
QD), the ratios’ shows slightly higher values of 0.19-0.27 as shown in Table 4.15. The
mixes with uncrushed OPS coarse aggregate shows a slight increment in Poisson’s ratio
(5.9 - 6.3 %) compared to the mixes using crushed OPS (0.15 – 0.16) and this could be
attributed to higher strains in uncrushed OPS. The OPSGC with conventional mining sand
show the Poisson’s ratio values 0.15 and 0.16 in the mixes OPSGC-NS-C and OPSGC-
NS-UC, respectively; while the corresponding mixes using MS and QD show 0.16–0.17,
in both cases.
There is no published literature available on the Poisson’s ratio of OPS based geopolymer
concrete. Depending on the properties of aggregate used, Poisson’s ratio of concrete lies
generally in the range of 0.15-0.22 (Neville, 1995). Neville (1995) reported for
lightweight aggregate conventional concrete the Poisson’s ratio could be of lower value
compared to NWA concrete.
Poisson’s ratio effect has a considerable influenced in construction. Due to Poisson’s
effect, the concrete may laterally expand and shorten its length. If a single slab concrete
highway is cast without any expansion joint, it may show crack within a short time due
the effect of Poisson’s ratio. Impact strength in compression is improved by the use of
aggregate with a low Poisson’s ratio (Neville, 1995). Higher Poisson’s ratio could lead to
splitting. In each material, the vertical compression results in a lateral expansion due to
the Poisson’s ratio effect.
101
4.9 Mechanical properties of OPSGC with and without fibre
In the previous Section (4.8 ), the effect of three types of fine aggregates along with
crushed and uncrushed OPS on the mechanical properties of OPSGC and NWGC was
investigated and reported. The specimens with MS produced comparable results to that
of NS and hence its use as sustainable material was further investigated using fibres. The
variables investigated in this section are OPS to binder contents with crushed and
uncrushed OPS; the fibre content was kept constant at 0.5% on volume of concrete. MS
was used as fine aggregate and comparison of mechanical properties of NWGC with and
without fibre was also done. Based on the findings from the previous Section (4.8 ), only
one curing condition, namely ambient curing was employed.
4.9.1 Density
The 28-day density of oil palm shell geopolymer concrete (OPSGC) and normal-weight
geopolymer concrete (NWGC) with and without fibre are shown in Table 4.16. The
density of OPSGC and fibre reinforced oil palm shell geopolymer concrete (FROPSGC)
ranges 1820−1940 and 1873−1994 kg/m3, respectively, and thus, it could be categorised
as LWC (EN 206-1, 2000). Figure 4.20 shows the relationship between density and the
compressive strength. As seen from Figure 4.20, the compressive strength increases
proportionally with the density.
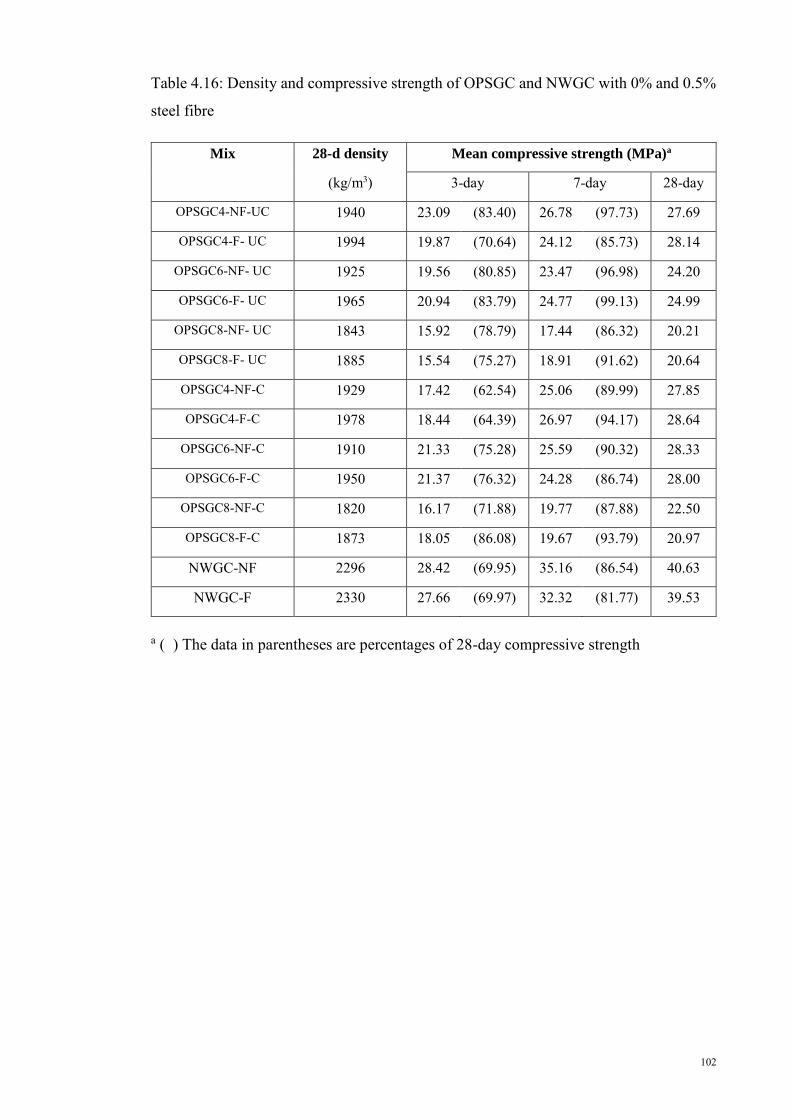
102
Table 4.16: Density and compressive strength of OPSGC and NWGC with 0% and 0.5%
steel fibre
Mix 28-d density Mean compressive strength (MPa)a
(kg/m3) 3-day 7-day 28-day
OPSGC4-NF-UC 1940 23.09 (83.40) 26.78 (97.73) 27.69
OPSGC4-F- UC 1994 19.87 (70.64) 24.12 (85.73) 28.14
OPSGC6-NF- UC 1925 19.56 (80.85) 23.47 (96.98) 24.20
OPSGC6-F- UC 1965 20.94 (83.79) 24.77 (99.13) 24.99
OPSGC8-NF- UC 1843 15.92 (78.79) 17.44 (86.32) 20.21
OPSGC8-F- UC 1885 15.54 (75.27) 18.91 (91.62) 20.64
OPSGC4-NF-C 1929 17.42 (62.54) 25.06 (89.99) 27.85
OPSGC4-F-C 1978 18.44 (64.39) 26.97 (94.17) 28.64
OPSGC6-NF-C 1910 21.33 (75.28) 25.59 (90.32) 28.33
OPSGC6-F-C 1950 21.37 (76.32) 24.28 (86.74) 28.00
OPSGC8-NF-C 1820 16.17 (71.88) 19.77 (87.88) 22.50
OPSGC8-F-C 1873 18.05 (86.08) 19.67 (93.79) 20.97
NWGC-NF 2296 28.42 (69.95) 35.16 (86.54) 40.63
NWGC-F 2330 27.66 (69.97) 32.32 (81.77) 39.53
a ( ) The data in parentheses are percentages of 28-day compressive strength
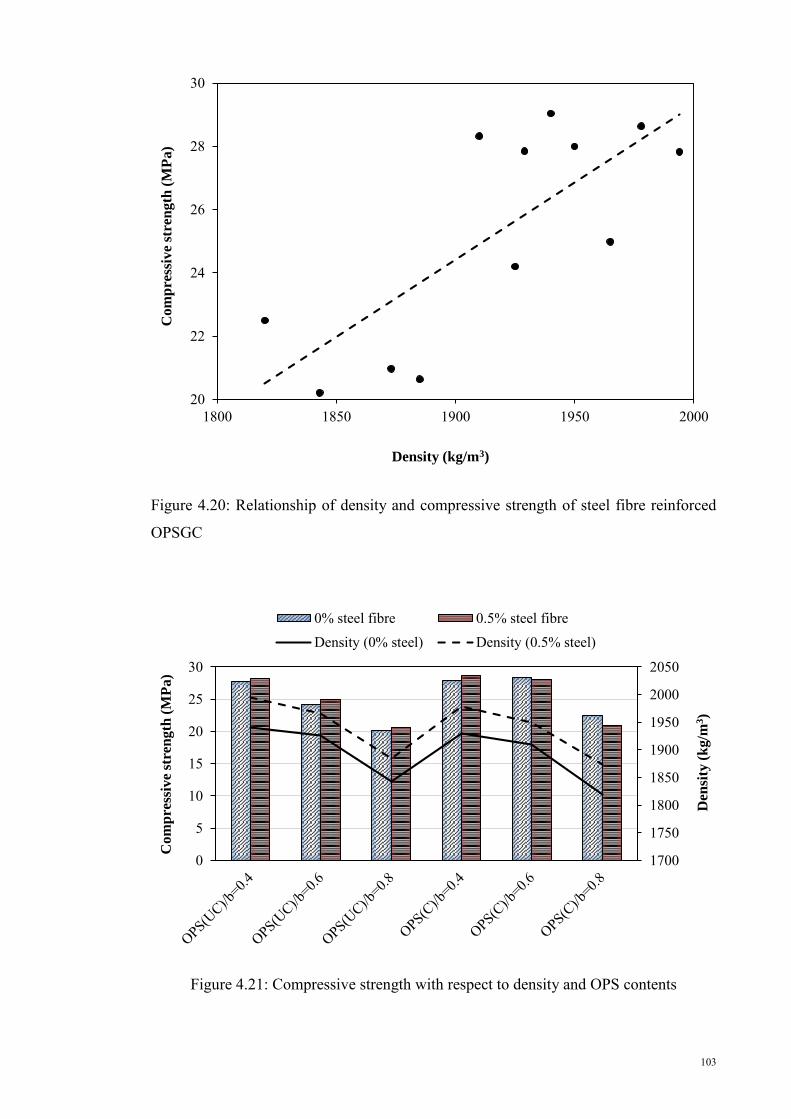
103
Figure 4.20: Relationship of density and compressive strength of steel fibre reinforced
OPSGC
Figure 4.21: Compressive strength with respect to density and OPS contents
20
22
24
26
28
30
1800 1850 1900 1950 2000
Co
mp
ress
ive
stre
ng
th (
MP
a)
Density (kg/m3)
1700
1750
1800
1850
1900
1950
2000
2050
0
5
10
15
20
25
30
Den
sity
(k
g/m
3)
Co
mp
ress
ive
stre
ngth
(M
Pa)
0% steel fibre 0.5% steel fibreDensity (0% steel) Density (0.5% steel)
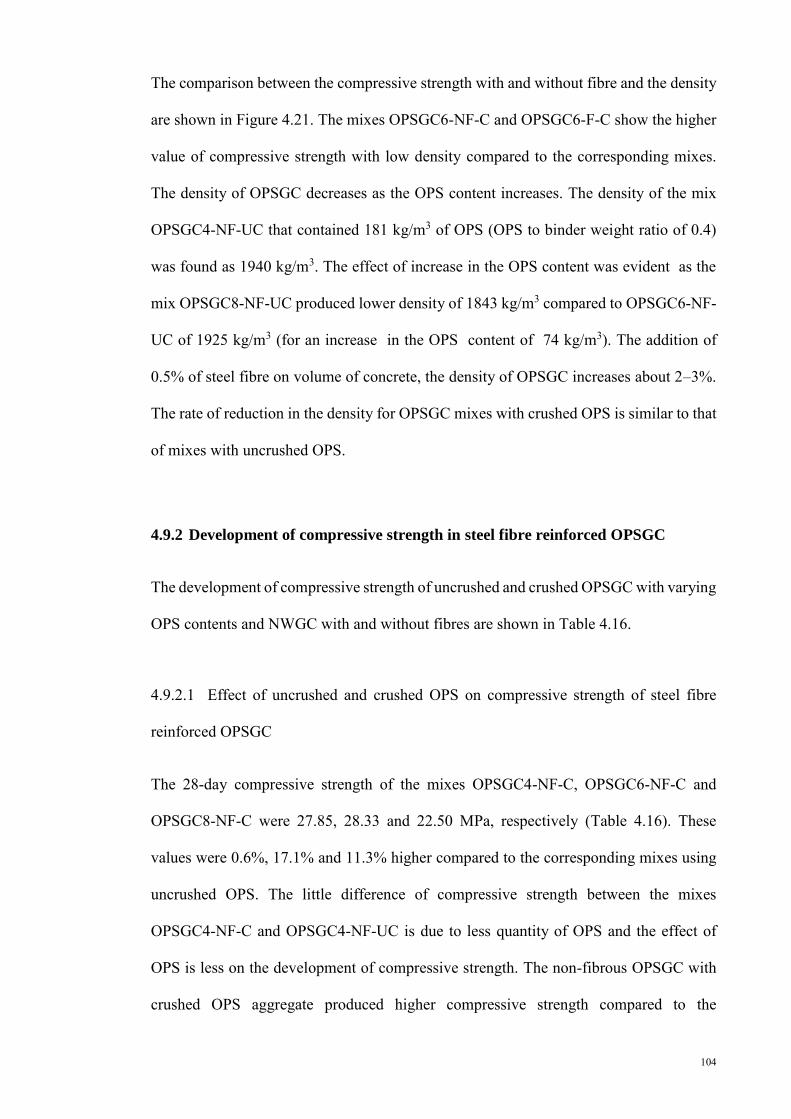
104
The comparison between the compressive strength with and without fibre and the density
are shown in Figure 4.21. The mixes OPSGC6-NF-C and OPSGC6-F-C show the higher
value of compressive strength with low density compared to the corresponding mixes.
The density of OPSGC decreases as the OPS content increases. The density of the mix
OPSGC4-NF-UC that contained 181 kg/m3 of OPS (OPS to binder weight ratio of 0.4)
was found as 1940 kg/m3. The effect of increase in the OPS content was evident as the
mix OPSGC8-NF-UC produced lower density of 1843 kg/m3 compared to OPSGC6-NF-
UC of 1925 kg/m3 (for an increase in the OPS content of 74 kg/m3). The addition of
0.5% of steel fibre on volume of concrete, the density of OPSGC increases about 2–3%.
The rate of reduction in the density for OPSGC mixes with crushed OPS is similar to that
of mixes with uncrushed OPS.
4.9.2 Development of compressive strength in steel fibre reinforced OPSGC
The development of compressive strength of uncrushed and crushed OPSGC with varying
OPS contents and NWGC with and without fibres are shown in Table 4.16.
4.9.2.1 Effect of uncrushed and crushed OPS on compressive strength of steel fibre
reinforced OPSGC
The 28-day compressive strength of the mixes OPSGC4-NF-C, OPSGC6-NF-C and
OPSGC8-NF-C were 27.85, 28.33 and 22.50 MPa, respectively (Table 4.16). These
values were 0.6%, 17.1% and 11.3% higher compared to the corresponding mixes using
uncrushed OPS. The little difference of compressive strength between the mixes
OPSGC4-NF-C and OPSGC4-NF-UC is due to less quantity of OPS and the effect of
OPS is less on the development of compressive strength. The non-fibrous OPSGC with
crushed OPS aggregate produced higher compressive strength compared to the
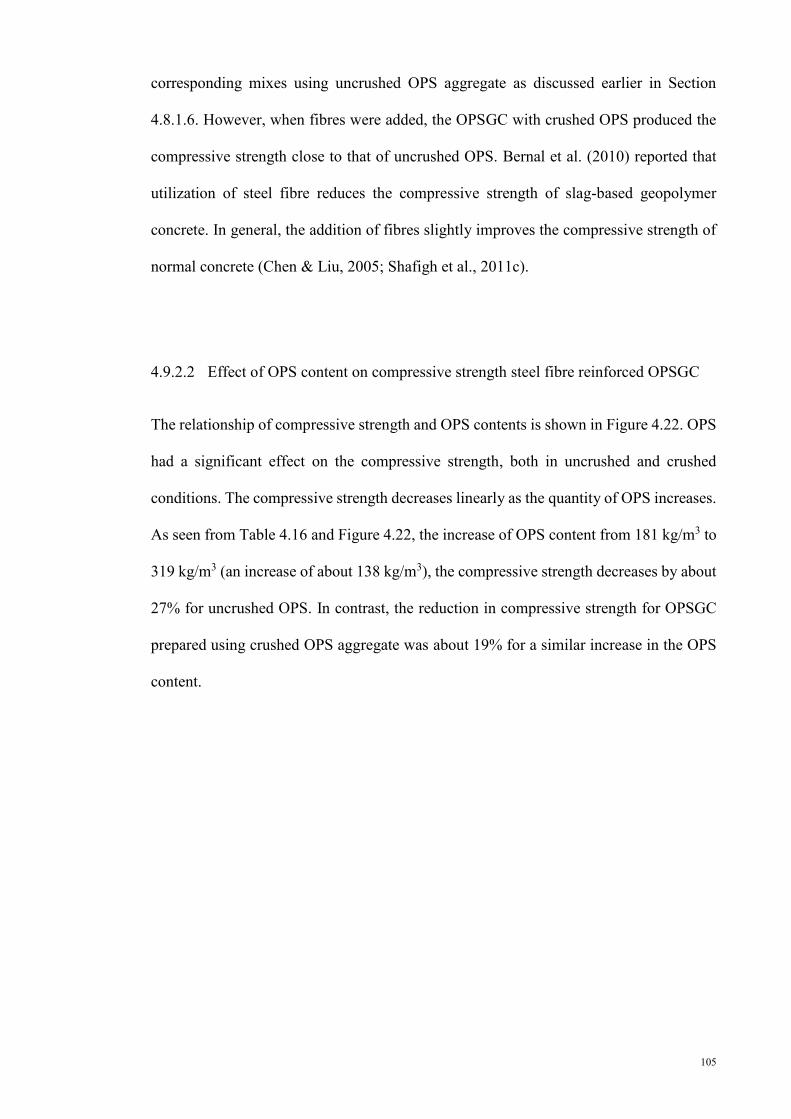
105
corresponding mixes using uncrushed OPS aggregate as discussed earlier in Section
4.8.1.6. However, when fibres were added, the OPSGC with crushed OPS produced the
compressive strength close to that of uncrushed OPS. Bernal et al. (2010) reported that
utilization of steel fibre reduces the compressive strength of slag-based geopolymer
concrete. In general, the addition of fibres slightly improves the compressive strength of
normal concrete (Chen & Liu, 2005; Shafigh et al., 2011c).
4.9.2.2 Effect of OPS content on compressive strength steel fibre reinforced OPSGC
The relationship of compressive strength and OPS contents is shown in Figure 4.22. OPS
had a significant effect on the compressive strength, both in uncrushed and crushed
conditions. The compressive strength decreases linearly as the quantity of OPS increases.
As seen from Table 4.16 and Figure 4.22, the increase of OPS content from 181 kg/m3 to
319 kg/m3 (an increase of about 138 kg/m3), the compressive strength decreases by about
27% for uncrushed OPS. In contrast, the reduction in compressive strength for OPSGC
prepared using crushed OPS aggregate was about 19% for a similar increase in the OPS
content.
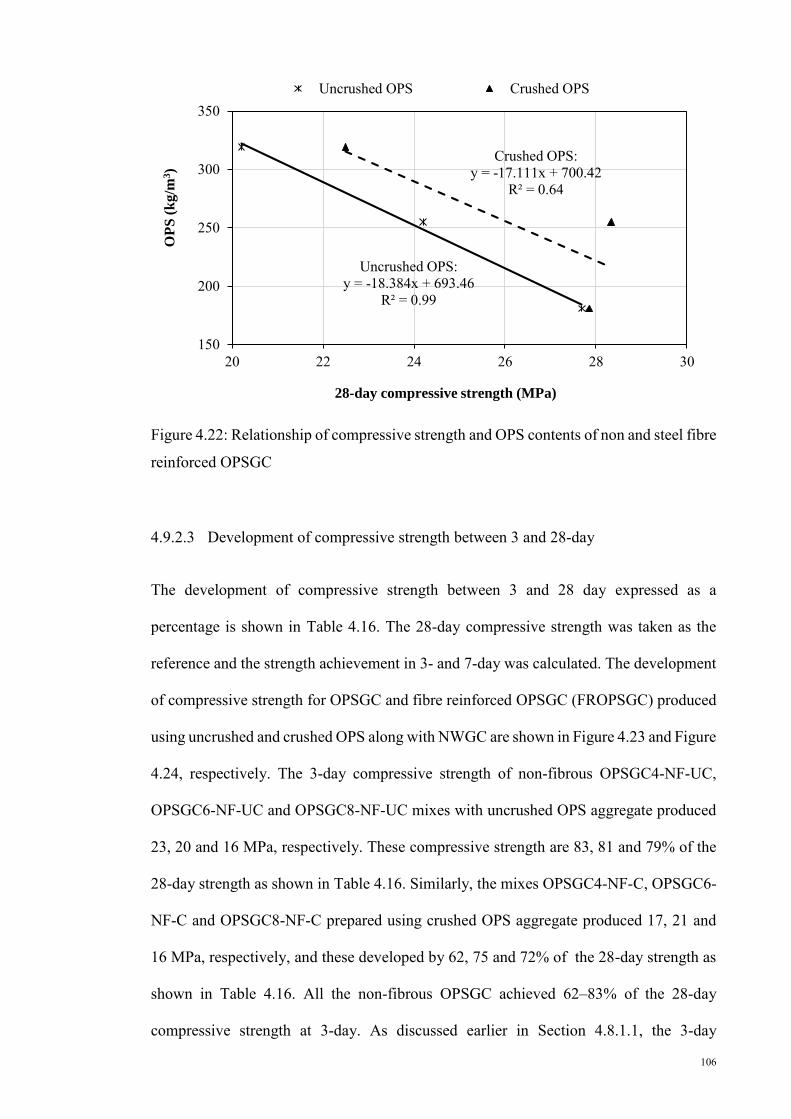
106
Figure 4.22: Relationship of compressive strength and OPS contents of non and steel fibre
reinforced OPSGC
4.9.2.3 Development of compressive strength between 3 and 28-day
The development of compressive strength between 3 and 28 day expressed as a
percentage is shown in Table 4.16. The 28-day compressive strength was taken as the
reference and the strength achievement in 3- and 7-day was calculated. The development
of compressive strength for OPSGC and fibre reinforced OPSGC (FROPSGC) produced
using uncrushed and crushed OPS along with NWGC are shown in Figure 4.23 and Figure
4.24, respectively. The 3-day compressive strength of non-fibrous OPSGC4-NF-UC,
OPSGC6-NF-UC and OPSGC8-NF-UC mixes with uncrushed OPS aggregate produced
23, 20 and 16 MPa, respectively. These compressive strength are 83, 81 and 79% of the
28-day strength as shown in Table 4.16. Similarly, the mixes OPSGC4-NF-C, OPSGC6-
NF-C and OPSGC8-NF-C prepared using crushed OPS aggregate produced 17, 21 and
16 MPa, respectively, and these developed by 62, 75 and 72% of the 28-day strength as
shown in Table 4.16. All the non-fibrous OPSGC achieved 62–83% of the 28-day
compressive strength at 3-day. As discussed earlier in Section 4.8.1.1, the 3-day
Uncrushed OPS:y = -18.384x + 693.46
R² = 0.99
Crushed OPS:y = -17.111x + 700.42
R² = 0.64
150
200
250
300
350
20 22 24 26 28 30
OP
S (
kg
/m3)
28-day compressive strength (MPa)
Uncrushed OPS Crushed OPS
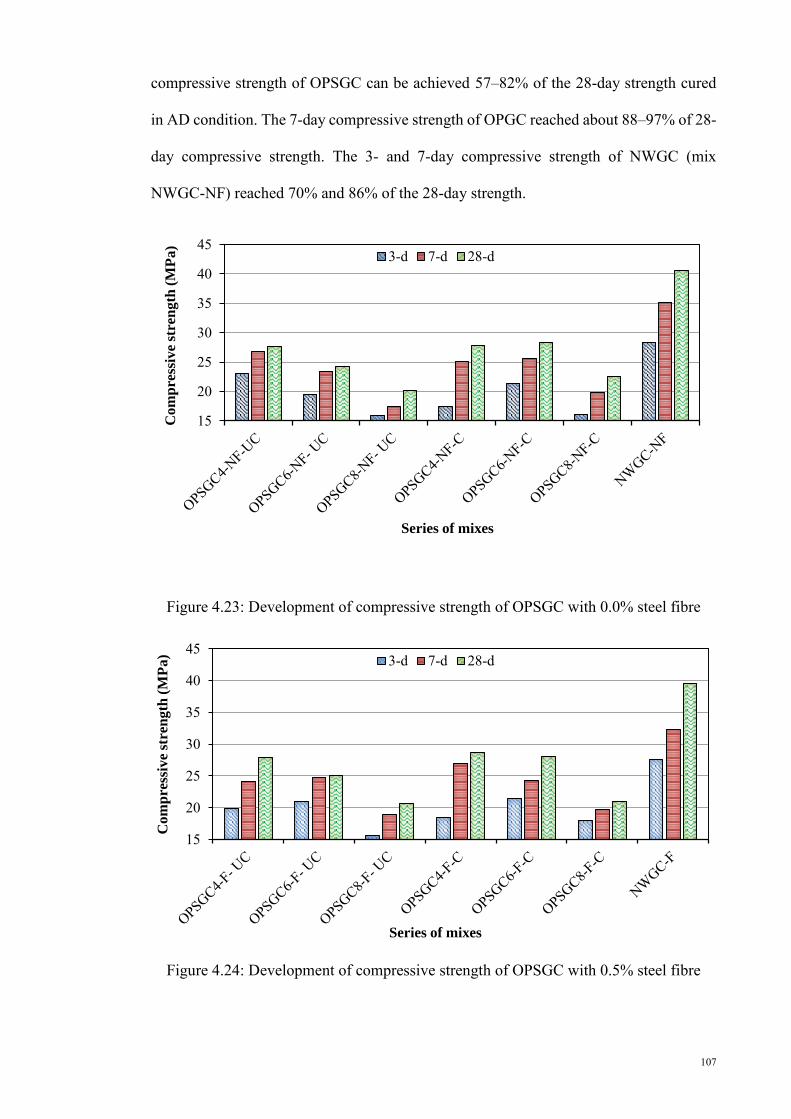
107
compressive strength of OPSGC can be achieved 57–82% of the 28-day strength cured
in AD condition. The 7-day compressive strength of OPGC reached about 88–97% of 28-
day compressive strength. The 3- and 7-day compressive strength of NWGC (mix
NWGC-NF) reached 70% and 86% of the 28-day strength.
Figure 4.23: Development of compressive strength of OPSGC with 0.0% steel fibre
Figure 4.24: Development of compressive strength of OPSGC with 0.5% steel fibre
15
20
25
30
35
40
45
Co
mp
ress
ive
stre
ng
th (
MP
a)
Series of mixes
3-d 7-d 28-d
15
20
25
30
35
40
45
Co
mp
ress
ive
stre
ngth
(M
Pa)
Series of mixes
3-d 7-d 28-d
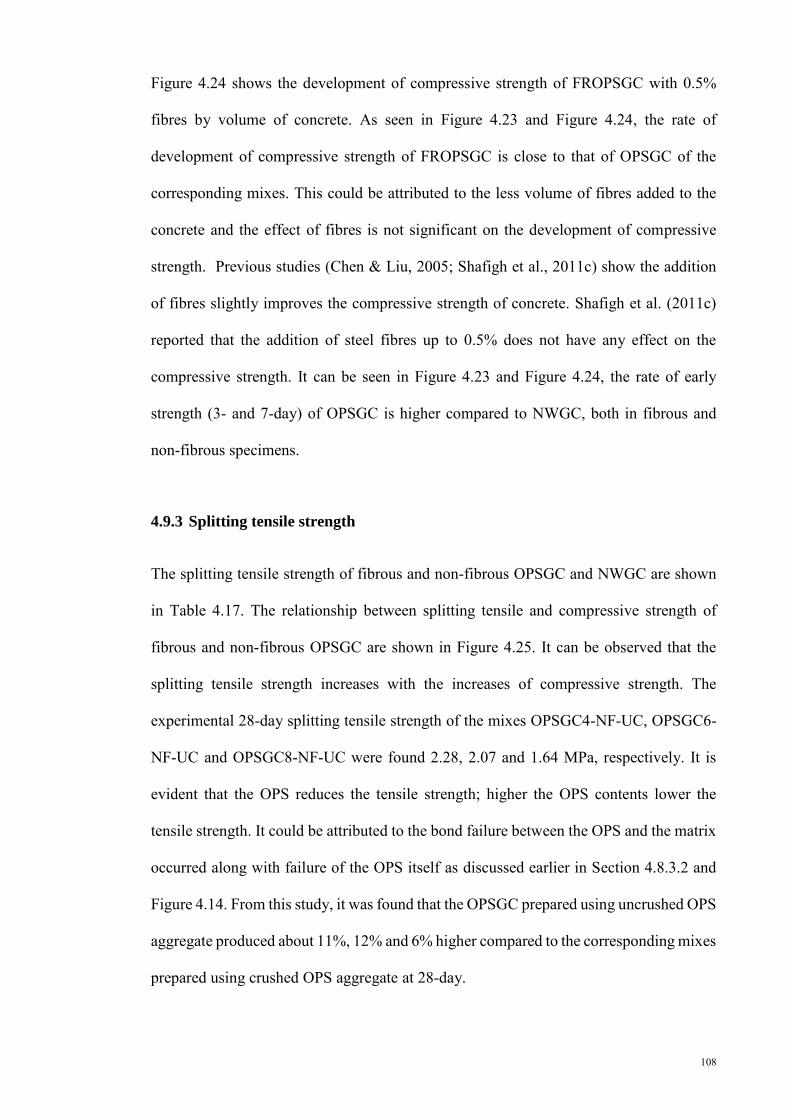
108
Figure 4.24 shows the development of compressive strength of FROPSGC with 0.5%
fibres by volume of concrete. As seen in Figure 4.23 and Figure 4.24, the rate of
development of compressive strength of FROPSGC is close to that of OPSGC of the
corresponding mixes. This could be attributed to the less volume of fibres added to the
concrete and the effect of fibres is not significant on the development of compressive
strength. Previous studies (Chen & Liu, 2005; Shafigh et al., 2011c) show the addition
of fibres slightly improves the compressive strength of concrete. Shafigh et al. (2011c)
reported that the addition of steel fibres up to 0.5% does not have any effect on the
compressive strength. It can be seen in Figure 4.23 and Figure 4.24, the rate of early
strength (3- and 7-day) of OPSGC is higher compared to NWGC, both in fibrous and
non-fibrous specimens.
4.9.3 Splitting tensile strength
The splitting tensile strength of fibrous and non-fibrous OPSGC and NWGC are shown
in Table 4.17. The relationship between splitting tensile and compressive strength of
fibrous and non-fibrous OPSGC are shown in Figure 4.25. It can be observed that the
splitting tensile strength increases with the increases of compressive strength. The
experimental 28-day splitting tensile strength of the mixes OPSGC4-NF-UC, OPSGC6-
NF-UC and OPSGC8-NF-UC were found 2.28, 2.07 and 1.64 MPa, respectively. It is
evident that the OPS reduces the tensile strength; higher the OPS contents lower the
tensile strength. It could be attributed to the bond failure between the OPS and the matrix
occurred along with failure of the OPS itself as discussed earlier in Section 4.8.3.2 and
Figure 4.14. From this study, it was found that the OPSGC prepared using uncrushed OPS
aggregate produced about 11%, 12% and 6% higher compared to the corresponding mixes
prepared using crushed OPS aggregate at 28-day.
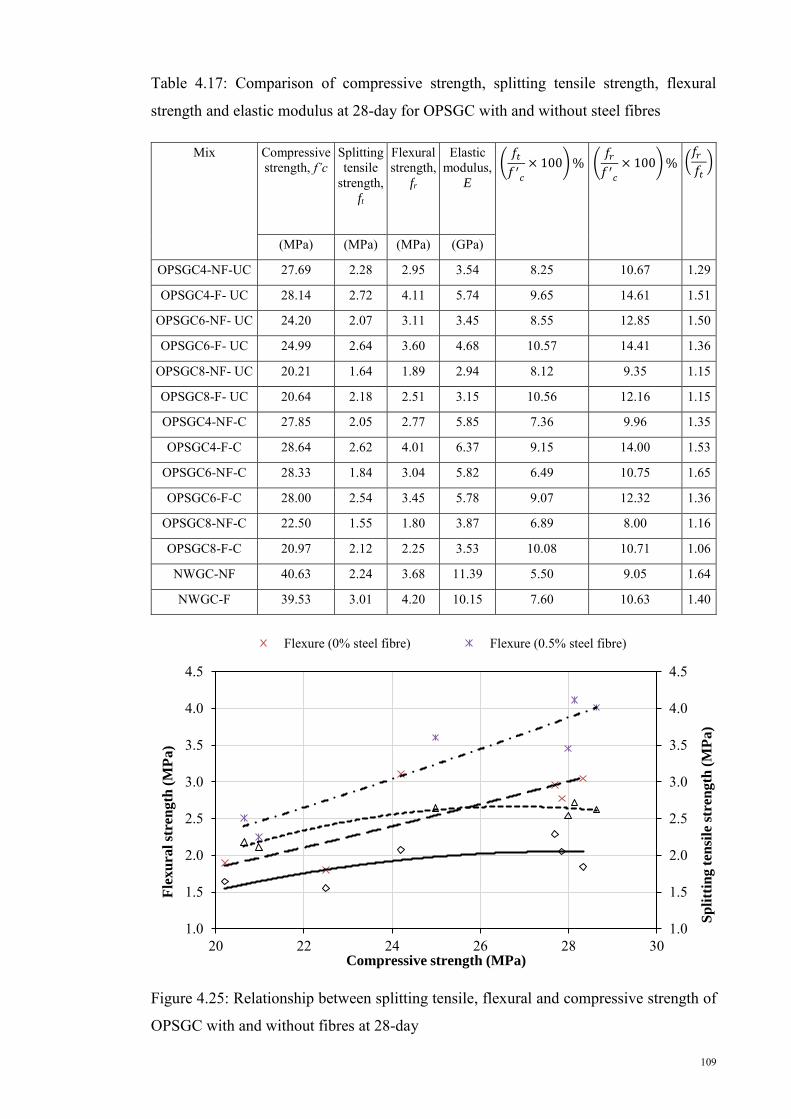
109
Table 4.17: Comparison of compressive strength, splitting tensile strength, flexural
strength and elastic modulus at 28-day for OPSGC with and without steel fibres
Mix Compressive strength, f’c
Splitting tensile
strength, ft
Flexural strength,
fr
Elastic modulus,
E (
𝑓𝑡
𝑓′𝑐
× 100) % (𝑓𝑟
𝑓′𝑐
× 100) % (𝑓𝑟
𝑓𝑡
)
(MPa) (MPa) (MPa) (GPa)
OPSGC4-NF-UC 27.69 2.28 2.95 3.54 8.25 10.67 1.29
OPSGC4-F- UC 28.14 2.72 4.11 5.74 9.65 14.61 1.51
OPSGC6-NF- UC 24.20 2.07 3.11 3.45 8.55 12.85 1.50
OPSGC6-F- UC 24.99 2.64 3.60 4.68 10.57 14.41 1.36
OPSGC8-NF- UC 20.21 1.64 1.89 2.94 8.12 9.35 1.15
OPSGC8-F- UC 20.64 2.18 2.51 3.15 10.56 12.16 1.15
OPSGC4-NF-C 27.85 2.05 2.77 5.85 7.36 9.96 1.35
OPSGC4-F-C 28.64 2.62 4.01 6.37 9.15 14.00 1.53
OPSGC6-NF-C 28.33 1.84 3.04 5.82 6.49 10.75 1.65
OPSGC6-F-C 28.00 2.54 3.45 5.78 9.07 12.32 1.36
OPSGC8-NF-C 22.50 1.55 1.80 3.87 6.89 8.00 1.16
OPSGC8-F-C 20.97 2.12 2.25 3.53 10.08 10.71 1.06
NWGC-NF 40.63 2.24 3.68 11.39 5.50 9.05 1.64
NWGC-F 39.53 3.01 4.20 10.15 7.60 10.63 1.40
Figure 4.25: Relationship between splitting tensile, flexural and compressive strength of
OPSGC with and without fibres at 28-day
1.0
1.5
2.0
2.5
3.0
3.5
4.0
4.5
1.0
1.5
2.0
2.5
3.0
3.5
4.0
4.5
20 22 24 26 28 30
Sp
litt
ing
ten
sile
str
eng
th (
MP
a)
Fle
xu
ral
stre
ng
th (
MP
a)
Compressive strength (MPa)
Flexure (0% steel fibre) Flexure (0.5% steel fibre)
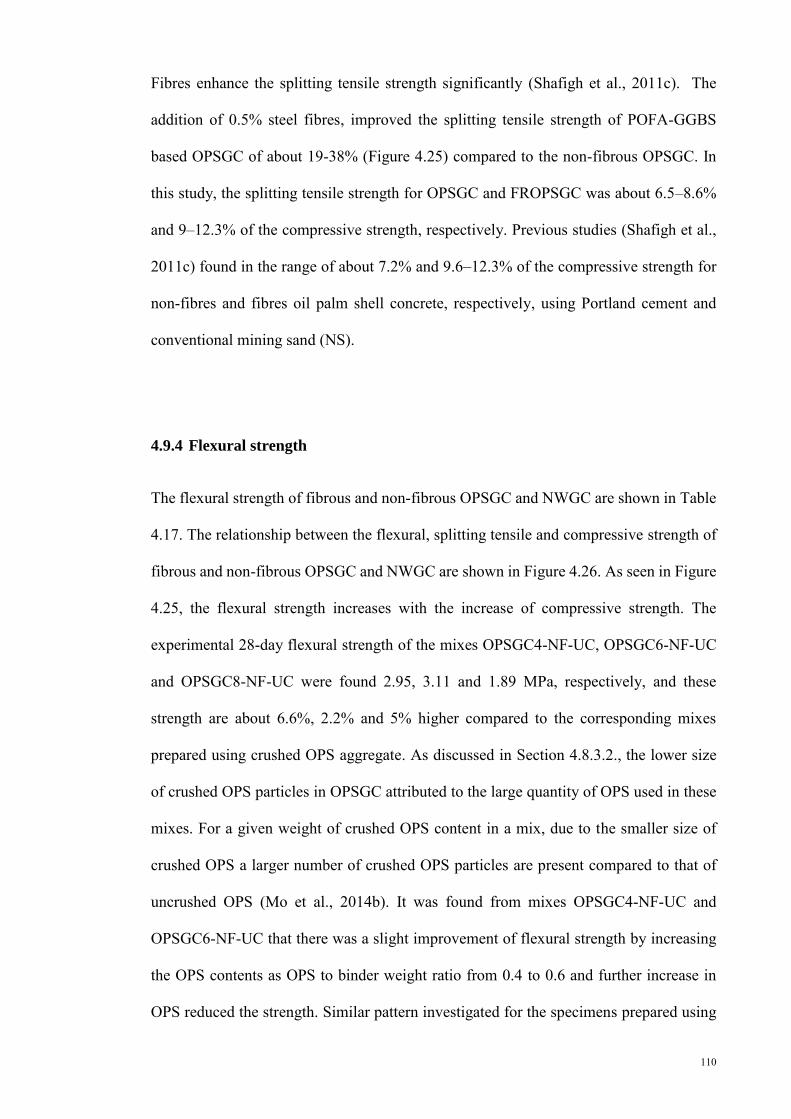
110
Fibres enhance the splitting tensile strength significantly (Shafigh et al., 2011c). The
addition of 0.5% steel fibres, improved the splitting tensile strength of POFA-GGBS
based OPSGC of about 19-38% (Figure 4.25) compared to the non-fibrous OPSGC. In
this study, the splitting tensile strength for OPSGC and FROPSGC was about 6.5–8.6%
and 9–12.3% of the compressive strength, respectively. Previous studies (Shafigh et al.,
2011c) found in the range of about 7.2% and 9.6–12.3% of the compressive strength for
non-fibres and fibres oil palm shell concrete, respectively, using Portland cement and
conventional mining sand (NS).
4.9.4 Flexural strength
The flexural strength of fibrous and non-fibrous OPSGC and NWGC are shown in Table
4.17. The relationship between the flexural, splitting tensile and compressive strength of
fibrous and non-fibrous OPSGC and NWGC are shown in Figure 4.26. As seen in Figure
4.25, the flexural strength increases with the increase of compressive strength. The
experimental 28-day flexural strength of the mixes OPSGC4-NF-UC, OPSGC6-NF-UC
and OPSGC8-NF-UC were found 2.95, 3.11 and 1.89 MPa, respectively, and these
strength are about 6.6%, 2.2% and 5% higher compared to the corresponding mixes
prepared using crushed OPS aggregate. As discussed in Section 4.8.3.2., the lower size
of crushed OPS particles in OPSGC attributed to the large quantity of OPS used in these
mixes. For a given weight of crushed OPS content in a mix, due to the smaller size of
crushed OPS a larger number of crushed OPS particles are present compared to that of
uncrushed OPS (Mo et al., 2014b). It was found from mixes OPSGC4-NF-UC and
OPSGC6-NF-UC that there was a slight improvement of flexural strength by increasing
the OPS contents as OPS to binder weight ratio from 0.4 to 0.6 and further increase in
OPS reduced the strength. Similar pattern investigated for the specimens prepared using

111
crushed OPS aggregate for the corresponding mixes. It could be due to the very less
quantity of OPS presented to the former that did not affect much on the flexural strength.
But excess OPS could cause bond failure between the OPS and the matrix occurred along
with failure of the OPS itself as discussed earlier in Section 4.8.3.2 and Figure 4.16.
Figure 4.26: Flexural and splitting tensile strength with respect to compressive strength
and OPS contents
The addition of steel fibres increases both the splitting tensile and flexural strength. The
addition of 0.5% steel fibres, enhanced the flexural strength of POFA-GGBS based
OPSGC of about 13-44% (Figure 4.25 and Figure 4.26) compared to the non-fibrous
OPSGC. This could be attributed to the strong bond and the matrix between the
aggregates and the steel fibres. In this study, the flexural strength for OPSGC and
FROPSGC was about 8–13% and 11–15% of the compressive strength, respectively and
in average, the flexural strength of lightweight OPSGC and FROPSGC was found
1.0
1.5
2.0
2.5
3.0
3.5
4.0
4.5
0
5
10
15
20
25
30
35
40
45
Fle
xu
ral
& s
pli
ttin
g t
ensi
le s
tren
gth
(M
Pa
)
Co
mp
ress
ive
stre
ngth
(M
Pa)
Series of mixes
Compressive strength Flexural strength Splitting tensile strength
112
approximately 34% higher than the splitting tensile strength; generally it is 35% as
reported earlier investigations (Zheng et al., 2001).
4.9.5 Modulus of elasticity (E- value) for OPSGC with and without steel fibres
The values of static modulus of elasticity (E) of all the mixes with and without fibre are
shown in Table 4.17. As seen in Table 4.17 and Figure 4.27, the addition of steel fibres
in OPSGC does not have a significant effect on the (E) value. It is reported (Mehta &
Monteiro, 2006) that the inclusion of steel fibres in concrete has little effect on the (E)
value. It was found from this study that the E-values of NWGC are higher than the values
obtained for OPSGC. Generally, the (E) value of OPS concrete is lower than the other
types of lightweight aggregate concrete (LWAC) (Shafigh et al., 2010). The reasons
already discussed earlier in Section 4.8.5
Figure 4.27. The relationship between MOE and compressive strength (at 28-day) of
OPSGC with and without steel fibres
4.10 Impact energy
The aggregate impact value (AIV) of OPS is much lower than the crushed granite
aggregate and this shows the OPS have high impact energy absorption capacity. Thus,
2
3
4
5
6
7
20 22 24 26 28 30
MO
E (
E),
GP
a
Compressive strength (MPa)
0% steel fibres 0.5% steel fibres
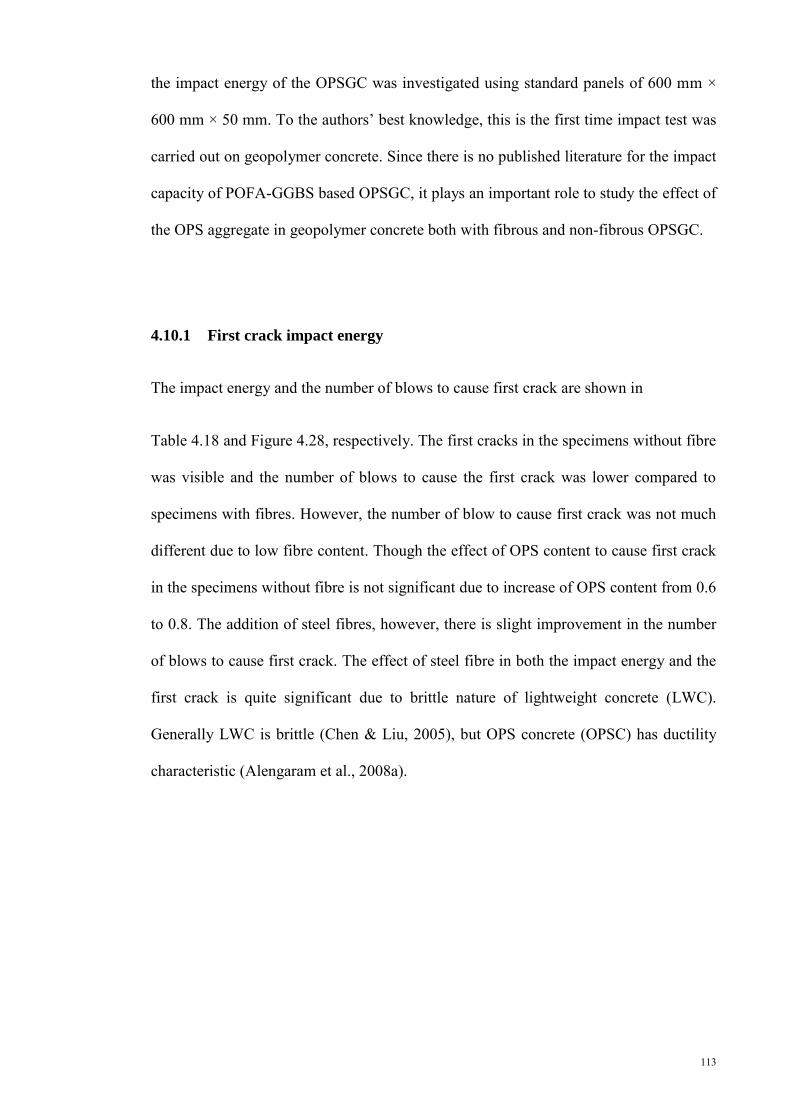
113
the impact energy of the OPSGC was investigated using standard panels of 600 mm ×
600 mm × 50 mm. To the authors’ best knowledge, this is the first time impact test was
carried out on geopolymer concrete. Since there is no published literature for the impact
capacity of POFA-GGBS based OPSGC, it plays an important role to study the effect of
the OPS aggregate in geopolymer concrete both with fibrous and non-fibrous OPSGC.
4.10.1 First crack impact energy
The impact energy and the number of blows to cause first crack are shown in
Table 4.18 and Figure 4.28, respectively. The first cracks in the specimens without fibre
was visible and the number of blows to cause the first crack was lower compared to
specimens with fibres. However, the number of blow to cause first crack was not much
different due to low fibre content. Though the effect of OPS content to cause first crack
in the specimens without fibre is not significant due to increase of OPS content from 0.6
to 0.8. The addition of steel fibres, however, there is slight improvement in the number
of blows to cause first crack. The effect of steel fibre in both the impact energy and the
first crack is quite significant due to brittle nature of lightweight concrete (LWC).
Generally LWC is brittle (Chen & Liu, 2005), but OPS concrete (OPSC) has ductility
characteristic (Alengaram et al., 2008a).
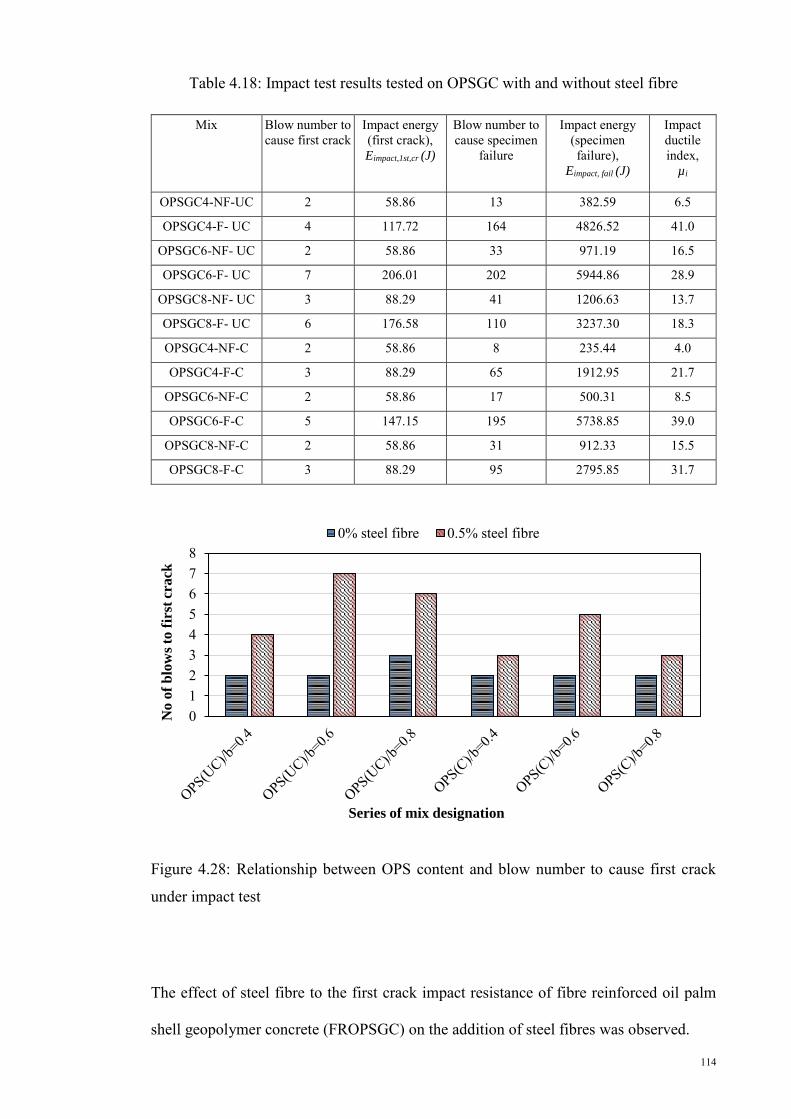
114
Table 4.18: Impact test results tested on OPSGC with and without steel fibre
Mix Blow number to cause first crack
Impact energy (first crack), Eimpact,1st,cr (J)
Blow number to cause specimen
failure
Impact energy (specimen failure),
Eimpact, fail (J)
Impact ductile index,
µi
OPSGC4-NF-UC 2 58.86 13 382.59 6.5
OPSGC4-F- UC 4 117.72 164 4826.52 41.0
OPSGC6-NF- UC 2 58.86 33 971.19 16.5
OPSGC6-F- UC 7 206.01 202 5944.86 28.9
OPSGC8-NF- UC 3 88.29 41 1206.63 13.7
OPSGC8-F- UC 6 176.58 110 3237.30 18.3
OPSGC4-NF-C 2 58.86 8 235.44 4.0
OPSGC4-F-C 3 88.29 65 1912.95 21.7
OPSGC6-NF-C 2 58.86 17 500.31 8.5
OPSGC6-F-C 5 147.15 195 5738.85 39.0
OPSGC8-NF-C 2 58.86 31 912.33 15.5
OPSGC8-F-C 3 88.29 95 2795.85 31.7
Figure 4.28: Relationship between OPS content and blow number to cause first crack
under impact test
The effect of steel fibre to the first crack impact resistance of fibre reinforced oil palm
shell geopolymer concrete (FROPSGC) on the addition of steel fibres was observed.
012345678
No o
f b
low
s to
fir
st c
rack
Series of mix designation
0% steel fibre 0.5% steel fibre
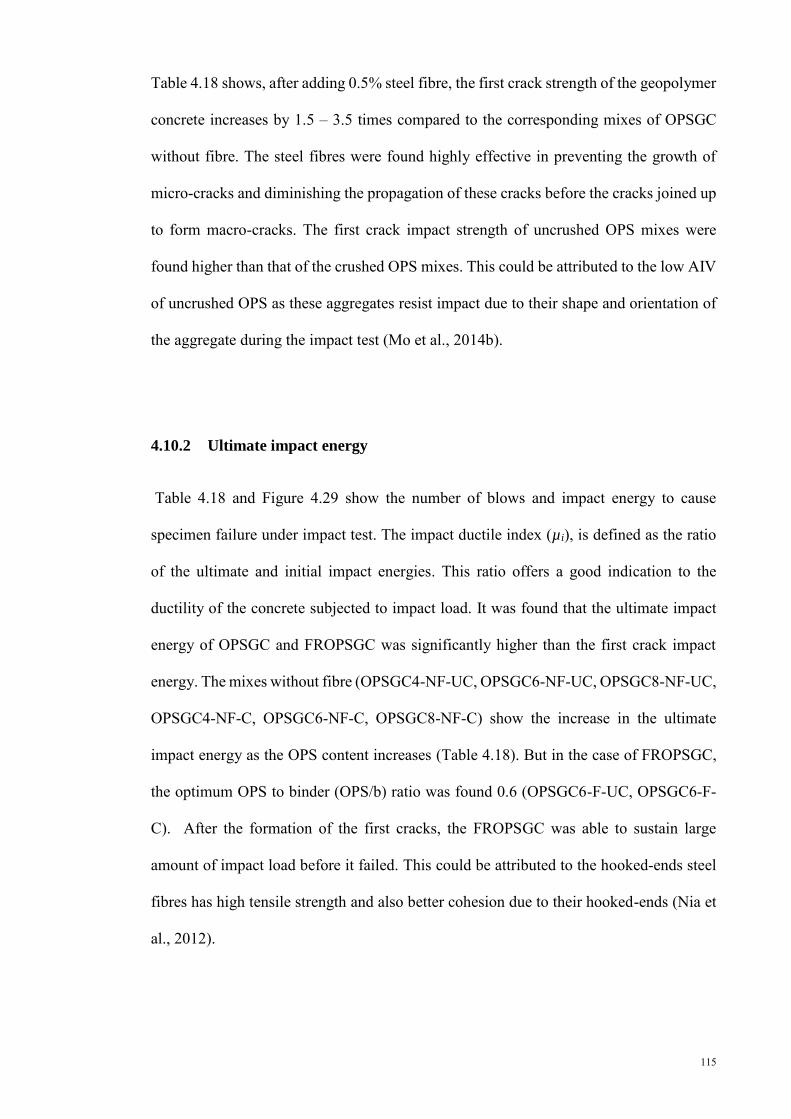
115
Table 4.18 shows, after adding 0.5% steel fibre, the first crack strength of the geopolymer
concrete increases by 1.5 – 3.5 times compared to the corresponding mixes of OPSGC
without fibre. The steel fibres were found highly effective in preventing the growth of
micro-cracks and diminishing the propagation of these cracks before the cracks joined up
to form macro-cracks. The first crack impact strength of uncrushed OPS mixes were
found higher than that of the crushed OPS mixes. This could be attributed to the low AIV
of uncrushed OPS as these aggregates resist impact due to their shape and orientation of
the aggregate during the impact test (Mo et al., 2014b).
4.10.2 Ultimate impact energy
Table 4.18 and Figure 4.29 show the number of blows and impact energy to cause
specimen failure under impact test. The impact ductile index (µi), is defined as the ratio
of the ultimate and initial impact energies. This ratio offers a good indication to the
ductility of the concrete subjected to impact load. It was found that the ultimate impact
energy of OPSGC and FROPSGC was significantly higher than the first crack impact
energy. The mixes without fibre (OPSGC4-NF-UC, OPSGC6-NF-UC, OPSGC8-NF-UC,
OPSGC4-NF-C, OPSGC6-NF-C, OPSGC8-NF-C) show the increase in the ultimate
impact energy as the OPS content increases (Table 4.18). But in the case of FROPSGC,
the optimum OPS to binder (OPS/b) ratio was found 0.6 (OPSGC6-F-UC, OPSGC6-F-
C). After the formation of the first cracks, the FROPSGC was able to sustain large
amount of impact load before it failed. This could be attributed to the hooked-ends steel
fibres has high tensile strength and also better cohesion due to their hooked-ends (Nia et
al., 2012).
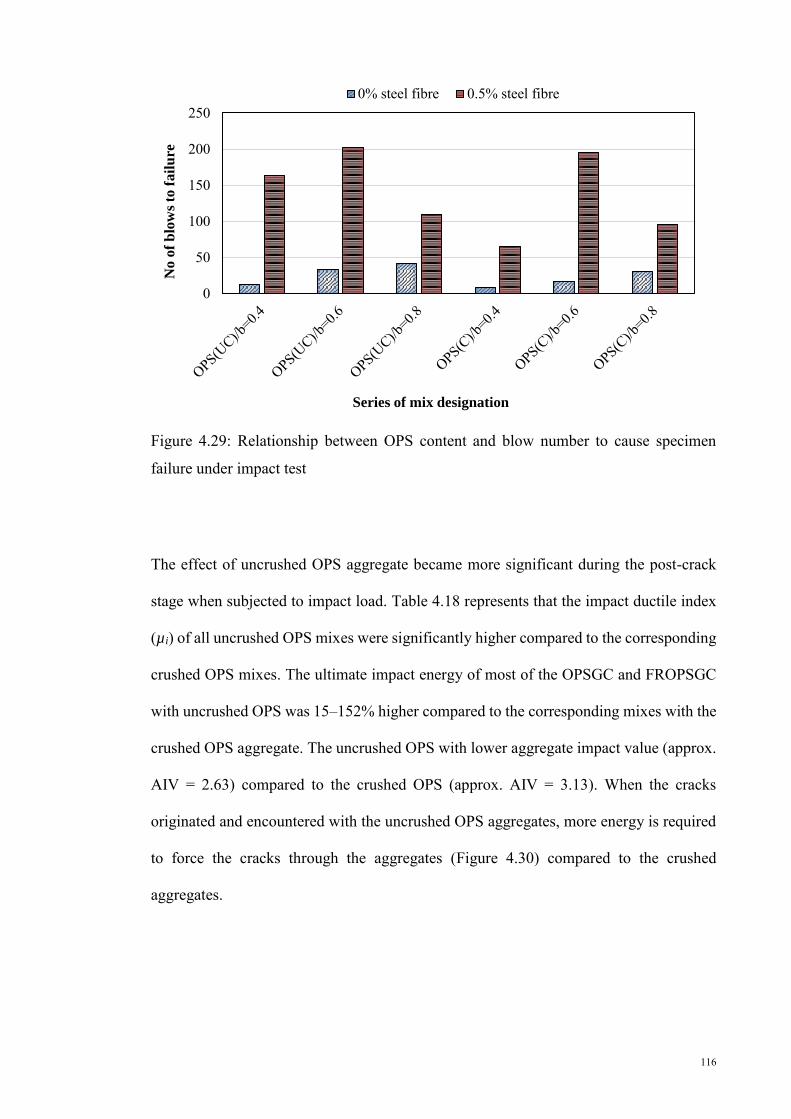
116
Figure 4.29: Relationship between OPS content and blow number to cause specimen
failure under impact test
The effect of uncrushed OPS aggregate became more significant during the post-crack
stage when subjected to impact load. Table 4.18 represents that the impact ductile index
(µi) of all uncrushed OPS mixes were significantly higher compared to the corresponding
crushed OPS mixes. The ultimate impact energy of most of the OPSGC and FROPSGC
with uncrushed OPS was 15–152% higher compared to the corresponding mixes with the
crushed OPS aggregate. The uncrushed OPS with lower aggregate impact value (approx.
AIV = 2.63) compared to the crushed OPS (approx. AIV = 3.13). When the cracks
originated and encountered with the uncrushed OPS aggregates, more energy is required
to force the cracks through the aggregates (Figure 4.30) compared to the crushed
aggregates.
0
50
100
150
200
250
No
of
blo
ws
to f
ail
ure
Series of mix designation
0% steel fibre 0.5% steel fibre

117
Figure 4.30. Origination process of crack through OPS aggregates at late age (Teo et al.,
2006)
The ductility index (µi) of FROPSGC was higher than the corresponding mixes without
fibres by 1.3 – 6.3 times (
Table 4.18). The highest final impact energy of 5945 J was obtained for FROPSGC
(mixes OPSGC6-F-UC) with the combination of the OPS to binder weight ratio of 0.6
and 0.5% steel fibres.
4.10.3 Failure mode
Failure pattern of the OPSGC is shown in Figure 4.31. Two different types of failure
pattern were found in the OPSGC panel specimens. For the plain non-fibrous OPSGC,
the concrete panel broke into four pieces upon failure (Figure 4.31a). The OPSGC lost its
structural integrity and geometry upon reaching the impact energy capacity. Nevertheless
the failure of the FROPSGC was due to perforation of the panels by the drop weight
hammer and the specimen was not broken into pieces, unlike plane OPSGC panels
(Figure 4.31b). This behaviour indicated that the FROPSGC panels remained structurally
integral, and also ductile. The failure pattern of FROPSGC also shows with a significant
number of secondary cracks.
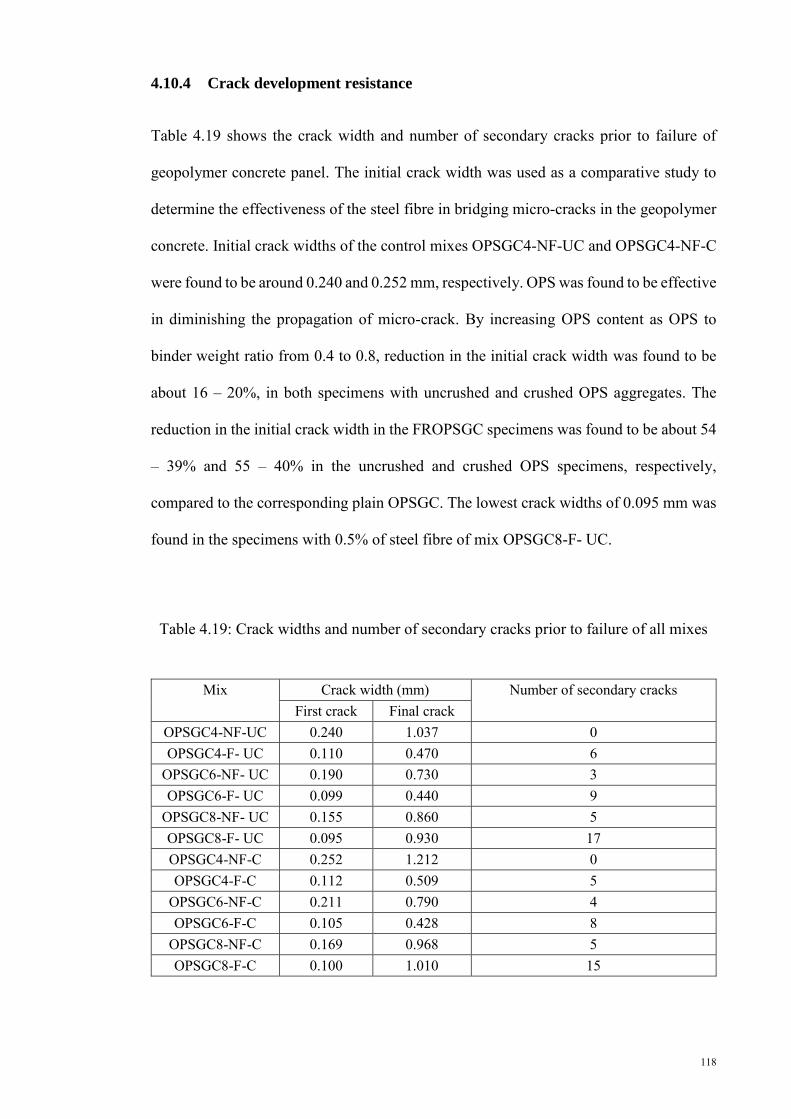
118
4.10.4 Crack development resistance
Table 4.19 shows the crack width and number of secondary cracks prior to failure of
geopolymer concrete panel. The initial crack width was used as a comparative study to
determine the effectiveness of the steel fibre in bridging micro-cracks in the geopolymer
concrete. Initial crack widths of the control mixes OPSGC4-NF-UC and OPSGC4-NF-C
were found to be around 0.240 and 0.252 mm, respectively. OPS was found to be effective
in diminishing the propagation of micro-crack. By increasing OPS content as OPS to
binder weight ratio from 0.4 to 0.8, reduction in the initial crack width was found to be
about 16 – 20%, in both specimens with uncrushed and crushed OPS aggregates. The
reduction in the initial crack width in the FROPSGC specimens was found to be about 54
– 39% and 55 – 40% in the uncrushed and crushed OPS specimens, respectively,
compared to the corresponding plain OPSGC. The lowest crack widths of 0.095 mm was
found in the specimens with 0.5% of steel fibre of mix OPSGC8-F- UC.
Table 4.19: Crack widths and number of secondary cracks prior to failure of all mixes
Mix Crack width (mm) Number of secondary cracks
First crack Final crack OPSGC4-NF-UC 0.240 1.037 0 OPSGC4-F- UC 0.110 0.470 6
OPSGC6-NF- UC 0.190 0.730 3 OPSGC6-F- UC 0.099 0.440 9
OPSGC8-NF- UC 0.155 0.860 5 OPSGC8-F- UC 0.095 0.930 17 OPSGC4-NF-C 0.252 1.212 0 OPSGC4-F-C 0.112 0.509 5
OPSGC6-NF-C 0.211 0.790 4 OPSGC6-F-C 0.105 0.428 8
OPSGC8-NF-C 0.169 0.968 5 OPSGC8-F-C 0.100 1.010 15

119
Figure 4.31: (a) Primary cracks in OPSGC panel; and (b) primary and secondary cracks
in FROPSGC panel
The secondary cracks initiated to visible just before to the failure in the FROPSGC
specimens as shown in Figure 4.31b. The plain OPSGC specimens had no secondary
cracks upon failure (Figure 4.31a). The formation of the secondary cracks is an indication
of the effect of fibres in arresting and preventing the crack growth.
120
CHAPTER 5 : CONCLUSIONS AND RECOMMENDATIONS
5.1 Introduction
This chapter presents a summary of the present study, the major conclusions and some
recommendations for future research. The main aim of the study was to develop
appropriate mixture design for mortar and to utilize it for further mixes in concrete; the
mechanical properties of the GGBS-POFA based OPS geopolymer concrete was
investigated. In addition, the effects of three different types of fine aggregate –
conventional mining sand (NS), manufactured sand (MS) and quarry dust (QD), were
studied in two different environment, namely, oven-dry and ambient curing conditions.
Another salient feature of the research was the use of fibres in the OPS geopolymer
concrete (OPSGC) and its effect on mechanical properties and impact resistance. Based
on the experimental investigations, many conclusions could be drawn. The following sub-
sections summarize the conclusions based on the objectives of the research.
5.2 Summary of Conclusions
Based on the experimental work reported in this study, the following conclusions are
drawn:
Objective 1: To develop appropriate mixture design for geopolymer mortar using ground
granulated blastfurnace slag (GGBS), palm oil fuel ash (POFA) and fly ash (FA) as
binder.
The compressive strength of geopolymer mortar increases as the GGBS content
is increased up to 70%. Further increase in GGBS content did not produce desired
effect.

121
The addition of POFA up to 30% with GGBS produced the highest strength and
hence it is recommended for strength beyond 60 MPa.
In most of the specimens 90% of compressive strength of geopolymer mortar was
achieved at 7 days.
The finer particles of GGBS produce dense mix and hence the density of mortar
produced using GGBS resulted in about 8% of density increase.
The use of locally available waste materials such as GGBS, POFA, FA and MS
could be used for development of sustainable construction material.
Objective 2: To study the effect of crushed and uncrushed oil palm shell (OPS) as a coarse
aggregate and three types of sand (mining sand, manufactured sand and quarry dust) in
the geopolymer structural concrete.
The oven-dry densities of all the OPSGC specimens fell within the range of 1900–
1935 kg/m3 and hence fulfilled the requirement for LWC as stipulated in EN206–
1.
The use of manufactured sand as an ideal replacement for the conventional sand
is recommended.
The mixture contained quarry dust produced slightly lower strength compared to
natural sand and manufactured sand.
The OPSGC specimens prepared using crushed OPS aggregate produced lower
slump values compared to those specimens prepared using uncrushed OPS
aggregate due to the high mortar demand.
The OPSGC prepared using crushed OPS aggregate produced slightly higher
compressive strength of about 7–14% and 3–7% cured in OD and AD,
respectively, compared to the corresponding mixes prepared using uncrushed OPS
aggregate.

122
The splitting tensile and flexural strength of POFA-GGBS based geopolymer
concrete is about 6–9% and 9–11% of the compressive strength, respectively.
The E-value of POFA-GGBS based OPSGC using conventional mining sand was
found 11.12 GPa for cube compressive strength of 32 MPa.
The Poisson’s ratio of OPSGC was found about 0.15 to 0.17.
Objective 3: To investigate the effect of curing on the mechanical properties of
geopolymer concrete.
Most of the specimens of geopolymer concrete reached 90% of the 28-day
compressive strength at 3-day for OD curing, while AD curing specimens reached
57–82%; however, the final strength of AD curing specimens found slightly
higher than the corresponding OD cured specimens at 28-day.
The early strength development of 92–100% and 81–97% of 28-day compressive
strength, respectively, for OD and AD curing at 7 days for both the OPSGC and
NWGC, which points to geopolymerization at an early age. The rate of increase
in compressive strength in the oven-cured specimens after 7 days is not
significant.
As air curing achieved adequate strength in calcium-based geopolymer concrete,
which reduces the energy usage.
POFA-based geopolymer modified with GGBS is found to be a suitable binder
for low to moderate strength or structural grade concrete production at ambient
curing as it eliminates the necessity of heat curing.
Objective 4: To investigate the effect of variation in OPS contents and steel fibre on the
mechanical properties of geopolymer concrete.

123
The density of OPSGC decreases as the OPS content increases.
The compressive strength of OPSGC decreases as the OPS content increases.
The addition of 0.5% of steel fibre on volume of concrete increases the density of
OPSGC about 2–3%. The rate of reduction in density for OPSGC with crushed
OPS is similar to that of uncrushed OPS.
When fibres were added, the OPSGC with crushed OPS produced the compressive
strength close to that of uncrushed OPS. In general, the addition of fibres slightly
improves the compressive strength of concrete.
The rate of early strength (3- and 7-day) of OPSGC is higher compared to NWGC,
both in fibrous and non-fibrous specimens.
The splitting tensile and flexural strength of geopolymer concrete increases with
the increases of compressive strength.
The splitting tensile strength OPSGC prepared using uncrushed OPS aggregate
produced about 6–12% higher compared to the corresponding mixes prepared
using crushed OPS aggregate at 28-day.
The flexural strength is about 33–35% higher than splitting tensile strength.
The compressive strength of FROPSGC is close to the non-fibrous plane OPSGC.
The addition of 0.5% steel fibres enhanced the splitting tensile and flexural
strength of POFA-GGBS based OPSGC by about 19–38% and 13–44%,
respectively compared to the non-fibrous OPSGC.
The addition of 0.5% steel fibres in OPSGC does not have a significant effect on
the (E) value.
Objective 5: To study the impact behaviour of the fibre reinforced geopolymer concrete
panels with crushed and uncrushed OPS and varying OPS contents.
124
The effect of steel fibre in both the impact energy and the first crack is quite
significant due to brittle nature of LWC.
Though the OPSGC specimens with crushed OPS aggregates produced higher
compressive strength, its impact resistance was lower compared to the
corresponding mixes of the uncrushed OPS aggregates. This could be attributed
to the low AIV of uncrushed OPS as these aggregates resist impact due to their
shape and orientation of the aggregate during the impact test.
All the FROPSGC had higher first crack impact energy compared to the plane
OPSGC due to the micro-crack bridging of the fibres.
All the FROPSGC specimens resisted high impact loads before failure and
produced smaller crack widths, compared to the OPSGC.
The uncrushed OPS aggregate produced higher final impact energy due to its
energy absorption capability compared to the corresponding crushed OPS
specimens. The impact energy distribution in the FROPSGC specimens was
clearly evident due to the formation of more number of secondary cracks in the
specimens.

125
5.3 Recommendations for the future works
In addition to the ongoing pursuit of the goal of developing cost effective with superior
performance of geopolymer concrete, there is a need for further research in the following
areas:
Further study to increase the concrete setting time to mitigate early setting
problem is to be carried out.
The effect of super-plasticizes to improve early setting of POFA-GGBS based
geopolymer concrete has to be investigated.
The mixing procedure to reduce pores in concrete has to be studied.
Since geopolymer concrete is sticky, further study is required to improve uniform
mixing of fibre.
Study on the effectiveness of fibres in reducing shrinkage could be investigated.
Structural behaviour of the GGBS-POFA based concrete has to be investigated.
Composite applications and design parameters using conventional reinforcement
in FROPSGC for structural applications could be investigated.
Fire resistant properties of fibre reinforced composites needs to be studied.
Further investigation on using FESEM, XRD, TGA, DTA and DSC techniques is
suggested to study the microstructure in a more elaborate way.
Long term properties such as fatigue, creep and shrinkage tests on POFA-GGBS
based OPSGC have to be done.
Further study to for housing applications have to be done.
Study on thermal capacity of the GGBS-POFA based concrete has to be
investigated.
126
REFERENCES
ACI 363R-92. (1992). State-of-the-art report on high-strength concrete. ACI committee report 363 (Vol. 363R1–363R55): American Concrete Institute, Detroit, 363R1–
363R55.
Aldahdooh, M. A. A., Muhamad Bunnori, N., & Megat Johari, M. A. (2013). Development of green ultra-high performance fiber reinforced concrete containing ultrafine palm oil fuel ash. Construction and Building Materials, 48(0), 379-389.
Aldred, J., & Day, J. (2012). Is geopolymer concrete a suitable alternative to traditional
concrete? Paper presented at the 37th Conference on our world in concrete & structures, Singapore.
Alengaram, U. J., Al Muhit, B. A., & Jumaat, M. Z. (2013). Utilization of oil palm kernel shell as lightweight aggregate in concrete – A review. Construction and Building
Materials, 38(0), 161-172.
Alengaram, U. J., Jumaat, M. Z., & Mahmud, H. (2008a). Ductility behaviour of reinforced palm kernel shell concrete beams. European Journal of Scientific
Research, 23(3), 406-420.
Alengaram, U. J., Jumaat, M. Z., & Mahmud, H. (2008b). Influence of sand content and
silica fume on mechanical properties of palm kernel shell concrete. Paper presented at the International conference on construction and building technology ICCBT.
Alengaram, U. J., Mahmud, H., & Jumaat, M. Z. (2010a). Comparison of mechanical and bond properties of oil palm kernel shell concrete with normal weight concrete. International Journal of Physical Sciences, 5(8), 1231-1239.
Alengaram, U. J., Mahmud, H., & Jumaat, M. Z. (2011). Enhancement and prediction of modulus of elasticity of palm kernel shell concrete. Materials & Design, 32(4), 2143-2148.
Alengaram, U. J., Mahmud, H., Jumaat, M. Z., & Shirazi, S. M. (2010b). Effect of aggregate size and proportion on strength properties of palm kernel shell concrete. International Journal of the Physical Sciences, 5(12)(12), 1848-1856.
Altwair, N. M., Megat Johari, M. A., & Saiyid Hashim, S. F. (2012). Flexural performance of green engineered cementitious composites containing high volume of palm oil fuel ash. Construction and Building Materials, 37(0), 518-525.
Ariffin, M. A. M., Bhutta, M. A. R., Hussin, M. W., Mohd Tahir, M., & Aziah, N. (2013). Sulfuric acid resistance of blended ash geopolymer concrete. Construction and
Building Materials, 43(0), 80-86.
Ashraf, M. A., Maah, M. J., Yusoff, I., Wajid, A., & Mahmood, K. (2011). Sand mining effects, causes and concerns: a case study from Bestari Jaya, Selangor, Peninsular Malaysia. Scientific Research and Essays, 6(6), 1216-1231.
127
ASTM:C109/C109M-13. (2013). Standard Test Method for Compressive Strength of Hydraulic Cement Mortars (Using 2-in. or [50-mm] Cube Specimen). USA: ASTM International.
ASTM:C227-10. (2010). Standard Test Method for Potential Alkali Reactivity of Cement-Aggregate Combinations (Mortar-Bar Method). Philadelphia, USA: ASTM International.
ASTM:C618-12a. (2008). Standard Specification for Coal Fly Ash and Raw or Calcined Natural Pozzolan for Use as a Mineral Admixture in Concrete. Philadelphia, USA: ASTM International.
ASTM:C 430. (2009). Standard test method for fineness of hydraulic cement by the 45-µm (No. 325) sieve. Philadelphia, USA: ASTM International.
Atiş, C. D., & Bilim, C. (2007). Wet and dry cured compressive strength of concrete
containing ground granulated blast-furnace slag. Building and Environment,
42(8), 3060-3065.
Bagheri, A., & Nazari, A. (2014). Compressive strength of high strength class C fly ash-based geopolymers with reactive granulated blast furnace slag aggregates designed by Taguchi method. Materials & Design, 54(0), 483-490.
Bakharev, T. (2005a). Durability of geopolymer materials in sodium and magnesium sulfate solutions. Cement and Concrete Research, 35(6), 1233-1246.
Bakharev, T. (2005b). Geopolymeric materials prepared using Class F fly ash and elevated temperature curing. Cement and Concrete Research, 35(6), 1224-1232.
Bakharev, T. (2005c). Resistance of geopolymer materials to acid attack. Cement and
Concrete Research, 35(4), 658-670.
Bakharev, T. (2006). Thermal behaviour of geopolymers prepared using Class F fly ash and elevated temperature curing. Cement and Concrete Research, 36(6), 1134-1147.
Bakharev, T., Sanjayan, J. G., & Cheng, Y. B. (1999). Alkali activation of Australian slag cements. Cement and Concrete Research, 29(1), 113-120. doi: Doi 10.1016/S0008-8846(98)00170-7
Basri, H. B., Mannan, M. A., & Zain, M. F. M. (1999). Concrete using waste oil palm shells as aggregate. Cement and Concrete Research, 29(4), 619-622.
Bernal, S., De Gutierrez, R., Delvasto, S., & Rodriguez, E. (2010). Performance of an alkali-activated slag concrete reinforced with steel fibers. Construction and
Building Materials, 24(2), 208-214.
Bogas, J. A., Gomes, M. G., & Gomes, A. (2013). Compressive strength evaluation of structural lightweight concrete by non-destructive ultrasonic pulse velocity method. Ultrasonics, 53(5), 962-972.
BS 146. (1996). Specification for Portland blastfurnace cements (9 ed.). London, UK: BSI.
128
BS 1881-116. (1983). Testing concrete —Part 116: Method for determination of compressive strength of concrete cubes. London: BSI.
BS 6699. (1992). Ground granulated blastfurnace slag for use with Portland cement (2 ed.). London, UK: BSI.
BS 8110-2. (1985). Structural use of concrete- Part 2: Code of practice for special circumstances. London: BSI.
BS EN 12350-2. (2009). Testing fresh concrete Slump-test. London, UK: BSI.
BS EN 12390-3. (2009). Testing hardened concrete. Part 3: Compressive strength of test specimens. London, UK: BSI.
BS EN 12390-7. (2009). Testing hardened concrete Density of hardened concrete: BSI.
BS EN 12504-4. (2004). Testing concrete Determination of ultrasonic pulse velocity. London, UK: BSI.
CEB-FIP. (1993). Model code 1990 (Design Code). London, UK: Thomas Telford.
Celik, T., & Marar, K. (1996). Effects of crushed stone dust on some properties of concrete. Cement and Concrete Research, 26(7), 1121-1130.
Chandra, S., & Berntsson, L. (2002). Lightweight aggregate concrete. Norwich, New York: William Andrew Publishing.
Chen, B., & Liu, J. (2005). Contribution of hybrid fibers on the properties of the high-strength lightweight concrete having good workability. Cement and Concrete
Research, 35(5), 913-917.
Clarke, J. L., editor. (2005). Structural lightweight aggregate concrete (J. L. Clarke Ed.): Taylor & Francis e-Library.
Collins, F. (2010). Inclusion of carbonation during the life cycle of built and recycled concrete: influence on their carbon footprint. The International Journal of Life
Cycle Assessment, 15(6), 549-556.
Davidovits, J. (1994). Geopolymers: Man-made rock geosynthesis and the resulting development of very early high strength cement. Journal of Materials education,
16, 91-139.
Davidovits, J. (2002). 30 Years of successes and failures in geopolymer applications.
Market trends and potential breakthroughs. Paper presented at the Geopolymer 2002 conference., Melbourne, Australia.
Davidovits, J. (2011). Geopolymer chemistry and applications (3 ed.). France: Geopolymer Institute.
EN 206-1. (2000). Concrete - Part 1: Specification, performance, production and conformity: European Committee for Standardization CEN.
ENV 1992–1–1: Part 1. (1991). Design of concrete structures, Part 1 General rules and rules for buildings, Final draft, European Committee for Standardization (Part
129
1C, The use of lightweight concrete with closed structures, to be issued as
ENV 1992–1–4.). Brussels.
Ernst Worrell, Lynn Price, Nathan Martin, Chris Hendriks, & Leticia Ozawa Meida. (2001). Carbondioxide Emissions from the Global Cement Industry (E. Environ., Trans.) (Vol. 26, pp. 303-329). Annu. Rev. Energy Environ., US: Lawrence Berkeley National Laboratory, Berkeley, California 94720.
FIP Manual. (1983). FIP Manual of Lightweight aggregate concrete (2nd ed.). London, UK: Surrey University Press.
Gesoğlu, M., Özturan, T., & Güneyisi, E. (2004). Shrinkage cracking of lightweight
concrete made with cold-bonded fly ash aggregates. Cement and Concrete
Research, 34(7), 1121-1130.
Haque, M. N., Al-Khaiat, H., & Kayali, O. (2004). Strength and durability of lightweight concrete. Cement and Concrete Composites, 26(4), 307-314.
Hardjito, D., & Rangan, B. V. (2005). Development and Properties of Low-Calcium Fly Ash-Based Geopolymer Concrete: Curtin University, Perth, Australia.
Hardjito, D., Wallah, S. E., Sumajouw, D. M., & Rangan, B. V. (2004). On the development of fly ash-based geopolymer concrete. ACI Materials Journal-
American Concrete Institute, 101(6), 467-472.
Huntzinger, D. N., & Eatmon, T. D. (2009). A life-cycle assessment of Portland cement manufacturing: comparing the traditional process with alternative technologies. Journal of Cleaner Production, 17(7), 668-675.
Islam, A., Alengaram, U. J., Jumaat, M. Z., & Bashar, I. I. (2014). The development of compressive strength of ground granulated blast furnace slag-palm oil fuel ash-fly ash based geopolymer mortar. Materials & Design, 56(0), 833-841.
Johari, M. A. M., Zeyad, A. M., Bunnori, N. M., & Ariffin, K. S. (2012). Engineering and transport properties of high-strength green concrete containing high volume of ultrafine palm oil fuel ash. Construction and Building Materials, 30(0), 281-288.
Kanadasan, J., & Razak, H. A. (2014). Mix design for self-compacting palm oil clinker concrete based on particle packing. Materials & Design, 56(0), 9-19.
Khale, D., & Chaudhary, R. (2007). Mechanism of geopolymerization and factors influencing its development: a review. Journal of Materials Science, 42(3), 729-746.
Kosmatka, S. H., Kerkhoff, B., & Panarese, W. C. (2002). Design and control of concrete
mixtures (14 ed.). USA: Portland Cement Association.
Kou, S.-C., & Poon, C.-S. (2013). Effects of different kinds of recycled fine aggregate on properties of rendering mortar. Journal of Sustainable Cement-Based Materials,
UK, 2(1), 43-57. doi: 10.1080/21650373.2013.766400
130
Kroehong, W., Sinsiri, T., Jaturapitakkul, C., & Chindaprasirt, P. (2011). Effect of palm oil fuel ash fineness on the microstructure of blended cement paste. Construction
and Building Materials, 25(11), 4095-4104.
Kupaei, R. H., Alengaram, U. J., Jumaat, M. Z., & Nikraz, H. (2013). Mix design for fly ash based oil palm shell geopolymer lightweight concrete. Construction and
Building Materials, 43(0), 490-496.
Li, C., Sun, H., & Li, L. (2010). A review: The comparison between alkali-activated slag (Si+Ca) and metakaolin (Si+Al) cements. Cement and Concrete Research, 40(9), 1341-1349.
Lim, S. K., Tan, C. S., Lim, O. Y., & Lee, Y. L. (2013). Fresh and hardened properties of lightweight foamed concrete with palm oil fuel ash as filler. Construction and
Building Materials, 46(0), 39-47.
Lloyd, N., & Rangan, B. V. (2010). Geopolymer Concrete with Fly Ash. Paper presented at the Second International Conference on Sustainable Construction Materials and Technologies, Ancona, Italy. http://espace.library.curtin.edu.au/R/?func=dbin-jump-full&object_id=148638&local_base=GEN01-ERA02
Lo, T. Y., Cui, H. Z., & Li, Z. G. (2004). Influence of aggregate pre-wetting and fly ash on mechanical properties of lightweight concrete. Waste Manag, 24(4), 333-338.
Lohani, T., Padhi, M., Dash, K., & Jena, S. (2012). Optimum utilization of Quarry dust as partial replacement of sand in concrete. International Journal of Applied
Science and Engineering Research, 1(2), 391-404.
Malhotra, V. (1999). Making concrete" greener" with fly ash. CONCRETE
INTERNATIONAL-DETROIT-, 21, 61-66.
Malhotra, V. (2002). High-performance high-volume fly ash concrete. CONCRETE
INTERNATIONAL-DETROIT-, 24(7), 30-34.
Mannan, M. A., Alexander, J., Ganapathy, C., & Teo, D. C. L. (2006). Quality improvement of oil palm shell (OPS) as coarse aggregate in lightweight concrete. Building and Environment, 41(9), 1239-1242.
Mannan, M. A., & Ganapathy, C. (2002). Engineering properties of concrete with oil palm shell as coarse aggregate. Construction and Building Materials, 16(1), 29-34.
Mehta, P. K., & Monteiro, P. J. (2006). Concrete: microstructure, properties, and
materials (Vol. 3): McGraw-Hill New York.
Meyer, C. (2009). The greening of the concrete industry. Cement and Concrete
Composites, 31(8), 601-605.
Mijarsh, M. J. A., Megat Johari, M. A., & Ahmad, Z. A. (2014). Synthesis of geopolymer from large amounts of treated palm oil fuel ash: Application of the Taguchi method in investigating the main parameters affecting compressive strength. Construction and Building Materials, 52(0), 473-481.
131
Mo, K. H., Alengaram, U. J., & Jumaat, M. Z. (2014a). Utilization of ground granulated blast furnace slag as partial cement replacement in lightweight oil palm shell concrete. Materials and Structures, 1-12. doi: 10.1617/s11527-014-0336-1
Mo, K. H., Yap, S. P., Alengaram, U. J., Jumaat, M. Z., & Bu, C. H. (2014b). Impact resistance of hybrid fibre-reinforced oil palm shell concrete. Construction and
Building Materials, 50(0), 499-507.
Mohammed, B. S., Al-Ganad, M. A., & Abdullahi, M. (2011). Analytical and experimental studies on composite slabs utilising palm oil clinker concrete. Construction and Building Materials, 25(8), 3550-3560.
Mohammed, B. S., Foo, W. L., & Abdullahi, M. (2014). Flexural strength of palm oil clinker concrete beams. Materials & Design, 53(0), 325-331.
Mohammed, B. S., Foo, W. L., Hossain, K. M. A., & Abdullahi, M. (2013). Shear strength of palm oil clinker concrete beams. Materials & Design, 46(0), 270-276.
Mohammed, M. H., Al-Gburi, M., Al-Ansari, N., Jonasson, J. E., Pusch, R., & Knutsson, S. (2012). Design of concrete mixes by systematic steps and ANN. Journal of
Advanced Science and Engineering Research Vol, 2(4September), 232-251.
Mosley, W. H., & Bungey, J. H. (1990). Reinforced concrete design (4 ed.). London, UK: Macmillan.
MPOB. (2012). Overview of the Malaysian Oil Palm Industry.
Naidu, P. G., Prasad, A. S. S. N., Adiseshu, S., & Satayanarayana, P. V. V. (2012). A study on strength properties of geopolymer concrete with addition of G.G.B.S. International Journal of Engineering Research and Development, 2(4), 19-28.
Nazari, A., & Khalaj, G. (2012). Prediction compressive strength of lightweight geopolymers by ANFIS. Ceramics International, 38(6), 4501-4510.
Neville, A. M. (1995). Properties of concrete (Vol. 4): Longman London.
Newman, J., & Choo, B. S., editors. (2003). Advanced concrete technology constituent
materials: Elsevier Ltd.
Nia, A. A., Hedayatian, M., Nili, M., & Sabet, V. A. (2012). An experimental and numerical study on how steel and polypropylene fibers affect the impact resistance in fiber-reinforced concrete. International journal of impact
engineering, 46(0), 62-73.
Okafor, F. O. (1988). Palm kernel shell as a lightweight aggregate for concrete. Cement
and Concrete Research, 18(6), 901-910.
Pakiam, R. (2013, 04/01/2013). Palm Oil Advances as Malaysia’s Export Tax May Boost
Shipments. Bloomberg. Retrieved from http://www.bloomberg.com/news/2013-01-04/palm-oil-advances-as-malaysia-s-export-tax-may-boost-shipments.html
Pangdaeng, S., Phoo-ngernkham, T., Sata, V., & Chindaprasirt, P. (2014). Influence of curing conditions on properties of high calcium fly ash geopolymer containing Portland cement as additive. Materials & Design, 53(0), 269-274.
132
Phoo-ngernkham, T., Chindaprasirt, P., Sata, V., Hanjitsuwan, S., & Hatanaka, S. (2014). The effect of adding nano-SiO2 and nano-Al2O3 on properties of high calcium fly ash geopolymer cured at ambient temperature. Materials & Design, 55(0), 58-65.
Puertas, F., Amat, T., Fernández-Jiménez, A., & Vázquez, T. (2003). Mechanical and durable behaviour of alkaline cement mortars reinforced with polypropylene fibres. Cement and Concrete Research, 33(12), 2031-2036.
Puligilla, S., & Mondal, P. (2013). Role of slag in microstructural development and hardening of fly ash-slag geopolymer. Cement and Concrete Research, 43(0), 70-80.
Raman, S. N., Ngo, T., Mendis, P., & Mahmud, H. B. (2011). High-strength rice husk ash concrete incorporating quarry dust as a partial substitute for sand. Construction
and Building Materials, 25(7), 3123-3130.
Rao, M. C., Bhattacharyya, S. K., & Barai, S. V. (2011). Behaviour of recycled aggregate concrete under drop weight impact load. Construction and Building Materials,
25(1), 69-80.
Razak, H. A., & Sajedi, F. (2011). The effect of heat treatment on the compressive strength of cement-slag mortars. Materials & Design, 32(8–9), 4618-4628.
Reddy, B. V. V. (2012). Suitability of Manufacture Sand (M-Sand) as fine aggregate in
mortars and concrete. (CSIC project: CP 6597/0505/11-330). India: Indian Institute of Science.
Ryu, G. S., Lee, Y. B., Koh, K. T., & Chung, Y. S. (2013). The mechanical properties of fly ash-based geopolymer concrete with alkaline activators. Construction and
Building Materials, 47(0), 409-418.
Safiuddin, M., Abdus Salam, M., & Jumaat, M. Z. (2011). Utilization of palm oil fuel ash in concrete: a review. Journal of Civil Engineering and Management, UK, 17(2), 234-247.
Sata, V., Jaturapitakkul, C., & Kiattikomol, K. (2004). Utilization of palm oil fuel ash in high-strength concrete. Journal of materials in civil engineering, 16(6), 623-628.
Sata, V., Jaturapitakkul, C., & Rattanashotinunt, C. (2010). Compressive strength and heat evolution of concretes containing palm oil fuel ash. Journal of Materials in
Civil Engineering @ ASCE, USA, 22(10), 1033-1038.
Shafigh, P., Alengaram, U. J., Mahmud, H., & Jumaat, M. Z. (2013a). Engineering properties of oil palm shell lightweight concrete containing fly ash. Materials &
Design, 49, 613-621.
Shafigh, P., Jumaat, M. Z., & Mahmud, H. (2010). Mix design and mechanical properties of oil palm shell lightweight aggregate concrete: A review. International Journal
of the Physical Sciences, 5(14), 2127-2134.
Shafigh, P., Jumaat, M. Z., & Mahmud, H. (2011a). Oil palm shell as a lightweight aggregate for production high strength lightweight concrete. Construction and
Building Materials, 25(4), 1848-1853.
133
Shafigh, P., Jumaat, M. Z., Mahmud, H., & Alengaram, U. J. (2013b). Oil palm shell lightweight concrete containing high volume ground granulated blast furnace slag. Construction and Building Materials, 40(0), 231-238.
Shafigh, P., Jumaat, M. Z., Mahmud, H. B., & Alengaram, U. J. (2011b). A new method of producing high strength oil palm shell lightweight concrete. Materials &
Design, 32(10), 4839-4843.
Shafigh, P., Jumaat, M. Z., Mahmud, H. B., & Hamid, N. A. A. (2012). Lightweight concrete made from crushed oil palm shell: Tensile strength and effect of initial curing on compressive strength. Construction and Building Materials, 27(1), 252-258.
Shafigh, P., Mahmud, H., & Jumaat, M. Z. (2011c). Effect of steel fiber on the mechanical properties of oil palm shell lightweight concrete. Materials & Design, 32(7), 3926-3932.
Shetty, M. (2005). Concrete technology: theory and practice. New Delhi, India: S. Chand & Company Ltd.
Short, A., & Kinniburgh, W. (1978). Lightweight concrete (3rd ed.). London: Applied Science Publishers.
Smadi, M., & Migdady, E. (1991). Properties of high strength tuff lightweight aggregate concrete. Cement and Concrete Composites, 13(2), 129-135.
Solís-Carcaño, R., & Moreno, E. I. (2008). Evaluation of concrete made with crushed limestone aggregate based on ultrasonic pulse velocity. Construction and Building
Materials, 22(6), 1225-1231.
Sreenivasa, G. ( 2012). Use of manufactured sand in concrete and construction an alternate to river sand. NBMCW, India.
Tangchirapat, W., Jaturapitakkul, C., & Chindaprasirt, P. (2009). Use of palm oil fuel ash as a supplementary cementitious material for producing high-strength concrete. Construction and Building Materials, 23(7), 2641-2646.
Tangchirapat, W., Khamklai, S., & Jaturapitakkul, C. (2012). Use of ground palm oil fuel ash to improve strength, sulfate resistance, and water permeability of concrete containing high amount of recycled concrete aggregates. Materials & Design,
41(0), 150-157.
Teo, D. C. L., Mannan, M. A., & Kurian, V. J. (2006). Structural concrete using oil palm shell (OPS) as lightweight aggregate. Turkish Journal of Engineering and
Environmental Sciences, 30(4), 251-257.
Tho-in, T., Sata, V., Chindaprasirt, P., & Jaturapitakkul, C. (2012). Pervious high-calcium fly ash geopolymer concrete. Construction and Building Materials, 30(0), 366-371.
Turner, L. K., & Collins, F. G. (2013). Carbon dioxide equivalent (CO2-e) emissions: A comparison between geopolymer and OPC cement concrete. Construction and
Building Materials, 43(0), 125-130.
134
UNEP. (2012). 21 issues for the 21st Century: results of the UNEP Foresight Process on Emerging Environmental issues (pp. 56). Nairobi, Kenya.
Wallah, S. E., & Rangan, B. V. (2006). Low-Calcium Fly Ash-Based Geopolymer Concrete: Long-Term Properties. Perth, Australia: Curtin University of Technology.
Wong, H. D. (2013, 18 April 2013). Cylinder Strength versus Cube Strength. Paper presented at the Standing Committee on Concrete Technology Annual Concrete Seminar, Hong Kong.
Wongpa, J., Kiattikomol, K., Jaturapitakkul, C., & Chindaprasirt, P. (2010). Compressive strength, modulus of elasticity, and water permeability of inorganic polymer concrete. Materials & Design, 31(10), 4748-4754.
Woolard, C., Petrus, K., & Van der Horst, M. (2000). The use of a modified fly ash as an adsorbent for lead.
Xu, H., & Van Deventer, J. S. J. (2002). Geopolymerisation of multiple minerals. Minerals Engineering, 15(12), 1131-1139.
Yip, C. K., Lukey, G. C., & van Deventer, J. S. J. (2005). The coexistence of geopolymeric gel and calcium silicate hydrate at the early stage of alkaline activation. Cement and Concrete Research, 35(9), 1688-1697.
Yusuf, M. O., Megat Johari, M. A., Ahmad, Z. A., & Maslehuddin, M. (2014a). Evolution of alkaline activated ground blast furnace slag–ultrafine palm oil fuel ash based concrete. Materials & Design, 55(0), 387-393.
Yusuf, M. O., Megat Johari, M. A., Ahmad, Z. A., & Maslehuddin, M. (2014b). Strength and microstructure of alkali-activated binary blended binder containing palm oil fuel ash and ground blast-furnace slag. Construction and Building Materials,
52(0), 504-510.
Zain, M. F. M., Mahmud, H. B., Ilham, A., & Faizal, M. (2002). Prediction of splitting tensile strength of high-performance concrete. Cement and Concrete Research,
32(8), 1251-1258.
Zhang, Z.-h., Yao, X., Zhu, H.-j., Hua, S.-d., & Chen, Y. (2009). Preparation and mechanical properties of polypropylene fiber reinforced calcined kaolin-fly ash based geopolymer. Journal of Central South University of Technology, 16, 49-52.
Zheng, W., Kwan, A., & Lee, P. (2001). Direct tension test of concrete. ACI materials
journal, 98(1), 63–71.
135
LIST OF PUBLICATIONS AND PAPERS PRESENTED
Journal Papers
Islam, A., Alengaram, U. J., Jumaat, M. Z., & Bashar, I. I. (2014). The development of
compressive strength of ground granulated blast furnace slag-palm oil fuel ash-fly
ash based geopolymer mortar. Materials & Design, 56(0), 833-841. (Published)
Bashar, I. I., Alengaram, U. J., Jumaat, M. Z., & Islam, A. (2014). The Effect of Variation
of Molarity of Alkali Activator and Fine Aggregate Content on the Compressive
Strength of the Fly Ash: Palm Oil Fuel Ash Based Geopolymer Mortar. Advances
in Materials Science and Engineering, 2014, 13. (Published)
Conference Papers
Islam, A., Alengaram, U. J., Jumaat, M. Z., & Bashar, I. I. (2014, 24th - 26th November).
Development of geopolymer mortar using palm oil fuel ash-blast furnace slag-fly
ash-as binders. Paper will be presented at the International Conference on
Construction Materials and Structures (ICCMATS), Johannesburg, South Africa.
(Accepted)
Bashar, I. I., Alengaram, U. J., Jumaat, M. Z., & Islam, A. (2014, 24th - 26th November).
The development of sustainable geopolymer mortar from fly ash-palm oil fuel ash
based binder and manufactured sand. Paper will be presented at the International
Conference on Construction Materials and Structures (ICCMATS), Johannesburg,
South Africa. (Accepted)
Bashar, I. I., Islam, A., Alengaram, U. J., & Jumaat, M. Z. (2014, 4th-5th November).
Development of sustainable geopolymer mortar using industrial waste materials.
Paper will be presented at the Conference for Civil Engineering Research Networks
(ConCERN), Bandung, Indonesia. (Abstract accepted)
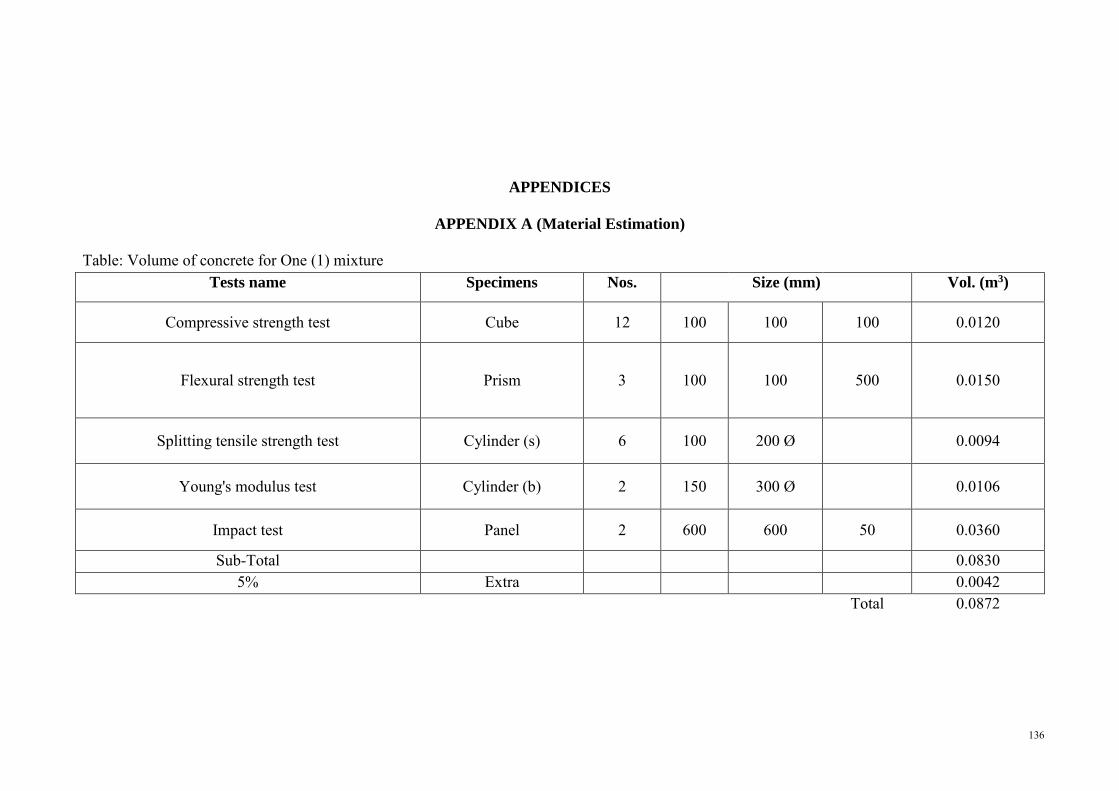
136
APPENDICES
APPENDIX A (Material Estimation)
Table: Volume of concrete for One (1) mixture Tests name Specimens Nos. Size (mm) Vol. (m3)
Compressive strength test Cube 12 100 100 100 0.0120
Flexural strength test Prism 3 100 100 500 0.0150
Splitting tensile strength test Cylinder (s) 6 100 200 Ø 0.0094
Young's modulus test Cylinder (b) 2 150 300 Ø 0.0106
Impact test Panel 2 600 600 50 0.0360
Sub-Total 0.0830 5% Extra 0.0042
Total 0.0872
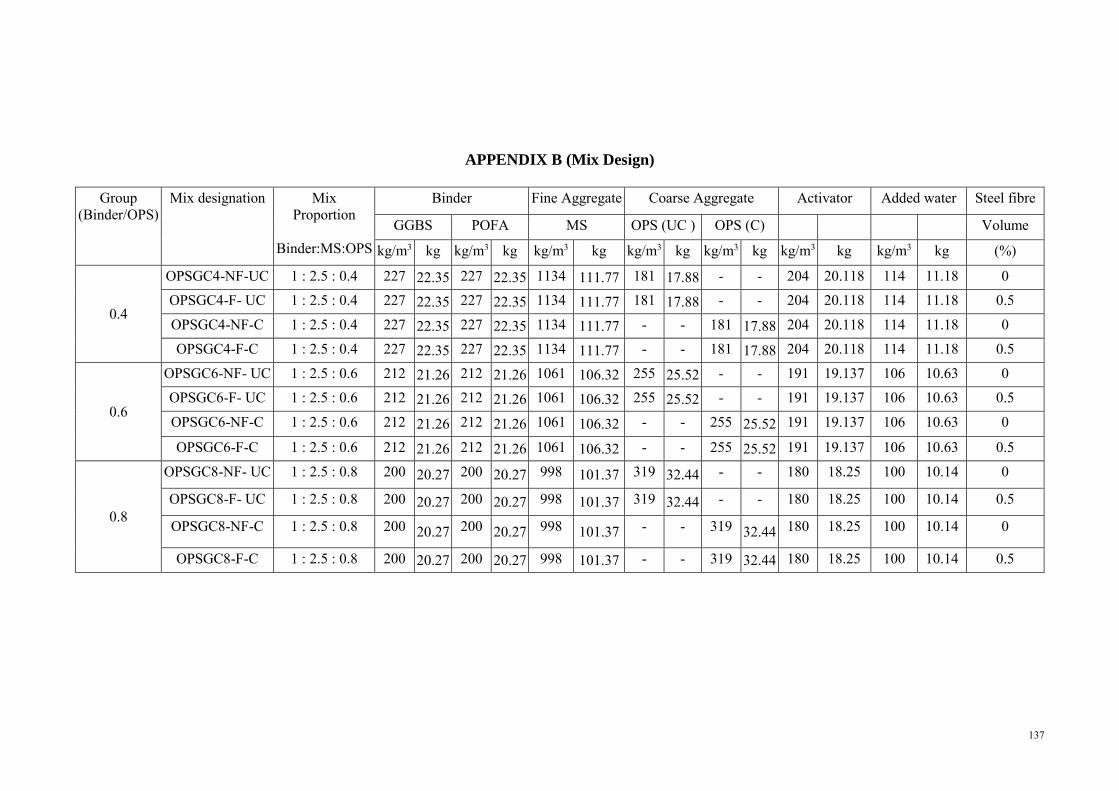
137
APPENDIX B (Mix Design)
Group (Binder/OPS)
Mix designation Mix Proportion
Binder:MS:OPS
Binder Fine Aggregate Coarse Aggregate Activator Added water Steel fibre
GGBS POFA MS OPS (UC ) OPS (C) Volume
kg/m3 kg kg/m3 kg kg/m3 kg kg/m3 kg kg/m3 kg kg/m3 kg kg/m3 kg (%)
0.4
OPSGC4-NF-UC 1 : 2.5 : 0.4 227 22.35 227 22.35 1134 111.77 181 17.88 - - 204 20.118 114 11.18 0
OPSGC4-F- UC 1 : 2.5 : 0.4 227 22.35 227 22.35 1134 111.77 181 17.88 - - 204 20.118 114 11.18 0.5
OPSGC4-NF-C 1 : 2.5 : 0.4 227 22.35 227 22.35 1134 111.77 - - 181 17.88 204 20.118 114 11.18 0
OPSGC4-F-C 1 : 2.5 : 0.4 227 22.35 227 22.35 1134 111.77 - - 181 17.88 204 20.118 114 11.18 0.5
0.6
OPSGC6-NF- UC 1 : 2.5 : 0.6 212 21.26 212 21.26 1061 106.32 255 25.52 - - 191 19.137 106 10.63 0
OPSGC6-F- UC 1 : 2.5 : 0.6 212 21.26 212 21.26 1061 106.32 255 25.52 - - 191 19.137 106 10.63 0.5
OPSGC6-NF-C 1 : 2.5 : 0.6 212 21.26 212 21.26 1061 106.32 - - 255 25.52 191 19.137 106 10.63 0
OPSGC6-F-C 1 : 2.5 : 0.6 212 21.26 212 21.26 1061 106.32 - - 255 25.52 191 19.137 106 10.63 0.5
0.8
OPSGC8-NF- UC 1 : 2.5 : 0.8 200 20.27 200 20.27 998 101.37 319 32.44 - - 180 18.25 100 10.14 0
OPSGC8-F- UC 1 : 2.5 : 0.8 200 20.27 200 20.27 998 101.37 319 32.44 - - 180 18.25 100 10.14 0.5
OPSGC8-NF-C 1 : 2.5 : 0.8 200 20.27 200 20.27 998 101.37 - - 319 32.44 180 18.25 100 10.14 0
OPSGC8-F-C 1 : 2.5 : 0.8 200 20.27 200 20.27 998 101.37 - - 319 32.44 180 18.25 100 10.14 0.5
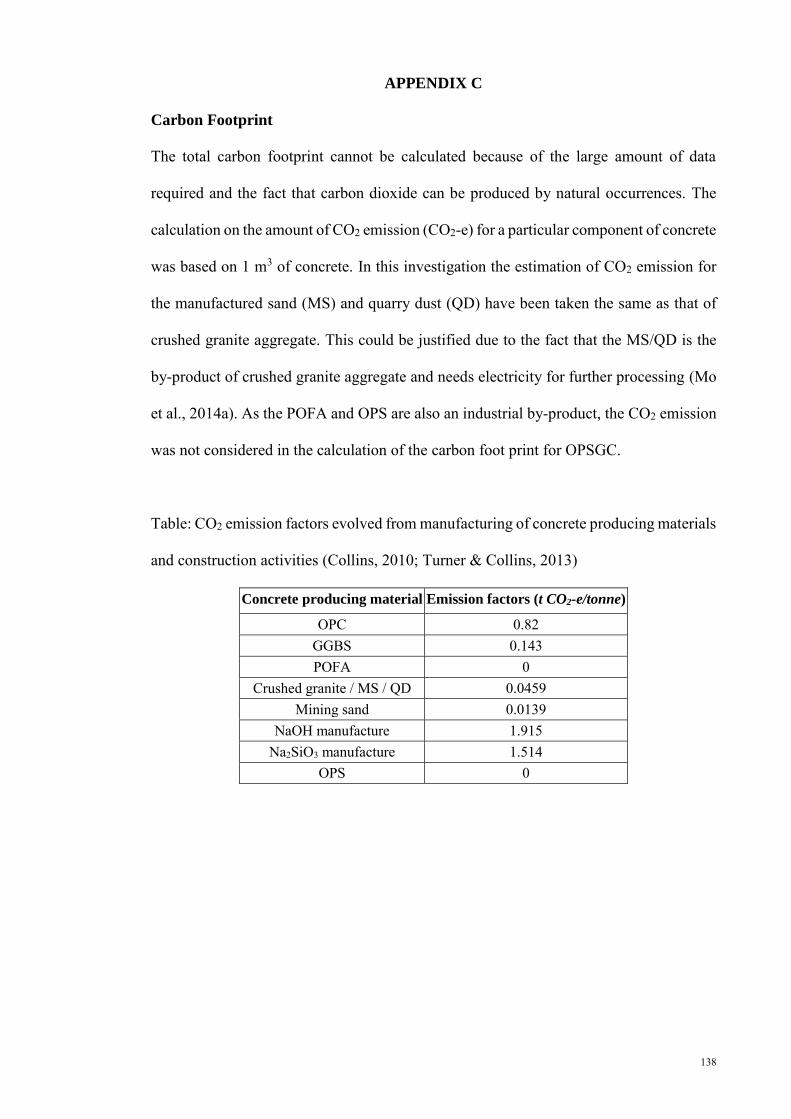
138
APPENDIX C
Carbon Footprint
The total carbon footprint cannot be calculated because of the large amount of data
required and the fact that carbon dioxide can be produced by natural occurrences. The
calculation on the amount of CO2 emission (CO2-e) for a particular component of concrete
was based on 1 m3 of concrete. In this investigation the estimation of CO2 emission for
the manufactured sand (MS) and quarry dust (QD) have been taken the same as that of
crushed granite aggregate. This could be justified due to the fact that the MS/QD is the
by-product of crushed granite aggregate and needs electricity for further processing (Mo
et al., 2014a). As the POFA and OPS are also an industrial by-product, the CO2 emission
was not considered in the calculation of the carbon foot print for OPSGC.
Table: CO2 emission factors evolved from manufacturing of concrete producing materials
and construction activities (Collins, 2010; Turner & Collins, 2013)
Concrete producing material Emission factors (t CO2-e/tonne)
OPC 0.82 GGBS 0.143 POFA 0
Crushed granite / MS / QD 0.0459 Mining sand 0.0139
NaOH manufacture 1.915 Na2SiO3 manufacture 1.514
OPS 0
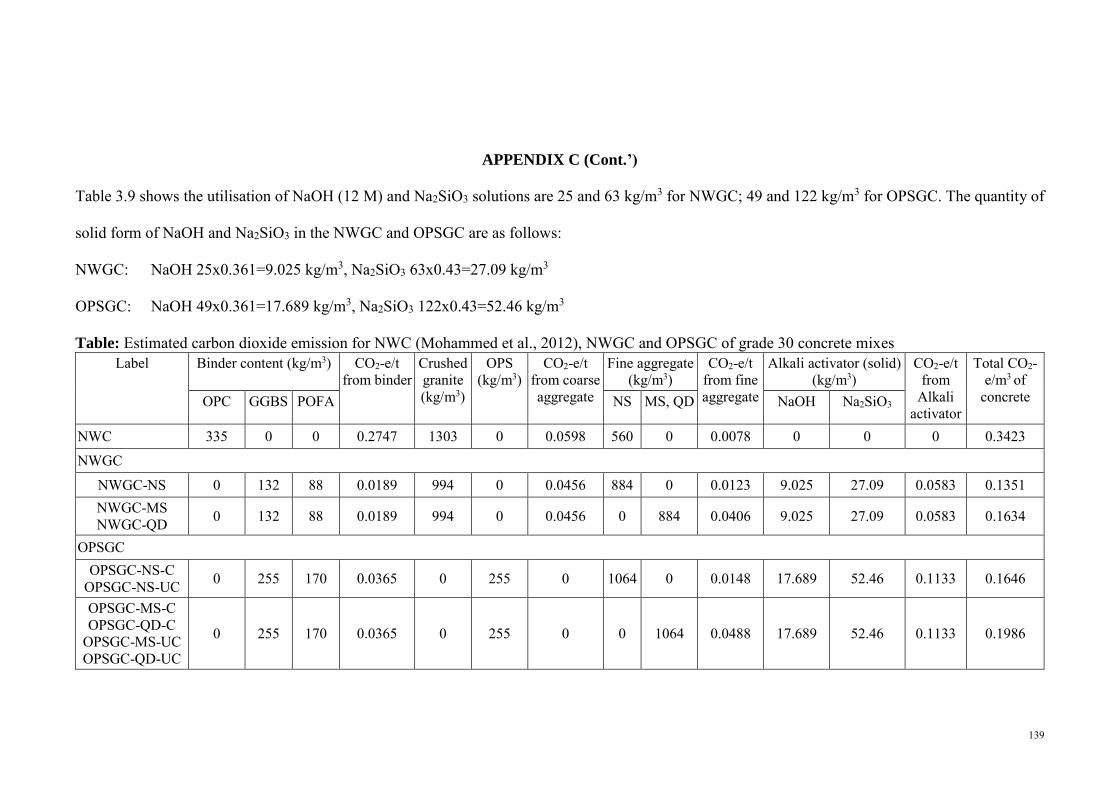
139
APPENDIX C (Cont.’)
Table 3.9 shows the utilisation of NaOH (12 M) and Na2SiO3 solutions are 25 and 63 kg/m3 for NWGC; 49 and 122 kg/m3 for OPSGC. The quantity of
solid form of NaOH and Na2SiO3 in the NWGC and OPSGC are as follows:
NWGC: NaOH 25x0.361=9.025 kg/m3, Na2SiO3 63x0.43=27.09 kg/m3
OPSGC: NaOH 49x0.361=17.689 kg/m3, Na2SiO3 122x0.43=52.46 kg/m3
Table: Estimated carbon dioxide emission for NWC (Mohammed et al., 2012), NWGC and OPSGC of grade 30 concrete mixes Label Binder content (kg/m3) CO2-e/t
from binder Crushed granite (kg/m3)
OPS (kg/m3)
CO2-e/t from coarse aggregate
Fine aggregate (kg/m3)
CO2-e/t from fine aggregate
Alkali activator (solid) (kg/m3)
CO2-e/t from
Alkali activator
Total CO2-e/m3 of
concrete OPC GGBS POFA NS MS, QD NaOH Na2SiO3
NWC 335 0 0 0.2747 1303 0 0.0598 560 0 0.0078 0 0 0 0.3423
NWGC
NWGC-NS 0 132 88 0.0189 994 0 0.0456 884 0 0.0123 9.025 27.09 0.0583 0.1351 NWGC-MS NWGC-QD 0 132 88 0.0189 994 0 0.0456 0 884 0.0406 9.025 27.09 0.0583 0.1634
OPSGC OPSGC-NS-C
OPSGC-NS-UC 0 255 170 0.0365 0 255 0 1064 0 0.0148 17.689 52.46 0.1133 0.1646
OPSGC-MS-C OPSGC-QD-C
OPSGC-MS-UC OPSGC-QD-UC
0 255 170 0.0365 0 255 0 0 1064 0.0488 17.689 52.46 0.1133 0.1986
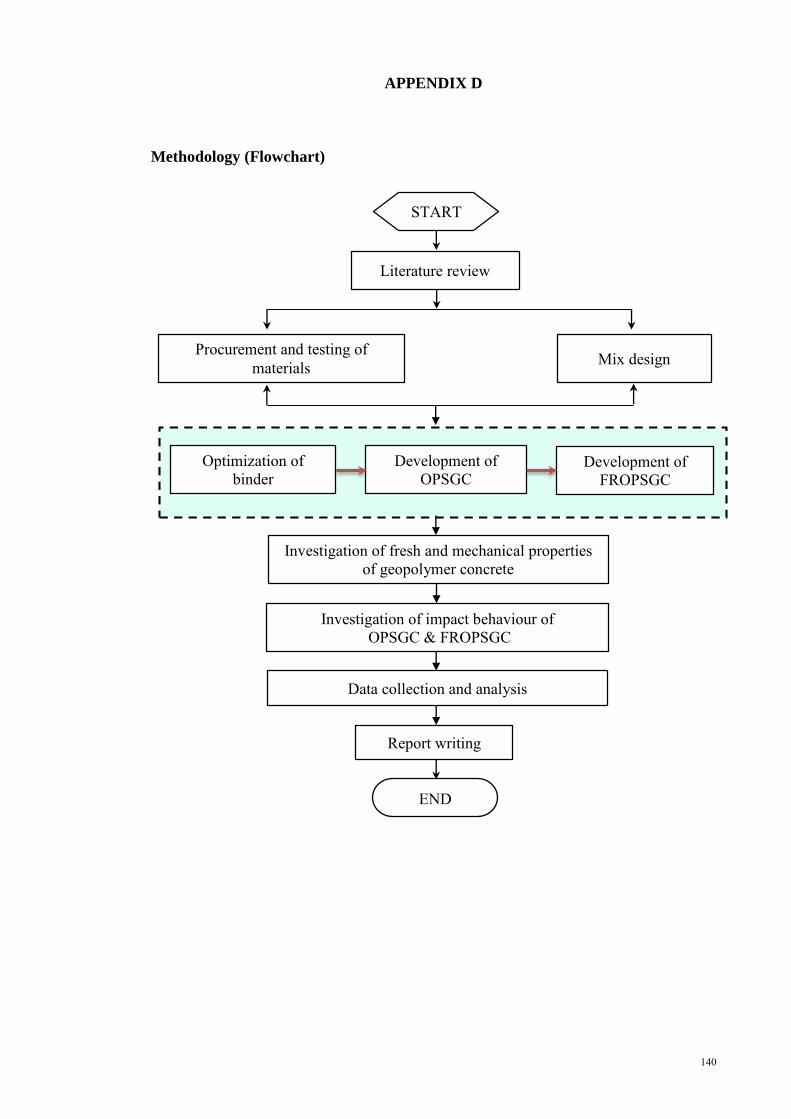
140
APPENDIX D
Methodology (Flowchart)
Literature review
Procurement and testing of
materials
Optimization of
binder Development of
OPSGC
Investigation of fresh and mechanical properties
of geopolymer concrete
Investigation of impact behaviour of OPSGC & FROPSGC
Report writing
Mix design
Development of
FROPSGC
Data collection and analysis
START
END

141
APPENDIX E
POFA collection
OPS
Palm Fruit
Palm Fruit
Manufactured sand
Quarry dust
Concrete specimens
Ambient curing
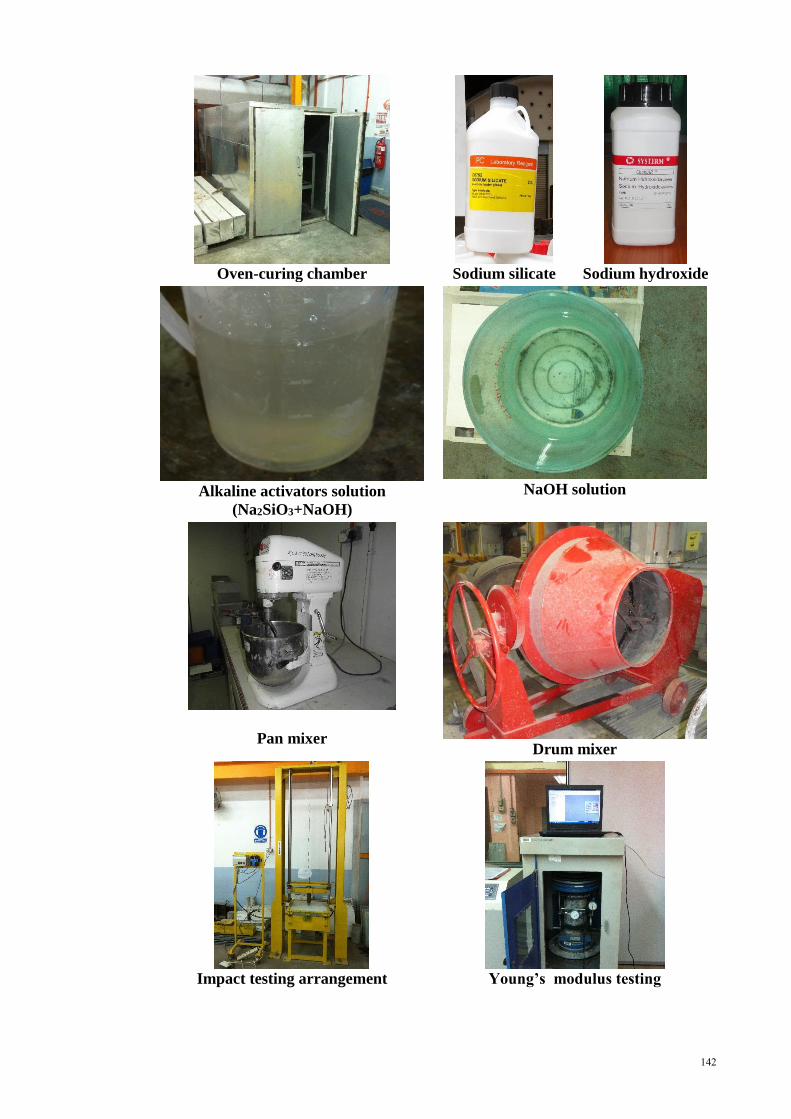
142
Oven-curing chamber
Sodium silicate
Sodium hydroxide
Alkaline activators solution
(Na2SiO3+NaOH)
NaOH solution
Pan mixer Drum mixer
Impact testing arrangement
Young’s modulus testing


