Engineering Properties and Durability Of Concretes Containing ...
12
Engineering Properties and Durability Of Concretes Containing Limestone Cements A.A. Ramezanianpour, E.Ghiasvand, I.Nickseresht, F. Moodi, and M.E. Kamel Concrete Technology and Durability Research Center, Amirkabir University of Technology, Tehran, Iran. E-mail: <[email protected]>, <[email protected]>, <[email protected]>, <[email protected]>, <[email protected]>. ABSTRACT The paper describes the effect of various amounts of LF on compressive strength, water penetration, sorptivity, electrical resistivity and rapid chloride permeability on concretes produced by using a combination of PC and LF at 28, 90 and 180 days. Also, the susceptibility to sulfate attack (Na 2 SO 4 and MgSO 4 ) was studied by measuring the expansion in mortar bars at different ages (according to ASTM C1012 Method). The percentages of LF that replace PC in this research are 0%, 5%, 10%, 15% and 20%. The water/(clinker + Limestone) or (w/b) ratios are 0.37, 0.45 and 0.55 having a constant total binder content of 350kg/m 3 . Generally, results show that the Portland limestone cement (PLC) concretes having up to 10% LF, indicate competitive properties with PC concretes and Portland limestone cement containing 5% LF improve resistance to sulfate attack. INTRODUCTION Cement production and consumption are considered to be important indicators of economic growth. Considering the amount of produced cement, concrete is clearly the most used construction material. The majority of the cementitious binder used in concrete is based on Portland cement clinker which is an energy-intensive process. In addition, it produces a large amount of greenhouse gas emissions, mostly CO 2 , resulted of releasing of CO 2 from limestone in the pyro-processing of clinker. On the other hand, the concrete industry is one of the major consumers of natural resources. In order to reduce energy consumption, CO 2 emission and increase production, cement plants produce blended cements are comprised of supplementary cementitious materials such as slag, natural pozzolan, fly ash and limestone. In recent years Portland limestone cements (PLC) are gaining popularity due to their economical and environmental advantages. Before the 1980s, limestone was assumed as an inert filler. However, the results of recent studies show that calcium carboaluminate hydrates precipitate during the hydration of Portland Limestone Cement (PLC). In addition, there is an interaction between tricalcium silicate (C 3 S) and calcium carbonate (CaCO 3 ); the latter accelerates the hydration of C 3 S and modifies the Ca/Si ratio of C-S-H [Pera et al. 1999]. It is worth noting that limestone does not show pozzolanic properties and, consequently, does not produce C-S-H gel [Sersale K. 1992]. When LF is used in cementitious materials, changes in the capillary porosity occur due to several physical effects such as, dilution effect, filler effect and heterogeneous nucleation [Bonavett et al. 1999 and 2003; Cyr et al. 2006]. The increase in the amount of LF
Transcript of Engineering Properties and Durability Of Concretes Containing ...

Engineering Properties and Durability Of Concretes
Containing Limestone Cements
A.A. Ramezanianpour, E.Ghiasvand, I.Nickseresht, F. Moodi, and M.E. Kamel
Concrete Technology and Durability Research Center, Amirkabir University of Technology,
Tehran, Iran. E-mail: <[email protected]>, <[email protected]>,
<[email protected]>, <[email protected]>, <[email protected]>.
ABSTRACT
The paper describes the effect of various amounts of LF on compressive strength, water
penetration, sorptivity, electrical resistivity and rapid chloride permeability on concretes
produced by using a combination of PC and LF at 28, 90 and 180 days. Also, the
susceptibility to sulfate attack (Na2SO4 and MgSO4) was studied by measuring the expansion
in mortar bars at different ages (according to ASTM C1012 Method). The percentages of LF
that replace PC in this research are 0%, 5%, 10%, 15% and 20%. The water/(clinker +
Limestone) or (w/b) ratios are 0.37, 0.45 and 0.55 having a constant total binder content of
350kg/m3. Generally, results show that the Portland limestone cement (PLC) concretes
having up to 10% LF, indicate competitive properties with PC concretes and Portland
limestone cement containing 5% LF improve resistance to sulfate attack.
INTRODUCTION
Cement production and consumption are considered to be important indicators of economic
growth. Considering the amount of produced cement, concrete is clearly the most used
construction material. The majority of the cementitious binder used in concrete is based on
Portland cement clinker which is an energy-intensive process. In addition, it produces a large
amount of greenhouse gas emissions, mostly CO2, resulted of releasing of CO2 from
limestone in the pyro-processing of clinker. On the other hand, the concrete industry is one of
the major consumers of natural resources. In order to reduce energy consumption, CO2
emission and increase production, cement plants produce blended cements are comprised of
supplementary cementitious materials such as slag, natural pozzolan, fly ash and limestone.
In recent years Portland limestone cements (PLC) are gaining popularity due to their
economical and environmental advantages.
Before the 1980s, limestone was assumed as an inert filler. However, the results of recent
studies show that calcium carboaluminate hydrates precipitate during the hydration of
Portland Limestone Cement (PLC). In addition, there is an interaction between tricalcium
silicate (C3S) and calcium carbonate (CaCO3); the latter accelerates the hydration of C3S and
modifies the Ca/Si ratio of C-S-H [Pera et al. 1999]. It is worth noting that limestone does not
show pozzolanic properties and, consequently, does not produce C-S-H gel [Sersale K.
1992]. When LF is used in cementitious materials, changes in the capillary porosity occur
due to several physical effects such as, dilution effect, filler effect and heterogeneous
nucleation [Bonavett et al. 1999 and 2003; Cyr et al. 2006]. The increase in the amount of LF
cbx054
Text Box
Coventry University and The University of Wisconsin Milwaukee Centre for By-products Utilization, Second International Conference on Sustainable Construction Materials and Technologies June 28 - June 30, 2010, Università Politecnica delle Marche, Ancona, Italy. Special Technical Proceedings ed. P Claisse, E Ganjian, F Canpolat and T Naik ISBN 978-1-4507-1488-4 http://www.claisse.info/Proceedings.htm

involves a decrease in the amount of cement and consequently, an increase in the effective
w/b ratio. The filler effect implies a modification in the initial porosity of the mix, and it
generally produces a decrease in the water required to maintain constant workability.
Heterogeneous nucleation occurs because LF particles act as nucleation sites, increasing the
early hydration of cement and, therefore, producing a more disoriented crystallization of CH
[Irassar 2009]. Most Portland cement specifications allow the use of limestone up to 5%.
Beyond that, Portland limestone cements are categorized based on the percentage of
limestone added to the cement. Portland limestone cements consisting of limestone from 5%
up to 40% are being produced and used in various countries around the world. The new
European Standard (EN 197-1-2000) has permitted up to 5% limestone as a minor additional
constituent and also identifies four types of PLC containing 6–20% limestone (types II/A-L
and II/A-LL) and 21–35% limestone (types II/B-L and II/B-LL), respectively [Bonavetti et
al. 1999]. The ASTM Standard (C150-04) allows up to 5% of limestone filler. The calcium
carbonate (CaCO3) content calculated from the calcium oxide content should be at least 70 %
by mass, so that the requirements of this standard are met [ASTM C 150]. Since 1983, the
Canadian standard has allowed the inclusion of up to 5% limestone addition for Type 10 and
30 Portland cement. There is a similar trend in Latin-American countries such as Argentina,
Brazil, and Mexico [Bonavetti et al. 1999]. For instance, Institute of Standards and Industrial
Research of Iran (ISIRI 4220 - 2005) allows the inclusion of 6% to 20% limestone filler for
PLC [ISIRI 4220].
A very important aspect of concrete durability is the resistance to sulfate attack. It is
generally accepted that conventional sulfate attack in mortars and concretes involves the
formation and the expansive properties of ettringite (3CaO.Al2O3 .3CaSO4.31H2O) and
gypsum (CaSO4.2H2o). [Bonavetti et al. 1999] However, another kind of sulfate attack,
concerning cements and concretes containing limestone and attributed to the formation of
thaumasite (CaSiO3.CaCO3 CaSO4.15H2O), has been widely discussed during the last years.
In this paper, the effect of various amounts of LF on compressive strength, water penetration,
sorptivity, rapid chloride permeability test (RCPT) and electrical resistively in concretes
produced by a combination of PC and LF at 28, 90 and 180 days are investigated. Also,
Expansion of mortar prisms immersed in 5% and 10% Na2SO4 and MgSO4 solutions up to 8
months were monitored.
Experimental program
Material
ASTM C 150 type I Portland cement was used in all the concrete mixtures. Chemical and
physical characteristics of clinker and limestone are shown in Table 1. The limestone should
meet three requirements:
(a) CaCO3 content greater than 75%; (b) clay content, determined with Methylene blue test
(MBA), less than 1.20 g/100 g; and (c) the total organic carbon (TOC) content shall conform
to one of the following criteria:
- LL: shall not exceed 0.20% by mass.
- L: shall not exceed 0.50% by mass [EN 197-1].
The used limestone satisfied all these requirements. For all mix designs, coarse aggregates
were crushed calcareous stone with a maximum size of 19 mm and fine aggregate was natural
sand. The coarse aggregates have a specific gravity and a water absorption of 2510 kg/m3 and
1.90%, respectively, and the fine aggregate has a water absorption of 2.75% and a specific
gravity of 2570 kg/m3. The gradings of the coarse and fine aggregates according to the BS
882 Standard [BS 882] are presented in Fig. 1. The naphthalene-based superplasticizer,

Rheobuild, with a specific gravity of 1200 kg/m3, was employed to achieve the desired
workability in specimens having w/b = 0.37.
Mixture proportion
The concrete production was carried out in a mixer of 60 liters capacity. The percentages of
limestone that replace PC in this research are 0%, 5%, 10%, 15% and 20% that were added to
clinker in the laboratory. All replacements were made by mass. The water:binder (w/b) ratios
were 0.37, 0.45 and 0.55 having a constant total binder (cement + limestone) content of 350
kg/m3. Slump was kept constant at 9 ± 2 cm. The mixture proportions for concrete
specimens are summarized in Table 2.
Fig. 1. The grading of the coarse and fine aggregate.
Table 1. Chemical and physical characteristics of clinker and limestone
Clinker Limestone
Chemical components % Chemical components %
Calcium oxide (CaO) 61.50 Calcium oxide (CaO) 54.77
Silicon dioxide (SiO2) 21.50 Silicon dioxide (SiO2) 1.47
Magnesium oxide (MgO) 4.80 Magnesium oxide (MgO) 0.30
Aluminium oxide (Al2O3) 3.68 Aluminium oxide (Al2O3) 0.22
Ferric oxide (Fe2O3) 2.76 Ferric oxide (Fe2O3) 0.29
Sulphate oxide (SO3) 2.50 Sulphate oxide (SO3) 0.06
Potassium oxide (K2O) 0.95 Potassium oxide (K2O) 0.08
Sodium oxide (Na2O) 0.12 Sodium oxide (Na2O) 0.05
Titanium oxide (TiO2) 0.04 Titanium oxide (TiO2) 0.05
Phosphorus oxide (P2O5) 0.23 Phosphorus oxide (P2O5) 0.01
LOI 1.35 LOI 42.23
Mineralogical composition Chemical characteristics
C3S (%) 51.1 CaCo3 (%) 97.8
C2S (%) 23.1 TOC (%) 0.05
C3A (%) 5.1 MBA (gr/100 gr) 0.07
C4AF (%) 8.4 Moisture Content (%) 0.37
Physical characteristics Physical characteristics
Blaine (cm2/gram) 3200 Blaine (cm
2/gram) 3300
Specific Gravity 3.21 Specific Gravity 2.69

Testing procedure and specimen preparation
Concrete test specimens were vibrated to remove entrapped air. After casting, the concrete
specimens were covered with a wet towel for 24 h and cured under laboratory conditions.
Then, they were demolded and cured in lime-saturated water at 23 ± 2 _C to prevent
possible leaching of Ca (OH)2 from the specimens. Concrete cubes of 100x100x100 mm were
cast. They were tested for compressive strength after 3, 7, 28, 90 and 180 days of water
curing. The water penetration test, is the one specified by BS EN-12390-8:2000 [BS EN-
12390-8]. In this test, 150 mm concrete cubes, after 28, 90 and 180 days of water curing,
were dried under laboratory conditions for 24 h. Water was applied on one face of the
specimen under a pressure of 0.5 MPa. This pressure was maintained constant for a period of
72 h. After the completion of the test, the specimens were taken out and split open into two
halves. The water penetration profile on the concrete surface was then marked and the
maximum depth of water penetration in three specimens was recorded. The sorptivity was
measured on 100 mm3 specimens, which were dried in a 50 _C oven for 14 days. After mass
stabilization, the specimens were coated with the epoxy resin on their lateral surfaces only, in
order to ensure uniaxial water absorption. The specimen was rested on rods to allow free
access of water to the surface and the tap water level was kept no more than 5 mm above the
base of the specimen. The masses of the specimens were measured after 0, 3, 6, 24 and 72 h
of absorption. The sorptivity coefficient (S) according to BS EN-480-5:1997 [BS EN-480-5]
was obtained using the following expression:
tScA
Q
where Q is the amount of water adsorbed; A is the cross section of specimen that was in
contact with water; t is the time (second); c is the constant coefficient;
Table 2: Mix proportions of concrete
Mix w/b LF
(%)
Concrete composition (kg/m3)
SP****
Slump
(mm) L* C
** W
***
Coarse
Agg Fine Agg
A-0 0.37 0 0 350 129.
5 973.9 960 1.1% 80
A-5 0.37 5 17.5 332
.5
129.
5 971.6 960 1.1% 85
A-10 0.37 10 35 315 129.
5 969.6 960 1.1% 90
A-15 0.37 15 52.5 297
.5
129.
5 967.4 960 1.1% 85
A-20 0.37 20 70 280 129.
5 965.3 960 1.1% 80
B-0 0.45 0 0 350 157.
5 912.3 950 - 75
B-5 0.45 5 17.5 332
.5
157.
5 910.2 950 - 80
B-10 0.45 10 35 315 157.
5 908.1 950 - 80
B-15 0.45 15 52.5 297
.5
157.
5 906 950 - 80
B-20 0.45 20 70 280 157.
5 903.9 950 - 75
C-0 0.55 0 0 350 192.
5 740.8 1050 - 95
C-5 0.55 5 17.5 332
.5
192.
5 738.7 1050 - 100
C-10 0.55 10 35 315 192.
5 736.6 1050 - 100
C-15 0.55 15 52.5 297
.5
192.
5 734.5 1050 - 95
C-20 0.55 20 70 280 192.
5 732.4 1050 - 90
* L: Limestone,
** C: Cement,
***W: Water,
****SP: Super plasticizer.

The electrical resistivity meter was used to measure the surface resistivity at the ages of 28,
90 and 180 days. Saturated cylinders (100 _ 200 mm) were used at each test age. The
electrical resistivity test for concretes was carried out by the four-point Wenner array probe
technique. The probe array spacing used was 40 mm. The resistivity measurements were
taken at four quaternary longitudinal locations of the specimen.
The rapid chloride permeability test was conducted in accordance with ASTM C-1202
[ASTM C-1202] at 28, 90 and 180 days. Two specimens of 100 mm in diameter and 50 mm
in thickness conditioned according to the standard were subjected to a 60-V potential for 6 h.
The total charge passed through the concrete specimens was determined and used to evaluate
the chloride permeability of each concrete mixture.
MgSO4 and Na2SO4 solutions of temperature 20±2 ºC with different concentrations 5%
(50g/l) and 10 (100g/l) for investigate the influence of the sulfate attack on the length change
in Prismatic mortar sample were used. The length change due to sulfate attacks was
performed in accordance with ASTM C1012 by using 25× 25×285 mm bars. The pH values
of the solutions were monitored and controlled in the range of 6 and 8, by using 0.1 M
concentrated sulfuric solutions for adjustment. The measurements of length change were
performed up to 8 month by a digital length comparator. Two mortar specimens were tested
for each data.
For scanning electron microscopy studies, selected cement paste samples cured for 3 and 28
days were used. A cement prism was cut into cubes of 10 mm square, one side of which was
ground flat. The hydrated samples were flooded with acetone to stop hydration reactions and
were, eventually, dried and coated with gold.
Results and Discussion
As shown in Table 2, slumps in PLC concretes are greater than in PC concretes. It
demonstrates that there is a reduction of the water demand in PLC concretes. According to
Tsivilis et al. the increase of limestone content to 20% and 35% causes a decrease of the
water demand from 26% to 23.5% and 22.8% [Tsivilis et al. 2002]. Vuk et al. found the
addition of 5% limestone decreased water content for the standard consistency of paste by an
average of 0.5% in absolute scale [Vuk et al. 2001].
Fig. 2 shows the compressive strength of concrete specimens with varying w/b ratios. As
expected, the compressive strength of all concrete specimens increases with the period of
curing and decreases with increasing the w/b ratio. In addition, generally, when limestone is
increased, compressive strength decreases. However, up to 10% limestone replacement is not
significant in this reduction. As a case in point, compressive strength for the C-20 mixture
after 180 days was 23% lower than the C-0 mixture. The maximum compressive strength in
concrete specimens at 180 days was 67.0 MPa corresponding to the A-10 mixture and the
minimum compressive strength was 32.0 MPa corresponding to the C-20 mixture. The
reduction in compressive strength is explained as the result of a clinker dilution effect. The
dilution effect is a consequence of replacing a part of cement by the same quantity of
limestone.
In Portland limestone cements, the filler effect and heterogeneous nucleation react opposite
of the dilution effects. For this reason, there is an optimum limestone replacement for
Portland limestone cements. For lower values, properties of PLC are better than PC and vice
versa. Dhir et al. showed that at equal w/c ratios, with equal cement and water contents, the

strength of concrete mixes was found to decrease with increasing the limestone content,
although differences between PLC concrete containing 15% limestone and PC concrete were
minimal [Dhir et al. 2007].
Table 3 summarizes the results of the water penetration depths in all concrete mixtures. It is
observed from this table that for all concrete mixtures, the water penetration depth increases
with increasing the w/b ratio. The maximum depth of water penetration is 21 mm for the C-
20 mixture after 28 days and the minimum is 8 mm for the A-10 mixture. After 180 days, the
maximum depth of water penetration is 14.5 mm for the C-20 mixture and the minimum is
2.5 mm for the A-10 mixture. The results indicate that PLC concretes containing up to 10%
limestone generally have lower depths of water penetration than PC concretes and PLC
concretes containing more than 10% limestone show greater depths. For example, after 180
days for C series specimens, the depth of water penetration increases from 20% to 45% for
concretes containing 15% and 20% of limestone, respectively. The decrease and increase of
penetration depths are related to the filler effect, heterogeneous nucleation and the dilution
effect respectively.
Fig. 2. The effect of limestone on the compressive strength at various ages.
The results of several studies [Fagerlund et al, 2005; Gonzalez et al, 1999; Persson 2001]
show similar trends. Water transportation in cementitious materials depends on capillary
porosity, its connectivity and the pore structure (tortuosity and constriction or disconnection);
these parameters are directly related to the w/b ratio and the progress of cement hydration.
Irassar [2009] reported for Portland cement pastes with a w/c of 0.40, 0.45 and 0.50, capillary
porosity becomes disconnected when the hydration degree is approximately 0.72, 0.82 and
0.93, respectively. On the other hand, capillary disconnection is very difficult for w/c higher
than 0.60, and impossible for w/c of 0.70. However, for reduction of capillary porosity in
Portland limestone cement paste, a lower w/b is needed with increasing the limestone
replacement. This issue is related to the dilution effect. For example, to obtain the capillary
porosity threshold in pastes made with PLC fully hydrated (α = 1) and w/b ratio of 0.50, 0.45
and 0.40, the maximum percentage of limestone addition will be 5%, 15% and 25%
respectively. In other words, capillary disconnection of cement paste containing 5%, 10%,

20% and 35% limestone will be obtained by using a w/b of approximately 0.50, 0.48, 0.43
and 0.34, respectively [Irassar 2009].
Table 4 shows the influence of the w/b ratio on the sorptivity of concretes containing
different amounts of limestone at the age of 28, 90 and 180 days. It is clear that the w/b ratio
reduction decreases the sorptivity. In all three series (A–C), sorptivity decreases with the
period of curing and increases with limestone replacement. Also, there is no significant
difference between the sorptivity of specimens containing 0% and 5% limestone. For
example, after 180 days, the sorptivity coefficient for the B-20 mixture was 1.6 times as large
as that for the B-0 mixture but this parameter for the B-5 mixture was only 1.02 times as
large as that for the B-0 mixture. Ghrici et al. [2007] showed that incorporation of 15%
limestone into PC diminishes the sorptivity of concrete by 2% and 9% at 28 and 90 days of
age, respectively, for the w/b ratio of 0.6. Also, Tsivilis et al. reported that replacing 15% of
PC with limestone at w/b = 0.7 had an insignificant effect on the sorptivity of concrete
[Tsivilis et al. 2003].
Table 3.The effect of limestone on the water penetration depth (cm) at various
ages
Mix 28 days 90 days 180 days
A - 0 1.1 0.6 0.35
A - 5 0.9 0.65 0.3
A - 10 0.8 0.6 0.25
A - 15 1.05 0.85 0.4
A - 20 1.25 0.95 0.9
B - 0 1.3 0.8 0.55
B - 5 1.2 0.75 0.4
B - 10 1.4 0.85 0.6
B - 15 1.3 1 0.8
B - 20 1.7 1.3 1
C - 0 1.7 1.1 1
C - 5 1.6 1.1 0.9
C - 10 1.8 0.9 1
C - 15 1.9 1.5 1.2
C - 20 2.1 1.75 1.45
The corrosion-resisting performance of concrete is influenced by its electrical resistivity,
which refers to the resistance that an electrical charge experiences while passing through the
concrete. The increased electrical resistivity of concrete hinders the movement of electrons
from the anodic to the cathode regions, and thereby retards the propagation of the corrosion
process. Results obtained from electrical resistivity tests (Table 5) indicate that the electrical
resistivity decreases with increasing the w/b ratio. The electrical resistivity decreased in the B
and C series with increasing limestone replacement. However in the A series, PLC concretes
containing 10% and 20% limestone replacement show maximum and minimum resistivity
values, respectively. The highest value of electrical resistivity is 31.5 kΩ cm for the A-10
mixture after 180 days and the minimum is 15.0 kΩ cm for the C-20 mixture.

Table 4. The effect of limestone on the sorptivity coefficient (10-6
) (m/s0.5
)
at various ages.
Mix 28 days 90 days 180 days A - 0 0.073 0.0553 0.0484 A - 5 0.0772 0.0559 0.0491
A - 10 0.0731 0.0557 0.0501 A - 15 0.0866 0.0647 0.0626 A - 20 0.0944 0.0918 0.0897 B - 0 0.0824 0.0793 0.0773 B - 5 0.088 0.0848 0.079
B - 10 0.1349 0.1063 0.0846 B - 15 0.1466 0.1307 0.1211 B - 20 0.1466 0.1332 0.1236 C - 0 0.1735 0.1327 0.1221 C - 5 0.1732 0.1666 0.1559
C - 10 0.1977 0.1588 0.1503 C - 15 0.2358 0.184 0.1591 C - 20 0.2354 0.1906 0.1797
Table 5. The effect of limestone on the electrical resistivity (kΩ cm) at various
ages
Mix 28 days 90 days 180 days
A - 0 16.7 26.3 30.5
A - 5 18.0 24.0 30.0
A - 10 19.3 28.3 31.5
A - 15 20.5 25.3 29.5
A - 20 16.0 23.3 28.3
B - 0 16.5 20.0 21.7
B - 5 15.0 20.3 20.7
B - 10 14.7 19.7 20.3
B - 15 13.2 20.0 20.0
B - 20 13.9 19.0 20.2
C - 0 12.9 16.8 16.8
C - 5 11.5 16.3 16.3
C - 10 11.0 14.7 15.3
C - 15 11.7 13.7 15.3
C – 20 11.7 14.7 15.0
Table 6. The effect of limestone on the rapid chloride ions permeability
(Coulomb) at various ages
Mix 28 days 90 days 180 days
A - 0 3329 2551 1392
A - 5 3445 2528 1565
A - 10 3027 2311 1525
A - 15 3344 2707 1700
A - 20 3707 2900 1938

B - 0 4842 3905 2150
B - 5 5142 3824 2277
B - 10 4448 3406 2124
B - 15 5154 4003 2747
B - 20 5432 4101 3390
C - 0 5073 4461 3310
C - 5 6151 5225 3965
C - 10 5754 4950 3755
C - 15 4870 4376 3624
C – 20 6171 5625 4125
The results for chloride penetration, measured in terms of the electric charge passed through
the specimens in coulombs, obtained at the age of 28, 90 and 180 days are presented in Table
6. The decrease of the w/b ratio from 0.55 to 0.45 and also from 0.55 to 0.37 significantly
reduces the rapid chloride ion permeability. In the A and B series, the PLC concrete
containing up to 10% limestone and in C series PLC concrete containing up to 15% limestone
indicates suitable performance. Also, in the A series all of the 180 day concrete specimens
are categorized as low chloride permeability, according to the ASTM C1202. Hornain et al.
show that the addition of limestone to neat cement pastes and mortars reduces the diffusion
coefficient of chloride ions. The reduction is attributed to the filler effect on the tortuosity of
the concretes [Hornain et al. 1995]. Ghrici et al. [2007] showed that the penetration of
chloride ion increases in concretes containing 15% limestone. Also, Bonavetti et al. reported
that the penetration of chloride ion increased from 43% to 114% for concretes containing
10% and 20% of limestone, respectively [Bonavetti et al. 2000]. Figs. 3a–d present the results
of expansion of mortars immersed in 5% and 10% Na2SO4 and MgSO4 solutions. As shown
in Fig. 3a–d, the expansion of the mortar containing 20% limestone in all of sulfate solution
is higher than others. Increasing the percentage replacement of limestone and concentration
of sulfate solution tend to increase the expansion due to dilution effect. Overall, the
expansion of mortar under MgSO4 attack in 10% sulfate solution is lower than that under
Na2SO4 attack due to the different mechanisms.
(a) (b)
(c) (d)
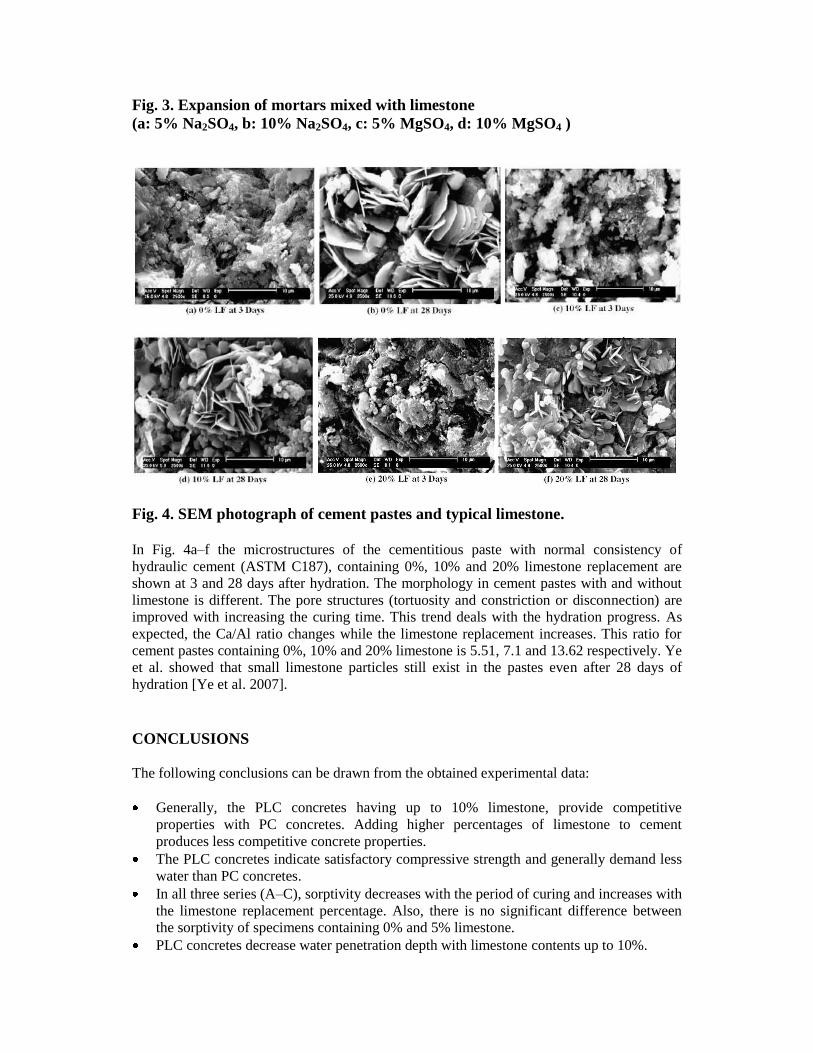
Fig. 3. Expansion of mortars mixed with limestone
(a: 5% Na2SO4, b: 10% Na2SO4, c: 5% MgSO4, d: 10% MgSO4 )
Fig. 4. SEM photograph of cement pastes and typical limestone.
In Fig. 4a–f the microstructures of the cementitious paste with normal consistency of
hydraulic cement (ASTM C187), containing 0%, 10% and 20% limestone replacement are
shown at 3 and 28 days after hydration. The morphology in cement pastes with and without
limestone is different. The pore structures (tortuosity and constriction or disconnection) are
improved with increasing the curing time. This trend deals with the hydration progress. As
expected, the Ca/Al ratio changes while the limestone replacement increases. This ratio for
cement pastes containing 0%, 10% and 20% limestone is 5.51, 7.1 and 13.62 respectively. Ye
et al. showed that small limestone particles still exist in the pastes even after 28 days of
hydration [Ye et al. 2007].
CONCLUSIONS
The following conclusions can be drawn from the obtained experimental data:
Generally, the PLC concretes having up to 10% limestone, provide competitive
properties with PC concretes. Adding higher percentages of limestone to cement
produces less competitive concrete properties.
The PLC concretes indicate satisfactory compressive strength and generally demand less
water than PC concretes.
In all three series (A–C), sorptivity decreases with the period of curing and increases with
the limestone replacement percentage. Also, there is no significant difference between
the sorptivity of specimens containing 0% and 5% limestone.
PLC concretes decrease water penetration depth with limestone contents up to 10%.

The partial replacement of cement with limestone reduces the electrical resistivity of
concrete. However in Series A, PLC concrete containing 10% and 20% limestone
replacement have maximum and minimum values respectively.
Chloride ion permeability is increased considerably when the (w/b) ratio is increased
from 0.37 to 0.55. For the materials in this study, the optimum replacement of limestone
is between 10% and 15%.
Increasing the percentage replacement of limestone and concentration of sulfate solution
tend to increase the expansion due to filler effect.
REFERENCES
Pera Jean, Husson Sophie, Guilhot Bernard. ―Influence of finely ground limestone on cement
hydration". Cement Concrete Comp 1999;21:99–105.
Sersale K. ―Advances in Portland and blended cement". In: Proceeding 9th international
congress of the chemistry of cement, New Delhi, India. vol. I;1992. p. 277–9.
Bonavetti V, Donza H, Rahhal V, Irassar EF. “High strength concrete with limestone filler
cements". In: Malhotra VM et al., editors. “High-performance concrete and performance
and quality of concrete structures", vol.186. Farmington Hill (MI USA): ACI Special
Publication; 1999. p. 567–80.
Bonavetti VL, Donza HA, Menendez G, Cabrera OA, Irassar EF. “Limestone filler cement in
low w/c concrete a rational use of Energy". Cem Concr Res 2003;33(6):865–71.
Cyr M, Lawrence P, Ringot E. “Efficiency of mineral admixtures in mortars:quantification of
the physical and chemical effects of fine admixtures in relation with compressive
strength". Cem Concr Res 2006;36(2):264–77.
Irassar EF. “Sulfate attack on cementitious materials containing limestone filler—A review".
Cem Concr Res 2009;39:241–54.
ASTM C 150-04. “Standard specification for portland cement". Philadelphia (PA): American
Society for Testing and Materials; 2004.
ISIRI 4220. “Lime – Portland cement – specification". Tehran: Institute of Standards and
Industrial Research of Iran; 2005.
EN 197-1. Cement – Part 1. “Composition, specifications and uniformity criteria for common
cements". European Committee for Standardization; 2000.
BS 882. “Specification for aggregates from natural sources for concrete". British Standards
Institution; 1983.
BS EN-12390-8. “Depth of penetration of water under pressure". British Standards
Institution; 2000.
BS EN-480-5. “Tests methods, determination of capillary absorption". British Standards
Institution; 1997.
ASTM C 1202-97. “Standard test method for electrical indication of concrete’s ability to
resist chloride ion penetration". Philadelphia (PA): American Society for Testing and
Materials; 1997.
Tsivilis S, Chaniotakis E, Kakali G, Batis G. “An analysis of the properties of Portland
limestone cements and concrete". Cement Concrete Comp 2002;24:371–8.
Vuk T, Tinta V, Gabrovslek R, Kauclicl V. “The effects of limestone addition, clinker type
and fineness on properties of Portland cement". Cem Concr Res 2001;31:135–9.
Dhir RK, Limbachiya MC, McCarthy MJ, Chaipanich A. “Evaluation of Portland limestone
cements for use in concrete construction". Mater Struct 2007;40:459–73.

Fagerlund G. “Imaginable effects of limestone filler on chloride transport". Lund Institute of
Technology, Division of Building Materials. Lund, Sweden: Lund University. Report
TVBM-7187; 2005.
Gonzalez MA, Rahhal VF, Bonavetti VL, Donza H, Irassar EF. “Effect of curing on early
chloride diffusion of filler cement concrete". In: Swamy RN, editor. Proceedings of the
international conference on infrastructure regeneration and rehabilitation, improving the
quality life through better construction: a vision for the next millennium. UK: Sheffield
Academic Press; 1999. p. 37–148.
Persson B. “Assessment of the chloride migration coefficient, internal frost resistance, salt
frost scaling and sulphate resistance of self-compacting concrete – with some interrelated
properties". Lund, Sweden: Lund Institute of Technology, Division of Building Materials,
Lund University. Report TVBM-3100; 2001.
Ghrici M, Kenai S, Said Mansour M. “Mechanical properties and durability of mortar and
concrete containing natural pozzolana and limestone blended cements". Cement Concrete
Comp 2007;29:542–9.
Tsivilis S, Tsantilas J, Kakali G, Chaniotakis E, Sakellariou A. “The permeability of Portland
limestone cements concrete". Cem Concr Res 2003;33(9):1465–71.
Hornain H, Marchand J, Duhot V, Regourd M. “Diffusion of chloride ions in limestone
filler". Cem Concr Res 1995;25:1667–78.
Bonavetti V, Donza H, Rahhal V, Irassar E. “Influence of initial curing on the properties of
concrete containing limestone blended cement". Cem Concr Res 2000;30(5):703–8.
Ye G, Liu X, De Schutter G, Poppe A-M, Taerwe L. “Influence of limestone powder used as
filler in SCC on hydration and microstructure of cement pastes". Cement Concrete Comp
2007;29:94–102.