Engineering Management Accounting – Lecture 8 Revision.
51
Engineering Management Engineering Management Accounting – Lecture 8 Accounting – Lecture 8 Revision Revision
-
Upload
anastasia-green -
Category
Documents
-
view
217 -
download
2
Transcript of Engineering Management Accounting – Lecture 8 Revision.

Engineering ManagementEngineering ManagementAccounting – Lecture 8Accounting – Lecture 8
RevisionRevision
2
About the examAbout the exam• 2 pm 15/11, Language Centre – but check venue • Structure has changed from last year –
– 20 multiple choice questions on management topics - worth 40% of exam
– Two Accounting questions - each worth 15% of exam– Two Economics questions - each worth 15% of exam
• The exam is worth 70% of the total unit assessment• Previous exam questions/solutions available at
http://www.latrobe.edu.au/eemanage/ will be useful preparation, as well as these revision slides.

3
Accounting for Engineers - becauseAccounting for Engineers - because
• Engineers invariably operate in a managed business environment.
• Accounting provides a means of measuring the viability and performance of organisations.
• Accounting is closely linked to Engineering Economics in that it provides many of the analytical tools and data required for analysis.

4
So what is accounting?So what is accounting?
• “The process of identifying, measuring and communicating economic information to permit informed judgement and decisions by users of the information.”
Bazley et al
5
Financial AccountingFinancial Accounting
“That part of an accounting system that tries to meet the needs of various external users”.
Bazley et al

6
Management AccountingManagement Accounting
“That part of an accounting system that tries to meet the needs of management and internal users”.
Bazley et al

7
TopicsTopics
• Financial Accounting– Profit and Loss Statement– Balance Sheet – Cash Flows
• Capital assets/depreciation• Business Analysis/Ratios• Management Accounting
– Budget Process– Organisation Structure– Product Cost Calculation

8
Balance SheetBalance Sheet(Statement of Financial Position)(Statement of Financial Position)
• Records the financial position of the organisation at a given point in time.

9
Balance Sheet (Statement of Financial Position) as at …
Current Assets
Cash at Bank $8 000
Inventory $1 500
Total Current Assets $9 500
Non-Current Assets
Equipment $5 000
Total Non-Current Assets $5 000
Total Assets $14 500
Current Liabilities
Accounts Payable $4 000
Total Current Liabilities $4 000
Net Assets $10 500
Owner’s Equity
Owner - Capital $10 500

10
Profit and Loss StatementProfit and Loss Statement(Statement of Financial Performance)(Statement of Financial Performance)
Reports receipts and expenditure over the period in question – the accounting period.

11
Example Profit & Loss StatementExample Profit & Loss Statement
Net Sales $ 707,500 Less cost of goods sold $ 340,000Gross Margin (gross profit) $ 367,500 Less operating expenses $ 325,500Net Profit $ 42,000
Note: Tax is calculated on the Net Profit
12
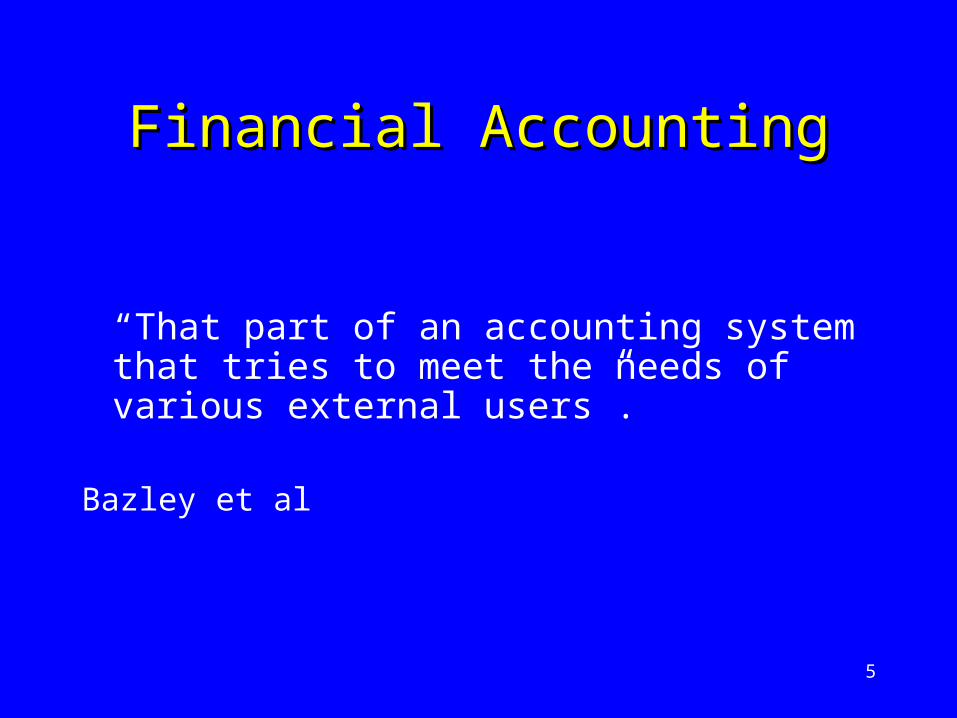
Gross sales $730,500.00Less returns $15,200.00
Less allowances $7,800.00Total: $23,000.00
Net sales $707,500.00Less cost of goods sold $340,000.00
Gross margin (Gross profit) $367,500.00
Less operating expensesMarketing expenses
Advertising $53,000.00Sales salaries $89,000.00
Delivery $18,000.00Total: $160,000.00
Administrative expensesOffice salaries $102,000.00
Office supplies $9,600.00Miscellaneous $4,500.00
Total: $116,100.00
General espensesRent $43,000.00
Miscellaneous $6,400.00Total: $49,400.00
Total operating expenses $325,500.00
Net margin (Net profit) before taxes $42,000.00
Example - Profit & Loss Statement for a Retailer

13
Cash Flow StatementCash Flow Statement
Reports cash flows in and out over the accounting period.
It is an indicator of the organisation’s ability to survive in the short term
14
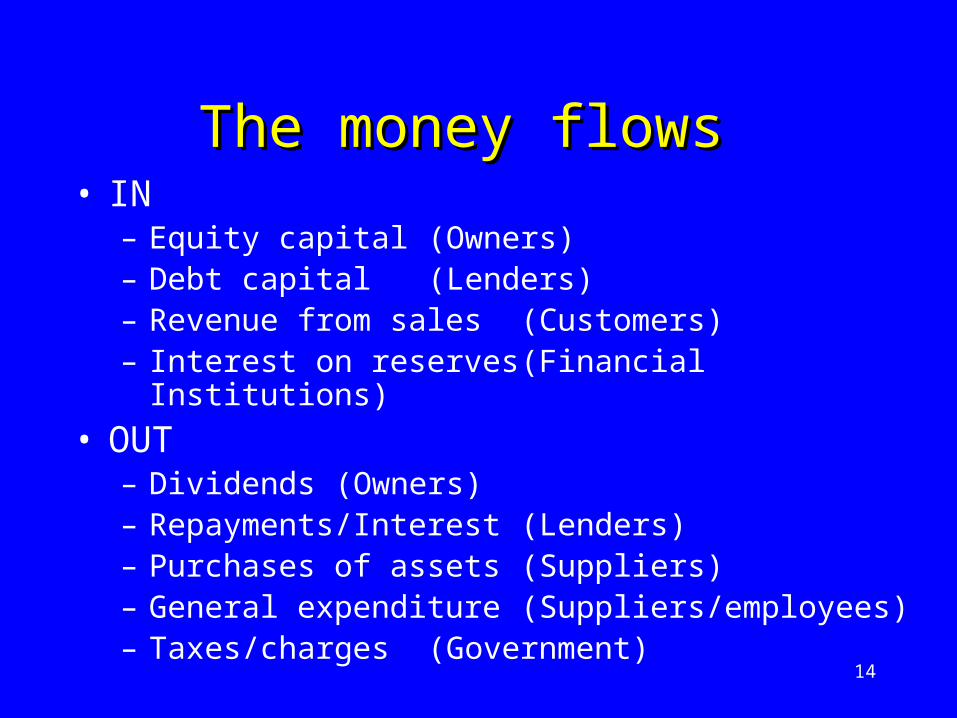
The money flows The money flows • IN
– Equity capital (Owners)– Debt capital (Lenders)– Revenue from sales (Customers)– Interest on reserves (Financial Institutions)
• OUT– Dividends (Owners)– Repayments/Interest (Lenders)– Purchases of assets (Suppliers)– General expenditure (Suppliers/employees)– Taxes/charges (Government)
15
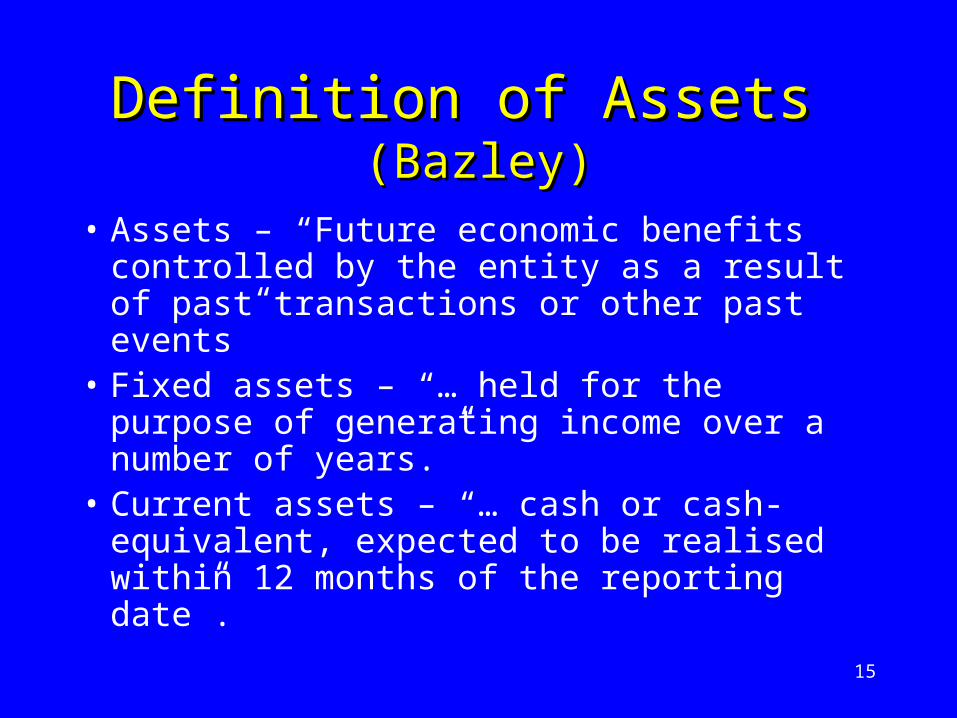
Definition of Assets Definition of Assets (Bazley)(Bazley)
• Assets – “Future economic benefits controlled by the entity as a result of past transactions or other past events”
• Fixed assets – “… held for the purpose of generating income over a number of years.”
• Current assets – “… cash or cash-equivalent, expected to be realised within 12 months of the reporting date”.

16
Types of AssetsTypes of Assets• Fixed Assets
– Buildings
– Plant
– Equipment
• Current Assets– Stock (inventory)
– Cash on hand
– Accounts receivable
– Short-term investments
• Intangible assets e.g. patents, goodwill

17
Other ExpenditureOther Expenditure• Salaries and wages• Rent and other building-related expenses• Insurance• Taxes and charges • Marketing and advertising• Communications• Motor vehicles and travelling• Entertainment
18
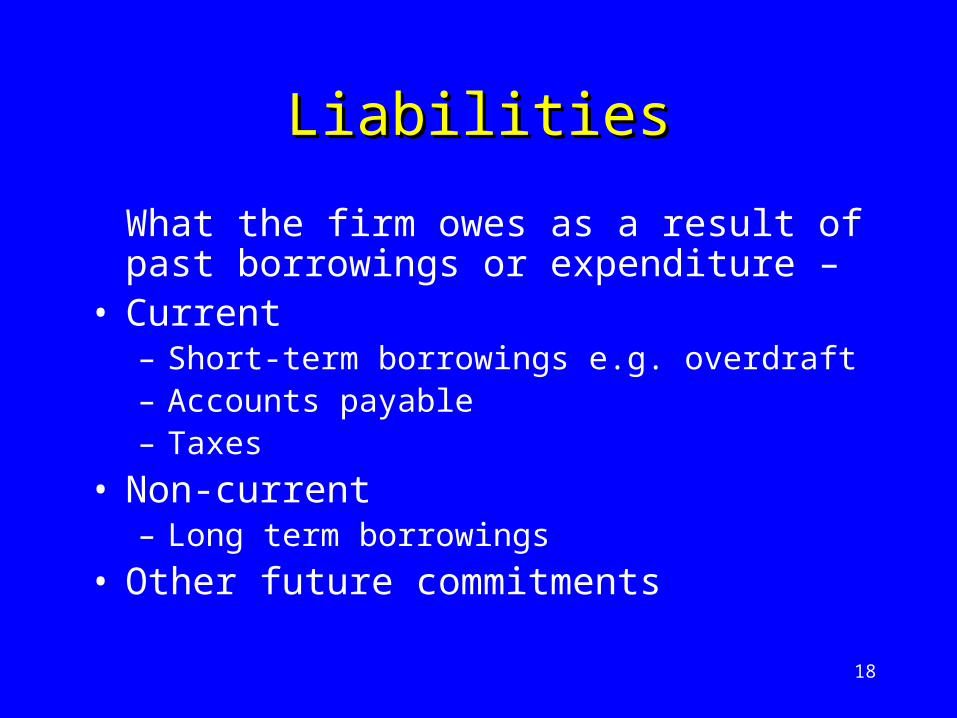
LiabilitiesLiabilities
What the firm owes as a result of past borrowings or expenditure –
• Current– Short-term borrowings e.g. overdraft– Accounts payable– Taxes
• Non-current– Long term borrowings
• Other future commitments

19
Owners Equity or Net WorthOwners Equity or Net Worth= =
Assets - LiabilitiesAssets - Liabilities

20
Why capitalise/depreciate?Why capitalise/depreciate?
• Capital assets have an estimated useful lifetime.• Consequently, it would be misleading to account
for the associated expenditure in just one accounting period.
• As a result, the expenditure is accounted for over the asset’s lifetime through depreciation.
• This also provides a basis for valuing the asset.• ATO requires that the asset expense deduction is
claimed over the asset’s lifetime.
21
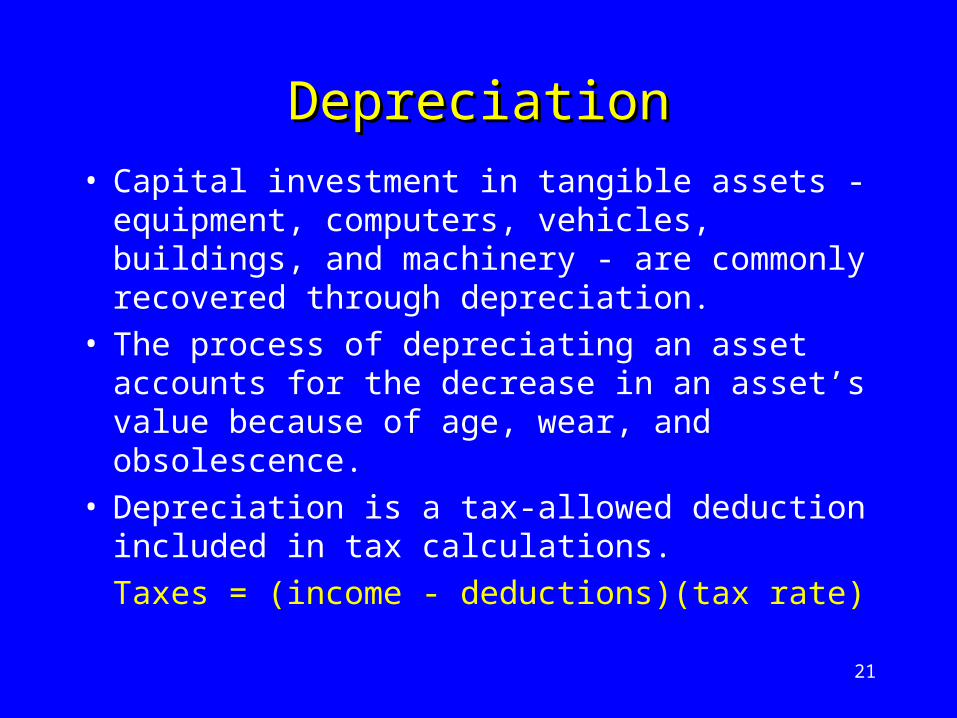
DepreciationDepreciation
• Capital investment in tangible assets - equipment, computers, vehicles, buildings, and machinery - are commonly recovered through depreciation.
• The process of depreciating an asset accounts for the decrease in an asset’s value because of age, wear, and obsolescence.
• Depreciation is a tax-allowed deduction included in tax calculations.
Taxes = (income - deductions)(tax rate)
22
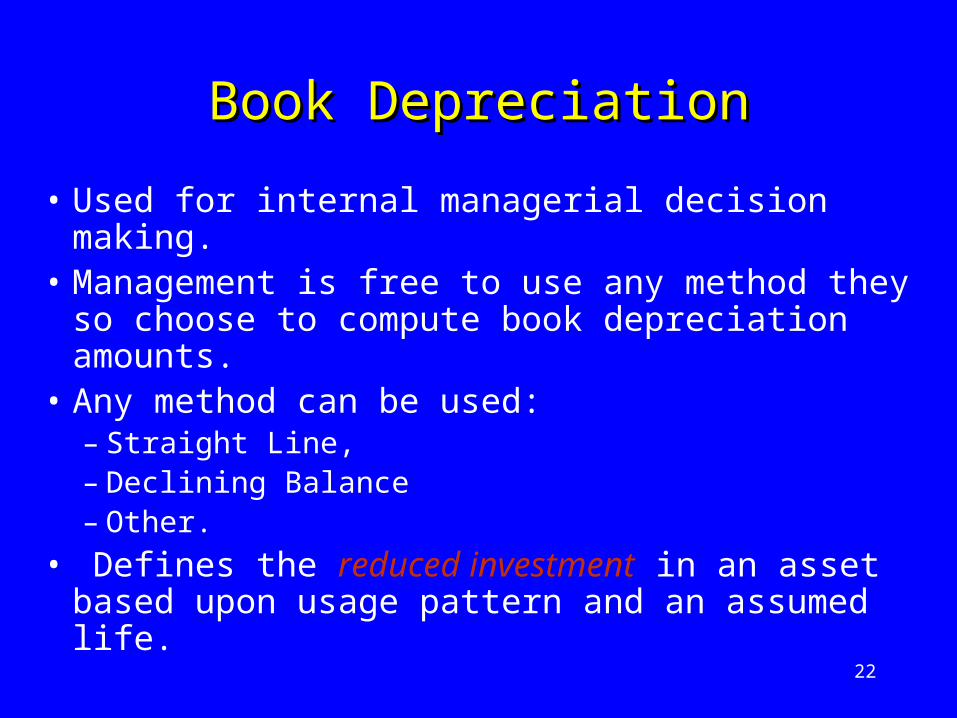
Book DepreciationBook Depreciation
• Used for internal managerial decision making.• Management is free to use any method they so
choose to compute book depreciation amounts.• Any method can be used:
– Straight Line,– Declining Balance– Other.
• Defines the reduced investment in an asset based upon usage pattern and an assumed life.
23
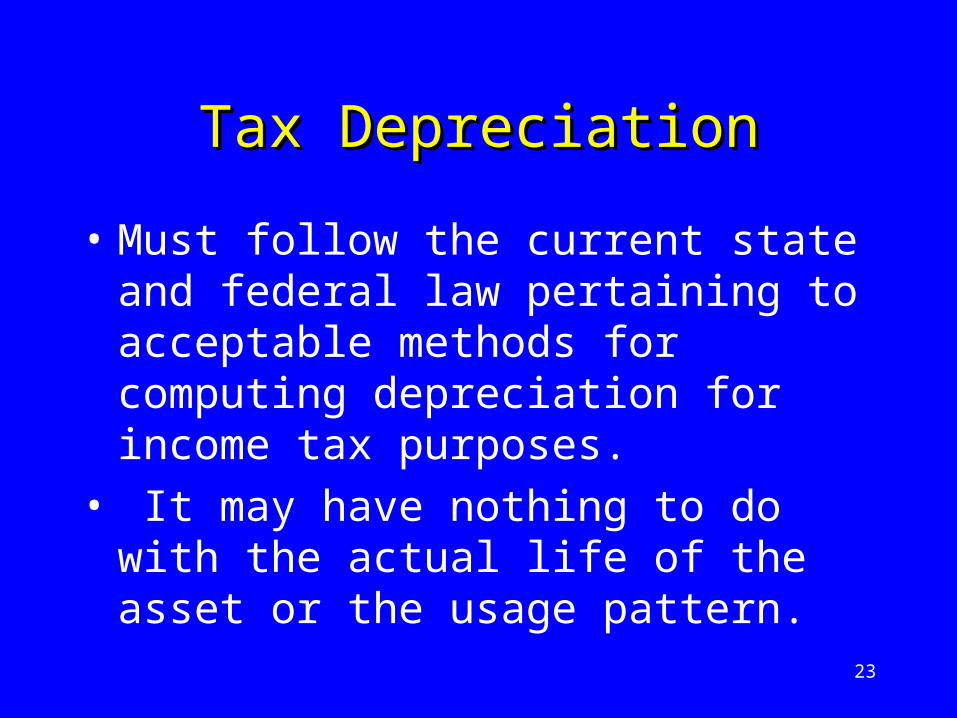
Tax DepreciationTax Depreciation
• Must follow the current state and federal law pertaining to acceptable methods for computing depreciation for income tax purposes.
• It may have nothing to do with the actual life of the asset or the usage pattern.
24
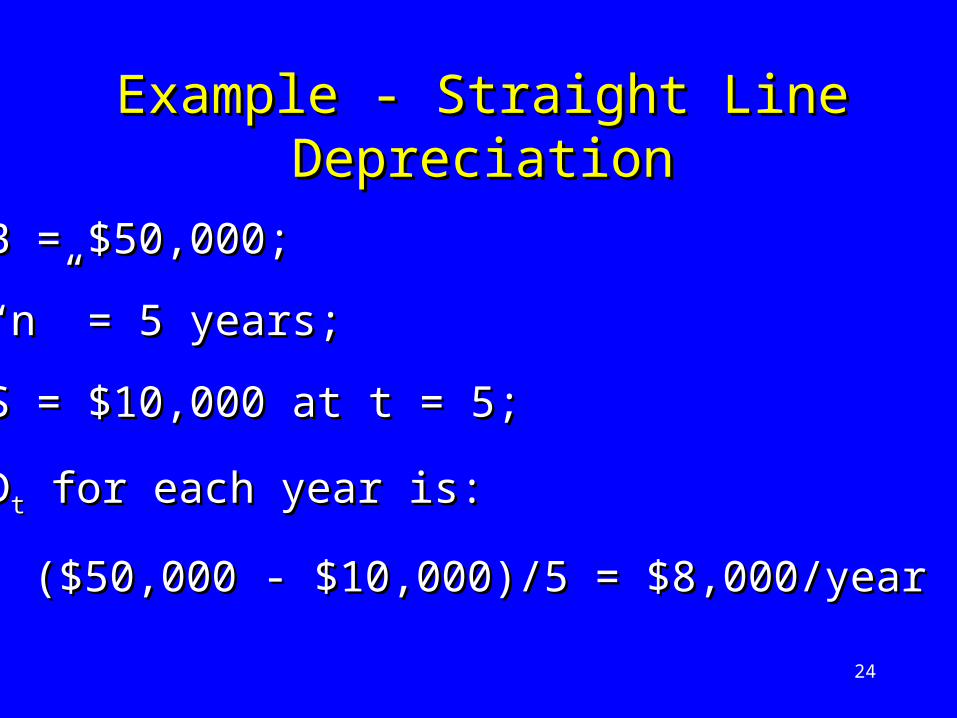
Example - Straight Line DepreciationExample - Straight Line Depreciation
B = $50,000;B = $50,000;
““n” = 5 years;n” = 5 years;
S = $10,000 at t = 5;S = $10,000 at t = 5;
DDtt for each year is: for each year is:
($50,000 - $10,000)/5 = $8,000/year($50,000 - $10,000)/5 = $8,000/year
25
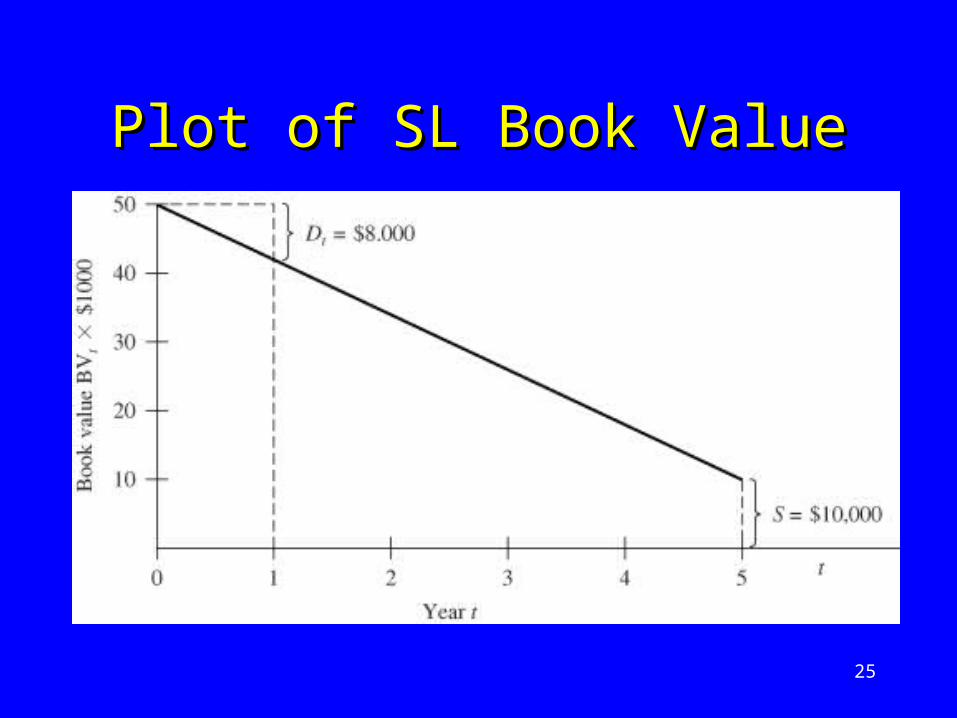
Plot of SL Book ValuePlot of SL Book Value
26
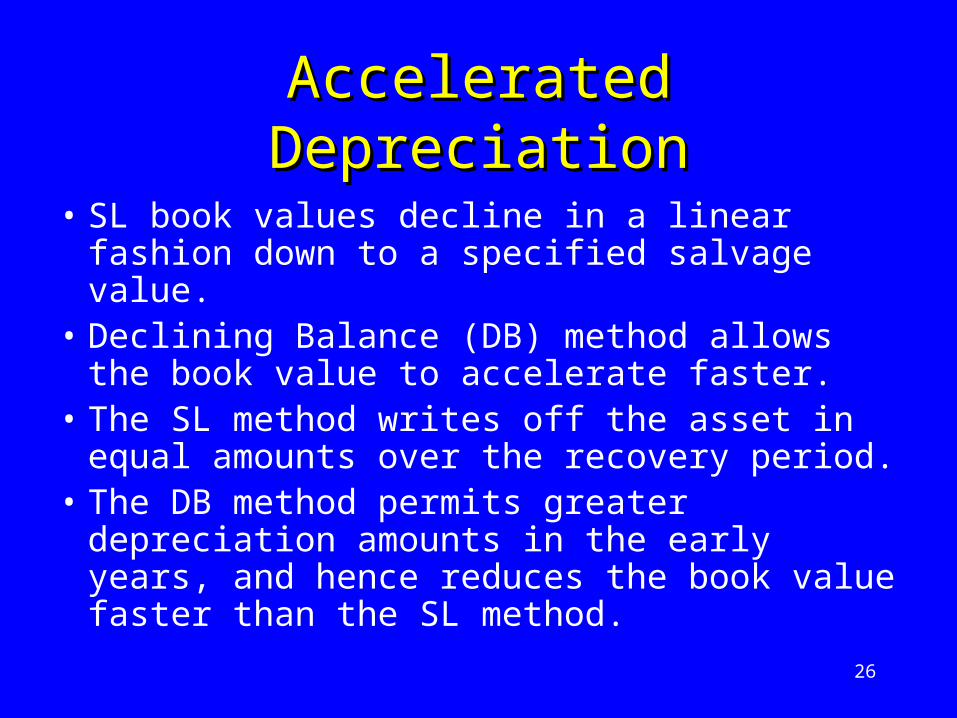
Accelerated DepreciationAccelerated Depreciation
• SL book values decline in a linear fashion down to a specified salvage value.
• Declining Balance (DB) method allows the book value to accelerate faster.
• The SL method writes off the asset in equal amounts over the recovery period.
• The DB method permits greater depreciation amounts in the early years, and hence reduces the book value faster than the SL method.
27
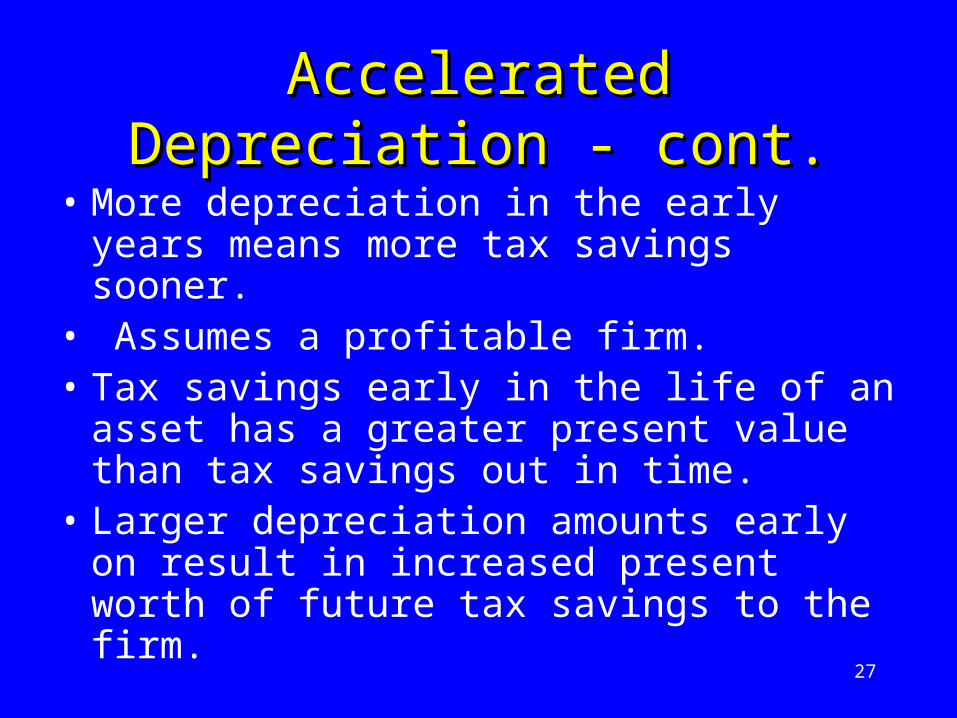
Accelerated Depreciation - cont.Accelerated Depreciation - cont.
• More depreciation in the early years means more tax savings sooner.
• Assumes a profitable firm.• Tax savings early in the life of an asset has a
greater present value than tax savings out in time.
• Larger depreciation amounts early on result in increased present worth of future tax savings to the firm.

28
Need for Business AnalysisNeed for Business Analysis
• Stakeholders and potential stakeholders need to know how to evaluate an organisation’s financial success.
• The evaluation process requires a good understanding of financial statements and performance ratios.
29
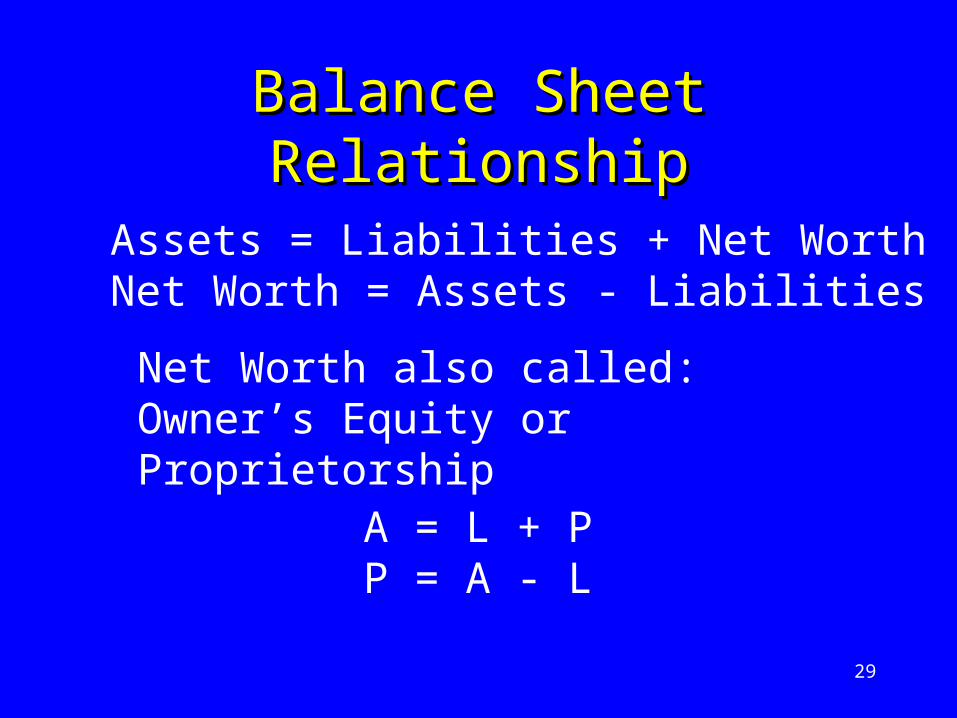
Balance Sheet RelationshipBalance Sheet Relationship
Assets = Liabilities + Net WorthNet Worth = Assets - Liabilities
Net Worth also called:Owner’s Equity or Proprietorship
A = L + PP = A - L

30
Profit & Loss StatementProfit & Loss StatementStatement of Financial PerformanceStatement of Financial Performance
• The basic equation for profit is:Profit = Sales - Costs
• P & L Statement shows an organisation’s sales revenues and costs over a given period, typically a year, quarter or month.
• A well-written statement can help in identifying the areas of the business associated with profit or loss.
• Assessment can be based on a division, department, business unit, product line, etc.

31
Performance RatiosPerformance Ratios
• The gross margin percentage• The net profit percentage % of sales• The operating expenses ratio• Market ratios (based on share data)• Other financial ratios – ROA, ROI• Employee ratios – sales or earnings/employee• The stock turnover ratio – sales/average stock

32
Financial Ratio Analysis Financial Ratio Analysis • Financial ratios are somewhat limited in
meaning when viewed in isolation.• They are more useful when used to compare
similar companies (benchmarking), or when examining trends.
• Some ratios are available on financial websites such as Commsec and InvestorWeb.
• More detailed data is available on individual company websites.

33
Example ROA CalculationExample ROA Calculation
ROA = Net Profit / Total Assets
Suppose that the total assets for the organisation is $425,000 and the net profit is $42,000
ROA = 42,000 / 425,000 = 0.0988
or 9.88 %

34
ROI Return on investmentROI Return on investment
ROI = Net Profit / Net Worth
This shows the profitability of shareholders’ equity.
Suppose that the total assets for the organisation is $425,000, the net profit is $42,000 and the total liabilities are $200,000.
ROI = 42,000 /( 425,000 – 200,000) = 0.187
or 18.7%

35
BudgetBudget
• This is a key aspect of management accounting within the organisation.
• Bazley et al define the budget as –“A short and long-term plan of action for the future operating activities of a business, expressed in monetary terms”.
• It covers a period of time called the budget period which is normally one year.

36
Overall Purpose of the BudgetOverall Purpose of the Budget
• Budgetary Control – “… actual performance can be compared with the budget to identify any deviations so that management can take corrective actions.” (Bazley et al).
• Budgetary control provides a useful mechanism for predicting likely financial outcomes to the stakeholders.

37
P&L/Balance Sheet/BudgetP&L/Balance Sheet/Budget
• P&L reports receipts and expenditure over the period in question – the accounting period.
• The Balance Sheet records the financial position of the organisation at a given point in time.
• The budget is attempting to predict in advance what the P&L will look like in the same timeframe – the budget period, and what the balance sheet will look like at the end of the same period.
38
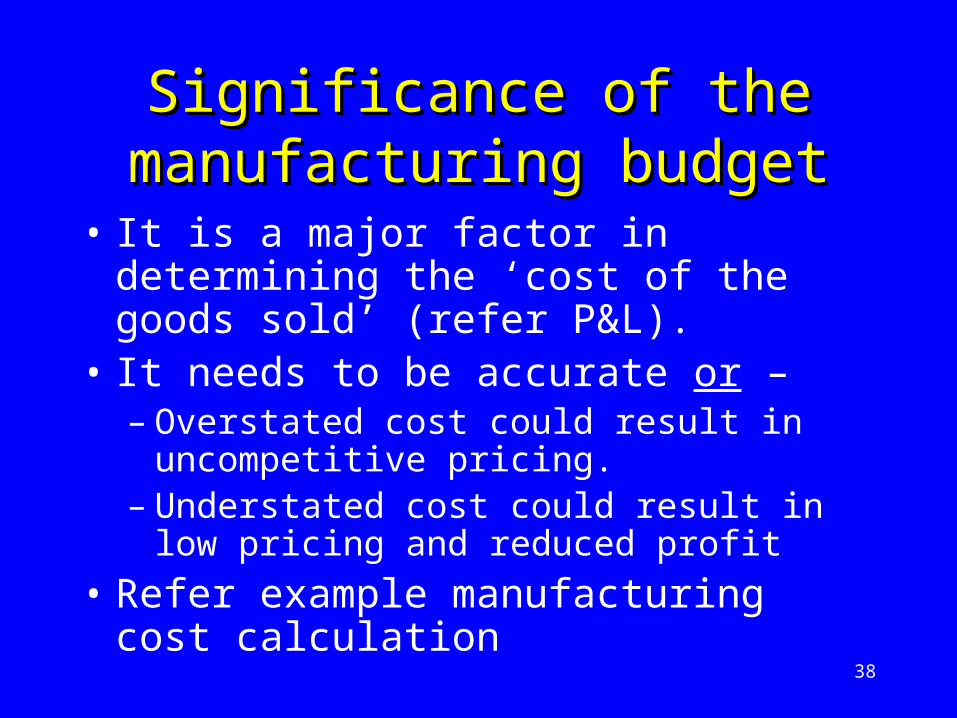
Significance of the Significance of the manufacturing budgetmanufacturing budget
• It is a major factor in determining the ‘cost of the goods sold’ (refer P&L).
• It needs to be accurate or –– Overstated cost could result in uncompetitive
pricing.– Understated cost could result in low pricing and
reduced profit
• Refer example manufacturing cost calculation

39
Manufacturing budgets requiredManufacturing budgets required
Budget Type
• Capital
• Personnel
• Expenses
• Inventory
• Purchases
Impacts
> Cash flow, depreciation expenses
> People-related expenses
> Hourly rate calculations
> Borrowings, warehouse planning
> Cash flow

40
‘‘Manufacturing Resource Planning’Manufacturing Resource Planning’MRP IIMRP II
“Computer based information system integrating production planning and control activities of basic MRP* systems with related financial, accounting, personnel, engineering and marketing information”.* MRP = Materials Requirements Planning
Bartol, K.M., Martin, D.C., Tein, M., & Matthews, G., “Management A Pacific Rim Focus”, McGraw-Hill, 2002 (Supplement 2 to Chapter16)

41
Budget Inputs RequiredBudget Inputs Required
• Forecast of specific product volumes • The latest comparison of budget and actuals• Forecasts of inflation rates and salary
increases.• Specific cost reduction/efficiency
initiatives. • Charges from other departments (facilities,
support etc.)

42
Impact of volume variationsImpact of volume variations
• This occurs when actual sales vary from budget.• The most serious consequence is when sales fail to
meet budget.• As a rule, direct costs are variable and can be
adjusted to changed volumes.• This rule may not apply if the volume variation is
significant but temporary.• The major problem arises with overhead costs
which are relatively fixed.

43
Budget ActualNet Sales $ 69,160,000 $62,244,000 Less cost of goods sold $ 33,250,000 $30,613,000Gross Margin (gross profit) $ 35,910,000 $31,631,000 Less operating expenses $ 31,813,600 $31,813,600Net Profit $ 4,096,400 ($182,600)
Impact on Profit & Loss StatementImpact on Profit & Loss Statement

44
How to react?How to react?
• Scrutinise all budget elements for cost-cutting possibilities.
• Actions will depend on the size of the volume variation, and how sustained it is expected to be.
• Increase the price to restore the margin???
Refer ‘price elasticity’
45
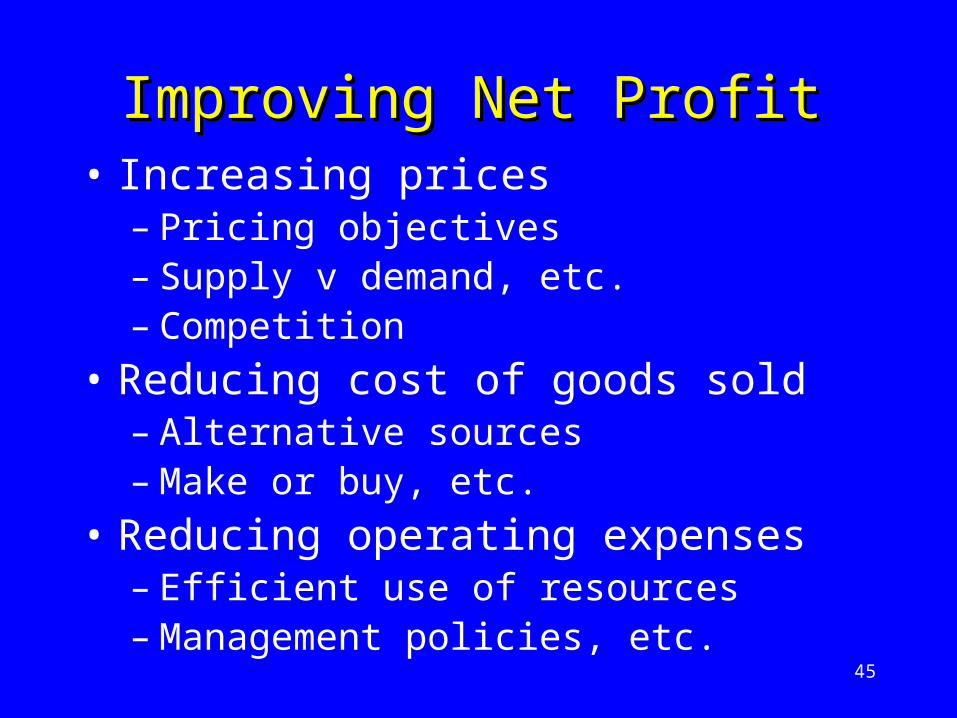
Improving Net ProfitImproving Net Profit• Increasing prices
– Pricing objectives– Supply v demand, etc.– Competition
• Reducing cost of goods sold– Alternative sources– Make or buy, etc.
• Reducing operating expenses– Efficient use of resources– Management policies, etc.

46
Setting PricesSetting Prices
1. Determine your pricing objectives.
2. Know the importance of price to your target market.
3. Know your demand.
4. Understand your costs.
5. Determine your pricing strategy.
6. Competitor issues – pricing etc.
47
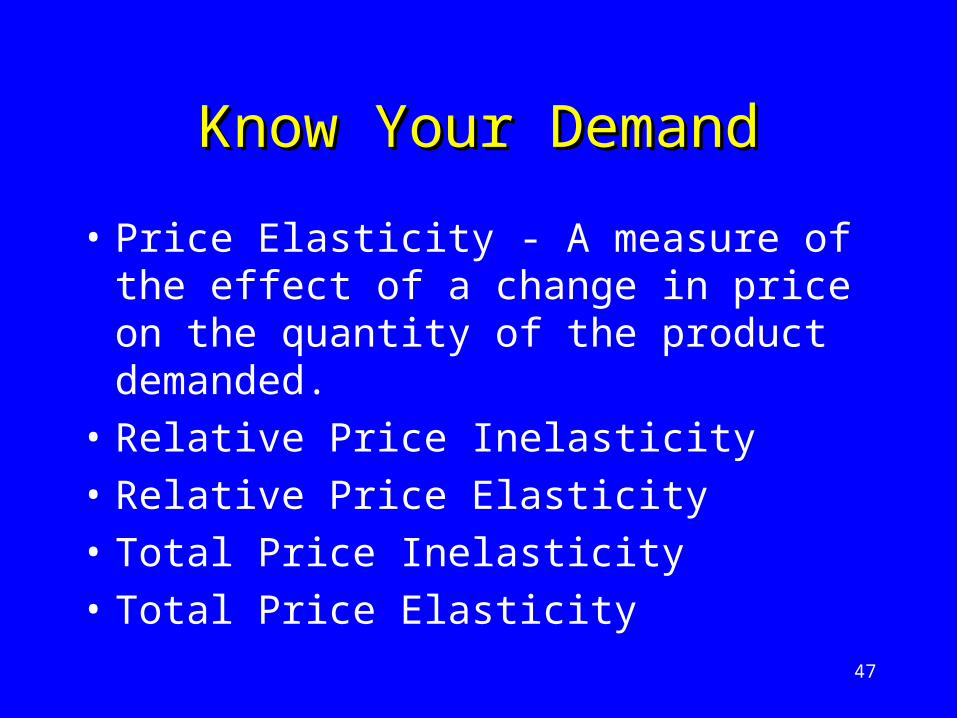
Know Your DemandKnow Your Demand
• Price Elasticity - A measure of the effect of a change in price on the quantity of the product demanded.
• Relative Price Inelasticity
• Relative Price Elasticity
• Total Price Inelasticity
• Total Price Elasticity
48
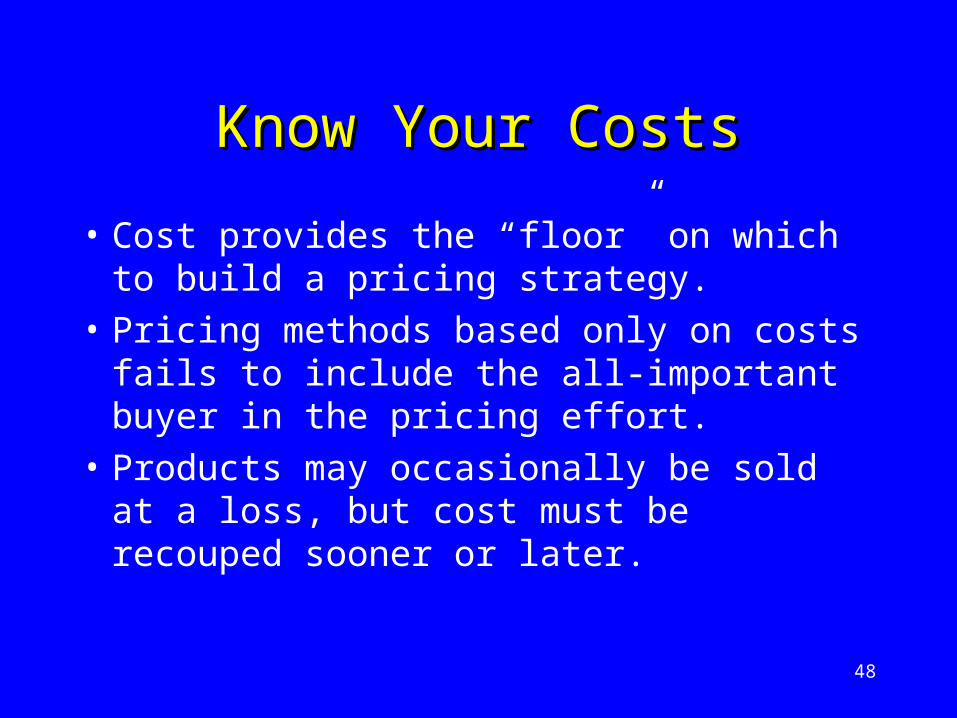
Know Your CostsKnow Your Costs
• Cost provides the “floor” on which to build a pricing strategy.
• Pricing methods based only on costs fails to include the all-important buyer in the pricing effort.
• Products may occasionally be sold at a loss, but cost must be recouped sooner or later.

49
Supply & Demand RelationshipSupply & Demand Relationship
High
P1
Low
Q1 HighLow
S
D
Quantity
Pri
ce

50
ReferencesReferences
Bazley, Hancock, Berry, Jarvis “Contemporary Accounting”, Thomson
Australian Taxation Office website:
www.ato.gov.au

51
Good luck on Nov 15!Good luck on Nov 15!