Engineering Laboratory Blasting and blast effects in cold · PDF fileEngineering Laboratory...
62
SSpecial Report 86-16 July 1986 US Army Corps of Engineers Cold Regions Research & Engineering Laboratory Blasting and blast effects in cold regions Part i/: Underwater explosions Malcolm Mellor CV) 00 I Prepared for OFFICE OF THE CHIEF OF ENGINEERS Approved for public release; distribution Is unlimited.
Transcript of Engineering Laboratory Blasting and blast effects in cold · PDF fileEngineering Laboratory...

SSpecial Report 86-16July 1986
US Army Corpsof EngineersCold Regions Research &Engineering Laboratory
Blasting and blast effects in cold regionsPart i/: Underwater explosions
Malcolm Mellor
CV)
00
I
Prepared for
OFFICE OF THE CHIEF OF ENGINEERS
Approved for public release; distribution Is unlimited.

UnclasgfledSECURITY CLASSIFICATION OF THIS PAGE ("oen Dant E~ntered)
REPORT DOCUMENTATION PAGE READ INSTRUCTIONSREPORT__ DOCUMENTATIONPAGE_ BEFORE COMPLETING FORM
1. REPORT NUMBER 2. GOVT ACCESSION NO. R •4ECIPIENT'S CATALOG NUMBER
Special Report 86-164. TITLE (and Subtitle) ". TYPE OF REPORT & PERIOD COVERED
BLASTING AND BLAST EFFECTS IN COLD REGIONSPart Ih: Underwater Explosions 6. PERFORMING ORG. REPORT N..M BER
7. AUTHOR(s) 8. CONTRACT OR GRANT NUMBER(s)
Malcolm Mellor
9. PERFORMING ORGANIZATION NAME AND ADDRESS 10. PROGRAM ELEMENT. PROJECT, TASKAREA & WORK UNIT NUMBERS
U.S. Army Cold Regions Research and Engineering 6.27.40ALaboratory, Hanover, New Hampshire 03755-1290 DA Project 4A762730AT42
Ta.k Area CS. Work Unit 029I1. CONTROLLING OFFICE NAME AND ADDRESS 12. REPORT DATE
Office of the Chief of Engineers July 1986Washington, D.C. 20314-1000 63. NUMBER OF PAGES
6014. MONITORING AGENCY NAME & ADDRESS(If different from Controlling Office) 15. SECURITY CLASS. (of this report)
UnclassifiedISa. DECLASSIFICATION/DOWNGRADING
SCHEDULE
16. DISTRIBUTION STATEMENT (of this Report)
Approved for public release; distribution is unlimited.
17. DISTRIBUTION STATEMENT (of the abstract entered In Block 20, I different from Report)
MS. SUPPLEMENTARY NOTES
19. KEY WORDS (Continue on reverse side if necessary aind Identify by block number)
Blast waves Shock waves Underwater ordnanceCold regions Underwater explosionsExplosions Underwater demolition
20. ABSTRACT CCarofftJu m Poverw. saf if neoosasfy md Identify by block number)
The general characteristics of underwater explosions are reviewed in order to provide abackground for the consideration of under-ice explosions. Test data for under-ice explo-sions and for explosive icebreaking are summarized and interpreted.
DO 73 1473 EDITION OF I NOV 655 IS OBSOLETE UnclassifiedSECURITY CLASSIFICATION OF THIS PA7.E 'W?,-e,, Data Fnterd)

PREFACE
---- >'This is one of a series of reports that summarize data relating to
blasting procedures and blast effects in cold regions. They are organizedexlo ions 9-(2) explosions in water)ito deal successively with-) explosions i
,(--3-)-explosions I solid ground materials. For the most part, the blasting
procedures used in cold regions are not much different from those that are
in general use elsewhere. Similarly, the principles involved in assessing
blast effects in cold regions are' the tame as those that apply to blast
effects generally. The reports therefore summarize principles and data for
general explosions technology, and then present the procedures and data for
cold environments within this framework.
The purpose of the series is to provide a convenient reference source
for engineers faced with problems of explosions or blasting in cold
regions., Because not all engineers are well acquainted with explosions
technology, relevant physical principles are explained or summarized, but
there is, no attempt to explore the underlying theory in depth, nor is there
any treatment of the practical aspects of explosives use and safety prac-
tices. These topics are covered well in Army Technical Manuals and Army
Materiel Commend publications, as well as in commercial blasters' handbooks
and in textbooks.
This report was prepared by Dr. Malcolm Mellor, Research Physical
Scientist, Experimental Engineering Division, U.S. Army Cold Regions
Research and Engineering Laborazory. The work was done under DA Project
4A762730-AT42, Design, Construction, and Operations Technology for Cold
Regions, Task Area Combat Support, Work Unit 029, Explosives and Projectile
Impact Under Winter Conditions.
The author is grateful to Donald Albert for his careful review of the
manuscript and suggestions for improvement. The numerous figures were pre-
pared by Edward Perkins and his staff.
. ?V
".2. /c '<• a
.' I f i• .. .;•. , :, . •W • .

CONTENTSPage
Abstract ........................................................ iPreface ......................................................... i.Introduction ..................................................... IDeep underwater explosions ...................................... I
Shock propagation ............................................ 1Variation of shock pressure with time ........................ 4The impulse of a shock in deep water ......................... 6Refraction of pressure waves in deep water ................... 8Bubble expansion and pulsation ............................... 11Damping of bubble pulsations ................................. 14Pressure pulses from the gas bubble .......................... 16Bubble rise .................................................. 17
Underwater explosions near the surface .......................... 18Shock effects at the surface ................................. 18Bubble motion near the surface ............................... 21Surface displacement by the gas bubble ....................... 25Dimensions and ejection velocities for waterspouts ........... 29Explosions near the bottom of deep water ..................... 34
Underwater explosions in cold regions ........................... 35Environmental factors ........................................ 35Reflection and refraction of shock waves ..................... 35Cratering of floating ice by an underwater explosion ......... 36Specific energy, or powder factor, for ice fragmentation ..... 41Cratering of floating ice by an underwater gas bubble ........ 43Use of multiple charges for icebreaking ...................... 46Design of multiple charges for breaking thin ice ............. .. 48Charges on top of the ice sheet, or inside it ................ 48The physical basis of explosive icebreaking .................. 53
Literature cited ................................................ 55
ILLUSTRATIONS
FigureI. Attenuation of peak overpressure for spherical propagation
from a concentrated high explosive source ............... 32. Pressure-time trace for an underwater shock passing a
fixed point that is relatively close to the source ...... 43. Variation of time constant, or relaxation time, with radius
for deep underwater explosions of TNT and HBX-l ......... 54. Attenuation of impulse with radius for deep underwater
explosions of TNT and HBX-1 ............................. 75. Variation of acoustic velocity with water depth for normal
seawater at OC ... ................................... 86. Variation of acoustic velocity with water temperature and
salinity at atmospheric pressure ........................ 9
iii

Figure Page7. Variation of acoustic impedance with salinity and tem-
perature at atmospheric pressure ....................... 98. Effects of acoustic velocity profiles on the propagation
and refraction of pressure waves ....................... 109. Variation of theoretical bubble radius and bubble period
with charge depth ...................................... 1310. Variation of bubble radius with time for a high explosive
charge In deep water ................................... 1511. Approximate magnitude of bubble pulse amplitude for the
first collapse of a non-migrating bubble in deepwater .................................................. 17
12. Effect of wave reflection from the water/air interface ... 1913. "Spalling" of the water surface by an underwater
explosion ............................................... 1914. Reflections and interference of shock waves at the
water/air interface .................................... 2115. Peak overpressures in water from an explosion at the
air/water interface .................................... 2216. Secondary pressure pulses produced by successive collapses
of the gas bubble during pulsation ..................... 2317. Number of bubble oscillations as a function of scaled
charge depth for TNT charges in deep water ............. 2418. Surface eruptions from underwater explosions ............. 2619. Surface effects from underwater explosions ............... 2720. Critical charge depth d* plotted against charge
weight W ............................................... 2721. Scaled maximum bubble radius Rbm/W1/ 3plotted against
absolute charge depth for TNT charges at depths up to10 m ................................................... 28
22. Part of Figure 19 replotted to give charge depth in termsof cube-root scaling ................................... 29
23. Scaled diameter for .waterspouts from underwater ex-plosions ............................................... 30
24. Upper limit of base diameter for surface eruptions fromunderwater TNT explosions .............................. 31,
25. Maximum height of the column or jet formed by chargeslying on the bottom in shallow water ................... 31
26. Height of eruptions produced by TNT charges set at variousdepths ................................................. 32
27. Initial vertical velocity as a columnar waterspout beginsto burst through the water surface ..................... 33
28. Effects of contact between the charge and the bed forhard and soft bottom materials ......................... 34
29. Ray paths for shock waves from an underwater explosionbeneath an ice cover ................................... 35
30. Eruption of a shallow-depth charge through thin ice ...... 3731. Design curves for ice blasting ........................... 3832. Prediction curves derived from regression analysis when
linear dimensions are scaled with respect to maximumbubble radius, and water level is the depth datum ...... 40
33. Simple guidelines for optimum charge design .............. 41
ivj

Figure Page34. Specific charge, or powder factor, as a function of
scaled ice thickness when single charges are atoptimum depth .......................................... 42
35. Comparison of ice fragmentation by gas discharge andby high explosive ...................................... 45
36. Shallow-depth multiple charges breaking through thinice .................................................... 47
37. Summary of dimensions for the true crater produced bya small charge inside thick ice ........................ 48
38. Summary of data for the scaled dimensions of the truecrater in massive ice .................................. 49
39. Summary of scaled dimensions for apparent craters inmassive ice ............................................ 51
40. Use of delay deck charges to break a narrow shaftthrough very thick ice ................................. 52
41. Effect of a charge lying on the upper surface of thinice .................................................... 52
42. Effects of surface charges compared with the effects ofunder-ice charges ....................................... 53
43. Predicted crater diameter in very thin ice compared withthe scaled dimensions of explosive eruptions from anice-free water surface ................................. 54
TABLES
Table1. Attenuation constants for shock propagation in deep
'water .................................................. 42. Scaling parameters for the relaxation time of a deepwater
shock ................................................... 53. Attenuation constants for the impulse of a deep wate:"
shock .................................................. 74. Parameters for the first bubble pulse .................... 135. Effects of charges in a single row when each charge is
close to optimum for the prevailing ice thickness, andcharge depth is about lt to l.5t ....................... 46
INSPECTED
6
v

BLASTING AND BLAST EFFECTS IN COLD REGIONSPART II: UNDERWATER EXPLOSIONS
Malcolm Mellor
INTRODUCTION
The close-range effects of a deep underwater explosion in cold regions
are not significantly different from those of the same kind of explosion in
the waters of temperate or tropical regions. Temperature and salinity, and
stratifications of temperature and salinity, have to be taken into account,
but the relevant physical considerations are no different from those that
are applied for any waters.
The special feature that distinguishes the waters of cold regions from
those in other parts of the world is ice. With an undisturbed cover of
recently formed ice, the water surface is sealed by a solid floating plate.
Other types of ice covers may consist of disconnected ice fragments of
various sizes, or of jumbled accumulations of fragments that have been
pushed together and refrozen. The surface of the ice usually has a snow
cover.
An ice cover influences the reflection and propagation of acoustic
waves from underwater explosions. It also tends to subdue, or suppress,
any surface eruptions from shallow underwater explosions. Since there are
various practical needs for breaking and penetrating ice covers, the
relevant blasting technology is of interest.
DEEP UNDERWATER EXPLOSIONS
Shock Propagation
When a concentrated charge of high explosive is detonated far below
the surface of deep water, the initial pressure is typically of order I to
10 GPa (or more); intense compression is transmitted to the surrounding
water, causing a steep shock wave to propagate in a spherical pattern at
very high speed. Very close to the source, the shock amplitude is high and
the shock passage is very fast. Peak overpressure in the water can exceed
100 MPa, shock velocity can exceed 5 km/s (several times the acoustic
velocity), and positive phase duration is typically well below 10 ms. The

amplitude and velocity of the shock wave decrease as radius increases,
until the disturbance becomes an acoustic wave, with velocity independent
of amplitude (N 1.45 km/s). This process is qualitatively similar to shock
propagation in air. However, while air and water are both fluids, with no
shear rigidity, they are very different in terms of compressibility.
The explosive also forms a bubble of gas and water vapor, which
expands, pulsates and migrates over time periods which are very long com-
pared with the times for shock passage. Initially, the bubble is small,
with very high temperature and pressure, but as it expands against hydro-
static pressure, the temperature and pressure fall. About half of the
total energy of the explosion goes into bubble expansion, with the other
half going into propagation and dissipation of the shock.
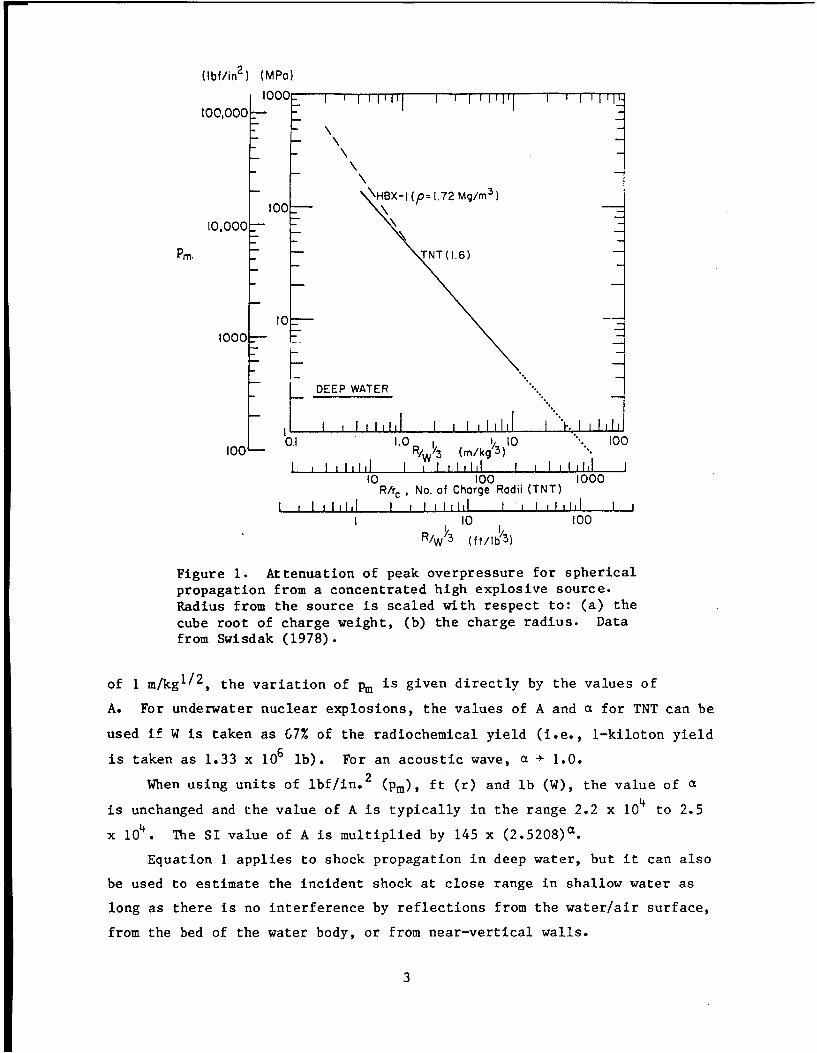
At a given distance, or scaled distance, from an underwater explosion,
the shock amplitude is a lot higher than it would be in air (Fig. 1). In
the range of available data, commonly with scaled radius from 0.4 to 10
m/kgl/ 3 (8 to 200 charge radii), the attenuation of peak overpressure
Pm with radius r is more gradual in water than it is in air. For TNT,
Pm is approximately proportional to r- 1I 1 3 at moderately close range.
Higher pressures measured very near charges of HBX-1* attenuate a little
more rapidly, with pm approximately proportional to r-1. 3 7 . For air
blast at comparable distances, pm is approximately proportional to r-2
(see Part I, Fig. 19).
The relation between shock pressure and radius can be scaled in ac-
cordance with Hopkinson, or cube root, procedures (see Part I). The
attenuation curve can thus be represented by approximate relations of the
form
r -aPm = A(w-') (1)
where A and a are positive constants. The scaled distance (r/WI/ 3 ) is,
in effect, dimensionless, since W1/3 represents charge radius (see Part
I). This relation obviously breaks down as r + 0, so limits of applicabil-
ity have to be set. Table 1 gives values of A and a for several types of
explosive, together with the ranges of applicability. At a scaled radius
*RDX, TNT and aluminum.
2
(Ibf/in 2 ) (MPo)I0 0 0 ,. I I I I l' I fil I ;I lI I 1 1 1 1 1 1 1100,000 0
00 -\HBXI (p= 1.72 Mglm3 )
100-I0,000="
Pm. TNT,(.6)
1000 -0-
S• ~DEEP WATER "-
100 0.11.0W% (m/kg 3) " 1
I , I l I I I I I I lIl I I10 100 1000
R/rc , No. of Charge Radii (TNT)
1 0 100R,/w 3 (ft/I )3
Figure 1. Attenuation of peak overpressure for spherical
propagation from a concentrated high explosive source.
Radius from the source is scaled with respect to: (a) the
cube root of charge weight, (b) the charge radius. Data
from Swisdak (1978).
of 1 m/kgl/2, the variation of pm is given directly by the values of
A. For underwater nuclear explosions, the values of A and a for TNT can be
used if W is taken as 67% of the radiochemical yield (i.e., 1-kiloton yield
is taken as 1.33 x 10⁶ lb). For an acoustic wave, a + 1.0.
When using units of lbf/in. 2 (Pm), ft (r) and lb (W), the value of a
is unchanged and the value of A is typically in the range 2.2 x 10⁴ to 2.5
x 10 . The SI value of A is multiplied by 145 x (2.5208)a.
Equation 1 applies to shock propagation in deep water, but it can also
be used to estimate the incident shock at close range in shallow water as
long as there is no interference by reflections from the water/air surface,
from the bed of the water body, or from near-vertical walls.
3

Table I. Attenuation constants for shock propagationin deep water. (Data from Swisdak 1978.)
Overpressureattenuation Applicableconstants* range
Explosive A a Pm (MPa)
TNT 52.4 1.13 3.4 - 138
Pentolite 56.5 1.14 3.4 - 138
H-6 59.2 1.19 10.3 - 138
HBX-1 56.7 1.15 3.4 - 60
HBX-1 56.1 1.37 60 - 500
HBX-3 50.3 1.14 3.4 - 60
HBX-3 54.3 1.18 60 - 350
*Units such that pm is given in MPa when r is inmetres and W is in kilograms.
Variation of Shock Pressure with Time
In deep water, the pressure p behind a shock front decays with time t
almost exponentially, although the tail of the wave actually has a small
hump (Fig. 2). This secondary pulse is believed to be produced by reflec-
tions within the explosion source, brought about by the finite size and
finite reaction time of the explosion. The positive phase duration at a
given radius from the source can be characterized by a "relaxation time,"
or time constant, 0, such that 0 is the time taken for the shock pressure
to decay to I/e, or about 37% of the peak pressure pm:
Figure 2. Pressure-time trace foran underwater shock passing a fixedpoint that is relatively close to
/the source. Pressure decay behindSr/W "/ = .27 m/kgI/ e a
the shock front is approximately: exponential, but there is a hump
o.368 p0 that is thought to be related tothe finite size and finite reac-
tion time of the explosion source.Following test data illustrated
8 ,Time 58 6.70 by Cole (1948).
4

Table 2. Scaling parameters for the relaxation timeof a deepwater shock. (Data from Swisdak, 1978.)
Scaling constants Applicablefor relaxation time* range
Explosive B 8 Pm (MPa)
TNT 0.084 0.23 3.4 - 138
Pentolite 0.084 0.23 3.4 - 138
H-6 0.088 0.28 10.3 - 138
HBX-i 0.083 0.29 3.4 - 60
HBX-1 0.088 0.36 60 - 500
HBX-3 0.091 0.22 3.4 - 60
*Units are such that 8/W1/ 3 is given in ms/kg!/3when r is in metres and W is in kilograms.
p/p et/O (2)
where t is the elapsed time since shock front arrival and 0 is the relaxa-
tion time, or time constant.
The "time constant" is actually not constant; it varies somewhat with
radius r from the source. By invoking similitude principles, a can be
scaled and its relation to r can be expressed as
e/w1/3 = B (r/W 13) (3)
where W is charge weight and B and 8 are positive constants, valid only
within certain limits of applicability. Table 2 gives values of B and 8
1.0 1 1 1 1 I
0~
E
S~HBX-I
g 0.1_0
Figure 3. Variation of time0
En constant, or relaxation time,with radius for deep under-
1 00 water explosions of TNT and0.o 1o 10 10 HBX-1. From equations given
r/W" 3, Scaled Radius (/kg I3 by Swisdak (1978).
5

for various explosives and for specified pressure ranges. For an acoustic
pulse, $ + 0. Figure 3 shows the relation between O/WI/ 3 and r/W1/3 in
graphical form for two explosives.
Equation 2 applies to shocks in deep water. When there is reflection
from the water/air interface, from the bed of the water body, or from near-
vertical walls, eq 2 applies to the incident shock only up to the time tc
at which the reflected wave interferes with the tail of the incident wave
(see later discussion of surface effects).
The Impulse of a Shock in Deep Water
The impulse I of the shock wave (per unit area) is the integral of
pressure p with respect to the time after shock arrival, t:
t,
I= f p dt0
t,
f Pm e -t/ dt . (4)0
The limit of integration is typically taken with t, in the range 50 to
70. From similitude considerations, I can be scaled with respect to
WI/3, and the variation of the scaled impulse I/WI/ 3 with the scaled
radius r/W1/ 3 can be expressed as
INW1/3 = C(r/W /3)-Y (5)
where C and Y are positive constants for specified ranges of pressure or
scaled radius. With the integration in eq 4 taken to t* = 50, values of
C and Y for various explosives are as shown in Table 3. For an acoustic
pulse, Y + 1.0. Figure 4 shows the relation between I/W1/ 3 and r/WL/3
graphically for two explosives.
Equation 5 applies in deep water where there are no shock
reflections. At shallow depths, where the tail of the incident shock is
truncated by a tensile wave reflecting from the surface (see Fig. 12
later), the impulse is reduced because the integration in eq 4 must
terminate at the time of the surface cutoff.
6

Table 3. Attenuation constants for the impulse ofa deep water shock. (Data from Swisdak, 1978.)
Attenuation constants Applicablefor positive impulse* range
Explosive C Y Pm (MPa)
TNT 5.75 0.89 3.4 - 138
Pentolite 5.73 0.91 3.4 - 138
H-6 6.58 0.91 10.3 - 138
HBX-i 6.42 0.85 3.4 - 60
HBX-i 6.15 0.95 60 - 500
HBX-3 6.33 0.90 3.4 - 60
HBX-3 6.70 0.80 60 - 350
*Units are such that I/W1/ 3 is given in kPa-s/kg 4/3
(or MPa-ms/kgl/ 3 ) when r is in metres and W is in kilo-grams. To convert kPa-s/kgl/ 3 into (lbf/in. 2)-s/1b1 / 3 ,multiply by 0.1114.
~lo
it TNT
•1.0-
0.10.! I 1.0 I0I )
0.1 1.0 to 100
/W"3 , Scaled Radius (m/kgi/
Figure 4. Attenuation of impulse with radi-us for deep underwater explosions of TNTand HBX-1. From equations given by Swisdak(1978).
7

Refraction of Pressure Waves in Deep Water
For small explosions, shock propagation is almost spherical because
the surrounding water is effectively homogeneous. However, for large
explosions in deep water, the far-field effects are not those of simple
spherical propagation. To appreciate the complications in deep water, it
is convenient, and justifiable, to assume that the shock behaves as an
acoustic wave, and also to think in terms of "ray paths," which are ortho-
gonal to the wave front. In this way the wave can be treated by the
ordinary laws of reflection and refraction, as developed in optics (see
corresponding discussion for air blast in Part I).
In seawater, the acoustic velocity c increases as temperature, pres-
sure (or depth) and salinity increase (Fig. 5 and 6). Water density p also
varies with temperature, salinity and pressure, and the acoustic impedance
Pc varies. Figure 7 indicates the variation of acoustic impedance with
salinity and temperature at atmospheric pressure. In the ocean, where
pressure increases with depth and where there are thermal and salinity
stratifications, acoustic velocity varies appreciably with depth, and the
depth profile of velocity changes from place to place and from season to
season. In the topmost layers, the velocity profile can change dV.urnally.
If water conditions above an explosion are such that velocity increas-
es with height above the charge, the "rays" are refracted in the sense that
1520
SSalinity:3 %
1440
1400I I0 2000 4000
Water Depth (m)
Figure 5. Variation of acoustic velocity with waterdepth for normal seawater at OC. Data from soundspeed tables based on the Bradley-Wilson equation.
8
I

Sol0 In I I y'o
-35
S150C02
S1410U
>0
U
Figure 6. Variation of acousticvelocity with water temperatureand salinity at atmospheric pres-sure. Data from sound speedtables based on the Bradley-Wilson
0 0 20 30 equation.
Water Temperature (C)
- 1.56 - 30_
E
1.4aFigure 7. Variation of acoustic
impedance with salinity and tem-
1.44-perature at atmospheric pressure.The units of impedance are equiva-lent to specific gravity (dimen-
5 10 15 20 25 30 35 sionless) multiplied by acousticSalinity (%.) velocity in km/s.
they are bent downward (Fig. 8a). At sufficient distance from the source,
the rays in a particular direction turn back into a downward direction, but
if a ray reaches the surface before this happens, it undergoes regular
surface reflection. At the radial limit of surface reflection, the refrac-
tion phenomenon creates a shadow zone which is not traversed by the pres-
sure waves
If the velocity profile has an inversion (Fig. 8b), refraction above
and below the inversion occurs in opposite senses, again tending to create
a shadow zone.
When the velocity gradient is small in the uppermost water layers, and
also in the layers near the charge depth (Fig. 8c), some rays can turn
around and cross the rays which start further from the vertical. This
9

again creates a sort of shadow zone, bounded at the bottom by the caustic,
a surface which is the locus of crossover points.
If velocity increases both above and below the charge depth (charge
near the minimum of a velocity profile), refraction above and below con-
fines much of the energy to propagation within a horizontal layer, or
"sound channel" (Fig. 8d).
Acoustic Velocity Radius Water Surface Shadow
a. Velocity decreasing linearly with increasing depth.
Acoustic Velocity Radius Water Surface
Sorc
b. Velocity increasing linearly with depth below the surface,then decreasing linearly with depth below an inversion level.
Acoustic Velocity Radius Water Surface
Sorc
c. Velocity almost uniform in the uppermost water layers, withnonlinear decrease of velocity at greater depths.
Figure 8. Effects of acoustic velocity profiles on the propa-gation and refraction of pressure waves.
i0

Acouslic Velocity Radius Water Srfoco
d. Velocity increasing above and below the source depth, form-ing a "duct," or "sound channel."
Figure 8 (cont'd). Effects of acoustic velocity profiles on thepropagation and refraction of pressure waves.
Bubble Expansion and Pulsation
The high temperature and pressure of an explosion form a gas bubble,
which initially has very great energy in very small volume. Transmission
of shock from the gas bubble to the water depletes the energy of the bubble
and lowers the internal pressure somewhat, but the gases continue to expand
rapidly, forcing the surrounding water to flow radially outward against
hydrostatic pressure, aided somewhat by after-flow from the shock passage.
During expansion to ambient hydrostatic pressure, the radial flow of water
accelerates. The inertia of the radial water flow allows the bubble to
over-expand, so that its internal gas pressure eventually drops below the
local hydrostatic pressure while the radial flow is decelerating to zero
velocity. At this stage the water flow reverses and the bubble starts to
collapse. Inertia allows the bubble to over-compress, and the collapse
motion becomes very fast (of order 60 m/s) just before it is halted by gas
compression. The abrupt arrest of bubble collapse creates in the surround-
ing water a pressure pulse which is significant, but much smaller than the
initial shock (see Fig. 16). By contrast, at maximum bubble expansion
there is very little energy transmitted to the water because the expansion
phase ends more gradually. The bubble pulsation is damped by energy losses
resulting from acoustic emission in the secondary pressure pillses and also
from turbulence. Thus, in very deep water, the pulsation sbovid eventually
cease.
11i

The behavior of the bubble from a nuclear explosion is similar, but
there are significant differences. The bubble from high explosives con-
tains mainly gaseous explosion products from the charge itself; these have
constant mass, and the charge has finite size. The bubble from a nuclear
explosion, which has temperatures and pressures very much higher than those
of HE detonations, is formed by vaporization, dissociation and ionization
of water as shock energy is dissipated. The nuclear "charge" is essential-
ly a point source. Later in the bubble development, condensation can
reduce the mass of vapor in the nuclear bubble, producing bubble pulse
energy losses that are greater than corresponding losses for HE bubbles.
During the first bubble pulse of a chemical explosive, the maximum
bubble radius Rbm and the period of the oscillation T1 vary with the
charge size and the charge depth. The influence of charge size can be
dealt with by applying cube root scaling, defining a scaled bubble radius
Rbm and a scaled period T1 such that
Rbm = Rbm/W3 (6)
S= T/1/3 (7)
Scaled values of maximum bubble radius and bubble period are then inversely
proportional to powers of the absolute hydrostatic pressure, or total
head. If the pressure, or head, is expressed in metres of water, the total
head is (H + H0 ) N (H+10), where H is charge depth and H0 is atmospheric
head, approximately equal to 10 m. The radius and period relations are:
Rbm k= kj (8)Rb - �WM-3 (H+Ho)II 3 (H+10)1/3
Ti = T.L.- k_2 k2 (9)W1/3 =(H+H0) (1H+10)5/6
where kj and k2 are constants for a given explosive. Table 4 gives values
of kI and k2 for several explosives, and the effect of charge depth is
illustrated in Figure 9. The ratio k 2 /kl does not vary much from one
explosive to another. Bubble period is relatively easy to measure, so
12

Table 4. Parameters for the first bubble pulse. (Data fromSwisdak, 1978.)
Radius constant Period constant
Explosive k, k2 k2/kI
TNT 3.50 2.11 0.603
Pentolite 3.52 2.11 0.600
HBX-1 3.95 2.41 0.610
HBX-3 4.27 2.63 0.616
H-6 4.09 2.52 0.616
Units of kj and k2 are such that radius is given inmetres and time is given in seconds when charge depthis in metres and charge weight is in kilograms.
0.3
- 0.28
E11.2 -- Radius - 0.24
" - 0.20
E
_, 0.8-- 0.16
E ' 0.12 •
0.4-- -0.08
TNTHa= 10 m 0.04
o r I I I ,1 ,1,111 1 1 ,1 , l 0 -1 10 100 1000
H, Charge Depth (W)
Figure 9. Variation of theoretical bubble radiusand bubble period with charge depth. The curvesare in accordance with eq 8 and eq 9, using theparameters for TNT given in Table 4.
relations involving T are useful for calculating other quantities, such as
bubble depth or bubble energy (see eq 13-15 later). For comparison of
nuclear and HE bubble effects, the "weight" of the nuclear charge W (TNT
equivalent) is taken as about 84% of the radiochemical yield (usually
expressed in kilotons, where I kt is equivalent to 1012 calories).
13

The period of the first bubble pulse, T1 , gives the time interval
between the shock wave and the first pressure pulse formed by bubble
collapse.
Damping of Bubble Pulsations
When a bubble pulsates, the expansion and compression of the gas is
effectively elastic, so that much of the internal energy is conserved.
However, some energy is transferred irreversibly to the surrounding water
and dissipated, partly by radiation of stress waves when the bubble
collapse is arrested, partly by compression and turbulence in the water,
and partly by breakup of the bubble surface into spray jets which cool the
gas (Taylor instability).
Equation 9 gives, in essence, the period for the first bubble pulse
as a function of detonation energy. A similar equation should be applic-
able to the nth pulse if the detonation energy is replaced by the residual
energy En:
k(E n)1/3
Tn =(H + H0 ) 5 /6
where k is a constant. For successive bubble pulsations, the period T and
the bubble energy E are then related by
T n+1 En+I 1/3 H n + H 5/6
n n Hn+l + H 0
where Hn and Hn+1 are the respective bubble depths for the two pulsa-
tions. If the rise of the bubble is slow relative to the bubble period, so
that H is sensibly constant, then
T n+1 •En+l ) /3 (2T E 1/T = n--j-- (12)
n n
Some data given by Cole (1948) suggest that (Tn+i/Tn) may be approxi-
mately constant during the first few cycles when the bubble is remote from
free surfaces or rigid boundaries, with a value of about 0.77 (see Fig.
10a). This implies that (En+i/En) - 0.46, again approximately constant
from one cycle to the next. This further implies an exponential decay of
bubble energy with the number of cycles. Other test results discussed by
14

(mm) (in)
500- 2C0
400 15-
0300
10
S200
5--100[
00 20 40 60 80
Time (ms)
a. Radius plotted against time for three bubble pulsesfrom a 0.25-kg charge of tetryl at 91 m depth. AfterCole (1948).
- 1.5- HydrostaticPesr (bar)
22
b. Calculated values of scaled
radius plotted against scaledtime for the first bubble pulse
I I I under ambient pressures of 20 100 200 and 5 bars. After Johansson
Scaled Time (ms/kg"'3) and Persson (1970).
Figure 10. Variation of bubble radius with time for a high explosivecharge in deep water.
Cole (1948) indicate a bigger energy loss in the first contraction, with
E2 /Ej = 0.34, but smaller relative loss in the second contraction, with
E3 /E 2 = 0.54. For a non-migrating bubble, Snay (1957) gave E2 /Ej - 0.38.
If an explosion produces steam, it is to be expected that energy losses
will be relatively high, with En+I/En varying considerably from cycle
to cycle (increasing with n if there is no migration).
When the bubble is rising rapidly, migration depletes the internal
energy of the bubble.
Maximum bubble radius will also decay with pulse repetition. If equa-
tions similar in form to eq 8 and eq 9 are accepted for the nth pulsation,
then
Rk_ (H + HO)1/ 2
(Rbm n Tn (13)
15

In other words, maximum bubble radius is directly proportional to the
period, and it will tend to decrease by a fixed percentage (say about 23%)
with each cycle. Figure 10a illustrates the fluctuation of radius with
time in deep water, showing Rbm for the second and third pulses as rough-
ly 70% of the value for the preceding pulse in each case. Figure 10b shows
scaled radius as a function of scaled time for the first bubble pulse under
two different ambient pressures.
Pressure Pulses from the Gas Bubble
Each collapse of a pulsating gas bubble produces a pressure pulse
(see Fig. 16 later). When measured over a broad frequency band, the
amplitude of the first bubble pulse is appreciably smaller than the ampli-
tude of the shock wave, and at close range the pressure rise is compara-
tively slow. However, the duration of the bubble pressure pulse is quite
long, so that the impulse (area under the pressure-time trace) is compar-
able to that of the shock. The bubble pulse propagates as an acoustic
wave, with the wave front tending to steepen progressively ("shock-up' -
Part I, Fig. 3).
Neither the absolute amplitude of the bubble pulse nor the amplitude
relative to the initial shock can be predicted with confidence. The bubble
pulse is affected by bubble migration, there may be interference by shock
reflections from distant boundaries, the pulse shape can change during
propagation, and there are slightly different attenuation rates for the
shock and the bubble pulse.
For a deep explosion in very deep water, the peak pressure of the
first bubble pulse, Pbl, varies with scaled radius r/W1/ 3 as
Pbl = k (r/W /3)-1 (14)
where k is a coefficient which has a weak dependence on the total head (H +
Ho). Swisdak (1978) used TNT data from Slifko (1967) and gave k = 9.03
when Pbl is in MPa and r/W1/3 is in m/kgl/ 3 . This value of k was for
152 < (H + Ho) < 1219 metres, and 79 < (r/WI/ 3 ) < 5500 m/kgl/3. The
corresponding relation for the peak shock pressure Pm was eq I with A =
50.4 (i.e. 4% smaller than the TNT "close range" value in Table 1), and a =
1.13. These relations for Pm and Pbl are shown graphically in Figure
11. At the closest applicable range, Pbl/Pm = 0.315; at the most
distant applicable range, Pbl/Pm - 0.548.
16

102I 1 " I""
i0
o\
a, \
U) pShock pressure
lt ,euFigure 11. Approximate magnitude
pb.P~ressure of\9Sfirst bubble pulse of bubble pulse amplitude for the
first collapse of a non-migrating
ICi2 bubble in deep water. The peakshock pressure is plotted for com-
- Swi-ok (1978). following Slifko(1967) parison. The full lines are re-Cole (1948) lations for TNT given by Swisdak
O1 ,•5i 2 3I, , '"' (1978) and credited to SlifkoI6' 1 I0 102 10 104 (1967). The dashed lines are re-
r/W ,Scaled Radius (m/kg113 ) lations given by Cole (1948).
Cole (1948) stated that "The peak pressure in the first bubble pulse
is no more than ten to twenty percent of that of the shock wave ... ".
Cole's example of bubble pulse data for a scaled radius of 3.6 m/kgl/3
(Cole's Fig. 1.5 and Table 9.2) gives Pbl/Pm = 0.045. Cole's example
implies that k = 1.96 in eq 14, so that the relative amplitude of the
bubble pulse at distant ranges is a good deal lower than that indicated by
Swisdak's equations. However, a theoretical relation given by Cole (his
eq 9.13) converts to give k = 7.08, which yields values of Pbl only 22%
lower than those given by Swisdak's equation. Cole's relations seem to be
developed for application at relatively close range, and they have been
plotted accordingly in Figure 11.
Bubble Rise
Being buoyant, the gas bubble rises towards the surface while it is
expanding or pulsating. However, the characteristics of the motion seem
rather strange at first sight.
A simple bubble from a non-explosive source rises in water, or any
other liquid, much like a balloon, increasing in size as depth decreases,
without pulsation. The speed increases as bubble size increases, maintain-
ing a Froude number (based on equivalent bubble radius) that is very close
to unity. It might therefore be expected that a pulsating bubble would
rise quickly when in an expanded state, and slowly when highly compressed.
17

However, because the bubble size and bubble velocity are changing continu-
ously, there are accelerations, and the instantaneous velocity lags behind
the driving conditions. The top of the bubble moves farthest during expan-
sion, and the bottom moves farthest during contraction. The result is that
the upward motion tends to accelerate as the bubble expands, but maximum
velocity of the bubble center is reached only when the bubble is collapsing
again. The net result is that ascent of a spherical bubble in deep water
is jerky, with maximum velocity when the bubble is small and minimum veloc-
ity when it is large, or just the opposite from what would be expected for
steady motion. Displacement of the top or bottom of the bubble is the
resultant of the rise motion and the radial pulsation. During collapse,
the two components of motion are opposed at the top of the bubble, but they
are additive at the bottom of the bubble.
Vertical migration becomes more pronounced as depth decreases, but at
shallow depths the process of migration under gravity (buoyancy) is compli-
cated by proximity to the free surface, as discussed later.
UNDERWATER EXPLOSIONS NEAR THE SURFACE
Shock Effects at the Surface
The shock wave propagating spherically from a shallow underwater
explosion hits the surface and reflects as a tensile wave, or rarefaction
wave. If the shock is weak when it reaches the surface, it can be regarded
as an acoustic wave and the reflected wave can be imagined as emanating
from a virtual source which is a mirror image of the true point of detona-
tion. The shape of the incident wave behind the shock front will then be
determined by the algebraic sum of the pressures from the incident wave and
the reflected wave at any given instant. For strong shocks, however, this
is an oversimplification.
The first contact of the shock wave with the surface is at a point
vertically above the charge, and at this point there is normal reflection.
The shock contact zone spreads out radially across the surface from this
point, giving oblique reflections. In high-speed photographs taken from
above, surface reflection of the shock wave creates a darkened "surface
slick," a circular area that spreads extremely fast near surface zero, in
accordance with arrival times for the shock. Spreading velocity for the
slick, drs/dt, can be written as U(d/rs)(1 + Ut/d), where U is shock
18

velocity, d is charge depth, and t is the time for the slick to reach
radius rs. For rs < d, drs/dt > U.
The reflected rarefaction wave can reduce the net water pressure below
original ambient pressure if charge depth is not too great (Fig. 12), and
when the negative overpressure drops sufficiently low (near the vapor pres-
sure), cavitation occurs. There is a limit to negative amplitude in the
reflected wave because of the limit to the tension that can be sustained by
water. The combination of "bulking" from cavitation and droplet ejection
from shock impact causes a spray dome to form at the surface (Fig. 13).
Cutoff InvolvesIncident Finite Time
Shock Front
Positive pressure cancelledby superposition of reflected
PO rarefaction wove
Small or IZero Time
Z b. Real cutoff requiringfinite time.
a. Idealized surface cutoff.
Figure 12. Effect of wave reflection from the water/air interface. Thereflected rarefaction wave superimposed on the tail of the incident com-pressive wave can reduce the resultant pressure down to, or slightly below,the ambient hydrostatic pressure.
SprayDome
Spoiled (uncovltated)0 ae Surface
Incident . 6Shock Wave 0ShockWoveReflected
Rarefaction Wove
GasBubble
Figure 13. "Spalling" of the water surfaceby an underwater explosion (idealized). Theincident compressive wave and the reflectedrarefaction wave cause ejection of dropletsand cavitation of surface layers. AfterYoung (1973).
19

The spray dome, which is the first surface disturbance to appear, rises in
a bell-shaped form, humped highest at the center because the initial
velocity is proportional to the incident shock pressure. After a deep
explosion, a secondary spray dome can be formed by the pressure pulse of
the first bubble collapse, or by shock reflection from the bed.
The initial upward velocity u of the surface water particles results
from the shock reflection, with doubling of particle velocity. It can be
expressed in terms of the incident shock pressure pm as
2 Pm cos8 (15)
PoU
where 8 = tan- (rs/d), in which d is charge depth and rs is the hori-
zontal radius from "surface zero" to the point considered. U is shock
velocity (1 co, the acoustic velocity in water) and P0 is water density.
If shock attenuation for all but the shallowest explosions is taken as a
power relation, in accordance with eq 1, the variation of u with surface
radius rs can be expressed as
a+lU -+
S= (1 + (rs/d) 2) 2 (16)u0
where ur is initial vertical velocity at surface radius rs, uo is
initial vertical velocity at "surface zero," and a is the attenuation con-
stant from eq 1. Equation 16 defines the initial shape of the spray dome
and shows how it is affected by charge depth. Since acl, the exponent in
eq 16 is approximately -1.
The interference of the reflected wave with the incident wave is
called the surface cutoff. The abrupt cutoff of positive pressure shown in
Figure 12a is an idealization; in reality, the cutoff takes a finite time
(Fig. 12b) because the reflected wave is traveling through water disturbed
by the incident wave. The difference between the arrival time of the
incident shock and the reflected wave is called the surface cutoff time,
tce It is given with sufficient accuracy by an acoustic approximation:
tc W (i/c)[rs 2 + (dc + dg)2]1/ 2 - r/c(17)
- (1/c)[r2 + 4 dcdg]I/ 2 - r/c
20

Image
Oof Source
KK
KK
AIR
WATER mlu
S dg nomlu
rS
Figure 14. Reflections and interference of shock
waves at the water/air interface.
where c is acoustic velocity (strictly the shock velocity), rs is hori-
zontal distance from the charge to the sensing point, r is slant radius
from charge to sensing point, dc is charge depth, and dg is depth of
the sensing point (Fig. 14). Values of co at atmospheric pressure are
given in Figure 6, with depth effects on co shown in Figure 5.
As dg decreases, so tc decreases and eventually (because the
reflected wave travels in shocked water) the reflected wave interferes with
the shock front itself, reducing the amplitude of the shock front. This is
analogous to Mach stem formation in an air blast over a solid surface, but
in the case of underwater shock the fused shock fronts reduce the amplitude
instead of magnifying it. The zone within which the peak overpressure is
reduced by the reflected wave is called the anomalous region (Fig. 14).
In a "contact burst," where the charge is at the surface with half its
volume in air and half its volume in water, the distribution of shock pres-
sure in the water is strongly "anomalous." Figure 15 shows how peak over-
pressure varies with thz. depth of the sensor and with the radial distance
of the sensor from the charge. At any given radial distance from the
charge, shock pressure increases with increasing depth.
Bubble Motion Near the Surface
A bubble pulsating at great depth displaces the water radially, the
radial velocities decaying with distance from the bubble center. The
21

Target Depth(charge radii)
S_ 30\
0o 0.9
•" Radial Distance
a -o - (c h a rg e r ad ii)r - ~30-
50_ 0
S60 1.0 . .
0.7S
_1.0 _---.-_ _ 8 0
a. 18.85 Charge Radii i
-- 18.85 Charge Rodii=l m/kg1/ 3 -1 m/kgI -
I , 1 ,1,1,1 I ',I1 1,1, I I 1 ,1,1, 0 10IO
0.1o 10 10 t00 Charge Radii (TNTD(charge radii0) I
,III I II I I ,I ,1,III I I I ,I , , I I III II 2 4 (m /kg s')0.01 0.1 1.0 (m/kgl/s)
Depth of Target (gouge) Below Surface Radial Distance from Charge
a. Peak overpressure as a function of scaled b. Peak overpressuretarget depth, with scaled target radius as as a function of scaledparameter. target radius, with
scaled target depth as
parameter a
Figure 15. Peak overpressures in water from an explosion at the air/water
interface. Data from Swisdak (1978).
bubble period is relatively short at great depth, so that buoyancy effects
are not very important to the pulsation. By contrast, the radial symmetry
of the bubble motion is disturbed when a free surface or a rigid surfaceintersects the flow field; the period increases near the air/water surface,
and buoyancy effects become significant there. The external pressure onthe free surface (atmospheric) is constant, and therefore displacements of
the water surface adjust so as to equilibrate the pressure. For a continu-
ous ri boundary (e.g. sea bed), flow must be parallel to the boundary.
During bubble expansion, water being displaced towards the free sur-
face encounters less inertial resistance. During contraction, the rela-
tively small mass of water above the bubble accelerates more rapidly than
22

the water below. Also, the pressure gradient relative to the mean pressure
becomes more significant as depth decreases. Because of these things,
proximity to the air/water interface affects the bubble pulsation, the
bubble shape, and the rate of rise.
At maximum expansion the bubble is almost spherical, but during
collapse the shape becomes distorted by hydrostatic pressure differences
and by buoyant migration of the bubble. The bottom of the bubble, where
hydrostatic pressure is greatest, moves inward more than other parts of the
bubble surface. The effect is first to flatten the bubble from its expand-
ed spherical shape, then to bulge the bottom inward like the base of a wine
bottle. In cross section, the contracted bubble is kidney-shaped. This
distortion can culminate in a collision between the bottom and top surfaces
of the bubble; the bottom penetrates the top as a jet, leaving the bubble
with a doughnut shape. As each collapse of the bubble is arrested, a
pressure pulse is transmitted to the surrounding water (Fig. 16). Under
certain circumstances, it is possible that the migrating bubble transforms
into a vortex ring.
Initial Shock
Pulses Formed by
Bubble Collapse
Time
_--4 .-- 4 - • -. .----- --Water Surface
0 1 I q I.0C 1 01j 1Ici I
°I
Figure 16. Secondary pressure pulses produced by successivecollapses of the gas bubble during pulsation. After Snay(1957).
23

.SI ,04-
0
0 2 -
E3M
n s a First Contraction Complete-
First Expansion Complete
0 2 4 6(r/kg"3)
I I 1 130 5 10 15(ft/lb 3
Scaled Charge Depth
Figure 17. Number of bubble oscilla-tions as a function of scaled chargedepth for TNT charges in deep water.After Swisdak (1978).
Near the free surface, the bubble pulsates more rapidly and the period
is shorter than it would be without the free surface. The theoretical
period given by eq 9 can be adjusted to account for proximity to the sur-
face or to the bottom of the water body (Cole 1948, Swisdak 1978), but the
equations will not be reviewed here. An alternative to theoretical adjust-
ment is to obtain effective values of k 2 in eq 9, using values of depth H
and charge weight W that are of special interest. For example, one can
plot ln(Tl/WI/ 3 ) against ln(H+Ho), fit a line that has a slope of -5/6,
and thus obtain k2 .
During the collapse phase of bubble pulsation there is acceleration of
the inward radial flow, and the flow downward from the free surface ac-
celerates towards the bubble center at higher rates than flow from other
directions. This gives the appearance of repulsion from the free surface,
as the center of the bubble moves away from the surface.
The effect of the gas bubble when it reaches the surface will vary
according to the number of pulsations it has undergone during its rise.
Figure 17 gives the number of oscillations as a function of scaled charge
depth. The graph also indicates the stage of bubble pulsation (expanding
or contracting) at which the bubble reaches the surface.
24

Surface Displacement by the Gas Bubble
When the gas bubble reaches the surface it produces an eruption of
water, or of water and gas. If the scaled depth of the explosion is very
great, there may be no visible effects at the surface, since the shock
there is attenuated to practically nothing, the rising bubble has lost all
its energy in multiple pulsations, and gases have been dissolved in the
water. The depth at which all surface effects become completely suppressed
is known as the total containment depth. As scaled charge depth decreases,
the first noticeable surface disturbance may be a shock-induced spray dome,
followed by bubble-induced upwelling, with water motion but no significant
elevation of the surface. With further decrease of charge depth, there is
a shock-induced spray dome and possibly a spray dome from the second pres-
sure pulse (first bubble collapse). A mound of water is formed subsequent-
ly at the surface, with turbulent radial motion; this may develop into a
hump of spray and foamy water. The mound is produced by the arrival of a
bubble whose pulsations have been damped out during multiple oscillations.
At still shallower depths, a ring of inclined plumes bursts through the
dome of spray in a coronet pattern, throwing water radially outward to some
extent. For small charge depths (< 0.9 Rbm, the so-called venting depth)
the bubble reaches the surface level during its first expansion and the
eruption develops in a columnar form. When the bubble expands through the
surface plane, it does not necessarily vent directly and instantaneously to
the atmosphere, since a layer of water is displaced upward. At charge
depths slightly shallower than 0.9 Rbm the erupting gas is below ambient
air pressure, and air is sucked into the eruption ("blow-in"). If a
shallow explosion has sufficient depth for the bubble to develop and grow
before it reaches surface level, the column of spray has a high speed
vertical jet as its core in the later stages of development. When charges
are just below the surface (< 0.2 Rbm), so that the gas bubble vents
directly and positively ("blowout"), the water column is capped by a cloud
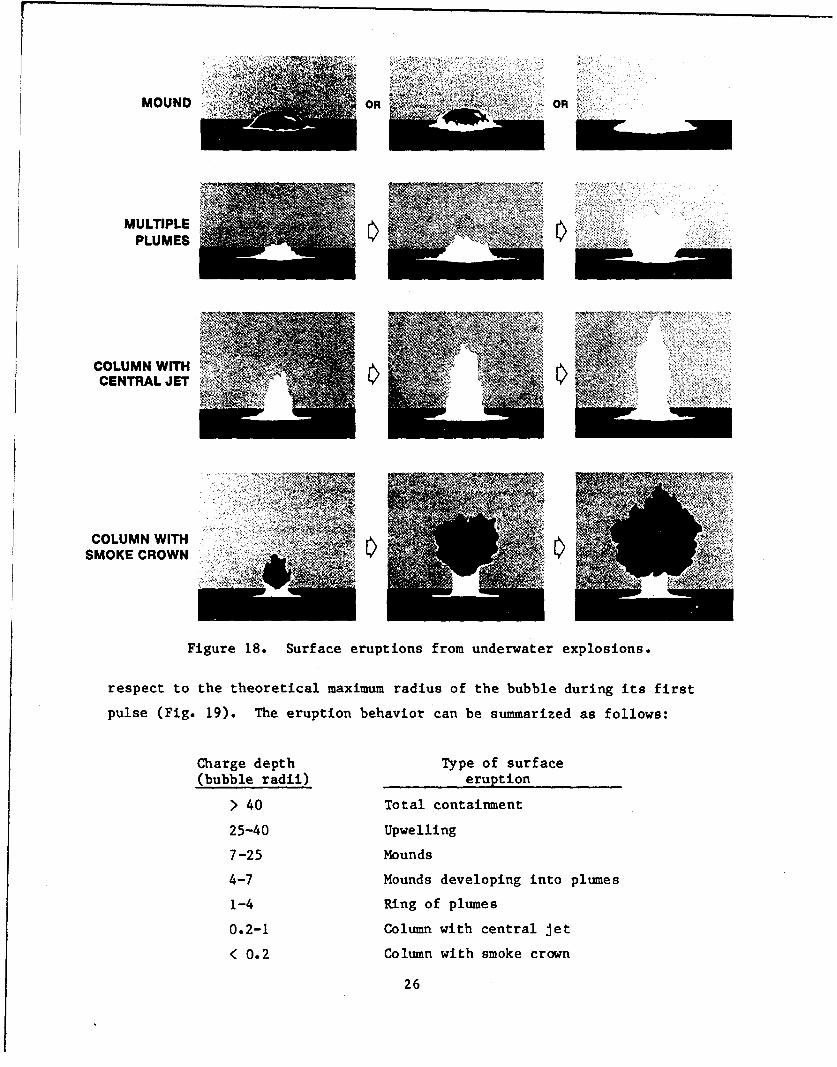
of explosion products, or "smoke." Some typical features of surface
eruptions are illustrated in Figure 18.
The characteristics of surface eruptions have been recorded for a
range of charge depths and charge sizes, and boundaries for the various
types of eruption have been defined by normalizing charge depth with
25
MOUND ,,! OR •, OR •i••
MULTIPLE j • •..
PLUMES__ ORR
COLUMN WITH 7CENTRALJ ET V2
A" "', i~• •
COLUMN WITH • v [ \SMOKE CROWN '"' •'"
Figure 18. Surface eruptions from underwater explosions.
respect to the theoretical maximum radius of the bubble during its first
pulse (Fig. 19). The eruption behavior can be summarized as follows:
Charge depth Type of surface
(bubble radii) eruption
> 40 Total containment
25-40 Upwelling
7-25 Mounds
4-7 Mounds developing into plumes
1-4 Ring of plumes
0.2-1 Column with central jet
< 0.2 Column with smoke crown
26

(M) (UI)1000i \t .... /•
oloocI
.oo0 CO
o- A0
10 100 1000 10,000 10000 0o (b)
10 t00 1000 10,000 (kg)W. Charge Weight
Figure 19. Surface effects from underwater ex-plosions. After Young (1971).
For practical purposes it is useful to have scaled data expressed in
terms of charge weight rather than bubble radius, but gravity effects
complicate the scaling considerations. Ordinary cube root scaling is not
directly applicable to charge depth where bubble effects are being con-
sidered. Bubble pressure is related to the total head (H+H0), rather thanthe water depth H, and bubble radius is a function of both charge weight
and ambient pressure. In Figure 20 the depth d* which is equal to
(m) (fi)
- : Simple Cube Root Relotion
d>4+33.4d." 2048W Figure 20. Critical chargedepth d* plotted against
d. - charge weight W. d* is de-fined by d* = Rbm, and therelation between d* and Wis given by eq 8. The re-lation is compared with a
0.1_ simple cube root relation0 . to show that, over a .lim-
- 1.0 10 100 1000 10,000(•0) ited range of charge size,,1hd I I,, I 1, ,,,hl I ,IIIIIhl I IIII1, 1,~ l 1 , ,, 'cube root scaling of charge
0.1 .0 10 100 1000 (kg) depth provides a good ap-w proximation.
27

theoretical maximum bubble radius Rbm, i.e. (d*/Rbm) = 1, is plotted
against charge weight. The required relation is given by eq 8 after making
the substitution Rbm = H, i.e.
H4 + Ho H3 = k1 W. (18)
For the range of charge sizes shown on the graph, up to 5 tons (or 5
tonnes), a simple cube root relation provides a good approximation in the
mid-range, and it can probably be accepted for charges weighing 1 to 1000
lb (0.5 to 500 kg). For very big charges, say over 1 ton (I tonne), a
better approximation is given by scaling with respect to the one-fourth
root of charge weight. When the linear dimensions of surface eruptions are
scaled with respect to the cube root of charge weight, without reference to
charge depth, there is a tacit assumption that the scaled bubble radius
Rbm is independent of charge depth. Figure 21 shows that the actual
variation of Rbm/Wl/ 3 is not very great for charge depths less than
10 m.
In Figure 22, part of Figure 19 has been replotted to show the effect
of scaled charge depth on surface eruption when cube root scaling is em-
(m/kS (f/l/b)2 -- 5 I /
RIb I00
R b// 3 - -
0 -- I
2--
0I0 0 20 3o (ft)
I I I I I I I I0 2 4 6 8 10(m)
d
Figure 21. Scaled maximum bubble radiusRbm/Wl/ 3 plotted against absolute chargedepth for TNT charges at depths up to10 m. The arrows indicate the chargeweights for which Rbm is equal to thecharge depth.
28

(m/kg') (ft/lb[/) No. of Bubble Pulsations
-- Plumes
1.0Column
0.1 Column and Smoke Crown
0.1 , I _LILL1.0 10 too 1000 (,b)
1.0 10 100 (kg)
W
Figure 22. Part of Figure 19 replotted to givecharge depth in terms of cube-root scaling. Datafor bubble pulsations from Figure 17 have alsobeen added.
ployed, and when the effects illustrated in Figures 20 and 21 are taken
into account. The graph also shows the number of bubble pulsations accord-
ing to Figure 17. Columnar waterspouts all occur during the first bubble
pulse, but plume eruptions may occur at any stage of bubble pulsation
during the second and third oscillations.
When the columnar types of waterspouts collapse and fall back, the
falling spray forms an annular, or toroidal, cloud over the water surface.
This ring of spray is then driven radially outward as a two-phase flow.
The phenomenon is termed base surge.
Dimensions and Ejection Velocities for Waterspouts
The scaled dimensions of the waterspout can vary in a complicated way,
especially when there are multiple bubble pulsations before venting, but
some predictions of dimensions can be made. The two characteristic dimen-
sions for columnar waterspouts are diameter and maximum height.
For columnar discharges, several different diameters have been identi-
fied. The maximum diameter Dmax is the diameter of the well-defined
visible column just above the base. Some investigators have also defined
the diameter of an "effective column," which is a denser water column
29

-10
[ _ L_ I,. - I , i oo II
(m/kg'3
I0
0.01 0.1 1L0d/v/,W/3 (m/kg 3)
Figure 23. Scaled diameter for waters-pouts fromunderwater explosions. The diameter of the gasbubble at its first maximum is also plotted forcharge weights of 10 and 100 kg. Data for Dmaxfrom Swisdak (1978).
inside the masking spray cloud that defines Dmax. Finally, there is a
central core consisting of a high-speed jet, which is sometimes seen shoot-
ing out of the top of the column like a fountain.
Figure 23 gives Dmax as a function of charge depth d, with dimen-
sions scaled with respect to charge radius, or to cube root of charge
weight. The data for Dmax (Swisdak 1978) are for charges lying on the
bed in shallow water, but they are believed to be applicable for charges at
LIM Se sI UePLLI 1.1L UCCp WULtI! LLt LCelation f-- 1'-nax
DmaxiW1/3 = 3.71(d/W1/ 3 )0"166 3.71(d/W1/3)1/ 6 (19)
where the units of Dmax and d are metres and W is in kg. The limits of
applicability are 0.08 < (d/W 1 / 3 ) < 0.88.
For explosions at greater scaled depths, where the surface eruption
forms more squat spray :louds, the maximum base diameter of the waterspout
has been expressed as . function of ctla:ge depth with different scaling
parameters. The waterspout base diameter Dw, measured as a maximum value
at surface level, is scaled wich respect to the cube root of charge weight
as D,/WI/ 3 . The charge depth d is scaled with respect to the fourth
root of charge weight as d/WI/ 4 . Data in this form (Swisdak 1978) were
plotted to obtain the envelope shown in Figure 24. The values ef D, are
upper limit values intended to indicate "safe" distances.
The available darn for height of the waterspout are all scaled such
that scaled height is in the form 11/W 1/3 and scaled charge depth is in
the form d/W1 / 4 . Data for the maximum height of the column or jet from
30
'4.i

L -
1 2o
.44
o Io
a) a
D,--
o ý 2K
1I) 41-10 J - J- LJL 1i I
o s0 2 , 4 6 8
d/W' , Scolce Charge Depth (rn/kg'4)
Figure 24. Upper limit of base diameter for sur-
face eruptions from underwater TNT explosions.
Data from Swisdak (1978).
.' IOO 'l 1 ,l I 1111 I I I 111
•"• 00o5 OOi 0' 10
I.- d/W '. Scoled Chorge Depth (rn/kQ "
shallow explosions, Hmax, are given in Figure 25. These results are for
charges set on the bottom, but it is thought that column height is much the
same when charges are su3pended at the same depths in deep water (Swisdak
1978). The results for deeper charges in deep water (not on bottom) are
somewhat different, as shown in Figure 26, which gives uipper linit valutG
for 11max and compares this envelope witti representative values from
LI
SFigure 25.
Coluihinar waterspouts emerge from she surface at high velocity, then
decelerate as they rise against resistance from gravity and air drag.
first ejection of water occurs when the shock hits the surface, as des-
31
j.

,-1-.
l0j l I - 1 - -i - 1 -- • _
"-0 ' --IL-
.2
T4 Upper limit valueprfor deep water
" \ Representative p"values for charges
-f) lying on bottom-\ - -~ ~
•, I.-
L j J . .i ___0 2 4 6 8
d/W °, Scaled Charge Depth (m/kg '4
Figure 26. Height of eruptions produced
by TNT charges set at various depths. The
top curve is an upper limit envelope for
charges suspended in deep water. The low-er CULVe 6!iVV . ep.ett.iLvdL..v. . . lu. for
charges lying on the bottom, as in FiguT,_
25. D,-ta from Swisdak (1978).
cribed earlier. Initial ejection velocities arý given by eq 15 and 16.
The initial velocity uI for a point directly above the charge ("surface
zero") can be expressed by substituting eq 1 into eq 15:
2A _ (20)U ( 1/3'
0 W4
where A and a are shock attenuation constants from Table 1, (d/Wl/ 3 ) is
scaled charge depth, Po is water density and U is shock (or acoustic)
velocity. For this relation to apply, (d/W1/ 3 ) should be greater than
about 0.4 m/kg1/3, or ft/lb 1 / 3 . For explosives suh as TNT and
Pentolite, the approximate magnitude of initial ejection velocity is
ui 70 (d/W 1 / 3 ) 1 "1 4 r/s when (d/WI/ 3 ) is in m/kgl/ 3 .
Surface displacement by the gas bubble is more complicated, but it
appears to give ejection velocities close to those predicted by eq 20.
Figure 27 gives an impression of initial upward velocity as a function of
32
-. r--

?0.600i
0.00o I .1
* ooo
.400j Figre 27. Initial vertical velocity
0:•: i a colitmin r watersp)oLt begins toi g".•. i b rst throtu),1 tile water ,urfacc. Un-l-
reato of ttefor
C I
* 01)
wher K as a olumnar watrsou bein to-/3
eL iscaled velocity is plotted against.c o 04 ICoos pi 4 o scao scaled charge depth g. Based on test
wco'eo Cf.orgc geiveh ttc/ii 3) data compiled by Toing (1973).
•aca- ,Ohm.ge uep"i by combining various test results that were compiled by
Young (1973). i fw trend of the linited data can he described by a power
relation of the form /
S= K~ /1/3) nZ
*where K is a constant and n -4/3. '
Ejection velocity for a given scaled charge depth is usually given int
unscaled forn, irrespective of charge size. however, the maximum height of
the waterspout for a given gocaled charge depth is commonly scaled with
respect to NWI/3 If the lma•xIinum height of the waterspout is determined
largely by gravity deceleration in accordance with elementary ballistic
equations*, then for internal consistency thle initial velocity ought to
scale with respect to (N 1 /3)'/2, or WI/ 6 .
Scaling with respe ' to the one-sixth root of charge weight has rela-
tively little eftect on the Ilual result. For example, if a 50-kg charge
is taken as the bat;!.s of comparison, then the scaling factors for 5-kg and
500-kg charges are, respoctrlely, (1.68 and 1.46. Factors of this magnitude
do not produce much displacement of data point . wh1ich have been plotted oil
a logarihtlhic velocity scale.
Sv2 = u2 + 2fs, where u and v are initfal and final velocities
respectively, f is acceleration, and s is distance, traveled in the vectordtrect ton.
33
{ 'l" '.. i~ i i " " ' .. N"• 1 " '- " U, , -'. I ' Y5 "

Explosions Near the Bottom of Deep Water
When a charge is detonated near the bottom, and far below the water
surface, the shock wave is reflected but some energy is absorbed by the
bottom material. If the bottom were completely rigid, and if the shock
behaved like an acoustic wave, there would be perfect regular reflection,
with no loss of energy in the reflection and a doubling of pressure at the
interface. With a charge in contact, the water around the charge would
experience effects equivalent to those produced in free water by a charge
twice as big (Cole 1948). Applying cube root scaling, th's would imply a
26% increase of peak overpressure (factor of 21/3), a 59% increase of
impulse (factor of 22/3), and a 100% increase of energy flux density*
(factor of 2). In reality, all bottom materials absorb energy and so the
predictions of simple theory are never fully met. Figure 28 gives some
results for the attenuation of energy flux density with distance along the
bed when the charge is lying on the bottom. The attenuation curve for free
water is compared with attenuation curves for charges lying on "hard
bottom" and on mud. Close to the charge, the hard bottom appears to give
an amplification of energy flux density which is well below the theoretical
factor of 2, but fut Lher away from the charge there is a doubling, as pre-
dicted by simple theory. In the caee of charges lying on mud, the energy
flux along the bed is actually reduced below the values for free water.
70 I 1 I-
I-l
-�-iolrd UOttOm
SF -H
Free Water/2,. 'o ---F
Joi.
r1
_ Figure 28. Effects of contact between thecharge and the bed for hard and soft bottom
Sj _ _materials. Scaled energy flux density in10o the water is plotted against scaled distance
Scoied Distance (m/kg'3) from the charge. After Swisdak (1978).
* Energy per unit area (e.g. N-m/m 2 Pa-ni N/r)
34

UNDERWATER EXPLOSIONS IN COLD REGIONS
Environmental Factors
As long as water remains in the liquid state, deep underwater explo-
sions behave in much the same way, irrespective of whether the water is in
the tropics or the polar regions. However, proximity to an ice surface
introduces new considerations.
Reflection and Refraction of Shock Waves
A weak shock propagating spherically from an underwater axplosion
reflects and refracts on contact with ice. From shock measurements made in
water just below a uniform floating ice sheet, Barash (1966a) deduced the
wave paths shown in Figure 29. The incident shock reflects from the lower
surface of the iceý and, subject to critical angle limitations, it also
penetrates and refracts inside the ice. After refraction, part of the
energy propagates along the ice/water interface and re-radiates back into
the water. Another wave path reflects from the ice/air interface, return-
ing -h, igh the ice and back into the water, with refraction. If the ice
is very thick (iceberg )r Ice island), the ray shown as number 4 in Figure
29 w.ll propagat. and .t.t..n.ate in the iC withot .UL.............LL .LICL11.
Air
Ice i
Water
Gouge
2
(D irect Wove Path Through Water
Wove Reflected from Bose ofIce Cover
ho z Wove Refracted and Propagatedat Interfacewith Dispersed
Re-entry into Water
Wove Refracted in Ic-.with
Internal Reflsction from
Ice/Air Interface
Figure 29. Ray paths for shock waves frim an under-water explosion beneath an ice cover. kfter Barash(1966).
35
If the shock amplitude is sufficiently high, the ice can deflect,
fracture, shatter or deform.* This aspect of the material response is
dealt with later.
Cratering of Floating Ice By an Underwater Explosion
If an underwater explosion is big enough and shallow enough, it wi
burst through a surface ice layer to form a crater. The gas bubble dis-
places the surface, discharging water, ice fragments and sometimes gaseous
explosion products (Fig. 30). The final crater may have open water, or it
may be completely choked with ice fragments.
A crater in floating ice is usually characterized only by its diameter
or radius. The definition of crater diameter is arbitrary, and not always
consistent for different studies. Crater diameter is the diameter of the
zone where the ice is completely (and obviously) fractured, such that it is
unable to sustain a bending movement. Additional radial and circumferen-
tial cracks may extend beyond the crater without destroying the continuity
and structural integrity of the ice sheet to a significant extent. The
size of the crater depends on the size of the explosive charge, on the ice
thickness, on the charge depth and, to a lesser degree, on the explosive
type and ice type. -
Available test data have been compiled and analyzed to provide design
curves which give probable crater radius as a function of charge weight W,
ice thickness t, and charge depth dc (Mellor 1972, 1982, 1986). For the
limited range of the test data (W < 300 kg, t < 4.3 m), cube root scaling
appears to be fully justified, so that all linear dimensions of the problem
can be taken as proportional to W113. Using scaled values for crater
radius, ice thickness and charge depth, multiple regression analysis can be
applied in order to derive the required prediction curves. Variations of
explosive type and i-e type seem to produce only second-order effects which
cannot be evaluated from existing test data. However, some adjustment for
explosive type can be made on the basis of the specific energy for each
explosive (i.e. the heat of explosion) (Mellor 1982, 1986).
In practical ice-blasting work, it is convenient to refer charge depth
to the base of the ice cover, and to have variables scaled with respect to
"* "Spray reloading," which can occur by shock impact and cavitation behind
thin air-backed plates (Snay 1957), is not expected to be significant in
typical ice covers.
36-1,

1A
ANE-&
44
Figtire 30. Er1uptzion of a shallow-depth charge. (0.49 bubble radii)
37

8-
25I-.. Scclet Charge Ce~vh
0.0 5 (O.)
0.0 ().4)
5 20(06)
05ý . (14
70O (2.8)•80 (352ý
00- ._ _ (.. .-.-.' 5 10i 2'0 2'.5 (f f!/l"vmL
0.25 005 0.75 '.00 ,,./k,53Scoleo Ice Trckness
a. Scaled crater radius as a function of scaled icethickness, with scaled charge depth as parameter.
3.0-
2.5
606
S5 (C 2)
•"%"~ ~ C ( 10(O.8)
"0 2 4 20 (I08I )
"0. 3 I4 ( / ' ") )"SCO'' Oho-:e Oec'1 8elow, Ice
b. Scaled crater radius as a function of scaledcharge depth, with scaled ice thickness as param-eter.
-Figure 31. Design curves for frhp blqiTir.
- 38

the cube root of charge weight, as in Figure 31. However, when the govern-
ing physical principles are considered, it can be argued that: (1) the
level of the water surface should be used as the datum for water depth, (2)
linear dimensions should be scaled with respect to the theoretical maximum
bubble radius. Consequently, available test data have been analyzed with:
(a) cube-root scaling and water level as datum, (b) bubble-scaling and
water level as datum. Results of the various regression analyses show that
no practical advantages derive from these assumptions; the best empirical
correlation is obtained with the assumptions used to produce Figure 31.
Nevertheless, the results obtained with bubble-scaling (Fig. 32) provide
some physical insight into the icebreaking process. The maximum attainable
crater radius is about 1.63 times the maximum bubble radius, and it is
achieved when the charge depth and the ice thickness are about 0.3 times
the maximum bubble radius. This implies that water driven by the expanding
gas from an optimum blast bursts through the ice during the first bubble
expansion.
When the curves of Figure 31 are used to design a blast or to predict
explosion effpets; the usual in-ut is a measure, - csttmatcd value of the M
ice thickness t. If the concern is with a'- notin•a7 Wiast, the curves show
that the biggest scaled crater is obtaluo-id w' . t/Wl/ 3 - 0.9 ft/lbl/3
(0.36 rn/kgl/ 3 ), so that optimum charge w, ight We. r iso:
Wopt 1.4 t 3 lb with t in feet
(22)
Wopt 21 t3 kg with t in metres
The best result is obtained with the charge almost in oitact with the
underside of the ice, i.e. with the charge 0 to 0.5 f,/>)/3 (0 to 0.2
m/kgI/ 3 ) below the base of the ice cover. The probable caiius of the
resulting crater Re will then be
Rc ý 6.56 Wi/ 3 ft with W in lb(23)
Re ý 2.6 Wi/ 3 m with W in kg
A much simpler rule-of-thumb for optimur crater size is obtained by
expressing dimensions as multiples of the ice thickness t. The charge
depth dc (below the base of the ;cc) is then
39

-r
S(C ea .hC'.q Oep'-
05
L 15
2 C
1 05
a2
0 :4 028 042 056 07C
SC3.eo ice Th,ck~ness (bubble rod,)
COonr. Cnd CoIlunT PlumesSnmc~e C'ow• -
205
1.0 04 I
06
S05-
0 0 5, 2-S¢,•lea CýOlq-I Uspl. f•el. N'olf •.CýOfzl {•ub lý 1"~; 1
Figure 32. Prediction curves derived fromregression analysis when linear diwnensionsare scaled with respect to maximum bubbleradius, and water level is the depth datum.
dc 0- 0.6 t (24)
and the optimum crater diameter D(. is
Dc = 2 R 15 t• (25)
These guidelines are shown in Figure 33.
40

Op,~N011 BC,,u-: CCa$e:e5
op, C*..3*-go0 to), 14 1 , ., ,1 :':
V 1 21 1 .J qa-o ..
Optimum Chorge Ces,,nG~ves Cuter Do1" - ~ ---.-- , -- ---.• e -- -\ ,
0
-Chorge wi W
Figure 33. Simple guidelines for optimum chargedesign (single crater).
The procedure just described gives the optimum value of W and the
maximum value of Rc when t is specified. In other applications (see
Mellor 1982), the specified parameters may include W and a finite value of
the charge depth dc. In such cases, t/WI/ 3 and dc/W1/ 3 are comput-
ed, so that R, can be estimated from Figure 31. Alternatively, t and
dc may be given, leaving an optimum value of W to be estimated, largely
on the basis of an optimum value of t/WI/ 3 from Figure 31. Other varia-
tions of the prubluc, catt be dealt with, either directly or by iteration.
Specific Enermv, or Powder Factor, for Ice Fragment ,tion
The specific energy for fragmentation of a solid, Es, is the energy
consumed to break unit volume. The energy in a charge of weight W is kW,
where k is a characteristic specific energy content for the particular
explosive. k can be taken either as the heat of explosion, typically
around 4.2 to 4.8 kJ/g for high explosives, or as the gas expansion energy,
which is roughly 20% of the heat of explosion. The volume of ice broken by
a single charge is nRc t, where Rc is crater radius and t is ice thick-
ness. Thus, for explosive icebreaking,
kW klnE = k2 = . (26)
s R 2t 1/3 1/3
c (L ,W ) (t/W / )c
The weight of explosive per unit volume of fragmented material is
known as the powder factor Fp, or as the specific charge. For ice blast-
ing with a single charge:
41

- ~WwF = (27)
F IT R 2 t 1/3 2 1/3c 2 T(Rc/WI/32 (t/W 1/)
"Figure 34 gives the specific charge (powder factor) as a function of
scaled ice thickness for single charges at optimum depth, i.e. immediately
below the bottom of the ice. The minimum value of specific charge is
3 30.0051 ib/ft , or 0.082 kg/m , and it is obtained when the scaled ice
thickness is about 2 ft/ibl/ 3 , or 0.8 m/kgl/ 3 . In other words, the
ma4imum specific volume of fragmentation occurs with t/WI/ 3 - 2
ft/lb 1 / 3 (0.8 m kgl/3), whereas maximum specific area of fragmentation
occurs with t/WI/ 3 u 0.9 ft/lb1/ 3 (0.36 m/kgl/ 3 ).
For comparison, the powder factor for optimum crater blasts in semi-
3 3infinite ice is about 0.01 to 0.02 lb/ft , or 0.004 to 0.008 kg/mr
Values of specific energy E. for explosive icebreaking by single7-i
charges can be obtained from F' ure 34 by multiplying values of specific
(kg/rn3
) (lb/ft3
)
Charge 0-0 5 ft/lb3 (0-0.2 rn/kg 3)
below base of ice
0.03' -I01
* L 0.02[-
02 FFI -
011
0 02 04 0. 0 08 10 (m/kg 3)
function of scaled ice thickness when single chargesare at optimum depth.
42
I '

charge by either the heat of explosion or the energy of gas expansion for
explosive. The units of this specific energy are energy per unit volume,
which. reduces to the dimensions of a stress. If we take the heat of explo-
sion as 4.6 kJ/g (1.1 kcal/g), which is about right for TNT, the minimum
3overall specific energy for explosive icebreaking is about 0.38 MJ/mi
which is equivalent to 0.38 MPa (55 lbf/in. 2). This is comparable to the
specific energy of a fairly large icebreaker (10,000-50,000 hp) when Es
is based on shaft horsepower. The "process specific energy" for a ship,
based on propeller thrust and speed, is lower, but this should be compared
with an explosive specific energy that is based on the work of gas expan-
sion (about 20% of the value given above).
The specific enerly for maximum crater area is obtained by taking
"(Rc/Wl/ 3 ) = 6.56 ft/ib 1 / 3 and (t/W0/3) = 0.9 ft/lbl/3. These
give F = 0.0082 lb/ft3 (0.13 kg/m3 ) and, with k = 4.6 kJ/g, Es = 0.63 2
4J/ir (0.6 MPa, 88 lbf/in. ). If specific energy is based on the work of
gas expansion, E. I 0.12 MJ/m•. These values are a bit higher than
corresponding values for maximum specific voliune of broken ice, but they
are still comparable to the specific energy for an icebreaking ship.
Cratering ot Floating Tce by an Underwater Gas Bubhlp
Floating ice can be broken by a rapid gas discharge into the water
beneath the ice. The gas bubble behaves much like that from a cheraical
explosive, but the initial pressure is relatively low and there is no
transfer of intense shock to the surrounding water. Tests have been made
with a variety of gas blasting systems, all of which discharge at relative-
ly low pressure without propagating a true shock (Mellor 1984). Experi-
mental equipment has included: (a) carbon dioxiee shells (discharge pres-
sure 70-90 MPa), (b) an airblasting system (69-83 MPa), (c) an air gun (17
MPa), and (d) a fuel/air combustion system (2.3-4.3 MPa).
Gas blasting results cannot be compared directly with explosives data.
To draw any kind of conclusions from the limited data, dimensions have to
be scaled with respect to the cube root of the discharge energy, which is
taken as the energy for adiabatic gas expansiop to atmospheric pressure.
For comparison with explosives, it is not yet clear whether the energy of
the conventional chemical explosive should be taken as the heat of explo-
sion or as the energy of gas expansion. If a scaled dimension for gas
blasting has units of m/MJI/ 3 , it can be converted to units of m/kg1/3
43
, S

by multiplying by the cube root of an explosive specific energy factor that
has units of MJ/kg. For TNT, the heat of explosion is approximately 4.56
lu,/kg and the energy of gas expansion is 0.87 Mi/kg; the corresponding cube
root factors are 1.66 and 0.955 (MJ/kg)l/ 3 .
For ice-breaking gas discharges of magnitude I WJ, optimum scaled ice
thickness for maximum crater diameter is about 0.4 m/MJu/3, optimum
charge depth is in the range 0 to 0.6 m/MJ1/3, and the resulting maximum
crater radius is about 2.9 m/MiI/ 3 (Mellor 1984). If the gas expansion
conversion factor for high explosives is applied to the optimum crater
results for explosives (Fig. 31), the corresponding values are: optiium
ice thickness 0.38r m/MJi/ 3 , optimum charge. depth 0 to 0.21 m/MJl/3, and
maximum crater radius 2.7 m/HLJI/3. Considering all the uncertaintties
that are involved, this is remarkably close agreement between gas blasting
and explosives blasting. Furthermore, both gas blasting and chemical
explosives give a probable maximum value for the scaled crater diameter of
approximately 15 times the optimum ice thickness.
The specific energy Es for maximum values of scaled crater diameter
is about 0.1 sJ"/ 3 . This is more or less the same as the corresponding
spocific energy for conventiona! explosives when.. -s based . the work M
of gas expansion rather than upon the heat of explosion (Es - 0.12
- 3Ni/rn3).
This suggests that for optimum cratering the crater size is controlled
by gas expansion and water displacement, not by shock propagation. Since
much of the energy of a high explosive goes into gas expansion, and since
the energy per Unit mass of typical explosives does not vary between very
wide limiks, it also seems reasonable to expect that optimum crater
dimensions will be fairly insensitive to explosive type. However, the
degree of ice fragmentation within the crater is different for gas blasting
diices and high explosives, and it seems probable that fragmentation will
vary with explosive type. Gas blasting tends to give large fragments
produced by a system of radial and circumferential cracks, while high
explosives give more shattering in the central crater (Fig. 35).
If crater size is influenced mainly by gas expansion and water
displacement, then variations in ic,ýý type might not have much effect. In
particular, an ice cover formed by accumulation of ice fragments might
respond much like an intact ice plate.
44
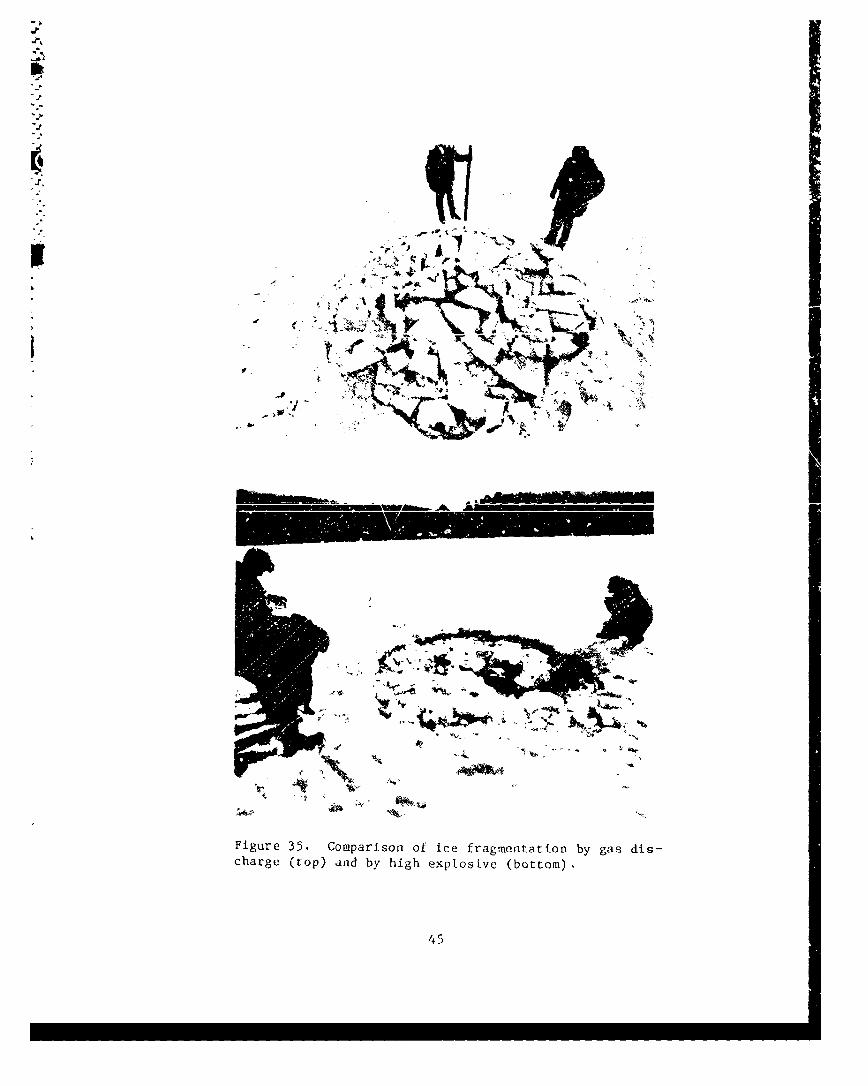
J.
'p
-i
-II
Figure 35. Comparison of ice fragmentation by gas dis-charge (rop) and by high explosive (bottom).
45
- - - - - -- ------

Use of Multiple Charges for lcehreaking,
To break ice over wide areas, patterns ol multiple charges can be
used. A single line of charges, which could be used to open. a channel, is
termed a row charge. An array of multiple rows iq called a pattern charge.
To design a row, or an atray, of icebreaking charges, it is convenient
to first calculate the cr' er radi us Rcl for a single charge and then to
relate Rcl to the s;'acon.: s for charges in a row, or in a square network.
In a single row of :harges where s/RCI is greater than about 2.5, or
in an array where s/Re- > 4, each charge produces a separate eruption and
a separate crater. Wh n s/Rci becomes somewhat sma lier than these
values, each charge sr LIi gives a separate eruption (Fig. 36), but as the
ice debris and the w; er columns fall back again, the ice between the
individual craters i-i subjected to impact, base surge, and violent wave
action. This can fricture the ice between the craters with varying degrees
of fragmentation, dependiag on s/R 0 1 . Under these conditions, the author
has chosen to accept 1 ft/ibh/1 (0.4 m/kg 1 / 3 ) as optimum charge depth
(instead of 0-0.5 ft/ibl/3), in order to increase the base diameter of
the water plume. There are no systematic data to support this judgment,
which is based on data for waterspouts from ice-free surfaces.
Table 5. Efects of charges in ,a tngle row when each charge is close tooptimum for the prevailing ice thickness, and charge dnpth is about It to1.5t. Based on tests by Kartz et al. (1966), Fcnstad and Gerard (1985),and unpublished work by the author.
Approximate width of-_.arge spacing fractured channel, b Fragmentation
(3/Rci ) (b/kei) (b/s)
>2.5 Individual craters As for single crater
2 3.8 1.9 Poor at edges ofchannel and in cuspsbetween craters
1.5 3.4 2.3 Good in mid-channel,
less along edges
1.0 3,4 3.4 Good
-. I 46
b4 "•"•' .
k-S
Figure 36. Shallow-depth multiple charg-es breaking through thin ice.
Charge depth 0.45 hubble radii.
Drawing upon l1mited field data, probable effects of row charges are
Lindicated in Table 5. The charges interact to prodLuce 'I continuous broken
channel when s/R < 2.5. Fragmentation improves anid becomes more uniform as
s/F,,.. decreases, until rhe row of individual charges approximates the
effect of a continuIous linear charge, for which• Hie blast effects spread
cylindrically rather than spherically.
A mnUlti-row array produces more? interference between craters, and the
charge spacingq can be wider than -Lt is in a single row. Th~e logical charge
pattern is a square net of mesh size s. A "dia•uiiond,"' or '5-spotl," pattern
is obtained by rotating the reference axes of a square mesh through 45'.
Limited personal experience with charge arrays indicates that individual
cr.--tý, are formed with F./PRcl > 4, continuous fracture occuxrs with
s/'Rl= 3, adequate" f ragmentat ion is o htained wi th s/ Rcl 2. 7, spacing,
is closer thani necessary with S/Rcl = 2.3, oand spacing is wastefully
clo:se with• s/Ra:, = 2. Fonstad and Gerar'd (1985) deduced an upper limit
for useful interference as s/Rcl = 3.5, which agr•evs reasonably well with
aI value of 3.8 suggested earlier (Mellor 1982.).
47
. -"- .- -¢ -2.-" -" " - " - - " " -- -" " -'
ik---

Design of Multiple Charges for Breaking Thin Ice
If the ice is thin (< I ft; < 0.3 m), the optimum size of a single
charge is small, and the absolute diameter of the resulting crater is also
small (< 15 ft; < 4.5 m). When the objective is to break a wide channel or
a broad area in thin ice with multiple charges, the required number of
optimum charges may be large. Under these circumstances, the effort
involved in drilling and charge emplacemeat can become excessive, and it
may be more efficient in practical terms to use charges that are bigger
than optimum, and to set them fucther apart.
Having made the calculations for optimnum charge size to get a feel for
things, a guess can be made at the total amount of exp'osive that seems
affordable for the job, and a neU charge size can be estimated (e.g. 5 lb
instead of I lb, or 2.5 kg instead of 0.5 kg). The scaled ice thickness
for the new charge weight is then calculated, and the curves of Figure 31
are used to obtain the correspoiuding value, o• Rcl (perhaps taking a
szaled charge depth of about 1 ft/lb 11 3 or 044 m/kg:' 3 , as suggested
earlier). Using the chosen value of s/Rcl, say 2.7, the new value of
charge spacing s Is obtained.
Charges on Top of the Ice Sheet, or Inside It
A small charge placed on top of a thick ice sheet, or in its upper
half, has much the same effect as a cratering charge in semi-infinite ice
(Fig. 37). Figure 38 stummarizes data for the scaled dimensions of the true
1c, \I > \2
Ice -Choge wt W I
S.. . . ."-,,
-w ate r -- _
F- (3,l- en' C DF'• •D OcpI" eo Chage Depth
" . b Il, a''jH H~jHV 2 3 (It an0 IU)
- ,0 6 - 1 2 1- anI Q9:
Be:- C,,I,ca C',A'g- Depi,
i , 4 (1' ano Iu)
1 ( In, a HJ Pg)I, =0
Figure 37. Summary of dimensiovs for the true
crater produced by a small charge inside thickice.
48
- - - - - - - - - -

I 2 '.'w --xr 5-.r Trr W,, ¶,
44-
3,3
"2 4
," ' 2 4 6 I
LL AI__________
0 I 2 (rm/ky I3)
Scaled Chorge Depth
a. Scaled crater radius as a function ofscaled charge depth.
(rn/kg (ii! lb
25L/I' SpringHole
. ose of Cnorge
L- /.C.G of Charge
n . i' ///• Crater Depth Onto
S// " Mosfiy Within
2 ' / t...s R. ngeV/05L-
I F i 7
0 I 2 3 4 5 6 7 (fl/Ib'5)
..- L!I I I _
0 05 10 15 2.0 2.5 (m/kqg)
Scaled Charge Depth
b. Scaled crater depth as a function of scaledcharge depth.
Figure 38. Summary of data for the scaled dimen-sions of the true crater in massive ice. Datafrom Livingston (0960).
49

SI
crater in reep ice. The true crater is the more or less conical region of
fractured ice, as distinct from the apparent crater, which is the visible
open hole. The maximum scaled radius of the true crater, measured at the
ice/air surface, is in the range 3 to 5 ft/lb 1 / 3 (1.2 to 2.0 m/kg 1/3).This maximum is achieved with a scaled charge depth of 3 to 4 ft/lb 1 /3
(1.2 to 1.6 m/kgl/ 3 ). In other words, the true crater for optimum charge
depth is equivalent to a cone with a 450 half-angle.
Corresponding data for the apparent crater are given in Figure 39.
Dimensions of the apparent crater are smaller than those of the true crater
because some of the fractured ice is not grossly displaced, and some
ejected fragments fall back into the crater.
A charge set at, or below, mid-depth can break out to both the ice/air1/3
and the ice/water interfaces, provided that t/2W is less than about 4
ft/lb1/3 (1.6 m/kg /3). However, the ma•iv.,nn scaled radius of the upper or
lower surface fracture zone is likely to drop below the 3-5 ft/lb1/3 (1.2-1/3,
2.0 r/kg ) value for an optimum :ratering charge in very thick ice.
To cut a relatively nartow vertical shaft through thick ice, delayed
deck charges Lai be employed.oSvr charges a plce at diffcrent
depths, and they are fired in rapid sequence, from top to bottom with ap-
propriate delays (Fig. 40). The top charge is designed to produc: the re-
quired hole diameter, in accordance with the cratering data of Figure 38.
Successive charges vent through this crater, and a final charge in the
water beneath the ice f'ushes out ice fragments. An alternative is to
place a well-coupled line charge in a vertical drill hole, with a c1layed
charge in the water to flush out fragments.
When a small unconfined charge is laid on top of thick ice it makes a
superficial crater, with the dimensions given by Figures 38 and 39 for zero
charge depth. The scaled radius of the true crater is 2-3 ft/rb1/3 (0.8-
1.2 m/kgl/ 3 ) at thv surface, but the depth is small, say 0.6 to 1.0.ell 1/3)
ft/lbs/3 (0.24 to 0.4 m/kg''). In order for a surface charge to break
through to the bottom of the ice sheet and to form a penetration crater, as
in Figure 41, the scaled ice thickness has to be less than 2 ft/lbl/5
(0.8 m/kgl/ 3 ). As the scaled ice thickness decreases, the radius of the
crater increases, but it is always much smaller than the radius of the
crater that would be produced by the same charge set in water under the
50

41.) SEMI INFINITE ICE
1.5 •
30.5-
.- 1
0 0.5 1.0 1.5 2.0 2.5 3.0 3.5 4.0 (ft/lbI 1 I I I
0 0.5 1.0 1.5 (m/kg3 )
Burial Depth
a. Scaled crater radius as a function of scaled
4 charge depth.
(rn/kg3' (ft/lb3)
4.0- SEMI INFINITE ICE'.5 .t I--
3.0-
2L .5-
o 2.0-2
F- 0.5 2L'a 1.0
0.5 -
0 0.5 1.0 1.5 •.O 2.5 3.0 3.5 4.0 (ft/lb
0 0.5 1.0 1.5 (m/kg 3)BurilI Depth
b. Scaled crater depth as a function of scaledcharge depth.
Figure 39. Summary of scaled dimensions for appar-
ent craters in massive ice. Data from Livingston
(1960)
5]

0 1 Small cratering charge 10
control hole diameter
Charges fired in sequence with delays :iLaroge : chargee: n in
in order to produce narrow hole
and to clear debris from hole- #. Charge venting upwa'd andalso breaking to base of ice
#4 Relatively large clearing
charge below ice
Ice\
\ -t. ,.- __
Water
Figure 40. Use of delay deck charges to break anarrow shaft through very thick ice.
\II
- Crater DiD Drops
to Zero for:
W f 3/8 (lb and f)
.''i" W:2t3 (kg and m)
Figure 41. Effect of a charge lying on the uppersurface of thin ice.
"base of the ice sheet (Fig. 42). A surface charge is likely to produce
more breakage if it is covered by sandbags, or mudcapped in some other way.
A charge in air above the ice surface is even less effective than a
s,,rface charge. No systematic test results have been reported, but at a
scaled ice thickness of 1 ft/lb11 3 (0.4 m/kg1/3), no crater is formed
when the charge height is 0.5 ft/lb 1 / 3 (0.2 m/kg 1 / 3 ) or more.
52
V V-

(n•g'• (1,/lb )
I5
r~8ose of Ice
2 45
ChOGe ýon05.1,1
C-I0 I5 20 2 5 1, )
025 050 0 7t) 00 (ý/kg
2 co:ed Ice ThCk•$S 0
Figure 42. Effects of surface chargescompared with the effects of under-icecharges. Data for surface charges fromBarash (1966) and Fonstad et al. (1981).
The Physical Basis of Explosive Icebreaking
While it is easy to identify the physical phenomena involved in explo-
sive icebreaking, the relative significance of the various effects is less
easy to deduce from abstract considerations. We therefore have to examine
the test data, taking advantage of the admittedly imperfect empirical
correlations described in the previous sections.
Surveying the general body of field test results, certain facts
emerge:
1. High explosives and gas blasting devices produce craters of about
the same size (D - 15 t) when the blast is properly optimized, but high
velocity explosives give greater fragmentation in the central crater.
2. For high explosives, the crater diameter in thin ice correlates
with the maximum theoretical diameter of the gas bubble, and with the base
diameter of the erupting water column (Fig. 43).
3. Underwater explosions break ice most effectively in the range
where columnar eruptions would occur under ice-free conditions (Fig. 32).
53

- 1 0 1 1 ; I I I J1 iIl lm' -
/'W`3 ©- - -a
(mr/kg /3) 10 r c QD Predicted crater dia. as ice thickness tends to Zero.
1.0 ® Max. bubble dia. for charge depths 0.5-4.0m.
I I/ I I I I
Sd/, 10
0.01 0.1 1.0
d/W,/ 3 (r/kg
Figure 43. Predicted crater diameter in very thin ice com-
pared with the scaled dimensions of explosive eruptions from
an ice-free water surface.
4. Crater dimensions are not much affected by variation of explosive
type (linear dimensions vary with the cube root of the explosive's specific
energy).
5. The maximum crater diameter fOL eXpIuSIULLS is suialler than the
diameter of cracking for slow, radially symmetric flexure of an ice sheet.
For Ice I m thick, the blast crater diameter is about 15 m, whereas the
diameter of the ouLermost circumferential crack for flexure miglt be 50 to
70 m.
6. The specific energy Es for explosive icebreaking is very much
higher than the specific energy for icebreaking by slow flexure. A blast
optimized for maximum crater diameter might give Er M 0.5 MJ/m 3 when it3
is based on heat of explosion (Fig. 34), cr Es 0.1 MJ/m when it is
based on the work of gas expansion. By contrast, slow flexure by a concen-
trated force could give E. in the range 2 to 700 J/m 3 , depending on dis-
.. placement rate.
7. The specific energy for optimized gas blasting devices (E. 0.1
MJ/m3) is the same as the specific energy for high explosives when the
explosive energy is taken as the work of gas expansion (about 20% of the
heat of explosion).
From these observations, the following tentative conclusions might be
drawn:
54

.. Maximum crater size is controlled more by eruptions driven by the
gas bubble than by shock wave shattering of the ice.
2. Since the specific energy for cratering is the same for explosives
and gas blasting devices when "s is based on gas expansion energy, some
of the total energy of a high explosive may be wasted -n icC Cra'.Cing.
3. Variation of explosive type is not very important in determining
crater size.
4. Craters in ice are formed by local high speed piercing rather than
by widespread flexural doming, although there is an annulus around the
crater where the ice breaks by flexure.
If these conclusions are valid, then it should be possible to compile
and correlate test data with closer regard to the physics of the process.
For typical explosives and moderate charge sizes (say up to 500 kg), cube
rn-s root scaling can be retained, and variation of explosive type can be
ignored, or adjusted on the basis of specific energy. If bubble expansion
i3 the dominant effect, charge depth ought to be referred to the water
surface rather than the underside of the ice cover. As an alternative to
cube root scaling, especially if very largp epnonsions are being con-
' - sidered, linear dimensions of the problem could be scaled with respect to
the theoretical maximum bubble radius. Both of these changes to the data
handling scheme have been tried, but the net result in both cases is adeterioration in the empirical correlations. For the time being, the
simple scheme outlined earlier is still in use for practical purposes.
LITERATURE CITED
Barash, R.M. (1966,) Ice-breaking by explosives. U.S. Naval OrdnanceLaboratory, Waite Oak, Silver Spring, Maryland, NOLTR 66-229.
Barash, R.M. (1966b) Measurement o! underwater explosion pulses reflectedfrom an ice layer. In unpublished report, Office of Naval Rescacch,Code 468.
Cole, R.H. (1948) Underwater Explosions. Princeton Univursity Press(republished in 1965 by Dover Puihlications), 437 pp.
Fonstad, C.D. and R. Gerard (1985) Field tests of techniques for explosivecratering of floating ice sheets. In Proceedings, Annual Conference,Canadian Society for Civil Engineering, Saskatoon, p. 341-363.
Glasstone, S. (Ed.) (1962) The effects of nuclear weapons. DA Pamphlet39-3, 730 pp.
55

Jo'lansson, C.H. and P.A. Persson (1970) Detonics of High Explosives.London and New York: Academic Press, 330 pp.
Kurtz, M.K., R.H. Benfer, W.G. Christopher, G.E. Frankenrstpln, C. Vi,, Wyheand E.A. Roguskld r Leport, Operation Break-up, FY66.Ice cratering experiments, Blair Lake, Alaska. Nuclear CrateringGroup, Lawrence Radiation Laboratory, Livermore, California, NCG/TM
66-7 (reprinted ia River Ice Jams, S.J. Bolsenga, ed., 1968, ResearchReport 5-5, U.S. Lake Survey, Detroit).
Livingston, C.W. (1960) Explosions in ice. U.S. Army Snow, Ice and Perma-frost Research Establishment, Technical Rport 75, AD-276605.
Mellor, M. (1972) Data for ice blasting. USA Cold Regions Research andEngineering Laboratory, Technical Note (unpublished).
Mellor, M. (1982) Breaking ice with explosives. USA Cold Regions Researchand Engineering Laboratory, CRREL Re'ort 82-40.
Mellor, M. (1984) Icebreaking by gas blasting. IAHR Ice Symposium,Hamburg.
Mellor, M. (1986) Derivation of guidelines for blasting floating ice. USACold Regions Research and Engineering Laboratory, Special Report86-10.
Slifko, .J.P. (1967) Pressure pulse characteristics ot deep explosions as a
function of depth and range. U.S. Navy NOLTR 67-87 (quoted bySwisdak, 1978, but not seen by this author).
Snay, H.G. (1957) Hydrodynamics of underwater explosions. In Symposium onNaval Hydrodynamics, Office of Naval Research and National ResearchCouncil, NAS/NRC publication 515, p. 325-352.
Swisdak, M.M. (1978) Explosion effects and properties. Part II: Explosioneffects in water. Naval Surface Weapons Center, Technical Report76-116, 109 pp.
Young, G.A. (1971) The physical effects of conventional explosions on theocean environment. U.S. Naval Ordnance Laboratory, White Oak, SilverSpring, Nd., NOLTR 71-120 (distribution unlimited).
Young, G.A. (1973) Plume and ejecta hazards from underwater explosions.U.S. Naval Ordnance Laboratory, White Oak, Silver Spring, Md., NOLTR73-111 (limited distribution - results may be quoted in open
literature).
56