
Engineering in Food & Beverage de Vries - Endress... · C a rg ill Kra ka ta u P AM | LC M ... E+H...
28
03/14/2017 Products Solutions Services Endress+Hauser Engineering in Food & Beverage Slide 1 / 28 Ronald de Vries
-
Upload
hoangthien -
Category
Documents
-
view
213 -
download
0
Transcript of Engineering in Food & Beverage de Vries - Endress... · C a rg ill Kra ka ta u P AM | LC M ... E+H...

03/14/2017
Products Solutions Services
Endress+Hauser Engineering in Food & Beverage
Slide 1 / 28 Ronald de Vries

03/14/2017
Engineering in Food & Beverage
Agenda
• Introduction, Endress+Hauser at a Glance
• Fit for Purpose instruments
• Follow the signal
• Asset Management
• Why and how ?
• Energy management
• Follow the signal
• Example UHT
Slide 2 / 28 Ronald de Vries
03/14/2017
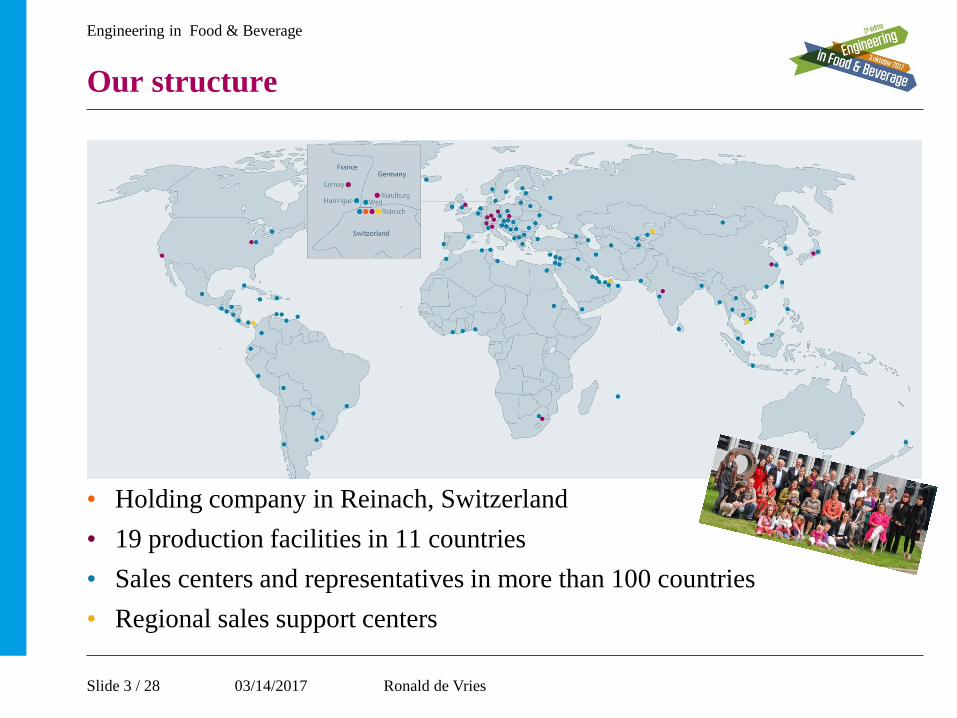
• Holding company in Reinach, Switzerland
• 19 production facilities in 11 countries
• Sales centers and representatives in more than 100 countries
• Regional sales support centers
Engineering in Food & Beverage
Our structure
Slide 3 / 28 Ronald de Vries

03/14/2017
Endress+Hauser at a glance 2014
Our “world”
We provide sensors, instruments, components
and systems for tasks in the field of
• Level measurement
• Flow measurement
• Pressure measurement
• Temperature measurement
• Analytics and sampling
• Data management
• Device communication and integration

03/14/2017
Engineering in Food & Beverage
Instrumentation & (Level |Flow | Pressure | Temperature | Analysis)
Infrastructure
Asset information (AIM)
Device information (DIM)
Calibration CM
Energy monitoring/
management
Inventory (IMS)
Tank Terminal
Management (TTM)
Analyse
ERP
En
gin
eeri
ng
| S
ervic
es |C
on
sult
ancy
Maintenance management
BPI (Business Process Integration) | Middelware |ERP Integration |
Field of activity key focus
Slide 5 / 28 Ronald de Vries

03/14/2017
Engineering in Food & Beverage
Follow the Signal
CMMS : Computerized Maintenance Management
System
CMS : Calibration Management System
DCS : Distributed Control System
EMS : Energy Monitoring System
ERP : Enterprise Resource Planning
MES : Manufacturing Execution System
PAM : Plant Asset Management
PLC : Programmable Logic Controller
SCADA : Supervisory Control And Data
Acquisition
SiS : Safety Instrumented System
User : Process Manager System : MES, EMS (Energy) Data : Not real time (hour/day) Signal : 4-20mA, Fieldbus (digital)
Driver : Efficiency
Energy Management aM&T
User : Quality Assurance/Metrology System : CMS (Calibration) Data : Not real time (week/month) Signal : 4-20mA, Fieldbus (digital)
Driver : Quality
Quality Management
Diagn
ostics
Valu
e /
Asset
infor
matio
n
User : Engineering / Maintenance Systems : PAM, CMMS (Asset) Data : Not real time (hour) Signal : Status (digital)
Driver : Reliability, Availability
Asset and Life Cycle Mngt.
User : Logistics System : ERP (Material Management) Data : Not real time (hour/day) Signal : 4-20mA, Fieldbus (digital)
Driver : Delivery, Flexibility
Inventory Management TankVision
User : Safety System : SiS (Safety) Data : Real time (second) Signal : 4-20mA, Fieldbus (SiS, PROFIsafe)
Driver : Safety, Reliability
Safety Management
User : Operator System : DCS, PLC/SCADA Data : Real time (second) Signal : 4-20mA, Fieldbus (digital)
Driver : Process, Accuracy
Process Management
Slide 6 / 28 Ronald de Vries

03/14/2017
Triangle approach
Platform
Installation Instruments
Demand
Engineering in Food & Beverage
Slide 7 / 28 Ronald de Vries

03/14/2017
Engineering in Food & Beverage
Shorten time to production, Ensure & improve asset performance during operation
Maintenance management
Documentation management
Spare part management
Calibration management
Inspection and monitoring of assets
Performance Monitoring, Maintenance Analysis
Maintenance/Calibration Planning & Scheduling
Device Configuration Management
Asset Information Management
Slide 8 / 28 Ronald de Vries

03/14/2017
Engineering in Food & Beverage
Enable Continuous Improvement
Vision, Mission and Strategy
What is necessary to achieve to support the Vision, Mission and Business Strategy
Install Base Audit
• Criticality of Tags
• Current Level of maintenance
• Migration plan
• MPE Value
Existing Systems
SOP & WI
• Clear assignments
• Checklists
• Inspection
• Calibrations
• Business processes
Adequate Administration
• Right Level of detail, tagnumber level
• Timeliness
• Planning
• Within Specification Out of specification
• Certification
• Time consumption
• Breakdown
Analyses of Data
• Breakdown Overview
• Calibration Data
Focused Maintenance
• Effective result
• Efficient execution
VISION, MISSION &
STRAGTEGY
As Is Audit CONCEPT
DEVELOPMENT IMPLEMENTATIO
N EXECUTION IMPROVEMENT
Continuous
Improvements
Consistent Data
Standardization
of Activities
AS IS Audit High level
Objectives
Objective: Optimum
Availability
Slide 9 / 28 Ronald de Vries

03/14/2017
Engineering in Food & Beverage
Solutions packages and services mix
Your business process philosophy defines the mix
Outsourcing Maintenance Management
Insource Maintenance Management
Maintenance Management
Maintenance Management
Solution Packages
……………………………….
Your Business Process
Your Business Process philosophy
The mix is determined via Consulting
………………
……………… E+H offering mix is based on your strategy mix/operating point
Maintenance Management Services ……………………………….
Solution Packages for Maintenance Management
Service Agreements for Maintenance Management
Slide 10 / 28 Ronald de Vries

03/14/2017
Engineering in Food & Beverage
Slide 11
Information assurance
W@M Enterprise
CER
Serial# Flow
Pressure
Level
Temperature
Dynamic hyperlink / Web Services
Endress+Hauser Product center • Serial number • Order code • Manuals • Certificates • Purchase info Events: • Production info • Calibration info • Repair info Analysis
Endress+Hauser Sales center • Maintenance reports • Calibration reports • Service reports • Repair reports • Inspection reports within maintenance or calibration contracts
Slide 11 / 28 Ronald de Vries

03/14/2017
Self-Monitoring and diagnosis of field devices
4. Failure (F = failure)
2. Check function (C = check)
3. Off-spec (S)
1. Maintenance required (M = maintenance)
OK Device is operating normally
Engineering in Food & Beverage
Slide 12 / 28 Ronald de Vries

03/14/2017
Example: Temperature diagnostic functions
• Sensor drift detection If the measured values of the two sensors deviate by a preset value, a warning signal is given to the PLC.
• Ambient temperature monitoring The temperature of the electronics is controlled constantly.
• Monitoring of the sensor limits The physical measuring range of the connected sensor was exceeded/under-cut.
• Open circuit or short-circuit Failure of the sensor cables is recognized on RTD's and TC's. Short-circuit detection on RTD's.
• Sensor backup In case of a sensor failure the trans-mitter automatically switches to the second sensor and sends a warning signal to the PLC.
• Cable-corrosion-detection Corrosion control on the sensor cables of an RTD 4-wire or TC sensor.
• Simulation active
Engineering in Food & Beverage
Slide 13 / 28 Ronald de Vries

03/14/2017
Reference Topology
Engineering in Food & Beverage
DWG NO REV
0
SCALE 1:1 SHEET 1 OF 1
0
REV. DESCRIPTION DATE BY
PAM | LCM 22-7-2013 KBL
CUSTOMER
FSCM NOSIZE
A4
PROJECT
Cargill Krakatau
PAM | LCM
Plant Asset Management | Life Cycle Management
ET-200iSP/M:RIO PROFIBUS DP/HARTHART-PASSTHROUGH
Profibus DP
Profinet
FlowLevel Pressure Temperature
Control Workstation | HMI
Maintenance Workstation |
Device configuration & Asset Information
Fieldcare central Device configuration &
Device Performance Monitoring (Namur 107 compliant)
W@M Enterprise (Asset information)
DP
PA
Profibus PA
Intelligent Ethernet/PROFIBUS gateway
Ethernet TCP/IP
W@M Portal (CER)
Internet replication
*Note: Before Device Performance
Monitoring (DPM | Namur 107) can be
implemented it’s important to check if the
PLC hardware is compatible.
* see note below
Slide 14 / 28 Ronald de Vries

03/14/2017
Engineering in Food & Beverage
Business Process Integration
Calibration Management
CompuCal
Mobile
Service results from:
- Customer (CMMS)
- E+H (CompuCal)
Manual
Field Calibration
Beamex
MC5 Automated
Field Calibration
Integration
Middleware
Calibration executed
& Managed
Any
System
Integration
Middleware
Middleware
SAP-PM
CompuCal
W@M Portal/Enterprise
Instrument specific
Central Asset information
Asset update
for audit trail
KPI update
In dashboard
Update
Work order
data
Calibration
Work order
Slide 15 / 28 Ronald de Vries

03/14/2017
How is the plant condition and how is it supported when it needs attention?
Engineering in Food & Beverage
OSI
Pi
Service results from:
- Customer (CMMS)
Data Historian
Beamex
MC5
Automated
Field Calibration
Inspection executed
& Managed
Device Performance
Monitoring
OPC UA Middleware
SAP-PM
E+H SMP
via Netviewer
W@M Portal/Enterprise
Instrument specific
Central Asset information
Send notification
to Service supplier
Store data
in historian Update status
in Asset Logbook
Workflow
Slide 16 / 28 Ronald de Vries

03/14/2017
Project Approach projects: Overview and process
Engineering in Food & Beverage
Folie 17
• On site analysis of the installed base.
• Final report and presentation.
• User Requirement specifications
• Functional Design Specifications
•Detailed and modular offer based on the PAM concept.
• Project plan.
• Components delivery and installation.
• Installation of software.
•Inclusion of existing instrument data.
• Commissioning.
• Project management.
• Training.
• Service.
• Analysis and interpretation of the collected data and identification of areas for potential savings
• CMMS
• W@M
(life cycle management)
• Suggestions how to do maintenance on demand to improve efficiency.
• Device performance Monitoring
• KPI
• Develop and implement continuous improvements and thereby increase efficiency
• Scope and budget definition
Inventarisation Concept Implementation Project Evaluation Data Analysis Optimization Continuous
improvement
1 day 1 day 1-2 weeks 1-2 months years
OPEX Savings CAPEX Savings
Slide 17 / 28 Ronald de Vries

03/14/2017
Products Solutions Services
Energy Management
Slide 18 / 28 Ronald de Vries

03/14/2017
Engineering in Food & Beverage
Follow the Signal
CMMS : Computerized Maintenance Management
System
CMS : Calibration Management System
DCS : Distributed Control System
EMS : Energy Monitoring System
ERP : Enterprise Resource Planning
MES : Manufacturing Execution System
PAM : Plant Asset Management
PLC : Programmable Logic Controller
SCADA : Supervisory Control And Data
Acquisition
SiS : Safety Instrumented System
User : Process Manager System : MES, EMS (Energy) Data : Not real time (hour/day) Signal : 4-20mA, Fieldbus (digital)
Driver : Efficiency
Energy Management aM&T
User : Quality Assurance/Metrology System : CMS (Calibration) Data : Not real time (week/month) Signal : 4-20mA, Fieldbus (digital)
Driver : Quality
Quality Management
Diagn
ostics
Valu
e /
Asset
infor
matio
n
User : Engineering / Maintenance Systems : PAM, CMMS (Asset) Data : Not real time (hour) Signal : Status (digital)
Driver : Reliability, Availability
Asset and Life Cycle Mngt.
User : Logistics System : ERP (Material Management) Data : Not real time (hour/day) Signal : 4-20mA, Fieldbus (digital)
Driver : Delivery, Flexibility
Inventory Management TankVision
User : Safety System : SiS (Safety) Data : Real time (second) Signal : 4-20mA, Fieldbus (SiS, PROFIsafe)
Driver : Safety, Reliability
Safety Management
User : Operator System : DCS, PLC/SCADA Data : Real time (second) Signal : 4-20mA, Fieldbus (digital)
Driver : Process, Accuracy
Process Management
Slide 19 / 28 Ronald de Vries

03/14/2017
Triangle approach
Platform
Installation Instruments
Demand
Engineering in Food & Beverage
Slide 20 / 28 Ronald de Vries

03/14/2017
Engineering in Food & Beverage
Motivation for Energy Management
• Reducing energy costs (Save money, KPI)
• Legal and political possibilities (e.g. tax exemptions ,
subsidies eq SDE+, EIA & MIA)
• Improve company image / Marketing / Public relations
• Sustainability management – Strategy for Energy and
Environment
• Management system certification (EMAS, DIN EN 16001,
ISO 50001, DIN ISO 14001)
• Competitive advantages (Cost price)
• Produce and sell „Green“ products and services
• Improvement/ optimization of production processes
Sustainabilit
y
• responsible
• independent
• awareness of values
• eco-friendly
Reasons why energy Management is a current topic in companies
Slide 21 / 28 Ronald de Vries

03/14/2017
Energy Trends
Engineering in Food & Beverage
Energy Solutions
Sustainability
50% of end-consumers require
sustainable products
Product Carbon
Footprint Will be very
important for
each and every
product
DIN ISO 50001 International standard
for energy
management
Cost Savings To gain advantages
against competitors
and be more efficient
Green Image Create sustainable company
image by advertising of
companies green activities
Big Data
Data Integration
Large amounts of data that
will be analyzed and used
for forecasting and
identifying improvements 01
00
101
Rising Energy
Prices Flexible integration of energy
relevant data into other systems
Slide 22 / 28 Ronald de Vries

03/14/2017
Engineering in Food & Beverage
Potential Savings
Research has shown that realistic savings
of 5%-15% are achievable
Slide 23 / 28 Ronald de Vries

03/14/2017
Engineering in Food & Beverage
Topology of an full scale EMS
Slide 24 / 28 Ronald de Vries

03/14/2017
UHT-Temperature curves of product and sensor
Engineering in Food & Beverage
T [°C]
Dropping below
minimum
temperature micro-
biological risks!
Exceedance of
maximum
temperature
loss of quality,
waste of energy!
Product temperature
Temperature signal
competitor insert with
standard technology
Product temperature
Temperature signal
Improvement of
control accuracy!
higher safety
lower costs
Slow control loop: Fast control loop:
t [s]
Standard
control
limits
QuickSens
control
limits
Slide 25 / 28 Ronald de Vries
03/14/2017
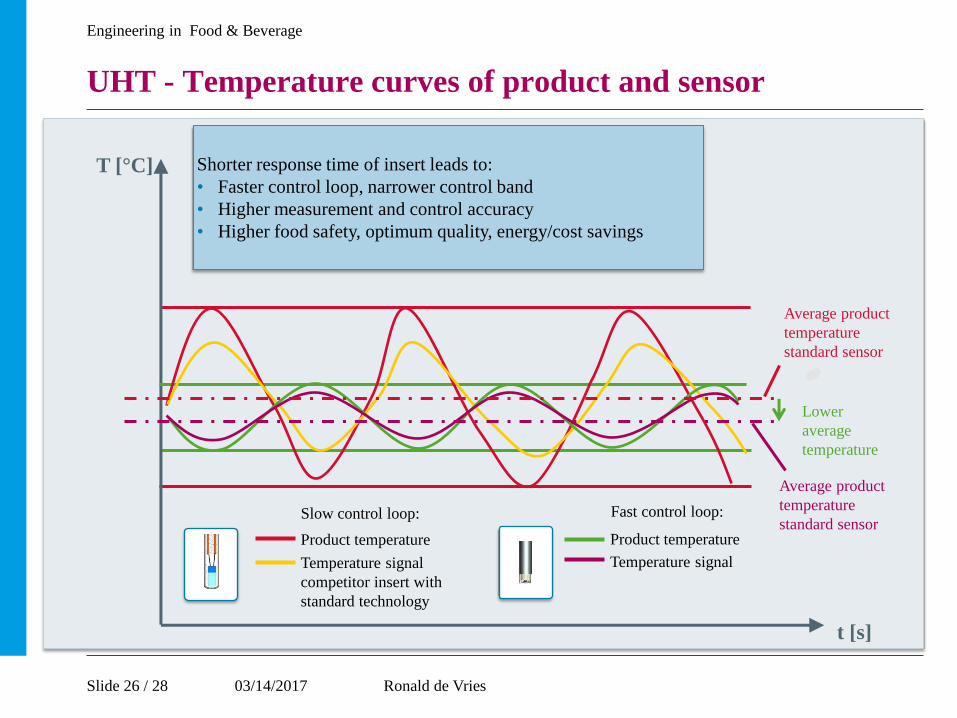
UHT - Temperature curves of product and sensor
Engineering in Food & Beverage
T [°C] Shorter response time of insert leads to:
• Faster control loop, narrower control band
• Higher measurement and control accuracy
• Higher food safety, optimum quality, energy/cost savings
Product temperature
Temperature signal
competitor insert with
standard technology
Product temperature
Temperature signal
Slow control loop: Fast control loop:
t [s]
Lower
average
temperature
Average product
temperature
standard sensor
Average product
temperature
standard sensor
Slide 26 / 28 Ronald de Vries

03/14/2017
UHT - Example calculation for possible cost savings
• 1 UHT treatment module
• Runtime: 5,000 hours per year
• Higher control accuracy by usage of fast response time technology
• Example: decrease of average product temperature by 2 °C through narrower
control bandwidth and faster temperature detection.
2 °C lower average temperature means 30 kg less steam per hour!
Average costs for 1 kg steam = 0.08 €
Engineering in Food & Beverage
30 kg/h x 5,000 h/year x 0.08 €/kg steam =
= 12.000,- €/year
Benefits:
Cost savings of 12.000,- €/year and
at the same time higher food safety!
Slide 27 / 28 Ronald de Vries

03/14/2017
Products Solutions Services
Any questions?
Slide 28 / 28 Ronald de Vries


![Q ;¤CeW27m[oRek¨Uì]Ë. .÷ Endress+Hauser * 2Ý...Endress+Hauser 中国 鸟瞰图 Endress+Hauser 工程师在现场 4 Q ;£CdW17l[nRdk Uë]Ê. .ö Endress+Hauser * 2Ý5 Endress+Hauser](https://static.fdocuments.net/doc/165x107/61269abbaa2e0357dc52fda9/q-cew27moreku-endresshauser-2-endresshauser-ec.jpg)
