Engineering Fracture Mechanics · Fracture toughness of adhesively bonded joints with large plastic...
15
Fracture toughness of adhesively bonded joints with large plastic deformations Xiang-Fa Wu ⇑ , Uraching Chowdhury Department of Mechanical Engineering, North Dakota State University, Fargo, ND 58108, USA article info Article history: Received 26 September 2017 Received in revised form 19 November 2017 Accepted 29 November 2017 Available online 2 December 2017 Keywords: Fracture toughness Adhesively bonded joints (ABJs) Double cantilever beam (DCB) Elastoplastic deformation Elastic springback abstract An elastoplastic fracture mechanics model is formulated for determining the fracture toughness of adhesively bonded joints (ABJs) with large plastic deformations and elastic springback. The analysis is made on the basis of the post-fracture configuration of double cantilever beam (DCB) specimen consisting of two adhesively bonded thin plates of ductile metals (e.g., thin aluminum alloy or mild steel plates). Due to the springback after large plastic deformation, the post-fracture configuration of the adherends was noticeably differ- ent from that at the peak loading. To model the fracture process, the ductile metal adher- ends are treated as elastoplastic solids with power-law strain-hardening behavior, and springback of the adherends is considered in the strain energy calculation. The present model is capable of determining the fracture toughness of ABJs with extensive plastic deformation. Numerical simulations are performed to evaluate the effects of material parameters and specimen geometries on the springback and fracture toughness of the ABJs. Compared to the experimental data available in the literature, the present model can predict reliable fracture toughness of ABJs with large plastic deformations. The present study is applicable for the analysis of various fracture tests of thin ductile films with large plastic deformations and elastic springback such as peeling test, metal cutting, etc. Ó 2017 Elsevier Ltd. All rights reserved. 1. Introduction Adhesively bonded joints (ABJs) have been used extensively in aerospace, aeronautical and ground vehicles for bonding and connecting thin structural parts, repairing surface defects, etc. [1–4]. A number of robust joint models have been formu- lated and implemented for joint design and strength analysis [5–9]. Superior to traditional mechanical joints, e.g., bolted and welded joints, a major technological advantage of ABJs is their low material and labor costs, high joining strength and fatigue durability, efficient load-transferring capability, and noticeable weight reduction of the joining parts. In the view of struc- tural integrity, bonding strength and fatigue durability are the dominate factors governing the mechanical performance of ABJs. Subjected to external loading, ABJs typically exhibit complicated stress and strain state due to their complex geome- tries and mismatch of material properties across the bonding lines of the adherends. Therefore, in-depth understanding of the strength and failure mechanisms of ABJs is crucial to better design and more reliable and predictable performance of engineered ABJs. So far, remarkable efforts have been dedicated to the investigation on the toughening and failure mecha- nisms ABJs made of metals and composite materials and related structural design and strength analysis [10–13]. https://doi.org/10.1016/j.engfracmech.2017.11.040 0013-7944/Ó 2017 Elsevier Ltd. All rights reserved. ⇑ Corresponding author. E-mail address: [email protected] (X.-F. Wu). Engineering Fracture Mechanics 190 (2018) 16–30 Contents lists available at ScienceDirect Engineering Fracture Mechanics journal homepage: www.elsevier.com/locate/engfracmech
Transcript of Engineering Fracture Mechanics · Fracture toughness of adhesively bonded joints with large plastic...

Engineering Fracture Mechanics 190 (2018) 16–30
Contents lists available at ScienceDirect
Engineering Fracture Mechanics
journal homepage: www.elsevier .com/locate /engfracmech
Fracture toughness of adhesively bonded joints with largeplastic deformations
https://doi.org/10.1016/j.engfracmech.2017.11.0400013-7944/� 2017 Elsevier Ltd. All rights reserved.
⇑ Corresponding author.E-mail address: [email protected] (X.-F. Wu).
Xiang-Fa Wu ⇑, Uraching ChowdhuryDepartment of Mechanical Engineering, North Dakota State University, Fargo, ND 58108, USA
a r t i c l e i n f o a b s t r a c t
Article history:Received 26 September 2017Received in revised form 19 November 2017Accepted 29 November 2017Available online 2 December 2017
Keywords:Fracture toughnessAdhesively bonded joints (ABJs)Double cantilever beam (DCB)Elastoplastic deformationElastic springback
An elastoplastic fracture mechanics model is formulated for determining the fracturetoughness of adhesively bonded joints (ABJs) with large plastic deformations and elasticspringback. The analysis is made on the basis of the post-fracture configuration of doublecantilever beam (DCB) specimen consisting of two adhesively bonded thin plates of ductilemetals (e.g., thin aluminum alloy or mild steel plates). Due to the springback after largeplastic deformation, the post-fracture configuration of the adherends was noticeably differ-ent from that at the peak loading. To model the fracture process, the ductile metal adher-ends are treated as elastoplastic solids with power-law strain-hardening behavior, andspringback of the adherends is considered in the strain energy calculation. The presentmodel is capable of determining the fracture toughness of ABJs with extensive plasticdeformation. Numerical simulations are performed to evaluate the effects of materialparameters and specimen geometries on the springback and fracture toughness of theABJs. Compared to the experimental data available in the literature, the present modelcan predict reliable fracture toughness of ABJs with large plastic deformations. The presentstudy is applicable for the analysis of various fracture tests of thin ductile films with largeplastic deformations and elastic springback such as peeling test, metal cutting, etc.
� 2017 Elsevier Ltd. All rights reserved.
1. Introduction
Adhesively bonded joints (ABJs) have been used extensively in aerospace, aeronautical and ground vehicles for bondingand connecting thin structural parts, repairing surface defects, etc. [1–4]. A number of robust joint models have been formu-lated and implemented for joint design and strength analysis [5–9]. Superior to traditional mechanical joints, e.g., bolted andwelded joints, a major technological advantage of ABJs is their lowmaterial and labor costs, high joining strength and fatiguedurability, efficient load-transferring capability, and noticeable weight reduction of the joining parts. In the view of struc-tural integrity, bonding strength and fatigue durability are the dominate factors governing the mechanical performance ofABJs. Subjected to external loading, ABJs typically exhibit complicated stress and strain state due to their complex geome-tries and mismatch of material properties across the bonding lines of the adherends. Therefore, in-depth understanding ofthe strength and failure mechanisms of ABJs is crucial to better design and more reliable and predictable performance ofengineered ABJs. So far, remarkable efforts have been dedicated to the investigation on the toughening and failure mecha-nisms ABJs made of metals and composite materials and related structural design and strength analysis [10–13].
Nomenclature
A material constant of a power-law nonlinear elastic solidh adherend thickness of an adhesively bonded jointE Young’s modulusI moment of inertia of the cross-section area of an adherend of unit width (=h3/12)M bending moment acting on an adherendMc critical bending moment to initiate yielding in adherendsn exponent of a power-law nonlinear elastic solid; strain-hardening index of a power-law hardening solidR1, R2 radii of curvature of two post-fracture adherends after springbacky coordinate of a material point from the adherend neutral axisyc location of the critical point between regions of plastic and elastic deformationC fracture toughness; strain energy release rateDl crack growth lengthDW1, DW2 work done by the bending moment acting on two adherends, i.e., DWi (i = 1,2)DU1, DU2 strain energy stored in two adherends, i.e., DUi (i = 1,2)De axial strain release at location y of a plastically deformed adherend after unloading [=y(1/qm-1/q)]e axial strain of an adherende0 axial yield strain (=r0/E)ep residual axial strain of a plastically deformed adherend after unloadingg axial strain at adherend surface [=h/(2q)]gm axial strain at adherend surface at the maximum bending moment [=h/(2qm)]q radius of curvature of the adherend neutral axis at bending moment Mq0 radius of curvature of the neutral axis of a plastically deformed adherend after unloadingqm radius of curvature of the neutral axis of a plastically deformed adherend at the maximum bending moment, i.e.,
minimum radius of curvaturer flexural stress of an adherendr0 yield strengthABJ adhesively bonded jointCLS cracked lap shearDCB double cantilever beamERR (strain) energy release rateFEM finite element methodLEFM linearly elastic fracture mechanicsPMC polymer matrix compositeSSY linearly elastic facture mechanics
X.-F. Wu, U. Chowdhury / Engineering Fracture Mechanics 190 (2018) 16–30 17
In the view of structural applications, characterization and enhancement of the fracture toughness of ABJs are crucial toimprove their structural integrity and safety. Quite a few efficient and reliable mechanical characterization techniques andrelated specimen designs have been formulated and standardized for evaluating the fracture toughness of ABJs, e.g., thosebased on double cantilever beams (DCB), cracked lap shear specimens (CLS), four-point bending specimens, etc. [11,12].Accordingly, substantial progress has been made in fracture mechanics of layered structures including those carrying thegeometries close to ABJs. Systematic studies of mixed-mode cracks in layered materials and composites have been per-formed by Hutchinson and Suo [14,15] and others, in which the energy release rate (ERR) of crack initiation and propagationand related crack mode partition have been obtained with the aid of the elementary beam theory. These fundamental inves-tigations have been extensively utilized for the analysis of interfacial fracture and buckling delamination in broad layeredmaterials and structures including ABJs, surface coatings, ceramics, and laminated polymer matrix composites (PMCs). Inaddition, for the purpose of accurately predicting the mixed-mode crack growth in layered materials, crack-tip elementswere formulated and integrated into conventional finite element methods (FEM) by Davidson, et al. [16–18]. The effect ofcrack tip deformation on mixed-mode crack growth in bonded layers was investigated by Wang and Qiao [19]. In addition,elasticity theories may be resorted for analyzing interfacial cracks embedded in thick beams. Yet, only a few simple cases ofinterfacial cracks embedded in elastic strips can be solved in explicit forms, e.g., the cases of simple cracked strips treated byWu et al. [20–23], and elastic solutions to more general cases of ABJs can be obtained in high accuracy by evoking efficientsemi-analytic methods and purely numerical methods (e.g., FEM).
Experimentally, the fracture toughness of ABJs can be determined by measuring the critical external force and displace-ment or the work done by external forces per unit crack growth. With the fracture test data, fracture mechanics and classiccrack solutions can be utilized to extract the fracture toughness and crack mode partition. As a matter of fact, most crack

18 X.-F. Wu, U. Chowdhury / Engineering Fracture Mechanics 190 (2018) 16–30
solutions to common fracture specimens available in the literature are obtained within the framework of linearly elastic frac-ture mechanics (LEFM), in which small-scale yield (SSY) is assumed at crack tip. Obviously, fracture of ABJs with large plasticdeformation is beyond the consideration of LEFM while the fundamental concepts of fracture mechanics are still workable.When considering the fracture of ABJs made of thin ductile metal plates, plastic deformation in the ductile adherends con-tributes substantially to the energy dissipation and has to be taken into account for accurate estimate of the relevant fracturetoughness [24–33]. In the special cases of nonlinear elastic solids, Atkins et al. [34] and Li and Lee [35] formulated the ana-lytic solutions to the ERRs of DCB specimens. Yet, these crack models and solutions are not applicable for the realistic elasto-plastic fracture with large plastic deformation and afterward elastic springback due to crack-growth induced unloading.
In their experimental studies, Thouless et al. [26] formulated an effective steady fracture test scheme for evaluating thefracture toughness of ABJs made of thin metal plates. In the test, a symmetric configuration of the fracture specimens of ABJs(Dimensions: 90 mm � 20 mm) was utilized, in which two identical aluminum-alloy (5754 aluminum, Alcan Rolled ProductsCo.) or mild-steel (draw-quality, special-killed, cold-rolled steel, Inland Steel Co. with a nominal yield stress of 170–240 MPa)plates were adhesively bonded, as shown in Fig. 1. Three commercially available toughened epoxies were used to bond theductile metal plates, i.e., adhesives A (Ciba-Geigy LMD1142), B (Ciba-Geiyy XD4600), and C (Essex 73,301), which werecurved at 180 �C for 30 min. in an air-circulating oven [26]. The bond length of the ABJ specimens was 30.0 mm, whichwas established by placing a strip of Teflon tape (12.7 mm in width) across each adherend 30 mm from the ends of theadherend. The thickness of the adhesive layer was controlled by sprinkling a few glass beads of the diameter 0.25 mm onthe adhesive. The ABJ specimens were clamped during curing, and the excess adhesives at the sides and end of the ABJs werefiled off. The steady dynamic fracture test was performed at room temperature (21 �C) on an instrumented dynamic testingmachine (Dynatup, General Research Corp., Model GRC 8250) based on a drop weight method. The testing specimen waspositioned over a hardened steel wedge with a tip radius of 1 mm and a wedge angle of 10.0�. The tip of the wedge was keptto align with a locating mark scribed on the side surface of the ABJ specimen, 10 mm from the edge of the adhesive. Theimpactor force was generated by a mass of 44.85 kg, which pushed the wedge through the ABJ specimen, resulting in thetwo adherends to bend and the adhesive to fracture, as illustrated in Fig. 2. The impact speed upon striking the specimenwas 2 ± 0.2 m/s. After the fracture test, the radii of curvature of the two post-fracture metal adherends carried a small vari-ation due to the uncontrollable factors in the fracture event. The fracture toughness was determined conveniently by using arelation [26]:
Fig. 1.adhesivdynam
C ¼ AnðhÞnþ2
2nðnþ 2Þðnþ 1Þ1
Rnþ11
þ 1Rnþ12
!: ð1Þ
In above, R1 and R2 are the radii of curvature measured from two post-fracture adherends of the ABJ specimen with largeplastic deformations, h is the adherend thickness, and A and n are the material constants of the nonlinear elastic materialmodel:
r ¼ Aen: ð2Þ
Thouless et al. [26] indicated that data reduction of the ABJ fracture tests based on relation (1) might result in theextracted fracture toughness only half the experimental values obtained in other control fracture tests. Kinloch andWilliams[36,37] attributed such a large deviation of fracture toughness to the root rotation of the adherends during crack advance,which is incompatible with the steady fracture test method [38]. Further examination of the derivation of fracture toughness(1) shows that two potential factors may noticeably influence the extraction of the fracture toughness from the fracture testdata as addressed in the late discussions [28,29,36–38]. First, Thouless et al. [26] used a nonlinear elastic material model toapproach the material property of the well-ductile metals employed in their steady dynamic fracture tests. In fact, elasticspringback of the fracture specimens after elastoplastic deformation was ignored in their calculation, which noticeablyaltered the radii of curvature of the adherends R1 and R2 as used in relation (1) by Thouless et al. [26]. The actual radii ofcurvature of the adherends at the maximumworking moment (with the largest elastoplastic deformation) were much smal-ler than the ones measured from the post-fracture adherends after elastic springback, especially for those ABJs made of verythin ductile metal plates which bore very large plastic deformations and afterward large elastic springback. Thus, the theo-retical simplification for the convenience of data reduction by Thouless et al. [26] might have noticeably underestimated thesteady working moment that was consequently utilized for determining the fracture toughness of the ABJs. Second, due to
Adhesive90.0 mm
30.0mm
40.0mmTeflon tape
Wedge tip location
Metal plates
Schematic configuration of a fracture specimen used by Thouless et al. [26] consists of two 90-mm length metal coupons of identical thickness,ely bonded with toughened epoxy over 30 mm at one side. The tip of the wedge is positioned at the left end of the Teflon tape at the beginning of theic test.

R1R2
Hammer
ABJ Specimen
Stationary Wedge
Fig. 2. Experimental configuration of the instrumented impact fracture test, in which the fracture ABJ specimen was split by being driven over a wedgeunder the low-speed moving hammer, and large elastoplastic deformation and afterward elastic springback exhibited.
X.-F. Wu, U. Chowdhury / Engineering Fracture Mechanics 190 (2018) 16–30 19
the large elastic springback in the thin ductile adherends of the ABJs, the actual strain energy stored in the post-fractureadherends is appreciably lower than that calculated without elastic springback. Such a combined effect is expected to sub-stantially underestimate the fracture toughness of the ABJs by using relation (1).
With the above knowledge of the fracture of ABJs with large plastic deformations, the goal of the present study is aimed toreinvestigate and resolve the large deviation between the experimental results and existing theoretical approach by adopt-ing an elastoplastic material model with elastic springback to approach the loading and unloading mechanical behavior ofABJs made of thin metal plates in the fracture tests. During the procedure, based on the radii of curvature of the adherendsmeasured from the post-fracture specimens, the adherend radii of curvature at the maximum working moment are to bedetermined via springback analysis of the adherends. The strain energy stored in the elastoplastically deformed adherendscan be calculated in three terms, i.e., the linearly elastic portion, the strain-hardening portion, and the unloading portion. Theproposed elastoplastic fracture mechanics model will be utilized to extract the fracture toughness of ABJs with large plasticdeformations based on the experimental fracture data reported in the literature [26]. Numerical experimentation will be per-formed to examine the elastic springback effect on the fracture toughness of ABJs with varying Young’s modulus, yield stress,strain hardening index, and the specimen geometries. Discussions on the present fracture mechanics model and its compar-ison with those available in the literature will be further made.
2. Model formulation of ABJs with large plastic deformations and springback under pure bending
The analysis of steady dynamic fracture test of ABJs performed by Thouless et al. [26] was based on the work done by awedge and the strain energy stored in the ABJ adherends after large nonlinear elastic deformation. In their model, the mea-sured radii of curvature of the two elastoplastically deformed adherends of the ABJs were not corresponding the maximumworking bending moment due to elastic springback. In addition, a substantial portion of the strain energy release wasignored due to the springback of the post-fracture adherends. As a result, the fracture toughness of the ABJs was determinedby calculating the nonlinear elastic strain energy of the ABJs. Herein, both the large elastoplastic deformation and elasticspringback of the ductile adherends of the ABJ specimens are to be considered. During the fracture event, both adherendsof the ABJ specimens underwent loading and unloading. Large elastoplastic deflection happens at the bending root (cracktip) under the action of the working moment exerted by the wedge. The measured radii of curvature of the adherendsare the ones after substantial elastic springback due to unloading. Springback results in the fact that the radii of curvaturemeasured from the post-fracture adherends are much larger than the ones at the instant of the maximum working momentwhich drives the fracture event. Such a steady fracture scenario was ignored in extracting the fracture toughness of thetested ABJs made of thin ductile metal plates in the previous studies such that the actual steady elastoplastic fracture of ABJswas simplified as a process of nonlinear elastic process without obvious elastic springback [26,27,33,36–38]. Hereafter, forthe purpose of the present modeling, the material properties of ABJs made of thin aluminum and steel plates are assumed tobe elastoplastic solids following a power-law strain-hardening law [39]:

Fig
20 X.-F. Wu, U. Chowdhury / Engineering Fracture Mechanics 190 (2018) 16–30
r ¼Ee; ðr 6 r0Þr0
ðr0=EÞn en; ðr > r0Þ
(ð3Þ
where E is the Young’s modulus, r0 the yield strength for both tension and compression, and n is the strain-hardening index.The representative strain-stress curve is illustrated in Fig. 3. For n ? 1, the material model covers that of linearly elasticmaterials, while n?1, the material model covers that of idealized elastoplastic materials.
Let us treat both the symmetric adherends of the ABJs as Euler-Bernoulli beams and the flexural strain in the beam cross-section of each adherend is linearly varying for both elastic and elastoplastic deformations:
e ¼ y=q; ð4Þ
where q is the radius of curvature of the neutral axis of each deflected adherend, and y is the distance from a material pointof interest in the adherend cross-section to its neutral axis (i.e., the mid-plane of the adherend), as shown in Fig. 4. The crit-ical bending moment per unit specimen width to initiate the plastic deformation in each adherend isMc ¼ r0h2=6: ð5Þ
Thus, given an external bending moment M >Mc, plastic deformation initiates and elastic springback is triggered oncecrack grows and unloading at crack tip happens.
Hereafter, we first determine the relationship between the bending moment M acting at one adherend and the corre-sponding radius of curvature q of the neutral axis of the adherend in the case of pure bending (loading and unloading). Basedon the assumption of Euler-Bernoulli beam, the axial strain in the adherend linearly varies following relation (4), and thestress distribution follows relation (3). The locus yc of the critical point, at which plastic deformation initiates, can be deter-mined as
yc ¼ qe0; ð6Þ
where e0 = r0/E is the yield strain. With the aid of the constitutive relation of the material as shown in Eq. (3), the relation-ship between the loading moment M (per unit width) and the resulting radius of curvature of the neutral axis isMðqÞEI=q
¼ 1� 3nþ2
� �ge0
� ��3þ 3
nþ2ge0
� �n�1; ðg > e0Þ
1; ð0 6 g 6 e0Þ
8<: ð7Þ
where I is the moment of inertia of the adherend cross-section (per unit width) such that I = h3/12 (rectangular cross-section)and g = h/(2q). As a check, in the limiting case g = e0, relation (7) recovers the critical bending moment Mc in relation (5).Given an arbitrary working bending moment M, the radius of curvature q of the adherend can be determined by solving thenonlinear Eq. (7) numerically with respect to 1/q as to be demonstrated in Section 4, and the corresponding maximum axialstrain at the top and bottom surfaces of the adherend is h/(2q).
After complete unloading due to crack growth as illustrated in Fig. 3, elastic springback happens in the post-fractureadherends of the ABJs. Thus, the radii of curvature measured from the post-fracture adherends (after elastic springback)become larger than those at the maximumworking moment. By assuming the radius of curvature of an adherend after com-plete elastic springback (i.e., complete unloading) to be q0, the recovered elastic strain is
De ¼ y1qm
� 1q0
� �; ð8Þ
where qm is the radius of curvature of the neutral axis of the adherend at the maximum working moment. Therefore, for amaterial point of location y at a strain-hardening state (r, e) such that r > r0 and e > e0, the residual plastic strain ep can bedetermined according to the strain-stress relation in Fig. 3:
ε
σ
E
Unloading
Loading
Loading
Unloading
. 3. Schematic diagram of the stress-strain relation of elastoplastic materials with power-law strain-hardening under loading and unloading.

y yM
ε=y/ρ0
(b)
h
σ
(a)
M
M
OO
Fig. 4. Adhesively bonded double cantilever beam (DCB) under the action of pure bending moment M: (a) Specimen loading configuration and (b)Schematic strain and stress distributions across the beam thickness.
X.-F. Wu, U. Chowdhury / Engineering Fracture Mechanics 190 (2018) 16–30 21
ep ¼ yqm
� 1en�10
yqm
� �n
: ð9Þ
In the limiting case of linearly elastic material, i.e., n = 1, it leads to ep = 0 as expected. After complete unloading, the netbending-moment resultant in any cross-section of the adherends must be zero as the result of bending-moment self-equilibrium at each cross-section, i.e.,
Z yc�yc
Eeydyþ 2Z h=2
yc
Eðe� epÞydy ¼ 0; ð10Þ
where yc is the critical location specified in Eq. (6) for qm, and e is the linear axial (flexural) strain:
e ¼ y=q0: ð11Þ
It can be observed from relation (10) that after complete unloading, the elastic region near the neutral axis of the adher-ends still keeps the similar stress state though the stress level diminishes. However, the elastoplastic region far from theelastic region switches the stress direction to maintain the global bending moment-free of the adherend cross-section.
Substitution of Eqs. (9) and (11) into Eq. (10) yields the relation for determining the radius of curvature q0 of the neutralaxis of the adherends after elastic springback as
g0
gm¼ 1� 1� 3
nþ 2
� �gm
e0
� ��3
� 3nþ 2
gm
e0
� �n�1
; ð12Þ
where gm = h/(2qm) and g0 = h/(2q0). As a check, in the limiting case of linearly elastic material, i.e., n = 1, it leads to gm/g0
? 0, i.e., q0 ? 1, and the ABJ adherends recover their initial straight state after purely elastic unloading. The radius of cur-vature q0 in Eq. (12) is measured from each post-fracture adherend after complete elastic springback. Given a radius of cur-vature q (qm < q < q0) in the unloading process, the corresponding bending moment per unit width can be determinedsimilar to relation (7) as
MðqÞEI=qm
¼ ggm
� 1� �
þ 1� 3nþ 2
� �gm
e0
� ��3
þ 3nþ 2
gm
e0
� �n�1
; ð13Þ
where g = h/(2q). In the limiting case of linearly elastic material, i.e., n = 1, it reads
MðqÞ ¼ Eh3
12q; ð14Þ
as expected. With the measured radius of curvature q0 of the fractured adherends after complete springback, relation (12)can be employed for determining the radius of curvature qm at the maximum working moment implicitly, and relations (7)and (13) are the moment-curvature relations during loading and unloading processes, respectively.
3. Fracture toughness of plastically deformed ABJs
Based on the fracture testing configuration, the fracture toughness of an elastoplastically deformed ABJ can be expressedas
C ¼ DW1 þ DW2 � DU1 � DU2
Dl; ð15Þ
22 X.-F. Wu, U. Chowdhury / Engineering Fracture Mechanics 190 (2018) 16–30
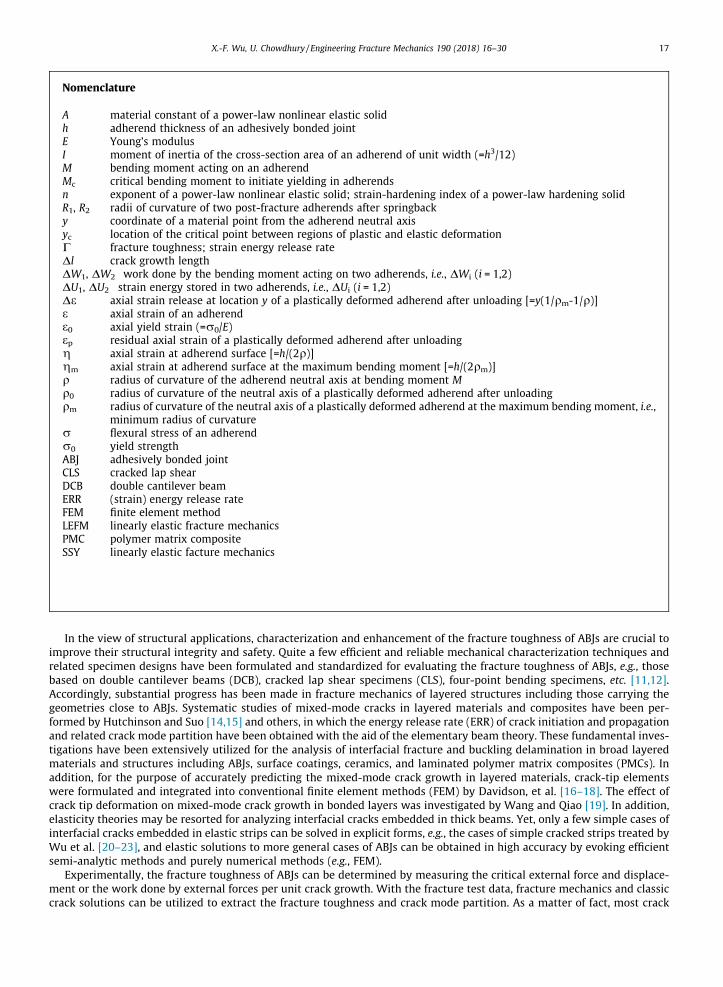
where DWi and DUi (i = 1, 2) are the work done by the external working moment M and the strain energy stored in eachadherend of the ABJ per unit width, respectively, for a crack growth Dl. Since the impact fracture test is a steady dynamicprocess, the maximum working moment can be determined by Eq. (7) for q = qm. Thus, in relation (15), the work DW doneby the working moment M in each adherend (per unit width) for a crack growth Dl is
Fig. 5.
Fig. 6.(unit ad
DWEhDl
¼ 13� 1nþ 2
� �e20
gm
e0
� ��1
þ 1nþ 2
e20gm
e0
� �nþ1
: ð16Þ
κ=1/ρ
M(ρ)
1/ρc
Unloading
Loading
1/ρm 1/ρ0
M(ρc)
M(ρm)
Strain energy
Curvature
Schematic diagram of the loading and unloading moment-curvature relation of the elastoplastic ABJ adherends in a steady dynamic fracture test.
0 0.01 0.02 0.03 0.040
200
400
600
800
1000
1200
1400
Curvature 1/ρ (1/mm)
Ben
ding
mom
ent M
(N*m
m/m
m)
n decreases
Thickness: h = 3 mm; E=69 GPa; σ0 = 113 MPan = 0.0, 0.1, 0.2, 0.3, 0.4 & 0.5; ρmin = 25 mm
Ben
ding
mom
ent M
(N*m
m/m
m)
0 0.01 0.02 0.03 0.040
500
1000
1500
2000
2500
3000
Curvature 1/ρ (1/mm)
n decreases
Thickness: h = 4 mm; E=69 GPa; σ0 = 113 MPan = 0.0, 0.1, 0.2, 0.3, 0.4 & 0.5; ρmin = 25 mm
0 0.01 0.02 0.03 0.040
20
40
60
80
Curvature 1/ρ (1/mm)
n decreases
Thickness: h =1 mm; E=69 GPa; σ0 = 113 MPan = 0.0, 0.1, 0.2, 0.3, 0.4 & 0.5; ρmin = 25 mm
Ben
ding
mom
ent M
(N*m
m/m
m)
0 0.01 0.02 0.03 0.040
100
200
300
400
500
Curvature 1/ρ (1/mm)
n decreases
Thickness: h =2 mm; E=69 GPa; σ0 = 113 MPan = 0.0, 0.1, 0.2, 0.3, 0.4 & 0.5; ρmin = 25 mm
Ben
ding
mom
ent M
(N*m
m/m
m)
The loading and unloading moment-curvature diagrams of aluminum-alloy adherends with varying thickness and material strain-hardening index nherend width).

X.-F. Wu, U. Chowdhury / Engineering Fracture Mechanics 190 (2018) 16–30 23
Correspondingly, the strain energy DU stored in each adherend of the ABJs (per unit width) after complete elastic spring-back due to crack growth Dl can be expressed as
Fig. 7.adheren
DU ¼Z qc
1
Eh3
12qd
1q
� �þZ qm
qc
MðqÞd 1q
� �� 12MðqmÞ
1qm
� 1q0
� �" #Dl; ð17Þ
where q0 = h/(2e0) is the critical radius of curvature to initiate plastic deformation in the adherends, e0 = r0/E is the yieldstrain of the adherends, and M(qm) is the working moment at the minimum radius of curvature qm, i.e., the maximum work-ing moment to drive the facture event. The strain energy integration (17) is illustrated in Fig. 5, in which the 1st term is thestrain energy stored in the linearly elastic loading region, the 2nd term is the strain energy stored in the strain-hardeningloading region withM(q) specified in relation (7), and the 3rd term is the strain energy release in the springback region withM(q) specified in relation (13). These three terms correspond to the entire elastoplastic deformation process of the cross-section of the ABJ adherends during the crack growth in the steady dynamic fracture test. Substitution of relations (7)and (12) into Eq. (17) yields the total strain energy DU stored in the each adherend of the ABJs per unit width after completeelastic springback as
DUEhDl
¼ e206þ e20
3�e0 1� 3
nþ 2
� �ðg�1
m � g�1c Þ þ 3
ðnþ 1Þðnþ 2Þ e�ðnþ1Þ0 gðnþ1Þ
m � gðnþ1Þc
� ��
� 16gmðgm � g0Þ 1� 3
nþ 2
� �e30g
�3m þ 3
nþ 2e�nþ10 gn�1
m
�; ð18Þ
wheregm = h/(2qm),g0 = h/(2q0), and q0 is the radius of curvature of the fractured adherend that is measured from the post-fracture adherend after complete elastic springback. Substitution of relations (16) and (18) for both adherends into Eq. (15)
0 0.01 0.02 0.03 0.040
5
10
15
20
25
Curvature 1/ρ (1/mm)
Ben
ding
mom
ent M
(N*m
m/m
m)
n decreases
Thickness: h = 0.5 mm; E= 200 GPa; σ0 = 205 MPan = 0.0, 0.05, 0.1, 0.2, 0.25 & 0.35, ρmin = 25 mm
Curvature 1/ρ (1/mm)0 0.01 0.02 0.03 0.04
0
20
40
60
80
100
120
140
Ben
ding
mom
ent M
(N*m
m/m
m)
n decreases
Thickness: h = 1 mm; E= 200 GPa; σ0 = 205 MPan = 0.0, 0.05, 0.1, 0.2, 0.25 & 0.35, ρmin = 25 mm
0 0.01 0.02 0.03 0.040
100
200
300
400
500
600
700
Curvature 1/ρ (1/mm)
Ben
ding
mom
ent M
(N*m
m/m
m)
n decreases
Thickness: h = 2 mm; E= 200 GPa; σ0 = 205 MPan = 0.0, 0.05, 0.1, 0.2, 0.25 & 0.35, ρmin = 25 mm
Ben
ding
mom
ent M
(N*m
m/m
m)
0 0.01 0.02 0.03 0.040
400
800
1200
1600
Curvature 1/ρ (1/mm)
n decreases
Thickness: h = 3 mm; E= 200 GPa; σ0 = 205 MPan = 0.0, 0.05, 0.1, 0.2, 0.25 & 0.35, ρmin = 25 mm
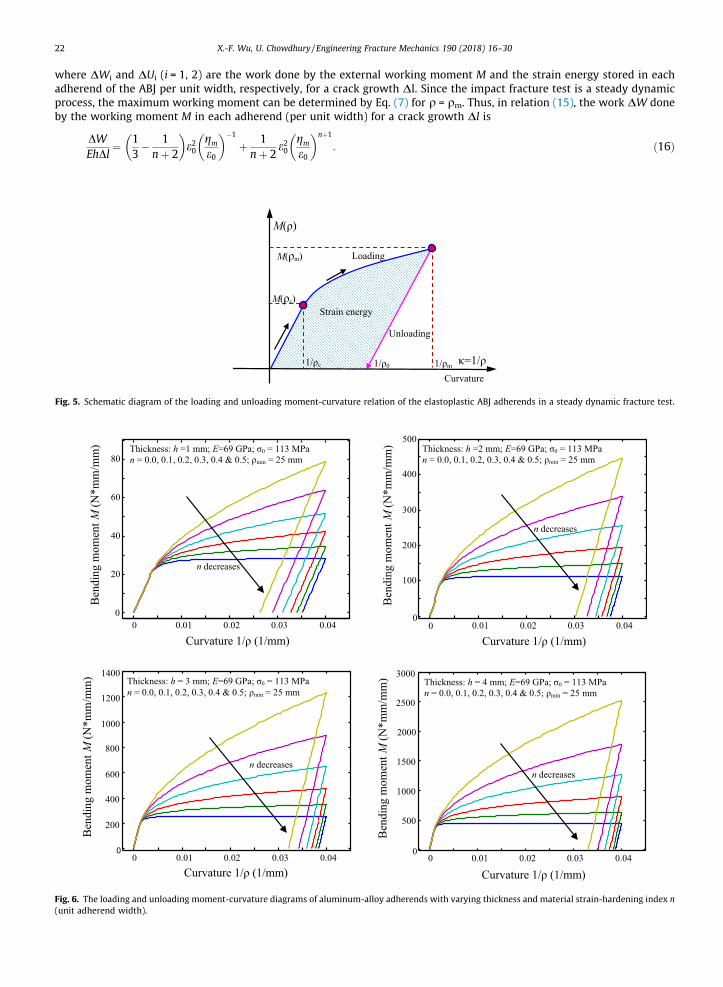
The loading and unloading moment-curvature diagrams of mild-steel adherends with varying thickness and material strain-hardening index n (unitd width).

24 X.-F. Wu, U. Chowdhury / Engineering Fracture Mechanics 190 (2018) 16–30
yields the fracture toughness of the ABJs, which is the energy dissipated by the adhesive layer to generate a unit-area crackgrowth. In the particular case of the ABJs made of two identical adherends, the fracture toughness (15) can be recast as
Table 1Fracturn, and r
h (m
Adhe1.012.003.00
Adhe1.012.003.00
Adhe1.012.003.00
Note: Rdirectlyobtaine
Table 2Fracturand rad
h (m
Adhe0.911.141.41
Adhe0.711.141.41
Adhe0.520.911.41
Note: Rdirectlyanalyzi
C2Eh
¼ 13� 1nþ 2
� �e30g
�1m þ 1
nþ 2e�nþ10 gnþ1
m � e206
� e203
�e0 1� 3nþ 2
� �ðg�1
m � g�1c Þ þ 3
ðnþ 1Þðnþ 2Þ e�ðnþ1Þ0 gðnþ1Þ
m � gðnþ1Þc
� ��
� 16gmðgm � g0Þ 1� 3
nþ 2
� �e30g
�3m þ 3
nþ 2e�nþ10 gn�1
m
�; ð19Þ
which is the improved version of the fracture toughness (1) after taking into account the power-law hardening materialmodel (3) and complete elastic springback after unloading.
Compared to the fracture toughness (1) formulated by Thouless et al. [26], the present fracture toughness (19) carriesmultiple terms due to the use of a piecewise power-law strain-hardening material model (3) and taking into account theentire loading and unloading path of the elastoplastic materials. The present expression (19) is expected to improve theaccuracy for extracting the fracture toughness of ABJs of thin ductile plates with large plastic deformation and elastic spring-back. To apply relation (19) for fracture data reduction, it is needed to first solve the nonlinear algebraic equation (12) todetermine the minimum radius of curvature qm at the steady working moment M, i.e., the maximum working moment,based on the radius of curvature q0 measured from the post-fracture adherends after complete springback. Eq. (12) canbe solved conveniently by evoking the numerical algorithms for solving single nonlinear algebraic equations such as the
e toughness of aluminum-bonded adhesives A (LMD1142), B (XD3600) and C (Esses 73,301). Test data of the adherend thickness, strain-hardening indexadii of the aluminum adherends after tests were from [26].
m) Strain-hardening index n Rp (mm) C (kJ/m2) [26] C (kJ/m2) [36] C (kJ/m2) (Present Model)
sive A0.271 10 1.69 ± 0.25 3.2 3.77 ± 0.090.227 27 1.97 ± 0.30 4.8 4.39 ± 0.100.238 60 1.94 ± 0.29 4.6 4.97 ± 0.28
sive B0.271 13 1.33 ± 0.20 2.4 3.08 ± 0.160.227 36 1.36 ± 0.21 3.0 3.36 ± 0.090.238 78 1.43 ± 0.21 3.1 4.09 ± 0.17
sive C0.271 18 0.83 ± 0.12 1.4 2.19 ± 0.070.227 32 0.89 ± 0.13 1.7 2.52 ± 0.080.238 111 0.92 ± 0.20 1.8 3.13 ± 0.20
p is the weighted mean radius used by Thouless et al. [26] and Williams [27]. The fracture toughness (15) based on the present model is calculatedusing the measured radii of curvature of the aluminum-alloy adherends with r0 = 113 MPa and E = 69 GPa. The C deviation in the present model isd by analyzing all the sample data in each test case [26].
e toughness of steel-bonded adhesives A (LMD1142), B (XD3600) and C (Esses 73,301). Test data of the adherend thickness, strain-hardening index n,ii of the steel adherend after tests were from [26].
m) Strain-hardening index n Rp (mm) C (kJ/m2) [26] C (kJ/m2) [27] C (kJ/m2) (Present model)
sive A0.158 12 1.14 ± 0.17 2.7 2.23 ± 0.090.131 16 1.14 ± 0.17 3.4 2.15 ± 0.100.124 22 1.33 ± 0.20 4.4 2.26 ± 0.09
sive B0.152 11 0.71 ± 0.11 1.5 1.45 ± 0.090.131 21 0.83 ± 0.12 2.2 1.73 ± 0.070.124 37 0.79 ± 0.12 2.0 1.63 ± 0.10
sive C0.094 10 0.33 ± 0.05 0.8 0.55 ± 0.020.158 28 0.42 ± 0.06 0.7 1.11 ± 0.050.124 75 0.34 ± 0.10 0.7 1.28 ± 0.13
p is the weighted mean radius used by Thouless et al. [26] and William [27]. The fracture toughness (15) based on the present model is calculatedusing the measured radii of curvature of steel adherends with r0 = 205 MPa and E = 200 GPa. The C deviation in the present model is obtained by
ng all the sample data in each test case [26].

X.-F. Wu, U. Chowdhury / Engineering Fracture Mechanics 190 (2018) 16–30 25
popular Newton-Raphson method. With available qm and q0, the work DW done by the working moment M and the strainenergy DU stored in each adherend after crack growth Dl can be determined by relations (16) and (18), respectively.
4. Model applications for experimental data reduction and scaling analysis of ABJ fracture
Let us first examine the dependency of the loading and unloading moment-curvature diagrams upon the material prop-erties and ABJ geometries at a fixed maximum curvature 1/qm. To do so, adherends of aluminum alloy (Young’s modulus E =69 GPa, yield stress r0 = 113 MPa, strain-hardening index n = 0.0, 0.1, 0.2, 0.3, 0.4 and 0.5, and adherend thickness h = 1, 2, 3,and 4 mm) and mild steel (E = 200 GPa, r0 = 205 MPa, n = 0.0, 0.05, 0.1, 0.2, 0.25, and 0.35, and h = 0.5, 1, 2, and 3 mm) withunit width are considered. The minimum radius of curvature qmin of the ABJ adherends at the maximum bending momentM(qmin) is assumed as 25 mm. These material and geometrical parameters as well as the loading level in term of qmin are in therange of the experimental studies as reported in the literature [26]. Numerical simulations are made by using the loading andunloading moment-curvature relations (7) and (13).
Figs. 6 and 7 show the moment-curvature diagrams of aluminum-alloy and mild-steel adherends, respectively. It can beobserved that both types of adherends have the similar graphical moment-curvature relations, each of which consists ofthree ranges, i.e., the linearly elastic loading, nonlinear loading, and linearly elastic unloading (elastic springback). Giventhe strain-hardening index n, the bending moment M increases rapidly with increasing adherend thickness h at a fixedadherend curvature 1/q. In addition, given the value of h, M decreases rapidly with decreasing n at a fixed 1/q, which isdue to the softening of the material with decreasing n. In particular, when n = 0, i.e., in the case of an idealized elastoplasticmaterial, M tends to constant after initial yielding. Furthermore, after complete unloading, the springback effect decreaseswith decreasing n, i.e., a larger value of n corresponds to a relatively larger elastic springback and strain energy release inthe elastic unloading stage.
In addition, the fracture toughness (19) developed in the present study is further used to extract the fracture toughness ofplastically deformed ABJs based on the fracture test data reported in the literature [26], in which extensive steady dynamic
0 20 40 60 80 100 1200
20
40
60
80
100
120
Radius after springback ρ0 (mm)
Min
. rad
ius o
f cur
vatu
re ρ
m (m
m)
n decreases
Thickness: h = 2 mm; E= 69 GPa; σ0 = 113 MPan = 0.0, 0.1, 0.2, 0.3, 0.4 & 0. 5
0 20 40 60 80 100 1200
20
40
60
80
100
120
Radius after springback ρ0 (mm)
n decreases
Thickness: h = 3 mm; E= 69 GPa; σ0 = 113 MPan = 0.0, 0.1, 0.2, 0.3, 0.4 & 0. 5
Min
. rad
ius o
f cur
vatu
re ρ
m (m
m)
0 20 40 60 80 100 1200
20
40
60
80
100
120
Radius after springback ρ0 (mm)
Min
. rad
ius o
f cur
vatu
re ρ
m(m
m)
n decreases
Thickness: h = 4 mm; E= 69 GPa; σ0 = 113 MPan = 0.0, 0.1, 0.2, 0.3, 0.4 & 0. 5
Radius after springback ρ0 (mm)0 20 40 60 80 100 1200
20
40
60
80
100
120
Min
. rad
ius o
f cur
vatu
re ρ
m( m
m)
n decreases
Thickness: h = 1 mm; E= 69 GPa; σ0 = 113 MPan = 0.0, 0.1, 0.2, 0.3, 0.4 & 0. 5
Fig. 8. Variation of the minimum radius of curvature qmin with respect to the radius of curvature q0 after springback of aluminum-alloy adherends withvarying thickness and material strain-hardening index n (Dashed line represents the diagonal for reference).

26 X.-F. Wu, U. Chowdhury / Engineering Fracture Mechanics 190 (2018) 16–30
fracture tests of ABJs made of both thin aluminum-alloy and mild-steel plates were performed as aforementioned. Yet, modelparameters of power-law strain-hardening solids according to the constitutive law (3) are not exhausted for the particularaluminum-alloy and mild-steel plates used in these fracture tests. In the following, the mechanical properties of thealuminum-alloy plates are selected as Young’s modulus E = 69 ± 5 GPa and yield stress r0 = 113 ± 3 MPa, which were usedfor the fracture analysis of the same ABJs in the literature [26,40], and the strain-hardening index nwas directly selected fromthe nonlinear elastic material model (2) by fitting the test data [26]. Such a choice is due to lack of original experimental datato fit themodel parameters of the present elastoplastic material model (3) andmay not lead to appreciable deviation betweenmaterial model (3) and the nonlinear elastic material model (2) in the loading range. For cold-rolledmild-steel plates, E = 200GPa, r0 = 170–240 MPa, and n was also selected from the nonlinear elastic material model (2) in the literature [26].
Based on the available radii of curvature of the two individual adherends of the ABJ specimens after complete springback,relation (12) is used to determine the minimum radius qm of curvature of each adherend at the maximum working momentM(qm); relation (19) is used to extract the fracture toughness of the ABJs. The values of fracture toughness for the ABJs madeof thin aluminum-alloy and mild-steel plates with varying adherend thickness are tabulated in Tables 1 and 2, in which thefracture toughness (19) is determined by using the mean values of the mechanical properties of the aluminum-alloy (r0 =113 MPa and E = 69 GPa) and mild-steel plates (r0 = 205 MPa and E = 200 GPa) and all the measured radii of curvature of theadherends after springback by Thouless et al. [26]. For the purpose of comparison, Williams’s corrections by assuming a rootrotation at the adherend end were also listed in Tables 1 and 2 [27,36,37]. It is worthy to mention that similar to thosereported by Thouless et al. [26], Williams’s corrections were also based on the nonlinear elastic material model (2). It canbe found in Tables 1 and 2 that the present model predicts quite a few values of fracture toughness close to Williams’s cor-rections, nearly double the values of fracture toughness reported by Thouless et al. [26], which are considered as the truefracture toughness of the ABJs with Thouless’s argument [26] and also used as references for the purpose of comparisonin this study. In particular, the present model predicts the values of fracture toughness of adhesives A and B based on ABJs
0 20 40 60 80 100 1200
20
40
60
80
100
120
Radius after springback ρ0 (mm)
Min
radi
us o
f cur
vatu
re ρ
m (m
m)
n decreases
Thickness: h = 0.5 mm; E= 200 GPa; σ0 = 205 MPan = 0.0, 0.05, 0.1, 0.2, 0.25 & 0.3 5
0 20 40 60 80 100 1200
20
40
60
80
100
120
Radius after springback ρ0 (mm)
Min
. rad
ius o
f cur
vatu
re ρ
m(m
m)
n decreases
Thickness: h = 1 mm; E= 200 GPa; σ0 = 205 MPan = 0.0, 0.05, 0.1, 0.2, 0.25 & 0.3 5
0 20 40 60 80 100 1200
20
40
60
80
100
120
Radius after springback ρ0 (mm)
Min
. rad
ius o
f cur
vatu
re ρ
m(m
m)
n decreases
Thickness: h = 3 mm; E= 200 GPa; σ0 = 205 MPan = 0.0, 0.05, 0.1, 0.2, 0.25 & 0.3 5
0 20 40 60 80 100 1200
20
40
60
80
100
120
Radius after springback ρ0 (mm)
Min
. rad
ius o
f cur
vatu
re ρ
m (m
m)
n decreases
Thickness: h = 2 mm; E= 200 GPa; σ0 = 205 MPan = 0.0, 0.05, 0.1, 0.2, 0.25 & 0.3 5
Fig. 9. Variation of the minimum radius of curvature qmin with respect to the radius of curvature q0 after springback of mild-steel adherends with varyingthickness and material strain-hardening index n (Dashed line represents the diagonal for reference).

X.-F. Wu, U. Chowdhury / Engineering Fracture Mechanics 190 (2018) 16–30 27
made of thin steel plates, as listed in Table 2, very close to double the values of fracture toughness provided by Thouless et al.[26] and even closer than those provided by Williams’s corrections [27,36,37].
Yet, the present model also predicts a few obvious overshot values of the fracture toughness of the three adhesives basedon aluminum-alloy ABJs. For example, in Table 1 the present model predicts the values of fracture toughness with the max-imum deviations for adhesives A, B and C based on ABJs made of 3 mm thick aluminum-alloy adherends as 4.97 ± 0.28 kJ/m2,4.09 ± 0.17 kJ/m2, and 3.13 ± 0.20 kJ/m2, respectively, which are 28%, 43%, and 70% higher than double the values of the frac-ture toughness reported in the literature [26]. Such large deviations might be related to the deviation of selected modelparameters in the present material model (3) for the aluminum alloy sheets as such model parameters were not availablein the literature. For example, due to lack of the experimental stress-strain diagrams of aluminum alloy and steel plates,the exponent n of the nonlinear elastic material model (2), which was fitted from experimental data [26], was directly usedas the strain-hardening index n of the present material model (3). Noticeable deviations may exist for the parameter nbetween the two material models. As an example, here a brief investigation is made on the parameter dependency of thefracture toughness of the ABJs made of 1 mm thick aluminum-alloy sheets. In this case, if slightly scaling down the param-eter n from 0.271, which was obtained by fitting the experimental data based on the material model (2) in the literature [26]and was used in the present material model (3) to generate the results in Table 1, to 0.271/1.08 = 0.251, the present model(19) predicts the values of fracture toughness of adhesives A, B and C as 3.33 ± 0.08 kJ/m2, 2.73 ± 0.14 kJ/m2,1.96 ± 0.06 kJ/m2, which are much close to double the values of fracture toughness obtained in the steady dynamic fracturetests [26] as also listed in Table 1.
Therefore, the present model is capable of extracting reliable fracture toughness from steady dynamic fracture tests ofABJs with large plastic deformations, provided that the materials behave following power-law strain-hardening solids (3)and sufficient experimental data are available to fit the model parameters E, r0 and n. Other potential influencing factorsresponsible for the deviations between the present model predictions and experimental data could be the test data collec-tion, failure mechanisms out of the assumption of pure bending, friction between the wedge and adherends, or the strainenergy dissipation not fully used for driving crack growth such as heat and kinetic energy, among others.
Fig. 10. Variation of the fracture toughness Cwith respect to the radius of curvature q0 after springback of ABJs of thin aluminum-alloy plates with varyingthickness and material strain-hardening index n.
28 X.-F. Wu, U. Chowdhury / Engineering Fracture Mechanics 190 (2018) 16–30
Moreover, the present model is further used for scaling analysis of the springback and fracture toughness of ABJs made ofthin aluminum-alloy and mild-steel plates with varying strain-hardening index n at varying q0. Figs. 8 and 9 are the varia-tions of the minimum radius qm at the maximumworking momentM(qm) with respect to q0 of the ABJ adherends after com-plete springback, in which the material properties and geometries are selected as the same as those employed in Figs. 6 and7. The general varying tendencies are similar for both types of ABJs. Given the values of q0 and the adherend thickness h, qm
decreases with decreasing n. This is due to the fact that a lower value of n indicates a more plastically deformed ABJ, i.e., alower value of qm. In addition, at the fixed values of q0 and n, qm increases with increasing h, i.e., thicker elastoplastic spec-imens tending to more noticeable springback. In the limiting case of idealized elastoplastic materials (n = 0), the minimumspringback exhibits. In contrast, in the limiting case of linearly elastic materials (n = 1) or nonlinear elastic materials, theadherends completely recover the original configurations after unloading, i.e., the maximum springback.
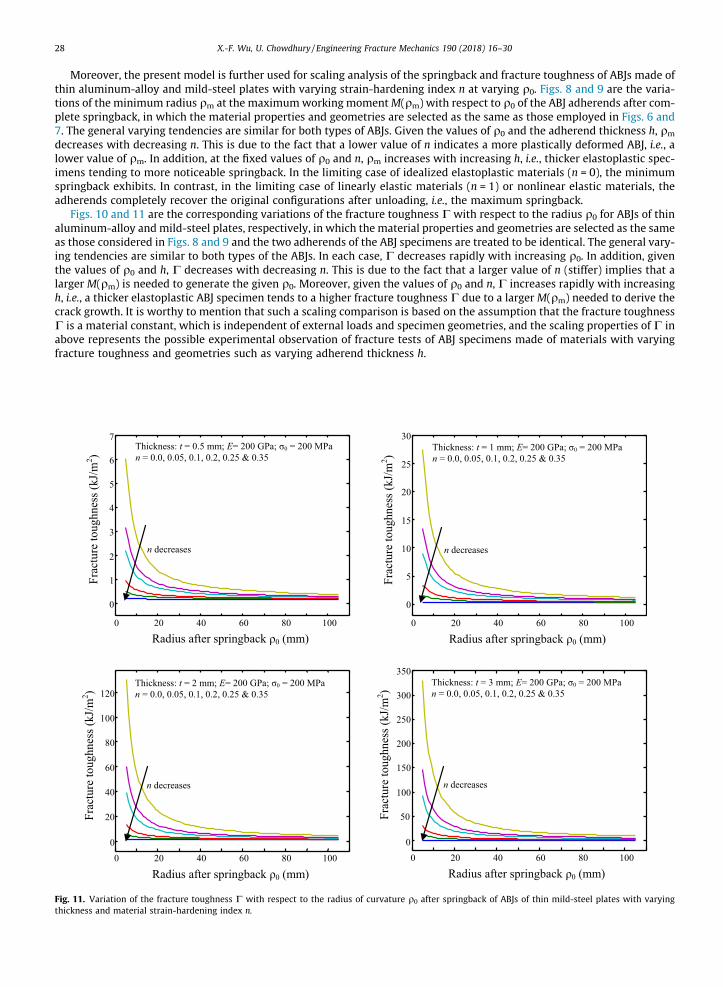
Figs. 10 and 11 are the corresponding variations of the fracture toughness C with respect to the radius q0 for ABJs of thinaluminum-alloy and mild-steel plates, respectively, in which the material properties and geometries are selected as the sameas those considered in Figs. 8 and 9 and the two adherends of the ABJ specimens are treated to be identical. The general vary-ing tendencies are similar to both types of the ABJs. In each case, C decreases rapidly with increasing q0. In addition, giventhe values of q0 and h, C decreases with decreasing n. This is due to the fact that a larger value of n (stiffer) implies that alarger M(qm) is needed to generate the given q0. Moreover, given the values of q0 and n, C increases rapidly with increasingh, i.e., a thicker elastoplastic ABJ specimen tends to a higher fracture toughness C due to a larger M(qm) needed to derive thecrack growth. It is worthy to mention that such a scaling comparison is based on the assumption that the fracture toughnessC is a material constant, which is independent of external loads and specimen geometries, and the scaling properties of C inabove represents the possible experimental observation of fracture tests of ABJ specimens made of materials with varyingfracture toughness and geometries such as varying adherend thickness h.
0 20 40 60 80 100
0
5
10
15
20
25
30
Radius after springback ρ0 (mm)
Frac
ture
toug
hnes
s (kJ
/m2 )
n decreases
Thickness: t = 1 mm; E= 200 GPa; σ0 = 200 MPan = 0.0, 0.05, 0.1, 0.2, 0.25 & 0.35
0 20 40 60 80 1000
20
40
60
80
100
120
Radius after springback ρ0 (mm)
Frac
ture
toug
hnes
s (kJ
/m2 )
n decreases
Thickness: t = 2 mm; E= 200 GPa; σ0 = 200 MPan = 0.0, 0.05, 0.1, 0.2, 0.25 & 0.35
0 20 40 60 80 1000
50
100
150
200
250
300
350
Radius after springback ρ0 (mm)
Frac
ture
toug
hnes
s (kJ
/m2 )
n decreases
Thickness: t = 3 mm; E= 200 GPa; σ0 = 200 MPan = 0.0, 0.05, 0.1, 0.2, 0.25 & 0.35
0 20 40 60 80 100
0
1
2
3
4
5
6
7
Radius after springback ρ0 (mm)
Frac
ture
toug
hnes
s (kJ
/m2 )
n decreases
Thickness: t = 0.5 mm; E= 200 GPa; σ0 = 200 MPan = 0.0, 0.05, 0.1, 0.2, 0.25 & 0.35
Fig. 11. Variation of the fracture toughness C with respect to the radius of curvature q0 after springback of ABJs of thin mild-steel plates with varyingthickness and material strain-hardening index n.
X.-F. Wu, U. Chowdhury / Engineering Fracture Mechanics 190 (2018) 16–30 29
5. Concluding remarks
An elastoplastic fracture mechanics model has been formulated for determining the fracture toughness of aluminum-alloy and mild-steel ABJs with large plastic deformations and elastic springback. Based on the present model, the maximumcurvature (1/qm) and corresponding maximumworking bending momentM(qm) can be determined explicitly from the mea-sured radius of curvature (1/q0) of the ABJ specimens after complete elastic springback, which are appreciably different fromthose based only on nonlinear elastic material model (2) without springback. The stored strain energy in the ABJ adherendshas been determined in explicit form, which consists of the strain energy stored in the entire stage of loading and unloading,i.e., the linearly elastic loading, nonlinear loading, and linearly elastic unloading range. Without additional ad hoc assump-tions and simplifications beyond the elastoplastic constitutive law (3) of power-law strain-hardening materials and linearlyvarying axial strain across the adherend thickness (i.e., Euler-Bernoulli beam), the present model is capable of extracting thereliable fracture toughness of ABJs with large plastic deformations from steady dynamic fracture test data. This presentmodel has its advantages: (1) The elastoplastic power-law strain-hardening material model is more general and close tothe mechanical performance of many practical ductile metals extensively used in engineering including aluminum alloysand mild steels; (2) The maximum working moment M(qm) to drive the crack growth in ABJs is determined accurately withtaking into account the elastic springback of the ABJ adherends; (3) The effect of elastic springback after complete unloadinghas been considered for determining the maximum curvature (1/qm), corresponding to the maximum working bendingmoment M(qm) and the maximum strain energy stored in the plastically deformed ABJs.
Furthermore, the present model has also been utilized for detailed scaling analysis to examine effects of the mechanicalproperties and joint geometries on the elastic springback and fracture toughness of ABJs at varying loading level, which isuseful to explore the effects of governing parameters on the fracture behavior of plastically deformed ABJs and design ofmetal ABJ specimens for better testing and fracture data reduction. The present model can be used for the analysis of broaderfracture and adhesive failure events of thin beams and film structures of ductile metals with large plastic deformations andelastic springback such as peeling tests in coatings, fracture tests of ductile metals, and machine cutting of ductile metals,among others.
Acknowledgment
Partial support of the research by the NASA EPSCoR (NASA Grant #NNX07AK81A, seed grant: 43500-2490-FAR018640),NDSU Development Foundation (Grant No.: 43500-2490-FAR0017475), and NDSU Faculty Research Initial Grant is gratefullyappreciated.
Appendix A. Supplementary material
Supplementary data associated with this article can be found, in the online version, at https://doi.org/10.1016/j.en-gfracmech.2017.11.040.
References
[1] Park SY, Choi WJ, Choi HS, Kwon H, Kim SH. Recent trends in surface treatment technologies for airframe adhesive bonding processing: a review (1995–2008). J Adhes 2010;86:192–221.
[2] Davis M, Bond D. Principles and practices of adhesive bonded structural joints and repairs. Int J Adhes Adhes 1999;19:91–105.[3] Higgins A. Adhesive bonding of aircraft structures. Int J Adhes Adhes 2000;20:367–76.[4] Grant LDR, Adams RD, da Silva LFM. Effect of the temperature on the strength of adhesively bonded single lap and T joints for the automotive industry.
Int J Adhes Adhes 2009;29:535–42.[5] da Silva LFM, das Neves PJC, Adams RD, Spelt JK. Analytic models of adhesively bonded joints-part I: Literature survey. Int J Adhes Adhes
2009;29:319–30.[6] da Silva LFM, das Neves PC, Adams RD, Wang A, Spelt JK. Analytic models of adhesively bonded joints-part II: Comparative study. Int J Adhes Adhes
2009;29:331–41.[7] Wu XF, Jenson RA. Stress-function variational method for stress analysis of bonded joints under mechanical and thermal loads. Int J Eng Sci
2011;49:279–94.[8] Wu XF, Jenson RA. Semi-analytic stress-function variational approach for the interfacial stresses in bonded joints. J Eng Mech 2014;140. 04014089;
Wu XF, Zhao YH. Stress-function variational method for interfacial stress analysis of adhesively bonded joints. Int J Solids Struct 2013;50:4305–19.[9] Wu XF, Jenson RA, Zhao YH. Stress-function variational approach to the interfacial stresses and progressive cracking in surface coatings. Mech Mater
2014; 69: 195–203.[10] Carlsson LA, Pipes RB. Experimental characterization of advanced composite materials. New Jersey: Prentice-Hall; 1987.[11] Johnson WS. Adhesively bonded joints: testing, analysis, and design. ASTM STP 981, Philadelphia: ASTM; 1988.[12] Mittal KL. Adhesive joints: formation, characteristics and testing. Boston: Brill Academic Publishers; 2003.[13] Wu XF, Yarin AL. Recent progress in interfacial toughening and damage self-healing of polymer composites based on electropsun and solution-blown
nanofibers: an overview. J Appl Polym Sci 2013;130:2225–37.[14] Suo ZG, Hutchinson JW. Interface crack between two elastic layers. Int J Fract 1990;43:1–18.[15] Hutchinson JW, Suo Z. Mixed mode cracking in layered materials. Adv Appl Mech 1992;29:64–191.[16] Schapery RA, Davidson BD. Prediction of energy release rate for mixed-mode delamination using classical plate theory. ASME Appl Mech Rev 1990;43:
S281–7.[17] Davidson BD, Hu HR, Schapery RA. An analytical crack-tip element for layered elastic structures. J Appl Mech-Trans ASME 1995;62:294–305.[18] Sundararaman V, Davidson BD. An unsymmetric double cantilever beam test for interfacial fracture toughness determination. Int J Solids Struct
1997;34:799–817.
30 X.-F. Wu, U. Chowdhury / Engineering Fracture Mechanics 190 (2018) 16–30
[19] Wang JL, Qiao PZ. Analysis of beam type fracture specimens with crack-tip deformation. Int J Fract 2005;132:223–48.[20] Wu XF, Dzenis YA. Closed-form solution for a mode-III interfacial edge crack between two bonded dissimilar elastic strips. Mech Res Commun
2002;29:407–12.[21] Wu XF, Dzenis YA. Closed-form solution for the size of plastic zone in an edge-cracked strip. Int J Eng Sci 2002;40:1751–9.[22] Wu XF, Dzenis YA, Fan TY. Two semi-infinite interfacial cracks between two bonded dissimilar elastic strips. Int J Eng Sci 2003;41:1699–710.[23] Wu XF, Lilla E, Zou WS. A semi-infinite interfacial crack between two bonded dissimilar elastic strips. Arch Appl Mech 2002;72:630–6.[24] Kinloch AJ, Lau CC, Williams JG. The peeling of flexible laminates. Int J Fract 1994;66:45–70.[25] Moidu AK, Sinclair AN, Spelt JK. Analysis of the peel test: prediction of adherend plastic dissipation and extraction of fracture energy of metal-to-metal
adhesive joints. J Test Eval 1995;23:241–53.[26] Thouless MD, Adams JL, Kafkalidis MS, Ward SM, Dickie RA, Westerbeek GL. Determining the toughness of plastically deforming joints. J Mater Sci
1998;33:189–97.[27] Williams JG. Friction and plasticity effects in wedge splitting and cutting fracture tests. J Mater Sci 1998;33:5351–7.[28] Yang QD, Thouless MD, Ward SM. Numerical simulations of adhesively-bonded beams failing with extensive plastic deformation. J Mech Phys Solids
1999;47:1337–53.[29] Yang QD, Thouless MD, Ward SM. Analysis of the symmetrical 90o-peel test with extensive plastic deformation. J Adhes 2000;72:115–32.[30] Wei YG. Thin layer splitting along the elastic-plastic solid surface. Int J Fract 2002;113:233–52.[31] Atkins AG. Toughness and cutting: a new way of simultaneously determining ductile fracture toughness and strength. Eng Fract Mech
2005;72:849–60.[32] Hadavinia H, Kawashita L, Kinloch AJ, Moore DR, Williams JG. A numerical analysis of the elastic-plastic peel test. Eng Fract Mech 2006;73:2324–35.[33] Williams JG, Patel Y, Blackman BRK. A fracture mechanics analysis of cutting and machining. Eng Fract Mech 2010;77:293–308.[34] Atkins AG, Chen Z, Cotterell B. The essential work of fracture and JR curves for the double cantilever beam specimen: an examination of elastoplastic
crack propagation. Proc R Soc Lond A-Math Phys Engn Sci 1998;454:815–33.[35] Li XF, Lee KY. Fracture of a thin power-law nonlinear materials with a crack using the DCB model. Int J Fract 2016;201:119–25.[36] Kinloch AJ, Williams JG. Comments on ‘‘Determining the toughness of plastically deforming joints”. J Mater Sci Lett 1998;17:813–4.[37] Kinloch AJ, Williams JG. Further comments on ‘‘Determining the toughness of plastically deforming joints”. J Mater Sci Lett 1999;18:2049.[38] Yang QD, Thouless MD. Reply on ‘Comments on ‘‘Determining the toughness of plastically deforming joints”’. J Mater Sci Lett 1999;18:2051–3.[39] Pardoen T, Ferracin T, Landis CM, Delannay F. Constraint effects in adhesive joint fracture. J Mech Phys Solids 2005;53:1951–83.[40] Cavalli MN, Thouless MD, Yang QD. Cohesive-zone modeling of the deformation and fracture of spot-welded joints. Fatigue Fract Eng Mater Struct
2005;28:861–74.