ENGI 8926 – Midterm Report - Faculty of Engineering and ...tes/Midterm Report.pdfENGI 8926 –...
25
ENGI 8926 – Midterm Report THERMAL ENERGY SOLUTIONS FEB 6, 2015 Faculty Supervisor: Prof. Andy Fisher Ernst van Wijk (201021516) Will McNally (201008810) Matthew Noseworthy (201013463) David Oake (201036621) Yuntao Pan (200943298)
-
Upload
truongnhan -
Category
Documents
-
view
216 -
download
0
Transcript of ENGI 8926 – Midterm Report - Faculty of Engineering and ...tes/Midterm Report.pdfENGI 8926 –...
ENGI 8926 – Midterm Report THERMAL ENERGY SOLUTIONS
FEB 6, 2015
Faculty Supervisor: Prof. Andy Fisher
Ernst van Wijk (201021516) Will McNally (201008810)
Matthew Noseworthy (201013463) David Oake (201036621) Yuntao Pan (200943298)

M E M O R I A L U N I V E R S I T Y O F N E W F O U N D L A N D | T H E R M A L E N E R G Y S O L U T I O N S
i
MIDTERM REPORT FEB 6, 2015
TABLE OF CONTENTS 1 Introduction ................................................................................................................. 1 1.1 Scope ..................................................................................................................................... 1
1.2 Project Workflow .................................................................................................................. 1
1.3 Team Roles ............................................................................................................................ 2
2 Background Research ................................................................................................ 3 2.1 Current Home Heating Energy Consumption .................................................................. 3
2.1.1 Combustion ................................................................................................................. 3
2.1.2 Electricity ...................................................................................................................... 4
2.1.3 Heat pump ................................................................................................................... 4
2.2 Carnot Cycle ......................................................................................................................... 5
2.2.1 Vapour-Compression Cycle ....................................................................................... 6
2.3 Ground Source Heat Pump (GSHP) .................................................................................... 9
2.4 Heat Exchangers ................................................................................................................. 10
2.4.1 Concentric tube ........................................................................................................ 11
2.4.2 Shell and tube ........................................................................................................... 11
2.4.3 Plate ............................................................................................................................ 12
2.4.4 Plate and fin ............................................................................................................... 13
3 Constraints ................................................................................................................. 14 3.1 Economic ............................................................................................................................. 14
3.2 Environmental ..................................................................................................................... 14
4 Proposed Process Layout ......................................................................................... 14 5 Initial Design and Calculations ................................................................................ 15 6 Recommendations .................................................................................................... 17 7 Works Cited ............................................................................................................... 19
Appendix A: Schedule
Appendix B: Heat Pump Operation Data
Appendix C: Initial Design Calculations

M E M O R I A L U N I V E R S I T Y O F N E W F O U N D L A N D | T H E R M A L E N E R G Y S O L U T I O N S
ii
MIDTERM REPORT FEB 6, 2015
TABLE OF FIGURES Figure 1: Work Flow Diagram .......................................................................................... 2 Figure 2: Organizational Chart ........................................................................................ 2 Figure 3: Carnot Cycle T-s Diagram ................................................................................ 5 Figure 4: Vapour-Compression Cycle ............................................................................. 7 Figure 5: Vapour-Compression Cycle T-s Diagram ....................................................... 8 Figure 6: GSHP Components .......................................................................................... 9 Figure 7: Ground loop of a GSHP ................................................................................. 10 Figure 8: Concentric Tube Heat Exchanger ................................................................. 11 Figure 9: Shell and Tube Heat Exchanger ................................................................... 12 Figure 10: Plate Heat Exchanger ................................................................................... 13 Figure 11: Plate and Fin Heat Exchanger ..................................................................... 13 Figure 12: Proposed Process Layout ............................................................................ 15 Figure 13: Increase in Net Power Output with Increasing Inlet Temperature .......... 16 Figure 14: Annual home heating savings vs. temperature increase .......................... 17
LIST OF TABLES Table 1: Performance Improvement Calculations for 2-ton Heat Pump ................... 16
M E M O R I A L U N I V E R S I T Y O F N E W F O U N D L A N D | T H E R M A L E N E R G Y S O L U T I O N S
1
MIDTERM REPORT FEB 6, 2015
1 INTRODUCTION Over the last number of decades, the impacts of human induced climate change have
become more and more noticeable. The apathy that society had once shown towards the
issue is fading, with most people coming to the realization that immediate action must be
taken. Therefore, a significant need has been established for more efficient technologies
that minimize pollution and energy waste.
1.1 SCOPE The implementation of more efficient heating technology has great potential to reduce
energy waste and consumption, especially in cold northern climates. Canadians attribute
more than two thirds of their annual energy costs to heating alone [1] which demonstrates
that significant reductions in energy consumption could be attained through the
implementation of more efficient heating technologies. The purpose of this project is to
design and model an enhanced ground-source heat pump (GSHP) system that utilizes
additional heat sources in conjunction with a ground loop. Energy will be collected from
these additional heat sources and passed into the ground loop through the use of one or
more heat exchangers. This energy addition will raise the temperature of the source
thermal reservoir, enhancing the heat pump’s performance. The focus of this report will be
to review the enhanced performance of this proposed system and outline the reduction in
energy consumption that will accompany its use.
1.2 PROJECT WORKFLOW This project requires a thorough understanding of thermodynamics and heat transfer in
order to develop a realistic model. Initiating the project development, therefore, required
extensive research into the Carnot cycle, heat pumps, and heat exchangers, among other
mechanical equipment. Once a sufficient level of understanding of all the project’s
components was reached, real world heat pump data was analyzed. A “black-box”
approach was taken, where heat was added to the ground loop, regardless of how that
energy would be harnessed. Estimates of economic benefit were then generated for
varying levels of ground loop temperature increase.

M E M O R I A L U N I V E R S I T Y O F N E W F O U N D L A N D | T H E R M A L E N E R G Y S O L U T I O N S
2
MIDTERM REPORT FEB 6, 2015
Figure 1: Work Flow Diagram
1.3 TEAM ROLES The organization chart, depicted in Figure 2, outlines the major roles assigned to each
team member. Despite the assigned roles, each team member is expected to contribute
as much as possible in the project, as required.
This team model is based on a high performance work system where each member has a
focus but also a thorough understanding of the entire project’s components.
Figure 2: Organizational Chart

M E M O R I A L U N I V E R S I T Y O F N E W F O U N D L A N D | T H E R M A L E N E R G Y S O L U T I O N S
3
MIDTERM REPORT FEB 6, 2015
2 BACKGROUND RESEARCH In order to begin the process of improving a heat pump system, key research had to be
conducted. An understanding of the energy consumption of the average Newfoundland
household, with and without a heat pump, is essential. The current heating energy costs
represents the pie from which any additional savings will be drawn.
A thorough understanding of heat pumps and their underlying thermodynamic processes
allows calculations to be performed so that performance enhancements can be
determined. Finally, effective use of heat exchangers is essential in the project execution,
as harnessing energy from any additional heat sources requires the use of heat
exchangers.
2.1 CURRENT HOME HEATING ENERGY CONSUMPTION To examine the energy savings associated with an enhanced heat pump incorporating
additional heat sources, it is necessary to first consider traditional methods of heating a
typical residential building. To do this, common parameters are used to first calculate the
amount of energy required to heat a typical home in the Atlantic region of Canada. The
average sized house is estimated at 1,750 square feet, or 165 square meters [2]. The
average annual energy required to heat a house can be approximated at 150 kilowatt-
hours per square meter [2]. Therefore the total annual energy required for home space
heating is approximately 24,750-kilowatt hours. Other than space heating, the hot water
heating also needs to be considered. For this, it is estimated that the average person
requires 1,412.5 kilowatt-hours worth of hot water heating per year. Assuming a home
consisting of 4 people, the energy required for hot water heating is equal to 5,650-kilowatt
hours [2]. It follows that the total energy needed for home heating is equal to 26,162.5
kilowatt-hours.
𝐸!" ≈ 24,750 𝑘𝑊ℎ
𝐸!" ≈ 5,650 𝑘𝑊ℎ
𝐸! ≈ 30,400 𝑘𝑊ℎ
To examine annual costs, different heating sources will be considered. For ease of
analysis, the conventional methods for heating a home can be grouped into three
categories: combustion, electricity, and heat pumps.
2.1.1 COMBUSTION Common sources of fuel used for combustion home heating include natural gas, oil, coal,
M E M O R I A L U N I V E R S I T Y O F N E W F O U N D L A N D | T H E R M A L E N E R G Y S O L U T I O N S
4
MIDTERM REPORT FEB 6, 2015
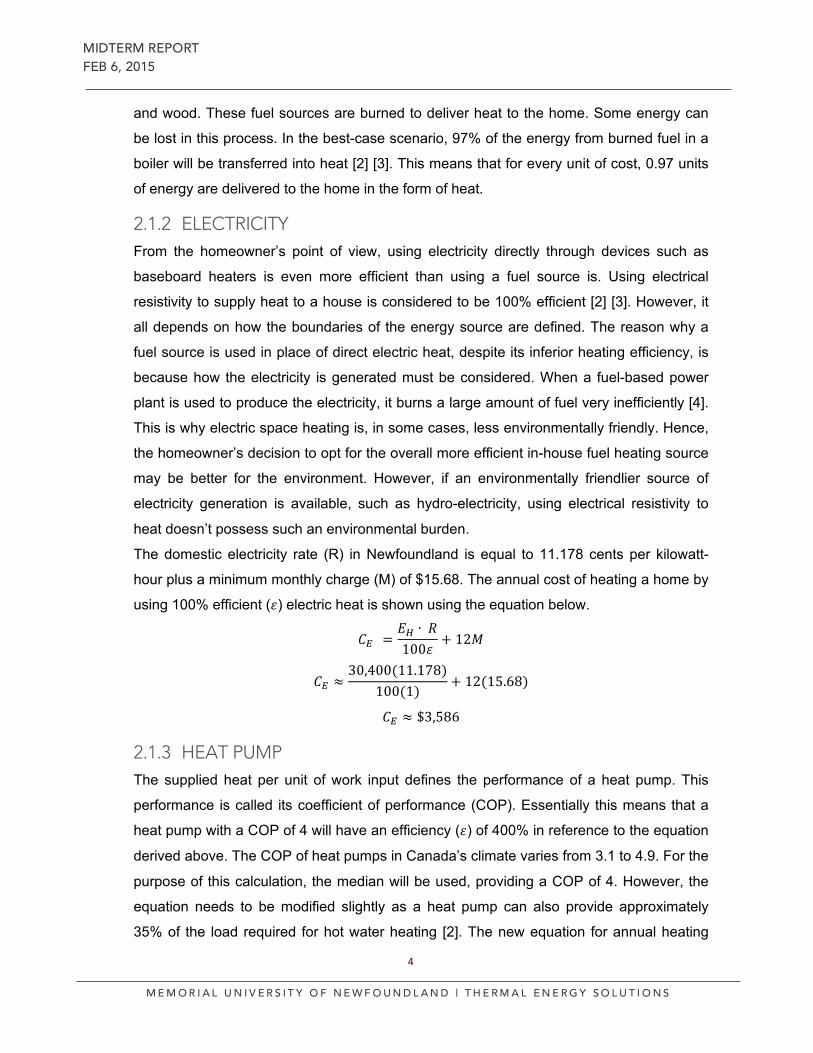
and wood. These fuel sources are burned to deliver heat to the home. Some energy can
be lost in this process. In the best-case scenario, 97% of the energy from burned fuel in a
boiler will be transferred into heat [2] [3]. This means that for every unit of cost, 0.97 units
of energy are delivered to the home in the form of heat.
2.1.2 ELECTRICITY From the homeowner’s point of view, using electricity directly through devices such as
baseboard heaters is even more efficient than using a fuel source is. Using electrical
resistivity to supply heat to a house is considered to be 100% efficient [2] [3]. However, it
all depends on how the boundaries of the energy source are defined. The reason why a
fuel source is used in place of direct electric heat, despite its inferior heating efficiency, is
because how the electricity is generated must be considered. When a fuel-based power
plant is used to produce the electricity, it burns a large amount of fuel very inefficiently [4].
This is why electric space heating is, in some cases, less environmentally friendly. Hence,
the homeowner’s decision to opt for the overall more efficient in-house fuel heating source
may be better for the environment. However, if an environmentally friendlier source of
electricity generation is available, such as hydro-electricity, using electrical resistivity to
heat doesn’t possess such an environmental burden.
The domestic electricity rate (R) in Newfoundland is equal to 11.178 cents per kilowatt-
hour plus a minimum monthly charge (M) of $15.68. The annual cost of heating a home by
using 100% efficient (𝜀) electric heat is shown using the equation below.
𝐶! =𝐸! ∙ 𝑅100𝜀
+ 12𝑀
𝐶! ≈30,400(11.178)
100(1)+ 12(15.68)
𝐶! ≈ $3,586
2.1.3 HEAT PUMP The supplied heat per unit of work input defines the performance of a heat pump. This
performance is called its coefficient of performance (COP). Essentially this means that a
heat pump with a COP of 4 will have an efficiency (𝜀) of 400% in reference to the equation
derived above. The COP of heat pumps in Canada’s climate varies from 3.1 to 4.9. For the
purpose of this calculation, the median will be used, providing a COP of 4. However, the
equation needs to be modified slightly as a heat pump can also provide approximately
35% of the load required for hot water heating [2]. The new equation for annual heating
M E M O R I A L U N I V E R S I T Y O F N E W F O U N D L A N D | T H E R M A L E N E R G Y S O L U T I O N S
5
MIDTERM REPORT FEB 6, 2015
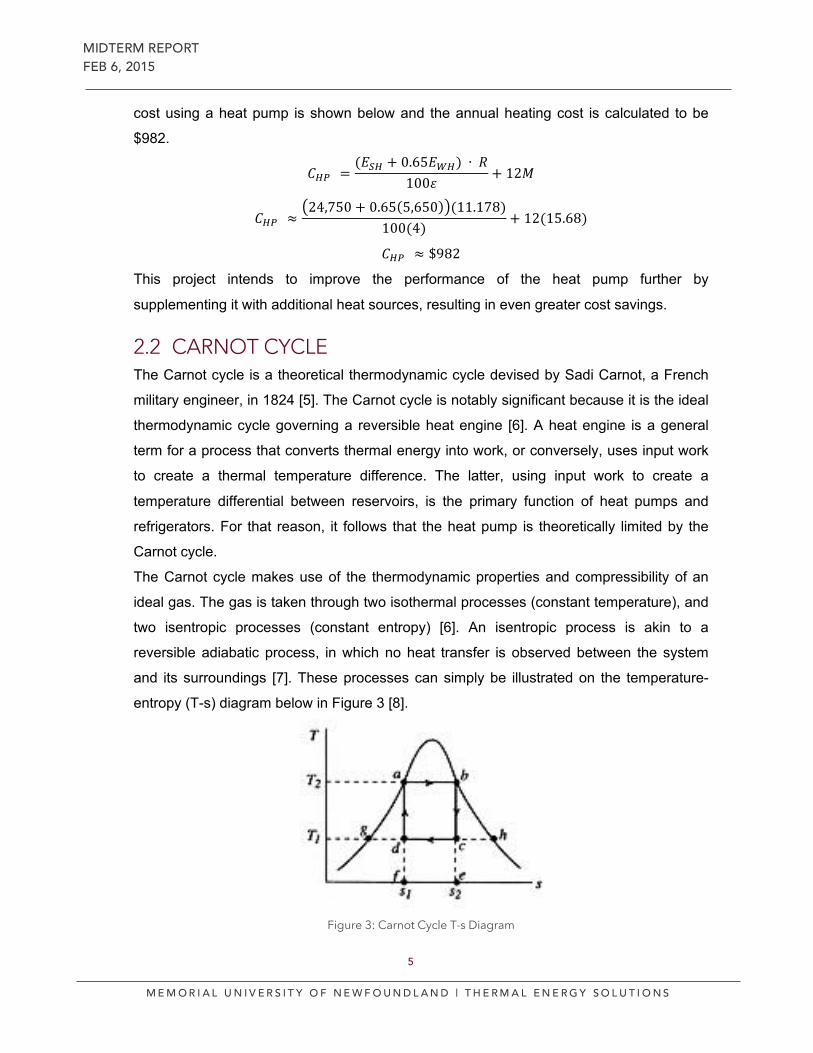
cost using a heat pump is shown below and the annual heating cost is calculated to be
$982.
𝐶!" =(𝐸!" + 0.65𝐸!") ∙ 𝑅
100𝜀+ 12𝑀
𝐶!" ≈24,750 + 0.65 5,650 (11.178)
100(4)+ 12(15.68)
𝐶!" ≈ $982
This project intends to improve the performance of the heat pump further by
supplementing it with additional heat sources, resulting in even greater cost savings.
2.2 CARNOT CYCLE The Carnot cycle is a theoretical thermodynamic cycle devised by Sadi Carnot, a French
military engineer, in 1824 [5]. The Carnot cycle is notably significant because it is the ideal
thermodynamic cycle governing a reversible heat engine [6]. A heat engine is a general
term for a process that converts thermal energy into work, or conversely, uses input work
to create a thermal temperature difference. The latter, using input work to create a
temperature differential between reservoirs, is the primary function of heat pumps and
refrigerators. For that reason, it follows that the heat pump is theoretically limited by the
Carnot cycle.
The Carnot cycle makes use of the thermodynamic properties and compressibility of an
ideal gas. The gas is taken through two isothermal processes (constant temperature), and
two isentropic processes (constant entropy) [6]. An isentropic process is akin to a
reversible adiabatic process, in which no heat transfer is observed between the system
and its surroundings [7]. These processes can simply be illustrated on the temperature-
entropy (T-s) diagram below in Figure 3 [8].
Figure 3: Carnot Cycle T-s Diagram
M E M O R I A L U N I V E R S I T Y O F N E W F O U N D L A N D | T H E R M A L E N E R G Y S O L U T I O N S
6
MIDTERM REPORT FEB 6, 2015
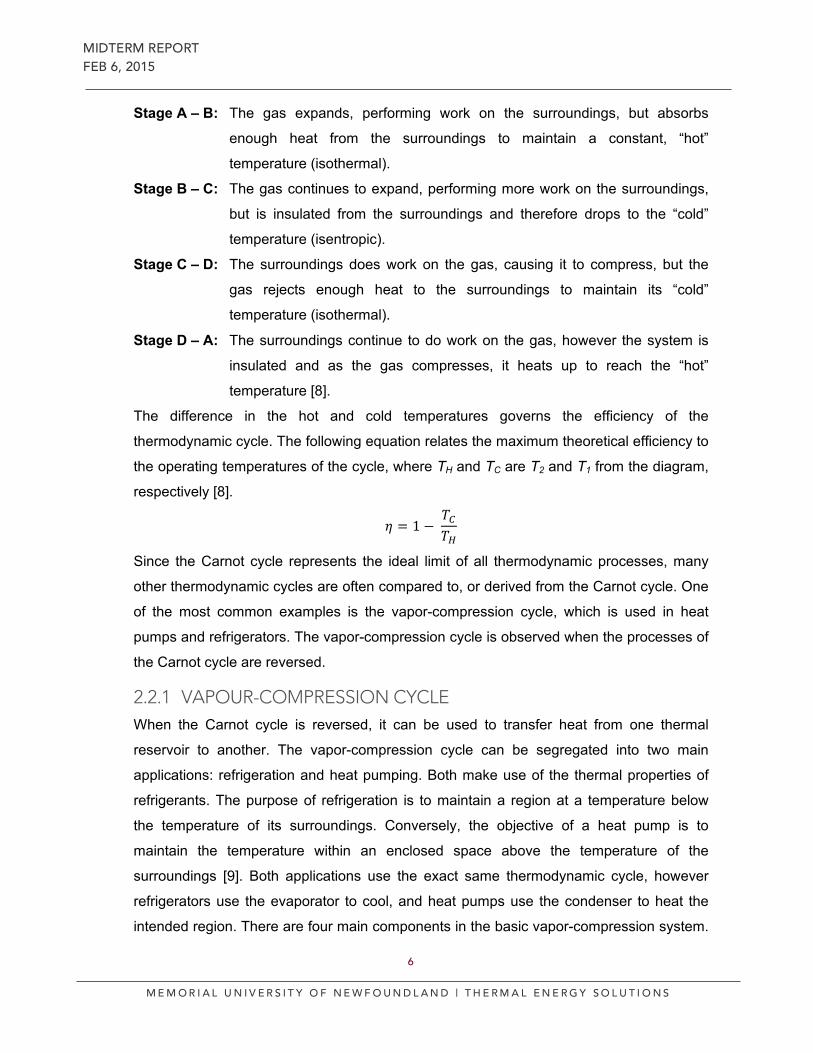
Stage A – B: The gas expands, performing work on the surroundings, but absorbs
enough heat from the surroundings to maintain a constant, “hot”
temperature (isothermal).
Stage B – C: The gas continues to expand, performing more work on the surroundings,
but is insulated from the surroundings and therefore drops to the “cold”
temperature (isentropic).
Stage C – D: The surroundings does work on the gas, causing it to compress, but the
gas rejects enough heat to the surroundings to maintain its “cold”
temperature (isothermal).
Stage D – A: The surroundings continue to do work on the gas, however the system is
insulated and as the gas compresses, it heats up to reach the “hot”
temperature [8].
The difference in the hot and cold temperatures governs the efficiency of the
thermodynamic cycle. The following equation relates the maximum theoretical efficiency to
the operating temperatures of the cycle, where TH and TC are T2 and T1 from the diagram,
respectively [8].
𝜂 = 1 − 𝑇!𝑇!
Since the Carnot cycle represents the ideal limit of all thermodynamic processes, many
other thermodynamic cycles are often compared to, or derived from the Carnot cycle. One
of the most common examples is the vapor-compression cycle, which is used in heat
pumps and refrigerators. The vapor-compression cycle is observed when the processes of
the Carnot cycle are reversed.
2.2.1 VAPOUR-COMPRESSION CYCLE When the Carnot cycle is reversed, it can be used to transfer heat from one thermal
reservoir to another. The vapor-compression cycle can be segregated into two main
applications: refrigeration and heat pumping. Both make use of the thermal properties of
refrigerants. The purpose of refrigeration is to maintain a region at a temperature below
the temperature of its surroundings. Conversely, the objective of a heat pump is to
maintain the temperature within an enclosed space above the temperature of the
surroundings [9]. Both applications use the exact same thermodynamic cycle, however
refrigerators use the evaporator to cool, and heat pumps use the condenser to heat the
intended region. There are four main components in the basic vapor-compression system.
M E M O R I A L U N I V E R S I T Y O F N E W F O U N D L A N D | T H E R M A L E N E R G Y S O L U T I O N S
7
MIDTERM REPORT FEB 6, 2015
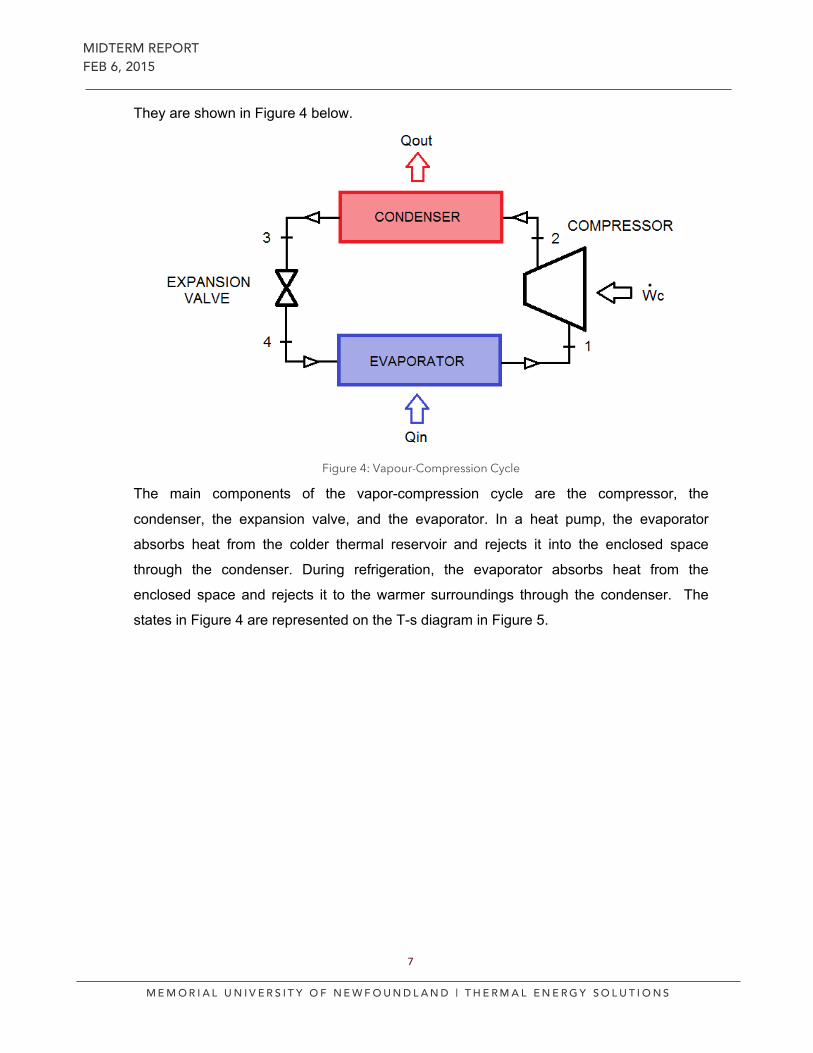
They are shown in Figure 4 below.
Figure 4: Vapour-Compression Cycle
The main components of the vapor-compression cycle are the compressor, the
condenser, the expansion valve, and the evaporator. In a heat pump, the evaporator
absorbs heat from the colder thermal reservoir and rejects it into the enclosed space
through the condenser. During refrigeration, the evaporator absorbs heat from the
enclosed space and rejects it to the warmer surroundings through the condenser. The
states in Figure 4 are represented on the T-s diagram in Figure 5.
M E M O R I A L U N I V E R S I T Y O F N E W F O U N D L A N D | T H E R M A L E N E R G Y S O L U T I O N S
8
MIDTERM REPORT FEB 6, 2015
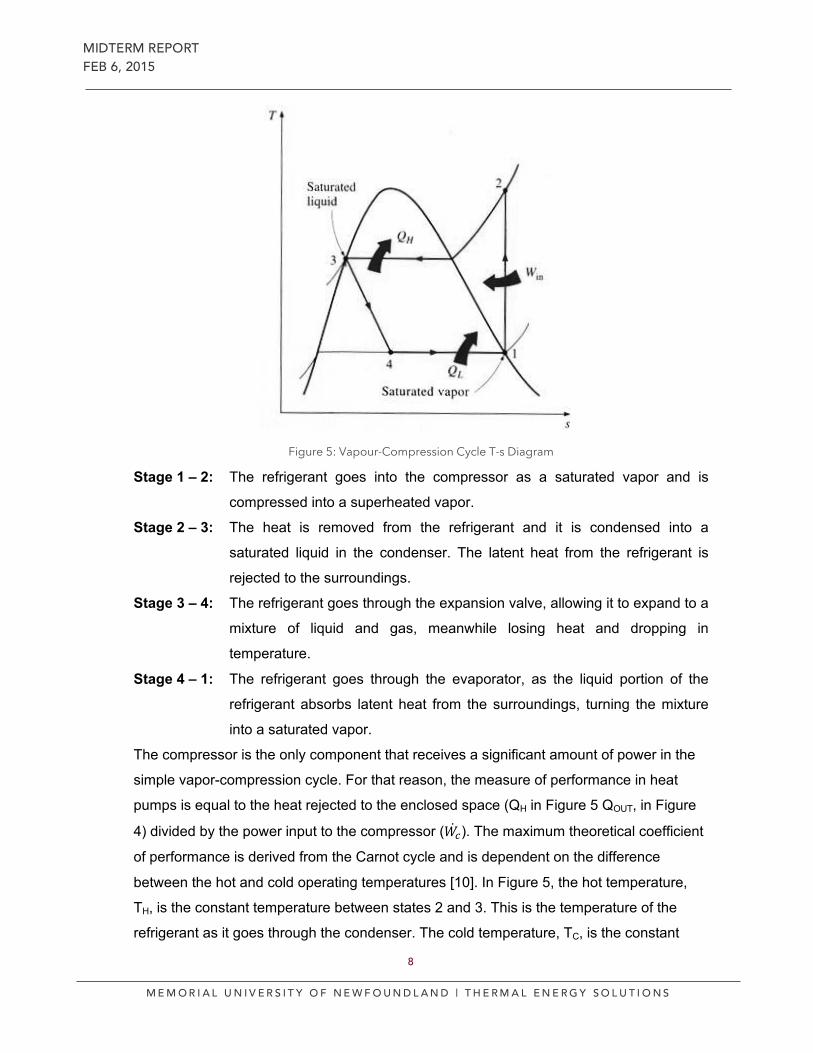
Figure 5: Vapour-Compression Cycle T-s Diagram
Stage 1 – 2: The refrigerant goes into the compressor as a saturated vapor and is
compressed into a superheated vapor.
Stage 2 – 3: The heat is removed from the refrigerant and it is condensed into a
saturated liquid in the condenser. The latent heat from the refrigerant is
rejected to the surroundings.
Stage 3 – 4: The refrigerant goes through the expansion valve, allowing it to expand to a
mixture of liquid and gas, meanwhile losing heat and dropping in
temperature.
Stage 4 – 1: The refrigerant goes through the evaporator, as the liquid portion of the
refrigerant absorbs latent heat from the surroundings, turning the mixture
into a saturated vapor.
The compressor is the only component that receives a significant amount of power in the
simple vapor-compression cycle. For that reason, the measure of performance in heat
pumps is equal to the heat rejected to the enclosed space (QH in Figure 5 QOUT, in Figure
4) divided by the power input to the compressor (𝑊!). The maximum theoretical coefficient
of performance is derived from the Carnot cycle and is dependent on the difference
between the hot and cold operating temperatures [10]. In Figure 5, the hot temperature,
TH, is the constant temperature between states 2 and 3. This is the temperature of the
refrigerant as it goes through the condenser. The cold temperature, TC, is the constant

M E M O R I A L U N I V E R S I T Y O F N E W F O U N D L A N D | T H E R M A L E N E R G Y S O L U T I O N S
9
MIDTERM REPORT FEB 6, 2015
temperature between states 4 and 1. This is the temperature of the refrigerant as it goes
through the evaporator. The equations for the actual and maximum COP for the vapor-
compression cycles in heating mode (heat pump) are shown below, where the
temperatures are in Kelvin.
𝐶𝑂𝑃 = 𝑄!𝑊!
𝐶𝑂𝑃!"# = 𝑇!
𝑇! − 𝑇!
Referring to the equation for the maximum COP, performance of the heat pump will be
maximized if the temperature difference between the two operating temperatures is
minimized. Since the hot temperature is fixed at a preferred value, raising the cold
temperature is required to maximize performance.
2.3 GROUND SOURCE HEAT PUMP (GSHP) Based on the vapour-compression cycle, ground source heat pumps (earth-energy
system) use the earth or ground water as a source of heat. The absorbed heat is then
transferred to the heat pump cycle through a heat exchanger, acting as the evaporator.
Many ground source heat pumps are capable of reversing its process so that heat is
absorbed from the home and discharged into the ground. This ability allows the heat pump
to heat a home during the winter and cool it during the summer.
Figure 6: GSHP Components
Ground source heat pumps consist of two major cycles. The first is the outdoor ground
loop and the second, the indoor heat pump cycle, as shown in Figure 6. The outdoor
ground loop can be either an open or close loop. For an open loop, the ground water is
M E M O R I A L U N I V E R S I T Y O F N E W F O U N D L A N D | T H E R M A L E N E R G Y S O L U T I O N S
10
MIDTERM REPORT FEB 6, 2015
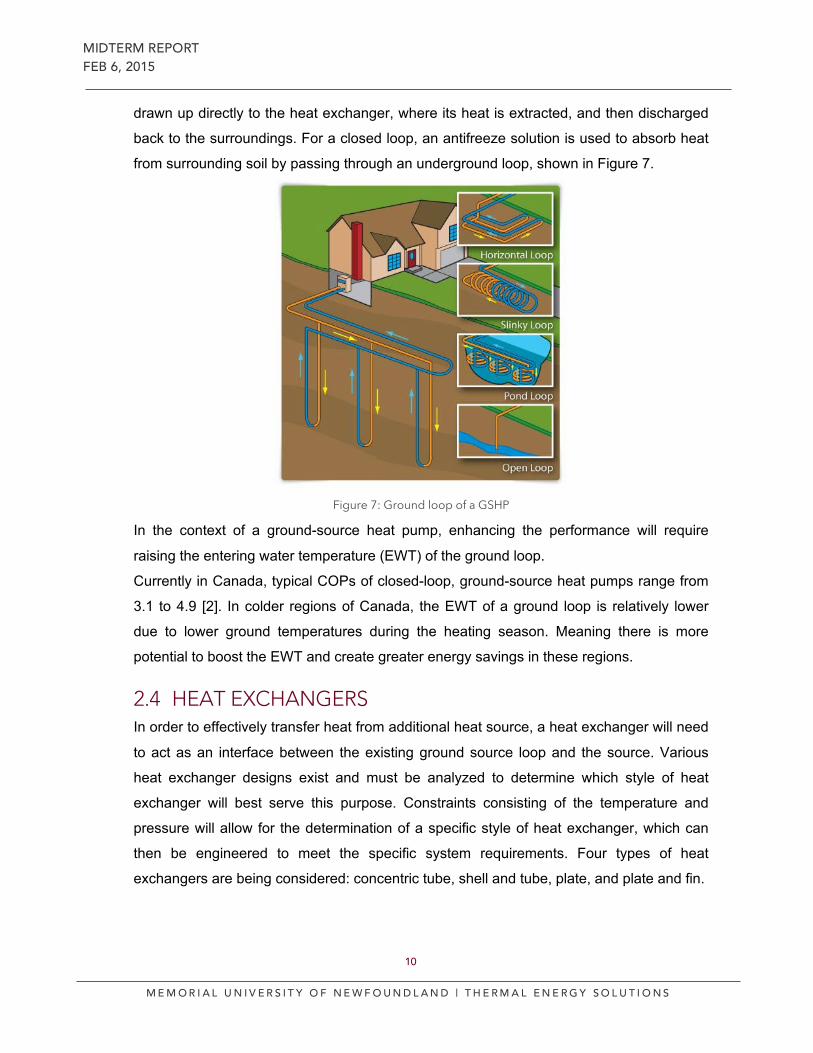
drawn up directly to the heat exchanger, where its heat is extracted, and then discharged
back to the surroundings. For a closed loop, an antifreeze solution is used to absorb heat
from surrounding soil by passing through an underground loop, shown in Figure 7.
Figure 7: Ground loop of a GSHP
In the context of a ground-source heat pump, enhancing the performance will require
raising the entering water temperature (EWT) of the ground loop.
Currently in Canada, typical COPs of closed-loop, ground-source heat pumps range from
3.1 to 4.9 [2]. In colder regions of Canada, the EWT of a ground loop is relatively lower
due to lower ground temperatures during the heating season. Meaning there is more
potential to boost the EWT and create greater energy savings in these regions.
2.4 HEAT EXCHANGERS In order to effectively transfer heat from additional heat source, a heat exchanger will need
to act as an interface between the existing ground source loop and the source. Various
heat exchanger designs exist and must be analyzed to determine which style of heat
exchanger will best serve this purpose. Constraints consisting of the temperature and
pressure will allow for the determination of a specific style of heat exchanger, which can
then be engineered to meet the specific system requirements. Four types of heat
exchangers are being considered: concentric tube, shell and tube, plate, and plate and fin.
M E M O R I A L U N I V E R S I T Y O F N E W F O U N D L A N D | T H E R M A L E N E R G Y S O L U T I O N S
11
MIDTERM REPORT FEB 6, 2015
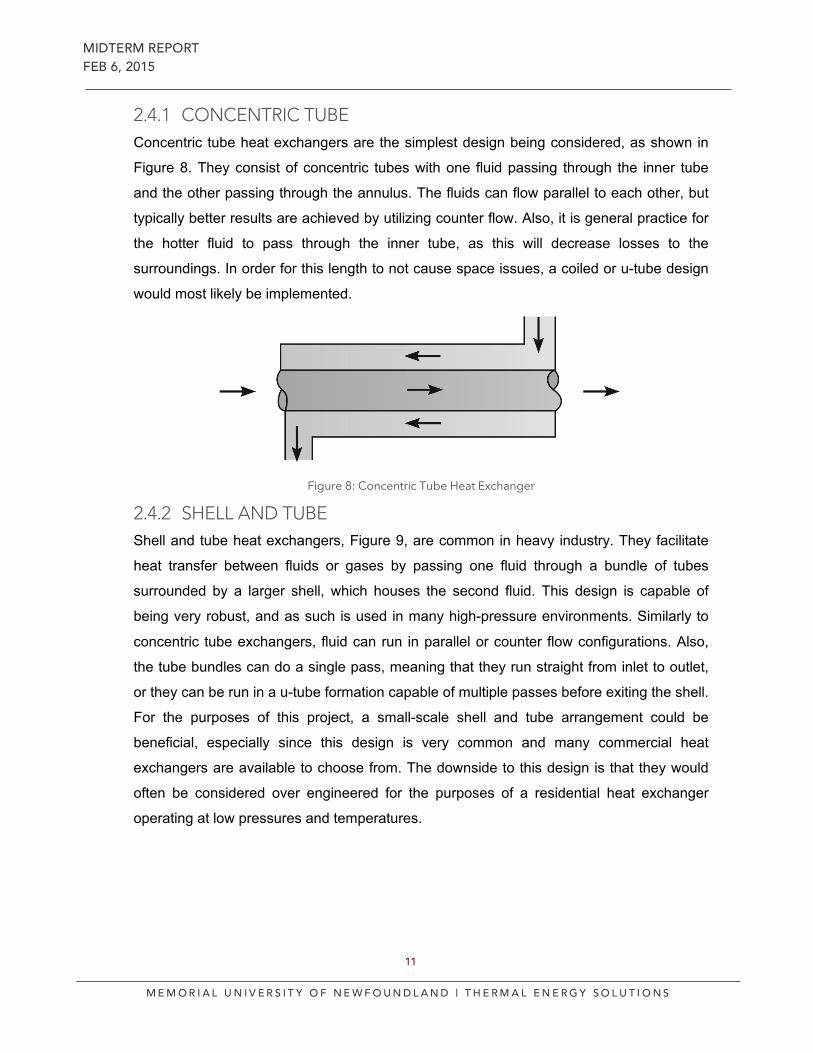
2.4.1 CONCENTRIC TUBE Concentric tube heat exchangers are the simplest design being considered, as shown in
Figure 8. They consist of concentric tubes with one fluid passing through the inner tube
and the other passing through the annulus. The fluids can flow parallel to each other, but
typically better results are achieved by utilizing counter flow. Also, it is general practice for
the hotter fluid to pass through the inner tube, as this will decrease losses to the
surroundings. In order for this length to not cause space issues, a coiled or u-tube design
would most likely be implemented.
Figure 8: Concentric Tube Heat Exchanger
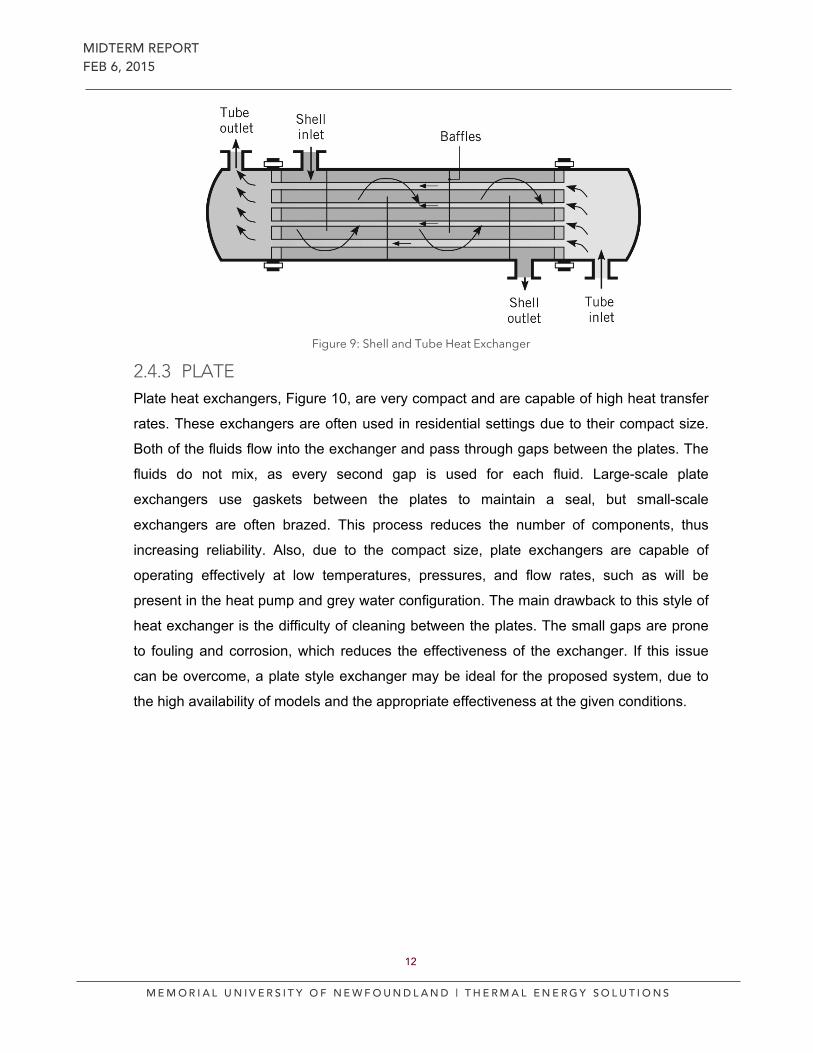
2.4.2 SHELL AND TUBE Shell and tube heat exchangers, Figure 9, are common in heavy industry. They facilitate
heat transfer between fluids or gases by passing one fluid through a bundle of tubes
surrounded by a larger shell, which houses the second fluid. This design is capable of
being very robust, and as such is used in many high-pressure environments. Similarly to
concentric tube exchangers, fluid can run in parallel or counter flow configurations. Also,
the tube bundles can do a single pass, meaning that they run straight from inlet to outlet,
or they can be run in a u-tube formation capable of multiple passes before exiting the shell.
For the purposes of this project, a small-scale shell and tube arrangement could be
beneficial, especially since this design is very common and many commercial heat
exchangers are available to choose from. The downside to this design is that they would
often be considered over engineered for the purposes of a residential heat exchanger
operating at low pressures and temperatures.
M E M O R I A L U N I V E R S I T Y O F N E W F O U N D L A N D | T H E R M A L E N E R G Y S O L U T I O N S
12
MIDTERM REPORT FEB 6, 2015
Figure 9: Shell and Tube Heat Exchanger
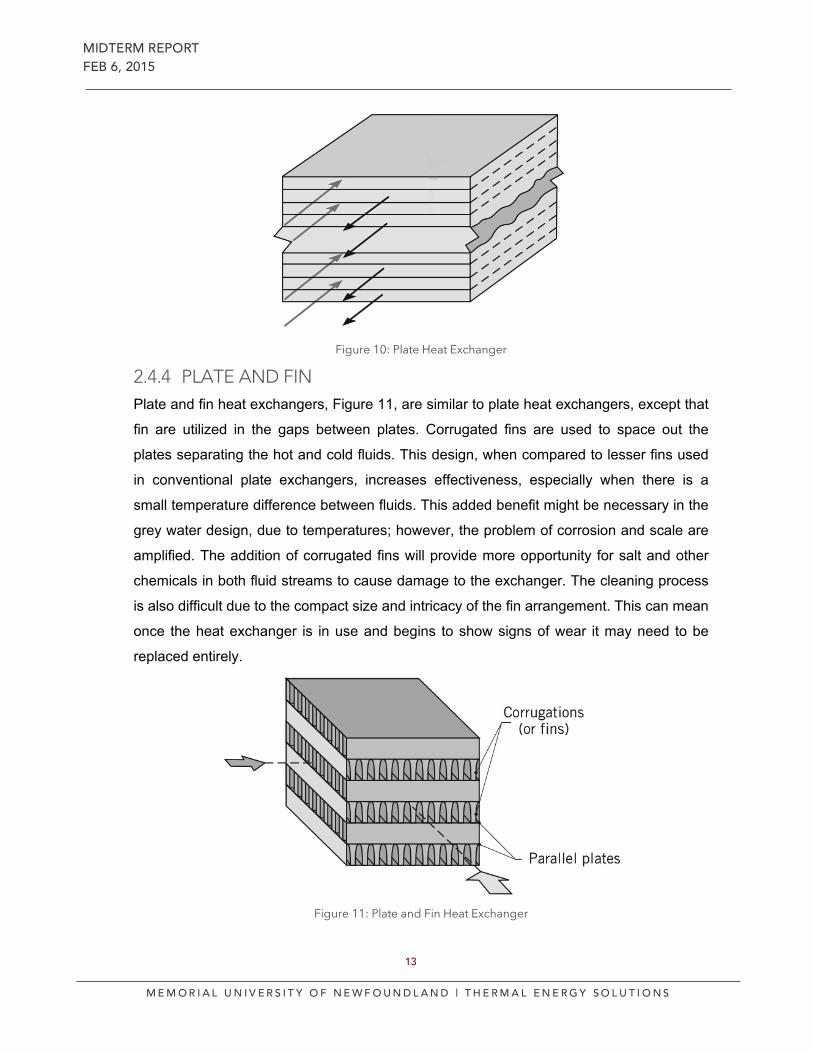
2.4.3 PLATE Plate heat exchangers, Figure 10, are very compact and are capable of high heat transfer
rates. These exchangers are often used in residential settings due to their compact size.
Both of the fluids flow into the exchanger and pass through gaps between the plates. The
fluids do not mix, as every second gap is used for each fluid. Large-scale plate
exchangers use gaskets between the plates to maintain a seal, but small-scale
exchangers are often brazed. This process reduces the number of components, thus
increasing reliability. Also, due to the compact size, plate exchangers are capable of
operating effectively at low temperatures, pressures, and flow rates, such as will be
present in the heat pump and grey water configuration. The main drawback to this style of
heat exchanger is the difficulty of cleaning between the plates. The small gaps are prone
to fouling and corrosion, which reduces the effectiveness of the exchanger. If this issue
can be overcome, a plate style exchanger may be ideal for the proposed system, due to
the high availability of models and the appropriate effectiveness at the given conditions.
M E M O R I A L U N I V E R S I T Y O F N E W F O U N D L A N D | T H E R M A L E N E R G Y S O L U T I O N S
13
MIDTERM REPORT FEB 6, 2015
Figure 10: Plate Heat Exchanger
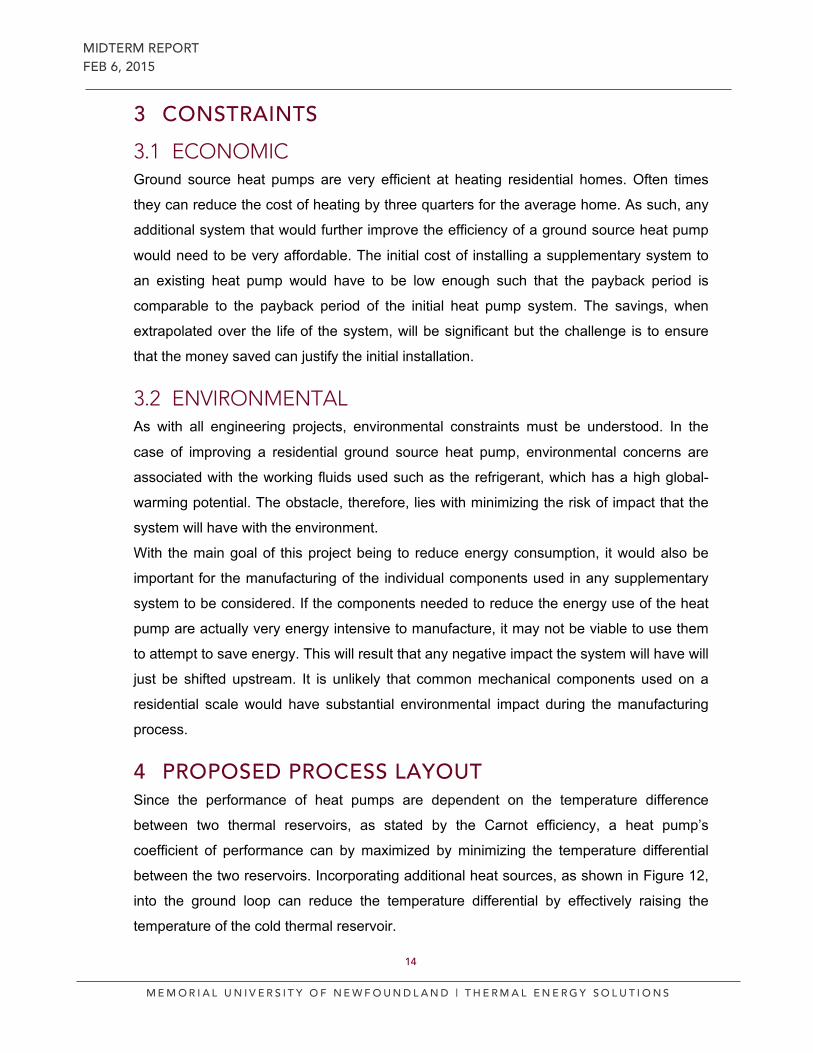
2.4.4 PLATE AND FIN Plate and fin heat exchangers, Figure 11, are similar to plate heat exchangers, except that
fin are utilized in the gaps between plates. Corrugated fins are used to space out the
plates separating the hot and cold fluids. This design, when compared to lesser fins used
in conventional plate exchangers, increases effectiveness, especially when there is a
small temperature difference between fluids. This added benefit might be necessary in the
grey water design, due to temperatures; however, the problem of corrosion and scale are
amplified. The addition of corrugated fins will provide more opportunity for salt and other
chemicals in both fluid streams to cause damage to the exchanger. The cleaning process
is also difficult due to the compact size and intricacy of the fin arrangement. This can mean
once the heat exchanger is in use and begins to show signs of wear it may need to be
replaced entirely.
Figure 11: Plate and Fin Heat Exchanger
M E M O R I A L U N I V E R S I T Y O F N E W F O U N D L A N D | T H E R M A L E N E R G Y S O L U T I O N S
14
MIDTERM REPORT FEB 6, 2015
3 CONSTRAINTS 3.1 ECONOMIC Ground source heat pumps are very efficient at heating residential homes. Often times
they can reduce the cost of heating by three quarters for the average home. As such, any
additional system that would further improve the efficiency of a ground source heat pump
would need to be very affordable. The initial cost of installing a supplementary system to
an existing heat pump would have to be low enough such that the payback period is
comparable to the payback period of the initial heat pump system. The savings, when
extrapolated over the life of the system, will be significant but the challenge is to ensure
that the money saved can justify the initial installation.
3.2 ENVIRONMENTAL As with all engineering projects, environmental constraints must be understood. In the
case of improving a residential ground source heat pump, environmental concerns are
associated with the working fluids used such as the refrigerant, which has a high global-
warming potential. The obstacle, therefore, lies with minimizing the risk of impact that the
system will have with the environment.
With the main goal of this project being to reduce energy consumption, it would also be
important for the manufacturing of the individual components used in any supplementary
system to be considered. If the components needed to reduce the energy use of the heat
pump are actually very energy intensive to manufacture, it may not be viable to use them
to attempt to save energy. This will result that any negative impact the system will have will
just be shifted upstream. It is unlikely that common mechanical components used on a
residential scale would have substantial environmental impact during the manufacturing
process.
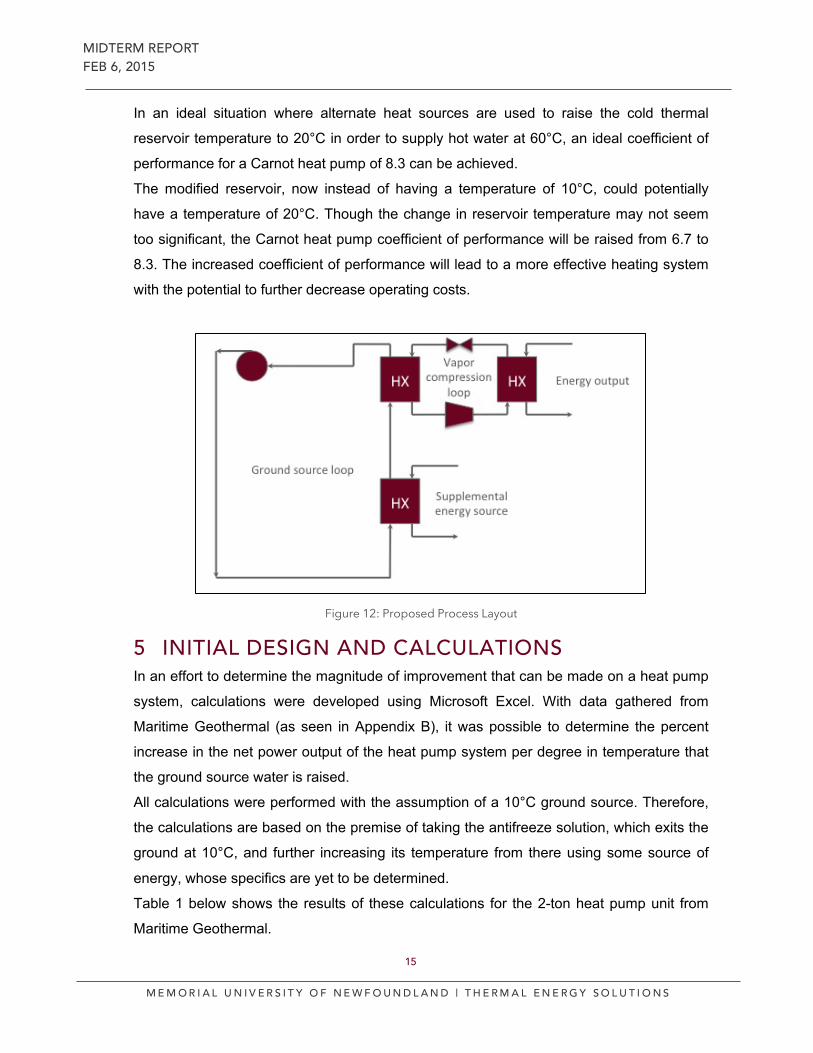
4 PROPOSED PROCESS LAYOUT Since the performance of heat pumps are dependent on the temperature difference
between two thermal reservoirs, as stated by the Carnot efficiency, a heat pump’s
coefficient of performance can by maximized by minimizing the temperature differential
between the two reservoirs. Incorporating additional heat sources, as shown in Figure 12,
into the ground loop can reduce the temperature differential by effectively raising the
temperature of the cold thermal reservoir.
M E M O R I A L U N I V E R S I T Y O F N E W F O U N D L A N D | T H E R M A L E N E R G Y S O L U T I O N S
15
MIDTERM REPORT FEB 6, 2015
In an ideal situation where alternate heat sources are used to raise the cold thermal
reservoir temperature to 20°C in order to supply hot water at 60°C, an ideal coefficient of
performance for a Carnot heat pump of 8.3 can be achieved.
The modified reservoir, now instead of having a temperature of 10°C, could potentially
have a temperature of 20°C. Though the change in reservoir temperature may not seem
too significant, the Carnot heat pump coefficient of performance will be raised from 6.7 to
8.3. The increased coefficient of performance will lead to a more effective heating system
with the potential to further decrease operating costs.
Figure 12: Proposed Process Layout
5 INITIAL DESIGN AND CALCULATIONS In an effort to determine the magnitude of improvement that can be made on a heat pump
system, calculations were developed using Microsoft Excel. With data gathered from
Maritime Geothermal (as seen in Appendix B), it was possible to determine the percent
increase in the net power output of the heat pump system per degree in temperature that
the ground source water is raised.
All calculations were performed with the assumption of a 10°C ground source. Therefore,
the calculations are based on the premise of taking the antifreeze solution, which exits the
ground at 10°C, and further increasing its temperature from there using some source of
energy, whose specifics are yet to be determined.
Table 1 below shows the results of these calculations for the 2-ton heat pump unit from
Maritime Geothermal.

M E M O R I A L U N I V E R S I T Y O F N E W F O U N D L A N D | T H E R M A L E N E R G Y S O L U T I O N S
16
MIDTERM REPORT FEB 6, 2015
Table 1: Performance Improvement Calculations for 2-ton Heat Pump
TEMPERATURE INCREASE OF HEAT
SOURCE
INCREASED NET POWER OUTPUT OF
HEAT PUMP (KW)
PERCENT INCREASE IN POWER OUTPUT OF
HEAT PUMP 0 0 0
1 0.1394 2
2 0.2788 4
3 0.4181 6
4 0.5575 8
5 0.6969 10
6 0.8363 12
7 0.9757 15
8 1.1151 17
9 1.2544 19
10 1.3938 21
The data shown above demonstrates a significant potential to improve heat pump
performance; however this is entirely dependent on being able to harness an energy
source, which can achieve the required magnitude of temperature increase. Performance
improvement per degree of temperature increase is a linear relationship, as demonstrated
in Figure 13 below.
Figure 13: Increase in Net Power Output with Increasing Inlet Temperature
0%
5%
10%
15%
20%
25%
0 2 4 6 8 10 12
Perc
ent I
ncre
ase
Temperature Increase (degC)
Increase in Net Power Output versus Temperature Increase
M E M O R I A L U N I V E R S I T Y O F N E W F O U N D L A N D | T H E R M A L E N E R G Y S O L U T I O N S
17
MIDTERM REPORT FEB 6, 2015
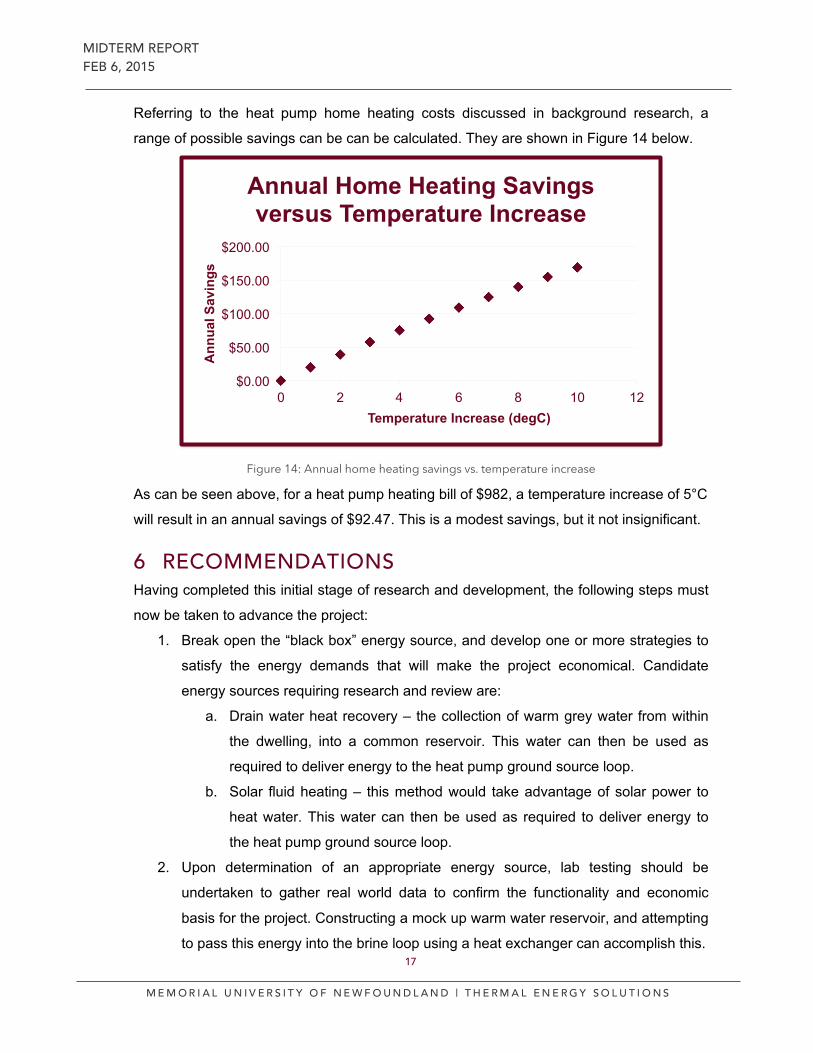
Referring to the heat pump home heating costs discussed in background research, a
range of possible savings can be can be calculated. They are shown in Figure 14 below.
Figure 14: Annual home heating savings vs. temperature increase
As can be seen above, for a heat pump heating bill of $982, a temperature increase of 5°C
will result in an annual savings of $92.47. This is a modest savings, but it not insignificant.
6 RECOMMENDATIONS Having completed this initial stage of research and development, the following steps must
now be taken to advance the project:
1. Break open the “black box” energy source, and develop one or more strategies to
satisfy the energy demands that will make the project economical. Candidate
energy sources requiring research and review are:
a. Drain water heat recovery – the collection of warm grey water from within
the dwelling, into a common reservoir. This water can then be used as
required to deliver energy to the heat pump ground source loop.
b. Solar fluid heating – this method would take advantage of solar power to
heat water. This water can then be used as required to deliver energy to
the heat pump ground source loop.
2. Upon determination of an appropriate energy source, lab testing should be
undertaken to gather real world data to confirm the functionality and economic
basis for the project. Constructing a mock up warm water reservoir, and attempting
to pass this energy into the brine loop using a heat exchanger can accomplish this.
$0.00
$50.00
$100.00
$150.00
$200.00
0 2 4 6 8 10 12
Ann
ual S
avin
gs
Temperature Increase (degC)
Annual Home Heating Savings versus Temperature Increase

M E M O R I A L U N I V E R S I T Y O F N E W F O U N D L A N D | T H E R M A L E N E R G Y S O L U T I O N S
18
MIDTERM REPORT FEB 6, 2015
3. In parallel to lab testing, detailed engineering should be carried out to finalize all
system details. Aspects such as piping, storage tank, and filtration requirements
will all be fully engineered at this point.
M E M O R I A L U N I V E R S I T Y O F N E W F O U N D L A N D | T H E R M A L E N E R G Y S O L U T I O N S
19
MIDTERM REPORT FEB 6, 2015
7 WORKS CITED [1] Natural Resources Canada. (2014, November) Natural Resources Canada. [Online].
http://www.nrcan.gc.ca/energy/products/categories/heating/13740
[2] Maritime Geothermal. Nordic. [Online]. http://www.nordicghp.com/residential-heat-pumps/economic-benefits/
[3] U.S. Energy Information Association. (2014, June) eia. [Online]. www.eia.gov/tools/faqs/heatcalc.xls
[4] AECB. (2005, November) AECB - The sustainable building association. [Online]. http://www.aecb.net/publications/the-green-electricity-illusion-full-paper/
[5] William Thomson. (1897) University of Notre Dame. [Online]. http://www3.nd.edu/~powers/ame.20231/carnot1897.pdf
[6] R Nave. HyperPhysics. [Online]. http://hyperphysics.phy-astr.gsu.edu/hbase/thermo/carnot.html#c1
[7] Kurt Gramoll. OU Engineering Media Lab eCourses. [Online]. https://ecourses.ou.edu/cgi-bin/ebook.cgi?doc=&topic=th&chap_sec=06.4&page=theory
[8] MIT. web.mit.edu. [Online]. http://web.mit.edu/16.unified/www/FALL/thermodynamics/notes/node63.html
[9] Michael J Moran, Howard N Shapiro, Daisie D Boettner, and Margaret B Bailey,
Fundamentals of Engineering Thermodynamics, 7th Ed. Hoboken, NJ: John Wiley &
Sons, Inc., 2011.
[10] R Nave. HyperPhysics. [Online]. http://hyperphysics.phy-astr.gsu.edu/hbase/thermo/heatpump.html
[11] HeuserG. (2014, June) refrigeration.blogspot.ca. [Online]. http://refrigerationtoday.blogspot.ca/2014/06/refrigeration-t-s-diagram.html
[12] Government Canada. (2014, April) Natural Resources Canada. [Online]. http://www.nrcan.gc.ca/energy/publications/efficiency/heating-heat-pump/6833

APPENDIX A: SCHEDULE
APPENDIX B: HEAT PUMP OPERATION DATA
APPENDIX C: INITIAL DESIGN CALCULATIONS