ENG child poverty · evidence of both social statistics and everyday experience indicates that...
78
1 UNICEF REPORT CHILD POVERTY IN RUSSIA Alarming Trends and Policy Options L. N. Ovcharova D. O. Popova INDEPENDENT INSTITUTE OF SOCIAL POLICY MOSCOW UNICEF Moscow 2005
Transcript of ENG child poverty · evidence of both social statistics and everyday experience indicates that...

1
UNICEF REPORT
CHILD POVERTY IN RUSSIA Alarming Trends and Policy Options
L. N. Ovcharova D. O. Popova
INDEPENDENT INSTITUTE OF SOCIAL POLICY
MOSCOW
UNICEF Moscow 2005

2
Preface
UNICEF works against Child Poverty because poverty-related opportunities denied to children have a practically irreversible impact upon them and the societies they live in. In practical terms, of interest to the Russian Federation, protecting children from the sharpest edges of poverty during their formative years is both a mark of a civilised society and a means of addressing some of the evident problems that affect the quality of life in economically developed nations.
Life opportunities ought not to be determined by the circumstances of birth. But evidence of both social statistics and everyday experience indicates that those who grow up in poverty are at a marked and measurable disadvantage. High rates of child poverty are an unambiguous contradiction of equality of opportunity.
It would be both useful as well as relevant to see this exploratory study on “Child Poverty in the Russian Federation – 2005” in light of a recent publication prepared by UNICEF entitled “Child Poverty in Rich Countries 2005”. The latter presents the following key findings: • Higher government spending on family and social benefits is clearly associated with
lower child poverty rates; • However, variation in government policy appears to account for most of the
variation in child poverty in Organization for Economic Cooperation and Development (OECD) countries. Therefore most OECD countries appear to have the potential to reduce child poverty below 10 per cent without a significant increase in overall spending;
• No OECD country devoting 10 per cent or more of GDP to social transfers has a child poverty rate higher than 10 per cent. No country devoting less than 5 per cent of GDP to such transfers has a child poverty rate of less than 15 per cent;
• There is a close correlation between growing up in poverty and the likelihood of educational under-achievement, poor health, teenage pregnancy, substance abuse, criminal and anti-social behaviour, low pay, unemployment, and long-term welfare dependency.
• While “material or income poverty” is the easiest measurement of child poverty, one should not neglect the fact that child poverty is influenced by many other, difficult to measure factors, including family love and security, parental time and skills, community support and friendship, and the quality of the environment children grow up in.
At the outset it is fundamental to recognize that child poverty is affected by a
combination of social trends, labour market conditions and government policies. Therefore it is within the scope and capabilities of governments, thus a matter of

3
political will and priority setting, to use the structure of government budgets as well as tax and benefit policies to substantially reduce child poverty.
As we approach the end of 2005, social issues seem to be high on the political agenda in the Russian Federation with a debate and great expectations surrounding the additional US$4 billion to be allocated to health care, education, housing and agriculture over the next few years. It may be the right moment to put children’s needs first. Children don’t deserve to be poor, it is their right not to be poor.
This document more than justifies itself by one revealing fact - close to one million questions have been directed to the President of Russia through a call center at the time of writing with the dominating issues being wages, pensions and housing problems, but with little direct reference to children, let alone child poverty.
Carel de Rooy UNICEF Representative for the Russian Federation and Belarus
Moscow, October 2005

4
Acknowledgements
Child Poverty in Russia has been prepared by Research Director Dr. Lilia
Ovcharova and Senior Researcher Daria Popova, Independent Institute of Social Policy, the Russian Federation.
The purpose of this report is to extend the empirical work, providing a check on assumptions and a more in depth consideration of key policy related data on exploring non income dimensions of child poverty that have particular significance within Russian Federation. These include aspects of deprivation that are underresearched and will contribute to a better understanding of child poverty in the Russian Federation. For further information please contact: United Nations Children Fund’s (UNICEF) Russian Federation Moscow, 101000 Pokrovsky bulvar, d.4/17 str.1 Offices 19 and 20 Phone: +7 (095) 9338818 Fax: +7 (095) 9338819 www.unicef.org The opinions expressed are those of the authors and editors and do not necessarily reflect the policies or views of UNICEF. The designations employed in this publication and the presentation of the material do not imply on the part of UNICEF the expression of any opinion whatsoever concerning the legal status of any country or territory, or of its authority, or the delimitation of its frontiers.

5
Contents
Introduction ..................................................................................................................... 6
1. Dynamics of living standards and poverty indicators in Russia over the reform years ..................................................................................................................... 7
1.1. Dynamics of income level, structure and inequality.................................................. 7
1.2. Employment dynamics ............................................................................................... 9
1.3. The social security system........................................................................................ 11
1.4. Poverty in Russia: definition, measurement, dynamics of level and depth ............. 14
1.5. Poverty in Russia in the context of the Millennium Development Goals................ 19
2. Poverty profile: children have the highest risk of poverty in Russia............. 26
2.1. The main characteristics of the poverty level and profile ........................................ 26
2.2. Poverty profile of families with children ................................................................. 28
2.3. The poverty profile according to absolute and relative criteria ............................... 31
2.4. Poverty among families with a favourable demographic situation.......................... 34
3. Non-monetary forms of poverty in Russia as a whole and among families with children .................................................................................................................. 39
3.1. Non-monetary tangible assets: large families have poor housing conditions and single-parent families have no property .......................................................................... 39
3.2. Population health and accessibility of medical services .......................................... 42
4. Regional measurement of poverty..................................................................... 50
Summary ........................................................................................................................ 56
Appendix 1 ...................................................................................................................... 58
Appendix 2 ...................................................................................................................... 71
Appendix 3 ...................................................................................................................... 78

6
Introduction
As market relations were just taking shape in Russia, the political and expert community did not focus on the problem of poverty, since it was seen as a temporary exacerbation of socio-economic problems under the conditions of reform. Twelve years later, it has become evident that the pre-reform level of the population’s average incomes has not been regained and that income differentiation has more than trebled. An inevitable consequence of the way things have developed was a growth of poverty, which, in turn, could not go unnoticed by the public, the executive and legislative authorities. Reducing the poverty level by half has been declared a priority goal of the development of Russian society. Analysis of the scale, depth and profile of poverty indicates that children are distinguished by the highest risk and greatest depth of poverty. The aim of this report is to provide a detailed analysis of child poverty in Russia The first chapter is devoted to analysis of the changes in the indicators of the standard of living and poverty in Russia during the market reform years. We consider these issues in order to understand the general context in which the standard of living of families with children forms. In that chapter, material is also presented explaining the methodology used for measuring poverty in Russia today and the role of government social programmes in the poverty reduction effort. A structural analysis of the poverty profile makes it possible to assess the share of families with children in the overall poor population. The second chapter of the report is devoted to these issues. A breakdown of the socio-demographic profile of poverty provides an opportunity for understanding the specifics of how the standard of living is composed and the tendency towards poverty among complete families with a small number of children, single-parent and large families. Since poverty is manifested in a multitude of forms, the third chapter is devoted to analysis of this question. Poverty among families with children and Russian poverty in general is assessed from the viewpoint of provision with non-monetary tangible assets and the accessibility of medical services. The fourth chapter focuses on regional disparities in Russia. Analysis of regional disparities in the standard of living and poverty indicates that the regional factor largely determines the chance of households falling into the poor category. That is why this subject has become one of the priorities in analysing child poverty.

7
1. Dynamics of living standards and poverty indicators in Russia over
the reform years
1.1. Dynamics of income level, structure and inequality The main negative trends in the change in the welfare of Russia’s population over the market reform years have been a drop in and larger spread of real incomes which resulted in poor population growth. If 1991 is taken as the point of departure for analysis, as that year preceded the radical economic reforms (Table 1.1 of Appendix 1), the sharpest drop in real incomes was observed in 1992 and 1998. In the former case, this was connected with the liberalisation of prices in January 1992, and in the latter, with the financial and economic crisis of August 1998. The data presented in Table 1 of Appendix 1 confirm that the pre-reform income level has yet to be achieved, despite a sustained rise in the people’s real incomes which began in the year 2000. The income dynamics were matched by substantial changes in the income structure (Table 1.1).
Table 1.1. Structure of money incomes of the population (%) 1990 1996 1997 1998 1999 2000 2001 2002 2003 Total cash incomes 100 100 100 100 100 100 100 100 100 Including: Wages and salaries 76.4 66.5 66.4 64.9 66.4 62.9 64.6 65.8 63.9 Income from business 3.7 13.1 12.5 14.4 12.4 15.2 12.4 11.9 12 Social transfers 14.7 14.0 14.8 13.4 13.2 13.9 15.3 15.2 14.1 Income from property 2.5 5.3 5.7 5.5 7.1 6.8 5.8 5.2 7.8 2.7 1.1 0.6 1.8 0.9 1.2 1.9 1.9 2.2
Sources: 1. The Social Position and Standard of Living of the Population in Russia (2001, 2002), Statistical Digest, M., Goskomstat of the Russian Federation. 2. Russian Statistical Yearbook 2004, Statistical Digest, Russian Committee for Statistics (Rosstat), M., 2004, p. 725.
Alongside declining incomes and wages, new income sources appeared, including income from business and from property. As a result, the share of these new sources of income in the structure of money (cash) incomes rose, while that of wages was steadily falling. In 1991, wages accounted for over 70% of per capita money income, but in 2000-2002, for 63-66% (concealed, officially unregistered wages included1). The respective figures for incomes from business and from property were 13-15% and 5-7% (Table 1.1). The transformation of the structure of the population’s incomes, against the background of an overall drop in them, was largely responsible for their significant differentiation, 1 Since 1999, the share of wages in the structure of income has been marked up by the Federal Government Statistics Service (FGSS) by an amount of concealed salaries, which constitutes the difference between total incomes and the amount of all the types of income officially registered or specifically evaluated. The share of concealed wages averages about 25% of total incomes. Without adjustment for concealed wages, wages would account for about 40% of total incomes.

8
which is rooted in impoverishment of the population groups living on wages and social transfers, and enrichment of those receiving income from business and property. The rapid rise in the wealth of the latter allowed some of them to regain the pre-reform standard of living. At the same time, most recipients of traditional incomes experienced a deterioration in their standard of living and many of them found themselves below the poverty line. Table 1.2 shows clearly the process of redistribution of money incomes between quintiles, which began in 1992, when the incomes of the poorest quintile fell by half: from 11.9% in 1991 to 6% in 1992. Right up until 1995, their incomes continued falling steadily: to 5.8% in 1993 and 5.3% in 1994. In subsequent years (1995-1999), a trend was observed for them to stabilise around the 6.0-6.2% mark. In 2002-2003, however, their money incomes fell once again, to 5.6%. A similar but less pronounced process was typical of the three middle-income population groups: their cash incomes accounted for 57.4% of the total income in 1991 and 48.3% in 2003. This testifies to a deterioration in the financial position of the middle-income strata of the population. Correspondingly, in the fifth quintile, a significant income rise was observed: from 30.7% in 1991 to 38.3% in 1992, 47.9% in 1999 and 46% in 2002-2003. Thus, in 1999-2003, the wealthiest quintile accounted for virtually half of all the money incomes of the population. The dynamics of the aggregated indices of income inequality, presented in Table 2, also reflect a growing stratification of the population: Goskomstat estimates that during the 1991-2003 period the per capita income ratio2 went up from 4.5 to 14.3-fold, and the Gini coefficient3 – from 0.260 to 0.400. The period of maximum increase in income inequality was 1991 to 1994, when the value of the Gini coefficient went up by more than 50%, after which a certain drop in differentiation was observed, until this was interrupted by the financial crisis in 19984.
Table 1.2. Distribution of total money incomes of the RF population, differentiation coefficients for 1991-2003, %
1991 1992 1993 1994 1995 1996 1997 1998 1999 2000 2001 2002 2003
Money incomes, total 100 100 100 100 100 100 100 100 100 100 100 100 100
2 The per capita income ratio is equal to the ratio of total incomes of decile 10 (with the highest incomes) and decile 1 (with the lowest incomes). 3 The Gini coefficient is equal to half the average deviation of each income unit individually from all the other income units, expressed in relation to the average income. 4 Although officially published assessments of income differentiation are quite high, it should be noted that the method applied by the FGSS to model the distribution of households in income terms is open to dispute. The FGSS assesses differentiation by means of an imitation model that virtually ignores regional differences in the cost of living (which leads to an overestimation of the real level of inequality) and regional differences in income inequality (which has the opposite effect). According to experts using other methods, the actual value of the inequality indicators are from 50% to 100% higher than the official ones [A.Yu. Shevyakov, A.Ya. Kiruta, Measurement of economic inequality, M., Summer 2002, p. 320], or even 250% higher. [Incomes and Employment of the Population.//Russian Federation Human Development Report for 2002, M., InterDialect, 2003, p. 43].

9
First decile (with the lowest incomes) 11.9 6.0 5.8 5.3 5.5 6.2 5.9 6.0 6.1 6.0 5.9 5.6 5.6
Second 15.8 11.6 11.1 10.2 10.2 10.7 10.2 10.4 10.4 10.4 10.4 10.4 10.3 Third 18.8 17.6 16.7 15.2 15.0 15.1 14.1 14.8 14.7 14.8 15 15.4 15.3
Fourth 22.8 26.5 24.8 23.0 22.4 21.6 21.6 21.2 20.9 21.2 21.7 22.8 22.7 Fifth (with the highest incomes) 30.7 38.3 41.6 46.3 46.9 46.4 47.5 47.6 47.9 47.6 47 45.8 46.1 Decile per capita income ratio 4.5 8.0 11.2 15.1 13.5 13.0 13.5 13.8 14.0 13.8 14.0 14.0 14.3 Gini coefficient 0.260 0.290 0.398 0.409 0.381 0.375 0.381 0.398 0.399 0.394 0.396 0.398 0.400 Sources: 1. Russian Statistical Yearbook 2002, Statistical Digest/Goskomstat of Russia, М., 2002, p. 690. 2. Russia in Figures, 2003, Concise Statistical Digest/Goskomstat of Russia, М., 2003, pp. 431-108.
1.2. Employment dynamics The state of the labour market exerts a direct influence on the welfare of the economically active population groups and an indirect influence on the standard of living of minors, most of whom live in families of working people. Supply on the labour market is formed by the economically active population, including both the employed and unemployed. The ratio between these groups and the total able-bodied population reflects the level of economic activity. Table 1.3 demonstrates a marked drop in the overall level of economic activity of the population over the reform years, which means loss of earned income by millions of people and, consequently, has a negative impact on the population’s standard of living. This process was particularly intensive in the 1992-1998 economic recession period. The situation changed in 1999, when economic activity reached its 1994 level.
Table 1.3. Economic activity of the population, 1992-2003, % 1992 1995 1998 1999 2000 2001 2002 2003
А. Level of economic activity of the population 1. aged 15-72 years* total 70.3 64.8 61.1 65.5 64.8 64.3 65.2 65.5 men 77.6 72.1 67.6 71.9 70.9 70.3 70.5 70.9 women 63.7 58.3 55.2 59.7 59.2 58.8 60.3 60.6 2. of working age* total 84.2 80.3 76.1 79.0 78.6 77.2 77.5 77.3 men 86.6 82.8 79.0 81.7 81.0 80.2 79.9 80 women 81.6 77.6 73.1 76.0 76.0 74.1 75.1 74.6
B. Level of employment of the population 1. aged 15-72 years total 66.7 58.7 53.0 57.2 58.4 58.6 59.6 60.3 men 73.6 65.2 58.5 62.8 63.7 63.8 64.2 65.1 women 60.4 52.9 48.1 52.2 53.7 53.8 55.4 56 2. of working age

10
1992 1995 1998 1999 2000 2001 2002 2003 total 79.9 72.5 65.9 68.8 70.7 70.2 70.8 71.1 men 82.2 74.6 68.2 71.1 72.6 72.6 72.6 73.3 women 77.4 70.2 63.5 66.3 68.8 67.7 68.8 68.7 Source: Russian Statistical Yearbook, 2004, Statistical Digest/Rosstat, М., 2004, p. 725.
During the period of economic recession, the numbers of the unemployed grew 2.3-fold to reach 13.2% in 1998 (Table 1.4).
Table 1.4. 1992-2003 unemployed as % of the economically active population 1992 1995 1998 1999 2000 2001 2002 2003
1. Unemployed total 5,2 9.4 13.2 12.6 9.8 8.9 8.6 7.9 men 5,2 9.7 13.5 12.8 10.2 9.3 9.0 8.3 women 5,2 9.1 12.9 12.4 9.4 8.5 8.1 7.9
2. Unemployed registered with the government employment agencies (in 2002-2003, including the Chechen Republic)
total 0,8 3.3 2.9 1.7 1.4 1.6 2.1 2.3 men 0,4 2.3 1.9 1.0 0.9 1.0 1.3 1.4 women 1,2 3.9 3.9 2.5 2.1 2.2 3.0 3.1 Source: Russian Statistical Yearbook, 2004, Statistical Digest/Rosstat, М., 2004, p. 725.
The tendency towards a drop in unemployment appeared at the beginning of economic growth, thanks to which the share of unemployed fell to 7.9% between 1999 and 2003. This fall was most rapid in the first two years of economic recovery, but has slackened off in subsequent years (Table 1.4). In 2002-2003, the drop in the unemployment level was the result of a rise in the numbers of employed, rather than a fall in the numbers of unemployed. The welfare of the working people is determined by wage levels. A characteristic feature of the period of market transformations in Russia has been significant losses of the real content of wages, as received by 90% of the employed (Table 1.1 of Appendix 1). During the 1992-1998 recession period, real wages dropped to a third of their previous level. Hence the fall in GDP and the relevant drop in real per capita incomes, which halved over this period. Economic growth pushed real wages up in 2000 and their dynamics started to outstrip these of GDP and the population’s money incomes. In 2004, however, real incomes were still only 57.8% of the 1991 level. The loss in the value of wages has resulted in average wages falling far behind the minimum subsistence level (living wage). In 1991, for instance, the share of employed earning less than the living wage was no more than 8%, but from 1992 to 1998, it fluctuated between 25% and over 40%. Low wages largely accounted for the poverty of the working population. Wages began to rise only in 2002, the process encompassing 70% of the employed. According to 2004 data, only 25% of the employed received low wages, but this drop was still not enough to protect them from poverty, since a 10% level alone might be a safeguard against poverty. Another poverty-promoting factor associated with the new economic conditions was wage arrears which emerged in the early reform years, snowballed in the mid-1990s, and peaked in 1998-1999 due to the financial crisis. According to official statistics, the

11
share of the employed whose salaries were delayed constituted 33% in 1998, though, according to REHM5 data from the mid-crisis period, the figure was actually more than 60%. Once economic growth set in, wage arrears began to shrink. Currently, only 10% of employees are affected by wage arrears (data for early 2003). Another characteristic feature of the reform years has been an abnormally high differentiation of wages. Over the 12 year period, the average wage gap between the highest- and lowest-paid deciles has almost quadrupled. In 1990, for instance, the wage gap factor stood at 7.8, but in 2000-2002, it rose to 30-40 (Table 1.5).
Table 1.5. Wage gap dynamics in Russia, 1990-2003 Indicator 1990 1994 1995 1999 2000 2001 2002 2003 Difference factor 7.8 23.4 26.4 32.1 34.0 39.6 30.5 26.4 Gini coefficient - 0.439 0.454 0.482 0.483 0.507 0.477 - Sources: 1. Statistical Bulletin No. 9 (93), January 2003, М., RF Goskomstat, p. 37. 2. Statistical Bulletin. No. 9 (108), November 2004, М., Federal Government Statistics Service, p. 46.
It should be noted that, in Russia, wage differentiation is twice as high as income differentiation and constitutes the main reason behind the latter, since earned income remains the most significant and mass type of the population’s incomes. 1.3. The social security system The basic principles of the Russian social security system were inherited from the Soviet era. Today, the social support system is still based on insurance payments, disability benefits and supports for persons who have given particular service to the state, while assistance to the poor is not a social policy priority. In general, all social transfers can be divided into social transfers in cash and social transfers in kind. The total amount of cash (monetary) social transfers in 2003 amounted to 9.4% of GDP. They are the main source of income for Russian people and constitute 13-15% of their money incomes, with 70-80% of these being, moreover, pensions. As the data in Table 1 of Appendix 1 show, after the liberalisation of prices in 1992, the standard of living of the elderly population fell just as that of the entire population did: the real value of the average pension dropped to 42.5% of the December 1991 level. Overall, from 1993 to 1997, the real level of pensions was on the rise: their annual growth averaged 106.6%. The biggest drop in pensions occurred during the period of the financial crisis (1998) and stagnation (1999), when their real levels fell to 29.2% and 27.3%, respectively, of the December 1991 level. Since 2000, periodical indexations of pensions have been made. Moreover, in 2000, all pension arrears were settled. As a result, in 2004 real pensions rose to 52.3% of the 1991 level, which 5 Russian Economic and Health Monitoring (REHM) consists of a series of countrywide representative surveys performed in Russia between 1992 and 2003, the results of which are available on the Internet [http://www.cpc.unc.edu/rlms/]. The study covered about 12,000 respondents from 4,500 households, living in 32 regions of Russia.

12
constitutes 109.6% of the pensioner’s minimum subsistence level. It should be noted that policy in relation to pensioners has promoted a rapid restoration of their incomes; this, however, cannot be said of families with children, in relation to which the role of government assistance has consistently fallen throughout the reform period. Today, the value of all social benefits is no more than 1% of the GDP and about 2% of total money incomes (Table 1.6). The most widespread benefits are as follows:
• temporary disability benefits;
• monthly benefits for children up to the age of 16 years and those in full-time education up to the age of 18 years, inclusively;
• unemployment benefits.
Table 1.6. Monetary social transfers 1992 1995 1996 1997 1998 1999 2000 2001 2002 2003 Share in GDP, % 5.3 7.5 8.8 9.9 8.7 8.0 7.8 8.9 9.6 9.4 Share in total cash incomes of population, % 14.3 13.1 14.0 14.8 13.4 13.1 13.8 15.2 15.3 14.1 Including: Pensions 12.2 10.2 10.0 10.9 10.1 9.6 9.1 10.1 10.6 10.4 Stipends 0.2 0.2 0.2 0.2 0.2 0.2 0.1 0.1 0.1 0.1 Benefits 1.2 2.4 3.2 3.1 2.3 1.9 2.0 1.8 1.9 1.6 Sources 1. The Social Position and Standard of Living of the Population in Russia, 2002, Goskomstat of Russia, Moscow, 2002, p. 104. 2. The Social Position and Standard of Living of the Population in Russia, 2003, Goskomstat of Russia, Moscow, 2003, pp. 108, 172. 3. The Social Position and Standard of Living of the Population in Russia, Rosstat, Moscow, 2004, pp. 141, 212.
The drop in government support for families with children was manifested in a reduction in the family and maternity benefits item6, which currently absorbs about a third of all the funds spent on all social benefits. In 1991, family and maternity benefits accounted for 77.3% of the total funds, in 1995 for 54%, while the 2003 figure was only 32.4% (Table 1.2 of Appendix 1). This change was the result of a refusal to pay monthly child benefits to all children indiscriminately and a switchover to paying such benefits only to children from poor families. Thus, in contrast to the majority of benefits which are insurance-based, monthly child benefits are distributed on a targeted basis. Even so, they are paid out to over 70% of all children and the size of such a benefit amounts to 3.3% of the child’s subsistence minimum (Table 1.3 of Appendix 1). In addition, there are still debts with respect to payment of this benefit: at the end of 2003, the debt amounted to 22.9% of the total amount of benefits due (Table 1.2 of Appendix 1). As a result, in spite of the quite considerable outlays on the payment of benefits in general, they do not resolve the problems of poor families with children. Beginning from 2005, financial and legislative powers with regard to these benefits were handed over to the RF constituent entities, which will result in a worsening of the status of children in depressed areas. 6 Family and maternity benefits include: maternity benefits, birth grants, 0-18 months child care benefits, disabled child care benefits, and monthly benefits for each child.

13
Now let us take a look at data on social transfers in kind and in noncash form, which the population receive as benefits and subsidies in acquiring goods and services. A breakdown of the disposable resources structure by decile group (Table 1.7) indicates that, in contrast to cash benefits, which make the biggest contribution to the disposable resources of those in Decile One (poorest), benefits in kind are to a large extent accessible to the middle-income groups.
Table 1.7. Structure of households per capita disposable resources by decile group, %
decile 1decile 2decile 3decile 4decile 5decile 6decile 7decile 8 decile 9decile 10Wages 32.5 33.8 31.7 30.5 32.3 35 40.5 45.7 49.4 52.9 Pensions and stipends 25.4 32.7 37.8 39.6 36.3 32.3 26.5 20.1 15.3 7.6 Monetary benefits 4.9 2.2 1.5 1.1 1.1 1 0.8 0.6 0.5 0.5 Revenues from personal subsidiary plots in money form 3.9 3.1 2.7 2.3 2.4 2.2 2.8 2.6 2.9 1.7
Revenues from personal subsidiary plots in kind 10.7 8.5 8.1 7.1 6.5 6.7 5.7 4.9 4.3 2.2
Benefits and subsidies in kind 2.5 3.2 3.8 4.7 5.1 4.9 4.4 3.4 2.9 1.9 Monetary assistance from relatives 2.9 2.3 2.1 2.4 2.3 2.2 2.6 2.8 2.8 2.8 Other receipts7 17.2 14.2 12.3 12.3 14 15.7 16.7 19.9 21.9 30.4 Total 100 100 100 100 100 100 100 100 100 100
Source: calculated from NOBUS data for the 2nd quarter of 2003.
According to our estimates based on the NOBUS data, the most common are housing and amenities benefits (41.4% of households enjoy these benefits) and transport subsidies (38.7%). In location terms, it is transport benefits that are the most differentiated: they are enjoyed by 52.8% of households in cities with a population of one million or more, but only by 27.4% of rural families. Recipients of subsidised sanatorium vouchers are found among only 2.6% of families (4.9% in cities with over one million inhabitants and 1.5% in rural areas). Recipients of subsidized medicines and medical services are found in 19.8% of families and there are no significant discrepancies in location terms: 22.2% in cities with a population of one million or more, and 17.9% in rural areas. In addition, there are benefits for: keeping children in preschools; paying for food, including for children at school; compensation for expenses on gasoline and repairs to motor transport; other receipts in kind (social transfers from the employer enterprise that are not included among the above services, material assistance, humanitarian aid, etc.). According to NOBUS data, 50% of Russian households receive federal social benefits. In value terms, these programmes account for about 9% of the total volume of disposable resources of households participating in the social benefit programmes. Regional social programmes for providing assistance in kind fall outside the scope of the federal social mandate and on average encompass 20% of households. However, the programmes financed out of regional and local budgets alone apply to only 10% of households participating in regional programmes, while the remaining 10% receive assistance from the enterprises where the family members work, charitable 7 Types of money income for which the true source cannot be reliably identified.

14
organisations, various communities, the Church, and other religious organisations, public and political associations, political parties and other sources. Analysis of the composition of benefit programme participants from the sociodemographic point of view indicates that the maximum amount of federal benefits is received by families of pensioners. The federal benefits system embraces 85% of non-working pensioners, 80% of single pensioners and 86% of married couples on pensions, with about 50% of the households consisting of two pensioners enjoying four or more types of benefits. This is because, according to effective legislation, the right to benefits is enjoyed, in the main, by elderly people (the average age of beneficiaries being 62 years), since it is they who have given particular service to the state or have health problems affecting their way of life. In families that include pensioners, the provision of social benefits is, as a rule, much greater than in young and middle-aged families. Thus, families with heavier child dependency and therefore facing a higher risk of poverty remain virtually without government support. According to NOBUS data, 80% of single-parent families with children and over 60% of families with many children are not covered by the system of social benefits. Regional programmes to a considerable extent focus on supporting families with children. The system of regional social support covers 18% of all families with children and only 8% of families without children. Most often, the participants are large families (26%), married couples with 2 children (19.1%) and single-parent families with children (18.4%). However, regional programmes are not specially focused on any particular family groups. Here we have a striving to implement the following model for organising social programmes: the main thing is not the amount of aid, but the number of participants, and the more the participants, the better. Thus, neither federal nor regional programmes regard poor households as a priority group. The distribution of financial resources, the scale of household coverage and the level of concentration of individual benefits in a household all indicate that the non-poor remain the most active recipients of benefits in cash and in kind. Consequently, these social programmes do not make any tangible contribution to reducing poverty, and their higher efficiency within the framework of poverty reduction policy would be possible only if the practice of determining participants by category is given up and the procedure for means testing is introduced, on the condition that those placed in the category of poor enjoy priority access. 1.4. Poverty in Russia: definition, measurement, dynamics of level and depth In Russia, those with incomes below the poverty line are officially viewed as poor. Russia was the first CIS country to officially introduce the procedure for poverty line assessment based on subsistence minimum calculation after the start of market reforms in 1992. In the interim 14 years (1992-2004), the procedure for calculating the subsistence minimum was changed twice. From 1992 to 1999, it was determined by a regulatory-statistical method, according to which the food basket cost was assessed based on the minimum consumption standards for protein, fat, carbohydrates, minerals

15
and vitamins. The cost of the non-foodstuffs was calculated on the basis of the expenditure patterns of the poorest quintile. Since 2000, the subsistence minimum has been determined by a method of standards, meaning that both the food and non-food parts of the minimum basket are assessed on the basis of minimum consumption standards. It should be noted that each of the RF constituent entities had its own subsistence minimum determined for it. Differences in regional subsistence minimum levels are 3.5 to 4-fold. Since the population’s consumption is differentiated significantly depending on its sociodemographic characteristics and living conditions, the subsistence minimum has been calculated not only per capita of the population or per household, but also separately for children, pensioners and able-bodied people. Calculations of the subsistence minimum for Russia as a whole have been made according to the new methodology since the 1st quarter of 2000 according to the main sociodemographic groups of the population and per capita8. For the purpose of producing comparable dynamic series for the subsistence minimum, the indicators for 1999 and 1998 were recalculated retrospectively according the methodology in place since 2000. The results of these assessments are given in Table 1.8. They show that the new subsistence minimum is approximately 15% dearer. At the same time, the subsistence minimum for pensioners calculated by the 2000 method has increased by about 25%, that for children by 20%, and that for the able-bodied population – by roughly 12%.
Table 1.8. Subsistence minimum by sociodemographic group, 1998-2000
Including by sociodemographic group Total population able-bodied population pensioners children
1998 493 (567) 555 (616) 1998 493 (567) 1999 908 (1008) 1003 (1089) 1999 908 (1008) 2000 1210 1320 2000 1210 Source: Proposals for Poverty Reduction Strategy, M., ILO, 2002, p. 127.
The minimum food baskets were also developed by the Institute of Nutrition of the Russian Academy of Medical Sciences (RAMS) in consideration of recommendations made by the World Health Organisation (WHO). The subsistence minimum dynamics for the last three years are given in Table 1.9.
Table 1.9. Subsistence minimum in 2000-2002 (per capita) by sociodemographic group, roubles per month
Including by sociodemographic group Total population able-bodied population pensioners children
2000 I quarter 1138 1232 851 1161 II quarter 1185 1290 894 1182 III quarter 1234 1350 930 1218
8 Resolution No. 36/34 of the RF Ministry of Labour and Goskomstat of Russia, dated 28 April 2000.

16
Including by sociodemographic group Total population able-bodied population pensioners children
IV quarter 1285 1406 962 1272 Year 1210 1320 909 1208
2001 I quarter 1396 1513 1064 1405 II quarter 1507 1635 1153 1507 III quarter 1524 1658 1163 1514 IV quarter 1574 1711 1197 1570 Year 1500 1629 1144 1499
2002 I quarter 1719 1865 1313 1722 II quarter 1804 1960 1383 1795 III quarter 1817 1980 1387 1799 IV quarter 1893 2065 1432 1880 Year 1880 1967 1379 1799
2003 I quarter 2047 2228 1554 2039 II quarter 2137 2328 1629 2119 III quarter 2121 2318 1612 2089 IV quarter 2143 2341 1625 2113 Year 2112 2304 1605 2090
Source: Russia in Figures. 2004, Concise Statistical Digest/Federal Government Statistics Service, M., 2004. The composition and structure of the current subsistence minimum were set by Federal Law No. 134-FZ of 24 October 1997 on the Subsistence Minimum in the Russian Federation (as amended on 27 May 2000). The law lays down two key concepts: subsistence minimum and consumer goods basket. The subsistence minimum is defined as the cost of the consumer goods basket, plus mandatory payments and levies. In its turn, the consumer goods basket is defined as the minimum package of foodstuffs, plus non-food goods and services, necessary to maintain a person’s health and life. The Federal law establishes that:
• The size of the subsistence minimum per capita and by the main sociodemographic groups of the population as a whole for the Federation shall be established by the Government of the Russian Federation, and in the constituent entities of the Russian Federation – by the executive agencies of the constituent entities of the Russian Federation.
• The size of the subsistence minimum set for the Russian Federation in general shall be the basis for establishing the size of the minimum wage and the minimum old age pension, as well as for determining the size of stipends, allowances and other social benefits.
• The subsistence minimum shall also be taken into consideration in the rendering of government social assistance.
In Russia, officially published data on the poverty level are based on the poor population index, determined under Russian conditions as the share of the population

17
with incomes below the subsistence minimum. Figure 1.1 presents the dynamics of this share of the population for a 12-year period. As we can see, this indicator fluctuated substantially. After the 1992 liberalisation of prices the poor amounted for a third of the Russian population, then the figure declined steadily until 1995. The biggest drop in the poverty level occurred in 1994, but the reasons for this change should not be sought in the specifics of socioeconomic policy or significant institutional changes. The main factor behind this was the changes introduced into by the FGSS into the methods used for constructing the income distribution series.
33.5 31.5 22.4 24.7 22.0 20.7 23.3 28.3 28.9 27.3 24.2 20.4
5.3
4.4
5.9
3.8
2.6
3.6
5.04.8
3.52.83.13.3
0.0 5.0
10.0 15.0 20.0 25.0 30.0 35.0 40.0 45.0
1992 1993 1994 1995 1996 1997 1998 1999 2000 2001 2002 2003
Pove
rty le
vel,
%
0.0
1.0
2.0
3.0
4.0
5.0
6.0
Mon
ey in
com
e sh
ortfa
ll, %
Poverty level, percentage of total populationMoney income shortfall, percentage of total money incomes of the population
Figure 1.1. Official estimates of poverty level and depth based on macroeconomic data
Sources: 1. Russia in Figures. 2004, Concise Statistical Digest/Federal Government Statistics Service, M., 2004, p. 99-100. 2. The Social Position and Standard of Living of the Population in Russia: Statistical Digest/Goskomstat of Russia, М., 2001, p. 24. 3. The Social Position and Standard of Living of the Population in Russia: Statistical Digest/Goskomstat of Russia, М., 1997, p. 9. In 1995, a certain rise in the rate of poverty was observed, which was linked to the financial crisis, followed by a tendency for poverty to decline, lasting right through until the August crisis of 1998. After that crisis, the consequences of which were demonstrated most clearly in 1999, we observe a steady fall in the level of poverty, beginning as early as 2000. It was in this year, however, that Russia transferred to a higher subsistence minimum, so the growth of the population’s real incomes was not reflected in poor population dynamics. Can the poor population index be considered a fair poverty measurement unit? In certain cases, yes, it can. It is easy to understand and use in practice. For assessing the overall progress in poverty reduction, it is the most suitable instrument for analysis. In some cases, however, including poverty and social impact analysis, use of this indicator

18
does not allow the effects to be evaluated. Such is the case, for instance, when a programme is targeted on the poorest groups and, as a result of its impact, the recipients of social assistance remain in the poor category, but receive substantially higher incomes. In such a case, it is income shortfall that provides for a more precise assessment of these dynamics. This poverty indicator can be calculated in a variety of ways. Official Russian statistics define it as the amount of income that would need to be paid to all poor people to bring them out of poverty, as a percentage of the volume of income of the total population. The dynamics of this indicator are also given in Figure 1.1., from which it can be seen, in particular, that in 2003, 2.6% of the total income would have had to be redistributed in favour of the poor in order to eliminate poverty. Given the rise in the incomes of the middle- and high-income population strata, this indicator is likely to fall even if the depth of poverty increases. In particular, if the incomes of the poor remain unchanged, but there is an overall income growth, this income shortfall will shrink. The most informative is the per capita income shortfall, expressed as a percentage of the subsistence minimum. Fundamental conclusions can be drawn on the basis of analysis of a distribution series for income shortfall. This indicator is not among those published officially, so here we make use of NOBUS data. Let us note that poverty assessments, based on this data source, do not coincide with those published officially (Table 1.10). These disparities result from use of different data for measuring income poverty (actual income, spending or disposable resources9) and methods for gathering them (macroeconomic data and household surveys). In particular, NOBUS data give higher poverty rates than the official assessments, the calculation of which includes a number of methodological errors. While leaving a discussion of approaches to determining and measuring poverty outside the scope of this report, let us note that, in this case, 26.0% of households, or 33.4% of the population, are classified as poor.
Table 1.10. 2003 poverty level, % Households Population Data sources
Income (expenses)
Disposable resources
Income (expenses)
Disposable resources
Based on distribution pattern series by expenses* - - - 20.4
Based on HBS data expenses** 41.2 32.5 47.3 39.4 Based on NOBUS data 49.0 26.0 55.6 32.2 * Official poverty level assessment ** HBS – Household budget surveys, performed quarterly by Rosstat Now let us turn to the distribution of income shortfall calculated on the basis of NOBUS data, measured as a percentage of the subsistence minimum and indicating how much extra would have to be paid to the poor to bring their incomes up to the subsistence minimum, i.e., so that they were no longer poor. The average income shortfall of all poor people is 22.5% of the subsistence minimum, while the average level of the disposable resources shortfall is equal to 10%. 9 Disposable resources include both money and other incomes.

19
Distribution of the total volume of these indicators (Figure 1.2) gives grounds for asserting that poverty in Russia is not deep. For the majority of poor families, the disposable resources shortfall is no more than 40% of the subsistence minimum, and only among 8% of households does it exceed 60% of the subsistence minimum. These assessments prompt the conclusion that a significant proportion of poor households in Russia are concentrated around the poverty line and only for a tenth of them does poverty mean a virtual lack of the source of livelihood. The fact that poverty is not deep should be regarded as a positive result from the point of view of the dynamics of the standard of living, and concentration of the poor predominantly at the poverty line is also indicative of a high level of temporary poverty. For policy purposes, this makes it possible to determine two fundamentally different lines of targeted activities. First, using programmes designed to support those at the poverty line, a substantial reduction could be achieved in the poor population at minimum costs. Second, some 8% of poor families will remain so even if a substantial part of income is redistributed in their favour; hence the need for special poverty reduction programmes.
money income disposable resources (maximum for incomes and expenses)
1,2
19,2
13,7
7,3 7,1
22,5
32,6
26,3
39,7
30,4
up to 20% SM up to 80-100% SM up to 60-80% SM up to 40-60% SMup to 20-40% SM
Figure 1.2. Distribution of poor households by income shortfall level, as % of the subsistence minimum (SM)
Source: calculated from NOBUS data for the 2nd quarter of 2003.
1.5. Poverty in Russia in the context of the Millennium Development Goals A cut in extreme poverty is determined as the priority goal in the sphere of development, formulated in the Millennium Declaration. We will confine ourselves to considering the given issue in the report, since certain indicators of the Millennium Development Goals affect children directly. As already noted, assessment of poverty

20
presupposes answers to two questions: how many people or households may be categorised as poor (proportion of the poor) and how poor are they (resources shortages of the poor)? The tasks countries need to resolve in implementing the Millennium Declaration and indicators of progress in achieving Goal 1 of the MDG, also follow the given principle: Task 1. By 2015, halve the proportion of the population in extreme poverty. In order to evaluate measures geared to achieving this goal, the use of the following indicators is proposed:
• dynamics of the population share with less than 1 dollar a day for current consumption10;
• dynamics of the resource shortfall of the poor, using a poverty line at the level of 1 dollar a day.
• dynamics of the consumption share of the poorest 20% in total consumption. Task 2. By 2015, halve the share of the population suffering from hunger. Progress in this field will be measured by the following indicators:
• incidence of low weight among children up to the age of 5 years;
• share of the population with a calorie consumption below the minimum. The indicators determining progress in resolving the first of these tasks will, under Russian conditions, measure success of quite a broad scope. The indicators of the share and shortage of resources shortfalls of the population with incomes less than 1 dollar a day are oriented on evaluating the results of improving the material well-being of the poorest strata of the population or those in abject poverty. It should be noted that there are no data sources making it possible to measure these indicators for Russia, since the Russian Statistics Agency assesses poverty proceeding from the official subsistence minimum. The method used by the World Bank to measure extremely low living standards is based on a poverty line corresponding to expenditures of less than 2.15 dollars a day, since cold natural and climatic conditions necessitate additional outlays on heating, winter clothing and foodstuffs11.
Table 1.11. Poverty level in countries with different levels of economic development
Country Year Share of the population below the poverty line, %
Year Share of those living on less than $1 ($2.15) a day, %
Russia 2001 27.3 2001 6.1 ($2.15) Ukraine 2002 27.2 - - Poland 1998 12.1 1993 6.8 Kyrgyzia 2002 44.4 1993 18.9 China 1998 4.6 2000 16.1
10 Dollars are recalculated into roubles at the purchasing power parity. In 2000, the purchasing power parity (rouble/US dollar) was 7. 28 roubles to the dollar, and in 2002 – 9.48 roubles to the dollar. 11 Reforms to the Benefit of Each and Everyone: Poverty and Inequality in the Countries of Europe and Central Asia. World Bank, Washington, 2001, p. 31.

21
Brazil 1998 22.0 1998 9.9 Nigeria 1992 34.1 1997 70.2 USA 2001 11.7 - - India 2000 28.6 2000 34.7 Source: The Social Position and Standard of Living of the Population in Russia. 2003: Statistical Collection/Goskomstat of Russia, М., 2003, p. 441.
According to the World Bank methodology (Table 1.11), in 2000, 6.1% of the population of Russia were in abject poverty (below the poverty line of 2.15 dollars a day). The NOBUS data at our disposal for the 2nd quarter of 2003 allow expert assessments to be made of the Russian level of poverty applying poverty lines of 1 and 2.5 dollars a day. The results obtained show that, in 2003, 1% of the population of Russia was in abject poverty according to the standards of the Millennium Declaration (a poverty line of 1 dollar a day) and 5% fell into this category using the World Bank methodology (2.15 dollars a day). It is notable from Table 1.11 that, if the official Russian poverty line is applied (the cost of the minimum basket of consumer goods), the number of poor people is much higher than the estimates given above. Consequently, in comparison with world standards for determining absolute poverty, the national Russian poverty line presupposes a higher level of minimum consumption. The indicator of the consumption share of the poorest quintile in the total volume of consumption for countries with a low level of economic development is also oriented on measuring extreme poverty, however, under Russian conditions it approximates to the estimate of the dynamics of official poverty, since, in 2003, 20.6% of the population were recognised as poor with respect to the national poverty line. Overall, it makes it possible to measure the dynamics of both poverty and inequality: the lower the share of resources among the 20% of the poorest people, the greater the poverty and inequality.

22
6.1 5.8 6 6 5.8 5.6 5.6 5.6
9.5 9.81010.1
7.8
6.1
1970 1975 1980 1985 1990 1995 1996 1997 1998 1999 2000 2001 2002 2003
Figure 1.3 – Dynamics of the share of the money incomes of the most poor 20% in total incomes, 1970 – 2003, %
Source: Russian Statistical Yearbook. 2004: Statistical Collection/Rosstat, М., 2004, pp. 725-193.
The data presented in figure 1.3 testify that, at the time when the country was descending into economic crisis and market transformations were taking place, in the early 1990s, a substantial redistribution of resources was observed in Russia in favour of the middle and prosperous population strata. Until 2000, when we consider that the economic growth phase set in, this indicator fluctuated between 5.8 and 6.1%, but subsequently stabilised at a level of 5.6%. This is indicative that the poor did not receive priority access to the results of the economic growth, so this evidently conceals a certain potential for reducing poverty. The characteristics of food energy values and the extent to which younger children are under weight are the indicators used most frequently to identify malnutrition or hunger. At the same time, most researchers see low weight as the most precise sign of hunger, since individual calorie requirements may differ considerably, depending on the specifics of the metabolism and physical load. Data on the level of calorie consumption are published regularly. Their comparison with the standards set by the minimum basket of consumer goods helps to estimate the share of the population consuming fewer than the minimum number of calories.
Table 1.12. Food energy value of the diet by 10-% income groups of the population in 2003, average per household member
Decile group Energy value Protein content Fat content Carbohydrate content
ccal % of norm grams % of norm grams % of norm grams % of norm1 1527 68 39 53 48 84 233 66 2 1870 84 49 67 62 114 277 78 3 2114 95 56 76 72 127 309 88

23
4 2298 102 61 83 81 143 330 93 5 2483 111 66 90 88 155 354 100 6 2606 117 70 95 93 164 369 104 7 2730 122 74 100 100 176 382 108 8 2819 126 77 105 103 181 393 111 9 2967 133 82 111 110 193 410 116 10 3286 147 91 123 122 214 454 129 Household average 2488 111 67 91 89 157 353 100
Consumption norm in the subsistence minimum (per capita average) 2236.7 100 73.6 100 56.8 100 353.3 100
Source: The Social Status and Standard of Living of the Population. 2003: Statistical Collection/Goskomstat of Russia, М., 2004, p. 277.
Corresponding calculations for 2003 are given in Table 1.12. If all cases of daily calorie consumption below the standards envisaged by the Russian subsistence minimum are taken as indicators of extreme poverty, then the scale of the given phenomenon in Russia would run close to 40%, while the protein malnutrition problem would affect 60% of the population. In order to agree with this result, confidence in the reliability of the initial data would be needed, as well as of the methodology used for assessing the number of calories consumed. Official statistical assessments of the energy values of the foodstuffs consumed are based on establishing which foodstuffs were purchased and then recalculating them in terms of actual consumption. This method has major limitations, engendering underestimation of real consumption (food consumed outside the home, incorrect recalculation of foodstuffs into calorie content, and so on). It is difficult to estimate quantitatively the level of errors incurred in the course of such recalculations. The only thing to do seems to be to compare the results obtained with data produced by other studies by the Institute of Nutrition of the RAMS12, which testify that the method used in Russia for estimating the energy value of the diet tends to underestimate calories by about 20%. Consequently, the average calorie consumption level in 2003 corresponded to 2684 calories and it should be noted at this point that Russia does not belong to a category of countries where foodstuffs are in short supply13. Comparison of the characteristics of the energy value of the actual diet, adjusted for a share of consumption not taken into account, with the standards envisaged by the minimum basket of consumer goods testifies to incidence of this form of poverty among 10-15% of the population of Russia. At the same time, it should be stressed that the standard calorie consumption envisaged by the Russian minimum basket of consumer goods is considerably higher than the number of calories required for the basal metabolism, which is judged to be about 1500 calories14. With respect to hunger and signs of calorie deficiency, the focus is on the given daily standard for energy 12 A.K. Baturin,V.A. Tutelian, L.N. Ovcharova et al. Diet and health in poor families. Ministry for Labour and Social Development, etc. – M.: Prosveshcheniye, 2002. – p. 304. 13 The Food and Agricultural Organisation (FAO) uses the indicator of the food energy value for dividing countries into categories with sufficient or insufficient access to foodstuffs for the population, the criterion being 2,400 kcal a day per person. 14 A.K. Baturin, M. Lokshin. A study of dietary components in the analysis of poverty and justification of poverty limits. Moscow, 2003, World Bank Report, p. 10.

24
consumption. The data we have allow us to suppose that this form of extreme poverty affects 1-3% of the population of Russia, but let us stress again that the official statistics do not trace such forms of poverty. Overall, analysis of the diet structure of Russian families prompts the conclusion that it does not correspond to today’s principles of a healthy diet, this structure being characterised by a low level of consumption of fruit and vegetables, milk and dairy products and giving preference to animal fats, which creates the conditions for the development of heart and circulatory diseases, obesity, diabetes and other metabolic disorders. The incidence of low weight among children under the age of 5 may be disclosed only as a result of anthropometric studies, characterising the nutritional status of the population of Russia. Calculation of children’s z-scores of height and body mass help disclose stunting or reduced body mass, which testify (at values of less than 2) to chronic or acute malnutrition, respectively. In this case, the only source of information is specially organised research by the Institute of Nutrition15, showing that there do exist signs of acute and chronic malnutrition in Russia and that they are concentrated in families with low incomes. Stunting and low weight, testifying to a chronic shortage of food, are encountered most frequently among younger children (with respect to underweight) and among children between the ages of 7 to 10 years (more often stunting). Even though Russia differs little from other developed countries in terms of the incidence of shortages of food among children, and the situation is much better according to this indicator than in the developing countries16, the very fact of the existence of such forms of extreme poverty provides sufficient grounds for monitoring this process and elaborating measures designed to eliminate food shortages among children. Thus, to conclude the review of the dynamics of the standard of living and poverty indicators in Russia, let us note the following: 1. Over the last 12 years of market reforms, a return to the pre-reform standard of living indicators has not yet been attained, although the last four years have seen a substantial growth of the population’s real incomes. 2. The reforms implemented have been accompanied by a significant growth in inequality in income distribution, so the rise in the incomes of the prosperous population strata has, to a considerable extent, been at the expense of a redistribution of resources from the poor to the rich. 3. The fall in real incomes and rise in inequality has prompted a growth in the numbers of the poor population. 4. In spite of the fact that over 50% of Russian households are covered by various social assistance programmes, the majority of social programmes are not targeted on supporting the poor population strata.
15 A.K. Baturin,V.A. Tutelian, L.N. Ovcharova et al. Diet and health in poor families. Ministry for Labour and Social Development, etc. – M.: Prosveshcheniye, 2002. – p. 304. 16 The World Bank Group. Health, Nutrition & Population. Washington, D.C., 1997, p. 97.

25
5. The scale of extreme poverty, measured in accordance with criteria determined for the purposes of the Millennium Development Goals, is estimated at 1-5% of the total population. The numbers in this group may be swollen by deviant strata.

13/F:\PROGRAMMES Folders\Poverty report and meeting\Edited versions_for printing\ENG child poverty.doc 26
2. Poverty profile: children have the highest risk of poverty in Russia
2.1. The main characteristics of the poverty level and profile It was already noted in Chapter 1 of the report that, according to official publications, in 2003 20.4% of the population were classed as poor. We have also already looked in detail at one of the main problems involved in analysing Russian poverty, namely that the two official data sources (research into household budgets and the model series of income distribution) give different estimates of the scale of poverty: according to the study of households (NOBUS and HBS), the scale of poverty is considerably higher (Table 1.10). Since, in order to calculate the indicators of the poverty profile, direct access is needed to initial data, the analysis provided in this chapter will rely on the NOBUS data, as HBS initial data are not accessible to the investigator. According to the data in Table 1.10, 26% of households, in which 32.3% of the population live, are classed as poor. Which population groups are at increased risk of poverty and which constitute the majority of the poor population? To answer this question, we need to consider directly the indicators of the level, depth and risk of poverty for individual sociodemographic groups of families. These indicators will be considered in order to make two assessments of the welfare level: money incomes, counting only money received, and disposable resources, which include, apart from money incomes, all types of non-monetary receipts (foodstuffs from household subsidiary plots, subsidies and benefits received in kind, etc.). In its most general form, the existing poverty profile in Russia allows three categories of household to be identified (Table 2.1 – 2.2). 1. The biggest group in the poor population consists of families with children. In spite of the fact that families with children constitute 37% of the total number of households, they account for 50-60% of the total number of poor families, depending on the welfare indicator used. They also account for 75-80% of the income shortfall, which testifies to deep poverty of this type of family. More than half such families are distinguished by a favourable demographic structure (married couples with 2 or more children and other relatives), so their poverty is not linked to a high level of child dependence. If we orient ourselves on money incomes alone, then about 80% of all families with children fall into the poor category. If total disposable resources are taken into account, the indicator drops to 52%, but in this case, too, we observe an extremely high risk of poverty.

27
Table 2.1. Risk and depth of poverty by sociodemographic group Poor households
Money incomes Disposable resources Risk of
falling into the poor group
Income shortfall
Risk of falling into
the poor group
Income shortfall
All families,
%
(% of group size)
(% of subsistence minimum)
(% of group size)
(% of subsistence minimum)
Families with children: 100.0 77.7 37.0 52.3 18.7 Married couple with 1 child 100.0 56.9 22.6 30.3 8.2 Married couple with 1 child and other relatives 100.0 66.8 25.3 39.0 10.8
Married couple with 2 children 100.0 79.1 35.8 49.1 16.2 Married couple with 2 children and other relatives 100.0 81.3 36.5 56.6 18.5
Married couple with 3 or more children 100.0 89.7 54.2 71.6 32.3
Married couple with 3 or more children and other relatives 100.0 94.5 50.3 72.1 29.0
Mothers (fathers) with children 100.0 78.8 38.6 48.9 17.6 Mothers (fathers) with children and other relatives 100.0 74.7 32.7 50.5 16.9
Families without children: 100.0 36.2 10.4 15.2 3.7 Households of pensioners 100.0 31.2 6.1 8.1 1.4 Households of able-bodied people 100.0 41.1 14.7 22.3 6.0 Average for all families 100.0 49.0 22.5 26.0 10.0 Source: calculated from NOBUS data for the 2nd quarter of 2003.
2. Families of pensioners account for between 9% (disposable resources) and 18% (incomes) of the total number of the poor and from 1.7% (disposable resources) to 3.3% (incomes) of the resource shortfall. This result indicates that families of pensioners not only do not constitute the majority of poor ones, but that they are not distinguished by deep poverty either. The risk and depth of poverty for this population group falls sharply when disposable resources are taken into consideration, this being a consequence of the fact that older people enjoy priority access to non-monetary social transfers. 3. Families of able-bodied people without children have less risk of poverty than families with children, but fall into the poor category more often than pensioners. These proportions are characteristic of the indicators of both income and resource shortfall. The ratio of individual demographic groups of households in terms of standard of living and poverty, as established by the NOBUS research data for the 2nd quarter of 2003, have been relatively stable for the last 10 years. It may thus be concluded that there is a predominantly “child” aspect to poverty in Russia today, with respect to both the depth of the poverty suffered by traditional risk groups and to inclusion among poor families of those that are quite favourable in demographic terms. Objective reality is such that the birth of a second child in a family means, under current economic conditions, orientation on consumption patterns of the poor.

28
Table 2.2. Sociodemographic structure of poor households
Demographic structure of poor households
Money income Disposable resources
Demographic structure of households surveyed, %
Share among total poor, %
Share of total
income shortfall,
%
Share among total poor, %
Share of total
shortfall of disposable resources,
% Families with children: 36.6 52.8 74.6 61.3 78.0 Married couple with 1 child 10.1 11.7 12.8 11.8 10.5 Married couple with 1 child and other relatives 6.6 9.0 12.8 9.9 12.4
Married couple with 2 children 6.4 10.3 16.2 12.1 16.6 Married couple with 2 children and other relatives 1.5 2.5 5.1 3.3 5.8
Married couple with 3 or more children 1.1 2.1 5.7 3.2 7.7
Married couple with 3 or more children and other relatives 0.3 0.6 1.8 0.8 2.3
Mothers (fathers) with children 4.9 7.8 7.8 9.2 8.1 Mothers (fathers) with children and other relatives 5.7 8.7 12.5 11.0 14.5
Families without children: 63.4 47.2 25.4 38.7 22.0 Households of pensioners 28.7 18.5 3.3 9.0 1.7 Households of able-bodied people 34.7 28.8 22.1 29.8 20.4 All families 100.0 100.0 100.0 100.0 100.0 Source: calculated from NOBUS data for the 2nd quarter of 2003.
2.2. Poverty profile of families with children Let us analyse in more detail the poverty profile of families with children (Table 2.1-2.2). Households with children are not a homogeneous group and, in terms of their poverty characteristics and reasons for poverty, can be divided into the category of traditionally poor families (large and single parent families) and “new” poor families, arising as a consequence of the specifics of the transitional economy (families with 1 – 2 children). Married couples with 1 child, living separately or together with adult relatives. These are families with a favourable demographic composition, where there are at least 2 able-bodied adults per child. This is the most numerous group of families with children: in the overall structure of households, they account for about 17%, and among families with children – for over 45%. Since, theoretically, owing to the low child component, married couples with 1 child should not end up in poverty, the main reasons for poverty among families of this type should be sought in the characteristics of the employment of the adult family members (low wages of those who work and unemployment of the able-bodied).

29
Families with a favourable demographic composition constitute about 21% of households with resources below the subsistence minimum and account for 23% of the total of deficient disposable resources of the poor. They are distinguished by a relatively high average poverty risk and income shortfall: for couples with 1 child, these values are, respectively, 30% and 8%. In the presence of other relatives in a family with 1 child (for example, children over the age of 18 years or grandparents), the risk of poverty rises to 39%, while the relative income shortfall to almost 11%. Our calculations also showed that, among married couples with 1 child, young families are distinguished by a higher poverty risk, the birth of the first child reducing their material welfare: the share of poor families rises by 40% in money income terms and by 50% in disposable resource terms (figure 2.1).
49.0 52.0
72.1
26.0 29.6
45.2
0.0
10.0 20.0
30.0 40.0
50.0 60.0 70.0
80.0
All families Families less than 5 years old,
without children
Families less than 5 years old, with a child
under the age of 3
Poor in terms of money incomes
Poor in terms of disposable resources
Figure 2.1 – Risk of young families falling into poverty, % Source: calculated from NOBUS data for the 2nd quarter of 2003.
The problems of the higher risk of poverty among young families following the birth of a child are primarily associated with the dual burden on the working father: the birth of the child and the mother’s withdrawal from active professional work, at least for the 18 months of official maternity leave. The size of the allowance for childcare, which also depends on the minimum wage, cannot compensate for the absence of the mother’s wage in the family budget. At the same time, according to our estimates, this natural process of impoverishment of families on the birth of a child is less acute in Russia today than, for example, in the late 1980s, when the analogous drop was by 60%. This testifies that, when planning to have a baby, young families are increasingly relying on their own material possibilities. During the official period of postnatal childcare leave, women try to find work that would be compatible with the need to care for a small child – work at home or for only a few hours a day. In addition, compared to

30
the end of the 1980s, young men are more often taking advantage of the opportunity to earn extra and seek more highly-paid jobs. Married couples with 2 children, living separately or together with other relatives. This category of families has an average of 1 child per able-bodied adult, so the main reasons for poverty in such families are connected with the labour market (low wages of those in work and unemployment of the able-bodied). The share of households with 2 children among all families with children is 22%. Moreover, while they constitute only 8% in the overall structure of households, among the poor, with respect to disposable resources, the figure is twice as high (15.4%), and in the distribution of the total disposable resource shortfall their share trebles (to 22.4%). The existence of other relatives in a family with 2 children increases the poverty risk from 49 to 57% and the average income shortfall level from 16 to 18%. Married couples with 3 or more children, living separately or with other relatives. Large families are a traditionally vulnerable category of the group of families with an high dependency load, where there is only 1 able-bodied adult per child or several children. Here the simultaneous impact is observed of several poverty factors. Large families become poor not only as a result of the large number of dependents in them, but also because of their vulnerable position on the labour market. A large number of children in the family often means limited possibilities for employment of the mother, which, in turn, exacerbates the material position of such a family. Special studies testify that, in 40% of such families, the mothers do not work or have jobs that do not require qualifications and are consequently low-paid. This is not a numerous group: the share of large families among all families with children constitutes 4% and only 1.5% of the total structure of households. For this reason, they account for only 4% and 10%, respectively, in the poverty profile and disposable resource shortfall. In terms of the average risk of falling into poverty, however, this is the most vulnerable group among families with children, since 72% of large families have disposable resources below the subsistence minimum and, in terms of money incomes, there is a 90-95% probability of them being impoverished. The depth of the poverty suffered by families with 3 or more children is also maximal. Their average income shortfall is 29-32%, which is 1.7 times higher than the same indicator for all households with children. Single-parent families with children, living separately or with other relatives. These families are also among those with an high dependency load, since the second parent is missing and, consequently, there may be 1 or more children for every able-bodied adult. Like large families, they therefore suffer the simultaneous impact of two poverty factors – a heavy burden of dependents and a vulnerable position on the labour market. Single-parent families are a relatively small group among all families with children (29%) and in the overall structure of Russian households (10.5%). Their share in the poverty profile in terms of disposable resources is equal to 20% and in terms of the shortfall of disposable resources, the figure is virtually the same (22.6%). The average

31
disposable resource poverty risk for single-parent families is 49-50%. Thus, the probability of them finding themselves in poverty is less than that for large families and even for families with 2 children. In terms of the depth of poverty, single-parent families are comparable with the latter (the average disposable resource shortfall is about 16-17% of the subsistence minimum). 2.3. The poverty profile according to absolute and relative criteria
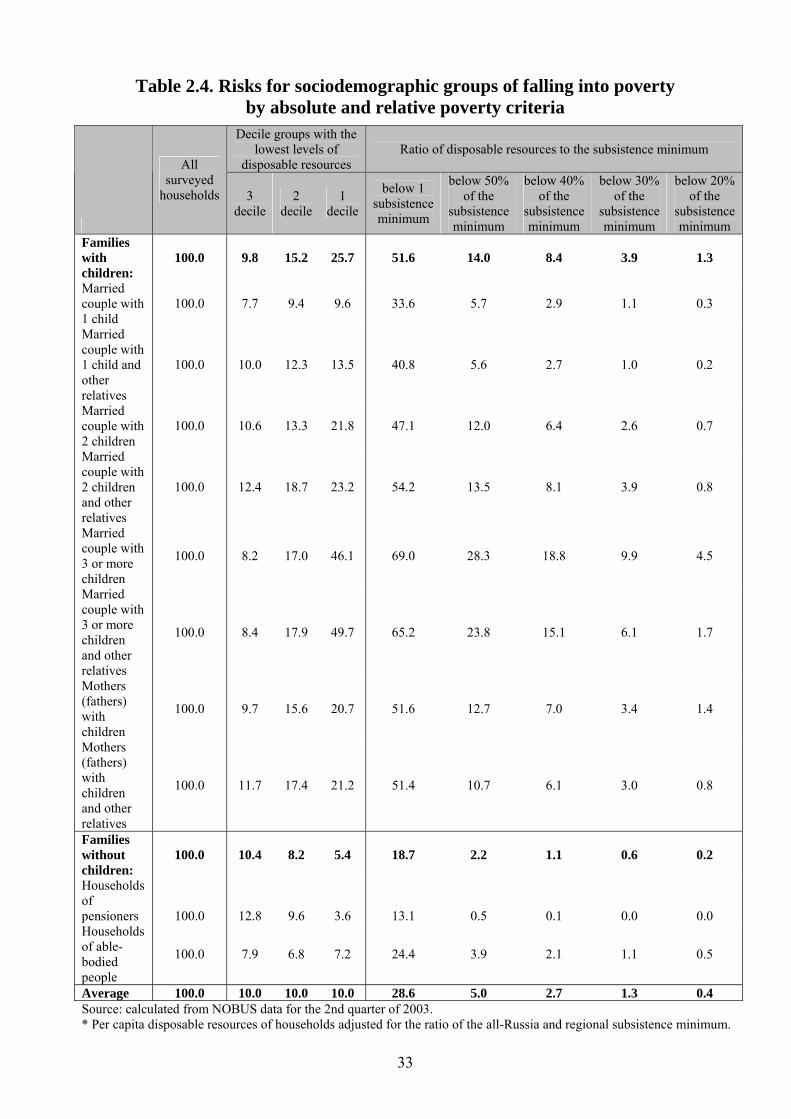
Tables 2.3 and 2.4 present the poverty profile simultaneously for the absolute and relative measurements of poverty. As the criteria for relative poverty, we used inclusion in the third, second and first decile groups with the lowest level of disposable resources; as those for absolute poverty – inclusion in the group with per capita disposable resources below the subsistence minimum, below half the subsistence minimum, below 40% of the subsistence minimum, below 30% of the subsistence minimum and below 20% of the subsistence minimum. Let us note that the poverty line at the level of 20% and 30% of the subsistence minimum is the line of extreme poverty. Analysis of poverty at the multiple poverty lines indicates that families with children are concentrated among the extremely poor. Concerning families with resources amounting to 20-30% of the subsistence minimum, which include 3-5% of the total population, these families lack the resources for even the most primitive diet and this is where malnutrition is encountered. 60-70% of such families include children. In absolute terms, the biggest group among the extremely poor consists mainly of big rural families.
Table 2.3. Sociodemographic structure of the poor by absolute and relative poverty criteria
Decile groups with the lowest levels of
disposable resources Ratio of disposable resources to the subsistence minimum
All surveyed
households 3 decile
2 decile
1 decile
below 1 subsistence minimum
below 50% of the
subsistence minimum
below 40% of the
subsistence minimum
below 30% of the
subsistence minimum
below 20% of the
subsistence minimum
Families with children:
36.6 35.6 48.9 64.9 57.2 70.5 71.3 69.6 62.7
Married couple with 1 child
10.1 7.8 9.5 9.7 11.9 11.4 10.7 8.8 6.3
Married couple with 1 child and other relatives
6.6 6.6 8.1 8.9 9.4 7.4 6.5 5.3 3.7
Married couple with 2 children
6.4 6.8 8.5 14.0 10.6 15.4 15.0 13.3 10.0
Married couple with 2 children and other
1.5 1.9 2.8 3.5 2.9 4.1 4.5 4.7 2.8

32
relatives Married couple with 3 or more children
1.1 0.9 2.0 5.3 2.8 6.5 7.9 9.0 12.1
Married couple with 3 or more children and other relatives
0.3 0.3 0.5 1.5 0.7 1.4 1.7 1.5 1.2
Mothers (fathers) with children
4.9 4.7 7.6 10.1 8.8 12.4 12.5 13.3 15.4
Mothers (fathers) with children and other relatives
5.7 6.6 9.8 12.0 10.2 12.0 12.6 13.6 11.2
Families without children:
63.4 64.4 51.1 35.1 42.8 29.5 28.7 30.4 37.3
Households of pensioners 28.7 36.9 27.5 10.2 13.1 2.8 1.5 0.6 0.0 Households of able-bodied people
34.7 27.5 23.6 24.8 29.6 26.7 27.1 29.8 37.3
Total 100.0 100.0 100.0 100.0 100.0 100.0 100.0 100.0 100.0 Source: calculated from NOBUS data for the 2nd quarter of 2003. * Per capita disposable resources of households adjusted for the ratio of the all-Russia and regional subsistence minimum.
The most fortunate group among families with children consists of married couples with 1 child: few of them fall into the first three decile groups. As the availability of resources compared with the subsistence minimum decreases, their share drops by half for nuclear families and two-thirds for complex families. A rise in the proportion of children in a household increases their level of representation both among the poor and among the extremely poor. The share of families with 2 children in the 1st decile group is 2.2 times greater than their number in the sample. A marked rise in the proportion of these families occurs in the groups with resources below 50 – 30% of the subsistence minimum.
33
Table 2.4. Risks for sociodemographic groups of falling into poverty by absolute and relative poverty criteria
Decile groups with the lowest levels of
disposable resources Ratio of disposable resources to the subsistence minimum
All surveyed
households 3 decile
2 decile
1 decile
below 1 subsistence minimum
below 50% of the
subsistence minimum
below 40% of the
subsistence minimum
below 30% of the
subsistence minimum
below 20% of the
subsistence minimum
Families with children:
100.0 9.8 15.2 25.7 51.6 14.0 8.4 3.9 1.3
Married couple with 1 child
100.0 7.7 9.4 9.6 33.6 5.7 2.9 1.1 0.3
Married couple with 1 child and other relatives
100.0 10.0 12.3 13.5 40.8 5.6 2.7 1.0 0.2
Married couple with 2 children
100.0 10.6 13.3 21.8 47.1 12.0 6.4 2.6 0.7
Married couple with 2 children and other relatives
100.0 12.4 18.7 23.2 54.2 13.5 8.1 3.9 0.8
Married couple with 3 or more children
100.0 8.2 17.0 46.1 69.0 28.3 18.8 9.9 4.5
Married couple with 3 or more children and other relatives
100.0 8.4 17.9 49.7 65.2 23.8 15.1 6.1 1.7
Mothers (fathers) with children
100.0 9.7 15.6 20.7 51.6 12.7 7.0 3.4 1.4
Mothers (fathers) with children and other relatives
100.0 11.7 17.4 21.2 51.4 10.7 6.1 3.0 0.8
Families without children:
100.0 10.4 8.2 5.4 18.7 2.2 1.1 0.6 0.2
Households of pensioners 100.0 12.8 9.6 3.6 13.1 0.5 0.1 0.0 0.0 Households of able-bodied people
100.0 7.9 6.8 7.2 24.4 3.9 2.1 1.1 0.5
Average 100.0 10.0 10.0 10.0 28.6 5.0 2.7 1.3 0.4 Source: calculated from NOBUS data for the 2nd quarter of 2003. * Per capita disposable resources of households adjusted for the ratio of the all-Russia and regional subsistence minimum.

34
The most unfortunate categories are families with 3 or more children and single-parent families with children. Large families account for an insignificant proportion in the overall structure, but their share in the 1st decile group goes up almost 5-fold and that in the group with resources below the subsistence minimum – 3-fold. The share of single-parent families in the 1st decile group and the group with resources below the subsistence minimum is virtually double that in the sample. In total, these two groups account for 40% of all the poor in the group with resources below 20% of the subsistence minimum. The representation of families without children drops between the 3rd and 1st deciles. This trend can be traced particularly clearly using the example of households of pensioners. Proceeding to absolute poverty lines, there is a significant drop in the proportion of families of pensioners in the group with resources below 50% of the subsistence minimum. Pensioners’ households are virtually absent from groups with even lower levels of resources, but a transition to less harsh absolute poverty lines sees an increase in the number of single people of working age in the structure of poor households. The share of this group among the extremely poor (with resources below 20% of the subsistence minimum) is four times greater than among households with resources below the subsistence minimum. This last group consists mainly of marginals –men living in rural areas, among whom 50% are out of work and over 50% consume alcohol several times a week or more often. 2.4. Poverty among families with a favourable demographic situation The extremely unfavourable standard of living dynamics over the last 10 years have had a detrimental effect not only on groups with a traditionally higher poverty risk, but also on families with a favourable demographic composition – complete families with 1-2 children. This category of households accounts for a large share in the structure of poor families, although, as we have already noted, in terms of poverty level and, especially, depth of poverty, they are in a better position than single-parent or large families. What is behind the poverty experienced by this category of household? The results of our analysis show that their poverty is caused by two main factors: а) a high proportion of people earning less than the subsistence minimum; b) unemployment among able-bodied household members. Let us look at this issue in more detail. In the first stage of our analysis, we try to assess the scope of the given phenomena (Table 2.5) among all households, irrespective of their material position. The indubitable leader here is low wages. The existence in the family of able-bodied people who neither work nor study but are seeking work is a quite widespread phenomenon. It should be noted, however, that the number of households including non-working members who are not seeking work is substantially higher. Consequently, lack of a job for an able-bodied person is not only a result of deformations on the labour market, but also of the population’s economic behaviour strategies. The majority of unemployed adults have no intention of working,

35
so the creation of new jobs would not solve the problem of these people’s incomes, since they have lost their connection with the labour market.
Table 2.5. Incidence of factors accompanying poverty on the labour market Share of households of a
given type, % Households with members of working age who are not working, studying or on holiday and are seeking work 3.7
Households with members of working age who are not working, studying or on holiday and are not seeking work 13.7
Households with working members receiving wages below the subsistence minimum (if the worker has a 0 salary, he is included in this group) 28.9
Source: calculated from NOBUS data for the 2nd quarter of 2003.
At the same time, non-working adults may concentrate among highly prosperous households, when one member of the family being without a job might be the result of a rational role division within the family. In order to understand how poverty results from lack of employment and low wages, let us break down these data into decile groups in terms of disposable resources (figure 2.2).
12.7
51.4 43.9
34.7 29.5 28.6
26.6 26.0
19.9
12.6
1.01.5 1.72.72.72.83.0 5.0 5.6 7.57.7 9.8 9.49.911.513.3
16.5 22.7
35.1
23.8
0.0
10.0
20.0
30.0
40.0
50.0
60.0
1 2 3 4 5 6 7 8 9 10
Decile groups of households by disposable resources
Households with family members of working age who are not working, studying or on holiday and are seeking work Households with family members of working age who are not working, studying or on holiday and are not seeking work Households with family members receiving salaries below the survival minimum (if the wage is 0, the worker is included in this group)
Figure 2.2 Incidence of factors limiting opportunities to work and earn by decile group, % of the size of the decile group
Source: calculated from NOBUS data for the 2nd quarter of 2003.
The results of the calculations show that the first decile group has the most restricted access to the labour market. The ranging of factors by significance corresponds to the

36
average distribution for Russia, but the scope of all the problems covered is much broader: half the households in the given decile group include workers with wages below the subsistence minimum; one in three households includes able-bodied people who are neither working nor seeking work and 12.7% are households in which those without work are looking for a job. In the context of socio-economic policy measures, this conclusion indicates that measures geared to reducing poverty must be linked to a rise in the minimum wage, otherwise the overall concept of the strategy for promoting a reduction in poverty will be illogical and ineffective. It should also be noted that households in which there is at least one working person with a wage below the subsistence minimum are quite widespread in all decile groups: up to the 9th decile group inclusively, they account for no less than 20%. The share of those who are neither working nor job-hunting falls as the level of prosperity rises, but the highest levels are characteristic of the first three decile groups, so poverty is, in many cases, a consequence of able-bodied household members leaving the labour market. On the household level, poverty problems are exacerbated if several poverty factors are concentrated in a single family (figure 2.3). Analysis on this plane demonstrates that poor households are also distinguished by a higher concentration of factors producing poverty with respect to the labour market. In the first decile group, only 23.4% of the families have a low level of resource provision not resulting from interrelations with the labour market. This group is represented by large and single-parent families. In the majority of families, from the economic point of view the low income levels are a consequence of just one factor, i.e., low wages. At the same time, in virtually 20% of the families, a low income of one worker and lack of job for another predetermine poverty of the nuclear family even if there is only one child. In cases when one of the parents earns a low wage and the other is without work and is not job-hunting, this model of economic behaviour is, in principle, a chronic poverty lifestyle. It is worth noting that this type of behaviour is demonstrated by one in five families in the first decile group. The second decile group, in terms of the nature of the household’s links with the labour market, is largely similar to the first, although all the negative processes are manifested somewhat less acutely here. In all subsequent decile groups, over half the households are without a worker earning less than the subsistence minimum, while all able-bodied members are either working or studying.

37
79.6
72.7 67.264.864.261.6
59.4 51.4
39.1
23.4 19.625.4
30.5 32.332.534.035.541.5
50.4 55.5
2.2
19.8 9.8 6.5 5.0 4.2 3.2 2.8 1.8 0.7
0.0 10.0 20.0 30.0 40.0 50.0 60.0 70.0 80.0 90.0
1 2 3 4 5 6 7 8 9 10
Decile groups of households by disposable resources
Households demonstrating none of the poverty factorsHouseholds demonstrating at least poverty factorHouseholds demonstrating 2 factorsHouseholds demonstrating all the 3 factors
Figure 2.3. Concentration of poverty factors connected with the labour market, by decile group, % of numbers of the poor
Source: calculated from NOBUS data for the 2nd quarter of 2003.
Now let us concentrate on the labour strategies of married couples with children (Table 2.6), starting with married couples with just one child. This sociodemographic type of family is not distinguished by a heavy burden of children, so poverty is connected only with the parents’ position on the labour market. The data in Table 2.6 prompt the conclusion that, among such families belonging to the first decile income groups (the poorest families), about half are distinguished by full employment of the adult members. In the 3rd to 5th decile groups, the overwhelming majority of such families participate on the labour market to the maximum extent (the poverty line runs at the 5th decile group). Consequently, in 2003, the main reason for poverty consisted of low wages. Concerning an additional burden of dependents, consisting of adult non-working household members, unemployment, along with low wages, constitutes the main social factor behind poverty. In the first decile in terms of income distribution, almost half the households come up against employment problems for the majority of their adult members and only 46% of the households in the first decile group have no adult dependents. Non-working adults are represented quite broadly in the 2nd and 3rd decile income groups. For comparison: in the tenth decile group there are virtually no non-working members (there are only 6.5% of such families).

38
Table 2.6. Characteristics of employment of able-bodied adults belonging to married couples with children, % of the income group
Married couples with 1 child Married couples with 2 or more children Decile income group Both parents
work 1 or 2 parents do not
work Both parents
work 1 or 2 parents do not
work 1 46.1 53.9 41.0 59.0 2 52.6 47.4 63.0 37.0 3 68.5 31.5 66.5 33.5 4 79.7 20.3 74.4 25.6 5 73.3 26.7 72.4 27.6 6 74.9 25.1 70.0 30.0 7 85.6 14.4 70.2 29.8 8 84.0 16.0 76.4 23.6 9 86.6 13.4 76.0 24.0
10 85.3 14.7 83.0 17.0 Source: calculated from NOBUS data for the 2nd quarter of 2003.
Thus, analysis of the profile of and reasons for poverty shows that families with children are the most widely represented group both among all the poor and the extremely poor. Employment policy and wages are the main regulators of Russian poverty and this is where the reasons should be sought for poverty among children, with low wages being the most significant poverty factor. The system of monthly allowances for children in poor families is not able to impact the level of child poverty at all substantially, since the allowances do not exceed 3% of the child’s subsistence minimum. The significance of the given targeted social programme will, in the near future, fall, since the legislative and financial powers with respect to child allowances for poor families have been transferred to the regional level. As a result, depressed territories will lack the resources to finance them.

39
3. Non-monetary forms of poverty in Russia as a whole and among families with children
3.1. Non-monetary tangible assets: large families have poor housing conditions and single-parent families have no property Alongside income indicators, the most important indicators of restricted and unequal access to vitally important resources are the level of provision of households with such tangible assets as housing and property, reflecting a long-term connection between family incomes and real consumption opportunities. A description of the system of indicators we use for assessing intangible assets is given in Appendix 2. A household is deemed poor from the housing point of view if it lives in cramped conditions or has no sewage system, heating system or running water. From the property angle, families lacking the consumer durables included in the minimum list of those necessary in accordance with the subsistence minimum are considered poor. These goods include: a television, refrigerator and washing machine.
59.6
40.545.5
28.3 28.8 28.7
12.1
30.725.8
0
10
20
30
40
50
60
70
poor households prosperous households all households
Poor in terms of housing provisionAverage level of housing provisionHousing conditions above average
Figure 3.1. Characteristics of housing provision of poor and prosperous
households, % Source: calculated on the basis of NOBUS data for the 2nd quarter of 2003.
An above-average standard of housing is considered to mean conditions under which a family lives in comfortable housing with more living space than the social norm. With

40
respect to property, such families are those that possess the main consumer durables from the minimum list, as well as either a dishwasher or a computer or a car. This group also includes those that have liquid assets in the form of a second residence or plot of land. The results of comparing the characteristics of income provision with the parameters of provision with housing and property are presented in figures 3.1 and 3.2 and in Tables 2.1-2.2 of Appendix 2. If we consider households included in the poor group on the basis of the income criterion, it becomes clear that, on the one hand, not all families with low incomes have below standard housing (the two coincide in only 60% of cases), and on the other hand, families that are not poor are quite broadly represented among those with below-standard housing (40.5%). It should be noted that 12% of the total numbers of poor families (3.3% of the overall number of Russian families) have high quality housing. A similar situation is also characteristic of provision with property. About 40% of poor families possess types of property included in Russia among signs of a high standard of living. At the same time, 20% of prosperous families are without consumer durables included on the minimum required list (television, refrigerator, washing machine).
30.6
19.522.4
30.4 30.7 30.6
39.0
49.847.0
0.0
10.0
20.0
30.0
40.0
50.0
60.0
poor households prosperous households all households
Poor in terms of property provisionAverage level of property provisionAbove average property provision
Figure 3.2. Characteristics of property provision of poor
and prosperous households, % Source: calculated according to NOBUS data for the 2nd quarter of 2003.
The results obtained confirm our assumption concerning the need to look at poverty from the angle of a broader range of welfare indicators. It is important to note that such an integrated approach to measuring forms of poverty does not automatically lead to an expansion of the scale of poverty.

41
If we consider the share of households with a low level of housing provision, among all families with children it will be somewhat above the sample average, but the difference is not sufficient for us to assert that this group of families has the worst housing conditions (Table 3.1). Large families stand out against the general background, over 70% of them having poor housing standards. Comfortable, sufficiently spacious housing is enjoyed by families with 2 children only half as often as the average for all households (9.8% and 25.8%, respectively). Large families have high standard housing particularly rarely: married couples with 3 or more children, living separately or with other relatives (1.2 – 1.5%), married couples with 2 children, living together with other relatives (3.2%). Single-parent families and married couples with 1 child more often have comfortable housing of an area no less than the social norm (28.5 and 19%, respectively). The situation with respect to provision with property is different. Families with children are better provided with property than the average sample household: 17.8% of families with children have a low level of property provision, against 21.6% of the population as a whole, and possess assets that are considered in Russia to be a sign of a high standard of living – 41.5% of families with children against 33% of all households (Table 3.1). In terms of property provision, the most vulnerable category among families with children consists of single-parent families: 27.6% of these do not have either a television or a refrigerator or a washing machine, that is, consumer durables from the minimum necessary list, and only 18% of them own a second residence or a car or such expensive items as a dishwasher or computer. The highest level of property provision is enjoyed by married couples with 1 child, living together with other relatives. Only 8% of these are without the most essential consumer durables and 56.3% own expensive, non-essential items. From the population distribution angle, these proportions are the same for both urban and rural families (Tables 2.2-2.3 of Appendix 2), but signs of poverty such as limited access to housing and property, with the exception of per capita living space by the square metre, are encountered far more frequently in rural areas:
• 72.6% of urban families with children and only 10.5% of rural ones live in comfortable housing.
• 83.2% of urban families with children and 71.9% or rural ones have less than the social norm for living space.
• 12.6% of urban families with children and 25.9% of rural ones have a low level of property provision.

42
Table 3.1. The level of the housing and property potential of Russian families
Housing provision criteria Property provision criteria
All families Living in
comfortable housing*
Total living
space not below the
social norm
Above average level of housing
provision**
Low level of housing provision
***
Above average level of property provision
****
Low level of
property provision
*****
Families with children: 100.0 52.6 20.8 9.8 52.7 41.5 17.8 Married couple with 1 child 100.0 63.0 36.2 19.0 42.6 47.3 11.8
Married couple with 1 child and other relatives 100.0 63.5 13.1 6.0 41.6 56.3 8.0
Married couple with 2 children 100.0 54.1 15.8 6.0 51.8 49.0 12.8
Married couple with 2 children and other relatives 100.0 50.2 9.7 3.2 54.5 52.8 14.1
Married couple with 3 or more children 100.0 29.4 10.5 1.2 75.2 41.1 25.8
Married couple with 3 or more children and other relatives
100.0 33.0 10.8 1.5 70.1 37.9 23.6
Mothers (fathers) with children 100.0 62.8 48.3 28.5 44.6 18.9 27.6
Mothers (fathers) with children and other relatives 100.0 64.7 21.7 12.7 41.7 29.0 18.4
Families without children: 100.0 58.7 63.0 33.0 45.9 26.5 25.8
Households of pensioners 100.0 51.6 71.5 32.9 52.7 16.6 30.9 Households of able-bodied people 100.0 65.9 54.6 33.2 39.1 36.4 20.7
All households 100.0 59.6 48.9 25.8 45.5 33.0 21.6 Source: calculated on the basis of NOBUS data for the 2nd quarter of 2003.
Overall, in identifying poverty on the basis of an analysis of housing and property provision, no uniquely higher inclination of families with children towards poverty is observed. In particular, pensioners’ households have less property and in rural areas they live more frequently in housing that lacks amenities. At the same time, traditionally vulnerable categories of families with children – large and single-parent families – are still at a high risk of joining the poor groups in terms of level of provision with non-monetary tangible assets.
3.2. Population health and accessibility of medical services The health of the population is one of the main indicators of quality of life. It determines the degree of development, civilisation and welfare of society. Comparisons between countries show that the principal characteristics of a nation’s state of health and, above all, life expectancy, demonstrate a connection with the size of the per capita national income. There are a multitude of direct and indirect links between health and material welfare. A high standard of living may be counted as one of the chief factors behind good health and, at the same time, only a healthy population is able to work and study intensively and achieve a high level of material welfare.

43
Official statistics for the last decade show a deterioration in the health of the Russian population. A rise in incidence for virtually all classes of disease has been observed17. Over the ten years, there was a deterioration in a number of indicators of the state of health of mother and child. Above all, the high level of maternal and infant mortality and worsened state of health among pregnant women and those giving birth should be noted (Figure 3.3).
12.8 16.6
21.7 25.5
29.2
34.435.8
37.8 38.641.3
43.9 42.7 42.8
11.1 12.6 13.8 15.1 15.7 16.8 17.8 18.520.2
21.9 21.6 20.2
14.617.5 18.6 18.6 19.4
5.5 6.1 6.7 7.5 7.7 8.7 9.4 10 9.4 10.2 9.8 10.2
8.9 5.9
8 9.4 10.8 12.3 12.9 13.8 15.4
5.1 0
5
10
15
20
25
30
35
40
45
50
1990 1991 1992 1993 1994 1995 1996 1997 1998 1999 2000 2001 2002
Anaemia Late onset toxicosis Kidney disease Circulatory diseases
Figure 3.3. Dynamics of the health of pregnant women
(% of the number of those reaching full term). Russian Federation. 1990-2002 Source: Russian Statistical Yearbook. Collection of Statistics./Rosstat, M., 1997-2003.
17 Strategy for Reducing Poverty in Russia: analysis and recommendations. Moscow. International Labour Organisation. 2002. p. 24

44
Table 3.2. Visits to the doctor and reasons for not visiting a doctor, %
Age groups: 0-5 6-14 15-17 18-23 24-30 31-40 41-50 51-54 55-60 61-70 71 and above
Poor households in terms of disposable resources Visited the doctor within the last 12 months: Yes 60.0 44.1 38.2 31.3 30.9 34.7 39.9 44.3 48.8 56.8 63.8 No 40.0 55.9 61.8 68.7 69.1 65.3 60.1 55.7 51.2 43.2 36.2 Total 100.0 100.0 100.0 100.0 100.0 100.0 100.0 100.0 100.0 100.0 100.0 If not, why not:** No health problems 89.1 85.6 84.1 82.8 78.9 74.1 63.7 58.0 43.2 34.2 19.3 No required specialist available in the vicinity 2.0 2.2 1.3 1.4 1.5 3.1 3.0 4.8 8.5 9.0 7.3 Difficult to make an appointment with the required specialist 0.7 0.4 0.5 0.8 1.6 1.9 2.4 3.7 4.1 3.0 7.6
Required services are to be paid for and cannot be afforded 0.6 3.2 2.8 3.2 5.1 4.9 10.7 10.2 12.6 15.7 14.6
Other reasons 7.7 8.7 11.3 11.8 12.8 16.0 20.1 23.3 31.6 38.1 51.2 Total 100.0 100.0 100.0 100.0 100.0 100.0 100.0 100.0 100.0 100.0 100.0
Households not poor in terms of disposable resources Visited the doctor within the last 12 months: Yes 68.1 55.0 48.4 37.2 37.0 40.0 47.3 53.1 54.3 63.5 76.2 No 31.9 45.0 51.6 62.8 63.0 60.0 52.7 46.9 45.7 36.5 23.8 Total 100.0 100.0 100.0 100.0 100.0 100.0 100.0 100.0 100.0 100.0 100.0 If not, why not:** No health problems 84.7 86.2 86.5 82.5 78.8 72.4 65.5 61.8 50.7 36.7 25.0 No required specialist available in the vicinity 1.4 1.3 1.1 1.5 1.3 1.9 2.4 2.6 3.2 5.6 10.3 Difficult to make an appointment with the required specialist 0.5 0.7 1.9 1.2 1.5 2.7 3.9 3.7 6.4 4.9 7.6
Required services are to be paid for and cannot be afforded 2.9 2.1 2.1 2.9 3.6 4.2 5.8 5.1 5.9 12.0 10.5
Other reasons 10.5 9.7 8.4 11.9 14.7 18.8 22.5 26.9 33.8 40.8 46.5 Total 100.0 100.0 100.0 100.0 100.0 100.0 100.0 100.0 100.0 100.0 100.0
Source: calculated on the basis of NOBUS data for the 2nd quarter of 2003.

45
Table 3.3. Indicators of completion of treatment prescribed for poor and non-poor respondents, %
Disposable resources Poor households Non-poor households
Age groups (years):
Yes
, com
plet
ed fu
lly
Com
plet
ed o
nly
the
part
avai
labl
e fr
ee o
f ch
arge
Com
plet
ed in
par
t bec
ause
of i
nsuf
ficie
nt
fund
s to
pay
for m
edic
ines
and
trea
tmen
t
Not
com
plet
ed a
t all,
ow
ing
to la
ck o
f fun
ds
to p
ay fo
r med
icin
es a
nd tr
eatm
ent
Not
com
plet
ed fo
r oth
er re
ason
s
0-5 100 81.6 11.8 4.4 0.5 1.7 87.8 6.8 3.5 0.3 1.6 6-14 100 81.2 9.6 8.0 0.5 0.7 83.5 8.7 6.0 0.3 1.5 15-17 100 77.2 11.6 9.2 0.3 1.7 81.2 9.4 7.0 0.4 1.9 18-23 100 73.3 13.3 9.9 0.6 2.9 78.1 9.6 8.0 0.4 3.9 24-30 100 75.4 11.9 10.3 0.8 1.5 82.1 7.3 7.1 0.3 3.2 31-40 100 69.7 16.4 12.1 0.5 1.4 76.0 10.7 9.3 0.5 3.5 41-50 100 65.9 16.9 13.5 1.1 2.6 74.9 12.3 9.5 0.6 2.7 51-54 100 62.7 19.6 12.9 0.8 4.0 74.4 12.6 10.3 0.6 2.1 55-60 100 61.3 21.7 13.7 1.1 2.2 69.1 16.9 10.9 1.0 2.1 61-70 100 58.8 26.2 12.0 1.1 1.9 64.5 19.6 13.0 1.0 2.1 71 and above 100 58.1 25.7 13.5 0.7 2.1 63.6 23.1 10.2 1.1 2.0
Source: calculated on the basis of NOBUS data for the 2nd quarter of 2003.

46
A fall in the indicators of the population’s health is, as a rule, linked to two factors: lifestyle and the way the healthcare system works. The key problem in the Russian healthcare system is the substantial divide between state guarantees concerning the provision of free healthcare services to the population and the finance provided for them. For the individual, this means restricted access to medical services, often resulting from an inability to pay for medical services and medicines or cover transport costs. We have investigated the connection between restricted access to medical services and the level of material security within individual age groups, since the greatest dependence is found between health and age. Analysis of the poverty profile showed that children between the ages of 5 and 16 years have the greatest risk of being impoverished, while pensioners, on the contrary, have the lowest risk, i.e., we might get the opposite trend, with the poorest turning out to be the healthiest. Consideration of the health problem from the angle of indicators of visits to medical institutions demonstrates certain differences between poor and non-poor households (Table 3.2). First, those who are not poor visit medical institutions and ask for medical assistance more frequently, this being a tendency that can be traced in all age groups. The most frequent visitors to the doctor are children under the age of 5 years and people of pensionable age, irrespective of their material status. Second, the reasons for not seeking medical assistance are different for poor and non-poor people. Among people of working age, the main reason for both poor and non-poor people not visiting the doctor is the absence of health problems. Within the age groups of 41-50 years and 51-54 years, however, there is a sudden increase in the significance of factors connected with the restricted access to healthcare services:
• There are no specialists of the required type in the vicinity. • It is difficult to make an appointment to see the required specialist. • Paid services are needed but there is no possibility of paying for them.
The significance of these factors rises among older age groups. Among poor people, these restrictions are much more common. In particular, non-poor respondents between the ages of 55 and 60 years who do not visit doctors for the above three reasons account for 15.5% of cases of failure to seek medical assistance, while the figure for poor people is 25.2%. There are virtually no institutional barriers to access to medical assistance for children up to the age of 5 years. Only 3.3% of the respondents in this age group from poor households indicated these factors as reasons for not seeking medical assistance, the figure for poor households being 4.8%. Analysis of data on completion of prescribed treatment indicates that poor people are more restricted in their access to medical care (Table 3.3). Non-poor groups complete a doctor’s prescriptions fully more often than poorer people, while poor groups, although in the majority of cases demonstrating the same behaviour, are more inclined to complete only the treatments provided free of charge. This pattern is characteristic of all age groups; moreover, the share of those who complete a course of treatment falls with

47
the age of the respondents. Failure to fulfil a doctor’s prescriptions is mostly connected with a shortage of funds to pay for them, a fact that is observed among both poor and non-poor respondents. It should be noted that treatment prescribed for children is completed more often than that for all other age groups. The unequal opportunities of the different population groups to take advantage of medical services are even more diversified if considered from the point of view of indicators characterising the population’s participation in payment for these services. In Russia, medical services that are paid for legally by the population to the cashiers of medical institutions are called “paid medical services”. In practice, different quality standards have taken shape for services of a single type, depending whether they are provided to patients free of charge or for a fee. The difference in quality consists in the use of medicines that cost different and, correspondingly, are of differing clinical effectiveness. Indicators of changes in the expenditure of the population and public spending on healthcare in recent years are given in Table 3.4. The share of paid medical services among the total of paid services to the population rose between 1993 and 2001 inclusive, from 1.7% to 4.6%. These impressive dynamics can hardly be explained merely by a growing demand for medical services on the part of high income population strata.
Table 3.4. Public spending and private expenditure on healthcare, billion roubles*
1993 1994 1995 1996 1997 1998 1999 2000 2001 Public spending on healthcare 6.38 23.9 51.3 72.1 98.5 88.0 137.7 199.3 241.0 Contributions to voluntary medical insurance 0.06 0.4 1.2 2.2 3.4 3.8 7.2 12.8 23.8 Paid medical services to the population 0.11 0.6 2.9 5.6 9.3 11.4 19.7 27.5 37.9 Expenditure of the population on medicaments N/A 2.1 8.1 12.2 19.8 26.3 51.7 70.1 94.2 Source: Russian Statistical Yearbook, 2000. M.: Goskomstat of Russia, 2001; Russian Statistical Yearbook, 2002. М.: Goskomstat of Russia, 2002. * until 1998 – in denominated roubles. Table 2.3 of Appendix 1 presents data characterising frequency with which poor and non-poor families take advantage of paid medical services. The first thing to notice is the three-times greater incidence of payment in hospitals than in outpatient facilities. As for the differences between the poor and those who are not poor, they are differentiated between the various age groups. With respect to children up to the age of 5 years, poorer people pay for outpatient healthcare as frequently as more prosperous people do and in hospitals they pay even more frequently than whose who are better off. Non-poor able-bodied people take advantage most frequently of paid outpatient services, which is indicative of their greater material opportunities and greater concern for their health. A similar situation is observed among both poor and non-poor groups with respect to frequency of payment for hospital treatment, though the differences are not manifested so strongly here.

48
Table 3.5. Reasons for seeking paid medical services, %
poor households non-poor households
Age groups (years): Not
satis
fied
with
free
med
ical
ca
re
Free
serv
ices
of d
octo
rs o
f the
gi
ven
prof
ile n
ot a
vaila
ble
It is
diff
icul
t to
mak
e an
ap
poin
tmen
t to
see
a fr
ee d
octo
r of
the
requ
ired
prof
ile
Not
satis
fied
with
free
med
ical
ca
re
Free
serv
ices
of d
octo
rs o
f the
gi
ven
prof
ile n
ot a
vaila
ble
It is
diff
icul
t to
mak
e an
ap
poin
tmen
t to
see
a fr
ee d
octo
r of
the
requ
ired
prof
ile
0-5 100 15.5 35.5 49.0 47.8 31.9 20.2 6-14 100 43.8 35.2 21.1 40.9 39.1 20.0 15-17 100 24.2 25.0 50.7 28.9 41.7 29.4 18-23 100 24.4 44.5 31.1 37.2 36.8 26.0 24-30 100 26.6 38.7 34.6 36.6 36.4 27.0 31-40 100 34.7 47.7 17.6 43.2 32.1 24.7 41-50 100 25.5 33.2 41.4 38.0 37.3 24.7 51-54 100 21.5 48.6 29.9 32.1 43.1 24.7 55-60 100 50.0 23.6 26.4 31.2 44.9 23.9 61-70 100 33.8 45.7 20.5 32.7 41.9 25.4 71 and above 100 31.1 48.3 20.6 29.8 43.4 26.7
Source: calculated on the basis of NOBUS data for the 2nd quarter of 2003.
Analysis of the reasons prompting people to pay for medical services does not confirm the widespread view that the main factor is a desire to receive quality healthcare (Table 3.5), though this is undoubtedly a weighty factor, especially among those who can afford it. With respect to children under the age of 5 years from poor families, the chief motive for them is the impossibility of getting an appointment with a doctor or the absence of the required specialist within the free healthcare system, and only 15.5% connect their visit to a paid medical institution with a desire to receive better quality healthcare. To conclude our overview of the characteristics of poverty, let us note that a variety of forms of manifestation of poverty are encountered in Russia, the key ones being the following: a shortage of means for current consumption; a low level of housing provision; a low level of property provision; restricted access to medical services. This comprehensive view provides a differentiated picture of poverty, allowing us to identify families for which multiple forms are characteristic. Analysis of the indicators of housing and property provision shows that income, housing and property provision are, as yet, only weakly interlinked, since many families became poor only recently and have retained a good level of living conditions. Large families are among those with the poorest living conditions, while single-parent families are distinguished by a low level of material provision. Both the poor and those who are better off encounter problems with respect to access to medical services and medicines. These situations arise far more frequently for poor people, but even more prosperous families encounter such restrictions quite often. Poor

49
people are more inclined not to complete treatment prescribed by a doctor because they lack the funds to pay for it. For children up to the age of 5 years, the barriers to taking advantage of medical services and obtaining medicines are substantially lower even in the poorest families. Among all families with children, barriers to obtaining medical services are more significant for multi-generation single-parent families, which account for 11.4% of cases when lack of funds prevents these people from visiting a doctor, while families with children account, on average, for 6.6% (Table 2.4 of Appendix 2). Large families do not complete a prescribed course of treatment in full in 22.2% of cases owing to a lack of funds. This indicator for all families with children is 13%, and that for the population as a whole, it is 11.6%.

50
4. Regional measurement of poverty
Poverty in such a vast country as Russia is bound to demonstrate a significant territorial differentiation. The reason for this is the extreme heterogeneity of the Russian regions with respect to level of economic development, state of the labour market, sex and age structure of the population, urbanisation development and living conditions. Differences in the level of poverty and the population’s incomes are characteristic of any country, being a consequence of territorial disproportions in economic development. Economic growth cannot be instantaneous and take place everywhere all at once: it begins at territorially localised “growth centres” or areas with the most favourable socio-economic conditions. A concentration of investments at the “growth centres” is necessary for the innovation processes that subsequently spread to the periphery, too, this making it possible to develop the more backward areas. These objectively existing development mechanisms make territorial economic inequality inevitable and total elimination of regional disproportions fundamentally unattainable, especially for big countries. The territorial disproportions in standard of living are greatest in countries that are trying to catch up in their development, including ones with a transitional economy, such as Russia. The ten biggest constituent entities of the RF account for 54% of the total aggregate GRP, and this share has increased substantially over the economic reform years (Table 4.1). This is primarily due to the rise in the share of the federal capital city, where the headquarters of the biggest Russian companies and over half the banks are concentrated. Differences between the centre and the periphery exist in any country, but in Russia they have reached enormous proportions and continue to intensify during the economic growth period.
Table 4.1. Share of the principal constituent entities of the RF in the total GRP of Russia, %
2002 1994 1. Moscow City 21.1 1. Moscow City 10.2 2. Tyumen Region 10.1 2. Tyumen Region 6.3 3. Moscow Region 3.9 3. Sverdlovsk Region 3.8 4. St. Petersburg 3.9 4. Moscow Region 3.6 5. Tatarstan 2.8 5. St. Petersburg 3.2 6. Sverdlovsk Region 2.6 6. Samara Region 3.2 7. Samara Region 2.5 7. Krasnoyarsk Territory 3.0 8. Krasnoyarsk Territory 2.5 8. Nizhne Novgorod Region 2.8 9. Krasnodar Territory 2.5 9. Bashkortostan 2.7 10. Bashkortostan 2.3 10. Chelyabinsk Region 2.7 Total for 10 constituent entities of the RF
54.2 Total for 10 constituent entities of the RF
41.5
Note – aggregate GRP of all constituent entities of the RF is less than the Gross Domestic Product (GDP) of Russia, since the GDP is not distributed by region.
The process of concentration of the economy in the regions with the most favourable conditions for development and the intensification of the inequality between centre and periphery at all levels (between regions and within them) during the transitional period

51
is objective in character. As a matter of fact, in Russia today, place of residence determines a person’s economic possibilities. The contrasts are particularly evident if you compare the per capita GRP indicators. In Figure 3.1 they are calculated in US dollars at purchasing power parity (PPP) and are adjusted to the cost of living in the regions. For comparison, the per capita GDP of Portugal at PPP was over 18,000 dollars in 2001. In Russia, only the Tyumen Region (with its autonomous areas) had higher levels, and Moscow was approaching those of Portugal. It is understandable that the GRP of the leading oil and gas production areas of the Tyumen Region should not really be compared with that of a separate state, since regions have an open economy – a large part of the output produced there is assimilated into the federal budget and is then redistributed. Even so, such a comparison is useful for understanding the level of regional discrepancies: the indicators for Tyva and Ingushetia are so far much closer to those of such countries as Mongolia and Uzbekistan.
0
5000
10000
15000
20000
25000
30000
per c
apita
GR
P, U
S do
llars
, Pur
chas
ing
Pow
er P
arity
Kra
snoy
arsk
Ter
ritor
y
Tata
rsta
n
Kom
i
Perm
Reg
ion
Sam
ara
Reg
ion
Rus
sia
Kur
gan
Reg
ion
Ivan
ovo
Reg
ion
Dag
esta
n
Tyva
Ingu
shet
ia
Mos
cow
City
Tyum
en R
egio
n
Figure 3.1– Per capita GRP in US dollars at Purchasing Power Parity
for 2001, adjusted for the regional cost of living Source: N.V. Zubarevich’s calculations, data from “Report on Human Potential Development of the UN Development Programme for 2002”.
The high level of differentiation of economic possibilities served as the objective basis for significant regional differences in terms of the level of poverty. Figure 3.2 shows the regional differentiation in the level of poverty in 2003, which coincides, in the main, with the differences in economic development. The highest proportion of poor people are found in the poorly developed republics (Ingushetia – 83%, Kalmykia and Dagestan – 53-55%) and autonomous areas (Ust-Ordinsk Buryatsky – 83%, Komi-Permyatsky –

52
64%). The lowest indicators are achieved only by two Tyumen areas: in the Khanti-Mansiisk Autonomous Area, the poor account for 11% and, in the Yamalo-Nenets Autonomous Area, with its smaller population, – 8%. In addition to the high wages in the basic sectors of the economy, poverty is also reduced by large-scale social security programmes and markups to the wages paid to those employed in the social sphere, financed out of regional budgets. If the population of the area is large, however, this is much more difficult: in Moscow which is the richest, 20% of the population are poor and in Russia as a whole the average is 20.6%. The level of poverty in the other regions with an export economy is the same or even higher. As in Moscow, the higher wages there mean higher prices and, consequently, a higher subsistence minimum. As a result, not only socially vulnerable population groups (single-parent and large families, the disabled and the unemployed), but also those employed in branches of the economy paying low wages (state-financed organisations, import-substituting industry) find themselves in poverty more frequently. Half of the poor consist of complete families with working parents and 1-2 children. For Moscow and the northern regions, the problem of pensioners is equally acute, as the majority receive pensions below the subsistence minimum.
Kfliningrad
Share of the population with incomes below the survival minimum, % of the total population in the region
Level of Poverty, 2003
нет данных
Kaliningrad
Perm
N. Novgorod
Moscow
Arkhangelsk St.Petersburg
Novosibirsk
Volgograd
Rostov-on-Don
Vladivostok
Khabarovsk
Chelyabinsk Ufa
Samara Voronezh
Irkutsk Omsk
Figure 3.2. Level of poverty map Source: N.V. Zubarevich. Social Atlas of Russian Regions (http://www.socialpolicy.ru/atlas/about/) For analysing the demographic profile of poverty, we can only use the NOBUS data, since our other information sources do not contain adequate figures. On the basis of

53
primary NOBUS data, 4 indicators were calculated of the poverty profile for different demographic types of family:
• the share of each demographic type among all poor households;
• the share of each demographic type in the overall income shortfall;
• the risks of joining the poor group for each demographic type of family;
• the average income shortfall for each demographic type of family. On the basis of these calculations, we studied regional specifics of the poverty profile in order to find out the territories in which children have the maximum and minimum risks and depth of poverty. It should be noted that the demographic, population dispersal and economic characteristics on which the poverty profile depends change quite smoothly from region to region, so there are no sharp boundaries between regions. Taking regions with the most clearly defined regional specifics of the poverty profile, however, our analysis allows us to identify 6 types of regions with their own specific poverty profiles (Table 3.1 Of Appendix 3). 1. Huge capital cities conurbations (Moscow and St. Petersburg). The level of poverty here is at the minimum, the biggest poor groups being households of able-bodied people without children (mostly young people) and single-parent families. The income shortfall is distributed similarly. In both these federal-level cities, the indicators of the average shortfall are similar for all demographic groups, i.e., the depth of poverty does not depend on the type of household. The estimated poverty risk provides a different picture, however: this risk is much higher for single-parent and complex families with children (up to 40% in Moscow and up to 30% in St. Petersburg), while for the most numerous groups – households with able-bodied members and no children – it is 66-75% lower. Childless pensioners have a minimum risk of falling into poverty. Thus, in the biggest cities, given the low level of poverty, it is single-parent and complex families with children that are at the greatest risk and, quantitatively, poverty is concentrated in childless, young households, yet the depth of poverty is distributed equally among the different types of household. 2. More developed, industrial resource and urbanised regions with a level of poverty just below the average. These are mainly the developed regions of the European North, the Volga area, the Urals and Siberia, with a younger population, polarised significantly in income terms. With respect to the scale of poverty, they do not have the same scourge of “childlessness” as the federal-level cities, with three groups being equally represented: able-bodied households without children and families with children (complete and single-parent). The income shortfall is also more evenly dispersed among these groups. This type is distinguished by an increased risk of poverty for single-parent families compared with complete families, owing to the “male” structure of the economy and the sharp gender differences in wages. The depth of the poverty of families with children is, however, approximately equal, irrespective of whether they are complete or single-parent, since the incomes of complete rural families engaged in the agricultural sector and families of urban state employees are just as low as those of single-parent families. The regions in this group are differentiated only in terms of the

54
poverty risk of pensioners’ households, which may be low or average, although the depth of the poverty (average income shortfall) suffered by pensioners is almost equal, since the cost of living is not going up so quickly in these regions. 3. Less developed regions of European Russia with average poverty indicators. These may be broken down into two subgroups. The first consists of the traditionally developed Centre and North West, with average and higher levels of poverty, an aging population, low-paid employment and less acute polarisation in incomes. In these regions, the risk of poverty for pensioners is minimal, since the cost of living is not high, but that of all families with children it is very high, since, given the low salaries of the employed population, children push the family over the poverty line. For this reason, the income shortfall of all families with children is also equal. The second subgroup consists of the more agricultural Black Earth Central Region and the South, which are distinguished by more moderate poverty (average or below), with a somewhat lower poverty risk for all families with children. It is likely that, in the less urbanised regions, children cost much less, owing to income in kind from the more developed personal allotments, though this is only a hypothesis and was not clearly supported by the calculations. 4. Less developed and relatively developed Eastern regions with an increased or high level of poverty. The rise in the cost of living is already marked here, but there is still not such an acute income polarisation as in the more developed export regions of Siberia. Owing to the rise in the cost of living and the higher proportion of the urban population compared with the Black Earth area, the relatively habitable East is distinguished by a high risk and depth of poverty for all families with children, especially single-parent ones, plus an increased risk of poverty for pensioners. 5. Medium developed and low population density North and East with the least favourable living conditions and above the average and high levels of poverty owing to the high cost of living. It is families with children that predominate among the poor, but the scale of poverty among pensioners is very high, too. The higher proportion of complete families with children among poor households is explained by the presence in this group of two republics – Komi and Yakutia. The rural population of these republics, consisting mainly of Komi and Yakuts, is engaged in the agricultural sector and live a poverty-stricken life. The risk of poverty for families with children does not differ from the previous types, while for single-parent and complex families it is greater. One specific of this type is the maximal poverty risks for pensioners owing to the considerable rise in the cost of living. For this reason, the average income shortfall of poor pensioners’ households is not also much lower than that of families with children. The North, especially with an ethnic component, makes all poor households almost equal in terms of the depth of their poverty. 6. Republics of the South with a higher than average level of poverty. The most clearly predominant group among the poor consists of families with children, complete, single-parent and complex families being equally represented. These families have a high risk of poverty and roughly equal depth. This can be explained by the large number of children in large and complex families and the existence of inter-family transfers in

55
single-parent ones, which smooth over any differences. The main specific feature of the Caucasian republics is the minimal scale and risk of poverty and income shortfall in households of childless pensioners. There are few of latter, owing to the indigenous population’s traditions of several generations living together, while households of Russian pensioners remain above the poverty line owing to the relatively low cost of living. Regional specifics of the Russian poverty profile in aggregated form are presented in figure 3.3.
Relatively developed exporting regions: Half single-parent families with children are poor virtually no large families
Capital cities: Singles of working
Centre of RussiaSingle-parent and large families, but few large ones
Far North and East: Families with children, pensioners, many large families
Southern republic: All families with children, few large families
Black Earth and Russian South: All families with children, few large families
Developed Eastern regions: Families with children, especially single-parent ones, and pensioners, few large families
Figure 3.3. Diagram of region types, indicating households with maximum risk
and depth of poverty Source: Table 3.1 of Appendix 3. Thus, in virtually all regions, families with children account for over half of all poor ones. The exceptions are the two major conurbations of Moscow and St. Petersburg, where there are no grave problems on the labour market, and the ratio of average wages to pensions is not in favour of pensioners, so it is non-working young people (students and unemployed) and pensioners who fall into poverty most frequently. In regions oriented primarily on male employment, single-parent families are at the greatest risk of poverty and experience the deepest poverty. In virtually all territories, large families are the most inclined towards poverty, but they are few in number, so do not predominate among the poor. The exceptions are the republics in the South of Russia and the poorly developed northern territories.

56
Summary
1. The socio-economic crisis in Russia in the early 1990s resulted in a double drop in the incomes of Russian citizens. During the first few reform years, incomes rose, but the 1998 crisis dropped them back virtually to the 1991 level. Since 2000, a growth of incomes has been observed, but the pre-reform standard of living indicators have still not been regained. 2. The reforms were accompanied by a substantial rise in income distribution inequality, so the growth of the prosperous population strata incomes occurred to a significant degree through a redistribution of resources from the poor to the rich. 3. Russia is distinguished by a high level of regional inequality in the standard of living, which took shape back in Soviet times and has intensified substantially during the market reform years. 4. According to the official Russian methodology, households and individuals are counted as poor if their incomes are below the subsistence minimum. The drop in real incomes and growth of inequality has entailed an increase in the numbers of the poor population and a deepening of poverty. Even though Russia lowered the standards for determining poverty compared with the Soviet period, the scale of poverty remains at the high level of 20%. 5. The incidence of extreme poverty, measured according to the criteria used in the Millennium Development goals, is assessed at the level of 1-5% of the total population. Unfortunately, official Russian statistics do not monitor the forms in which extreme poverty is manifested, so, in this report, the authors’ own expert assessments are used in the main. 6. Analysis of the profile of Russian poverty prompts the conclusion that families with children make up the biggest group among the poor and are distinguished by a high risk and great depth of poverty. Extreme levels of the risk and depth of poverty are characteristic of large families. Single-parent families are also a vulnerable group from the poverty point of view. At the same time, even the birth of a second child in a complete family increases the risk of poverty to 50%. 7. In Russia, the main reasons for poverty in general and child poverty in particular are connected with the labour market. In 50% of poor families with children there are parents earning wages below the subsistence minimum, while in 45% of complete families with children, one of the parents does not work. 8. Although children belong to the group with a high risk and considerable depth of poverty, the Russian system of monetary and in-kind forms of social support by the state is oriented on supporting the elderly. After the passing of Federal Law No. 122, which restructures the entire social security system, poor children’s access to social allowances is even further restricted, since the legislative and financial powers in this sphere are being handed over to the regional level and depressed regions, distinguished by a high poverty level, will be unable to finance payments to children of poor families.

57
9. Analysis of the provision of households with non-monetary tangible assets shows, from the poverty angle, that we are still seeing a close interconnection between poverty defined on the basis of access to monetary and non-monetary assets: many families that are not poor in income terms suffer from bad housing conditions and vice versa. If poverty is assessed on the basis of access to non-monetary tangible assets, families with children do not lead so unambiguously among the poor. At the same time, in this situation single-parent and large families again fall within the vulnerable groups. 10. The wide spread of paid medical services, against the background of falling real incomes of the population, more restricted access to medical services, even though healthcare is officially supposed to be free of charge in Russia. Against the general background of restricted access to medical services, children do not appear to be a vulnerable group, since both the state and parents strive to ensure priority access for children (especially up to the age of 5 years) to medicines and medical services. 11. Families with children account for over half of all poor ones. The exceptions are the two major conurbations of Moscow and St. Petersburg, where there are no grave problems on the labour market, and the ratio of average wages to pensions is not in favour of pensioners, so it is non-working young people (students and unemployed) and pensioners who fall into poverty most frequently. In regions oriented primarily on male employment, single-parent families are at the greatest risk of poverty and experience the deepest poverty. In virtually all territories, large families are the most inclined towards poverty, but they are few in number, so do not predominate among the poor. The exceptions are the republics in the South of Russia and the poorly developed northern territories.

58
Appendix 1
Table 1.1. Dynamics of nominal and real income of the population in 1991-2004 (year end)
1991 1992 1993 1994 1995 1996 1997 1998 1999 2000 2001 2002 2003 2004
Per capita income, roubles (until 1998, thous. roubles) 0.87 9.87 119.7 395.1 716.5 1036.9 1270 1676 2524 3118 4025 5429 7403 9229 Real money income (1991=100), roubles 870 380 489 504 397 472 516.5 370 408 419 456 535 649 632.5 % of 1991 100 43.7 56.1 57.9 45.7 54.3 59.4 42.5 46.9 48.2 52.4 61.5 74.6 72.7 % of 1997 100 71.7 79 81.0 88.3 103.6 125.9 122.4 Average wage, roubles (until 1998, thous. roubles) 1.2 16.07 141.2 354.2 735.5 1017 1215 1482 2283 3025 4294 5727 7344 8799 Real wages (1991 =100), roubles 1200 617 577 452 408 463 494 327 370 407 488 561 644 694 % of 1991 100 51.4 48 37.7 34 36.4 41.2 27.3 30.8 33.9 40.6 46.8 53.7 57.8 % of 1997 100 67.1 74.9 83.2 99.7 115.5 132.2 140.3 Average pension, roubles (until 1998, thous. roubles) 0.305 3.375 38 110.4 242.6 320.1 366.4 402.9 521.5 823.4 1241 1462 1842 2026 Real average pension, roubles 305 129.6 155.2 140.8 134.5 145.8 149 89 84.3 110.7 140.6 144.1 162 159.5 % of 1991 100 42.5 50.9 46.2 44.1 47.8 48.9 29.2 27.6 36.3 46.1 47.2 53.1 52.3 % of 1997 100 59.7 56.5 74.3 94.4 96.7 108.6 106.3 Consumer Price Index (CPI), % of previous year 100 2604 941 320 230 122 112 184 137 120 119 115 112 111.7 CPI 1991=1 1 26.04 244.9 784 1803 2196 2459 4524 6189 7440 8824 10148 11365 12694.7 CPI 1997=1 1 1.8 2.5 3.0 3.6 4.1 4.6 5.2 Sources: calculated from: 1. Information on the Socio-Economic Position in Russia, 2005. Final document bank, M., FGSS, 2004. 2. Brief economic indicators of the Russian Federation, M., FGSS, April 2005.

59
Table 1.2. Benefit payments as percentage of total spending
1994 1995 1996 1997 1998 1999 2000 2001 2002 2003
Benefit payments, total 100 100 100 100 100 100 100 100 100 100 including: temporary disability benefits18 38.9 32.8 34.3 33.4 36.7 35.7 42.8 49.3 49.0 49.9 Of these, on-the-job injury and occupational disease benefits … 0.5 0.5 0.5 0.6 0.6 0.6 0.7 0.7 0.7 Family and maternity benefits 52.4 54.4 49.6 46.5 35.3 37.7 33.8 34.9 34.0 32.4 including: maternity benefits27 5.2 4.2 4.0 3.7 4.8 4.4 4.7 5.6 6.7 7.6 birth grants 1.1 1.5 2.9 3.2 3.9 2.8 2.0 1.9 4.5 4.6 maternity leave until child is 18 months old27 2.7 2.6 4.4 4.2 4.8 3.5 2.3 2.0 4.1 4.0 disabled child care allowance27 0.1 0.1 0.1 0.1 0.2 0.1 0.2 0.2 0.2 0.2 monthly child allowances for each child19 43.4 46.0 38.2 35.3 21.6 26.9 24.7 25.2 18.4 16.0 benefits for radiation victims28 0.2 0.7 3.8 5.5 8.8 6.7 5.1 5.1 4.9 4.1 unemployment benefits20 8.4 8.5 8.0 9.6 12.5 13.6 8.0 7.3 8.3 9.2 lump-sum travel allowances to refugees and forced migrants31 - - - 0.4 1.0 0.8 0.6 0.5 0.7 0.3 funeral allowances 27, 29 1.6 1.8 2.6 2.8 3.5 2.7 1.9 1.8 1.4 1.2 Benefit payments share, % of GDP 1.6 1.4 1.9 2.0 1.5 1.1 1.1 1.1 1.2 1.1 in total household incomes 2.6 2.4 3.1 3.1 2.3 1.9 2.0 1.8 1.9 1.6 Share of family and maternity benefits, % of GDP 0.8 0.8 1.0 0.9 0.5 0.4 0.4 0.4 0.4 0.3 in total household incomes 1.4 1.3 1.6 1.4 0.8 0.7 0.7 0.6 0.6 0.5 Family and maternity benefit dynamics, % of previous year 126.4 80.8 119.3 97.0 48.2 77.3 104.8 107.4 109.5 92.5 Child benefit arrears (year end), % of total benefits granted - - - - 225.4 117.0 107.5 60.6 40.0 22.9 Sources: 1. The Social Position and Standard of Living of the Population in Russia, 2001, Statistical Digest/Goskomstat of Russia. M., 2001, p. 164. 2. The Social Position and Standard of Living of the Population in Russia, 2001, Statistical Digest/Goskomstat of Russia. M., 2001, p. 216. 3. The Social Position and Standard of Living of the Population in Russia, 2001, Statistical Digest/Goskomstat of Russia. M., 2001, p. 213.
18 Social Insurance Fund financing. 19 Federal and local budget financing. 20 Federal Employment Fund financing.

60
Table 1.3. Minimum social guarantees v. minimum subsistence level, as of 1 January, %
1995 1996 1997 1998 1999 200021 2001 2002 2003
Minimum wage 13 16 19 18 10 14.2 17.5 21.8 25.6 UTN grade 1 tariff rate for public sector employees 19 21 18 19 10 14.2 26.3 21.8 25.6 Minimum pension: old age 27 26 25 29 15 15.9 15.5 36.5 36.8 disability: degree 1 38 37 35 40 42 31.8 30.9 73.0 73.6 degree 2 19 18 18 20 30 15.9 15.5 36.5 36.8 degree 3 13 12 12 13 15 10.6 10.3 18.2 18.4 Survivors pension 13 12 12 13 10 - - 36.5 36.8 Monthly child allowance for a child: up to the age of 6 years 8 - - - - - - - - from 6 to 16 years 7 - - - - - - - - up to 16 years - 13 15 14 7 4.6 4.5 3.7 3.3 Minimum stipend: to higher education students 10 16 38 36 19 11.9 11.7 9.7 17.1 to students of secondary specialised and primary vocational educational institutions 7 11 13 13 7 4.2 4.1 3.4 6.0 Source: The Social Position and Standard of Living of the Population in Russia, Statistical Digest/Goskomstat of Russia, M., 1997-2004.
21 From 2000 onwards, data are given for the 4th quarter.

61
Table 1.4.1. Poverty risk and depth by sociodemographic group: cities with over 1 million population
Poor households Money income Disposable resources
Risk of falling into
the poor group
Income shortfall
Risk of falling into
the poor group
Income shortfall
All households surveyed, %
(% of group size)
(% of SM) (% of group size)
(% of SM)
Families with children: 100.0 66.9 26.4 44.1 12.7 Married couple with 1 child 100.0 42.1 14.4 19.0 3.6 Married couple with 1 child and other relatives 100.0 56.1 18.8 33.3 7.8 Married couple with 2 children 100.0 71.5 29.2 43.3 10.7 Married couple with 2 children and other relatives 100.0 68.9 28.6 56.0 17.9 Married couple with 3 or more children 100.0 65.9 32.9 48.1 16.9 Married couple with 3 or more children and other relatives 100.0 100.0 38.3 77.1 24.8 Mothers (fathers) with children 100.0 69.2 28.4 37.7 10.4 Mothers (fathers) with children and other relatives 100.0 61.9 20.9 38.5 9.6 Families without children: 100.0 24.3 5.2 8.6 1.8 Households of pensioners 100.0 24.3 3.4 4.1 0.7 Households of able-bodied people 100.0 24.3 7.1 13.1 2.9
Average for all families 100.0 34.4 12.8 16.7 5.0
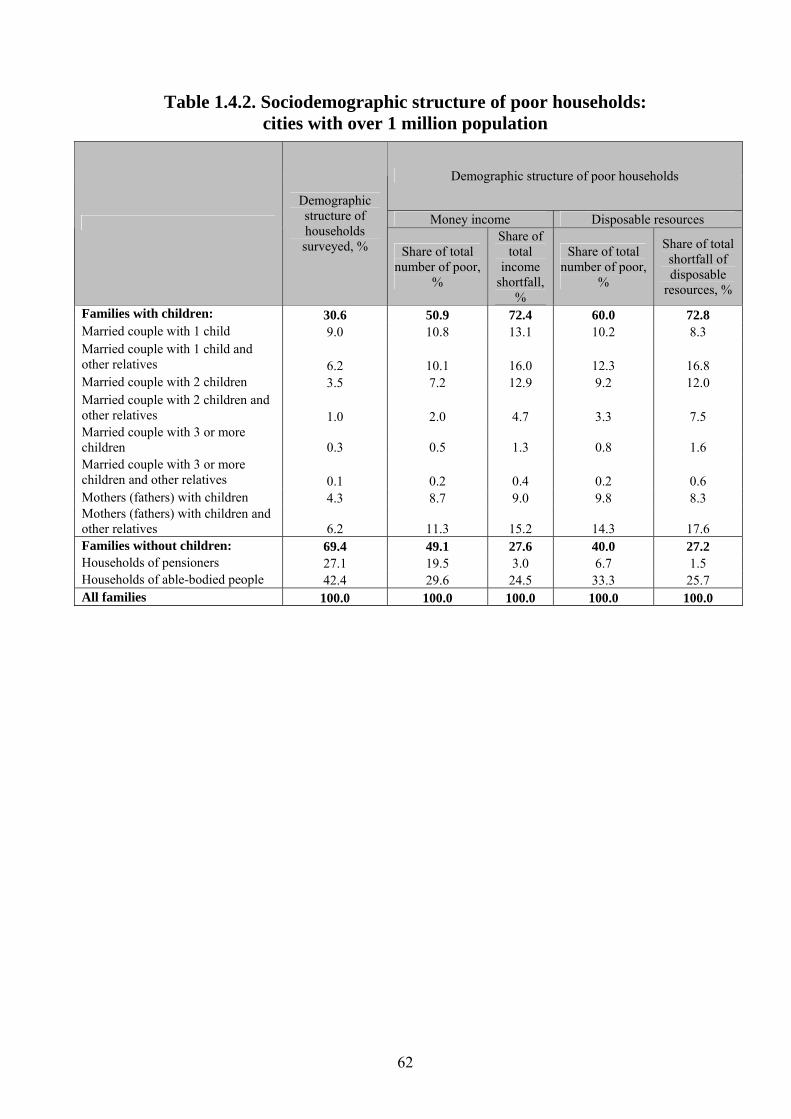
62
Table 1.4.2. Sociodemographic structure of poor households: cities with over 1 million population
Demographic structure of poor households
Money income Disposable resources
Demographic structure of households surveyed, % Share of total
number of poor, %
Share of total
income shortfall,
%
Share of total number of poor,
%
Share of total shortfall of disposable
resources, %
Families with children: 30.6 50.9 72.4 60.0 72.8 Married couple with 1 child 9.0 10.8 13.1 10.2 8.3 Married couple with 1 child and other relatives 6.2 10.1 16.0 12.3 16.8 Married couple with 2 children 3.5 7.2 12.9 9.2 12.0 Married couple with 2 children and other relatives 1.0 2.0 4.7 3.3 7.5 Married couple with 3 or more children 0.3 0.5 1.3 0.8 1.6 Married couple with 3 or more children and other relatives 0.1 0.2 0.4 0.2 0.6 Mothers (fathers) with children 4.3 8.7 9.0 9.8 8.3 Mothers (fathers) with children and other relatives 6.2 11.3 15.2 14.3 17.6 Families without children: 69.4 49.1 27.6 40.0 27.2 Households of pensioners 27.1 19.5 3.0 6.7 1.5 Households of able-bodied people 42.4 29.6 24.5 33.3 25.7 All families 100.0 100.0 100.0 100.0 100.0

63
Table 1.5.1. Poverty risk and depth by sociodemographic group: cities with 100,000 – 1,000,000 population
Poor households Money income Disposable resources
Risk of falling into
the poor group
Income shortfall
Risk of falling into
the poor group
Income shortfall
All households surveyed, %
(% of group size)
(% of SM) (% of group size)
(% of SM)
Families with children: 100.0 74.7 30.3 47.3 14.1 Married couple with 1 child 100.0 48.2 17.1 22.0 4.9 Married couple with 1 child and other relatives 100.0 59.9 18.7 30.3 7.4 Married couple with 2 children 100.0 70.1 27.2 36.9 9.3 Married couple with 2 children and other relatives 100.0 78.3 29.7 51.7 13.0 Married couple with 3 or more children 100.0 94.4 46.5 67.4 24.6 Married couple with 3 or more children and other relatives 100.0 99.5 38.7 83.5 26.6 Mothers (fathers) with children 100.0 75.7 34.8 44.3 14.0 Mothers (fathers) with children and other relatives 100.0 71.7 29.4 42.5 13.3 Families without children: 100.0 29.8 8.5 11.3 2.5 Households of pensioners 100.0 23.1 4.7 5.2 0.9 Households of able-bodied people 100.0 36.5 12.3 17.4 4.1 Average for all families 100.0 43.6 18.3 21.0 6.9

64
Table 1.5.2. Sociodemographic structure of poor households: cities with 100,000 – 1,000,000 population
Demographic structure of poor households
Money income Disposable resources
Demographic structure of households surveyed, % Share of total
number of poor, %
Share of total income
shortfall, %
Share of total number of poor, %
Share of total income
shortfall, % Families with children: 38.2 56.1 73.8 63.4 77.9 Married couple with 1 child 11.0 12.1 12.6 11.5 9.6 Married couple with 1 child and other relatives 7.0 9.6 12.3 10.1 12.9 Married couple with 2 children 5.7 9.1 13.5 10.0 12.3 Married couple with 2 children and other relatives 1.4 2.4 4.7 3.3 5.4 Married couple with 3 or more children 0.7 1.5 3.7 2.3 5.2 Married couple with 3 or more children and other relatives 0.3 0.7 1.6 1.1 3.0 Mothers (fathers) with children 5.1 8.9 8.8 10.7 9.4 Mothers (fathers) with children and other relatives 7.1 11.8 16.7 14.4 20.1 Families without children: 61.8 43.9 26.2 36.6 22.1 Households of pensioners 25.0 13.4 2.7 6.2 1.4 Households of able-bodied people 36.7 30.5 23.5 30.4 20.7 All families 100.0 100.0 100.0 100.0 100.0

65
Table 1.6.1. Poverty risk and depth by sociodemographic group: cities with 20,000 – 100,000 population
Poor households Money income Disposable resources
Risk of falling into
the poor group
Income shortfall
Risk of falling into
the poor group
Income shortfall
All households surveyed, %
(% of group size)
(% of SM) (% of group size)
(% of SM)
Families with children: 100.0 74.1 30.2 45.7 13.8 Married couple with 1 child 100.0 54.8 20.3 30.2 7.6 Married couple with 1 child and other relatives 100.0 66.7 24.7 41.0 10.7 Married couple with 2 children 100.0 76.1 31.7 44.0 13.5 Married couple with 2 children and other relatives 100.0 76.3 28.0 43.9 11.2 Married couple with 3 or more children 100.0 84.8 43.9 57.3 21.6 Married couple with 3 or more children and other relatives 100.0 76.0 23.2 47.0 10.6 Mothers (fathers) with children 100.0 79.0 37.3 49.1 18.0 Mothers (fathers) with children and other relatives 100.0 78.8 32.3 53.4 17.6 Families without children: 100.0 36.6 10.7 15.3 3.8 Households of pensioners 100.0 30.2 5.9 8.3 1.4 Households of able-bodied people 100.0 43.1 15.5 22.4 6.2 Average for all families 100.0 49.0 21.1 25.5 9.0

66
Table 1.6.2. Sociodemographic structure of poor households: cities with 20,000 – 100,000 population
Demographic structure of poor households
Money income Disposable resources
Demographic structure of households surveyed, % Share of total
number of poor, %
Share of total income
shortfall, %
Share of total number of poor, %
Share of total disposable
resources, % Families with children: 37.4 52.8 72.7 61.0 75.8 Married couple with 1 child 11.1 12.4 13.7 13.1 12.1 Married couple with 1 child and other relatives 6.8 9.3 14.0 10.9 14.2 Married couple with 2 children 6.8 10.7 17.0 11.8 17.0 Married couple with 2 children and other relatives 1.4 2.2 3.9 2.4 3.7 Married couple with 3 or more children 0.7 1.3 3.1 1.6 3.6 Married couple with 3 or more children and other relatives 0.2 0.3 0.6 0.4 0.7 Mothers (fathers) with children 5.7 9.1 9.6 11.0 10.9 Mothers (fathers) with children and other relatives 4.7 7.6 10.7 9.8 13.7 Families without children: 62.6 47.2 27.3 39.0 24.2 Households of pensioners 28.9 18.0 3.5 9.4 1.9 Households of able-bodied people 33.7 29.2 23.8 29.6 22.3 All families 100.0 100.0 100.0 100.0 100.0

67
Table 1.7.1. Poverty risk and depth by sociodemographic group: small towns with up to 20,000 population and urban-type settlements
Poor households Money income Disposable resources
Risk of falling into
the poor group
Income shortfall
Risk of falling into
the poor group
Income shortfall
All households surveyed, %
(% of group size)
(% of SM) (% of group size)
(% of SM)
Families with children: 100.0 84.1 40.6 55.8 19.5 Married couple with 1 child 100.0 71.1 28.0 40.7 11.9 Married couple with 1 child and other relatives 100.0 75.9 28.6 46.9 13.2 Married couple with 2 children 100.0 83.8 38.9 57.7 20.0 Married couple with 2 children and other relatives 100.0 88.2 39.0 62.4 22.4 Married couple with 3 or more children 100.0 87.6 48.0 74.8 26.8 Married couple with 3 or more children and other relatives 100.0 100.0 54.4 55.2 21.5 Mothers (fathers) with children 100.0 84.1 46.7 51.6 20.3 Mothers (fathers) with children and other relatives 100.0 82.0 41.1 56.7 19.9 Families without children: 100.0 40.9 12.0 18.9 4.6 Households of pensioners 100.0 36.1 7.6 12.2 2.2 Households of able-bodied people 100.0 45.8 16.4 25.6 7.0 Average for all families 100.0 54.9 25.4 30.7 11.6

68
Table 1.7.2. Sociodemographic structure of poor households: small towns with up to 20,000 population and urban-type settlements
Demographic structure of poor households
Money income Disposable resources
Demographic structure of households surveyed, % Share of total
number of poor, %
Share of total income
shortfall, %
Share of total number of poor, %
Share of total disposable
resources, % Families with children: 36.5 52.1 74.4 59.5 77.1 Married couple with 1 child 11.4 14.7 16.0 15.1 14.9 Married couple with 1 child and other relatives 6.7 9.3 13.3 10.2 13.4 Married couple with 2 children 6.3 9.5 16.0 11.8 17.9 Married couple with 2 children and other relatives 1.2 1.9 3.7 2.4 4.6 Married couple with 3 or more children 1.1 1.7 4.3 2.6 5.3 Married couple with 3 or more children and other relatives 0.2 0.4 1.1 0.4 0.9 Mothers (fathers) with children 5.2 7.9 9.1 8.8 8.6 Mothers (fathers) with children and other relatives 4.5 6.7 10.8 8.3 11.5 Families without children: 63.5 47.9 25.6 40.5 22.9 Households of pensioners 28.7 19.1 3.7 11.4 2.4 Households of able-bodied people 34.9 28.8 21.9 29.1 20.5 All families 100.0 100.0 100.0 100.0 100.0

69
Table 1.8.1. Poverty risk and depth by sociodemographic group: rural areas
Poor households Money income Disposable resources
Risk of falling into
the poor group
Income shortfall
Risk of falling into
the poor group
Income shortfall
All households surveyed, %
(% of group size)
(% of SM) (% of group size)
(% of SM)
Families with children: 100.0 85.8 48.5 62.5 26.3 Married couple with 1 child 100.0 73.3 36.9 44.4 15.7 Married couple with 1 child and other relatives 100.0 78.7 38.2 48.8 16.6 Married couple with 2 children 100.0 87.8 45.6 59.4 23.5 Married couple with 2 children and other relatives 100.0 87.8 47.3 64.0 24.8 Married couple with 3 or more children 100.0 91.5 61.5 76.8 39.1 Married couple with 3 or more children and other relatives 100.0 94.7 63.3 74.1 36.1 Mothers (fathers) with children 100.0 86.9 48.4 61.8 26.2 Mothers (fathers) with children and other relatives 100.0 85.8 46.5 70.9 28.1 Families without children: 100.0 51.8 18.4 24.8 7.4 Households of pensioners 100.0 40.8 8.7 11.1 1.9 Households of able-bodied people 100.0 62.9 28.0 38.4 12.8 Average for all families 100.0 63.1 35.7 36.6 17.8

70
Table 1.8.2. Sociodemographic structure of poor households: rural areas
Demographic structure of poor households
Money income Disposable resources
Demographic structure of households surveyed, % Share of total
number of poor, %
Share of total income
shortfall, %
Share of total number of poor, %
Share of total income
shortfall, % Families with children: 38.7 51.0 76.7 61.1 80.3 Married couple with 1 child 8.5 10.0 11.1 10.4 9.5 Married couple with 1 child and other relatives 6.2 7.8 11.5 8.3 10.1 Married couple with 2 children 9.1 12.7 18.6 14.8 19.2 Married couple with 2 children and other relatives 2.4 3.3 6.6 4.2 6.9 Married couple with 3 or more children 2.7 3.9 9.9 5.6 12.6 Married couple with 3 or more children and other relatives 0.6 1.0 3.1 1.3 3.5 Mothers (fathers) with children 4.3 5.9 5.7 7.2 6.2 Mothers (fathers) with children and other relatives 4.9 6.6 10.3 9.4 12.5 Families without children: 61.3 49.0 23.3 38.9 19.7 Households of pensioners 34.1 22.2 3.5 10.4 1.5 Households of able-bodied people 27.2 26.8 19.8 28.5 18.1 All families 100.0 100.0 100.0 100.0 100.0

71
Appendix 2
Criteria for the level of material provision of Russian households.
Criteria for the level of housing provision. 1. Comfortable housing. The household enjoys electricity, running water, a sewage system, and a hot water supply. 2. Living space not below the social norm. For single person families, the living space should be at least 33 square metres, for two-person families – at least 42 square metres, for families of three or more people, the living space should be at least 18 square metres per family member. 3. Poor in terms of housing provision. The housing lacks either a sewage system, or a hot water supply, or is in need of major repairs, or is poorly heated. 4. Above average living conditions. The household enjoys, first, comfortable housing; second, sufficient living space (not less than the social norm). 5. Average level of housing provision. All other households. Criteria for the level of property provision. 1. A low level of property provision. The household has no consumer durables from the list of minimum requirements (refrigerator, television, washing machine). 2. Above average level of property provision. The household has, first, all the durables from the minimum list (refrigerator, television and washing machine), second, either a dishwasher or a computer or a truck/car/motor boat or a second home or plot of land. 3. Average level of property provision. All other households.

72
Table 2.1. Level of housing and property potential: urban families
Housing provision criteria Property provision criteria
All urban families Living in
comfortable housing*
Total living
space not below the
social norm
Above average level of housing
provision**
Low level of housing provision
***
Above average level of property provision
****
Low level of property provision
*****
Families with children: 100.0 72.6 16.8 11.4 35.1 46.1 12.6 Married couple with 1 child 100.0 75.9 32.7 22.7 30.9 49.6 10.8
Married couple with 1 child and other relatives 100.0 77.7 10.2 6.7 28.6 58.5 6.4
Married couple with 2 children 100.0 76.2 12.1 7.7 32.3 52.3 11.2
Married couple with 2 children and other relatives
100.0 71.9 5.9 2.4 35.9 60.7 6.6
Married couple with 3 or more children 100.0 60.2 3.6 1.3 49.9 52.0 15.0
Married couple with 3 or more children and other relatives
100.0 64.0 1.9 0.4 41.7 42.6 9.7
Mothers (fathers) with children 100.0 76.3 47.3 34.4 32.3 22.0 25.3
Mothers (fathers) with children and other relatives
100.0 78.8 20.7 15.3 29.1 31.3 15.7
Families without children: 100.0 73.9 61.2 41.6 32.0 28.6 23.3
Households of pensioners 100.0 69.6 69.7 44.3 36.2 18.8 27.5 Households of able-bodied people 100.0 78.2 52.7 39.0 27.8 38.3 19.0
All households 100.0 75.2 46.9 32.4 31.3 35.5 19.1 Source: calculated on the basis of NOBUS data for the 2nd quarter of 2003.

73
Table 2.2. Level of housing and property potential: rural families
Housing provision criteria Property provision criteria
All rural families Living in
comfortable housing*
Total living space not below the
social norm
Above average level of housing
provision**
Low level of housing provision
***
Above average level of property provision
****
Low level of property provision
*****
Families with children: 100.0 10.5 28.1 3.5 90.2 32.9 25.9 Married couple with 1 child 100.0 12.5 50.1 4.7 88.2 38.5 15.5
Married couple with 1 child and other relatives
100.0 15.3 23.0 3.4 85.4 49.0 13.4
Married couple with 2 children 100.0 11.9 22.8 2.7 89.0 42.6 15.8
Married couple with 2 children and other relatives
100.0 14.1 16.0 4.7 85.4 39.6 26.7
Married couple with 3 or more children 100.0 4.8 16.1 1.1 95.4 32.3 34.3
Married couple with 3 or more children and other relatives
100.0 3.4 19.3 2.6 97.2 33.4 36.9
Mothers (fathers) with children 100.0 11.6 51.7 6.1 90.9 7.2 36.2
Mothers (fathers) with children and other relatives
100.0 10.6 25.7 2.5 89.9 20.4 28.7
Families without children: 100.0 9.6 69.3 6.3 90.8 19.7 33.7
Households of pensioners 100.0 6.6 75.9 4.5 93.9 11.2 39.2
Households of able-bodied people 100.0 12.6 62.7 8.1 87.7 28.2 28.3
All households 100.0 10.3 55.1 5.2 90.3 25.0 29.4 Source: calculated on the basis of NOBUS data for the 2nd quarter of 2003.

74
Table 2.3. Frequency* of seeking paid medical services and sources of medical services, %
poor households non-poor households
age groups (years):
Paid
for o
utpa
tient
se
rvic
es d
urin
g th
e la
st 3
m
onth
s
Paid
by
resp
onde
nt/re
spon
dent
’s
fam
ily *
Paid
for h
ospi
tal
treat
men
t dur
ing
the
last
12
mon
ths
Paid
by
resp
onde
nt/re
spon
dent
’s
fam
ily *
Paid
for o
utpa
tient
se
rvic
es d
urin
g th
e la
st 3
m
onth
s
Paid
by
resp
onde
nt/re
spon
dent
’s
fam
ily *
Paid
for h
ospi
tal
treat
men
t dur
ing
the
last
12
mon
ths
Paid
by
resp
onde
nt/re
spon
dent
’s
fam
il y *
0-5 100 6 95.2 27.8 93.4 5.3 98.3 23.9 96.2 6-14 100 5.6 97.6 26.3 92.6 7.3 98.1 25.6 94.2 15-17 100 5.9 91.1 27.8 91.4 8.7 95.9 34.5 91 18-23 100 8.5 95.1 31.1 95.2 12.2 95.4 35.6 93.8 24-30 100 7.9 98.8 29.3 95.3 14.5 94.5 32.7 93.6 31-40 100 10.1 92.5 39.8 91.6 14.9 91.6 38.2 92 41-50 100 8.8 85 30.2 84.4 12.7 94.5 37.7 89.5 51-54 100 7.2 92.7 41.8 97.4 11.3 95.4 45.3 89.8 55-60 100 6 99.6 43.5 98 10 93.7 40.6 93.6 61-70 100 5 96.7 36.5 98.5 7.8 93.8 41 90 71 and above 100 4.7 97.1 24.8 98.5 4.9 94.5 34.2 93.4
Source: calculated on the basis of NOBUS data for the 2nd quarter of 2003. *by those who seeked paid medical services

75
Table 2.4. Accessibility of medical services for demographic groups: Russian population as a whole
Reasons for not visiting a doctor in the case of health problems: Prescribed treatment completed or not:
Total population
No required specialist available
in the vicinity
Difficult to make an
appointment with the required specialist
Required services are to
be paid for services and
they are unaffordable
Completed only the part
available free of charge
Completed only
partially, owing to
insufficient funds
Not completed at all owing to
lack of funds to pay for
medicaments
Families with children: 100.0 2.5 2.6 6.6 12.5 13.0 0.6
Married couple with 1 child
100.0 2.4 2.1 4.9 10.5 10.5 0.6
Married couple with 1 child and other relatives
100.0 2.4 2.3 7.0 14.9 11.1 0.1
Married couple with 2 children
100.0 2.0 2.5 4.0 9.1 9.0 0.2
Married couple with 2 children and other relatives
100.0 2.1 3.6 7.3 16.1 12.7 1.0
Married couple with 3 or more children
100.0 2.8 1.1 4.1 12.9 12.8 1.1
Married couple with 3 or more children and other relatives
100.0 2.8 0.6 5.7 6.8 22.2 0.0
Mothers (fathers) with children
100.0 1.5 3.3 8.1 12.9 12.8 1.0
Mothers (fathers) with children and other relatives
100.0 3.7 5.3 11.4 16.7 12.7 0.8
Families without children:
100.0 5.8 4.9 10.2 19.2 11.6 1.1
Households of pensioners 100.0 8.1 5.9 12.7 21.6 13.5 1.4
Households of able-bodied people
100.0 3.4 4.0 7.7 16.7 9.7 0.8
Average for the population
100.0 3.9 3.8 8.1 17.3 11.6 0.9
Source: calculated on the basis of NOBUS data for the 2nd quarter of 2003.
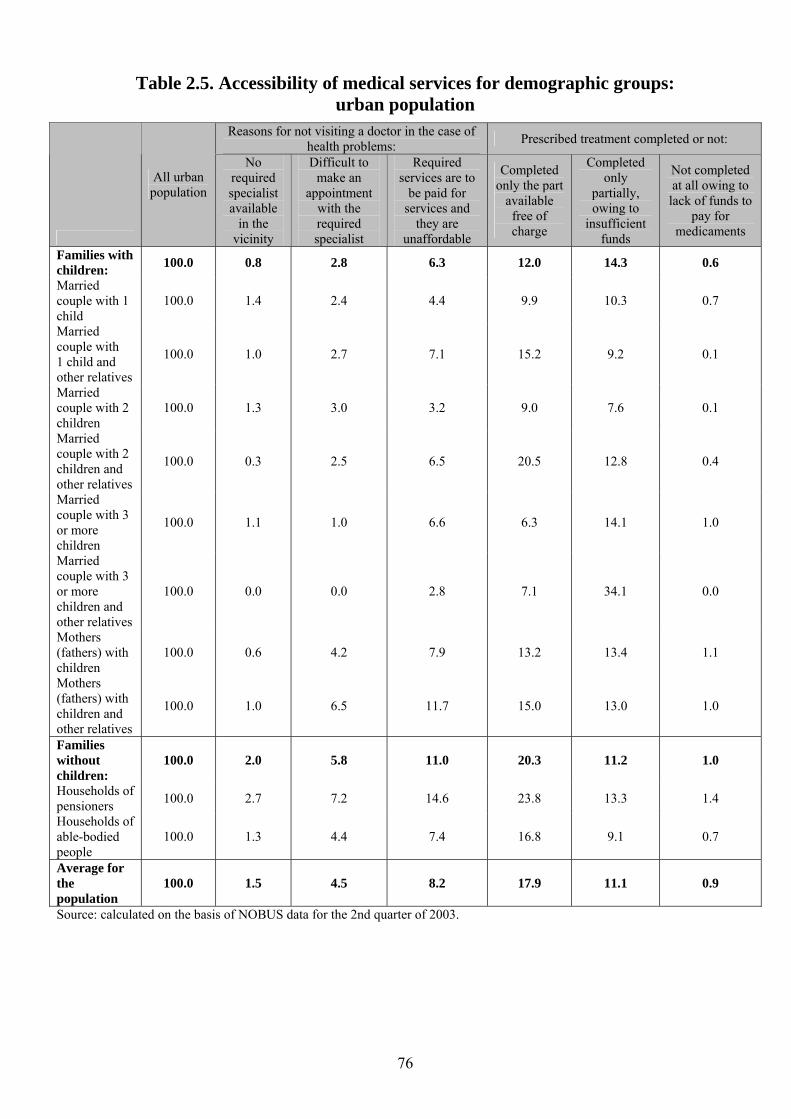
76
Table 2.5. Accessibility of medical services for demographic groups: urban population
Reasons for not visiting a doctor in the case of health problems: Prescribed treatment completed or not:
All urban population
No required specialist available
in the vicinity
Difficult to make an
appointment with the required specialist
Required services are to
be paid for services and
they are unaffordable
Completed only the part
available free of charge
Completed only
partially, owing to
insufficient funds
Not completed at all owing to
lack of funds to pay for
medicaments
Families with children: 100.0 0.8 2.8 6.3 12.0 14.3 0.6
Married couple with 1 child
100.0 1.4 2.4 4.4 9.9 10.3 0.7
Married couple with 1 child and other relatives
100.0 1.0 2.7 7.1 15.2 9.2 0.1
Married couple with 2 children
100.0 1.3 3.0 3.2 9.0 7.6 0.1
Married couple with 2 children and other relatives
100.0 0.3 2.5 6.5 20.5 12.8 0.4
Married couple with 3 or more children
100.0 1.1 1.0 6.6 6.3 14.1 1.0
Married couple with 3 or more children and other relatives
100.0 0.0 0.0 2.8 7.1 34.1 0.0
Mothers (fathers) with children
100.0 0.6 4.2 7.9 13.2 13.4 1.1
Mothers (fathers) with children and other relatives
100.0 1.0 6.5 11.7 15.0 13.0 1.0
Families without children:
100.0 2.0 5.8 11.0 20.3 11.2 1.0
Households of pensioners 100.0 2.7 7.2 14.6 23.8 13.3 1.4
Households of able-bodied people
100.0 1.3 4.4 7.4 16.8 9.1 0.7
Average for the population
100.0 1.5 4.5 8.2 17.9 11.1 0.9
Source: calculated on the basis of NOBUS data for the 2nd quarter of 2003.

77
Table 2.6. Accessibility of medical services for demographic groups: rural population
Reasons for not visiting a doctor in the case of health problems: Prescribed treatment completed or not:
All rural population
No required specialist available
in the vicinity
Difficult to make an
appointment with the required specialist
Required services are to
be paid for services and
they are unaffordable
Completed only the part
available free of charge
Completed only
partially, owing to
insufficient funds
Not completed at all owing to
lack of funds to pay for
medicaments
Families with children: 100.0 5.8 1.5 7.1 13.2 11.7 0.6
Married couple with 1 child
100.0 6.3 0.9 6.9 12.9 11.5 0.3
Married couple with 1 child and other relatives
100.0 6.6 1.1 6.9 13.4 18.2 0.0
Married couple with 2 children
100.0 3.2 1.7 5.3 9.3 12.5 0.4
Married couple with 2 children and other relatives
100.0 4.8 5.2 8.5 7.9 12.6 2.0
Married couple with 3 or more children
100.0 3.9 1.2 2.5 20.4 11.3 1.2
Married couple with 3 or more children and other relatives
100.0 4.6 1.0 7.7 6.3 5.4 0.0
Mothers (fathers) with children
100.0 4.4 0.0 8.9 11.7 10.4 0.6
Mothers (fathers) with children and other relatives
100.0 12.9 1.2 10.4 23.9 11.5 0.1
Families without children:
100.0 15.1 2.8 8.7 15.9 13.6 1.3
Households of pensioners 100.0 18.7 3.2 9.0 15.5 14.2 1.6
Households of able-bodied people
100.0 11.6 2.3 8.5 16.2 13.0 1.0
Average for the population
100.0 10.8 2.1 7.9 15.1 13.4 1.1
Source: calculated on the basis of NOBUS data for the 2nd quarter of 2003.

78
Appendix 3
Table 3.1. Poverty profile by region Risk of poverty for
families with children:
Income shortfall of households: Type Description Regions Level of poverty
Share of families
with children among
the poor
Risk of poverty for families of pensioners complete single
parent pensioners complete
families with
children
single-parent
families with
children 1 Major conurbations with minimal poverty,
mainly households without children, but with the biggest risk for single-parent and complex families with children
Moscow, St. Petersburg 11-15 39-50 3-5 19-21 24-39 15-17 18-21 18-22
2 More developed industrial resource and export regions with a lower level of poverty, lower risk and share of complete families with children, and low and average risk for pensioners
Kemerovo and Murmansk Regions, Krasnoyarsk Territory, Samara, Sverdlovsk, Chelyabinsk, Yaroslavl, Lipetsk, Novgorod and the south of the Tyumen Region
18-28 55-65 5-12 23-39 49-58 11-19 22-36 27-37
3a Black Earth region and South with an average level of poverty with a low share and low risk of poverty for pensioners and a high risk for families with children
Bashkortostan, Adigeya, Krasnodar Territory, Volgograd, Voronezh, Tambov, Oryol, Rostov and Omsk regions
25-28 60-71 5-9 36-49 40-67 13-20 22-37 26-33
3b European Centre with an average and high level of poverty, minimal risk for pensioners and maximum risk and income shortfall for all families with children
Pskov, Tver, Bryansk, Kirov, Kostroma, Nizhne Novgorod, Archangel regions, Mordovia, Udmurtia, Ivanovo Region
25-33 60-73 4-9 40-54 51-68 15-20 25-34 27-36
4. More developed eastern regions of a transitional type with high poverty levels, a high risk for families with children and above average risk for pensioners
Astrakhan, Kurgan, Amur, Novosibirsk, Khabarovsk regions, Primosky Territory, Buryatia
32-39 54-64 13-16 37-57 55-65 12-21 28-41 33-41
5. Underdeveloped north-eastern resource regions with an increased level of poverty, high poverty risk for urban pensioners and all families with children, especially in ethnic villages
Komi, Yakutia, Kamchatka and Sakhalin regions
30-43 55-69 18-26 35-52 46-67 20-22 25-38 29-39
6. Ethnic regions of the Caucasus with an increased level of poverty and risk for all families with children
Kabardino-Balkaria 34 73 3 46 53 7 30 34
Source: N.V. Zubarevich’s calculations, NOBUS data for the 2nd quarter of 2003.