
Energy Transitions - Boston University
50
THE PARDEE PAPERS / No. 12/ November 2010 Energy Transitions Peter A. O’Connor
Transcript of Energy Transitions - Boston University
THE PARDEE PAPERS / No. 12/ November 2010
Energy TransitionsPeter A. O’Connor
Energy Transitions
Peter A. O’Connor
The PARDee PAPeRS / No. 12 / November 2010
The Pardee Papers series features working papers by Pardee Center Fellows and other invited authors. Papers in this series explore current and future challenges by anticipating the pathways to human progress, human development, and human well-being. This series includes papers on a wide range of topics, with a special emphasis on interdisciplinary perspectives and a development orientation.
Series Editor: Professor Adil NajamAssociate Editor: Cynthia Barakatt
The Frederick S. Pardee Center for the Study of the Longer-Range Future at Boston University convenes and conducts interdisciplinary, policy-relevant, and future-oriented research that can contribute to long-term improvements in the human condition. Through its programs of research, publications, and events, the Pardee Center seeks to identify, anticipate, and enhance the long-term poten-tial for human progress, in all its various dimensions.
The Frederick S. Pardee Center for the Study of the Longer-Range Future Boston University Pardee House 67 Bay State Road Boston, Massachusetts 02215 Tel: 617-358-4000 Fax: 617-358-4001 www.bu.edu/pardee Email: [email protected]
Cover photo via iStockphoto.com.
The views expressed in this paper represent those of the author and do not necessarily represent the views of the Frederick S. Pardee Center for the Study of the Longer-Range Future or the Trustees of Boston University. The publications produced by the Pardee Center present a wide range of perspectives with the intent of fostering well-informed dialogue on policies and issues critical to human development and the longer-range future.
Produced by Boston University Creative Services © 2010 Trustees of Boston University
ISBN 978-0-9825683-7-8
Printed on recycled paper
1010 039415
Selected Pardee Center Publications
Issues in Brief series
Call for a Corporate Social Conscience IndexStephanie Watts (No. 16), September 2010
Mapping the Complexity of Higher Education in the Developing WorldMuhammad Hamid Zaman, Adil Najam, and David K. Campbell (No. 15), May 2010
Diplomacy Is Stalling: How the G20 Can Catch Up with the WorldAmbassador Paul Webster Hare (No. 14), April 2010
Beyond the Resource Curse: Minerals and Global DevelopmentSaleem H. Ali (No. 12), January 2010
Transportation in Mega-Cities: A Local Issue, A Global QuestionNadaa Taiyab (No. 4), November 2008
The Pardee Papers series
Coffee, Culture, and Intellectual Property: Lessons for Africa from the Ethiopian Fine Coffee Initiative
Heran Sereke-Brhan (No. 11), July 2010
Narcotics Trafficking in West Africa: A Governance ChallengePeter L. McGuire (No. 9), March 2010
Community Targeting for Poverty Reduction: Lessons from Developing CountriesMoeed Yusuf (No. 8), February 2010
Linking Climate Knowledge and Decisions: Humanitarian ChallengesPablo Suarez (No. 7), December 2009
Managing Hazardous Chemicals: Longer-Range ChallengesHenrik Selin (No. 5), March 2009

Sustainable Development Insights
Global Environmental Governance: The Challenge of AccountabilityAdil Najam and Mark Halle (No. 5), May 2010
The Role of Cities in Sustainable DevelopmentDavid Satterthwaite (No. 4), May 2010
Are Women the Key to Sustainable Development?Candice Stevens (No. 3), April 2010
Rio + 20: Another World Summit?Miquel Muñoz and Adil Najam (No. 2), November 2009
Pushing “Reset” on Sustainable DevelopmentAlan AtKisson (No. 1), October 2009
Other Publications
The Future of North American Trade Policy: Lessons from NAFTAPardee Center Task Force Report, November 2009
For a complete list and PDF versions of publications by the Frederick S. Pardee Center for the Study of the Longer-Range Future, visit www.bu.edu/pardee/publications.
Energy TransitionsPeter A. O’Connor
Abstract
Over the past two hundred years, developed countries including the United States have seen many significant changes in patterns of energy use. These changes encom-pass the fuels and technologies employed, the services provided, and the environ-mental impacts caused. Future energy transitions will be driven by the demands of development combined with the constraints posed by climate change and energy supplies. Experience suggests that the provision of energy services is not dependent on any one fuel or technology. The history of energy transitions is replete with innovation in the face of scarcity or other limitations. This innovation is made possible largely by the converters, the energy technologies that can offer extremely substantial improvements in the quantity or quality of energy services provided. These converters are generally flexible in the fuels that can be used, and in many cases offer significant efficiency improvements.
This analysis examines the history of energy transitions in developed countries, primarily the United States, to identify lessons for future energy transitions that are likely to occur or are occurring in developing countries. The analysis focuses not on high-level policy decisions or actions of major stakeholders, but on the provision of energy services to the population, such as heating, cooling, lighting, mechanical power, and information. Factors that led to the replacement of one fuel by another, or one converter by another, are discussed, as are the overall market conditions that lend themselves to energy transitions. The analysis also explores instances in which promising new technologies did not spark an energy transition, or in which a resource that appeared to be on its way out found new life.
This research was supported by the Pardee Center Summer Graduate Fellows program. Sup-port for continuing research is provided through the Mellon Foundation under the Energy Transitions and Society project. Special thanks to Cutler Cleveland and Adil Najam for their guidance and support, and to Miquel Muñoz and Cynthia Barakatt for editorial assistance.
2 The Pardee Papers | No. 12 | November 2010
GlOSSARy
Carbon Constraints: Limitations on carbon-based fossil fuels imposed by countries in response to climate change protocols. At the present, neither the United States nor any developing country is subject to binding carbon constraints.
Depletion: Economically significant reductions in the available amount of a resource resulting from use of that resource.
energy Carrier: A form of energy supplied to an energy converter. Natural gas (an energy carrier) is transported to a power plant (a converter), turned into electricity (a carrier), and transported to a home, where it may be converted into light through a lightbulb (a converter).
energy Converter: A device that transforms one energy carrier into another, or into an energy service.
energy Resource: A form of energy that can be extracted from the environment and placed into useful service in the economy. Fossil fuels, sunlight, wind currents, and uranium represent energy resources. Electricity and hydrogen are energy carriers, not resources.
energy Return on Investment (eROI): The energy contained in an energy carrier divided by the energy required to produce it. If the EROI is greater than 1, the energy carrier can be considered as a resource (such as coal taken from a mine). If less than 1, then the energy form is only useful as a carrier (such as electricity from a power plant).
energy Service: The forms of energy demanded by consumers and industry. These generally include (but are not limited to) heating, cooling, lighting, mechanical power, and information.
Mechanical Power: The energy service provided by motors and engines for transporta-tion and other physical manipulation of materials.
energy Transition: A particularly significant set of changes to the patterns of energy use in a society, potentially affecting resources, carriers, converters, and services.
Fossil Fuels: Energy resources derived from organic matter that has been substan-tially changed by geologic processes. The major fossil fuels include coal, petroleum, and natural gas. Minor ones include peat and shale.
hydrocarbons: Organic compounds consisting of carbon and hydrogen. Hydro-carbons include petroleum and natural gas.
Share: The fraction of an overall quantity provided by a specified category. For example, wind’s share of electricity generation is the amount of wind generation divided by the total amount of electricity generation. Lighting’s share of energy demand is lighting energy demand divided by total energy demand.
Energy Transitions 3
INTRODUCTION
Energy consumption in the United States shifted from 70 percent wood in 1870, to 70 percent coal in 1900, to 70 percent oil and gas in 1960. These changes were accompanied by changes in energy technologies and in the provision of energy services such as heating, cooling, lighting, and mechanical power. This analysis examines historical energy transitions, focusing on how energy resources and technologies emerged to meet the changing demands for energy services in the U.S. From this history, we hope to identify insights into future energy transitions, especially in developing countries.
The first practical steam engine was invented by Thomas Newcomen nearly 300 years ago. This was one of a long series of human innovations in energy conversion, following on the waterwheel, windmill, oil lamp, and other devices going back to the harnessing of fire. The pace and nature of energy innovations in the following centuries led to dramatic transforma-tions in human life and economy, as well as major environmental impacts. In the 19th century, a number of agrarian economies dependent on wood and animal power became industrial economies driven by coal and the steam engine. In the 20th century, many economies underwent another transformation, relying on a variety of fuels in internal combustion engines and electricity generators. As the demand for energy services has changed, so have the fuels and conversion technologies employed to meet those demands. As populations have risen and economic activity has expanded, energy consumption has increased, primarily through the use of fossil fuels.
Faced with the challenges of climate change, limits on fossil fuel resources, and the prospects of development, it is reasonable to conclude that some other sort of energy transition must occur. No analysis suggests that there is enough petroleum, even with unconventional resources, for develop-ing countries to build and maintain economies and transportation systems similar to those of the United States. Indeed, even the present demand for petroleum may prove difficult to sustain. Alternative forms of transporta-tion fuel will be needed. As countries respond to climate change, carbon emissions will be an increasingly important consideration in the selection of resources to meet the demand for transportation, heating, cooling, lighting, and other needs.
4 The Pardee Papers | No. 12 | November 2010
Technological innovation is a major driver in energy transitions, though it is not the only one. As Scientific American noted in December 1890, in an article about the first wind turbine:
It is difficult to estimate the effect of an invention on existing practices and industries. Occasionally a new invention will appear which will greatly affect a whole range of allied inventions and industries in such a way as to entirely change time-honored cus-toms, inaugurate new practices and establish new arts.
–“Mr. Brush’s Windmill,” Scientific American, December 20, 1890.
And yet even the technologies with the greatest transformational ability do not change the system overnight, or in the same way in all situations. The technology must be coupled with demand and with decisions by policymak-ers and consumers. Political, economic, cultural, and geographic factors shape the demand for energy services and the selection of technologies to provide those services.
Importance of energy
Improving access to energy services is seen as a critical component for improving quality of life in developing countries, particularly among the poorest (WSSD 2002; Townsend 2000, 8). A report of the United Nations Development Programme (UNDP) notes, “…adequate energy services are integral to poverty alleviation and environmentally sound social and eco-nomic development…” (Johannson and Goldemberg 2002, 1). Developing countries are not without energy. Residents buy kerosene for lighting and dry cell batteries for various applications, and may spend considerable time collecting biomass. Surveys of willingness-to-pay, as well as pilot projects for commercial energy programs, find that a market exists, but that “in too many cases the poor simply do not have the choice of consuming commer-cial energy” (Townsend 2000, 12).
Energy is crucially important for all three pillars of sustainable develop-ment—social, economic, and environmental well-being. Energy for lighting and transportation supports networks that connect people and societies. Energy for heating, cooling, and refrigeration enables human comfort and health. Energy for industrial and consumer uses creates economic activity.
Energy Transitions 5
Properly applied, energy technologies can be used to mitigate environmen-tal problems; used carelessly, they can create problems of their own. We are therefore most interested in developing forms and patterns of energy use that can advance social and economic well-being while, at least, not com-promising the environment.
history as a Guide
Some patterns of energy use in developing countries resemble those of earlier eras in developed countries such as the United States. The U.S. used kerosene for lighting, non-commercial biomass followed by coal for domes-tic heating and cooking, and animal power for agriculture. Not all of the conditions are the same; however, there are enough similarities that the U.S. experience is illustrative. For example, kerosene lamps and non-commercial biomass carry low capital cost, do not require sophisticated manufacturing facilities, and do not require extensive infrastructure.
Similarly, a limited electric utility infrastructure led to the use of stand-alone renewable energy systems in the U.S. prior to grid extension, as is seen today in countries such as Kenya. In the course of economic development, patterns of energy use changed. To what extent can we use developed countries as a point of reference? How can the experience of the U.S. and other countries show what we might expect to happen in a predictive sense, and what we might like to happen in a prescrip-tive sense, to support economic and human development in developing countries? Some of this analysis considers other developed countries, such as the United Kingdom. However, the primary focus is on the United States because data on U.S. energy consumption is copious and readily available.
Demand for energy services is similar, though not identical, in all countries. Everybody needs heat for cooking food, and most climates need some space heating and cooling. Agriculture and industry require mechanical power. With high literacy and access to reading materials, people need light. If there are broadcast systems, people generally want television and radio, and refrigeration enables preservation of food and medical supplies. But the conditions of each country are different. Climate, culture, and infrastructure
6 The Pardee Papers | No. 12 | November 2010
affect the demand for heating, air conditioning, and transportation. Local resources will influence the forms of industry and agriculture employed.
The United States developed its patterns of energy use based on abundant low-cost energy sources. English settlers found firewood in an abundance unknown in their home country, and used it for domestic heating, iron smelting, and early steam engines. The country turned out to be enor-mously wealthy in coal, oil, natural gas, and hydropower. The U.S. made
decisions based on this abun-dance, with sprawling suburbs, limited public transportation, and large, well-lit and well-cooled commercial buildings. The United States uses more energy per capita than most other devel-oped countries, as well as more energy per unit of gross domestic product (GDP). Fortunately for
the U.S., the country is also enormously wealthy in wind, solar, and biomass energy resources, so it has the potential to transform its system into a much lower-carbon one in the future. The U.S. system was developed before the health effects of air pollution were well-understood, and before climate change was recognized as a matter of concern. A system built on abundance and on the ignorance of adverse consequences is not a model for emulation.
Several factors affecting historical changes in U.S. energy use are very likely to recur in developing countries. First, as incomes rise, energy users will place a higher value on their time and will choose energy resources with lower associated labor costs. For example, as in the U.S., they will switch away from non-commercial biomass for domestic use, because of the labor required to utilize that resource. Second, demand for energy services will continue to grow, and commercial energy providers will increasingly seek out these markets. Third, if economic and political stability allow, investors will develop infrastructure, which has historically been a necessity for energy transitions. Wood required nothing but an ax; coal required mines, canals, and railroads; oil required wells, tanker trucks, pipelines, and refineries; gas
The U.S. system was developed before the health effects of air pollution were well-understood, and before climate change was recognized as a matter of concern. A system built on abundance and on the ignorance of adverse conse-quences is not a model for emulation.
Energy Transitions 7
required wells and higher-technology pipelines; electricity required genera-tors and an intricate grid. These investments were often undertaken by companies seeking to bring their product to market, or by other investors, though government assistance was common. Developing such a project requires the investors to believe they have a reasonable chance to recoup their investment.
Two factors not present in the historical shifts in U.S. energy use also seem likely to affect patterns of energy use in developing countries. First, constraints on emissions of greenhouse gases may alter the economics of fuel selection and, in the long term, seriously constrain the use of fossil fuels. Second, limits to petroleum supply growth may affect the design of transportation systems well before a system is developed to be heavily reliant on this fuel.
Carbon Constraints and Peak Oil
This analysis considers future energy transitions most likely to take place under constraints on emissions of carbon dioxide. In the United Nations Framework Convention on Climate Change (UNFCCC), countries com-mitted to stabilize atmospheric greenhouse gas concentrations “at a level that would prevent dangerous anthropogenic interference with the climate system” (UNFCCC 1992). This requires limiting emissions of greenhouse gases such as carbon dioxide. Energy conversion is the primary source of anthropogenic greenhouse gas emissions. The low-carbon fuels that are required to meet carbon constraints generally carry a cost premium over higher-carbon fuels.
This analysis contends that:
1) Carbon constraints will require some use of lower-carbon fuels, both in developed and developing countries;
2) These fuels do carry, in the near term, a higher cost; and,
3) This increase in cost will not be so deleterious as to cause a net decrease in quality of life over present conditions. Advanced energy technologies will enable vast improvement over the present qual-ity of life even if countries must use fuels that are not the absolute least-cost option.
8 The Pardee Papers | No. 12 | November 2010
Limits on high-carbon fuels resulting from climate change regulation are fundamentally not that different from limits imposed by domestic policy, depletion, or any other cause. The Industrial Revolution in the U.S. con-tinued to thrive after economic factors forced a change from the first fuel of choice (wood) to the second (coal). Electricity improved quality of life even in states and countries that were forced to use expensive oil-fired generators. Cars were used even in countries that could not import petroleum.
The same holds true for other limitations on fuels, such as peak oil. There is not enough oil in the world for every country to develop a transportation system based on automobile travel of 10,000 vehicle-miles per capita per year (FHA 2008) and 25-mpg automobiles. If a global population of 6.8 billion were to use petroleum at the per-capita rate of the U.S., oil con-sumption would be 450 million barrels per day, rather than the 86 million it is now. Even optimistic estimates of remaining reserves of two trillion barrels could only meet this demand for about 12 years.
WhAT IS AN eNeRGy TRANSITION?
Changes in the patterns of energy use take many forms. Energy resources include fossil fuels such as coal, oil, and natural gas, and renewable energy flows such as wind and solar energy. These are turned into energy carri-ers, such as electricity or gasoline. The carriers are then supplied to energy converters, such as a compact fluorescent lightbulb or an automobile, and ultimately used to provide energy services such as lighting or transportation.1 An energy transition—a particularly significant set of changes to the patterns of energy use in a society—can affect any step in this chain, and will often affect multiple steps.
Two commonly cited energy transitions are major shifts in the energy resources used in the U.S. economy. Wood was the dominant fuel for many decades, until it was overtaken by coal around 1884. Coal was overtaken by the hydrocarbons (oil and gas) around 1946. Wood, coal, and hydrocarbons
1. The generator that turns energy resources into electricity is also an energy converter, although its output is an energy carrier rather than an energy service. When considering electricity, the sequence might be resource (e.g., coal)gconverter (generator)gcarrier (electricity)gconverter (motor)gservice (mechanical power).
Energy Transitions 9
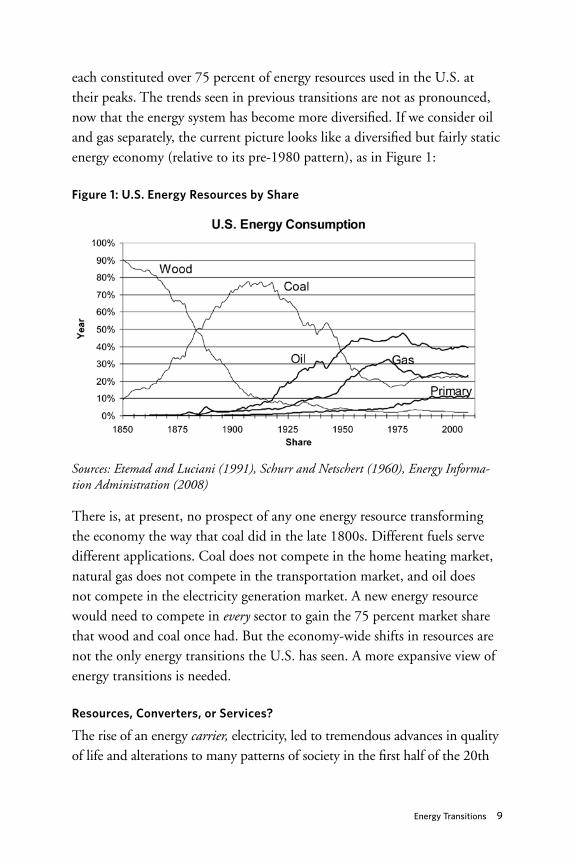
each constituted over 75 percent of energy resources used in the U.S. at their peaks. The trends seen in previous transitions are not as pronounced, now that the energy system has become more diversified. If we consider oil and gas separately, the current picture looks like a diversified but fairly static energy economy (relative to its pre-1980 pattern), as in Figure 1:
Figure 1: U.S. energy Resources by Share
Sources: Etemad and Luciani (1991), Schurr and Netschert (1960), Energy Informa-tion Administration (2008)
There is, at present, no prospect of any one energy resource transforming the economy the way that coal did in the late 1800s. Different fuels serve different applications. Coal does not compete in the home heating market, natural gas does not compete in the transportation market, and oil does not compete in the electricity generation market. A new energy resource would need to compete in every sector to gain the 75 percent market share that wood and coal once had. But the economy-wide shifts in resources are not the only energy transitions the U.S. has seen. A more expansive view of energy transitions is needed.
Resources, Converters, or Services?
The rise of an energy carrier, electricity, led to tremendous advances in quality of life and alterations to many patterns of society in the first half of the 20th
10 The Pardee Papers | No. 12 | November 2010
century. A graph of energy resources will not directly capture this, as electric-ity can be made from basically any energy resource. Further “downstream,” the rise of two related energy services, refrigeration and air conditioning, also transformed society. These services were associated with electricity, although not entirely dependent on it. To use an earlier example, the rising demand for lighting, as documented by Fouquet and Pearson (2006), transformed society and led to a millennium-long search for new energy resources and new energy converters. Lighting was particularly valuable and its share of energy expen-ditures (in monetary terms) could far outweigh its share of energy consump-tion (in energy units). And the steam engine, the energy converter that led to the Industrial Revolution, found its initial uses in a country already heavily reliant on coal. The transformation of that society caused by the steam engine would not show up as dramatically if one merely graphed the share of coal in the energy system, since coal was already dominant. By 1700, England was “already getting far more energy from coal than it could possibly have obtained from its woodlands” (Freese 2004, 56).
If the hallmark of an energy transition is a significant impact on society, quality of life, and the economy, then changes in resources, carriers, services, or converters can constitute an energy transition. We then have “energy resource transitions,” “energy carrier transitions,” “energy service transi-tions,” and “energy converter transitions.” These transitions are connected. A change in the demand for an energy service usually causes changes in the energy converters used. The invention of a new energy converter sometimes opens up opportunities for expanded use of an energy resource, as the inter-nal combustion engine did for petroleum. Improvements in the battery, an energy carrier, have affected energy resources (expanding utilization of solar power), energy converters (supporting the use of electric cars), and energy services (particularly information, as with cell phones).
If we consider energy transitions in the context of global warming, “energy resource transitions” are most important. For the most part, the selection of energy converters does not determine greenhouse gas emissions.2 Depend-
2. If successful, carbon capture and sequestration (CCS) would be a technology applied to the converter that can decouple the emissions from the fuel. CCS would make the converter, and not the fuel, determine emissions.
Energy Transitions 1 1
ing on the energy resources used, the electricity generator and the automo-bile can have high emissions or none at all. Similarly, knowing the energy services demanded does not give a clear picture of emissions, since most ser-vices can be provided through high-carbon or low-carbon pathways. From a climate perspective, we care about the resources used. However, “from the point of view of the user, what matters is the energy service not the source” (Modi et al. 2005). How can this dilemma be resolved?
energy converters have a greater impact on the services provided than do
energy resources. New energy converters can offer large improvements in the amount and/or quality of energy services delivered. New converters may allow time savings or operational improvements, which are typically much more important than cost differences in fuels and systems. The energy resource to be used for a given converter is chosen for economic reasons, but typically has a relatively minor impact on the quality of energy ser-vices delivered. Changing from a whale oil lamp to a kerosene lamp will improve the bright-ness of the light and reduce the cost of lighting, but not to the same degree as changing from an oil lamp to an incandescent lightbulb. The incandescent bulb can be brighter, can be adjusted easier, doesn’t produce smoke, is less of a fire hazard, and can be used in large quantities indoors. Changing a wood-fired steam locomotive to coal and then to fuel oil doesn’t improve perfor-mance, efficiency, or power-to-weight ratios as much as changing that steam engine to a diesel-electric engine. Changing an industrial steam engine to an electric motor offers a much greater benefit than changing the fuels used for generating the steam or electricity.
This is not to say that energy resources are irrelevant. Low-cost fuels enable a much higher level of energy use, whether in oil lamps, power plants, or automobiles. Low-cost fuels also lead to the creation of a system depen-dent on high levels of energy use. Fuels also have inherent qualities that do impart operational effects. The lower energy density of ethanol means that
New converters may allow time sav-ings or operational improvements, which are typically much more impor-tant than cost differences in fuels and systems.
12 The Pardee Papers | No. 12 | November 2010
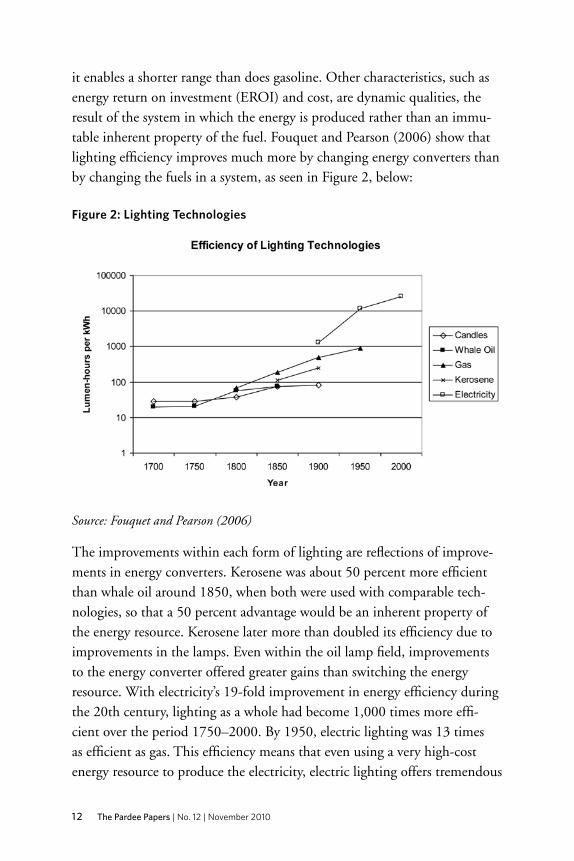
it enables a shorter range than does gasoline. Other characteristics, such as energy return on investment (EROI) and cost, are dynamic qualities, the result of the system in which the energy is produced rather than an immu-table inherent property of the fuel. Fouquet and Pearson (2006) show that lighting efficiency improves much more by changing energy converters than by changing the fuels in a system, as seen in Figure 2, below:
Figure 2: lighting Technologies
Source: Fouquet and Pearson (2006)
The improvements within each form of lighting are reflections of improve-ments in energy converters. Kerosene was about 50 percent more efficient than whale oil around 1850, when both were used with comparable tech-nologies, so that a 50 percent advantage would be an inherent property of the energy resource. Kerosene later more than doubled its efficiency due to improvements in the lamps. Even within the oil lamp field, improvements to the energy converter offered greater gains than switching the energy resource. With electricity’s 19-fold improvement in energy efficiency during the 20th century, lighting as a whole had become 1,000 times more effi-cient over the period 1750–2000. By 1950, electric lighting was 13 times as efficient as gas. This efficiency means that even using a very high-cost energy resource to produce the electricity, electric lighting offers tremendous
Energy Transitions 13
economic advantages. For this reason, a market exists for photovoltaic light-ing systems in off-grid areas. The efficient energy converter, either a com-pact fluorescent light (CFL) or light-emitting diode (LED), allows a much higher-cost energy resource (solar electricity) to compete with lower-cost energy resources (kerosene in lamps).
energy converters are flexible and powerful. The introduction of a new energy converter can offer improvements of an order of magnitude in energy ser-vices delivered, or can open up entirely new energy services that could not be provided before. The performance advantages can be tremendous, as are the efficiency gains. By comparison, the selection of a particular fuel is often of lesser importance. Take away coal, and the steam engine of the 19th cen-tury would (and did) run on wood, while the electricity generators of today would run on the many other options in use. Take away gasoline, and the automobile would run on ethanol, biodiesel, or coal-derived liquids. In each case, a change in fuels would have altered the patterns of usage. Alternative fuels would face a steeper cost curve, which would in turn reduce demand. Perhaps, facing a higher cost in fuels, cars would be smaller, lighter-weight, and less powerful; hybrids might have been commercialized earlier; urban planning might have placed a greater focus on density and mass transit. Alternative fuels would not be inherently unusable, though they would require somewhat different systems. The substitution of a different fuel has an impact, though not as great as the introduction of the new energy converter.3
Electricity takes this versatility to another level. The electric generator enables the use of resources that are nearly obsolete as direct energy sources. High-income countries use coal, peat, biomass, water power, and wind for electricity generation when they have largely stopped using them directly for heat or mechanical work. Some non-monetized characteristics are consid-ered, such as emissions and domestic supply, but selection of fuels is primar-ily based on cost. Higher-cost resources are not inherently unusable; they simply have a different cost curve. The advantages of electricity are so great that even when regions must resort to higher-cost resources, such as diesel
3. Takács-Sánta (2004) notes, “it is likely that in the beginning technological changes—especially the spectacular increase in the reliability of the new prime movers, steam engines in the second half of the 18th century — played a more important role in industrialization than coal itself.” Takács-Sánta does note the importance of fossil fuels in enabling the growth and extent of the late Industrial Revolution.
14 The Pardee Papers | No. 12 | November 2010
generators or petroleum-fueled power plants on islands, electricity still offers tremendous improvements to quality of life relative to not having electricity.
The experience of the electric industry augurs well for a low-carbon future. Even if low-carbon fuels were to cost twice as much as high-carbon ones,4 the advantages gained by changing energy converters is so substantial that countries will see a net benefit. Numerous examples exist. Not every industrialized country has abundant supplies of coal and/or hydropower
for electricity generation. Power production costs in some coun-tries are double what they are in others, or even more. And yet, all of these countries did develop electricity systems and advance their standard of living. Some, such as Japan, used imported energy resources. Others used whatever they had, such as shale in Estonia or peat in Ireland.
Internationally, industrial electricity prices in 2006 varied by about an order of magnitude from the least expensive major country (South Africa at around 2¢ per kilowatt-hour, or kWh) to the most (Italy at around 21¢/kWh) (IEA 2008). The mere fact that low-carbon energy resources are not the cheapest option does not mean that requiring their use would consign developing nations to poverty.
The transportation system does not have quite the same level of demon-strated flexibility, though experience offers hope for dealing with constraints on petroleum, whether caused by carbon policy or by supply limitations. Ethanol in Brazil, or coal-derived liquids in South Africa, suggest that petroleum is not absolutely indispensible for the automobile. The emerging
4. For reference, EIA (2010) projects the levelized per-kWh cost of wind power in the U.S. to be, by 2016, 50 percent more expensive than non-CCS conventional coal plants, and about 90 percent more expensive than the cheapest fossil-fuel power. Photovoltaic power is projected to be more expensive, at about five times the price of the cheapest fossil-fuel power, but with net metering it is appropriately compared to the retail price of electricity, not the generation cost. For other countries, the results of a similar analysis could be significantly different.
Not every industrialized country has abundant supplies of coal and/or hydro-power for electricity generation. Power production costs in some countries are double what they are in others, or even more. And yet, all of these countries did develop electricity systems and advance their standard of living.
Energy Transitions 15
plug-in hybrids partially decouple the energy service (transportation) from a particular energy resource (petroleum).
Big transitions are the sum of many small ones. Looking at overall energy consumption will miss the small-scale changes that are the foundation of the transitions. Various energy resources found ways to meet many grow-ing energy demands. Oil lost the lighting market to electricity, and the home heating market to electricity and gas, but captured the transportation market. Coal lost the transportation and home heating markets, but hung on to a dominant share of the fast-growing electricity market. Electricity lost the transportation market, but capitalized on lighting, cooling, informa-tion, and mechanical power. The “minor transitions” within the provision of particular energy demands created the “major transitions” seen.
DRIVeRS OF eNeRGy TRANSITIONS
Demand for energy services is an essential precondition for an energy transition. The existence of an energy resource, or invention of an energy converter, only alters the pattern of energy use to the extent that it can meet a demand for energy services. Changes in energy services demanded might or might not change the energy converters and resources used. A Philadelphia home over the period 1850–1900 might have met an expanding demand for illumination by shifting from coal oil in a lamp to coal gas in a gas light to coal-produced electricity in a lightbulb, using the same resource but changing the converters. A frontier home might have seen the same basic lamp run on lard oil, then coal oil, then kerosene over that time, changing the resource but not the converter. Some improvement in brightness would be seen in the frontier home, but not as much as in the city home. Changes in energy converters offer performance advantages that changes in energy resources cannot match. As a result, most of the transitions in energy services involve changes in converters. The resources used do not necessarily change.
Changes in energy converters offer performance advantages that changes in energy resources cannot match. As a result, most of the transitions in energy services involve changes in converters. The resources used do not necessarily change.
16 The Pardee Papers | No. 12 | November 2010
Why an energy Option Succeeds
Suppose that we have the conditions for an energy transition. Consumer demand for an energy service is growing, and competing resources and technologies aim to fulfill this demand. Why will certain combinations of resources and converters emerge victorious? Competition between energy options—whether between different resources to power a converter, or different converters to provide a service—can be resolved by the following factors:
• Supply constraints occur when a resource cannot be expanded to keep up with demand. In some cases a finite level can be sustained at low cost, but expansion is cost prohibitive, and a relative decline in share is seen. In others, maintaining a fixed level leads to rising prices, as when a resource is being depleted, and an absolute decline is seen. Supply constraints are often exposed in a period of demand growth.
Examples of supply constraints in energy transitions include the following:
{ The decline of hydroelectricity’s share of generation in the U.S. since 1949;
{The decline of whale oil after 1846 despite rising prices;
{The replacement of firewood with coal in the UK; and,
{ The limited utilization of geothermal energy (like hydropower, low-cost at a low level, but unable to economically expand very much).
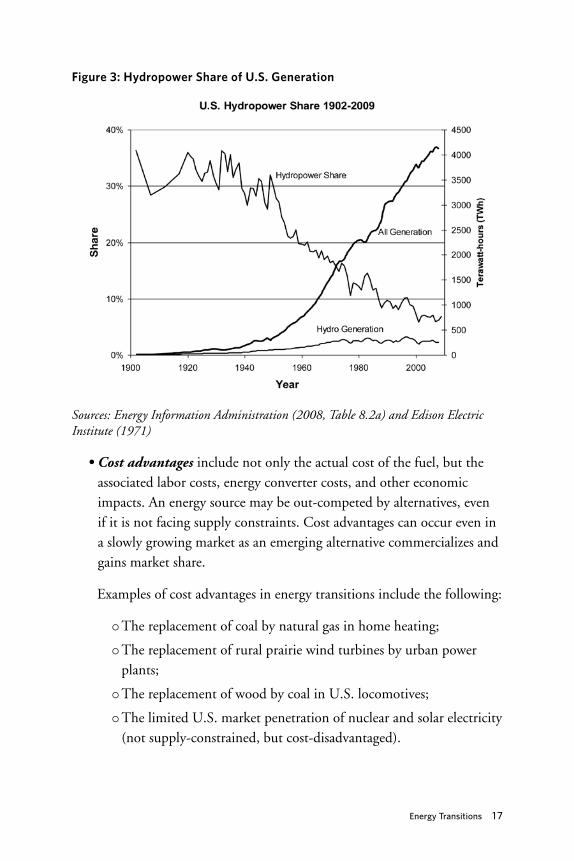
Hydropower in the U.S. in the 1950s and 1960s was low-cost where suit-able sites existed, and it continued to expand, but was unable to expand as quickly as fossil-fueled alternatives. In 1949, hydropower provided 32 percent of U.S. electricity, in the same range as it had been since 1902. Over the next 25 years, hydroelectricity continued to expand, tripling in absolute terms, but its share fell to 16 percent, as overall electricity genera-tion increased twice as fast. It has since maintained a roughly constant level, while electricity has continued to rise. Figure 3 illustrates this progression.
Energy Transitions 17
Figure 3: hydropower Share of U.S. Generation
Sources: Energy Information Administration (2008, Table 8.2a) and Edison Electric Institute (1971)
• Cost advantages include not only the actual cost of the fuel, but the associated labor costs, energy converter costs, and other economic impacts. An energy source may be out-competed by alternatives, even if it is not facing supply constraints. Cost advantages can occur even in a slowly growing market as an emerging alternative commercializes and gains market share.
Examples of cost advantages in energy transitions include the following:
{The replacement of coal by natural gas in home heating;
{ The replacement of rural prairie wind turbines by urban power plants;
{The replacement of wood by coal in U.S. locomotives;
{ The limited U.S. market penetration of nuclear and solar electricity (not supply-constrained, but cost-disadvantaged).
18 The Pardee Papers | No. 12 | November 2010
Wood was the fuel of choice for locomotives in the first few decades of American railroads. It was abundant, available from land cleared for agri-culture, and easy to burn. The shift to coal was a consequence of increasing wood prices (reflecting growing scarcity of wood near urban areas and major lines) and decreasing coal prices as the coal industry grew. Coal prices fell from the range of $7 to $10/ton in the 1830s to $3/ton in the 1850s, as low as $0.75/ton in some places in 1862. White notes, “It was this decline in coal prices, rather than the dramatic increase in wood prices, that brought about the great conversion in locomotive fuel (White 1979, 87).
• Performance advantages include all benefits not normally evaluated in terms of resource price, from speed and acceleration to safety and clean-liness. These are a subset of cost advantages, and certainly do have an implicit value demonstrated by consumer behavior, though the qualities are in many cases not explicitly valued. They can result from a new fuel, but often are tied to developments in energy converters.
Examples of performance advantages in energy include the following:
{ Early adoption of electric lighting, even where it was nominally more costly;
{ The progression in naval vessels from wind to coal-driven steam engines to oil-driven steam turbines (Yergin 2009, 139; Eberhart 2007, 186);
{The replacement of iceboxes by refrigerators;
{The replacement of trolleys and streetcars by the automobile; and,
{Selection of a higher-power engine when buying a car.
Selection of a high-performance option is seen in luxury goods, where consumer preferences justify paying a higher price, or in military expendi-tures such as naval propulsion. The early success of whale oil was due to its performance advantages over other lamp oils; it was cleaner-burning than lard oil, and safer than camphene. This justified a considerable premium in the marketplace.
Energy Transitions 19
What constitutes “performance” is highly dependent on individual prefer-ence. One consumer might be willing to pay more for a car with a powerful engine, while another might pay more for a car with very low emissions, and another might pay more for greater range. Culture influences individual preferences, although even in the most horsepower-minded city one can find a fan of high-efficiency hybrid automobiles.
• Policy decisions are important in energy consumption. Actions taken by governments affecting energy supply include tariffs, subsidies, codes, regulations, infrastructure development, and other measures. Cultural preferences often influence policy decisions.
Examples of policy decisions affecting energy transitions include the following:
{Public works projects creating hydropower dams;
{OPEC supply decisions, particularly the 1973 and 1979 price shocks;
{Land grants to expand railroad development; and,
{Subsidies for various energy technologies.
Governments have invested in infrastructure from irrigation systems in Mesopotamia to roads in the Roman Empire to airports in the U.S. Trans-portation infrastructure is particularly important for energy use. Many energy resources need transportation; in the U.S., coal is often shipped on railroads. Infrastructure also influences transportation energy use. Railroads, canals, and light rail systems carry a considerable capital cost, but can allow movement of people and goods with very low energy requirements.
New energy technologies can try to compete on cost or on performance. In the absence of a price on emissions, cleaner energy options emerge through performance advantages or policy decisions. With a price on emissions (a policy decision), environmental costs are internalized and energy technolo-gies compete on cost.
20 The Pardee Papers | No. 12 | November 2010
environmental Benefits as a Factor
Environmental benefits as “performance advantages,” or factors in consumer decisions that are not explicitly given an economic value, have factored into energy transitions within certain applications. The volatile compound emissions associated with bituminous coal were a reason for delay in that fuel’s acceptance,5 and led to cleaner anthracite being the preferred fuel for household heating, followed by the still cleaner natural gas. However, one simple technology allows an energy user to externalize environmental draw-backs, shifting the bulk of the burden from the user to the community—the chimney. As a result, selection of one fuel over another on environmental grounds is often accomplished through policy.6
The environmental impacts from greenhouse gas emissions are distributed much more widely than the pollutant emissions from a household chimney. Rather than inconveniencing one’s immediate neighbors with a smoky fur-nace, an energy user creates a very minor but global impact. If the decision to shift to low-carbon energy use patterns were to be solely a result of envi-ronmental concern, then policy action would be the only way to enact such a shift. Fortunately, many low-carbon energy systems can provide benefits in cost, productivity, or in the quality of service provided, as detailed in Kats (2003). Even so, policy action can accelerate energy transitions (or, if inap-propriately applied, delay them).
eXAMPleS OF eNeRGy TRANSITIONS
The major economy-wide energy resource transitions of wood to coal, and coal to oil and gas, represent the cumulative impact of a number of smaller transi-tions in converters. These smaller transitions are shown in Table 1. Many tran-sitions include a change in both resources and converters. In those cases, the table highlights the more important factor; electric lights displaced kerosene lamps not because coal was superior to kerosene, but because the incandescent lightbulb was superior to the oil lamp. Growth in demand for energy services was a motivating factor in many of these transitions.
5. Freese (2004) notes that coal soot led to the abandoning of tapestries in interior decoration (p. 36), and that coal soot led to loss of color in the design of both locomotives and the uniforms of engineers (p. 123).6. For an example of such an instance, see Tarr (1981).
Energy Transitions 21
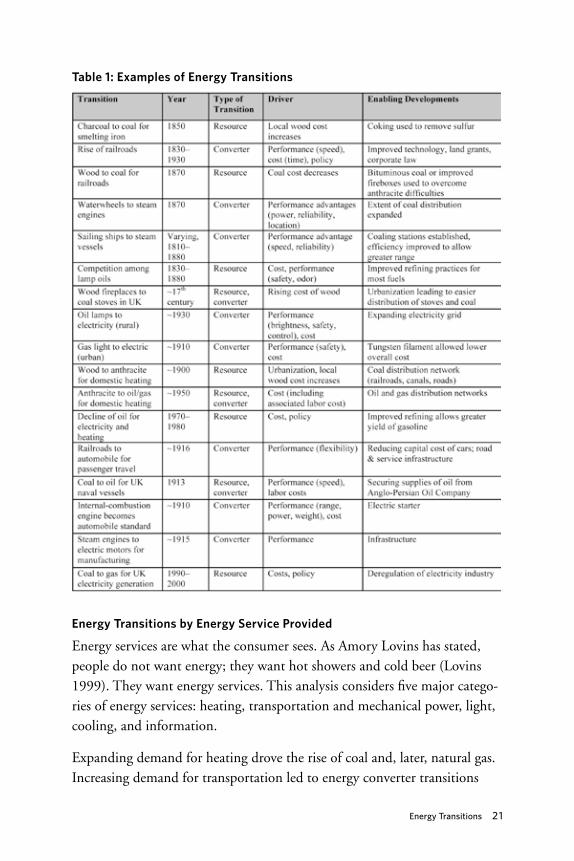
Table 1: examples of energy Transitions
energy Transitions by energy Service Provided
Energy services are what the consumer sees. As Amory Lovins has stated, people do not want energy; they want hot showers and cold beer (Lovins 1999). They want energy services. This analysis considers five major catego-ries of energy services: heating, transportation and mechanical power, light, cooling, and information.
Expanding demand for heating drove the rise of coal and, later, natural gas. Increasing demand for transportation led to energy converter transitions
22 The Pardee Papers | No. 12 | November 2010
from the sailing ship to the jet engine. Demands for cooling and informa-tion accelerated the rise of electricity. Labor-saving devices brought mechan-ical power from an agricultural or industrial application to a household one, with motors in appliances such as washing machines, coffee grinders, and power tools, largely using electricity. Growing demand for lighting drove the expansion of the candle and lamp industries in the 18th century, and numerous industries in the 19th and 20th centuries.
Rapidly growing markets offer good conditions for alternatives to emerge. First, a growing market offers the potential for better economic returns to investors. Second, in a growing market, incumbency advantages are often not as substantial. New heating fuels gained market share rapidly with the growth in home construction after the Second World War, as a new home would not have the “sunk cost” of a coal furnace. Electric motors took over from industrial steam engines by first winning the “new installations” mar-ket in the growing field of industrial machinery. Third, in a growing market, limitations of an existing energy technology or resource may emerge. Oil appears to be facing limits due to its supply (or at least the pace at which supply can be grown) and due to the environmental impact of its green-house gas emissions. Neither issue would have been a concern had con-sumption remained at lower levels, but with the rapidly growing demand for transportation, an opportunity exists for an alternative to emerge.
heating: Heating includes space heating, water heating, clothes drying, process heat, and heat for cooking. Heating demand is met by many energy resources. Biomass, coal, petroleum products, natural gas, peat, and geothermal and solar energy can provide heat directly. These resources, along with nuclear, wind, and hydropower, can also provide heating indirectly though electricity generation, or in some cases combined heat and power. Compared to other energy services, heat-ing energy consumption has not changed much in either the U.S. or the UK from the time of the Industrial Revolution. The U.S. in 1800 had a per-capita energy consumption of about 90 million British Thermal Units (BTU) (EIA 2008, 385), nearly all of it for household heating and cooking, and nearly all of it from wood (Schurr 1960, 49). Household heating in 2008 was under 40 million BTU per capita.7 Despite a considerable increase in living area per capita, a vast expansion
7. U.S. residential energy demand in 2008 was 6.778 quads of direct fuel use and 14.858 quads of indirect fuel use for electricity generation (EIA 2008, 41). Heating-related end uses represent nearly all
Energy Transitions 23
in personal income, and the introduction of heating services such as water heaters and clothes dryers, domestic heating energy demand per capita has declined by more than half. Even counting the commercial and industrial sectors, total U.S. demand for heating constitutes approximately 24 quads, or about 79 million BTU per capita.8 One million BTU is 1.055 gigajoules (GJ).
Energy demand in the UK was lower, at about 26 million BTU per capita in 1800, and again most of this would have been for heating and cooking. The energy was largely provided by coal, which would be burned in stoves with higher efficiency than the open fireplaces of the U.S. Coal had been used for domestic heating and cooking in the UK since the Middle Ages. There was more industrial demand in the UK than in the U.S., though this was still a small fraction of energy use in 1800.9 UK heating demand in 2007 was on the order of 44 million BTU per capita (UK BERR 2008),10 higher than in 1800, but not exceptionally so.
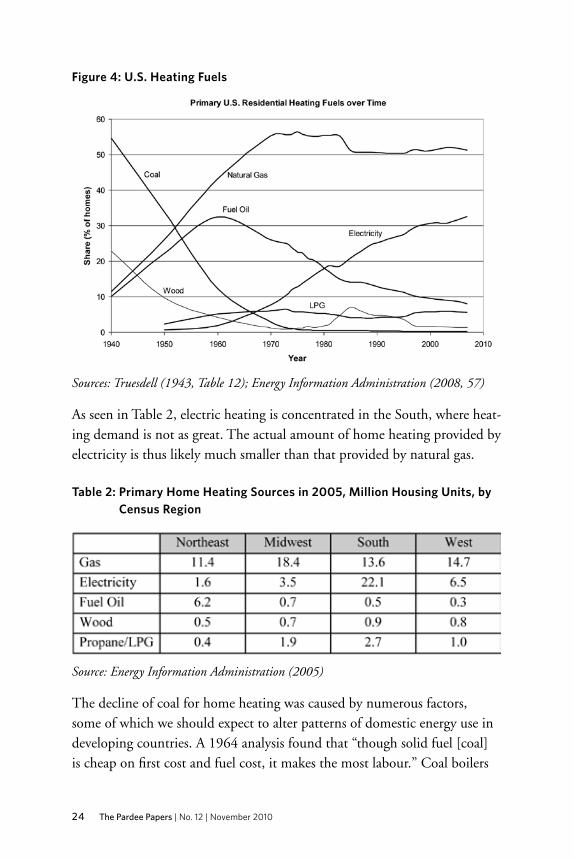
Firewood was abundant in the U.S., so it was used in preference to coal. Because fuel costs were minimal, fireplaces were used in preference to more efficient stoves, which carried a capital cost and a labor cost. As the population urban-ized, the cost of wood near cities rose, and coal entered into use as a heating fuel. Coal enjoyed a short period of dominance in U.S. domestic heating, from about 190011 until about 1940. Afterwards, it lost ground rapidly in favor of oil, natu-ral gas, and electricity. Oil’s rise was short-lived, peaking around 1960, at which time natural gas became the leading source of home heating. As of 2007, natural gas heated 51 percent of homes, with electricity heating 33 percent (EIA 2008). The evolution of domestic heating fuels is shown in Figure 4.
of the direct fuel use and approximately 1/3 of the electricity use (EIA 2001). This is a total of 11.73 quadrillion BTU, divided by a population of 304 million to give a figure of 39 million BTU per capita. Transportation use is a separate category.8. EIA, 2002, Table 5.2, results in 28 million BTU per capita from the industrial sector, and EIA, 2003, Tables E1A-E11A result in another 12 million BTU from the commercial sector.9. As late as 1850, iron production accounted for no more than 12 percent of UK coal use, and so it was likely lower in 1800 (Schurr 1960, 66). Steam engines accounted for about 10 percent of UK coal use in 1800 (Von Tunzelmann 1978).10. Non-electricity coal consumption was 10.3 million tonnes (~0.3 quads). Domestic, industrial, and miscellaneous petroleum consumption was 10.2 million tonnes (~0.4 quads). Domestic and industrial natural gas was 586.6 TWh (~2 quads). This is 44 million BTU per capita. Some industrial petroleum assumed to be heat may be for mechanical power, and some energy for electricity generation ultimately provides heat. 11. In energy units consumed, anthracite coal surpassed wood sometime between 1900 and 1905 (Schurr 1960, Table VII). As both were used primarily for domestic heating, the transition to coal can be placed around this time.
24 The Pardee Papers | No. 12 | November 2010
Figure 4: U.S. heating Fuels
Sources: Truesdell (1943, Table 12); Energy Information Administration (2008, 57)
As seen in Table 2, electric heating is concentrated in the South, where heat-ing demand is not as great. The actual amount of home heating provided by electricity is thus likely much smaller than that provided by natural gas.
Table 2: Primary home heating Sources in 2005, Million housing Units, by Census Region
Source: Energy Information Administration (2005)
The decline of coal for home heating was caused by numerous factors, some of which we should expect to alter patterns of domestic energy use in developing countries. A 1964 analysis found that “though solid fuel [coal] is cheap on first cost and fuel cost, it makes the most labour.” Coal boilers
Energy Transitions 25
require stoking and cleaning, storage and transport of the fuel, ash disposal, and chimney cleaning (Wright 1964). Therefore, when a homeowner’s value of time is greater, the operating cost of the coal boiler is higher. In some cit-ies, policy initiatives aimed at reducing air pollution served to encourage the use of alternative fuels such as natural gas (Tarr 1981).
lighting: Lighting was originally co-provided with heating, by a household fireplace. Increased demand for lighting was first met by improved technology for candle manufacturing and oil lamps. Nearly all lighting energy demand is now met by electricity in the developed world. Many rural areas in developing nations still use kerosene lanterns, which have higher costs and higher green-house gas emissions per unit of light provided than electric lighting.
From 1750 onwards, the UK saw rapid growth in lighting efficiency, light-ing demand, and GDP (Fouquet and Pearson 2006). Despite great progress in improving efficiency and reducing fuel costs, lighting expenditures took up a growing portion of GDP over time, rising from one percent in 1750 to 1.8 percent in 1800 and 2.2 percent in 1900. The willingness of consumers to spend a larger fraction of their GDP on lighting suggests that demand for lighting was growing—they were not just using more because it was cheaper.
Lamp fuels in the U.S. in the first half of the 19th century included fish oil, whale oil, lard oil, and camphene (a mixture of turpentine, alcohol, and camphor oil). Coal gas had been used in the U.S. since 1813 for street light-ing and in some wealthy homes (Schurr 1960, 97). In the second quarter of the 19th century, U.S. demand for lighting grew dramatically due to “a near doubling of the population, a growing urban population, an expanding fac-tory system, and the addition of some 9,000 miles of railroad” (Williamson and Daum 1959, 33). Relatively high literacy was another driving factor. A thriving periodicals industry led an observer in 1843 to state, “Such a diffusion of intelligence and information has never existed in any other country or age” (Tucker 1843, 149). A number of alternatives emerged. Camphene, introduced around 1830 (Williamson and Daum 1959, 33), gained a significant market share before it was effectively killed by a Civil War tax on alcohol (Bernton et al. 1982, 8). Whale oil production expanded rapidly from 1825 through 1846, tripling from about 4 million gallons to a
26 The Pardee Papers | No. 12 | November 2010
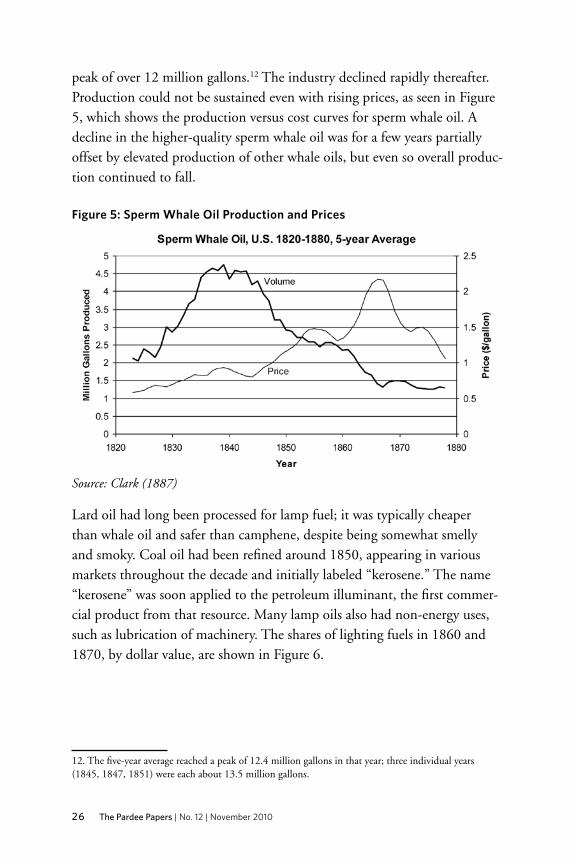
peak of over 12 million gallons.12 The industry declined rapidly thereafter. Production could not be sustained even with rising prices, as seen in Figure 5, which shows the production versus cost curves for sperm whale oil. A decline in the higher-quality sperm whale oil was for a few years partially offset by elevated production of other whale oils, but even so overall produc-tion continued to fall.
Figure 5: Sperm Whale Oil Production and Prices
Source: Clark (1887)
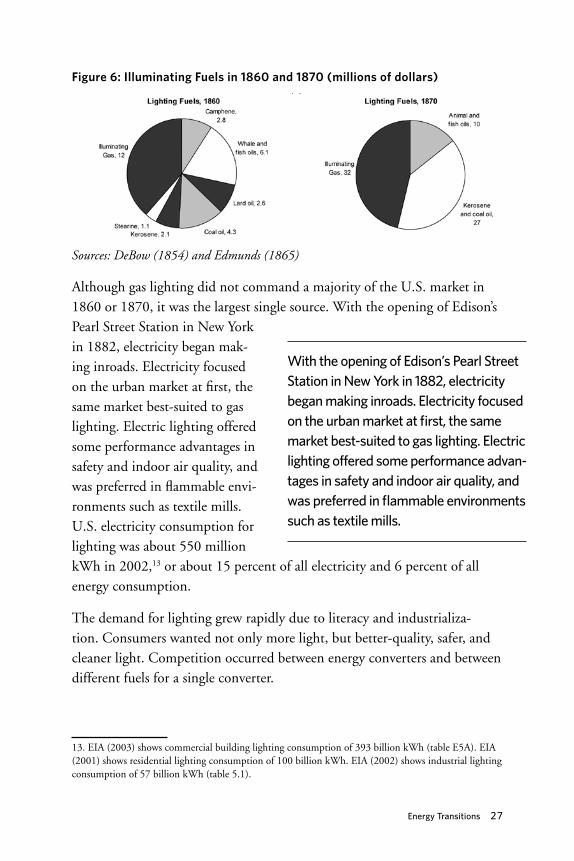
Lard oil had long been processed for lamp fuel; it was typically cheaper than whale oil and safer than camphene, despite being somewhat smelly and smoky. Coal oil had been refined around 1850, appearing in various markets throughout the decade and initially labeled “kerosene.” The name “kerosene” was soon applied to the petroleum illuminant, the first commer-cial product from that resource. Many lamp oils also had non-energy uses, such as lubrication of machinery. The shares of lighting fuels in 1860 and 1870, by dollar value, are shown in Figure 6.
12. The five-year average reached a peak of 12.4 million gallons in that year; three individual years (1845, 1847, 1851) were each about 13.5 million gallons.
Energy Transitions 27
Figure 6: Illuminating Fuels in 1860 and 1870 (millions of dollars)
Sources: DeBow (1854) and Edmunds (1865)
Although gas lighting did not command a majority of the U.S. market in 1860 or 1870, it was the largest single source. With the opening of Edison’s Pearl Street Station in New York in 1882, electricity began mak-ing inroads. Electricity focused on the urban market at first, the same market best-suited to gas lighting. Electric lighting offered some performance advantages in safety and indoor air quality, and was preferred in flammable envi-ronments such as textile mills. U.S. electricity consumption for lighting was about 550 million kWh in 2002,13 or about 15 percent of all electricity and 6 percent of all energy consumption.
The demand for lighting grew rapidly due to literacy and industrializa-tion. Consumers wanted not only more light, but better-quality, safer, and cleaner light. Competition occurred between energy converters and between different fuels for a single converter.
13. EIA (2003) shows commercial building lighting consumption of 393 billion kWh (table E5A). EIA (2001) shows residential lighting consumption of 100 billion kWh. EIA (2002) shows industrial lighting consumption of 57 billion kWh (table 5.1).
With the opening of Edison’s Pearl Street Station in New York in 1882, electricity began making inroads. Electricity focused on the urban market at first, the same market best-suited to gas lighting. Electric lighting offered some performance advan-tages in safety and indoor air quality, and was preferred in flammable environments such as textile mills.
28 The Pardee Papers | No. 12 | November 2010
Transportation and Mechanical Power: Animals provided mechanical power for thousands of years, plowing fields, transporting people and goods, and driving industrial operations such as mills. Farm animals provided over half of all work output in the U.S. in 1850 (Cook 1976, 63). Inanimate power has also long been harnessed for mechanical energy. Waterwheels and wind-mills ground grain or pumped water, and sailing ships harnessed hundreds of horsepower from the wind.
The Industrial Revolution saw massive increases in the application of motive power through the steam engine, for transportation and for industrial machinery. The steam engine became the dominant form of stationary power for industry in about 1870. Stationary steam engines were replaced by electric motors approximately 50 years after their rise to dominance (Schurr 1960, 187).14 Petroleum provided mechanical power to some non-transportation applications such as chainsaws, lawnmowers, and construction equipment.
As an energy service, demand for mechanical power rose to stand alongside the demand for heating. Within that application, the steam engine quickly became dominant. In the characterization of causes, this would be an example of “supply constraints” (waterwheels did not decline immediately, but did not expand as fast as steam) and “cost advantages” (for many appli-cations and locations, but not all, steam engines were the superior choice).
The steam engine offered economic advantages through flexibility in location, ability to expand operations, and reliability of power output. The selection of fuels for the steam engine was a matter of cost; coal was generally cheaper in the centers of industry than wood. The electric motor displaced the steam engine for many of the same reasons—it allowed improvements in industrial operations. The rise of electricity enabled water power to make a comeback of sorts, while allowing coal to maintain its contribution even as the steam engine declined.
Wood was the dominant fuel in railroad locomotives until about 1870, at which time coal took over (White 1979), and wood and coal were used
14. Electric motors held a share of 55 percent of total horsepower in 1919. Electric motors seem to have gained a majority of new installations by the 1904–1909 period, with a gain of 3 million horsepower out of total manufacturing installations of 5 million horsepower.
Energy Transitions 29
together in steamboats for much of the 1800s. In the 20th century, petro-leum became the dominant energy resource for transportation. Within existing transportation systems such as railroads and marine transport, oil supplanted coal due to its higher energy density and its possible use in the internal combustion engine. The internal combustion engine also enabled two new transportation systems, the airplane and the automobile.
Transportation is today about 27 percent of U.S. energy consumption, com-pared to about six percent for lighting. Transportation in 1800 was largely limited to animal power on land and sailing vessels on the oceans. Steam-boats appeared starting in 1807. Railroads began developing in the 1830s, rapidly expanding in the next few decades. The infrastructure expanded from about 8,600 miles in 1850 to 30,600 in 1860 (Edmunds 1866, 323). Railroads shaped the development of the American West, and with the completion of the transcontinental railroad in 1869, the country could be crossed in a week. Railroads shaped the economy, allowing transport of goods in massive quantities, and the railroads played a major role in the rise of the great corporations of the late 1800s. In the early 1900s, coal began giving way to oil for transportation, due both to the inherent characteristics of the fuel, such as greater energy density, and to superior new energy con-verters better suited to oil, such as the internal combustion engine.
The automotive sector at the turn of the 20th century saw a competition between three primary energy converters: the steam engine, the inter-nal combustion engine, and the electric motor. Competition also existed between sub-types of each converter (Otto-cycle engines vs. Diesels) and among the fuels that might be used for each technology. The winning energy converters succeeded on cost and performance, while the winning energy source was determined on cost and supply constraints. For the remainder of the century, the demand for transportation energy grew expo-nentially in developed countries such as the U.S. Car ownership expanded; driving distances lengthened; and vehicle power increased.
Cooling: Refrigeration cycles were first demonstrated in the mid-1700s, developed for ice making around 1850, and commercialized for air condition-ing around 1900. Prior to the widespread use of mechanical refrigeration, ice was harvested from lakes, transported throughout the country, and stored
30 The Pardee Papers | No. 12 | November 2010
throughout the year for food preservation. Various sources reference a harvest of 25 million tons in 1886; this would have represented about 7 trillion BTU of the nearly 6 quadrillion BTU used in that year, so about 1 part in 1,000.
The introduction of mechanical refrigeration allowed the use of cooling not only for food preservation but for air conditioning. The application spread to the residential sector in the second half of the 20th century. In 1955, fewer than 2 percent of U.S. homes had air conditioning, but this figure had increased to 13 percent by 1960, 36 percent by 1970, 58 percent by 1980 (Biddle 2008), and 84 percent by 2005 (EIA 2005). Cooling accounts for approximately one-third of residential electricity consumption in the U.S., and one-quarter of commercial electricity. Of U.S. residential electricity use in 2001, 17 percent was for refrigerators and freezers, and 14 percent for air conditioners (EIA 2001). Nearly all cooling is provided by electricity, with a small amount of other energy used in absorption chillers.
Information: Information is a relatively new category of energy service, dating to the introduction of the telegraph in the mid-1800s. Computers, as well as most forms of entertainment (televisions, DVD players, music systems, etc.), process and/or deliver information. The energy demand for this service is relatively small, and all of it is provided by electricity. Although relatively minor in energy consumption, information is tremen-dously important in economic terms. Recent developments have allowed the provision of information services at greatly reduced energy consumption. A cell phone with Internet access provides considerable processing power and information access at a trivial energy cost, on the order of about a watt for Internet browsing. Of course, this information depends on Internet servers, which accounted for approximately 1.2 percent of U.S. electricity use in 2005 including cooling requirements (Koomey 2007), and therefore about 0.5 percent of U.S. primary energy consumption.
electrification—an energy Carrier Transition
Electricity faced an uphill battle on its introduction. The key application was to be lighting, and indeed that was the major application for which it was originally employed. But electricity was capital-intensive, and was competing against a well-established energy source in gas lighting. Electric-
Energy Transitions 31
ity required a new infrastructure as well as new appliances. The expansion of the overall market for lighting, as well as performance advantages of electric lighting, made it possible for electricity to capture this market. Electricity also served new energy demands. Edison’s invention of the phonograph and improvement of the motion picture camera showed the potential for electricity to provide information and entertainment.
Electricity captured nearly all of the lighting market, and a portion of the heating market as well. It largely displaced steam power for motive force in industrial processes, and it captured a small share of motive power for trans-portation, as in streetcars and trolleys. The new energy demand for cooling was extremely significant, representing as much or more electricity demand than any of the existing markets that electricity had captured.
In 2001, 33 percent of U.S. residential electricity consumption was for cool-ing: air conditioners, refrigerators, and freezers. Another 33 percent or so was for heating: space heating, stoves and ovens, and clothes dryers. Approx-imately nine percent was for lighting, and seven percent for information and entertainment. The market for cooling, unforeseen at the time of Edison’s Pearl Street Station, was a major impetus for the growth of the electricity market and the revival of coal.
Failed Transitions, Delayed Transitions, and Revivals
Unsuccessful transitions are just as illustrative as the successful ones. History provides several examples of new energy resources being introduced and failing to claim the market share that their supporters had expected. History also provides examples of energy resources seeming to be in decline only to experience a revival at a later time.
Coal oil emerged as a lamp fuel in the 1850s. It held great promise, but was soon surpassed by petroleum, which was easier to refine. The production of liquid fuels from coal was not forgotten, and it was used by countries unable to obtain petroleum, such as Germany and Japan during the Second World War and South Africa during the apartheid era. The United States and other coun-tries explored producing liquid fuels from coal in the aftermath of the 1970s oil crises, as well as producing liquid fuels from the kerogen in organic marlstone.
32 The Pardee Papers | No. 12 | November 2010
Nuclear power emerged as a source of electricity in 1957. It grew to six per-cent of electricity generation in 1974 and 12 percent in 1977, to nearly 20 percent by 1988. In the U.S., new reactor orders slowed dramatically after 1975 and stopped altogether after 1978 (Bodansky 2004, 35). U.S. elec-tricity generation grew by about 6.8 percent per year from 1920–1970, but only 2.6 percent per year since then. With a slowdown in market growth, “sunk costs” of existing coal plants, low coal costs, and increased public safety concerns after Three Mile Island and Chernobyl, the nuclear indus-try stagnated. Completions of older “in the pipeline” orders, and increased yield from existing plants, has allowed fission to keep pace with electricity growth, providing about 20 percent of U.S. electricity.
Natural gas appears to have been an example of a delayed transition. According to Schurr (1960), natural gas production reached 369 trillion BTU in 1888. That would have been over five percent of energy consumed in that year, and more than double the energy of petroleum produced. Yet natural gas declined.15 After returning to the five percent level in 1924, gas then rose above 20 percent by 1952 and has since remained above that level.
The various energy forms have survived challenges in the past; some have reversed declines by finding new markets. Oil first found commercial use as an illuminant. Kerosene lamps provided light in remote areas not connected to gas distribution systems (or, later, to electricity grids). This market was limited; the industry which had grown more than eight-fold from 1875 through 1880 achieved little more
than a doubling from 1880 through 1900. It was the internal combus-tion engine that truly established the demand for oil. The market took off, showing a sustained rate of growth of over 12 percent for the next quarter-century. Oil’s growth has since slowed, in part due to the
loss of markets such as electricity generation and home heating, but it has main-tained its overall market share through dominance of the transportation sector.
15. In the Pittsburgh region, discovery of natural gas enabled “six years of clean air” beginning in the 1880s and ending when the local supply was exhausted. See Tarr, op. cit.
It was the internal combustion engine that truly established the demand for oil. The market took off, showing a sustained rate of growth of over 12 percent for the next quarter-century.
Energy Transitions 33
In the transportation sector, oil’s gain was coal’s loss. Railroads and ships switched from coal to fuel oil and diesel. Oil and gas quickly eroded coal’s dominance of the home heating market. Use of coal for heating or mechani-cal power reached a plateau around 1915 (with the exception of two war years), and began an irreversible decline in 1944. Electricity proved to be coal’s salvation. Certain of coal’s disadvantages relative to oil, such as lower energy density, disappeared when used in a power plant. Coal started to lose market share to oil generation in the late 1960s and early 1970s, but oil price shocks, combined with railroad deregulation, gave coal a cost advan-tage that it enjoys today.
eNeRGy TRANSITIONS IN The CONTeXT OF DeVelOPING COUNTRIeS
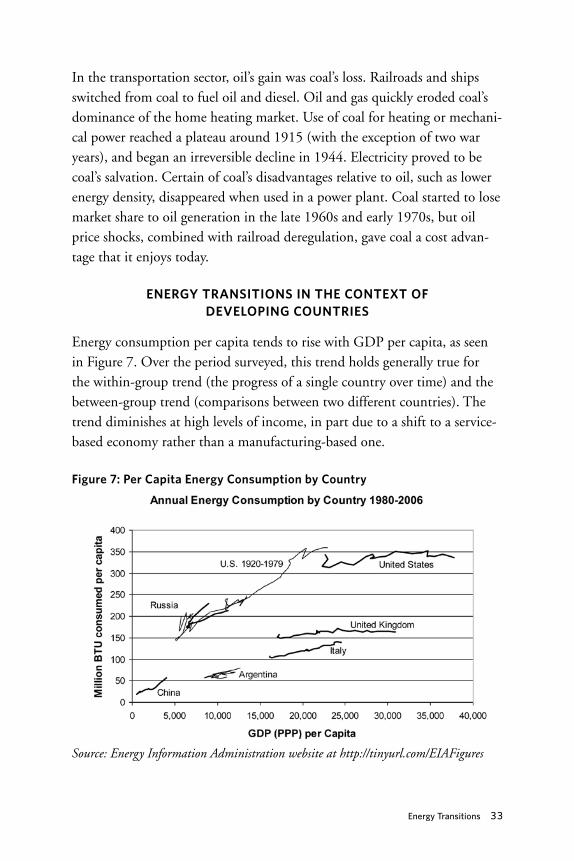
Energy consumption per capita tends to rise with GDP per capita, as seen in Figure 7. Over the period surveyed, this trend holds generally true for the within-group trend (the progress of a single country over time) and the between-group trend (comparisons between two different countries). The trend diminishes at high levels of income, in part due to a shift to a service-based economy rather than a manufacturing-based one.
Figure 7: Per Capita energy Consumption by Country
Source: Energy Information Administration website at http://tinyurl.com/EIAFigures
34 The Pardee Papers | No. 12 | November 2010
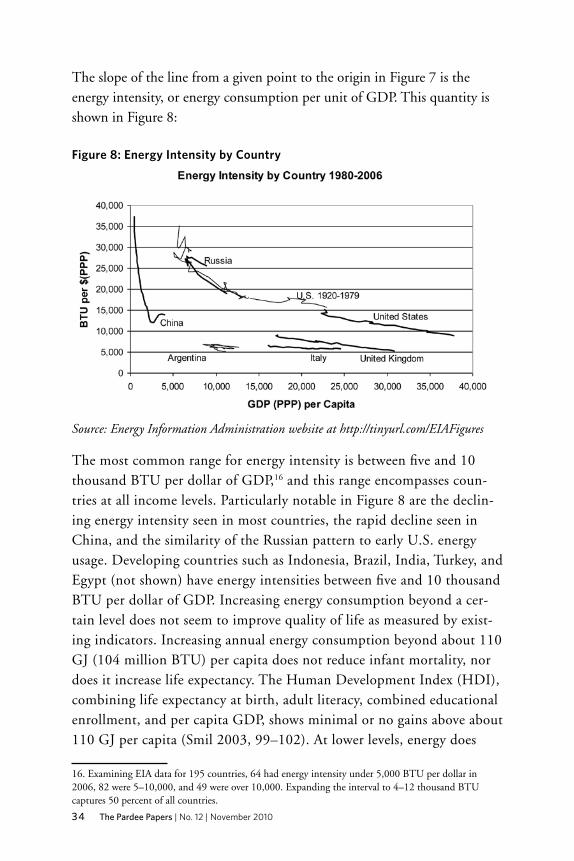
The slope of the line from a given point to the origin in Figure 7 is the energy intensity, or energy consumption per unit of GDP. This quantity is shown in Figure 8:
Figure 8: energy Intensity by Country
Source: Energy Information Administration website at http://tinyurl.com/EIAFigures
The most common range for energy intensity is between five and 10 thousand BTU per dollar of GDP,16 and this range encompasses coun-tries at all income levels. Particularly notable in Figure 8 are the declin-ing energy intensity seen in most countries, the rapid decline seen in China, and the similarity of the Russian pattern to early U.S. energy usage. Developing countries such as Indonesia, Brazil, India, Turkey, and Egypt (not shown) have energy intensities between five and 10 thousand BTU per dollar of GDP. Increasing energy consumption beyond a cer-tain level does not seem to improve quality of life as measured by exist-ing indicators. Increasing annual energy consumption beyond about 110 GJ (104 million BTU) per capita does not reduce infant mortality, nor does it increase life expectancy. The Human Development Index (HDI), combining life expectancy at birth, adult literacy, combined educational enrollment, and per capita GDP, shows minimal or no gains above about 110 GJ per capita (Smil 2003, 99–102). At lower levels, energy does
16. Examining EIA data for 195 countries, 64 had energy intensity under 5,000 BTU per dollar in 2006, 82 were 5–10,000, and 49 were over 10,000. Expanding the interval to 4–12 thousand BTU captures 50 percent of all countries.
Energy Transitions 35
make a substantial difference to increasing HDI. Over the full spectrum of countries, energy consumption per capita explains about 55 percent of the variance in HDI.
Approximately 2.4 billion people rely on traditional biofuels for cooking, and 1.6 billion do not have access to electricity (Modi et al. 2005, 1–2). Tra-ditional biofuels can have several drawbacks, including a significant health burden from fine particulate matter (PM
10) and carbon monoxide (CO)
emissions, high labor costs, and possible ecosystem degradation (Modi et al. 2005, 8). Nearly two million deaths per year in developing countries are attributable to indoor air pollution from solid fuels, with that impact being four percent of the overall global disease burden in years of life lost (Bruce et al. 2000). Improved biomass stoves can mitigate this impact to some degree, as can a shift to cleaner fuels.
Additionally, while the use of cooling for air conditioning might have been considered a luxury in earlier decades in the U.S., or today in developing countries, a small amount properly applied can offer a marked improvement in quality of life. Health is tremendously improved by access to refrigeration, allowing preservation of vaccines and other medical materials, maintenance of proper conditions for various medical procedures, and preservation of food.
Cultural standards, geography, climate, energy policy, and governance will affect the nature and degree of energy services demanded. Some energy tran-sitions in developing countries will have a very large impact on economic development potential. The World Bank’s Energy Sector Management Assistance Program (ESMAP) notes, “Energy services such as lighting, cooking, refrig-eration, and power for electronics and motive force are provided most cheaply and conveniently, and with the least local pollution, when they are derived from electricity or gas delivered through networks” (Brook and Besant-Jones 2000).
Cultural standards, geography, climate, energy policy, and governance will affect the nature and degree of energy services demanded. Some energy transitions in developing countries will have a very large impact on economic development potential.
36 The Pardee Papers | No. 12 | November 2010
electrification in Developing Countries
Most developing countries have established programs to expand access to electricity. Similar programs were employed by developed countries in the past. Electricity improves the quality of life by providing services that no other energy option can fulfill, or providing a higher-quality service than other energy options can.
In off-grid areas of developing countries, light is often provided by kerosene lamps, just as it was in parts of the U.S. from the late 1800s through the early 1900s. Fuel-based lighting, principally kerosene, accounts for $38 billion per year in fuel costs and 190 million tons of CO
2 emissions (Mills 2005). For
comparison, all energy-related CO2 emissions were about 29 billion tons in
2006. Fuel use for illumination represents about 17 percent of global lighting energy costs and provides about 0.1 percent of lighting energy services. The light from simple kerosene lamps falls far below western standards of adequacy for reading. Kerosene lamps also pose problems with indoor air quality and safety. For focused light, a white light-emitting diode (LED) with a solar-battery system provides the most illumination per unit cost, and has the lowest green-house gas emissions. A compact fluorescent light (CFL) connected to the grid provides the lowest cost of area lighting. The cost of lighting from a battery-powered flashlight is orders of magnitude higher than even the simplest kerosene lamps, let alone a CFL or LED (Mills 2003).
Mills and other researchers explored the market for LED lighting in devel-oping countries. They identified customer preferences and found a generally positive result from the experience of off-grid users in Kenya (Radecsky et al. 2008; Johnstone et al. 2009). Studies have found a willingness to pay more than the current cost of kerosene lighting in exchange for superior lighting services. The International Energy Agency found that kerosene and liquefied petroleum gas (LPG) are only minimally used in the very poorest countries (those in which 75 percent of the population live on $2/day or less) (IEA 2002, 371). Use of these fuels increases with income to a point, then declines. They are transitional fuels, more expensive and requiring a greater distribution infrastructure than biomass, but more widely available in developing countries than electricity or natural gas.
Energy Transitions 37
Experience with rural photovoltaic (PV) systems in Kenya demonstrates that demand for information and entertainment is particularly high. Kenyan PV systems are typically installed by the rural middle class living in areas not expected to be grid-connected in the near future. While almost 50 percent were in the first decile of income for rural residents (about $4,400 per year), the next three deciles each held about 15 percent of the PV market ($2,600, $2,400, and $2,000). The owners were more likely to use the PV system for television than for anything else. Some 90–95 percent of homes with PV systems use the power for televisions, compared to 84 percent for lights and 75 percent for radios, according to a 1997 study. Advertisements for solar power systems emphasized the ability of the systems to power televisions. Recent market developments include the growing importance of cell phone charging, as reflected in surveys and in advertisements (Jacobson 2007).
Kenya, like some other countries in Africa, has developed a way to meet minor demands for electricity even without a comprehensive electricity grid. “Charge shops” supplied either by a diesel generator or a grid con-nection charge batteries for consumers, who in turn use these batteries to power appliances such as televisions, radios, lights, and cell phones. The cost for this charge can be quite high: a cell phone charge costing $0.25 is the equivalent of paying perhaps $250/kWh.17 The cost of a charge is usually independent of the amount of electricity provided, so devices with larger batteries obtain charges at a lower cost per unit energy. Jacobson (2007) cites a survey of 79 cell phone users that found that, for their most recent charge, 24 percent used solar electricity at home, 22 percent used a charge shop, and 22 percent used grid electricity at work.
The Kenyan experience has a precedent in the U.S. Windmills had been used for water pumping on farms, and with the improvement of the genera-tion technology by Jacobs Wind and others, wind turbines appeared in the rural U.S. in the 1920s. Demand for information and entertainment, radios in this case, stimulated the growth of the market (Gipe 2004, 168). With increasing availability of electricity came increased marketing of electrical appliances, followed by increasing wind turbine size. This demonstrated
17. A 1000 mAh cell phone battery, operating at 1 watt, would have about 1 watt-hour of energy storage.
38 The Pardee Papers | No. 12 | November 2010
demand led to a more compelling political and business case for rural electrification, which led to the replacement of the rural wind turbines. The expertise and innovations developed in that period remained valuable when wind power again became a subject of interest, and Jacobs Wind re-started operations in 1980.
Potential Improvements in heating and Cooking
Although electricity can be used for heating and cooking, it is not particu-larly well suited to those demands. Heat is the lowest-quality form of energy, and electricity one of the highest. As a result, cooking and heating with electricity tends to be expensive. These sources also represent the majority of the present energy demand in developing countries.
The typical “three stone fire” used in many rural areas in developing coun-tries, a pot resting on three stones with the biomass fire beneath, is not particularly efficient. As much as 80 percent of the heat in the biomass is lost, whereas a kerosene or LPG stove can be close to 50 percent efficient (Modi et al. 2005, 36). Fuels such as kerosene, LPG, ethanol, or dimethyl ether (DME) are more energy-dense than traditional biomass, produce high heat quickly, and have lower emissions of particulate matter. Reddy (2002) suggests improved woodstoves as an interim step, and gaseous biofuel stoves as a long-term solution.
Most of the same fuels could be used for domestic heating, but this demand is generally not as great in developing countries, most of which are tropi-cal or subtropical. For low-level industrial process heat such as crop drying, cogeneration offers a viable solution. High-level industrial process heat normally has dedicated sources such as furnaces.
CONClUSIONS
The experience of energy transitions in the United States offers grounds for optimism for developing countries. Improving technology means that an increasing amount of energy services can be provided with a relatively small amount of fuel. A U.S. resident in 2008 enjoyed far more useful heat than one in 1800, while using less actual heat energy. The energy efficiency of lighting has improved better than a thousand-fold from the candle to the compact
Energy Transitions 39
fluorescent lightbulb. The provision of information has become vastly more energy-efficient. Technology continues to improve the energy efficiency of refrigeration, transportation, and industrial processes. Energy converters are generally flexible enough that no one fuel is absolutely necessary.
Both supply constraints and growing energy markets tend to increase deployment of alterna-tives. Even where no technology is immediately available that is both as convenient and as low-cost as our existing ones, the required changes in systems to accommodate the replacements would not be catastrophic. Countries can and have developed advanced energy systems even when lacking the lowest-cost resources.
For specific technologies such as biomass or coal for domestic heating and cooking, or kerosene for lighting, many of the same factors that led to shifts away from these technologies in the U.S. are likely to recur and stimulate transitions in developing countries. These include demand for lower-labor energy resources as individuals’ time grows to become more valuable, and capability for expanding complex energy infrastructures as energy providers become confident in their ability to gain a return on investment.
Countries will differ in their specific choice of energy services demanded. A comparison among high-income countries illustrates this, with countries at similar levels of income showing widely differing levels of energy con-sumption. Increased energy consumption does appear to be correlated with greater welfare up to a point, and it is reasonable to expect that developing countries will seek to bring commercial energy utilization up to that level. Very high levels of energy use beyond that point do not produce any greater benefits in human welfare.
The experience of energy transitions in the United States offers grounds for optimism for developing countries. Improving technology means that an increasing amount of energy services can be provided with a relatively small amount of fuel.

40 The Pardee Papers | No. 12 | November 2010
Energy Transitions 41
BIBlIOGRAPhy
Bernton, H., with W. Kovarik and S. Sklar. (1982). The Forbidden Fuel. New York: Boyd Griffin.
Biddle, J. (2008). “Explaining the Spread of Residential Air Conditioning 1955–1980,” Explorations in Economic History, Vol. 45, pp. 402–423.
Bodansky, D. (2004). Nuclear Energy: Principles, Practices, and Prospects. New York: Springer Press.
Brook, P., with J. Besant-Jones. (2000). “Reaching the poor in the age of energy reform,” in Energy Services for the World’s Poor, Washington, DC: World Bank/Energy Service Management Assistance Program.
Bruce, N., with R. Perez-Padilla and R. Albalak. (2000). “Indoor air pollution in developing countries: a major environmental and public health challenge,” Bul-letin of the World Health Organization, Vol. 78, No. 9.
Clark, A. H. (1887). “History and Present Condition of the Fishery,” in The Fisheries and Fishery Industries of the United States, Volume XV: The Whale-Fishery, United States Commission of Fish and Fisheries, ed. George Brown Goode, Washington D.C.
Cook, E. (1976). Man, energy, and society. San Francisco: W.H. Freeman.DeBow, J. D. B. (1854). Statistical View of the United States, Part IV: Industry, U.S.
Census Bureau.Eberhart, M. (2007). Feeding the Fire. New York: Harmony Books. Edmunds, J. M. (1865). Manufactures of the United States in 1860, U.S. Census
Bureau.Edmunds, J. M. (1866). Statistics of the United States in 1860, U.S. Census Bureau.Energy Information Administration (EIA). (2001). Residential Energy Consumption
Survey 2001. Available online at http://www.eia.doe.gov/emeu/recs/contents.html.
Energy Information Administration (EIA). (2002). Manufacturing Consumption Energy Survey 2002. Available online at http://www.eia.doe.gov/emeu/mecs/contents.html.
Energy Information Administration (EIA). (2003). 2003 Commercial Building Energy Survey. Available online at http://www.eia.doe.gov/emeu/cbecs/.
Energy Information Administration (EIA). (2005). Residential Energy Consumption Survey 2005. Available online at http://www.eia.doe.gov/emeu/recs/contents.html.
Energy Information Administration (EIA). (2008). Annual Energy Review 2008. Document DOE/Energy Information Administration-0384.
Energy Information Administration (EIA). (2010). Annual Energy Outlook 2010, Document DOE/Energy Information Administration-0383.
Etemad, B., and J. Luciani. (1991). World Energy Production 1800–1985. Geneva, Switzerland: Librairie DROZ.
42 The Pardee Papers | No. 12 | November 2010
Federal Highway Administration (FHA). (2008). Traffic Volume Trends, U.S. Department of Transportation, December.
Fouquet, R., with P. Pearson. (2006). “Seven Centuries of Energy Services: the Price and Use of Light in the United Kingdom (1300–2000),” The Energy Journal Vol. 27, No. 1.
Freese, B. (2004). Coal: A Human History. New York: Penguin Books.Gipe, P. (2004). Wind Power: Renewable Energy for Home, Farm, and Business.
White River Junction, VT: Chelsea Green. International Energy Agency (IEA). (2002). World Energy Outlook 2002. International Energy Agency (IEA). (2008). Energy Prices & Taxes—Quarterly
Statistics, First Quarter 2008, Part II, Section D, Table 21, and Part III, Section B, Table 18, cited by Energy Information Administration, at http://www.eia.doe.gov/emeu/international/elecprii.html.
Jacobson, A. (2007). “Connective Power: Solar Electrification and Social Change in Kenya,” World Development Vol. 35, No. 1, pp. 144–162.
Johansson, T., with J. Goldemberg. (2002). “Overview and a Policy Agenda,” in Energy for Sustainable Development: A Policy Agenda, United Nations Develop-ment Program. Sweden: Rahms i Lund AB.
Johnstone, P., with A. Jacobson, E. Mills, and M. Mumbi. (2009). “Self-reported Impacts of LED Lighting Technology Compared to Fuel-based Lighting on Night Market Business Prosperity in Kenya,” Lawrence Berkeley National Labo-ratory, February 11.
Radecsky, K., with P. Johnstone, A. Jacobson, and E. Mills. (2008). Solid-State Lighting on a Shoestring Budget: The Economics of Off-Grid Lighting for Small Busi-nesses in Kenya, Lawrence Berkeley National Laboratory, December.
Kats, G. (2003). “The Costs and Financial Benefits of Green Buildings,” Washing-ton, DC: Capital E.
Koomey, J. (2007). “Estimating total power consumption by servers in the U.S. and the world,” February. Oakland, CA: Analytics Press.
Lovins, A., with C. Lotspeich. (1999). “Energy Surprises for the 21st Century,” Journal of International Affairs, Vol. 53, No. 1.
Mills, E. (2003). Technical and Economic Performance Analysis of Kerosene Lamps and Alternative Approaches to Illumination in Developing Countries, Lawrence Berkeley National Laboratory, June 28.
Mills, E. (2005). “The Specter of Fuel-Based Lighting,” Science, Vol. 308, No. 5726, pp. 1263–1264, May 27.
Modi, V., with S. McDade, D. Lallement, and J. Saghir. (2005). Energy Services for the Millennium Development Goals, United Nations Development Programme and World Bank Energy Service Management Assistance Program.
Reddy, A. (2002). “Energy Technologies and Policies for Rural Development,” in Energy for Sustainable Development: A Policy Agenda, United Nations Develop-ment Program. Sweden: Rahms i Lund AB.
Energy Transitions 43
Schurr, S., with B. Netschert. (1960). Energy in the American Economy 1850–1975. Baltimore: Resources for the Future/Johns Hopkins Press.
Smil, V. (2003). Energy at the Crossroads. Cambridge, MA: MIT Press. Takács-Sánta, A. (2004). “The Major Transitions in the History of Human Trans-
formation of the Biosphere,” Human Ecology Review, Vol. 11, No. 1, pp. 51–66. Tarr, J. A. (1981). “Changing Fuel Use Behavior and Energy Transitions: The Pitts-
burgh Smoke Control Movement, 1940–1950,” Journal of Social History Vol. 14, pp. 561–588.
Townsend, A. (2000). “Energy access, energy demand, and the information deficit,” in Energy Services for the World’s Poor, Washington DC: World Bank/Energy Service Management Assistance Program.
Tucker, G. (1843). Progress of the United States in Population and Wealth in Fifty Years. New York: Hunt’s Merchants’ Magazine Press.
Truesdell, L. E. (1943). Census of Population and Housing 1940, Housing, Section II: General Characteristics, U.S. Census Bureau.
UK Department of Business Enterprise and Regulatory Reform. (2008). Digest of United Kingdom Energy Statistics 2008.
UK Department for Transport. (2008). Transport Statistics Great Britain 2008, November 27.
United Nations Framework Convention on Climate Change (UNFCCC). (1992). May 9. Available online at http://unfccc.int/resource/docs/convkp/conveng.pdf.
U.S. Department of Transportation (U.S.DOT). (2008). Bureau of Transportation Statistics, National Transportation Statistics 2008.
U.S. Environmental Protection Agency (EPA). (2009). Inventory of U.S. Greenhouse Gas Emissions and Sinks: 1990–2007, April 15, document EPA 430-R-09-004.
Von Tunzelmann, G. N. (1978). Steam Power and British Industrialization to 1860. Oxford: Oxford University Press.
White, John H. (1979). A History of the American Locomotive: Its Development 1830–1880. New York: Courier Dover Publications.
Williamson, H., with A. Daum. (1959). The American Petroleum Industry: the Age of Illumination 1859–1899. Evanston, IL: Northwestern University Press.
World Summit on Sustainable Development (WSSD). (2002). Plan of Implementa-tion of the World Summit on Sustainable Development. Available online at http://www.un.org/jsummit/html/documents/summit_docs/2309_planfinal.htm.
Wright, L. (1964). Home Fires Burning: the History of Domestic Heating and Cook-ing. London: Routledge & Kegan Paul.
Yergin, D. (2009). The Prize. New York: Free Press.

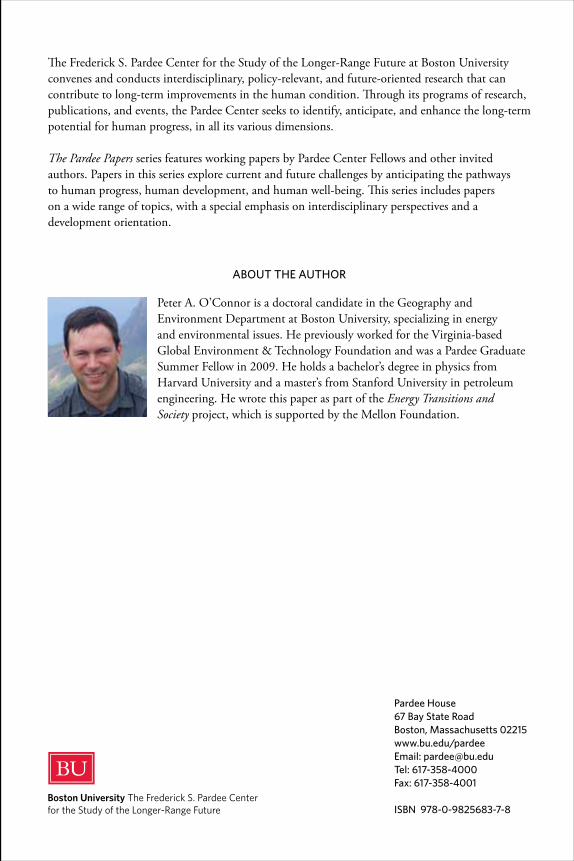
Pardee House67 Bay State RoadBoston, Massachusetts 02215www.bu.edu/pardeeEmail: [email protected]: 617-358-4000Fax: 617-358-4001
ISBN 978-0-9825683-7-8
The Frederick S. Pardee Center for the Study of the Longer-Range Future at Boston University convenes and conducts interdisciplinary, policy-relevant, and future-oriented research that can contribute to long-term improvements in the human condition. Through its programs of research, publications, and events, the Pardee Center seeks to identify, anticipate, and enhance the long-term potential for human progress, in all its various dimensions.
The Pardee Papers series features working papers by Pardee Center Fellows and other invited authors. Papers in this series explore current and future challenges by anticipating the pathways to human progress, human development, and human well-being. This series includes papers on a wide range of topics, with a special emphasis on interdisciplinary perspectives and a development orientation.
Peter A. O’Connor is a doctoral candidate in the Geography and Environment Department at Boston University, specializing in energy and environmental issues. He previously worked for the Virginia-based Global Environment & Technology Foundation and was a Pardee Graduate Summer Fellow in 2009. He holds a bachelor’s degree in physics from Harvard University and a master’s from Stanford University in petroleum engineering. He wrote this paper as part of the Energy Transitions and Society project, which is supported by the Mellon Foundation.
ABOUT THE AUTHOR