Energy Solutions for Industrial Environments - …2).pdf · Energy Solutions for Industrial...
22
GREEN design LEAN operations CLEAN energy Energy Solutions for Industrial Environments Presented by Bill Burke Director, Energy Solutions FPA Environmental Summit January 24, 2008
Transcript of Energy Solutions for Industrial Environments - …2).pdf · Energy Solutions for Industrial...

Page 1
GREENdesign
LEANoperations
CLEANenergy
Energy Solutions for Industrial Environments
Presented byBill BurkeDirector, Energy SolutionsFPA Environmental Summit January 24, 2008
Page 2
Outline
! Company Overview! Energy and Sustainability Drivers! Solution Approach ! Project Scenarios

Page 3
Automotive Experience
JCI is Three Global Businesses
Automotive Experience ($18.3 billion)! Seating and interiors! Components and system integration! Electronics
Power Solutions ($3.7 billion)! Lead acid (80 million per year)! Hybrid battery development (NiMH, Lith-Ion)! Battery management and electronics
Building Efficiency ($12.2 billion)! Control systems and HVAC equipment (York)! Life-cycle services operating in 125 countries! Energy efficiency and sustainable solutions

Page 4
Energy and Sustainability Drivers
! Energy Efficiency and Clean Energy– Increasing Energy Prices– Energy Independence– Climate Change Concerns– Legislation & Policy– “Green” Movement – Triple Bottom Line

Page 5
Defining Sustainability
External
• JCI Definition: “Through our actions and offerings, we embrace Environmental , Social and Economic practices that benefit our customers, employees, shareholders, and society as a whole”
• Core Values • Ethics Policy• ESH Policies• Committed
management• Performance metrics• Market position
Internal
EnvironmentalStewardship
SocialResponsibility
AnIntegrated,BalancedStrategicApproach
“Triple Bottom-line”
EconomicProsperity

Page 6
Walk The Talk ….
!
! United States
! Mexico
! South America
! Europe
! Asia
While JCI’s Energy Consumption per Revenue $ Continues to Decline
JCI’s Energy Use is projected to increase globally, but varies by region.
40% reduction in electricity metric38% reduction in natural gas metric
GRI Report
-
0.0200
0.0400
0.0600
0.0800
0.1000
0.1200
0.1400
FY 2003 FY 2004 FY 2005 FY 2006 FY 2007
kWh/
Reve
nue
($)
-
0.0005
0.0010
0.0015
0.0020
0.0025
0.0030
Ther
ms/
Reve
nue
($)
Electricity
Nat Gas

Page 7
Brengel Technology Center
! $16M technology & customer briefing center in Milwaukee, WI
! Building constructed in 2000! Complements existing 100-year-
old building! Lighting system consumes
0.86 watts per ft2 (1.20 is code)! 130,000 sq. ft. added – with no
additional maintenance personnel! 35% reduction in operating costs! $76,000 in annual energy savings
Silver Rating: New ConstructionGold Rating: Existing Building

Page 8
Capabilities and Commitment
! Outward Facing: – over 1,000 energy professionals– over 1,000 energy efficiency projects completed– $3.6B in energy performance guarantees– Renewable energy/green building expertise
! Internal Focus: – Ten-year sustainability objectives related to
• environmental footprint reduction, • improving supply chain eco-efficiency and • business growth in energy efficient products and services
– JCI has committed to 30% GHG intensity reduction by 2012 as part of EPA Climate Leaders

Page 9
Financial Impact – Return on Investment
! Studies now validate thatenergy efficient buildings have a positive impact on market value.
Source: CoStar “Does Green Pay Off?”, Nov. 2007
Source: Innovest Strategic Value Advisors, “Energy Management & Investor Returns:The Real Estate Sector”, Oct. 2002
! We’ve already validated the impact of energy efficiency investment in commercial property net operating income

Page 10
Motivation for Energy Investments
6%
24%
22%
35%
7%
5%
1%
100% cost savings
Mostly for cost savings
Somewhat more for cost savings
50% cost savings 50% environmental
Somewhat more for environment
Mostly for environmental responsibility
100% environmental responsibility
48% of participants feel that environmental responsibility is atleast as strong a motivator as cost savings
Source: JCI on-line survey conducted in March 2007 of 1249 North American executive/managers responsible for energy management decisions

Page 11
A Solution Approach – System Focused

Page 12
The “5 C’s” for Sustainability
! Commit …to improvement targets! Collect …data and assess facilities! Contract …for guaranteed results! Confirm …performance over time! Communicate …plans and progress
Life cycle value is an important element of energy investments. Meeting ‘expectations’ is important to
sustain continued investment.

Page 13
Utility Bill Audit
Commodity Supply
Services
Rate/Tariff Audits
Facility Audits
Operational Improvements
Energy Efficiency Services
Measurement & Verification
Loss Recovery
Loss Prevention & Education
Optimization
Process
GHG Audit &Reporting

Page 14
Data Driven Facility Assessment
! An important first step is utility data collection, analysis and benchmarking across the portfolio and other facilities
! The next step includes a detailed facility audit and the identification and quantification of potential opportunities for improvement
! The final step is financial analysis of the individual opportunities to determine the sequence of improvements and optimize the funding structure.

Page 15
Performance Contracting …for guaranteed results
Performance contracting is a proven model for financing energy investments based on guaranteed energy savings.
ImprovementsPa
ybac
k (y
ears
)
Additional Scope
Traditional Scope
Un-economic Projects

Page 16
and, if they fit…. Renewable Sources
BiomassCompetitive ‘life cycle’ cost Less fuel volatilityFuel cost reflect local market
SolarExpensive Incentives requiredregionally specific value
WindStill high cost/MWSupported by tax incentivesValue is locationally dependent
WindStill high cost/MWSupported by tax incentivesValue is locationally dependent
Landfill GasVery effective GHG impact Attractive incentives.Managed production
Page 17
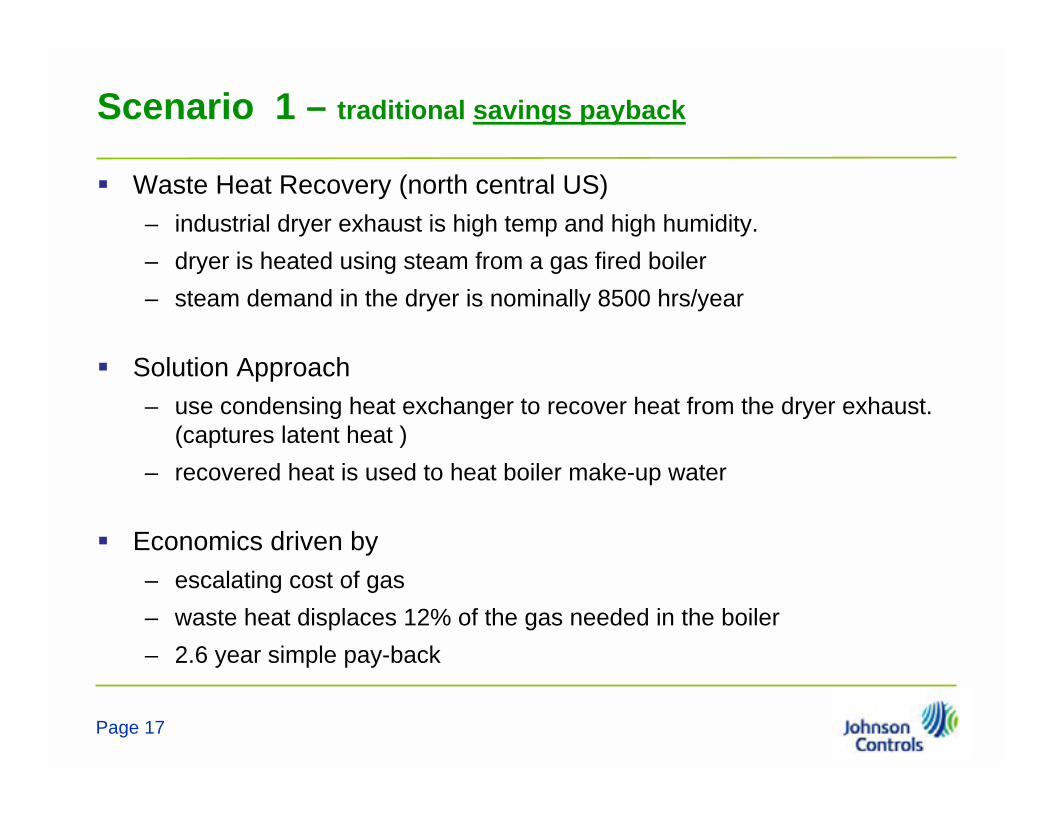
Scenario 1 – traditional savings payback
! Waste Heat Recovery (north central US)– industrial dryer exhaust is high temp and high humidity. – dryer is heated using steam from a gas fired boiler– steam demand in the dryer is nominally 8500 hrs/year
! Solution Approach– use condensing heat exchanger to recover heat from the dryer exhaust.
(captures latent heat )– recovered heat is used to heat boiler make-up water
! Economics driven by– escalating cost of gas– waste heat displaces 12% of the gas needed in the boiler– 2.6 year simple pay-back

Page 18
Scenario 2 – savings supplemented by avoided capital
! Rooftop Air Handler (east central US)– high exhaust CFM requires significant facility make-up air – make-up air cooling provided from air cooled Dx units– cooling demands driven by need to maintain humidity levels in plant.– refrigerant is Class I. Non-ODS compliant
! Solution Approach– Use excess capacity from central plant chiller to supply chilled water to the
existing AHUs. – Replace existing Dx Units with chilled water coil– Install enthalpy control on all AHUs to support enthalpy control
! Economics driven by– electric demand (kw) reduction and energy (kw-hr) reduction (50%)– increased hours of free-cooling available.(15%)– avoided cost associated with Dx unit replacement / CFC elimination (35%)– payback 4.5 years ( highly dependent on local electric costs)

Page 19
Scenario 3 – operating lease structure
! Thermal Re-compressor Replacement – existing system efficiency can improve by nearly 20%– new configuration can support maximum plant capacity– capital return is only 18% ROI vs. +25% corporate threshold.
! Solution Approach– Use off balance sheet ‘operating lease’ vehicle to fund the project.– requires extensive coordination w/ company CFO.– money factor on the lease payment is less than target ROI.– after 3-5 years of operating, buy out the lease meets capex requirement
! Economics driven by– decreased net energy per ton of product – lower cost of production– relieve production bottleneck. – risk transfer to third party for performance and availability– meets internal financial criteria ( subject to review by CFO)

Page 20
Scenario 4 – monetized emissions credits
! Boiler Performance Improvement – aged existing system is inefficient and subject to compliance issues– options are to shut down system, buy replacement grid power (or)– invest in front end rebuild and improved controls
! Solution Approach– improvements will lead to significant reduction in fuel used.– reduced fuel use (@ equivalent production) generates emissions credits– Global Climate Trust seeking to purchase sustainable credits
PV of the credits can be established and contribute to project capital
! Economics driven by– reduced operating costs due to improved combustion efficiency– improved reliability from controls upgrade (more operating hours)– 20% of total project capital from monetization of 20 years of CO2 credits.

Page 21
Scenario 5 – utility energy efficiency incentive
! Utility System Cost Reduction – Efficiency focus at the plant driven by Corporate Mandate for 10%
reduction in energy consumption – Site infrastructure is first round focus “low hanging fruit”
! Solution Approach– Significant waste heat at the plant from glass ovens – no process heat sinks – but significant chilled water demand.– install HRSG to drive an absorption chiller system,
! Economics driven by– reduced cost of mechanical refrigeration. (energy savings) (35%)– life extension of existing chiller assets (deferred capital) (45%)– Utility efficiency rebates for peak load reduction and reduced annual
energy consumption. (20%)

Page 22
GREENdesign
LEANoperations
CLEANenergy
Thank you.