Energy Services for the Millenium Development Goals
116
Energy Sector Management Assistance Programme United Nations Development Programme World Bank Achieving the Millennium Development Goals Energy Services for the Millennium Development Goals
-
Upload
christina-dian-parmionova -
Category
Documents
-
view
214 -
download
1
description
The Millenium Development Goals and Energy
Transcript of Energy Services for the Millenium Development Goals

Energy Sector Management Assistance Programme
United NationsDevelopment Programme
World Bank
Achieving the Millennium Development Goals
Energy Services for theMillennium Development Goals

The UN Millennium Project is an independent advisory body commissioned by the UN Secretary-General to propose the best strategies for meeting the Millennium Development Goals (MDGs). The MDGs are the world’s quantifed targets for dramatically reducing extreme poverty in its many dimensions by 2015 – income poverty, hunger, disease, exclusion, lack of infrastructure and shelter – while promoting gender equality, education, health, and environmental sustainability.
The UN Millennium Project is directed by Professor Jeffrey D. Sachs, Special Advisor to the Secretary-General on the Millennium Development Goals. The bulk of its analytical work is performed by 10 task forces, each composed of scholars, policymakers, civil society leaders, and private-sector representatives. The UN Millennium Project reports directly to the UN Secretary-General and the United Nations Development Programme Administrator, in his capacity as Chair of the UN Development Group.

Vijay ModiProfessor, Department Of Mechanical Engineering and Earth Institute, Columbia University
Susan McDadeManager, Sustainable Energy Programme, Bureau for Development Policy, United Nations Development Programme
Dominique LallementAdviser, Energy and Water Department, the World Bankand ESMAP Program Manager
Jamal SaghirDirector of Energy and Water, the World Bank
2005
Energy Services for the Millennium Development Goals
World Bank
Energy Sector Management Assistance Programme
United NationsDevelopment Programme

© 2005 The International Bank for Reconstruction and Development/The World Bank and the United Nations Development Programme
The International Bank for Reconstruction and Development/The World Bank/ESMAP 1818 H Street, NWWashington, DC20433, USATelephone: +202-473-1000Internet: www.worldbank.org www.esmap.org
United Nations Development ProgrammeOne United Nations PlazaNew York, NY 10017 USA
All rights reservedManufactured in the United States of America
The findings, interpretations, and conclusions expressed in this publication are entirely those of the author(s) and should not be attributed in any manner to the World Bank, or its affiliated organizations, or to members of its Board of Executive Directors or the countries they represent. The World Bank does not guarantee the accuracy of the data included in this publication and accepts no responsibility whatsoever for any consequence of their use. The boundaries, colors, denominations, or other information shown on any map in this publication do not imply on the part of the World Bank Group any judgment on the legal status of any territory or the endorsement or acceptance of such boundaries.
ESMAP Reports are published to communicate the results of ESMAP’s work to the development community with the least possible delay. Some sources cited in this paper may be informal documents that are not readily available.
The material in this publication is copyrighted. Copying and/or transmitting portions or all of this work without permission may be a violation of applica-tion law. Requests for permission to photocopy or reprint any part of this work should be sent either to the Director, Energy and Water, the World Bank, or to the ESMAP Manager or to the UNDP at the addresses shown in the copyright notice above. ESMAP and the UNDP encourage dissemination of their work and will normally give permission promptly and, when the reproduction is for noncommercial purposes, without asking a fee.
The views expressed in this publication do not necessarily represent those of the member countries of the United Nations, UNDP Executive Board or of those institutions of the United Nations system that are mentioned herein. The designations and terminology employed and the presentation of material do not imply any expression or opinion whatsoever on the part of the United Nations concerning the legal status of any country, territory, city or area, or of its authorities, or of its frontiers or boundaries.
The UN Millennium Project was commissioned by the UN Secretary-General and supported by the UN Development Group, which is chaired by the Administrator of the United Nations Development Programme. The report is an independent publication. This publication does not necessarily reflect the views of the United Nations, the United Nations Development Programme, or their Member States.
Correct citation: Modi, V., S. McDade, D. Lallement, and J. Saghir. 2006. Energy and the Millennium Development Goals. New York: Energy Sector Management Assistance Programme, United Nations Development Programme, UN Millennium Project, and World Bank.

Foreword
The world has an unprecedented opportunity to improve the lives of bil-lions of people by meeting the Millennium Development Goals (MDGs), the international community’s time-bound and quantified targets for addressing extreme poverty in its many forms. At the request of UN Secretary-General Kofi Annan, the UN Millennium Project has identified practical strategies to meet the MDGs, emphasizing the need for scaled-up investments in health, education, and infrastructure, alongside efforts to promote gender equality and environmental sustainability.
A common finding of the ten Task Forces of the UN Millennium Proj-ect has been the urgent need to improve access to energy services as essential inputs for meeting each MDG. Without increased investment in the energy sector, the MDGs will not be achieved in the poorest countries.
Under the leadership of Professor Vijay Modi of Columbia University, the Project has collaborated with ESMAP, UNDP, and the World Bank to prepare Energy Services for the Millennium Development Goals. The report underscores the strong links between energy services and achieving the MDG outcomes and puts forward a practical strategy for providing improved energy services to the world’s poor. As a major contribution to our understanding of how to achieve the MDGs, the authors propose quantitative and time-bound energy targets for low-income countries and derive goal-oriented strategies for meet-ing them.
This report has been prepared by a group of leading experts who con-tributed in their personal capacity and volunteered their time. I am grate-ful for their thorough and skilled efforts, and am certain that this report will make an important contribution to achievement of the Millennium Development Goals. In particular, I hope that developing countries will find the report helpful as they prepare their first MDG-based development

strategies. I recommend it to anyone who is interested in how energy services contribute to the achievement of the Goals.
Jeffrey D. SachsDirectorUN Millennium ProjectNovember 2005

Contents
Foreword ...................................................................................................... iii
Acknowledgements .......................................................................................ix
Executive Summary .......................................................................................1 Key Recommendations ............................................................................2 Structure of the Report ............................................................................5CHAPTER 1: Meeting the MDGs—The Energy Challenge ........................7 The Importance of Energy Services .........................................................7 Where are the Energy Poor? .....................................................................9 Meeting the Energy Challenge ..............................................................13 National Strategies to Achieve the MDGs .............................................14
CHAPTER 2: Energy and the MDGs ........................................................17 Growth and Income Poverty Reduction (MDG Target 1) .....................17 Hunger (MDG Target 2) .......................................................................23 Education (MDG Target 3) ...................................................................24 Gender Equality (MDG Target 4) .........................................................25 Health (MDG Targets 5–8) ..................................................................27 Environmental Sustainability (MDG Target 9) .....................................29 Water Supply and Sanitation (MDG Target 10) ....................................32 Summary ...............................................................................................32
CHAPTER 3: MDG-Compatible Energy Services and Targets ..................35 Types of Energy Access Needed .............................................................35 Setting Energy Targets for Meeting the MDGs .....................................38

vi
CHAPTER 4: Strategies and Technology Options for Meeting the Energy Targets ...................................................................41
Energy for Cooking ...............................................................................44 Electricity for Urban and Peri-Urban Areas ...........................................50 Modern Energy Services for Rural Communities ..................................53 Energy Technology Options and the Environment ................................63
CHAPTER 5: Implementation Challenges .................................................65 Challenges Facing Energy Institutions and Systems ...............................66 Integrate Energy Planning and Implementation into
a National Strategy ................................................................................67 Be Flexible in Energy Planning ..............................................................67
Design Effective Regulatory Framework ................................................68 Reduce Costs through Financing Mechanisms and Subsidies ................68 Enhance Human Capacity through Education, Training, and Research ..........................................................................................70
Address Regional and International Issues .............................................71
CHAPTER 6: Conclusion ...........................................................................73
Appendices ...................................................................................................75I. MDG and Energy Workshop (1 October 2004) Participants ..............75II. Computing Annual Per Capita Costs of Meeting Energy Goals:
The Example of Kenya ........................................................................77III. Providing Energy Services for the MDGs: Assessing
Needs and Planning for Scaling Up ....................................................86
References ....................................................................................................91
Acronyms .......... ………………………………………………………………99
Boxes1. What are energy services? ......................................................................92. The 10 key recommendations of the UN Millennium Project ............143. The impact of energy on women’s lives in rural India .........................264. Factors that influence the cost and efficacy of energy services
in urban and rural areas ......................................................................425. Energy efficiency .................................................................................436. LPG subsidies in Brazil: 1973–2003 ...................................................477. Diesel-powered multifunctional platform (MFP) in Mali ...................598. Gains possible in a transition to electricity:
An example from Kenya ......................................................................61
Contents

vii
9. Electricity services in Urambo Village, Tanzania ................................62II.1 The geographic disaggregation factor ..................................................85
Figures1. World map of electricity use per capita by country ..............................112. Number of people (actual and projected) without electricity,
1970–2030, by region .........................................................................113. Percentage of households using traditional biomass fuel,
by country ...........................................................................................124. Commercial energy consumption and GDP, 2000 ..............................185. The share of energy sources to the energy consumption of
100 developing and transition countries, by poverty levels and energy type ...................................................................................21
6. Time spent (in hundreds of hours) and the transport burden (measured in tones per km), in Tanzania, per person per year, disaggregated by gender and tasks .......................................................25
7. Unlocking local capital by bringing the grid closer .............................548. Variation in total three-phase, medium-voltage line cost
(labor and materials) for selected countries .........................................56
Tables1. Number of people relying on traditional biomass for
cooking and heating in developing countries, 2000 ............................132. GDP per capita, energy consumption, and poverty
in selected countries, with emphasis on sub-Saharan Africa ................193. Important linkages between energy services and the
Millennium Development Goals .........................................................334. Urban and rural dimensions of energy use in selected
sub-Saharan African countries ............................................................43
II.1 Estimated annual national and per capita costs of energy interventions in Kenya .............................................................78
II.2 Data and assumptions supporting intervention cost estimates in Kenya .......................................................................79
III.1 Estimates of MDG-compatible modern-cooking-fuel consumption levels ..............................................................................89
III.2 Estimates of MDG-compatible electricity consumption levels ............90
Contents

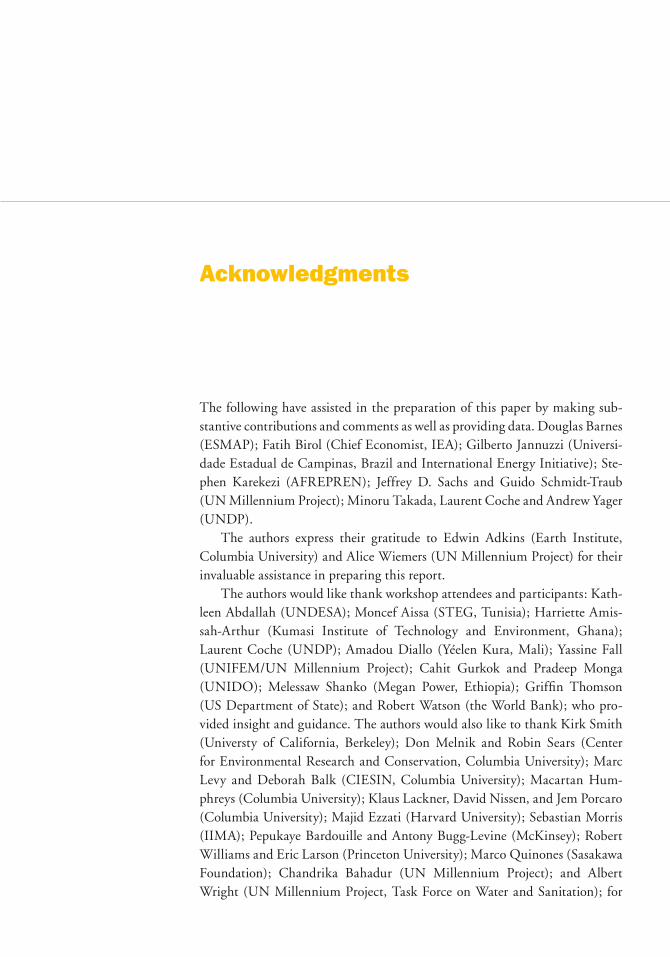
The following have assisted in the preparation of this paper by making sub-stantive contributions and comments as well as providing data. Douglas Barnes (ESMAP); Fatih Birol (Chief Economist, IEA); Gilberto Jannuzzi (Universi-dade Estadual de Campinas, Brazil and International Energy Initiative); Ste-phen Karekezi (AFREPREN); Jeffrey D. Sachs and Guido Schmidt-Traub (UN Millennium Project); Minoru Takada, Laurent Coche and Andrew Yager (UNDP).
The authors express their gratitude to Edwin Adkins (Earth Institute, Columbia University) and Alice Wiemers (UN Millennium Project) for their invaluable assistance in preparing this report.
The authors would like thank workshop attendees and participants: Kath-leen Abdallah (UNDESA); Moncef Aissa (STEG, Tunisia); Harriette Amis-sah-Arthur (Kumasi Institute of Technology and Environment, Ghana); Laurent Coche (UNDP); Amadou Diallo (Yéelen Kura, Mali); Yassine Fall (UNIFEM/UN Millennium Project); Cahit Gurkok and Pradeep Monga (UNIDO); Melessaw Shanko (Megan Power, Ethiopia); Griffin Thomson (US Department of State); and Robert Watson (the World Bank); who pro-vided insight and guidance. The authors would also like to thank Kirk Smith (Universty of California, Berkeley); Don Melnik and Robin Sears (Center for Environmental Research and Conservation, Columbia University); Marc Levy and Deborah Balk (CIESIN, Columbia University); Macartan Hum-phreys (Columbia University); Klaus Lackner, David Nissen, and Jem Porcaro (Columbia University); Majid Ezzati (Harvard University); Sebastian Morris (IIMA); Pepukaye Bardouille and Antony Bugg-Levine (McKinsey); Robert Williams and Eric Larson (Princeton University); Marco Quinones (Sasakawa Foundation); Chandrika Bahadur (UN Millennium Project); and Albert Wright (UN Millennium Project, Task Force on Water and Sanitation); for
Acknowledgments

x Energy Services for the Millennium Development Goals
fruitful discussions. The findings, interpretations, and conclusions expressed herein are entirely those of the authors, and should not be attributed in any manner to the organizations they represent.

Executive Summary
The Millennium Development Goals (MDGs) are the international community’s bold commitment to halving poverty in the world’s poorest countries by 2015. While some of the world’s poor countries have seen tremendous success in poverty reduction over the past decades and are on track to achieve the MDGs, many others are lagging. This report specifically addresses the role of energy services in meeting the MDGs in the lagging countries. Energy services refer to the services that energy and energy appliances provide. Such services include lighting, heating for cooking and space heating, power for transport, water pumping, grinding, and numerous other services that fuels, electricity, and mechanical power make possible. The core message of the report is that energy services are essential to both social and economic development and that much wider and greater access to energy services is critical in achieving all of the MDGs.
UN Secretary-General Kofi Annan commissioned the UN Millennium Proj-ect as an advisory body to recommend practical ways to help every country to achieve the MDGs. The UN Millennium Project brought together experts from around the world—from academia, civil society, government, the private sector, and multilateral organizations—to make recommendations on how the interna-tional system can ensure that the MDGs are achieved.
In line with the UN Millennium Project more broadly, this report on energy addresses three crucial components: firstly, a rigorous understanding of the energy services that drive and, when absent, impede progress towards achieving the MDGs in different parts of the world; secondly, a clear sense of the operational challenges faced by the world’s poorest countries in providing these services; and thirdly, a systematic set of recommendations as to how these energy challenges can be met.
Just two glaring statistics illustrate the scale of the energy services gap that the poor face. Worldwide, nearly 2.4 billion people use traditional biomass fuels for
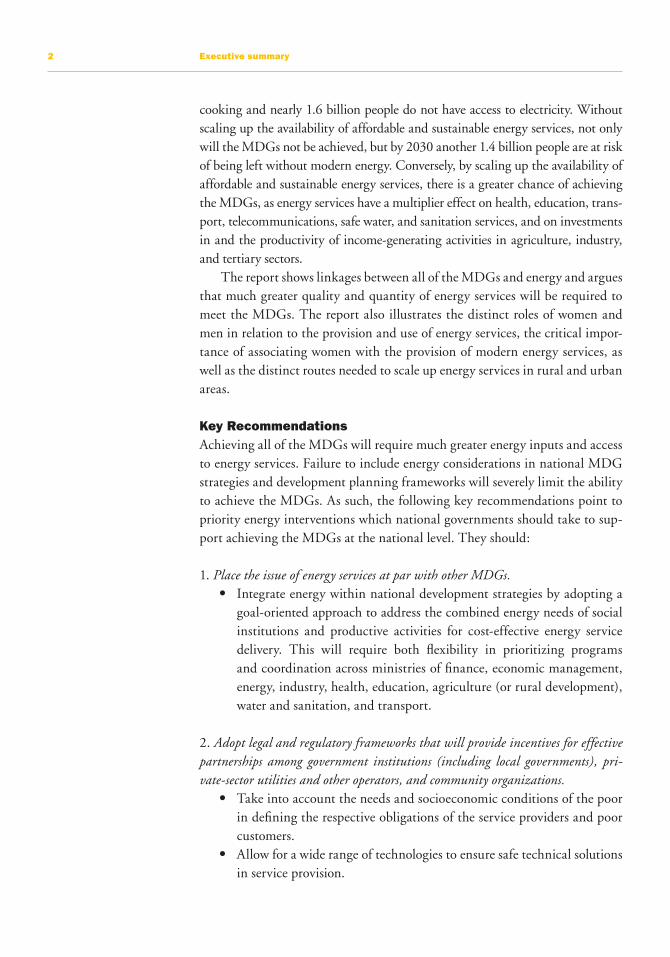
2 Executive summary
cooking and nearly 1.6 billion people do not have access to electricity. Without scaling up the availability of affordable and sustainable energy services, not only will the MDGs not be achieved, but by 2030 another 1.4 billion people are at risk of being left without modern energy. Conversely, by scaling up the availability of affordable and sustainable energy services, there is a greater chance of achieving the MDGs, as energy services have a multiplier effect on health, education, trans-port, telecommunications, safe water, and sanitation services, and on investments in and the productivity of income-generating activities in agriculture, industry, and tertiary sectors.
The report shows linkages between all of the MDGs and energy and argues that much greater quality and quantity of energy services will be required to meet the MDGs. The report also illustrates the distinct roles of women and men in relation to the provision and use of energy services, the critical impor-tance of associating women with the provision of modern energy services, as well as the distinct routes needed to scale up energy services in rural and urban areas.
Key Recommendations Achieving all of the MDGs will require much greater energy inputs and access to energy services. Failure to include energy considerations in national MDG strategies and development planning frameworks will severely limit the ability to achieve the MDGs. As such, the following key recommendations point to priority energy interventions which national governments should take to sup-port achieving the MDGs at the national level. They should:
1. Place the issue of energy services at par with other MDGs. • Integrate energy within national development strategies by adopting a
goal-oriented approach to address the combined energy needs of social institutions and productive activities for cost-effective energy service delivery. This will require both flexibility in prioritizing programs and coordination across ministries of finance, economic management, energy, industry, health, education, agriculture (or rural development), water and sanitation, and transport.
2. Adopt legal and regulatory frameworks that will provide incentives for effective partnerships among government institutions (including local governments), pri-vate-sector utilities and other operators, and community organizations.
• Take into account the needs and socioeconomic conditions of the poor in defining the respective obligations of the service providers and poor customers.
• Allow for a wide range of technologies to ensure safe technical solutions in service provision.

3
3. Improve the affordability, availability, and safety of cooking fuels and practices.
• Enable the use of modern cooking fuels through regulatory reforms; investments in the handling, transport, and distribution of fuels; and well-designed subsidies (or safety nets) for the poor.
• Reduce the first-cost burden of LPG1/kerosene stoves/cylinders and reduce the incremental recurring costs associated with the use of mod-ern fuels. These measures can encourage fuel switching especially in urban and peri-urban settings, where there is already a market for tradi-tional biomass and charcoal.
• Adopt measures to increase the sustainable production of biomass and exploit linkages of biomass production with agriculture, agroforestry, animal husbandry, waste treatment, ecosystem services, forestry, carbon credits, and income generation.
• Support efforts to develop and adopt the use of sustainable biomass and biomass-derived fuels, improved stoves, and practices that reduce exposure to harmful emissions. Increase the efficiency of conversion of biomass to biomass-derived cleaner fuels.
4. Adopt strategic, institutional, and financial measures to ensure wider access for households and small businesses in urban and peri-urban settings to services such as illumination and power, information and communication technology (ICT), refrigeration, and other beneficial uses.
• Reduce the cost burden of connection and distribution fees to enable electricity access for the poor in urban and peri-urban areas. A com-bination of strategies such as working with community organizations, lowered unit costs, subsidies, financing, and payment mechanisms can reduce the first-cost burden.
5. Adopt measures to ensure reliable electricity supply to households, businesses, public institutions, commercial establishments, and industry.
• Enable payment and cost-recovery mechanisms that will ensure the financial health of energy service delivery entities so that they can pro-vide reliable service and expand services.
• Create incentives to increase generation capacity and invest in distribu-tion infrastructure to serve a larger population.
Executive summary
1 LPG stands for Liquified Petroleum Gas. LPG is a mixture of propane and butane, gases that can be easily liquefied under pressure for ease of storage and transport in specialized canisters.

4
6. Provide access to mechanical power (for water lifting/delivery systems and agroprocessing) and electricity for public facilities (health clinics/centers, schools, government offices, and community centers) in all rural communities.
• Aggregate demand across multiple social and income-generating needs within the community, thus lowering unit costs. Location of these services for small businesses and/or cooperatives at some central point within a rural community can lead to even greater aggregation of demand, further lowering unit costs as well as unlocking local pri-vate capital.
• Emphasize immediate wider access and scalability through use of low-cost transitional technologies since these will be substituted eventually as affordability and energy demand evolve as income levels increase.
7. Take a flexible approach to selecting from a wide range of technologies as well as a wide range of institutional structures for the delivery of energy services.
• Include the entire spectrum of primary energy sources, distribution and end-use technologies from which proven, robust, and cost-effec-tive technologies can be chosen for implementation at larger scales with appropriate standards.
8. Develop energy infrastructure and institutions that directly benefit women and the poor.
• Energy services delivery mechanisms for household, productive and social sector uses should take into account the distinct energy services used by men and women and how their availability impacts men and women in economic and social terms
• Women should be included at all points of the project, policy and development planning process both as energy providers and energy users.
9. In order to develop and rapidly scale up energy services, enhance human capac-ity through energy-related education, training, and research.
• Training needs to include regulators, financiers, policymakers, techni-cians, community outreach workers, and people with local business skills/entrepreneurs to support the delivery of services.
10. Incorporate the cost of energy service delivery needed to support the achieve-ment of the MDGs into all national MDG strategies.
• A costing methodology using the example of Kenya is presented in Appendix II. It can serve as one of the methodologies that can be used for other countries.
Executive summary

5
Structure of the ReportChapter 1 explores global patterns of energy use among the wealthy and the poor as a basis for understanding the challenges that lie ahead in expand-ing access for the poor, with special emphasis on the impacts of traditional energy consumption. It then briefly describes the overall findings of the UN Millennium Project. Chapter 2 details the extensive interconnections between the MDGs themselves and energy needs throughout the poorest parts of the developing world. Chapter 3 discusses MDG-compatible energy services and proposes three time-bound, quantitative energy service targets for meeting the MDGs. Chapter 4 describes concrete national energy strategies for meeting these targets, and considers each of the three main areas for intervention in greater detail, with attention to technological, financing, geographic, and other aspects of possible solutions. Chapter 5 discusses a variety of issues related to planning and implementation, particularly the institutional and financial fac-tors that can hinder the efforts to expand energy access for the poor, and Chap-ter 6 offers summary conclusions.
Executive summary


CHAPTER 1: Meeting the MDGs— The Energy Challenge
At the United Nations Millennium Summit in September 2000, world leaders placed development at the heart of the global agenda by adopting the Millen-nium Declaration from which the Millennium Development Goals (MDGs) were later extracted. The MDGs provide concrete, time-bound objectives for dramatically reducing extreme poverty in its many dimensions by 2015—income poverty, hunger, disease, exclusion, and lack of infrastructure and shel-ter—while promoting gender equality, education, health, and environmental sustainability. These were reaffirmed by all world leaders at the 2005 World Summit in New York. This report addresses how the energy services needed to achieve the MDGs can be provided.
Many regions are off-track to meet the Goals. Sub-Saharan Africa is the epicenter of a global crisis, and as a region is off track in meeting all of the MDGs. Despite significant progress, East and South Asia still have the larg-est absolute number of poor people, with more than 270 million in East Asia and 430 million in South Asia living below the poverty line, all vulnerable to droughts, natural disasters, and other shocks. Latin America, despite rela-tively lower rates of poverty, has failed to make significant progress toward the Goals in the past decade, with large pockets of poverty and high and stagnant inequality. The former Commonwealth of Independent States (CIS) countries in Central Asia have regressed on several social indicators and face tremendous social, economic, and environmental challenges.
The Importance of Energy Services Even though no MDG refers to energy explicitly, improved energy services—including modern cooking fuels, improved cookstoves, increased sustain-able biomass production, and expanded access to electricity and mechanical power—are necessary for meeting all the Goals (see Box 1). The link between

8 Energy Services for the Millennium Development Goals
energy services and poverty reduction was explicitly identified by the World Summit on Sustainable Development (WSSD) in the Johannesburg Plan of Implementation (JPOI), which called for the international community to: “Take joint actions and improve efforts to work together at all levels to improve access to reliable and affordable energy services for sustainable development sufficient to facilitate the achievement of the MDGs, including the Goal of halving the proportion of people in poverty by 2015, and as a means to gener-ate other important services that mitigate poverty, bearing in mind that access to energy facilitates the eradication of poverty” (ESMAP 2002a, p. 2).
Cooking with fuelwood, crop residues, and dung is associated with a sig-nificantly higher disease burden than other forms of cooking, due to indoor air pollution. Cleaner fuels and cookstoves that facilitate lower smoke exposures, as well as improved ventilation of cooking areas, can reduce the disease burden from smoke, lower child mortality rates, and improve maternal health. Greater efficiency, combined with enhancements in biomass fuel availability through such programs as agroforestry, can also reduce the time and transport burden of women and young girls who collect biomass, thereby increasing opportuni-ties for education and income-generating work. These and other improvements can all lessen the pressure on fragile ecosystems.
Electricity is critical for providing basic social services, including education and health, where lack of energy often undermines sterilization, water supply and purification, sanitation, and refrigeration of essential medicines. Electric-ity can also power machines that support income-generating opportunities such as pumping water for agriculture, food processing, apparel production, and light manufacturing. In rural areas, lack of modern energy services can decrease the willingness of more-educated workers (such as teachers, doctors, nurses, and extension agents) to reside in those areas, further limiting services and opportunities to local populations. Similarly, those who have left such communities and fared well elsewhere are less likely to return to an area with-out modern services.
Since the evidence linking provision of energy services with achievement of social objectives and generation of economic growth is strong and well docu-mented, this report recommends strategies for achieving the MDGs and maps out policy changes and investments required for improving access to energy services in urban and rural areas. Chapter 2 discusses these critical links in more detail.
The particular focus of this report is to address the role of energy ser-vices in the poorest countries that are caught in a poverty trap. Modern forms of energy such as electricity, natural gas, clean cooking fuels, and mechani-cal power are necessary to increase the productivity of agriculture and labor, improve the health of the population, lower transaction and transport costs, and reduce risks through better information. They therefore serve as a founda-tion supporting a virtuous cycle of growth.

9
Box 1. What are
energy services?
Where are the Energy Poor?In many of the poorest countries, a large fraction of the population is unable to access modern energy services at all, and those who do have access often pay dearly for energy services of much lower quality—meaning that the services are erratic and unreliable. A substantial fraction of the population relies on bio-mass or dung for cooking fuel and heat; on kerosene wick lamps, batteries, or candles for lighting; and on human or animal energy-based mechanical power for tilling and weeding land, grinding and crushing, agroprocessing, or trans-port. The poorest households spend a large portion of their total income and human resources on energy because some forms of energy are absolutely essen-tial to meeting such basic needs as cooked food and transport. Insufficient and unreliable power limits the ability of enterprises to expand their activities, to be competitive, or to create new activities or jobs. The largest concentrations of the ‘energy poor,’ those people who are both poor and who also lack access to modern forms of energy, are currently in sub-Saharan Africa and South Asia.
One measure of energy poverty at the level of the poorest is the inability to cook with modern cooking fuels and the lack of a bare minimum of electric lighting to read, or for other household and productive activities after sunset. These minimum needs correspond to about 50 kilograms of oil equivalent (kgoe) of annual commercial energy per capita; this estimate is based on the need for approximately 40 kgoe per capita for cooking and 10 kgoe used as fuel for electricity.2 This represents just the most basic household energy needs
Energy services are the benefits that energy carriers produce for human well being. Exam-
ples of energy services include heat for cooking, illumination for home or business use,
mechanical power for pumping or grinding, communication, and cooling for refrigeration.
Energy services can be derived from a variety of energy carriers. For instance, illumina-
tion can be produced by fuels or by electricity. Mechanical power can be produced from
kinetic or potential energy of water, from kinetic energy of wind, from a liquid fuel, or
from electricity. Energy carriers, in turn, can be derived from a variety of primary energy
sources; electricity for example can be generated from hydropower, petroleum, solar, or
wind energy. From the point of view of the user, what matters is the energy service not the
source. Whether in business, home, or community life, what matters are the reliability,
affordability, and accessibility of the energy service. Therefore, it is essential to have a
clear understanding of which energy services are needed to support the MDGs, and to
examine the role that different energy carriers can play in providing these services in the
most practical and affordable fashion to support human development at large.
2 kgoe is the unit used as a common metric to quantify energy supplied using a variety of sources and carriers by converting them into oil equivalent units.
Meeting the MDGs
10 Energy Services for the Millennium Development Goals
for cooking and lighting; not included are energy consumption for agricul-ture, transport, community-level needs such as grinding and social services, or industrial, commercial, and government activities. Even in India, where annual commercial energy consumption per capita is between 400 and 500 kgoe, the poor often cannot afford, or may not have access to, 50 kgoe. This reflects both income inequality and limited availability, since energy is crucial not only for households, but also for industry, commercial enterprises, small and medium businesses, educational institutions, government offices, public transportation systems, health clinics, water supply systems, communication infrastructure, and street lighting.
Lack of reliable supply can impair a person’s ability to use modern energy services. For example, even if one can obtain an electricity connection, as is generally the case in an urban area, the supply may be unreliable or the con-nection unaffordable, or both, and hence energy services that are best derived from electricity may remain inaccessible. For those living in slums, many fac-tors can further hamper access to electricity services, such as lack of street addressing, lack of formal housing registration, and tariff structures and pay-ment mechanisms that are not adapted to the customer base. A combination of these factors and other broader issues affecting the performance of the utilities (for example, theft of electricity, legal structures to enforce power purchase contracts, the institutional structure of the utility itself, and the inability to enforce bill collection) can lead to lack of investment in electricity generation and distribution networks, or in development of fuel supply infrastructure, making it even more difficult to extend services to those not served.
In addition to generation or supply shortfall and insufficient distribution infrastructure for efficient energy carriers (such as electricity and clean gas or liquid fuels), the lack of access to end-use appliances, particularly those that impact women (such as mills, motors, and pumps), further hampers the use of modern energy services.
An examination of current national electricity consumption per capita highlights the differences between equatorial and non-equatorial regions in general, and between sub-Saharan Africa and the rest of the world in particu-lar. Figure 1 is a map showing current per capita electricity use by country. Figure 2 shows the actual and projected number of people without electricity, by region, over several decades. In most parts of the world, investments in energy services have outpaced population growth. The steep fall in the number of people without access to electricity is particularly noticeable in East Asia during the 1980s and 1990s. In South Asia, it is expected that falling fertility rates and increased investments will substantially reduce the number of people without access. The only region where the expansion of services has not kept pace with population growth is sub-Saharan Africa, where the total number of people without access to electricity has increased steadily and is projected to continue to do so for the next couple of decades.

11
Figure 2. Number of people
(actual and projected) without electricity,
1970–2030, by region
Source: IEA 2002b.
1970
1980
1990
2000
2010
2020
2030
0
100
200
300
400
500
600
700
800
900
Mill
ion
South Asia
East Asia/China Latin America
Middle Eastsub-Saharan Africa
North Africa
Meeting the MDGs
Figure 1. World map of
electricity use per capita by country
Source: UNDP 2004b.
26–50
No data0–25
51–7576–100
101–250
251–500501–1,000
1,001–2,500
2,501–5,0005,001–30,000
Electricity consumption per capita, kWh, 2001

12 Energy Services for the Millennium Development Goals
However, the direct use of solid biomass—a variety of solid fuels such as charcoal, fuelwood, stalks and other farm waste or dung—is widespread in the poorest parts of the world. Thus another way to determine where the energy-poor are is to look at geographical and quantitative data on the number and distribution of people who rely on traditional biomass fuels for cooking and heating (See Figure 3 and Table 1). The lack of access to improved cooking fuels is most extreme in sub-Saharan Africa, followed by South Asia.
Figure 3. Percentage of
households using traditional biomass
fuel, by country
Source: Gordon et al. 2004.
<5050–70
70–8080–90
>90No data
Households using biomass fuel (%)

13
Table 1. Number of people
relying on traditional
biomass for cooking
and heating in
developing countries,
2000
Source: IEA 2002b
Meeting the Energy ChallengeProgress toward providing greater access to modern energy services has been slow, due to a combination of interrelated circumstances. These include low income levels among the unserved population; lack of financial resources for service providers to build the necessary infrastructure and reduce first-cost bar-riers to access; weak institutional, financial, and legal structures that could otherwise encourage private investment; and lack of long-term vision and political commitment to scale up services.
Can the many obstacles limiting access of the poor to modern energy ser-vices be overcome by 2015? Our conclusion is that this can be done, but many concrete actions will be needed from all stakeholders. This conclusion rests, in large part, on the successful programs undertaken in many developing coun-tries in recent decades. For instance, in considering the question of whether 2.4 billion people can make the transition from solid fuels to cleaner-burning fuels, it is worth noting that the proportion of Brazil’s population using modern cooking fuels such as LPG increased from 16 percent in 1960 to 78 percent in 1985, eventually reaching nearly all by 2004. Similarly, the 1.6 billion people worldwide who are without access to electricity may take heart in the exam-ples set by Tunisia, where the electrification program expanded service from 6 percent of the population in 1976 to 88 percent in 2001; Morocco, where electrification rates reached 72 percent in 2004 (Morocco, Office National de l’Electricité 2005); and China, where electrification rates reached 97 percent in 2004, thanks to sustained political commitment, public funding that com-bined domestic resources and borrowings from the Development Banks and other sources, and effective cost-recovery tariffs and mechanisms from users.
Million % of total population
China 706 56
Indonesia 155 74
Rest of East Asia 137 37
India 585 58
Rest of South Asia 128 41
Latin America 96 23
North Africa/Middle East 8 0.05
sub-Saharan Africa 575 89
Total, Developing Countries 2,390 52
Meeting the MDGs

14 Energy Services for the Millennium Development Goals
Box 2. The 10 key
recommendations of the UN Millennium
Project
National Strategies to Achieve the MDGsThe UN Millennium Project was commissioned by UN Secretary General Kofi Annan to put forward the best strategies for achieving the MDGs. Its central finding is that the MDGs are achievable in the 10 years remaining to 2015, though barely. The world has at its disposal the knowledge, tools, and resources to cut poverty by half in a decade. No new international commitments are needed to achieve the MDG. Existing commitments made at the Millennium Summit, the Monterrey Conference on Financing for Development, and the World Summit on Sustainable Development in Johannesburg, and reaffirmed at the 2005 World Summit, are sufficient, if implemented. The focus must now be on implementation. To this end, the UN Millennium Project has developed 10 key recommendations summa-rized in Box 2.
The UN Millennium Project, an independent advisory body to UN Secretary-General Kofi
Annan, has issued the following key recommendations, which are described in more detail
in its report: Investing in Development: A Practical Plan to Achieve the MDGs.
Recommendation 1
Developing-country governments should adopt development strategies bold enough to
meet the Millennium Development Goal (MDG) targets for 2015. We term them MDG-
based national development strategies. To meet the 2015 deadline, we recommend that
all countries have these strategies in place by 2006. Where Poverty Reduction Strategy
Papers (PRSPs) already exist, those should be aligned with the MDGs.
Recommendation 2
The MDG-based national development strategies should anchor the scaling up of public
investments, capacity building, domestic resource mobilization and official development
assistance. They should also provide a framework for strengthening governance, promot-
ing human rights, engaging civil society, and promoting the private sector.
Recommendation 3
Developing-country governments should craft and implement the MDG-based national
development strategies in transparent and inclusive processes, working closely with civil
society organizations, the domestic private sector and international partners.
Recommendation 4
International donors should identify at least a dozen MDG ‘fast-track’ countries for a rapid
scale up of official development assistance (ODA) in 2005, recognizing that many coun-
tries are already in a position for a massive scale up on the basis of their good governance
and absorptive capacity.
Recommendation 5
Developed and developing countries should jointly launch, in 2005, a group of Quick
Win actions to save and improve millions of lives and to promote economic growth. They
should also launch a massive effort to build expertise at the community level.

15
Meeting the MDGs by 2015 requires a major a shift in development prac-tice. Low-income countries and their development partners currently plan around modest incremental expansions of social services and infrastructure. The UN Millennium Project recommends instead a bold, 10-year investment framework aimed at achieving the quantitative targets set out in the Goals. Rather than strategies to ‘accelerate progress toward the Goals,’ countries need strategies to ‘achieve the Goals,’ which in turn requires a different approach. Instead of asking “How close can we get to the Goals given current financial and other constraints?” countries should ask the question, “Which investments and policy changes are needed to meet the Goals?”
As agreed by all 191 member states of the UN at the 2005 World Sum-mit, each country should be empowered to adopt and implement a national
Recommendation 6
Developing-country governments should align national strategies with such regional initia-
tives as the New Partnership for Africa’s Development (NEPAD) and the Caribbean Com-
munity (and Common Market), and regional groups should receive increased direct donor
support for regional projects.
Recommendation 7
High-income countries should increase official development assistance (ODA) from 0.25
percent of donor GNP in 2003 to around 0.44 percent in 2006 and 0.54 percent in 2015
to support the MDGs, particularly in low-income countries, with improved ODA quality
(including aid that is harmonized, predictable and largely in the form of grants-based
budget support). Each donor should reach 0.7 percent no later than 2015 to support the
Goals and other development assistance priorities. Debt relief should be more extensive
and generous.
Recommendation 8
High-income countries should open their markets to developing country exports through
the Doha trade round and help Least-Developed Countries (LDCs) raise export competi-
tiveness through investments in critical trade-related infrastructure, including electricity,
roads and ports. The Doha Development Agenda should be fulfilled and the Doha Round
completed no later than 2006.
Recommendation 9
International donors should mobilize support for global scientific research and develop-
ment to address special needs of the poor in the areas of health, agriculture, natural
resource and environmental management, energy and climate. We estimate the total
needs to rise to approximately US$7 billion a year by 2015.
Recommendation 10
The UN Secretary-General and the UN Development Group should strengthen the coordi-
nation of UN agencies, funds, and programs to support the MDGs, at headquarters and
country level. The UN Country Teams should be strengthened and should work closely with
the international financial institutions to support the Goals.
Meeting the MDGs

16 Energy Services for the Millennium Development Goals
development strategy to achieve the MDGs. Existing strategies, including PRSPs, need to be aligned with the Goals. An integrated approach will include strategies in the areas of rural and urban development (including provision of infrastructure such as clean drinking water, sanitation facilities, energy, and transport), health, education, gender equality, environmental sustainability, science and technology, and public sector management. Thus energy services remain a key component of any such strategy.
An MDG-based national development strategy will outline human resource, infrastructure, and financial needs and determine what support is necessary from the international community. Developing countries need to craft and implement such MDG-based strategies in transparent and inclu-sive processes, working closely with civil society organizations, the domestic private sector, and international partners. The countries’ international devel-opment partners—including bilateral donors, UN agencies, regional develop-ment banks, and the Bretton Woods institutions—can provide critical support to the preparation and implementation of MDG-based national development strategies. In particular, official development assistance should be sufficient to fill the financing needs and subject to clear accountability. This also assumes that recipient countries make their own reasonable efforts at increasing domes-tic resource mobilization and at facilitating private-sector participation.
Achieving all of the MDGs will require much greater energy inputs and access to energy services. Failure to include energy considerations in national development strategies and development planning frameworks will make it impossible to achieve the MDGs.
Without energy services of adequate quality and quantity countries cannot meet the MDGs. This chapter summarizes the available evidence linking energy services and the Goals and Targets of the Millennium Declaration. We show that energy services directly affect income poverty and other dimensions of poverty, such as gender inequality, poor health, lack of education, or lack of access to infrastructure services. An excellent summary of these linkages was developed by the United Kingdom’s Department for International Develop-ment (DFID) and is presented at the end of the chapter.
Growth and Income Poverty Reduction3 (MDG Target 1)Modern energy services help drive economic growth by improving productiv-ity and enabling local income generation through improved agricultural devel-opment and non-farm employment. When they are available to all income groups, modern energy services are also an invaluable means of improving social equality.
Productive uses of energy are particularly important to economic growth. Modern fuels and electricity, for example, help boost household income by providing lighting that extends livelihood activities beyond daylight hours. They power machines that save time and increase output and value added. By providing additional opportunities for employment, energy services also enable farmers to diversify their income sources, and thus mitigate the inherent risks associated with agriculture-dependent livelihoods. Energy is important in sup-porting productive activities in both formal and informal sectors.
Another way modern energy services contribute to economic growth is by reducing unit costs. Due to the inefficiency of commonly used items such as
CHAPTER 2: Energy and the MDGs
3 Text based on UNDP 2005.

18 Energy Services for the Millennium Development Goals
Figure 4. Commercial energy
consumption and GDP, 2000
Source: United Nations
Common Database, 2000.
batteries, candles, kerosene, and charcoal, the poor often pay higher unit costs for energy than do the rich. The use of more efficient fuels can reduce the large share of household income spent on cooking, lighting, and keeping warm, thus saving families much needed income for food, education, health services, and other basic needs.
There are vastly different energy consumption levels across countries and regions, primarily dictated by large disparities in income. Energy consumption is highly correlated with higher GDP per capita, as illustrated in Figure 4.
Log (GDP per capita in $PPP)
Note: This is a log-log plot of per capita commercial energy consumption (kgoe) vs. GDP (in$PPP). In a log-log plot, the x- and y-axis numbers 0, 1, 2, 3, 4 ... correspond to 1, 10, 100, 1,000, 10,000...
Table 2 shows the UNDP Human Development Index (HDI) rank, annual per capita commercial energy consumption (in kgoe), and electricity consumption (in kilowatt hours or kWh) for several countries. It also shows measures of poverty such as the per capita income in purchasing power parity dollars ($PPP) and the percentage of the population earning below US$1 per day and US$2 per day (where income is also in $PPP). The data show that there is considerable variation among poor countries; however, these differ-ences are small relative to the energy consumption of wealthy countries. Note that biomass energy sources are not included here, that a significant portion of the energy consumption is not household consumption, and that commercial energy consumption across households also varies. Low commercial energy use is also correlated with high infant mortality, illiteracy and fertility, and with low life expectancy (UNDP 2000, p. 42).
Log
(Com
mer
cial
Ene
rgy
Con
sum
ptio
n pe
r C
apit
a (k
goe)
)
China
South Korea
United States
Senegal
IndiaGhana
Bangladesh
Cambodia
Kenya
EthiopiaChad
2.5 3 4 4.53.5
0
1
2
3
-1
Uganda

19Energy and the MDGs
Table
2G
DP
pe
r ca
pit
a, e
ne
rgy
consu
mpti
on,
an
d p
ove
rty
in
sele
cte
d co
untr
ies,
wit
h e
mp
hasi
s o
n su
b-S
aha
ran
Afr
ica
Sou
rces
: H
DI c
ount
ry r
anki
ngs
from
UN
DP
20
04
b; G
DP,
pop
ulat
ion,
and
inco
me
data
fr
om W
orld
Ban
k 2
00
4b;
per
cap
ita
elec
tric
ity
cons
umpt
ion
from
UN
Dep
artm
ent
of E
cono
mic
and
Soc
ial A
ffai
rs (
pers
onal
cor
resp
onde
nce,
Mar
ch 2
00
4);
per
cap
ita
com
mer
cial
ene
rgy
cons
umpt
ion
from
Uni
ted
Nat
ions
Com
mon
Dat
abas
e.
HD
I R
an
kC
ou
ntr
yG
DP
pe
r ca
pit
a
Ele
ctri
city
co
nsu
mpti
on
pe
r ca
pit
a
Co
mm
erc
ial
ene
rgy
consu
mp
-ti
on
pe
r ca
pit
aP
op
ula
tio
n be
low
inco
me p
ove
rty
line (
%)e
US
$
20
02
$PP
P
20
02
kWh
2
001
kgoe
2
00
0U
S$
1 p
er d
ayf
19
90
–20
02
US
$2 p
er d
ayg
19
90
–20
02
Nat
iona
l po
vert
y lin
e
19
90
–20
01
8U
nite
d S
tate
s3
6,0
06
a3
5,7
50
a1
3,2
417,
725
––
–9
Japa
n31,4
072
6,9
40
8,2
03
3,7
30
––
–2
8K
orea
, R
ep. of
10,0
06
16
,95
06,6
32
3,2
84
<2
.0<
2.0
–72
Bra
zil
2,5
93
7,770
2,1
22
717
8.2
22
.417
.49
4C
hina
98
94,5
80
1,1
39
561
b16
.64
6.7
4.6
11
9S
outh
Afr
ica
2,2
99
10,0
704
31
32,6
49
c7.
12
3.8
–1
27
Indi
a4
87
2,6
705
61
31
83
4.7
79.9
28
.61
31
Gha
na3
04
2,1
30
40
41
20
44
.878
.53
9.5
14
6U
gand
a2
36
1,3
90
66
26
82
.2d
96
.4d
44
.014
8K
enya
39
31,0
20
14
09
62
3.0
58
.652
.01
57
Sen
egal
50
31,5
80
151
12
82
6.3
67.
83
3.4
16
5M
alaw
i17
75
80
7627
h41
.776
.16
5.3
167
Cha
d24
01,0
20
12
5h
––
64
.017
0Et
hiop
ia9
078
03
02
92
6.3
80.7
44
.217
4M
ali
29
69
30
34
18
h72
.89
0.6
63
.817
6N
iger
19
08
00
413
3h
61
.48
5.3
63
.0
a Pr
actica
l iss
ues
aris
ing
in t
he c
alcu
lation
of th
e PP
P U
S d
olla
r G
DP
mak
e th
ese
valu
es d
iffe
rent
.
b D
oes
not
incl
ude
Hon
g K
ong,
Mac
ao, an
d Ta
iwan
, C
hina
. c
Sou
th A
fric
an C
usto
ms
Uni
on.
d U
ND
P 2
00
3; W
orld
Ban
k 2
00
3.
e D
ata
refe
r to
the
mos
t re
cent
yea
r av
aila
ble
during
the
per
iod
spec
ifie
d.
f Po
vert
y lin
e is
equ
ival
ent
to U
S$
1.0
8 (1
99
3 $
PPP)
.
g Po
vert
y lin
e is
equ
ival
ent
to U
S$
2.1
5 (1
99
3 $
PPP)
. h
Estim
ate,
UN
Sta
tist
ics
Div
isio
n.–
Not
ava
ilabl
e

20
These and other data illustrate that increased energy consumption cor-relates closely with both income levels and economic growth. For example, an increase from 30 to 300 kgoe in primary commercial energy consumption has a strong association with dramatically improved living standards.
While the selection of countries in Table 2 is arbitrary, it is designed to represent a wide range of income levels. It shows important general patterns among sub-Saharan African countries as well as among middle-income devel-oping countries. The three columns of poverty data show that while Brazil and China enjoy, on average, considerably higher GDP per capita than the poorest countries, they nonetheless have significant poor populations. Consid-ered broadly, these data suggest that it is not unrealistic to associate per capita commercial energy consumption levels of about 500 kgoe—a value based on a nation’s total, not just residential, consumption—with a substantial reduction in the number of poor for the poorest countries. Simplistic as this analysis is, a review of studies that attempt rigor in obtaining the precise energy–economic growth relationships have failed to provide estimates that are much better. This is due to variations in other key factors, such as a country’s economic structure, its geography, the particular domestic energy resources and technologies avail-able, and the costs of energy to consumers.
In addition to the level of energy consumption, the type of fuels used also varies across countries by income levels. Figure 5 shows the contribution of various energy sources to the total average per capita final energy consumption of one hundred developing and transition countries. The countries are grouped according to their share of population living on less than US$2 per day.
It is instructive to observe which modes of final energy consumption grow, and by how much, with decreasing poverty levels. What is evident here is the dramatic difference in the topmost segment of the bar graph (liquid fuels) between a representative country with more than 75 percent of the popula-tion living below US$2 per day and one with 40–75 percent living on less than US$2 per day. Liquid fuels are used primarily for transportation and, to a lesser extent, in industry and households. While Figure 5 masks the differ-ences in energy use patterns in individual countries, it illustrates, in an aggre-gate sense, the importance of transportation and fuel needs within a country’s combined energy sources.
Once again, the figure suggests that, when comparing countries represented by the first bar on the left (countries with greater than 75 percent of the popu-lation living with incomes below US$2 per day) with those represented by the second bar from the left (countries with 40–75 percent of the population earn-ing less than US$2 per day), an increase in per capita non-biomass energy con-sumption from about 50 to 400 kgoe is observed. For countries with the larg-est proportion of population living on less than US$2 per day, biomass is the single most important source of energy, largely due to the heating and cooking needs that people cannot go without. This is a similar level of primary energy

21
consumption that was suggested earlier based on the experience of China and Brazil as indicated by Table 2. This discussion provides us with a rough quantita-tive estimate of the overall level of primary energy consumption that includes all modes of consumption and not just household consumption.
At the household scale, modern energy services directly contribute to eco-nomic growth and poverty reduction. They create opportunities for income generation, reduce unit costs, and enable increased income from agriculture or animal husbandry by permitting pumping for supplementary irrigation, which lessens the risks associated with rainfed systems and enables increasing crop and pasture productivity as well as switching to higher-value crops. Indirect contributions to economic growth may come in the form of freeing up time for other productive activities, improved health and education, improved access/supply of clean drinking water, and reduced local environmental degradation.
At the village, town, city and national scale, lack of reliable and affordable electricity supply can also become an impediment to income-generating indus-trial, commercial, and service activities. A recent United Nations Economic Commission for Africa report (UNECA 2004) finds the current energy infra-structure in many African countries to be simply insufficient to support export diversification and ultimately sustainable economic development.
The increased productivity of human capital provided by energy services is evident in the developed world. For example, electricity can allow people to operate computers and file servers, and use telephones and the Internet, which can in turn lead to a large increase in the productivity of human labor. A single trained professional can provide services to a much larger number of people with improved transport and ICT. Mechanical power or electricity that can be then used for mechanical power can also provide opportunities for
Figure 5. The share of energy
sources to the energy consumption of 100
developing and transition countries, by poverty levels and
energy type
Source: IEA 2002b
Aver
age
tota
l fin
al c
omsu
mpt
ion
per
capi
ta (
kgoe
)
>75%0
200
40–75% 5–40% <5%
400
600
800
1,000
1,200
1,400
LPG+kerosene
Population living on less than US$2 per day(%)
Biomass Electricity Gas Coal LPG+kerosene Other oil
Energy and the MDGs

22 Energy Services for the Millennium Development Goals
businesses such as agroprocessing, carpentry, welding and businesses that rely on refrigeration.
A recent comprehensive effort to measure the social benefits of rural elec-trification in the Philippines attempted to quantify, in monetary terms, the benefits of electricity access (ESMAP 2002d). Based on survey data obtained from rural communities, the study estimated the improved educational oppor-tunities and conditions electrification would provide to rural populations. The authors estimated the total benefit of providing electricity to a typical, non-electrified Philippine household to be US$81–US$150 per month. Benefits accruing to individual wage earners were estimated to be roughly US$37 due to ‘improved returns on education and wage income.’ Survey respondents con-sistently affirmed in large majorities that electricity was an important part of their children’s education by increasing and improving the quality and dura-tion of indoor lighting enabling study at night. However, the study’s authors also concluded that electricity provides increased entertainment opportunities (particularly television) that can become a distraction from children’s study. In spite of the fact that the task is fraught with analytical difficulties, the authors found significant benefits in terms of opportunity costs from time saved, lower-cost lighting, and improved productivity in home businesses. Other studies also point to the positive relationship between educational opportuni-ties made possible by electric lighting and higher lifetime earnings (Fitzgerald et al. 1990).
Given that the role of energy in catalyzing growth and poverty reduction is unquestionable, securing the supply of primary energy and securing the demand to sustained services is paramount to achieving the MDGs. A rapid increase in oil prices, as brought about by a sudden disruption in supply, uncer-tainty within the oil markets, or by strong demand, has important implications for energy security, macroeconomic growth, and poverty reduction. Although price hikes certainly affect industrial countries, their effect is generally more pronounced in developing countries, with major differences between net oil importers and net oil exporters.
For net oil importing developing countries, a rapid rise in oil prices weakens economic growth and exacerbates poverty. The direct effect on an economy is felt through a worsening balance of payments and the subsequent contraction of the economy or increased external borrowing required to restore the balance of payment equilibrium. For example, it is estimated that a sustained US$10 a barrel price increase would amount to a 1.5 percent loss in GDP among the world’s poorest countries (ESMAP 2005b; IEA 2002a). Price hikes in primary energy sources also mean increases in consumer prices for essential products such as kerosene used for cooking and lighting by many poor people and a considerable increase in transportation costs, beyond what the poor can afford. This in turn leads the poor to go back down the energy ladder, for example, switching from kerosene to charcoal or fuelwood and putting more pressure on

23
forestry and land resources; returning to walking rather than using fuel-pow-ered transport; and spending less time on productive activities.
For developing countries that are net exporters of oil, price hikes mean increased foreign exchange earnings and the opportunity to accelerate devel-opment. Paradoxically, this opportunity is fraught with challenges. There is ample evidence to suggest that, in the absence of good governance and prudent monetary and exchange rate policies, resource-rich countries are not necessar-ily achieving higher rates of growth. The challenges of managing resource rev-enues in ways that avoid or minimize the harmful monetary impact associated with sudden foreign exchange windfalls—commonly referred to as the ‘Dutch disease’–and avoiding excessive rent seeking cannot be overlooked.
Therefore, from the perspective of both importing and exporting countries, energy security is tantamount to a country’s ability to expand, diversify, and optimize its energy resource portfolio and a level of services that will sustain economic growth and poverty reduction. It is in this light that energy security should become a key focus of energy policies in developing and middle-income countries. It should be analyzed not only in its macroeconomic dimensions—its impact on a country’s ability to service foreign debt, attract foreign invest-ment, manage fiscal resources, and mitigate environmental impacts on land degradation and air quality—but also in its microeconomic dimensions, from the perspective of the enterprises that strive to remain competitive in the face of rising prices and from the perspective of poor households that already spend a large share of their income on energy services.
Hunger (MDG Target 2)Energy in the form of heat is required to cook 95 percent of the basic staple foods that form the basis of human nutrition. Most cooked food also requires water, which must be pumped and transported. Growing food crops also requires energy inputs for planting, irrigation, harvesting, and post-harvest processing. In most places, women have the primary responsibility for cooking based on the social division of labor.
The availability and use of both traditional and modern cooking fuels therefore have important linkages to hunger. The amount of energy needed for household cooking needs is commonly estimated at 1 gigajoule (GJ) ‘into the pot’ per capita per year, which can rise as high as 10 GJ per capita per year once efficiency of cooking methods such as biomass burning over a three-stone fire are accounted for.
Since the poor—particularly in urban areas—devote a high share of their incomes to obtaining cooking fuels, they are vulnerable to changes in the price of energy carriers. For example, rising costs of imported fuels or charcoal can lead to a higher incidence of hunger since such increases prevent the poor from cooking and processing their food. The poorest families typically dedicate 80 percent of total household energy expenditure to fuels for cooking and heat
Energy and the MDGs

24 Energy Services for the Millennium Development Goals
and only 20 percent for fuels and batteries to produce light. This is because there is little choice whether or not to meet basic subsistence needs (Reddy 1999).
In communities heavily reliant on biomass fuels, farm waste (in the form of crop residues and manure) can be an important part of the energy supply. The UN Millennium Project Task Force on Hunger recommends replenishing soil fertility at the lowest possible cost through practices that may otherwise use the biomass for cooking and heating (UN Millennium Project 2005b). Use of modern fuels or improved stoves can allow a greater proportion of farm waste to be returned to the soil. Modern cooking fuels can also indirectly increase farm productivity by freeing up women’s time and effort, in particular by reducing the work required for biomass collection, which is particularly det-rimental to the health of childbearing women. Where appropriate, agroforestry can play an important role by expanding the total supply of biomass available locally, thus enabling biomass use both as cooking fuel and as a farm input while reducing the burden of fuel collection.
Education (MDG Target 3)Particularly for school-age girls, improved access to modern energy services can free time for going to school and for after-school study. Energy scarcity creates time pressure on children to collect fuel, to fetch water, and to partici-pate in agricultural work, and contributes to low school enrollment. There is documented evidence of the positive correlation between improved access to modern energy services and educational achievements. In Mali, girls’ scho-lastic achievements were measurably higher after the introduction of village level mechanical power for grinding, pumping, and threshing services (UNDP 2004a or b). King and Alderman (2001) summarize studies that show that investment in infrastructure saves time spent collecting water and fuelwood and benefits all household members; in particular, such infrastructure invest-ments result in fewer interruptions to women’s paid work and to girls’ school-ing. Schultz (1990) suggests that girls are constrained in their schooling in part by the demands placed on their time and suggests that the use of electricity and refrigeration could reduce households’ dependence on the labor of girls. Reflecting the complexity of the problem, Glick and Sahn (1999) argue that increased income is also important, since even when electricity access is avail-able in urban areas domestic work obligations continue to limit female school-ing for the very poor.
Another important dimension to the provision of efficient education ser-vices is the availability of qualified teachers. One of the most often cited fac-tors affecting teachers’ retention in rural areas is the lack of access to modern energy services, in particular lighting and power that enable a minimum qual-ity of life and connectivity. Energy and ICT in schools can also enable access to educational material, distance learning, and continuing education for teachers.

25
All of these linkages are critical in supporting the achievement of universal primary education as well as the equal participation of boys and girls in educa-tion at large.
Gender Equality (MDG Target 4)Access to energy services affects men and women differently, and the specific energy services used by men and women differ based on the economic and social division of labor in the workplace and at home.
It would be hard to imagine a family in the developed world today spend-ing one or more hours every day gathering biomass such as wood, agricultural residues, and dung, when they could instead buy cooking fuel for the same purpose at a price that reflects income from five or fewer minutes of work. Yet this is the burden of women in the developing world. The disproportionate ammount of daily time and effort women and young girls spend gathering solid fuels and water for household chores could be used for other income-pro-ducing activities, family subsistence, or education. The time spent gathering biomass varies with geographic location, land ownership, the time of the year, climatic events, and loss of control over local resources. Figure 6 shows time- use data from Tanzania.
Figure 6. Time spent (in
hundreds of hours) and the transport
burden (measured in tonnes km), in
Tanzania, per person and per
year, disaggregated by gender and tasks
Source: UNDP 1997
Tim
e (h
ours
× 1
02)
5
10
15
20
External marketing
Trips to market
Grinding mill
Health
Internal marketing
Crop harvesting
Crop weeding
Crop establishment
Firewood collection
Water collection
External marketing
Trips to market
Grinding mill
Internal marketing
Crop harvesting
Firewood collection
Water collection
Tonn
es k
m
10
20
30
40
50
60
70
80
Able-bodied female
Able-bodied male
Able-bodied female
Able-bodied male
Time per person per year Tonnes km per person per year
A study in rural India found collection time for wood to be 37 hours per month (ESMAP 2002b). The benefits to health may be even greater (see Box 3).
In addition to the time and effort spent gathering fuel, there are related needs that arise from the need to fetch water and carry supplies and products to and from markets. Frequently water is fetched by girls and women in plastic containers that are either head-loaded or carried strapped on the back, from a water source (river, spring, or a stream) likely to be at a lower elevation or lifted
Energy and the MDGs

26 Energy Services for the Millennium Development Goals
Box 3. The impact of
energy on women’s lives in rural India
Source: ESMAP 2004a.
1. The long, unrecognized hours spent on arduous, unhealthy, and unpleasant tasks have
sometimes been cited as a development outcome for rural energy projects. But the
main motivation for rural energy programs justifiably has been generally improving the
quality of rural life, conserving fuel, and alleviating deforestation. This study shows that
the impact of adopting modern energy services by rural women may be even more sig-
nificant than was previously assumed by development researchers. As a consequence,
in designing rural energy programs it is not unreasonable to pay more attention to the
problems women have in obtaining a reliable and efficient energy supply.
2. Women in India typically spend much of their time on the hard work involved in caring
for their families. They often work 12 to 14 hours a day, most of which is unpaid and
recognized mainly within the family. In addition, some of those hours are spent in an
extremely unhealthy environment. Respiratory illness and eye problems are common
among women who cook on traditional chulhas (Smith 1998). Infant mortality may also
be higher among children raised in such homes (Hughes and Dunleavy 2000; Claeson
et al. 1999; Mishra et al. 1997). This study supports the findings that women who use
biofuels lead the most burdensome lives. Of the three biofuels, firewood involves the
most drudgery in terms of time and effort needed to collect it on a regular basis, but
in terms of time spent cooking it is a better alternative than agricultural residues or
dung. In any event, most women use a combination of these fuels to meet their energy
needs.
3. The use of LPG or kerosene stoves relieves women of much of the most arduous tasks
involved in cooking for their families and permits them to lead a relatively comfortable
and healthy life. Household electrification also has positive consequences for women in
terms of their general quality of life, including an increased likelihood that they will read,
watch television, and earn income. Having lights at night increases their ability to read in
the evening after dark. However, the advantages of electrification could be exploited even
more, as there still is a puzzling underinvestment in appliances such as mixers, grinders,
blenders, and others that could help women with their daily household work.
4. While the Government of India in association with many other non-governmental private
organizations has instituted various programs to address rural energy problems, the
execution, pace, and rigor of implementation has been uneven. The results of this study
indicate that such programs are essential to bringing about greater independence of
women, principally through reducing the time spent on such tasks as fuelwood collec-
tion, food preparation, and cooking. In addition, the subordinate position of women in
rural society needs to be recognized in the development and implementation of rural
energy programs. Many recent studies indicate that the consultation with and participa-
tion of those benefiting from development programs lead to a greater likelihood of their
success.
5. Kerosene, LPG, electricity, and improved stoves do appear to have a significant impact
in terms of reducing arduous tasks performed by women in rural households. Besides
improving the quality of life, in some cases electricity can be used for productive and
income-producing activities inside the home. Although not all households or all women
in rural households will take advantage of the benefits made possible by the modern
use of energy, the benefits for the majority of households are cumulative and worth-
while. In this context, energy policymakers need to pay more attention to the impact of
modern rural energy services and how they affect the lives of women.

27
from a well. Mechanical power—perhaps from a windmill, a diesel generator, or an electric motor—can provide the means to lift the water to a storage tank. Modern energy services through use of electric or fuel-operated pumps can make it easier to bring water supply closer to home. Rosen and Vincent (1999) report that households (primarily women) spend an average of 134 minutes per day collecting water and that the time saved by bringing water supplies closer to households is likely to dominate estimates of the benefits of improving rural water supplies.
The time spent collecting fuelwood also reduces the proportion of day-light hours otherwise available. These hours may be critical to other income-generating activities such as commercial foods vending, which is facilitated by improved heating and lighting; agricultural processing using mechanical power; beer brewing, and many trading activities. The costs of energy inputs into these businesses are high and the lack of more-affordable alternatives limits the income-generating opportunities faced by women. Case studies show that access to modern energy services can greatly improve the profitability of these businesses as well as the quality and quantity of the traded product (Misana and Karlsson 2001). For example, in West Africa, motorized mills increased the daily production of shea butter by 200 percent, decreased fuelwood con-sumption for processing, and increased incomes significantly. Thus an impor-tant way in which improved energy services contribute to gender equality is by enabling productive work that is primarily undertaken by women.
Modern energy services facilitate ICT and ease political engagement for those unable to travel far from the home and village. Women also directly ben-efit from public health facilities closer to home, and with modern energy ser-vices the functioning of health clinics in rural areas is improved, as discussed in the following section.
Health (MDG Targets 5–8)There are close linkages between health issues and energy use, and between the quality of health services and the availability of quality energy services.
There is increasing evidence that the burning of solid biomass fuels for cooking in indoor environments, especially using traditional stoves in inad-equately ventilated spaces, can lead to an increased disease burden. WHO now estimates that the impact of indoor air pollution on morbidity and premature deaths of women and children is the number one public health issue in many developing countries, particularly for the poorest segments of the population. Once again, women (including mothers with young children)—who carry out a disproportionate amount of cooking activity—are also likely to share a disproportionate disease burden. There has been substantial recent progress in measuring, examining, documenting, and identifying quantitative links between the use of solid cooking fuels and the associated disease burden (Ezzati and Kamen 2001; von Schirnding et al. 2002; Warwick and Doig 2004). In
Energy and the MDGs

28 Energy Services for the Millennium Development Goals
addition to the respiratory health burden posed by the use of traditional fuels, women also face health dangers such as vulnerability to cuts, animal bites, falls, sexual attack, and back injuries as they travel long distances to collect and carry traditional fuels for home use (UNDP 2000, p. 49).
Recent studies have detailed the relationships among three variables—fuel type, kitchen type (indoor versus outdoor), and kitchen ventilation—and exposure to particulate matter experienced by those within household cooking and living areas (ESMAP 2002c, 2003, 2004b). The studies note that two factors—use of solid fuel and lack of ventilation—were associated with the highest particulate matter levels, adding that women responsible for cooking experienced the highest exposure. These studies have suggested that a com-bination of interventions—including ventilation, behavior changes, and fuel switching—may offer health advantages. Meanwhile, they suggest the adop-tion of the use of the household environmental health indicator—levels of access to clean fuel and to ventilation—as an air-quality-related parallel to that of the widely accepted indicator for water and sanitation—levels of access to clean water and to sanitation.
Smoke produced during the combustion of solid fuels contains a num-ber of pollutants such as particulates, carbon monoxide, and formaldehyde. In households with limited ventilation (as is common in many developing coun-tries), exposures experienced by household members—particularly women and young children who spend a large proportion of their time indoors—have been measured at levels many times higher than health-based WHO guide-lines and national standards (Bruce et al. 2000 ; Smith et al. 2003). Exposure to small particulates (less than 10 microns in diameter) is believed to be a risk factor for acute respiratory infections (ARI) and acute lower respiratory infections (ALRI). Such exposure also appears to be associated with chronic bronchitis (assessed by symptoms) and chronic obstructive pulmonary disease (COPD—progressive and incompletely reversible airways obstruction), par-ticularly among women. Smith et al.(2003) report evidence from China that exposure to coal smoke in the home markedly increases the risk of lung cancer, also particularly in women. Though tentative, evidence is accumulating that indoor air pollution is associated with other important child and adult health problems, such as low birth weight babies and blindness in adults (Mishra et al. 1999). It is estimated that 1.6 million deaths per year (of which 60 percent are female) in developing countries are associated with the inhalation of indoor air smoke from the use of solid fuels. This makes indoor air pollution the fourth leading cause of premature death in developing countries (Bruce et al. 2000).
A recent World Bank (2004a) report on policies and actions for achieving the MDGs states that, in 1999, some 10 million children under the age of five died in low-income countries—2.1 million in India alone. Using Indian health survey data, World Bank researchers have concluded that investments targeted at improving environmental conditions, including access to piped

29
water, electricity and separate kitchens with clean cooking fuels, can substan-tially reduce child mortality (van der Klaauw and Wang 2003).
Health care infrastructure even in the smallest clinics and health centers relies on refrigeration for vaccines and sterilization. Illumination for patient care after dark, for operating theaters, and for public safety surrounding hos-pitals increases the health systems’ ability to serve poor populations. Improved lighting and hygiene from clean water would help reduce women’s mortal-ity rate at childbirth. Modern fuels and/or electricity are essential for these functions. Electricity is essential for many medical instruments, illumination, medical record keeping, communications facilities for reporting medically sig-nificant events, and medical training.
The global HIV/AIDS pandemic has many direct and indirect linkages to energy services. Global evidence suggests that education and awareness cam-paigns, including those using radio and television, which require electricity, are essential to educate at-risk populations about prevention and treatment options in the most affected areas. Another key linkage is the role energy services can play in substituting for labor in areas where labor shortages exist as a result of HIV/AIDS. Research in Kenya (Muchena et al. 2005), and on the impact of AIDS on available labor for the livestock (Engh et al. 2000), non-timber for-estry (Barany et al. 2001), and other agricultural sectors, shows dramatic labor shortages throughout sub-Saharan Africa, even in densely populated areas such as Kisii in Kenya (800 persons km-2). As a result of labor shortages, food shortages are reported as well, for example in Zimbabwe (UNAIDS 1999).
Environmental Sustainability (MDG Target 9)The way energy is produced, distributed, and consumed affects the local, regional, and global environment through land degradation, local air pollution, acidification of water and soils, or greenhouse gas emissions. Biomass harvest-ing without sustainable agroforestry management can lead to land degradation, including soil and water resources, and vegetative cover. Fossil fuel use, explora-tion, transportation, transformation, and distribution will have some unavoid-able detrimental effects on the environment. The strong linkages between the production and use of all energy forms are central to the climate change debate, particularly the long-term impact on, and risks for, developing countries, with the likelihood that the poorest populations are increasingly vulnerable.
The world is not short of technologies and technical solutions. For exam-ple, modern diesel engines in Europe are much cleaner today than the higher-emission older technologies still used in many developing countries that do not have environmental regulations. Natural gas is a much cleaner fuel than oil and can replace liquid fuels for power generation and even transportation. Pipelines may be a better way to transport aggregated fuel supplies than truck-ing. Shifting to such improved technologies can significantly reduce the envi-ronmental pressure resulting from energy use.
Energy and the MDGs

30 Energy Services for the Millennium Development Goals
An important question is whether fuelwood collection—for use in rural areas, for sale in urban areas, or for charcoal production—causes or contributes to deforestation. Most studies identify the conversion of forests to agricultural use and their nationalization—denying unorganized, underprivileged people, particularly women, access to natural resources—as the main drivers of defor-estation (e.g., Leach and Mearns 1988; Sarin 1991; UNDP 2000; ESMAP 2005a). Depletion of the forests may also result from timber sales or commer-cial charcoal production. Furthermore, it appears that fuelwood scarcity may also result from deforestation caused by other factors. When a forest resource is severely depleted—due to reasons other than fuelwood collection—continued fuelwood collection may indeed make the problem worse. This circumstance, along with already depleted soils, may create a situation where biomass waste or dung that could help restore the soil is used as cooking fuel; interventions with modern fuels may offer a way out of this vicious circle.
In reviewing two decades of fuelwood crisis in Kenya, Mahiri and Howorth (2001), conclude that, in this context, the causes and dynamics of deforesta-tion differ in urban and rural areas, suggesting local specificity. The problem of indiscriminately felling trees and the resulting environmental degradation may exist near urban centers, but in rural areas the situation is intricately tied in with land use and control; those who can consolidate land by building a fence are able to increase their wood supply, but those who cannot have declin-ing access to fuelwood. In a meta-study, Geist and Lambin (2002) analyze the frequency of proximate causes and underlying driving forces of deforestation, including their interactions, as reported in 152 sub-national case studies from Asia (55 studies), Africa (19 studies), and Latin America (78 studies). Only in Africa does wood extraction for fuelwood contribute significantly to tropical deforestation.
In considering the environmental impact of energy use, greenhouse gas (GHG) emissions are a key concern. It is essential to draw a distinction between fossil fuel use in the poorest LDCs where energy consumption and GHG emis-sions are low both per capita and in aggregate and where the primary concern is the local environment, and fossil fuel use in industrialized and rapidly indus-trializing countries, where per capita emissions and aggregate emissions are much greater and therefore more significant on a global scale. This distinction is the basis for the principle of ‘common but differentiated responsibilies’ for emissions mitigation and reduction which is at the heart of global accords on climate change. Much of the growth in fossil fuel consumption in developing countries will come from increased industrial and transport use as a result of economic growth. This growth will permit economic transitions, which in turn will decrease these countries’ vulnerability arising from their present high dependence on land-based production activities such as agriculture and fisher-ies. Current fossil fuel consumption levels in tropical sub-Saharan Africa are so low that even if these countries increased at an annual rate of 10 percent (the

31
annual rate at which China’s consumption grew during the 1971–97 period), by 2015, the associated per capita GHG emissions will remain at levels that are less than 5 percent of those in the high-income countries today.
The distinction is even greater when the LDCs are compared to industrial nations. By way of example, United States carbon dioxide emissions per capita are nearly 200 times those of Ethiopia. This is due largely to the fact that Ethi-opia’s cooking fuel consists predominantly of biomass, and much of its elec-tricity is produced from hydropower (both nominally renewable resources). So even if Ethiopia’s fossil fuel consumption were to increase six-fold by 2015 (this would imply a rate of growth far higher than that achieved at any time in even the fastest growing countries), its per capita carbon dioxide emissions would still be thirty times less than those of the United States. Countries that expe-rienced dramatic economic growth in the last two centuries can now afford to make large-scale investments in modern energy services that do not rely on fossil fuels, biomass, or hydroelectric power.
Overall, increased GHG emissions from sub-Saharan Africa are not likely to have any significant impact on the world climate, nor have any mechanisms been identified that suggest that the region’s own GHG emissions will have feedback effects on climate locally. Moreover, natural gas and LPG produce far less potentially detrimental emissions, at least to the immediate user, than wood or dung. Furthermore, a switch to modern cooking fuels would not be limited by world resources or by GHG emissions, as Smith (2002) noted: “Even if all 2 billion people shifted to LPG for household fuel, it would add less than 2 percent to global greenhouse gas (GHG) emissions from fossil fuels. In terms of human health, a shift to LPG would actually result in a net reduction of human exposures to air pollution that would be substantially larger than today’s total exposure from all fossil fuel emissions.” When considered on a global scale, the energy source choices of the poorest countries are not the most threatening from an environmental perspective. Meeting domestic economic growth and social development requirements in line with the sustainability of the domestic resource base should be the overriding concern in these cases.
There may, however, be significant impacts of climate change on the energy sector in sub-Saharan Africa due to the region’s high reliance on biomass and hydropower. For example, changes in precipitation can be felt through loss or variability in hydroelectric potential, variations in runoff (which can lead to siltation, with subsequent impact on hydroelectric power generation), and impacts on biomass (and hence fuelwood and charcoal) production. Despite their low total and per capita carbon emissions, the poorest are more vulner-able to these and other impacts of climate change and are expected to experi-ence greater pressure to adapt.
In some circumstances, it may be prudent for the poorest to consider leap-frogging to newer low carbon and/or renewable technologies even if they may not be strictly cost-competitive at present. Such circumstances may arise when
Energy and the MDGs

32 Energy Services for the Millennium Development Goals
other factors such as the cost of reliance on imports, domestic job growth, and effects on the environment and tourism are taken into account. Goldemberg et al. (2004) argue that Brazil’s commitment to ethanol from sugarcane—a move that involved high initial costs—paid off since Brazil has become the most efficient sugarcane producer. Similar long-term benefits from investment in renewable energy-based electricity generation and/or biomass-based tech-nologies may accrue on a case-by-case basis. Such technologies should defi-nitely be considered as alternatives to fossil-fuel-based energy systems, even if fossil-fuel-based options continue to be cost effective and play a significant part in meeting developing countries’ energy needs for decades to come.
Water Supply and Sanitation (MDG Target 10)At the community level, water and sanitation are linked to energy through a variety of needs. Some of the benefits from water services powered by improved energy services—such as reductions in mortality and morbidity that could be gained through expanded access of the poor to piped water—are discussed above in the section on the MDG health targets. Other, similarly important needs include boiling water for basic health and medical uses and pumping water for household, agricultural, and potentially commercial uses. At a larger scale, approaching the national or regional level, hydropower provides syner-gistic links in energy production and water management. Meeting the MDG target of increasing the supply of safe drinking water and basic sanitation will require investments in infrastructure that utilizes modern energy, especially electricity, to deliver services to poor people and communities.
SummaryIt is clear that energy services have an impact on all of the MDGs and associated targets. Access to energy services facilitates the achievement of these targets. Failure to consider the role of energy in supporting efforts to reach MDGs will undermine the success of the development options pursued, the poverty reduc-tion targets, as well as the cost effectiveness of the resources invested. Table 3 summarizes the linkages between energy and the MDG targets discussed in this chapter.

33
Goal 1: Eradicate extreme poverty and hunger
Importance of energy to achieving the Goal
• Access to affordable energy services from gaseous and liquid fuels and electricity enables enterprise development
• Lighting permits income generation beyond daylight hours
• Machinery increases productivity
• Local energy supplies can often be provided by small-scale, locally owned busi-nesses creating employment in local energy service provision and maintenance, fuel crops, etc.
• Privatization of energy services can help free up government funds for social wel-fare investment
• Clean, efficient fuels reduce the large share of household income spent on cook-ing, lighting, and keeping warm (equity issue—poor people pay proportionately more for basic services)
• The majority (95 percent) of staple foods need cooking before they can be eaten and need water for cooking
• Post-harvest losses are reduced through better preservation (for example, drying and smoking) and chilling/freezing
• Energy for irrigation helps increase food production and access to nutrition
Goal 2: Achieve universal primary education
Importance of energy to achieving the Goal
• Energy can help create a more child-friendly environment (access to clean water, sanitation, lighting, and space heating/cooling), thus improving attendance at school and reducing drop-out rates
• Lighting in schools helps retain teachers, especially if their accommodation has electricity
• Electricity enables access to educational media and communications in schools and at home that increase education opportunities and allow distance learning
• Access to energy provides the opportunity to use equipment for teaching (over-head projector, computer, printer, photocopier, science equipment)
• Modern energy systems and efficient building design reduces heating/cooling costs
Goal 3: Promote gender equality and empower women
Importance of energy to achieving the Goal
• Availability of modern energy services frees girls’ and young women’s time from survival activities (gathering firewood, fetching water, cooking inefficiently, crop processing by hand, manual farming work)
• Clean cooking fuels and equipment reduces exposure to indoor air pollution and improves health
• Good quality lighting permits home study and allows evening classes
• Street lighting improves women’s safety
• Affordable and reliable energy services offer scope for women’s enterprises
Table 3. Important linkages
between energy services and the
Millennium Development Goals
Source: DFID 2002.
Energy and the MDGs

34 Energy Services for the Millennium Development Goals
Goal 4: Reduce child mortality
Importance of energy to achieving the Goal
• Indoor air pollution contributes to respiratory infections that account for up to 20 percent of the 11 million child deaths each year (WHO 2002, based on 1999 data)
• Gathering and preparing traditional fuels exposes young children to health risks and reduces time spent on child care
• Provision of nutritious cooked food, space heating, and boiled water contributes towards better health
• Electricity enables pumped clean water and purification
Goal 5: Improve maternal health
Importance of energy to achieving the Goal
• Energy services are needed to provide access to better medical facilities for maternal care, including medicine refrigeration, equipment sterilization, and oper-ating theatres
• Excessive workload and heavy manual labor (carrying heavy loads of fuelwood and water) may affect a pregnant woman’s general health and well being
Goal 6: Combat HIV/AIDS, malaria, and other major diseases
Importance of energy to achieving the Goal
• Electricity in health centers enables night availability, helps retain qualified staff, and allows equipment use (for example, sterilization, medicine refrigeration)
• Energy for refrigeration allows vaccination and medicine storage for the preven-tion and treatment of diseases and infections
• Safe disposal of used hypodermic syringes by incineration prevents re-use and the potential further spread of HIV/AIDS
• Energy is needed to develop, manufacture, and distribute drugs, medicines, and vaccinations
• Electricity enables access to health education media through information and communications technologies (ICTs)
Goal 7:Ensure environmental sustainability
Importance of energy to achieving the Goal
• Increased agricultural productivity is enabled through the use of machinery and irrigation, which in turn reduces the need to expand quantity of land under cultiva-tion, reducing pressure on ecosystem conversion
• Traditional fuel use contributes to erosion, reduced soil fertility, and desertifica-tion. Fuel substitution, improved efficiency, and energy crops can make exploita-tion of natural resources more sustainable
• Using cleaner, more efficient fuels will reduce greenhouse gas emissions, which are a major contributor to climate change
• Clean energy production can encourage better natural resource management, including improved water quality
• Energy can be used to purify water or pump clean ground water locally, reducing time spent collecting it and reducing drudgery

Without a certain minimum, but absolutely essential, amount of energy—for example, the energy needed to cook food and stay warm in cold climates—human existence would be impossible. But a society needs more than this life-sustaining amount of energy in order to be productive, educate its children, and ensure good health and access to water and sanitation for its citizens and other essentials. How much more energy, and in what form, is sufficient to meet the MDGs?
This chapter attempts an answer to this challenging question, which must be answered as part of countries’ efforts to prepare MDG-based national development strategies. It first describes the types of energy that households and societies need to have access to if the MDGs are to be achieved, and then proposes a set of quantitative and time-bound energy targets for meeting those specific energy needs. These targets lay the foundation for the discus-sion of specific technology options and implementation challenges in the next chapters.
Types of Energy Access NeededModern energy services are essential for the development of productive activities that raise the incomes of the poorest, for basic health and edu-cational needs, for many water supply systems, and for progress on other aspects of the MDGs. Meeting the Goals requires access to at least three types of energy services: (1) energy for cooking, (2) electricity for illumina-tion, ICT, and appliances to support household and commercial activities and the provision of social services, and (3) mechanical power to operate agricultural and food processing equipment, to carry out supplementary irrigation, to support enterprises and other productive use, and to transport goods and people.
CHAPTER 3: MDG-Compatible Energy Services and Targets

36 Energy Services for the Millennium Development Goals
Energy for CookingMost food must be cooked before it can be ingested and transformed into human energy—the primary input for the essential activities of agricultural production and transportation in poor economies. Thus sustainable, reliable, and least-cost access to cooking fuels is among the most basic energy needs for the world’s poor. There are multiple pathways by which those cooking with traditional solid biomass fuels can benefit from switching at least partially to the use of clean-burning cooking fuels. While the precise mechanisms are not all fully understood and quantified, there is now substantial evidence that this switch leads to positive outcomes for multiple MDGs. The multitude of short- and long-term benefits to health, productivity, agriculture, the environment, and women’s welfare that modern cooking fuels provide suggests that a rapid scale up of modern cooking fuel distribution systems should be an important part of the strategy to meet the MDGs.
The annual amount of energy required for cooking varies with the type of food, fuel, and stove used and the specific cooking practices of a household. More than 80 percent of the heat generated while cooking with wood on a traditional three-stone fire does not end up ‘in the pot,’ whereas with kerosene and LPG nearly half can, doubling the cooking efficiency per unit of energy consumed. Diet is also a factor in energy needs. Cecelski (1987) reports that coastal communities in Peru and Ghana, where fish consumption is high, use much less cooking fuel than inland villages relying on hard staples such as maize, cereals, potatoes, and cassava. When most of the food eaten is prepared at home, the yearly need for energy per capita for cooking (‘into the pot’) is about 1 GJ with few exceptions and within about a factor of two. In most of the poorest households, this need is primarily met by burning roughly one half tonne per person per year of firewood (also crop residues and dung) in open fires—depending upon the kind of wood, its water content, and the kind of fire. A family of six thus uses about three tonnes of biomass each year. If cook-ing fuel needs were met exclusively by either LPG or kerosene , and accounting for energy efficiency of these fuels and typical stoves, the amount used would be about 40 kg of LPG (or about 45 kg of kerosene) per person per year. In practice, a combination of different fuels is frequently used, including biomass, biomass-derived fuels (such as charcoal or biogas), and fossil fuels.
For food preparation, process heat, and transportation, other energy carri-ers are generally more suitable than electricity. These include natural gas; LPG; liquids such as kerosene (a petroleum-derived fuel that is liquid at atmospheric pressure and does not need a specialized container, but is not as clean burning as LPG); ethanol (or ethanol-derived gel fuels); or dimethyl ether (DME, an energy carrier that could be derived from solid biomass and may emerge in the near future as a potential carrier); and diesel or petrol for transportation. For cooking, gaseous and liquid fuels have many benefits in addition to conve-nience. As income increases, they are increasingly preferred to traditional fuels

37
such as solid biomass due to the high and quick heat produced and the relative cleanliness of the technology. Energy and fuels for cooking are particularly important for meeting MDGs 1, 3, 4, 5, and 7.
Electricity for Lighting, ICT, and AppliancesAlong with liquid fuels, electricity deserves special consideration as an energy carrier. Electricity is primarily produced from mechanical power. Mechani-cal power can be derived from high-grade heat from a multitude of possible sources, including chemical energy carriers like coal, oil, natural gas, and bio-mass which is used to power turbines that produce electricity. Geothermal heat, heat from nuclear fission, and the potential energy of water at an elevation in hydroelectric power plants can also produce electric power. It is also becom-ing increasingly cost-effective to generate electricity from wind (where strong sustained winds are available) and through direct conversion of sunlight using photovoltaic (PV) cells. PV is clean and can be scaled down to a few watts, and is thus ideal for household consumption. But PV technology still has a high initial cost and some recurring costs that have not declined as rapidly as expected due in part to the need for ‘balance of system’ components like bat-teries needed for storage.
Electricity can be distributed through centralized systems or electricity grids or through decentralized systems in which the electricity is consumed near or at the point of generation. Many renewable energy applications are engineered to provide decentralized electricity but can also be grid connected when the electricity is generated on a large scale as in the case of a wind farm. Hybrid systems combining conventional and renewable energy sources can also be used to generate decentralized electricity. In general, urban areas are within closer reach of electric power grids and rural areas face greater chal-lenges in reaching them.
Electricity from all sources is important to support productive activities both at home and in the marketplace; to support the delivery of social services such as education, health care, and functioning public sector offices; and to produce illumination for use at home. Electricity supports modern informa-tion and communication systems and enables the public sector to function and the private sector to produce value-adding activities within the economy. Elec-tricity for illumination is particularly important for MDGs 1, 2, 3, 6, and 7.
Mechanical Power for Agro/Food Processing, Water Pumping, Enterprises and Other Productive Uses Mechanical power is important for meeting the MDGs, and its direct use in some contexts could make it possible to bypass intermediate conversion to electricity. Mechanical power produced in engines has a variety of valuable uses that are most important in rural areas, including transportation, pumping water, irrigation, intensification of agriculture (tractors and farm equipment),
MDG-Compatible Energy Services and Targets

38 Energy Services for the Millennium Development Goals
processing of agricultural products (moving, crushing, grinding), among a multitude of other uses. These systems rely on the availability and affordability of common transportation fuels such as diesel. When available in rural areas, mechanical power can displace human and animal labor and greatly increase economic productivity and livelihoods. As noted earlier, access to mechanical power for water pumping and transport, food milling, and agricultural pro-cessing has a particularly direct effect on freeing the time of women and chil-dren for human development. In rural areas where the electricity grid will be slow or unlikely to reach, decentralized mechanical power from conventional or renewable energy is extremely important to reduce poverty and increase economic options. Mechanical power is particularly important for MDGs 1, 2, 3, 5, and 7.
Setting Energy Targets for Meeting the MDGsThe Millennium Declaration does not stipulate specific targets for energy ser-vices. It does, however, specify numerical time-bound targets for each of the MDGs. These targets represent milestones in addressing extreme poverty in its many dimensions—income poverty, hunger, disease, lack of adequate infra-structure and shelter, and exclusion—while promoting gender equality, educa-tion, and environmental sustainability. While modern energy services are an essential element enabling a country to meet these Goals, it has been diffi-cult to establish quantitative causal relationships between energy and progress toward the MDGs.
Identifying such targets is difficult because energy needs are highly diverse. First, countries need affordable and reliable access to energy in order to carry out many productive activities that generate income, initiating the process of economic growth and poverty reduction. Second, countries need energy to alleviate many broader conditions that can prevent people from contributing to and benefiting from economic growth. Third, the agroecology, geography, and unique composition of the local economy also matter in determining the type of energy carriers and services that are required.
In full recognition of these complexities, a workshop was held in New York City in October 2004, under the sponsorship of the UN Millennium Project, to identify possible energy targets in support of the MDGs. This workshop drew on the insights of many of the world’s foremost experts on the role of energy in development (the attendees are listed in Appendix I). An attempt was made to evolve a vision comprising a set of energy services that could provide a way forward toward meeting the MDGs by 2015. The overriding conclusion from this workshop was that energy services must be explicitly addressed within the planning for poverty reduction and for meet-ing the broader MDGs. Where energy is found to be a crucial and limit-ing input, provisions for reliable and low-cost energy services must be made in a detailed and practical manner. The group recommended the following

39
energy targets for 2015, deemed necessary for meeting the MDGs in each country:
• Enable the use of modern fuels for 50 percent of those who at pres-ent use traditional biomass for cooking. In addition, support (a) efforts to develop and adopt the use of improved cookstoves, (b) measures to reduce the adverse health impacts from cooking with biomass, and (c) measures to increase sustainable biomass production.
• Ensure reliable access to electricity to all in urban and peri-urban areas.
• Provide access to modern energy services (in the form of mechanical power and electricity) at the community level for all rural communities.
In setting forth these objectives, workshop participants acknowledged and drew upon crucial insights of current development thinking that also under-lie the MDGs. Meeting the MDGs will require many synergistic interventions, necessitating a combination of high impact, least-cost, and scalable means.
Attention to the household level, and the health and welfare of poor women, is addressed particularly, but not exclusively, through the target for cooking fuel. The target for electricity services for the urban and peri-urban poor recognizes that access to mechanical power generally is already present in urban areas. It also anticipates the global demographic transition toward urbanization currently under way. The target acknowledges the inherently lower cost for added access in urban and peri-urban areas, and potentially lower technical losses; it recog-nizes that the population targeted has greater ability to pay due to greater density of demand; and it recognizes the need to support industrial and commercial growth in urban areas. Access to both mechanical power and electricity are also needed in rural areas. A cost-effective approach would emphasize availability of electricity at the community level to support delivery of social services such as health, education, potable water, and agriculture extension that would enable even the poorest to benefit in an equitable fashion. Access to mechanical power is particularly important for rural areas as it can provide power for productive uses. The mechanical power target recognizes the gap in access between rural and urban areas and the need to fill this gap.
The workshop participants also addressed the analytically difficult ques-tion of financing. The broad consensus was that low-initial-cost technologies are essential for a rapid scale up of services even if some of the technologies may be transitional. For example, in the short term, improving supply and use of solid biomass for cooking may indeed be the most viable option, at least in rural areas, even though modern liquid and gas cooking fuels are desirable. Moreover, intermittent demand for energy services for agroprocessing and supplemental irrigation, as well as low-level demand in the evening hours for lighting, might be best met by low-initial-cost technologies even though the recurring costs per unit hours of service are high in the short term.
MDG-Compatible Energy Services and Targets

40 Energy Services for the Millennium Development Goals
Focusing on three key energy entry points—cooking fuels, electricity in urban areas, and mechanical power and/or electricity at central points in rural areas—can be a means of focusing national MDG plans and development strategies on those energy interventions that will have the greatest impact on MDG targets in the shortest timeframe. The longer-term objective of universal access to electricity remains valid, but experience within the energy and devel-opment communities over the last 30 years has shown that progress toward this goal has been slow. By suggesting three priority areas of intervention, MDG planners and national authorities can focus on the concrete investments, deliv-ery systems, and public policies for a narrower range of energy options as a means to overcome poverty.
Significantly, the very important role of fuels in addressing human health and welfare as well as the status of women has received relatively less attention over the years in both energy sector management and development planning at large. An accurate estimate of the number of people who do not have access to mechanical power for pumping, grinding, and food processing is not even known. As most of this work is done by animals and unpaid people, women in particular, current economic costing methodologies often overlook the signifi-cant role that this category of energy service plays in rural development. This chapter has highlighted the essential roles played by all three proposed energy entry points in achieving the MDGs.
2.
The MDG-consistent energy targets outlined in the previous chapter specify energy services but not specific technologies. In the poorest countries, energy services should be provided using proven, robust technologies that are cost-effective and can be implemented at scale. If modern energy services are to truly make progress on multiple MDGs, they must serve many different eco-nomic and social sectors and employ multiple technologies in as flexible a manner as possible, while still taking advantage of the economies of scale that large systems may offer. The design of energy systems and programs must not only solve technological and economic problems, but must also draw upon and incorporate the priorities and lessons of development history that have come to emphasize the needs of women, community ownership, and the importance of both economic and environmental sustainability.
Chapter 3 identified key energy services—energy for cooking, electricity for urban and peri-urban areas, and community-level modern energy services (with a focus on mechanical power and electricity) for rural areas—that should be targeted for expansion in order to achieve the MDGs, as an essential com-ponent of any MDG-based national development strategy. This chapter dis-cusses strategies for reaching the three MDG-consistent energy targets, taking into account economic, geographic, and demographic variations among coun-tries. See Box 4 and Table 4 for examples of these variations. These practical strategies can assist countries in designing the energy components of national development strategies for meeting the MDGs.
CHAPTER 4: Strategies and Technology Options for Meeting the Energy Targets

42 Energy Services for the Millennium Development Goals
Box 4. Factors that
influence the cost and efficacy of
energy services in urban and rural
areas
City size and density have been important factors in determining social complexity and
technological evolution (Ausubel and Herman 1988). The size and density of a city enable
specialization, bring people together, and lead to new businesses and products. To ensure
that these engines of growth flourish it is important that their unique technical problems
of communication, transport, and energy are addressed. High population densities in
urban areas lead to higher densities of energy consumption and allow economies of scale
(Marchetti 1975).
Urbanization is increasing in the developing world; in 1999, about 40 percent of the
world’s 1.3 billion poor people lived in peri-urban agglomerations. For a variety of rea-
sons—irregular tenure to dwellings, shared spaces, ill-defined responsibilities for pay-
ment, and low consumption levels—the urban poor may be poorly served by energy sys-
tems. They tend also to pay high prices both for relatively poor kerosene-based light and
for low-quality biomass cooking fuels. Slum dwellers are frequently ignored and bypassed
in favor of rural populations in spite of their active participation in the economic growth
of the city.
The growth of secondary cities with sufficient density presents opportunities for rela-
tively inexpensive extension of modern energy services to a greater proportion of a coun-
try at lower cost. The percentage of the population that lives in cities larger than 50,000
people is shown for a few sub-Saharan African countries in Table 4, which also presents
data on reliance upon traditional biomass cooking fuels and access to electricity. The
table also highlights the tremendous difference, in the rare cases where data are avail-
able, between the availability of electricity to urban and rural residents—a difference that
tends to be an order of magnitude or greater, particularly in the poorest countries.
Perhaps the most profound influence on the cost and viability of various energy tech-
nologies and systems in rural areas is the distribution of people—in terms of both need
and ability to pay. For all major energy types considered here, the question of how demand
can be aggregated across multiple service needs and multiple households or communi-
ties is a crucial one in determining how many of the poor can be reached, and at what level
of service, in a cost-effective manner. Rural populations may, though do not always, pres-
ent highly disaggregated demand patterns for cooking fuel, electricity, mechanical power,
and transportation. Meeting this dispersed need often requires very different basic energy
technologies, system designs, billing systems, and other features than are necessary or
viable in urban and peri-urban areas. This can be further complicated by the higher levels
of poverty that usually prevail in rural areas. For rural areas where the poor are very cash-
poor, energy services may require delivery in smaller, more portable, less expensive units
that help to meet what may be a more dispersed and intermittent need.

43
National population(millions)a
[1999]
National electrification
rate (%)b
[2000, 2004]
Urban electrification
rate (%)d
[2004, 2002]
Rural electrification
rate (%)d
[2004, 2002]
National reliance on
solid cooking fuels (%)f
[2004]
Share of population
in secondary cities (%)a
[1999]
Ethiopia 61.7 4.7 13.0 0.7 > 95.0 8.0
Ghana 19.7 45.0 82.5 20.9 95.0 25.0
Tanzania 32.8 10.5 39.0 1.0 > 95.0 27.0
Kenya 29.5 7.9 20.0 1.7 85.0 13.0
Niger 10.4 < 1.0c 36.6 0.2e > 95.0 17.0
Senegal 9.3 30.1 68.9 6.0 79.0 43.0
Chad 7.5 – 9.4 0.1e 95.0 13.0
Table 4. Urban and rural dimensions of energy use in
selected sub-Saharan African countries
Sources: a. CIESIN, 1999; b. IEA 2002b; c. GNESD 2004; d. ARFEPREN 2004;
e. Clarke and Wallsten, 2002; f. Gordon et al. 2004
Box 5. Energy efficiency
Increased energy efficiency—whether during generation/production, transport/transmis-
sion, or end use—can have wide-ranging benefits. The full extent of these benefits is
difficult to capture in developing countries, where low-initial-cost appliances/technolo-
gies might be preferred, capital for replacing inefficient equipment might not be available,
and regulatory/technical standards might be inadequate. Energy efficiency standards for
appliances (for example, for lighting and refrigerators) in developed countries suggest
that, at least in the urban, commercial, industrial sectors, it may be possible to use a
combination of awareness, technical standards, and pricing policies that can create a
long term win–win situation for both energy providers and consumers.
There are significant opportunities for improving energy efficiency in the rural sector
as well, such as in charcoal production, the use of cooking fuels and in lighting (whether
kerosene or electricity-based). But these are more difficult to address since the human
and capital resources to address these at scale are frequently inadequate. Careful evalu-
ation of the multiple impacts of inefficiencies in production/use are needed to suggest
investments in: (1) research, (2) technology transfer, (3) product development/testing, (4)
training and capacity building, (5) regulation, monitoring, and enforcement, and (6) supply
and distribution chain development so that the economic and social benefits of energy
efficiency and energy conservation can be realized.
Strategies and Technology Options
– Not available

44 Energy Services for the Millennium Development Goals
Energy for CookingMDG-consistent target:
• Enable the use of modern fuels for 50 percent of those who at pres-ent use traditional biomass for cooking. In addition, support:(a) efforts to develop and adopt the use of improved cookstoves, (b) measures to reduce the adverse health impacts from cooking with biomass, and (c) measures to increase sustainable biomass production.
Meeting this target requires reducing by 50 percent the share of those who use traditional biomass for cooking. Traditional biomass fuels consist of fuel-wood, crop residues, or dung burnt in open fires, or charcoal burnt in a stove. With the exception of charcoal, in rural areas these fuels are generally gath-ered by family members from their own or community land. A combination of increasing incomes and decreasing ease with which biomass fuel can be collected is creating a market in these traditional fuels. In many urban and peri-urban areas, the cost of using these fuels is approaching the recurring costs of using modern cooking fuels. This segment of the population would be prime candidates for switching from traditional biomass to modern cook-ing fuel. Discussed here are the implementation challenges associated with this switch.
The target also recommends additional measures to support the use of improved cookstoves, increased biomass production, and cleaner use of bio-mass fuels for those unable to switch to modern cooking fuels. The implemen-tation challenges of meeting this target are specific to the local economy.
Synergistic strategies for poverty reduction as well as social development should also lead to increased incomes, making it possible to at least partially close the affordability gap in using modern cooking fuels.
Implementation and Policy Options for Fuel Switching In areas of higher income and higher population density, a desirable out-come is substituting LPG or kerosene for solid biomass fuels. Otherwise, the energy demands of dense, urban populations are met with purchased fuel-wood or charcoal. The costs of these solid fuels incorporate the potentially high transport costs and, in the case of charcoal, low conversion efficiencies. Also, because they are frequently obtained from sources that are not sustain-ably managed, their prices do not reflect the cost to the environmental com-mons. Thus from the health, time-saving, and environmental perspectives, there is widespread agreement that the choice of LPG or kerosene is desirable even though they are fossil fuels. Moreover, in many urban areas of sub-Saharan Africa (for example, Accra in Ghana), charcoal and fuelwood are almost the same cost as more modern fuels per unit of energy ‘into the pot’ (Ahiataku-Togobo 2002).

45
Perhaps even more than lighting, the upfront costs and the recurring costs of modern cooking fuels such as LPG and kerosene are difficult to afford if the distribution and sale of these fuels is entirely on a cost recovery basis. It is diffi-cult for households making less than US$4 per day (in real US$) to afford the recurring cost of fuel immediately, since household fuel costs alone could be as much as US$0.40 per day (assuming daily consumption of 0.50 kg LPG per household per day and costs of US$750 per tonne if LPG at port is US$450 per tonne and transport, filling, and distribution costs are US$300 per tonne). In contrast, kerosene is easier to carry, transport, and buy in smaller quantities; but as a poisonous, flammable, clear liquid at room temperature it is potentially unsafe to handle without adequate knowledge of use. Nevertheless, because kerosene can also be clean-burning with a proper stove it has the potential to be a transition fuel for cooking. The stoves cost less, and distribution costs are lower as well.
A combination of top-down interventions such as removing taxes, lowered transport and distribution costs (through road/port infrastructure), improved handling and storage facilities at ports, bulk purchases of fuels, and impetus from the government through suitable regulatory reform can assist in lowering the costs of LPG and kerosene. In addition, bottom-up approaches can encour-age market development through provision of smaller LPG cylinders and low-cost stoves, upfront payments that are spread out over a longer period, and consumer education. In areas where the bottleneck is the financing of capital costs (for example of an LPG stove and cylinder) and not the recurring costs immediate opportunities exist for policy interventions to support the market penetration of these commercial energy products.
A range of policy measures and implementation instruments are available. For example, the direct subsidy or a form of lease/finance mechanism, and bank loans, can lower the initial costs of the stove and cylinder and reduce the lumpiness of payments. This is particularly important in the rural areas where cash incomes are limited and the initial cost of a cylinder and stove can reach US$40 to US$70. Technical measures, such as the provision of a range of canister sizes with particular emphasis on easy-to-carry smaller canisters can facilitate the marketability of these new energy sources. Institutional measures such as building up partnerships that draw on the strengths of the public sec-tor (village or district government, national, international); the private sector (small and medium-sized enterprises or SMEs, companies and investors); and local institutions (community organizations, NGOs) help create viable new markets. For example, energy service companies that provide energy to cus-tomers on a fee-for-service basis have proved quite successful in Sri Lanka, India and other countries. Partnerships between international LPG companies and local companies are important to bring to investors the knowledge of the local markets. Once an effective program is in place, increased use of LPG in urban areas can allow larger bulk imports of LPG, also reducing unit costs.
Strategies and Technology Options

46 Energy Services for the Millennium Development Goals
There is no unanimous view regarding the role of subsidies for recurring fuel costs. Suitably designed targeting to identify those who need subsidies, an exit strategy for those whose consumption and income grow beyond thresholds of eligibility to subsidies, and bill collection schemes that minimize collection costs can all help to ensure that subsidies are indeed reaching the poor with minimum leakage or waste. Two large-scale fuel subsidy programs—one in Brazil, which is viewed as a success, and one in India, which is commonly considered a failure—provide conflicting evidence.
Brazil’s energy strategy serves as a useful example of how a government subsidy program can positively and dramatically affect the rate and extent of penetration of modern energy services. Jannuzzi and Sanga (2004) present data on the penetration of LPG (from 18 percent of households in 1960 to 98 percent in 2004) and the concomitant decline of traditional fuel use in the Brazilian residential sector. In the period 1960–85, penetration of fuelwood and kerosene fell from 61 and 20 percent, respectively, to 28 and 7 percent, indicating a shift away from these fuels for cooking and lighting. During the 30-year period beginning in 1973, the inflation-adjusted per capita subsidy (based on the entire participating population) was less than US$1 per year (see Box 6). Brazil’s example shows that both across-the-board and targeted subsidies can advance the penetration of modern energy services to the poor, including those in rural areas. Depending upon the depth of a country’s pov-erty, however, the percentage of the population in need of subsidy support will vary, as will the size of the subsidy. Brazil’s experience, particularly for LPG, shows that effective scale up can occur and that a program can be revised to become more efficient as it progresses.
In India, LPG subsidies benefited the richest segments of the population and so from an MDG perspective were less successful. During the last decade, the annual LPG subsidy in India has varied between US$0.50 per capita (in the mid-1990s) and US$1.50 per capita (in 2002). However, the bulk of the LPG and hence the subsidy was consumed by about 30 percent of the popu-lation—by income, nearly the top half of urban populations and the top 20 percent of rural populations. Thus in 2002, the annual LPG subsidy was about US$5 per beneficiary (or about US$25 per family), with the total annual sub-sidy amounting to US$1.3 billion (Gangopadhyaya et al. 2005).
A comparison of government programs in India promoting use of ‘clean’ fuels, such as kerosene and LPG, illustrates some differences in results from ongoing versus ‘first cost’ subsidies (Viswanathan and Kumar 2005). In the state of Himachal Pradesh, subsidies for LPG, combined with subsidies for use of pressure cookers to increase energy efficiency, resulted in greater penetration of clean fuels into rural areas. However, a universal price subsidy may present problems in the long term, such as continued high burden on the state govern-ment budget as well as the fact that as much as 80–90 percent of the benefit of the subsidy may accrue to the richest households, and to urban households,

47
Box 6. LPG subsidies in
Brazil: 1973–2003
Source: Jannuzzi and Sanga 2004.
In Brazil, penetration of LPG services was aided substantially by government programs
and subsidies over three decades, during which LPG subsidies helped to keep energy
prices essentially stable. Particularly for LPG, the results of the program were dramatic,
allowing penetration of LPG (and city gas) to rise from 18 percent nationwide in 1960
to 98 percent of households in 2004. The penetration in rural areas, at 93 percent,
is particularly impressive given the difficulty of reaching what are often low-density
populations. Other important factors, together with subsidies, helped the widespread
dissemination of LPG: the continued support from the government through the state oil
company PETROBRAS (which was in charge of LPG production) and strong participation
by the private sector (which was responsible for the distribution and retail sales to con-
sumers). These private firms received a guaranteed profit margin and concession rights
for regional distribution.
Jannuzzi and Sanga (2004) examine the three-decade period between 1973 and
2003, during which an effective cross-subsidy scheme played a key role in the rapid and
comprehensive adoption of LPG. During the program’s initial period, from 1973–2001,
prices for LPG and other petroleum derivatives were administered by the central govern-
ment and kept uniform across the country for all customers. The LPG subsidy varied over
time, averaging around 18 percent of the retail price. Jannuzzi estimates the cumulative
value of this portion of the program, corrected for inflation and domestic LPG prices, at
US$2.9 billion; at an average per capita LPG consumption of 2 GJ, or roughly 40 kg per
year, this represents a per capita, inflation-adjusted annual subsidy of US$0.73.
In 2001, as part of a broader deregulation of markets for petroleum products, LPG
prices were liberalized and collective subsidies were eliminated. This was accompanied
by the establishment of a voucher program subsidizing only those families with a monthly
per capita income that was not more than one half of the minimum-wage income. (Cur-
rently the minimum wage is roughly R$240, or US$76.50 per month.) As of 2002, the
number of families participating in the targeted subsidy plan was 6.7 million (at a cost
of US$349 million), and this increased to 7.9 million families—or roughly 20 percent
of Brazil’s population—in 2003 (at a cost of US$462 million). This annual subsidy cost
averages US$58 per family, or roughly US$16 per capita for a family of 3.5 (IBGE 2004).
This transition to a deregulated market also produced some adverse impacts that need
to be analyzed so lessons can be drawn. Many households not included in the new
voucher scheme (there were problems in identifying qualified households at the time)
switched back to fuelwood because they could not afford the price rises; and imperfect
competition in several regions of the country and the creation of cartels aggravated the
impacts on consumers in the poorest and more remote areas of the country.
Overall, the average per capita subsidy rose with the price increases following dereg-
ulation—from approximately US$1 for the 1973–2001 period (in constant dollars) to
US$16 in 2004, after price liberalization. However, with liberalization in 2001, the net
expenditure of the government decreased by almost half due to the smaller number of
participating, low-income families. Overall, Januzzi and Sanga found the costs of the
program to be low relative to the benefits of providing greater access to a better cooking
fuel. Furthermore, after subsidies helped to establish an LPG market in Brazil, it has
been sensible policy to redirect the subsidy toward only the low-income consumers who
are most affected by changing prices.
Strategies and Technology Options

48 Energy Services for the Millennium Development Goals
rather than the rural poor. The use of subsidies to encourage penetration of clean and modern cooking fuel has been variously effective. The uneven effec-tiveness of particular programs, however, does not appear to argue against the use of subsidies per se. Instead, it suggests that a variety of factors, including the manner in which subsidies target specific populations, the percentage of a subsidy relative to both the fixed and recurring costs of the energy service, and the institutional framework through which a subsidy is implemented, as well as other factors, all play key roles in outcomes.
Implementation and Policy Options for Biomass-based Approaches Especially in rural areas, where modern cooking fuels remain both unavail-able and unaffordable for many, the use of solid biomass for cooking is likely to continue for some time. So long as solid biomass continues to be used for cooking, there is a need to address the issues of health, availability, and the sus-tainability of the biomass production. Hence the MDG-consistent target takes a three pronged approach to the use of biomass fuels by recommending:
a) efforts to develop and adopt the use of improved biomass cook-stoves, b) measures to reduce the adverse health impacts from cookstoves with
biomass, and c) measures to increase sustainable biomass production. Improved cookstoves. Sustainable production and availability of solid bio-
mass is strongly tied to local agroecology, land ownership (household and com-munal), and socioeconomic conditions. However the use of solid biomass is fre-quently in three-stone open fires, and as discussed in Chapter 2, is a significant source of exposure to smoke and indoor air pollution. Hence the most widely implemented of the proposed targets is the promotion of improved stoves for cooking with wood and charcoal. In the case of charcoal, there is documented improvement: improved charcoal-burning stoves are particularly effective and adoption rates tend to be high, since the fuel itself is dearer than firewood and offers greater returns to efficiency.
In contrast, in spite of considerable efforts over several decades, wood cookstoves development and implementation is at a nascent stage compared to the scale of the need. The varying size, composition, and moisture in wood; different styles of cooking; the sometimes multiple purposes that the wood fire serves; and the lack of sustained funding all contribute to the lack of ‘proven’ household wood stoves. Not all stoves with lower fuelwood consumption lead to lower harmful emissions. A sustained research effort is needed on the devel-opment of stoves as well as on combined with household modifications such as chimneys, smoke-hoods, windows, and eaves spaces, and improved cooking practices.
Health impacts. In contrast to efficiency concerns, most improved wood stoves have not addressed the problem of smoke and particulates exposure in the home. However, there is now increasing recognition of the importance of

49
this issue, and systematic efforts are in progress to develop stoves that produce less smoke and/or ventilate smoke out of the immediate cooking environment. Substantially greater effort is needed to develop such stoves and facilitate their adoption, along with measures to reduce high exposure levels from stoves that burn wood, dung, and crop residues. Some key strategies for smoke reduction are behavioral, including proper drying, cutting, and storing of firewood, as well as soaking of grains and other preparatory steps to reduce cooking times. While stove designs can vary widely in cost, complexity, and suitability for a given locale, these behavioral approaches tend to be very low-cost and widely applicable.
Sustainable biomass production. Charcoal production that is efficient and sustainable (through woodlots or agroforestry) and use of improved charcoal stoves can provide a convenient cooking fuel, reduce harmful emissions within the household, and generate local employment opportunities. However, con-cerns of indiscriminate felling of trees and related impacts on biodiversity, as well as the possibility of build up of high carbon monoxide levels, make the issue a complex one requiring careful examination at the local level. In areas where an invasive species of trees has taken over the landscape and the species itself is a good source of fuelwood, efficient conversion to charcoal offers par-ticularly attractive opportunities. Technologies for efficient conversion from wood to charcoal are not prohibitively complex and can be readily adopted.
One example is Prosopis julifora, which is now found in many parts of India and East Africa on otherwise degraded lands. Techniques that allow regulators to ensure the source of wood that went into making the charcoal offer an entry point for sustainable charcoal production. Similar entry points are available where waste biomass in the form of sawdust, husk, and charcoal dust are available. The same species is also particularly attractive for biomass gasification, a technology that allows efficient capture of the calorific value of the wood in the form of ‘producer gas’ that can then be used for producing electricity. This means of electricity production has not worked so well, how-ever, at the village scale, and certainly not at the household scale. Plants that generate several hundred Kilowatts operate 24 hours per day, 7 days per week, and feed into the grid. These larger plants can provide the economic benefits that accrue from scale and from the ability to retain a team of skilled personnel to operate the plant.
The production of biogas in anaerobic digesters using animal manure, nightsoil, and vegetable waste can be attractive where such waste and water are available. There are multiple benefits that can accrue. The carbon to nitrogen ratio of the slurry leaving the digester is a better source of fertilizer than materi-als fed into the digester. Also, biogas is a clean cooking fuel with the potential for Clean Development Mechanism (CDM) credits equivalent to nearly 20 kg of CO2 for each kg of methane burned. Having tethered animals may have other advantages for land use practices. The key bottleneck remains the finicky
Strategies and Technology Options

50 Energy Services for the Millennium Development Goals
nature of the digester and the need for adequate learning and training in the construction and use of a digester. Biogas production is especially attractive at commercial facilities where large animals are kept commercially, lowering transaction costs. If community-level aggregation can be achieved, this can also offer economies of scale.
Several other biomass-based systems offer potential entry points based upon local agroecologies and land use. These include tree species (for example, Jatropha curcas and oil palm) and plants or crop residues (for example, sugar-cane bagasse, maize, and soybean) that can be used to produce liquid or gel fuels. The land and labor inputs required by these systems need to be carefully balanced with the multiple potential benefits such approaches provide. Perhaps the greatest benefit of such technologies is the potential they offer for rural job creation, and yet for these approaches to be successful, they require a local investment in research and the skills to develop and adapt complex technolo-gies to rural conditions.
In the near future, measures to increase biomass production are recom-mended. Such measures are most likely to succeed when on-farm biomass pro-duction occurs synergistically with increased agricultural output and income. Agroforestry is one example of such an approach. Fallow tree species have the ability to provide as much as three to five tonnes of woody biomass per hectare on an annual basis while also adding nutrients to the soil. One or more tree species either on the farm or in community woodlots or area closures can pro-vide multiple benefits such as watershed management, soil conservation, nutri-tion, and fuelwood, and can provide the opportunity for additional income since the availability of biomass reduces the time and effort spent looking for cooking fuel.
Electricity for Urban and Peri-urban AreasMDG-consistent target:
• Ensure reliable access to electricity to all in the urban and peri-urban areas.
Here and elsewhere in this report, electricity is considered as an energy carrier with certain optimal uses, rather than as a specific technology. Electricity is an ideal medium for such end-uses as lighting; use of appliances such as radios, televisions, and equipment and devices used in numerous industrial and com-mercial establishments; and communication devices.
In some cases, this implies general technological solutions without the need to specify precise interventions or to ‘pick technologies.’ For instance, there is agreement that for those in urban and peri-urban settings, the effec-tive unit cost of lighting using kerosene lamps is nearly one to two orders of magnitude higher than the most expensive thermal generation of electricity. If the cost of disposable dry cells for radios and lighting and poorly charged lead-acid batteries for lighting or television are added, it becomes clear that, based
51
upon the costs that the urban poor already pay for less-efficient energy sources, they can afford the recurring costs of electricity generation and maintenance of the generation, transmission, and distribution infrastructure. By switching to electricity, they would avail themselves of a much better quality of energy service in the form of higher-lumen light, lower-cost use of radio or television, and reduced time and transportation for battery charging. What the urban poor may not be able to afford is the initial cost of an electricity hookup and possibly lumpy utility bills. This initial cost, however, can be as low as US$200 per household even in peri-urban settings. There is a sense that, if the poor can overcome the first cost of access, they can actually pay the recurring costs of low consumption levels of electricity. Moreover, the utility’s recovery of recur-ring costs can aid in achieving higher electricity penetration rates, facilitating near universal access in urban and peri-urban settings in the next 10 years.
Reliability of electric supply is equally important. The cost of unreliable service, through inefficient substitution, through lost productivity and revenue for businesses, or as a result of damaged goods (for example, if refrigeration capacity is lost) and appliances can lead to a high effective cost of electricity. Many businesses that rely on newer communication and computer technologies demand reliable and ‘clean’ electric power supply. For these businesses to remain competitive in the global marketplace, it is critical that quality of electricity infrastructure is not sacrificed for the sake of cost. In a sample survey of private businesses in 69 countries, respondents most frequently cited loss of productiv-ity and impediments to new investment and business creation as the effects of poor infrastructure (Brunetti et al. 1997). The low cost of connecting the peri-urban population to the grid can be exploited as an advantage leading to a win–win situation for consumers and electricity providers (ESMAP 2001b).
In the urban context, aggregation of demand led to the emergence of cen-tralized systems as the technology of choice. Factors such as higher popula-tion density, the presence of government and commercial establishments, and higher cash incomes have generally favored urban and peri-urban areas as the lowest-cost regions for early electrical grid creation and expansion. Methods to spread out first costs, innovative financing schemes, and marginal improve-ments to further reduce costs have been more effective at expanding access than in rural areas, where first costs are much higher. Thus in urban areas, the barrier to access for individual homes is the up-front cost associated with bringing the wire to a home. In spite of this, reaching the urban poor with electricity remains a challenge and hence the electricity penetration rate in some urban areas remains low.
A key factor in the lag in expansion of service even to urban populations is the failure to meet recurring costs. To understand this problem, one needs to recognize that low recurring costs of electricity are achieved technologi-cally through aggregation of demand across many users—tens of thousands of households as well as major industrial and commercial customers—all served
Strategies and Technology Options

52 Energy Services for the Millennium Development Goals
by large power-generation plants. This degree of aggregation was historically achieved through formation of institutions such as utilities that generally did not have service to the poorest as their first and highest priority. Over time, a combination of factors has led, in the case of some utilities, to a range of financial and technological failures that make it difficult even to continue pro-viding reliable services. These factors include subsidies for the recurring costs of those who could actually afford to pay, poor financial management of state-owned utilities, theft of electricity by those who were excluded from access, poor enforcement of service termination rules for failure to pay, and lack of financing for poor households and small enterprises.
In such situations, it is difficult to raise capital to increase generation capac-ity, or to recover costs through tariffs and billings. With the deterioration of the financial situation of the utilities, the quality of service further deteriorates. Where the rich can afford back-up generators, the poor bear the brunt of poor-quality service, including those not yet connected to the utility. They have neither the financing from the utility for the initial hookup nor the benefit of subsidized electricity supply available to the better-off. Where large-scale infrastructure investments are needed to extend the service to fast-expanding urban areas, raising the needed financing will be equally difficult, with high perceived risk and expected long payback periods.
There are financing, institutional, regulatory, and technological solutions that are available to successfully solve these problems. A considerable body of work has been developed to address the issue of how to support the develop-ment of financially healthy and efficient providers of reliable services for the poor. Some of the better practices are outlined here.
• With careful utility management, review of cost structures and stan-dards, and bulk purchases, the initial costs of hookup can be further lowered.
• Initial hookup costs can be partially recovered by spreading the initial costs over a longer period and by cross-subsidization. However, govern-ments need to recognize that subsidies of the initial hookup costs may be necessary for the poor.
• Governments can ensure that utilities are able to recover the recurring cost of generating electricity, in order to protect the financial viability of the investment.
• Allowing smaller independent power producers to operate under a regu-lated environment can make it possible for these producers to buy elec-tricity from or to sell electricity to the grid.
• Bill collection alternatives, including prepaid smart cards, community billing, and lifeline tarrifs, could reduce costs for electricity services.
• Regularization of tenure for slum dwellers can increase the size of the market and formalize electricity demand, thus reducing costs and bar-riers to service access

53
The fact that electricity is often ‘tapped off ’ illegally in urban poor areas is a testament to the desire of the poor to have access to the benefits that electric-ity provides, such as illumination, radio and television, and the ability to use machines and appliances that create jobs and incomes. In many cases, the fees recovered by informal sector middlemen who charge for these services outside of the utilty structure testifies to poor families’ willingness to pay for electric-ity, even at a high cost. The public safety, social service, and economic benefits from aggregation of demand are compelling reasons to make electricity ser-vice provision to urban and peri-urban areas a priority in national strategies to achieve the MDGs.
Modern Energy Services for Rural Communities MDG-consistent energy target:
• Provide access to modern energy services (in form of mechanical power and electricity) at the community level for all rural commu-nities.
Mechanical power has assisted human beings for centuries in reducing the drudgery of such work as lifting water, grinding cereals, and crushing seeds and nuts for oil. With the development of engines (with end-use equipment directly connected to the engine) and then with the advent of electricity (through the use of motors), mechanical power became widely accessible and is frequently the first use of energy that is critical to the poor after the availabil-ity of cooking fuel. Productive uses of mechanical power, especially those that benefit women, can end up providing both social and economic benefits simul-taneously. Where grid electricity is viable, meeting mechanical power needs is possible. Alternatively, when grid electricity is not a viable option, stand-alone mechanical power is the first priority. An emphasis on flexibility is crucial in identifying least-cost options for particular geographic, technological, demo-graphic, and economic conditions in order to provide mechanical power.
Access to mechanical power can improve productivity of human labor and reduce drudgery of work, freeing up the time of women and girls in particu-lar. In many rural areas, even community-level access to mechanical power is unavailable.
While the widespread use of electricity even in the developed world has only occurred over the last century, electricity has now come to be indispens-able to the functioning of government, public institutions, health care facili-ties, and business/commercial/industrial establishments. Modern energy ser-vices delivered in a sustainable manner are essential for progress toward the MDGs in rural areas. Publicly supported electricity expansion, as advocated here, would first and foremost guarantee reliable service to community health and education facilities and for agricultural extension, thus meeting basic needs and enhancing social capital. Community health facilities, such as clinics and healthposts, need appliances such as microscopes, centrifuges, refrigerators for
Strategies and Technology Options

54 Energy Services for the Millennium Development Goals
storing vaccines and blood samples, and other services that generally require electricity. Schools need electricity for computing, visual aids, scientific experi-ments, lighting, and communications. Community-level communication ser-vices—in the form of phone kiosks, Internet stations, and others—are also made possible by electricity.
Establishing rural nodes with mechanical power and electricity services within rural communities would also dramatically reduce the cost of addi-tional grid connections and extensions in the immediate vicinity, unlocking local capital and opening new opportunities for small-scale, private investment at the local level. Such private investment is already observed in rural areas where expansion occurs (as illustrated in Figure 7).
Figure 7. Unlocking local capital by
bringing the grid closerAn electrical
connection from the distant grid...
Mill
...to a rural school or clinic... ...lowers costs for
additional electricty access locally...
...fostering wealth- generating and labor- saving opportunities.
ICT Waterpumping
Householdconnections
Lightmanufacturing
Local shops and services
Waterpumping
Householdconnections
Lightmanufacturing
Local shops and services
Mill
Or a stand-alone power source, such as a diesel generator or renewable energy-based system...
...can provide similar services and options for expanded connections nearby.
Meeting the MDGs requires that coordinated and simultaneous efforts are made in all social sectors as well as in poverty reduction. This allows the possibility of planning across multiple sectors, in which case a natural aggre-gation of demand can occur within a community, producing significant cost reductions.
The dispersed and possibly remote nature of rural settlements has always posed a challenge for the provision of infrastructure, whether it is roads, elec-tricity, or telecommunications. Moreover, the reliance of a rural economy on agriculture, livestock, forest products, or fishing places larger demands on mechanical power that are specific to the particular nature of rural income-generating activity, its processing needs, and the mode of irrigation if any. The

55
lack of large anchor industrial and commercial customers, the seasonal and dispersed nature of agricultural loads, and peaky household demand make it technologically more difficulty to service a rural area with grid electricity infrastructure. If road infrastructure is poor, the tasks of maintenance, meter reading, and bill collection also become difficult. Finally, population densities can vary widely.
For all these reasons, both centralized and decentralized approaches can be viable means of addressing the issues arising out of the community-level targets for mechanical power and electricity in rural areas, depending on context. The technology options for community access are examined here in terms of cen-tralized and decentralized approaches, followed by a brief discussion of options for access at the household level.
Technology Options for Centralized Approaches in Rural AreasIn urban areas, centralized approaches are generally the obvious choice, provid-ing an interconnected grid serving thousands of households in addition to pub-lic institutions and businesses. In rural areas with no electrical service at all, a centralized system can still be viable—particularly if envisioned as a grid serv-ing public institutions, community centers, and small businesses—even when household electrification is not cost-effective. With the use of motors, these community electricity connections can meet both electricity and mechanical power needs simultaneously.
The cost-effectiveness of centralized systems in rural areas will be deter-mined by overall population density, aggregation of various social needs, whether households are ‘nucleated’ into villages or spread more evenly over the landscape, and distance between community centers and any pre-existing grid power. These factors determine the cost of transmission and distribution infra-structure, which are the dominant cost component when extending service in rural areas. High-density but dispersed (as opposed to nucleated) rural settle-ments (for example, the population around Lake Victoria in East Africa) rep-resent a large fraction of the population without significant access to modern energy services. For this population, the average distance between community centers (serving one or more clinics, schools, markets, or kiosks) is generally no more than two kilometers. This density of community centers allows people to exploit networked options for electricity service. Such centralized systems have the added benefit that they can provide low marginal cost access for small businesses located in the vicinity of the community centers
In planning larger-scale, centrally planned and administered systems, issues such as reducing unit costs to expand access to larger populations and recov-ering operating costs become more important. Since transmission line costs tend to dominate initial capital expenditures for grid and mini-grid electrifica-tion projects, reducing these costs can significantly impact the overall costs and extent of rural electrification. What is clear is that there are considerable
Strategies and Technology Options

56 Energy Services for the Millennium Development Goals
variations in materials and labor costs across countries. Figure 8 shows a com-parison of medium voltage line costs per kilometer varying from US$2,000 for India to US$18,000 for Mali for the same configuration. Some of the varia-tion in cost is because of availability of low-cost materials (such as inexpensive cement in India for concrete poles), varying standards, and topography and transport. However, bulk purchase and lowered transport costs alone could lead to significant savings. A combination of high penetration rates ensured by government policies and lowered line costs can have dramatic effects on the cost of a new connection.
Figure 8. Variation in total three-phase, medium-voltage
line cost (labor and materials) for selected
countries
Source: ESMAP 2000, p. 10.
Cos
t /
kilo
met
er (
US
$)
Indi
a
Laos
Sen
egal
(1)
Sen
egal
(2
)
Mal
i
Met
tler
Inc.
(U
SA)
Ippa
hann
ok (
US
A)
El S
alva
dor
MaterialsLabor
0
5,000
10,000
15,000
20,000
25,000
Ban
glad
esh
Ben
ton
REC
(U
SA)
Bol
ivia
Phili
ppin
es (
Mor
esco
)
Phili
ppin
es (
Tare
lcol
l)
Phili
ppin
es (
NE
A)
In envisioning a centralized system that provides electricity to community centers and public institutions, there is much to learn from the successful rural electrification programs of Tunisia and South Africa (among other countries). These countries have carried out cost-effective electrification programs at rates that can achieve national coverage in two to three decades, the details of which offer innovative approaches to expanding access to low-consumption consum-ers in rural environments. These cases provide evidence of how large-scale, mission-oriented approaches to rural electrification have succeeded in reducing costs per connection, increasing the efficiency of billing and other aspects of management, and otherwise establishing a set of best practices to be studied in future planning.

57
A recent program undertaken by the Tunisia Electricity and Gas Com-pany (STEG) achieved dramatic cost savings, which in turn contributed to a remarkable rate of cost-effective electricity grid expansion (Cecelski et al. 2004). As part of a multisectoral approach to the extension of a range of infra-structure and services to rural communities, Tunisia’s electrification program expanded services from 6 percent of the population in 1976 to 88 percent in 2001, including bringing electricity to 35 percent of people living in rural areas. The technical strategy of the program was to use a combination of three-phase and single-phase power lines, preferentially extending less-expensive, single-phase wire to rural communities. This approach saved an estimated 30–40 percent over the cost of medium-voltage (MV) lines, 15–20 percent on MV/low-voltage (LV) substations, and 18–24 percent on the system overall relative to what the same expansion would have cost with the previous ratio of MV and LV lines. In addition, the Tunisian program carried out such other aggressive cost-cutting measures as use of single wire earth return (SWER) design, shorter poles (saving 20 percent on cost), equipment standardization, and bulk buying. Administrative innovations, such as decentralized planning and improved corporate management practices, contributed to efficiency at the institutional level. As an indication of the program’s success, Tunisia has set rural electrification for all as a minimum standard for public service and has set a goal of 100 percent electrification, through a variety of grid-based and off-grid technologies, by 2010.
South Africa’s national electrification program showed similar success, driving down costs of both connections and payment schemes by reducing administrative overhead and loss. Electrification in South Africa grew from about 36 percent of households in 1990 to 67 percent in 2000, with more than 3 million new customers. Dramatic reductions in the capital investment costs per customer of rural electrification suggest that appropriately planned rural systems need not be much more expensive than urban systems (Gaunt 2005). Between 1996 and 2001, the national average cost per rural electric connection decreased by 40 percent in current terms and 70 percent after taking into account inflation, eventually becoming the same as an urban connection cost. The savings were achieved by adopting designs that match the network technology and capacity more closely to the requirements of the customers (greater application of single-phase instead of the traditional three-phase distribution at medium and low voltage), broad application of prepayment metering, and revised industry standards and implementation procedures. Using low-capacity, low-cost grid connections, South Africa’s rural electrification program can supply substantially more energy than pho-tovoltaic systems for a similar or lower cost. The South African experience with prepayment metering is a development of significant note, since this can allow consumers to purchase a service in small quantities and at the same time ensure low-cost bill collection. These payment methods dramatically
Strategies and Technology Options

58 Energy Services for the Millennium Development Goals
reduce the fraction of costs that are purely administrative for servicing a household with low consumption.
The institutional and regulatory issues that apply to centralized urban sys-tems also apply to centralized systems in rural areas. From these and other examples, a wealth of knowledge is now accumulating about best practices in structuring the roles of government, investors and donors, service provider institutions, and NGOs. Some of these are lowering or eliminating tax bur-dens; standardization and certification of systems; supporting programs for training in the design, maintenance, and safe use of these systems; and credit and delivery mechanisms.
Technology Options for Decentralized Approaches in Rural Areas The options for creating access through decentralized systems cover a wide range, from a stand-alone system for a single community center to a mini-grid connecting many community centers or institutions. The choice of a technol-ogy for a stand-alone system would depend upon the amount and kind of power (mechanical or electric) needed. This section does not address all tech-nology and cost options in detail but instead aims to identify key factors that influence system choices.
For a variety of reasons—geographical sparseness, availability of a local renewable resource, community centers spaced far from each other, different times at which electricity provision is installed, or simply the lack of coordina-tion among the various implementing agencies —the lowest-cost option for a given community center may be a stand-alone system.
Those who live in lower-density rural areas—as in many parts of Africa, including the Sahel—present an even greater challenge. These areas can be defined (somewhat arbitrarily) as having 100 or fewer persons per square kilometer, which corresponds to an upper limit of about 10 to 20 households per square kilometer. Where there are nucleated settlements (even though each settlement is far from the others), aggregation of community-level needs, both social and economic, is the likely situation. In such a situation, community-level access could be provided in conjunction with productive use functions, using a single stand-alone system with enough mechanical and/or electric power to serve all the functions, as has been done with the multifunctional platforms (MFPs) in West Africa. This intervention allows women direct access to mechanical power, including end use devices pow-ered by the engine, through cooperative ownership of the platform with wider access to the community through user fees (see Box 7).
The success of the MFPs suggests that it is not enough just to make energy services available, but that it is necessary to ensure that end-use devices critical to women and men are actually made available to them and are owned by them. What has been central to the success of this model is that the consumer does not bear the full cost of the equipment that generates

59
Box 7. Diesel-powered multifunctional
platform (MFP) in Mali
Source: Anderson et al. 2004.
By many measures, Mali is one of the poorest and least-developed countries in the world.
As of 2001, more than 70 percent of the population survived on less than $1 (PPP) per
day, and the nation falls very near the bottom (172 of 175) of the UNDP’s Human Develop-
ment Index (HDI). Geography and energy are key factors in Mali’s poverty: nearly three-
quarters of Mali’s population of roughly 12 million lives in semi-arid rural areas, where
poverty is most severe and yearly variations in rainfall can have drastic economic impacts.
Rural villages tend to be small (1,000 to 2,000 people) and dispersed, and electrifica-
tion is virtually nonexistent. Biomass constitutes the vast majority (90 percent) of the
country’s energy supply, particularly in rural areas, where women and girls are responsible
for the time-consuming and labor-intensive work of fuel collection.
Beginning in 1993, the UN Industrial Development Organization (UNIDO) and the
International Fund for Agricultural Development (IFAD) initiated a program to decrease
the burden of fuel collection, to supply labor-saving energy services, and to promote the
empowerment of women through the provision of the ‘multifunctional platform’ (MFP) to
rural villages. The MFP is a 10-horsepower diesel engine with as many as twelve modular
components in an integrated system that can supply a variety of services. These include
mechanical power for time- and labor-intensive work such as agricultural processing (mill-
ing, de-husking) and electricity for lighting (approximately 200–250 small bulbs), welding,
or pumping water.
Although the benefits of these services are shared by many people in the villages,
those who acquire, own, manage and control the platform itself are women’s organiza-
tions. This is not only to ensure that women and children benefit directly, but also to create
a group with the necessary skills to ensure the MFP’s long-term viability, while building
capacity and empowering women generally. Women’s groups are responsible not only for
owning and managing the system, but also for covering between 40 and 60 percent of the
MFP’s initial cost; this amounts to as much as US$2,600 of the US$4,300 total cost for
construction and installation. The remaining US$1,700 or so is provided by the program,
which is donor-supported.
In 1998, UNDP and the Government of Mali began supporting the program’s implemen-
tation phase, which installed nearly 500 MFPs between 1999 and 2004, reaching an esti-
mated 100,000 rural women in villages. Each MFP intervention—from a feasibility study,
to installation, to operation—lasts about two years. Capacity building and institutional
support is strongest in the earlier phases, then tapers off, leaving the rural women’s vil-
lage groups in charge of the platform’s operation, relying on a network of private suppliers,
technicians, and partners. Benefits observed in 12 villages studied suggest that freeing
up women’s time has led to multiple benefits such as increased cash income, higher food
consumption, and higher girl to boy ratios in schools.
Overall, the MFP program in Mali offers compelling evidence that time saved in the
lives of women and children, combined with the added socioeconomic and capacity ben-
efits to women’s groups of controlling and managing the MFP as a resource, can confer
substantial benefits to health and welfare.
Strategies and Technology Options

60 Energy Services for the Millennium Development Goals
or uses the energy, nor the cost of the technical assistance to develop the program. Rather, these costs are borne by the community, as a local utility (even a small one) would have to do. Individuals pay a fee for services that captures the variable cost of running the system plus some aspect of the overall or fixed costs of the system. The investment for the system at large falls on an organized community entity, business or NGO, thereby separat-ing the burden of investment from the benefit of the service at the point of consumption by the user.
In low-density rural areas where there is no nucleation, the key ques-tion is likely to be whether the community centers, public institutions, and economic needs are near each other. In such cases, education and health facilities could be powered by stand-alone systems that rely on small-scale renewables or a diesel generator. Where some degree of aggregation is pres-ent in the form of existing community centers (even though households themselves are dispersed), a mini-grid connecting the centers and powered by diesel generators may be viable. These would also permit use for produc-tive functions on a fee-for-service basis. Low-density areas are likely to have poor access to transport, unreliable fuel supply, and lack of maintenance facilities. In these areas, the high initial cost of stand-alone and robust off-grid technologies may actually turn out to be cost-effective in the long run.
Technology Options for Household-level Electricity Services in Rural Areas The energy target for rural areas has primarily addressed access to mechani-cal power and electricity at the community level. If one imagines a 10-year time horizon for energy and other development planning, it is prudent to anticipate a transition in which individual households shift from a low level of illumination and communication (provided by kerosene lamps and dry cells for radios) to electricity-based illumination and use of such appliances as television and eventually to power-demand levels that require grid elec-tricity. With this transition in mind, it is important to recognize approaches that permit energy services such as electricity-based household illumination and basic communication services without a grid. These services could be provided with a single, central node for a community. Box 8 provides details of some of the economic and technical factors that favor adoption of elec-tricity as an energy carrier for key lighting and communication services.
If households are tightly clustered in nucleated settlements, a local mini-grid may also be viable for household-level electricity supply. This mini-grid could be powered from a centralized system or a decentralized system such as micro-hydro, wind, or diesel genset. The electricity system in Urambo Village, Tanzania describes an independent rural cooperative successfully operating a diesel mini-grid serving 250 co-operative members (see Box 9).

61
Box 8. Gains possible in a
transition to electricity:
An example from Kenya
Source: Based on survey data and field observations from
fieldwork in Kenya.
In rural households, consumption of energy for non-cooking related services such as
lighting and communications is likely to be relatively small. Even here, one can anticipate
great improvements in efficiency, affordability, and environmental impact for some ser-
vices, with a transition to electricity as an energy carrier from such commonly used fuels
as kerosene. Many in rural areas currently rely on kerosene wick lamps. In addition to
producing smoke and soot, due to the low efficiency inherent in converting heat to light,
these kerosene lamps tend to provide approximately 20 lumens and consume 20 to 30
liters of kerosene per year when used for three to four hours per day. The service provided
amounts to a minimal amount of light—generally insufficient for reading, at an annual cost
of roughly US$13—and includes potential risks from smoke and open flame.
In contrast, the following electricity-based example sets an arbitrary but useful stan-
dard for home lighting at a minimum level of about 300 lumens, which can provide light
sufficient for reading and, if desired, room illumination in the evening for simple tasks.
Although this minimum standard represents an increase in light level of at least one order
of magnitude above that provided by kerosene, it can be produced cleanly and efficiently
from a 7W source using a compact fluorescent lamp.
If one adds to this basic lighting service additional electricity for communication
devices (radio, cell phone)—amounting to 3W—one can anticipate a total need of 10W
for 3 to 4 hours a day for each rural household. This corresponds to about 15 kWh per year
per household. The actual consumption level would vary by household, depending upon
the cost of service, individual ability to pay, and form of payment.
The power for light and communications could be provided by a portable battery,
recharged at a central point in a town or village, which would likely be at least as close as
the point of purchase for the kerosene currently used. And, at even US$0.40 per kWh—a
cost achievable with a diesel generator —the yearly cost of electricity would total roughly
US$6, far less than the expense of the kerosene for which it would be a substitute. If
electricity from some other source (for example, the electric grid or a microhydro facility)
is available at a central point within the community, the recurring costs would be further
lowered. The results, then, of a transition to electricity provided by portable batteries
charged at a central access point would include improved lighting, expanded access to
energy for communications, and reduced indoor air pollution from kerosene, all at a sub-
stantially reduced cost.
While solar PV technology is also ideally suited for meeting low loads of 30 to 40 Wh
per day, to ensure autonomy over three days people would need a solar home system of
about 20W peak capacity. Such a system would cost about US$150 to US$200 today,
including batteries and a charge controller. While the initial costs of such a system are
significantly higher, limiting access to fewer people, the recurring costs are lower, primar-
ily due to battery replacement costs.
Although this system currently serves only about 10 percent of the village, the possibility for extending service to the poorest in the community might include a state-supported, cooperative-operated program that could either provide a lifeline rate with limited consumption (of roughly 2 to 3 kWh per month) or low-cost, battery-charging services.
Strategies and Technology Options

62 Energy Services for the Millennium Development Goals
Box 9. Electricity services in Urambo Village,
Tanzania
Source: Ilskog et al. 2005.
As of 2001, only an estimated 2 percent of Tanzania’s rural households had access to
electricity services. As a strategy for accelerating rural electrification, the national electric
utility (TANESCO) and the Stockholm Environmental Institute (SEI) recommended the cre-
ation of rural electricity cooperatives operating independently of the national utility. The
first in Tanzania, the Urambo Electric Consumers Cooperative Society (UECCO)—based
in Urambo Village in the Tabora region—was established in 1993 by the Urambo District
Council with assistance from SEI, TANESCO, and the Swedish International Development
Agency (Sida). UECCO began operation in 1994, after first rehabilitating the generation
and transmission infrastructure of the pre-existing local electricity system (three diesel
generators of 85–100kW and ~11 km of power lines) and establishing the financial and
institutional foundation necessary (writing by-laws, creating a development committee,
hiring and training local employees, and setting share prices, connection fees, and tar-
iffs).
By 2002, UECCO employed three workers (two technicians and one accountant) and
provided electricity service to approximately 250 cooperative members, mostly house-
holds, totaling an estimated 2,000 persons, or 10 percent of the village. Customers
consumed an average of ~250W per connection, for around 4 hours per day, totaling
roughly 35 kWh per month. Even as the customer base expanded, the system has pro-
vided reliable service: electricity was provided for 97 percent of the scheduled hours in
2002. Diesel-to-electricity conversion efficiency was equal to or better than that achieved
by TANESCO’s comparable plants. Tariffs for most customers are billed according to con-
sumption and metered at the household level. Through this system, the coop’s tariff
income generally meets its operating expenses, which consist primarily (80 percent) of
fuel costs, with the remainder going to maintenance and salaries. The development com-
mittee held periodic meetings to adjust tariffs.
It is noteworthy that UECCO’s tariff as of October 2002 was US$0.47 per kWh, more
than 10 times the rate for electricity supplied through TANESCO’s grid. The viability of
UECCO’s system at this price suggests that TANESCO’s service is perhaps too heavily
subsidized. In a day-to-day sense, the system is largely technologically and financially
viable, even at a penetration rate of only 10 percent within the village. The possibility of
establishing a ‘lifeline’ service, as low as 2–3 kWh per month may be an option, though
in the past users have preferred metered consumption to flat rates with an upper limit on
consumption.
Important challenges remain: Committee meetings, at which tariffs are established or
changed, tend to be far too infrequent to effectively respond to wide swings in fuel costs,
leading to budget deficits for UECCO. Also, though tariffs effectively cover most of the
day-to-day expenses of UECCO, they do not recover sufficient capital for large-scale, occa-
sional repairs. Generator breakdown and other similar events have required additional
donor assistance. Finally, there remain some users who, due to lack of available meters
at the time of their connection, are charged a flat rate and are probably substantially over-
consuming relative to their tariff payments.
.

63
In high-density rural areas, a geographically well distributed grid net-work that forms the backbone for community services can allow one to lever-age household-level services through reduced-cost electricity connections. A medium-voltage electric line to a community center would facilitate dramati-cally reduced cost for a household connection within a radius of approximately 500 meters of each transformer spaced, for example, every 1 kilometer along the MV line. While few people would be able to immediately afford such a connection, it allows a utility to combine the reduced costs of connecting to existing nodes with possible micro-credit and/or private financing to increase rural supply options. Where grid electrification has occurred, the financial health of the utility and attention to institutional structure are critical. A lack of transparent mechanisms to meet generation cost can lead to unreliable and erratic supply, which in turn jeopardizes service to the truly needy.
Stand-alone solar home systems also allow household-level basic electric-ity access; they are far more convenient than a portable battery and have the added advantage of being independent of the local grid or service provider. Bangladesh is presently experiencing an impressive growth of this market seg-ment, with sales averaging 25,000 modules monthly. Emerging technologies could reduce the cost of such decentralized systems. Supportive policies such as tax incentives, technical standardization, and possible CDM funding would encourage such market development, which in turn would eventually reduce the costs of these options for the poor as well.
Energy Technology Options and the Environment This report advocates the adoption of increasingly cleaner energy technolo-gies with economic growth as opposed to expensive solutions that ‘leapfrog’ to the cleanest possible technology immediately. To quote from a DFID report, “Consideration of the positive environmental aspects of renewable energy sources must be balanced against meeting practically, quickly and efficiently the immediate energy needs of the poor with whatever energy services are accessible,” and “The dangers of not allowing the stalemate to be broken could be devastating for a population that is already weakened by poor health. More-over the technology choices made in meeting the immediate energy needs of the poor need not be permanent” (DFID 2002, p. 23). Hence the advantages and disadvantages of fossil fuels, particularly the environmental impacts, need to be weighed in a broader context of needs. As explained in Chapter 2, current and future emissions of GHGs are not caused primarily by the poorest people and the principle of common but differentiated responsibility for GHG emis-sions reduction is a globally agreed principle.
Strategies and Technology Options


Planning and delivery of energy services are made extremely challenging by the fact that, perhaps more than any other facet of development, energy touches upon virtually every aspect of society—from economic well being to social well being, and from the smallest scale dynamics of access and use at the individual and household level to the largest scale national and international issues. It is essential for energy planning to recognize the energy service needs of the eco-nomic and social sectors that will use energy services. An understanding of the needs and conditions experienced by those who will receive services requires coordination with the sectoral ministries. These are generally the ministries of energy, health, education, water and sanitation, telecommunications, industry, agriculture and/or rural development, and roads or transport. Energy services that rely on biomass for cooking cut across numerous sectors such as health, agriculture, forestry, environment, and improving the lives of women. The results of such planning need to be explicitly articulated in the national strat-egy for poverty reduction.
A central recommendation of this report is that countries develop strate-gies for increasing access to energy services as an integral part of their national development strategies to meet the MDGs. This chapter lays out some com-mon implementation challenges that planners may need to address as they prepare MDG-based energy strategies. It highlights several ‘system wide’ inter-ventions and policy choices to respond to crucial issues that will need to be addressed in any national energy strategy for the MDGs. It closes by outlining additional considerations that need to be borne in mind by energy planners and development partners as they develop and evaluate the energy component of a country’s MDG strategy.
CHAPTER 5: Implementation Challenges

66 Energy Services for the Millennium Development Goals
Challenges Facing Energy Institutions and Systems Energy service providers in many developing countries face a host of chal-lenges that can limit their ability to expand energy services to the poor on the scale required to meet the targets defined here. Some of these chal-lenges include:
• technical problems such as electric utilities with limited generation capacity and losses in transmission and distribution that nonetheless face high and growing demand;
• difficulties with investment financing and operating-cost recovery, including the ability to set cost-recovery tariffs and implement col-lection mechanisms adapted to the ability to pay of all users, includ-ing the poorest;
• institutional issues such as the need for a proper regulatory and legal framework, as well as greater transparency and efficiency of utilities’ management.
• the need for effective partnerships between the public sector (to pro-vide the legal and regulatory framework and protect the needs of the poor), the private sector (to develop and manage energy service utilities), and communities and local governments (responsible for the public services’ consumption of energy). For example, opportu-nities for adding generation capacity and developing local grids are frequently missed due to lack of a suitable framework that allows independent power producers to obtain licensing and feed electricity into the grid and local small utilities to develop.
It is crucial to address these institutional issues in order to improve the ability of energy-service providers to forecast energy supplies, to be financially viable, and to reliably meet the demands of current users and expand the services to new customers in pursuit of MDG-consistent objec-tives. Urban, peri-urban, and rural users would all benefit from the added reliability and predictability that financial, technical, and institutional health permits. The successful examples of sustained political commitment to creating incentive frameworks that have led to significant expansion of systems that have benefited the urban and rural poor (Thailand, Chile, Mexico, Morocco, South Africa) offer elements of solutions that can be replicated.
Finally, current trends in hydrocarbon fuel prices underscore the potential additional vulnerability of energy systems in net oil-import-ing countries. This vulnerability must be taken into account in planning energy systems and in designing incentive frameworks to increase energy efficiency and diversify energy resource portfolios and technological solu-tions. It also requires provision of an energy social safety net for the users most at risk.

67Implementation Challenges
Integrate Energy Planning and Implementation into a National Strategy As this report shows, energy services are critical for achieving the MDGs and therefore must be part of any national strategy for meeting the Goals. Unfor-tunately, this is rarely the case in developing countries.
Many past national development strategies have either neglected or paid only lip service to long-term energy planning. Some of the shortcomings have included:
• insufficient resources overall, and particularly for the operation and main-tenance of distribution and transmission systems;
• political expediency that favors one-time project allocations and fails to pro-vide for the recurring costs of energy services used by public institutions;
• lack of long-term planning, transparency, and public participation dur-ing the planning, contracting, and implementation process;
• inadequate institutions and technical capacity to carry out planning studies, establish performance standards, create environmental impact norms, and monitor and enforce established rules.
As a first step, it is therefore recommended that countries systematically integrate their energy-sector development strategies into a comprehensive MDG-based national development strategy. In addition, the very importance of energy services to a wide variety of sectors and ministries poses a coordina-tion challenge. Meeting this challenge requires country-level planning across the various ministries, including coordinated assessments of the quality and quantity of demand for primary energy sources, the delivery infrastructure, and the institutions responsible for the ‘last-mile’ of delivered energy services.
Planning should anticipate increasing demand in a manner that takes advantage of economies of scale, now and in the future. If it is recognized in the early planning stages that demand for these services will grow as access is increased, planners can create systems that will, at higher use rates, have dra-matically lower per unit costs. These higher demand levels, which can be met with cost-recovery tariffs and pricing, can in turn lead to lower incremental costs for those whose initial needs are small.
Be Flexible in Energy PlanningIt is recommend that policies be geared not toward promotion of specific tech-nologies but rather toward supporting a diversity of energy technologies and service delivery models. This is crucial, since energy needs, technology costs, capacity for implementation and technical support, and many other factors can vary enormously from one context and time to another.
In addition, it is important to recognize the potential for synergies. The combination of local productive enterprises, local energy resources, techni-cal improvements in production, efficiency improvements in use, emissions

68 Energy Services for the Millennium Development Goals
control, and sustainable land-use practices can all add up, leading to produc-tivity enhancement and simultaneous reduction in unit costs while allowing beneficial use of an otherwise potentially harmful energy source. One example of this is the use of fuelwood, perhaps from agroforestry practice, in conjunc-tion with improved cookstoves and an improved cooking environment with suitable modification to the kitchen. Another example is the efficient and con-trolled production of charcoal from wood obtained from sustainably managed woodlots combined with use of efficient charcoal stoves.
It is also crucial that policies recognize and support the energy delivery sys-tems that are evolving in poor communities in the absence of more organized efforts; lack of support for mini-grids or stand-alone diesel power can result in failure to take advantage of a tremendous opportunity to expand access for the poor. In Ethiopia, for example, the capacity of all imported diesel genera-tor sets over the last 10 years is over one gigawatt (Melessaw Shanko, personal communication), exceeding the current installed hydropower capacity of the country. These mini-grids are addressing the need for access in areas with-out transmission and distribution systems. These systems may have higher financial unit costs than grid extension but have the advantage of being more quickly deployed until grid extensions can be operational. Utilities, NGOs, donors, and planners should recognize the role of these services and the private sector in development and ensure that these solutions are supported through financial assistance, technical support structures, and appropriate standards.
Design Effective Regulatory Framework ‘Pro-poor’ energy policies will need to be implemented within a regulatory framework that prioritizes the provision of energy services to poor communi-ties and rural areas. Regulatory frameworks should be designed that use energy as an instrument to effectively deliver social needs, stimulate productive activi-ties, enable work that adds value in agriculture and services, and spur economic growth.
Sustained political commitment is required to create a framework of market conditions amenable to energy-based approaches to poverty reduc-tion. Macroeconomic policies and fiscal management should encourage eco-nomic diversification, the diversification of energy resource portfolios, the participation of communities and a larger number of private entrepreneurs in delivery systems, and the most efficient use of these resources through market incentives.
Reduce Costs through Financing Mechanisms and SubsidiesEconomic barriers limiting access to energy services by the poor can come in a range of patterns. Evidence shows that, in most cases, the poor do pay for energy—often at much greater per-unit costs than higher-income consum-ers and for a lower quality of service (ESMAP 2005d). The poor also often
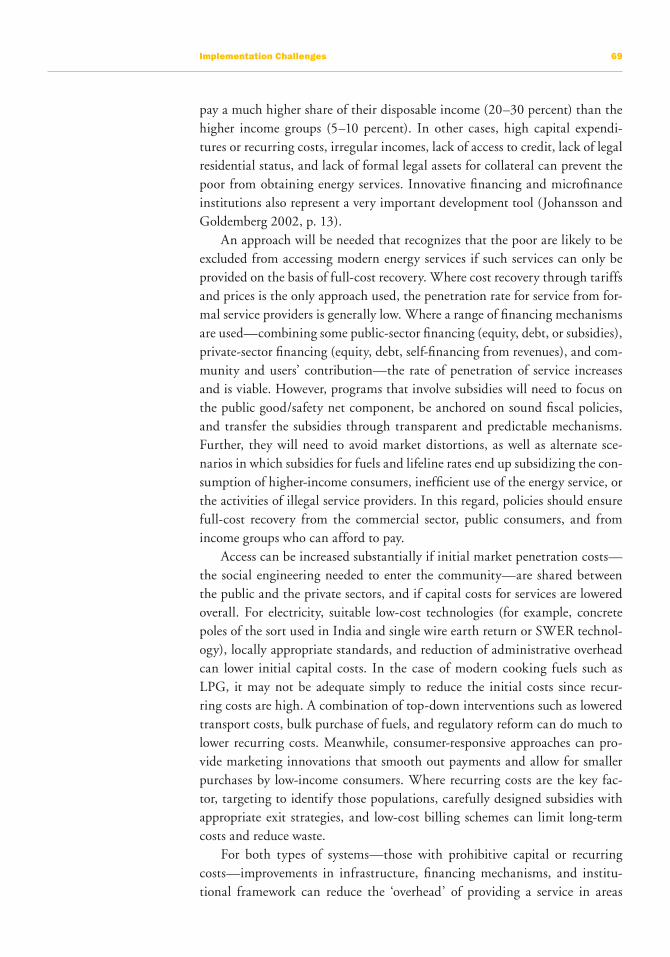
69Implementation Challenges
pay a much higher share of their disposable income (20–30 percent) than the higher income groups (5–10 percent). In other cases, high capital expendi-tures or recurring costs, irregular incomes, lack of access to credit, lack of legal residential status, and lack of formal legal assets for collateral can prevent the poor from obtaining energy services. Innovative financing and microfinance institutions also represent a very important development tool (Johansson and Goldemberg 2002, p. 13).
An approach will be needed that recognizes that the poor are likely to be excluded from accessing modern energy services if such services can only be provided on the basis of full-cost recovery. Where cost recovery through tariffs and prices is the only approach used, the penetration rate for service from for-mal service providers is generally low. Where a range of financing mechanisms are used—combining some public-sector financing (equity, debt, or subsidies), private-sector financing (equity, debt, self-financing from revenues), and com-munity and users’ contribution—the rate of penetration of service increases and is viable. However, programs that involve subsidies will need to focus on the public good/safety net component, be anchored on sound fiscal policies, and transfer the subsidies through transparent and predictable mechanisms. Further, they will need to avoid market distortions, as well as alternate sce-narios in which subsidies for fuels and lifeline rates end up subsidizing the con-sumption of higher-income consumers, inefficient use of the energy service, or the activities of illegal service providers. In this regard, policies should ensure full-cost recovery from the commercial sector, public consumers, and from income groups who can afford to pay.
Access can be increased substantially if initial market penetration costs—the social engineering needed to enter the community—are shared between the public and the private sectors, and if capital costs for services are lowered overall. For electricity, suitable low-cost technologies (for example, concrete poles of the sort used in India and single wire earth return or SWER technol-ogy), locally appropriate standards, and reduction of administrative overhead can lower initial capital costs. In the case of modern cooking fuels such as LPG, it may not be adequate simply to reduce the initial costs since recur-ring costs are high. A combination of top-down interventions such as lowered transport costs, bulk purchase of fuels, and regulatory reform can do much to lower recurring costs. Meanwhile, consumer-responsive approaches can pro-vide marketing innovations that smooth out payments and allow for smaller purchases by low-income consumers. Where recurring costs are the key fac-tor, targeting to identify those populations, carefully designed subsidies with appropriate exit strategies, and low-cost billing schemes can limit long-term costs and reduce waste.
For both types of systems—those with prohibitive capital or recurring costs—improvements in infrastructure, financing mechanisms, and institu-tional framework can reduce the ‘overhead’ of providing a service in areas

70 Energy Services for the Millennium Development Goals
where an ability to pay for the service already exists, particularly if these over-head costs are reduced to levels comparable to those in developed countries with high penetration of services.
It is also critical that policies be enacted that facilitate delivery of energy services. For example, policies can lead to the creation and strengthening of businesses and institutions that will provide energy services, and they can pro-mote the kind of training that people who own, manage, and work in these businesses will need. National governments can assist by reducing import duties on energy-generation technologies and equipment for electricity genera-tion, transmission, and distribution.
Enhance Human Capacity through Education, Training, and ResearchTo support national and regional infrastructure development, as well as con-sumer-responsive service delivery systems, education and training programs are needed for skilled technicians, planners, entrepreneurs, financial services and community workers. Gender balance in skill development and use is also key to ensuring that energy services respond to the different needs of men and women.
The place-specific nature of energy resources and related infrastructure will also require local research. For example, in order to exploit the geothermal resources in the Rift Valley of East Africa, people are needed with training in geology as well as geothermal engineering to carry out everything from explo-ration and drilling of test wells to design, construction, and maintenance of the power plants. To carry out the detailed analysis and management of envi-ronmental, social, and economic impacts of hydroelectric power plants would require experts in hydrology, earth science, engineering, economics, and social sciences. Although the need for technical capacity in Africa is great—and pro-jected to increase—it is one of the least-developed aspects of most enterprises throughout sub-Saharan Africa. A recent UNIDO report (2004) emphasized the reluctance of African manufacturers and other firms to employ trained scientists, engineers, and technicians. Even in Zimbabwe, which historically has had the second-most advanced industrial sector in the region after South Africa, scientific and technical staff tend to make up less than two percent of the workforce, and these are overwhelmingly concentrated in food-processing firms, due to that industry’s quality control and testing needs.
Moreover, energy services for rural areas are likely to require a variety of alternative ownership and market structures. If such structures—private com-panies, cooperatives, local consumer associations, public-private joint ventures, or local government initiatives—are to develop, trained people who can create and manage these institutions will be needed. Enhancing local research will lead to capacity building, technological developments that emerge from local needs and practices, and the emergence of standards.

71Implementation Challenges
Address Regional and International IssuesIn addition to local and national needs, if energy services are to be viable over the long term and scalable in a manner that will serve the millions in need, they will have to address larger regional and international issues such as trade barriers, regional integration, and the transnational nature of many energy resources.
The growth and integration of regional infrastructure and markets can be a driver of economic and social development in Africa and many other regions of the developing world. The formation of regional power pools, transmission line networks across countries, and pipelines for fuels can all contribute to bet-ter utilization of capacity, lower costs, reduced variability of supply, and a more optimal mix of primary energy sources at any point in time. It is also clear that hydropower and geothermal resources do not follow political boundaries. The creation of joint agreements for sharing the costs of study, research, and development of new regional sources of energy such as those that cut across physical and political geographies can help reduce costs and aid development across nations. The development of shared oil, gas, and electricity infrastruc-ture and markets—such as the Southern Africa Power Pool (SAPP), the West Africa Power Pool (WAPP), and the West Africa Gas Pipeline (WAGP)—are expected to bring multiple benefits to participating nations.
For many reasons—including economic efficiency and expansion of energy services—national governments and international lending and development institutions have targeted energy systems, particularly for electricity and petro-leum products, for interconnection at the regional level. Sharing electricity generation capacity allows some countries to meet energy needs without rely-ing entirely upon their local primary energy resources or having to expand their own generation. Also, there are great price differentials in Africa: house-hold electricity tariffs range from roughly 16 cents per kWh in Mali to roughly 5 cents per kWh in Ghana (Layec n.d.). This suggests the potential for trade, expansion in generation and supply for those with a comparative advantage, and lower cost for buyers. Other benefits relate to the nature and size of the energy markets themselves. A larger market encourages private investment and allows for projects that are larger-scale, lowering supply costs and reducing the need for redundant facilities.
Integration of energy infrastructure can also have beneficial impacts on regional politics, peace, and security. It tends to decrease the macroeconomic risks for particular countries by helping them to diversify their energy sources. Integration also fosters economic cooperation and increases the costs of con-flict (Stryker et al. 1997). In contrast, a lack of crucial infrastructure, or lim-ited energy systems with high technical and ‘non-technical’ losses (often due to theft), are widely recognized as impediments not only to the provision of services offered by the infrastructure itself, but also other crucial elements of growth, such as trade (Oshikoya and Hussain 2002).

72 Energy Services for the Millennium Development Goals
Multiple studies have considered the necessary preconditions, expected benefits, and strategies of implementation for regional electricity markets in a diverse range of developing-country settings. A study of these issues in South America by ESMAP and the Regional Integration Energy Commis-sion (CIER, a professional association of electricity companies) outlined the changes in infrastructure and legal/institutional factors, such as harmoniza-tion of regulatory rules, needed to create a 10-country regional power mar-ket including most of the South American continent (ESMAP 2001c). Other studies have examined related topics—such as progress toward and barriers to energy-sector reform, as well as the potential for development of additional energy resources—for regional power markets in the Greater Mekong Sub-Region (ESMAP 2001a), in the Nile River Basin (ESMAP 2005c) and in the East African Great Lakes Region including Burundi, Rwanda, and Zaire (ESMAP 1989). Regional integration and power pools require functioning and independent regulatory authorities and inter-country agreement on over-all energy policy. Some studies have cautioned about the potentially adverse impacts on the poor in terms of access to electricity in privatized markets that focus on trading wholesale electricity whereas the retail side of the market (the electricity that reaches the consumer) may in fact become less stable due to market volatility (Johansson and Goldemberg 2002, Ch. 3).
A frequently cited example of potential gains from integration of energy infrastructure—for Africa generally, but Central Africa in particular—is the potential for hydroelectricity generation and distribution. Some estimates for hydropower in Africa include 300 GW of continuous energy for the continent as a whole and 90 GW of continuous energy for the Democratic Republic of Congo. The latter estimate equates to nearly 800 TWh per year, a potential amount that is third behind estimates for China (1,320 TWh per year) and Russia (1,096 TWh per year) and ahead of both the United States (700 TWh per year) and Canada (530 TWh per year). The power generation guaranteed during low water output years is estimated to be 80 percent of the installed capacity for the Democratic Republic of Congo, and this is the highest guaran-teed amount of any nation (Sarfoh 1993; Hammons et al. 2000). Power experts from around the world have argued for this resource as a basis for regional and additional continental interconnections, based on a five-region plan. These would enlarge the extent of Africa’s interconnections—currently limited to three, in the West, South, and East—while expanding Africa’s energy supply, creating opportunities for continental energy trade and export to Europe.
Implementation Challenges

While there is no MDG on energy, access to energy services, especially by poor people and communities, is essential to reaching all of the MDGs. More and better energy services are needed to end poverty, hunger, educational disparity between boys and girls, the marginalization of women, major disease and health service deficits, as well as environmental degradation.
Energy services are the benefits that energy supplies produce; they include cooking, illumination, pumped water, communication, and mechanical power. Every stage of the energy supply chain—including the generation, distribution, and consumption of energy—has multiple impacts on the economic, social, and often environmental aspects of the MDG agenda. This is as true for the girls who do not attend school because they collect fuelwood to meet family subsistence needs as for the underemployed men and women who cannot find productive jobs or access health services due to lack of electricity in urban slums. From the point of view of individual people, the focus needs to be on access to the afford-able, reliable, and safe energy services that are essential to their daily well being, rather than solely on the source of the energy itself. Unfortunately, ministries of electricity or energy have often been isolated from development planning and investment discussions within other sectors in developing countries, working diligently to increase access to electricity while many other energy needs in the society at large are left unattended.
Whether energy is needed for jobs, water pumping, health services, cook-ing, illumination, or food processing, multiple sources of energy and diverse technologies can provide the energy services required. Grid-connected electric-ity or a stand-alone diesel generator can provide mechanical power to process agricultural products in rural areas. A kerosene lamp or a PV panel can provide home lighting. An MDG-based approach to development planning asks, what is the most cost-effective way to deliver this service to the rural areas and urban
CHAPTER 6: Conclusion

74 Energy Services for the Millennium Development Goals
poor? The response is that multiple technologies are required, depending on the resource availability and cost effectiveness of the delivery systems available.
This report has argued that three energy objectives are particularly impor-tant to support the MDG agenda because they have direct impact on multiple MDG targets. These three objectives are: increasing access to modern fuels and cleaner biomass systems for cooking and heating; ensuring access to electricity in all urban and peri-urban areas; and providing access to mechanical power and electricity at centralized points in rural areas. The explicit costing of interven-tions to reach these three objectives should form part of national MDG-based planning and budgeting exercises. Appendix II provides a detailed example of one approach to calculating the cost of meeting energy goals. Using Kenya as an example, the computation illustrates that both grid and off-grid electricity options are required and that a diversity of energy technology options needs to be employed; throughout the analysis, the differing impact of energy services on men and women and the relationship of energy to various MDGs are high-lighted.
Delivery of the energy services needed to meet the MDGs requires consulta-tion across multiple ministries, as well as engagement with business investors, community groups, and NGOs. Supportive policy and pricing frameworks are required not just in the energy sector but throughout each country’s national development framework. The use of public funds to support priority energy interventions with a high social return is advocated, while subsidies for recurring energy costs at large are cautioned against due to the long-term economic cost. In the short term, the emphasis should be on increasing access to energy services through a variety of measures, including subsidizing household electricity con-nection fees, lowering the costs of stoves or LPG canisters for cooking, and pro-viding community-based mechanical power through government investment.
These efforts will require institutional support and capacity building domes-tically and from the international community to ensure that policymakers, regulators, local business entrepreneurs, and technical personnel have the skills needed to support an energy system that delivers centralized and decentralized energy services depending on the national conditions.
Unfortunately, this report points to another stark conclusion: failure to include energy considerations in national development strategies and develop-ment frameworks will undermine the ability to reach all the MDGs. This does not need to happen. Successful examples of expanding access to modern fuels, electricity, and mechanical power exist and are featured here. These success sto-ries show that Goal-oriented strategies for scaling up access to energy services are not only possible but also necessary to achieve the MDGs. They therefore must be an essential component of any national strategy to achieve the MDGs.
No new MDG is needed on energy. What is needed is to address energy needs within the entire MDG framework as a means to reduce poverty and improve human development in line with the Millennium Declaration.

Appendix I: MDG and Energy Workshop (1 October 2004) Participants
Kathleen Abdallah United Nations Department for Economic and Social Affairs (UNDESA)
Edwin Adkins Columbia University, USA Moncef Aissa Tunisia Electricity and Gas Company (STEG) Harriette Amissah-Arthur Kumasi Institute of Technology and
Environment (KITE), GhanaFatih Birol International Energy Agency (IEA)/Organisation
for Economic Co-operation and Development (OECD)
Laurent Coche United Nations Development Programme (UNDP)
Amadou Diallo Yéelen Kura, MaliYassine Fall United Nations Development Fund for Women
(UNIFEM)/ United Nations Millennium ProjectCahit Gurkok United Nations Industrial Development
Organization (UNIDO)Gilberto Jannuzzi Universidade Estadual de Campinas, BrazilStephen Karekezi African Energy Policy Research Network
(AFREPREN), KenyaDominique Lallement World BankSusan McDade United Nations Development Programme
(UNDP)Vijay Modi Columbia University, USA
Appendices

76 Energy Services for the Millennium Development Goals
Jem Porcaro United Nations Development Programme (UNDP)
Jeffrey Sachs United Nations Millennium Project/Columbia University, USA
Jamal Saghir World BankGuido Schmidt-Traub United Nations Millennium ProjectMelessaw Shanko Megan Power Limited (MGP), EthiopiaMinoru Takada United Nations Development Programme
(UNDP)Griffin Thomson United States Department of StateRobert Watson World Bank

77Appendices
Appendix II: Computation of Annual Per Capita Costs of Meeting Energy Goals: The Example of Kenya For the purpose of illustration, costing estimates to meet the three proposed energy targets are described here in greater detail. We wish to emphasize here that country priorities may vary and in many cases countries may adopt more aggressive timeframes to achieve targets. This costing is carried out for one country, Kenya, for illustrative purposes. What follows are estimates that are perhaps best seen as providing a framework for computing costs; the frame-work illustrates the scale of the costs to meet the targets in a country with low existing coverage in each of the targets.
The costing approach taken here follows the MDG needs assessment approach pioneered by the UN Millennium Project. The costing method requires some preparatory explanation. The energy targets are for the percent-age of populations to be covered within 10 years. The difference between this target coverage and the current coverage represents a gap in coverage. This gap would be closed over a number of years using a strategy that presumably adds some planned amount of coverage each year. So additional annual cover-age needed would depend upon existing coverage, the target, the change in population and the how the gap in coverage is distributed over the next 10 years. For simplicity, we have not taken population changes into account and the coverage gap is simply divided equally over 10 years in this costing, imply-ing 10 percent new coverage each year. So for example if 70 percent of the country population is rural, and 95 percent of that rural population currently lacks access, and the target is to reach all rural population in 10 years, then the annual gap to be covered would be (0.70)(0.95)(0.1)*100 percent of the total population.
For Kenya, for example, the annual cost of extending grid electricity (or cost-effective, off-grid approaches) to institutions such as schools, clinics, and community centers (e.g., small business clusters, community water supply sys-tems) for a rural population are estimated to be US$67 million. A detailed explanation of how this estimate is arrived at is described below. Annual national costs for each of the three targets are then summarized in Table II.1. This cost does not include the cost of household electrification in rural areas (as that is not a target as such).4
For macroeconomic comparisons across different interventions and across countries with different populations, it is useful to compute a per capita cost of this particular intervention. This annual per capita estimate is computed simply by dividing the annual national cost by the national population. So the
4 If this is indeed deemed to be a national priority then additional costs would need to be included. Note, however, that where grid electricity is anticipated at community scale, it would reduce the cost of household electrification.

78 Energy Services for the Millennium Development Goals
Table II.1 Estimated annual
national and per capita costs of energy
interventions in Kenya
Source: authors’ calculations
Cost for national
interventions(US$ millions)
Per capita cost (US$)
Improved cooking fuels (50% LPG stoves and fuel, 50% sustainable forestry)
323 9.2
LPG stoves and canisters 16 0.5
LPG fuel 260 7.4
Sustainable biomass forestry 12 0.3
Improved biomass cookstoves 35 1.0
Grid extension to urban and peri-urban households
53 1.5
Electricity for rural schools, clinics, community centers
67 1.9
Capital expenditures 35 1.0
Recurring supply costs 32 0.9
Total costs, all interventions 443 12.7
annual per capita cost of this intervention (extending electricity to rural insti-tutions) would be computed as US$67 million divided by the Kenyan popula-tion of 35 million, thus obtaining a figure of US$1.91 per capita. Such annual per capita costs for Kenya for all three targets are then summarized in the final column of Table II.1. Table II.2 provides the demographic, geographic, engi-neering, and cost assumptions that underly the cost computation for national level interventions.
Costs of Energy Target 1: Improved cooking fuelsThe first intervention, focused on improvement of cooking fuels used by the poor, involves two components. One component focuses on expanding access to modern cooking fuels (assumed to be specifically LPG appliances and fuel); the second component addresses increased biomass availability and cleaner use of biomass. We have assumed here a goal to reach 50 percent of the country’s population for each component within the next 10 years by 2015. Costs for both the LPG and biomass components are detailed below.

79
Table
II.
2D
ata
an
d ass
um
pti
ons
sup
po
rtin
g in
terv
enti
on
cost
est
imate
s in
Ke
nya
Data
an
d a
ssu
mpti
ons
No
tes
Basi
c ge
og
rap
hic
an
d so
cio
eco
no
mic
data
Popu
lation
of K
enya
: 3
5 m
illio
nAr
ea o
f K
enya
: ~
60
0,0
00 s
q km
Av
erag
e na
tion
al h
ouse
hold
siz
e: 5
Pe
r ce
nt o
f po
pula
tion
res
idin
g in
rur
al a
reas
: 70
%
Popu
lation
, on
ave
rage
, of
eac
h ru
ral c
omm
unit
y: 2
,00
0
Geo
spat
ial a
ggre
gation
fac
tor
(rur
al in
stitut
iona
l): 0
.30*
*An
assu
med
/est
imat
ed v
alue
, ba
sed
on
obse
rvat
ion
and
geos
patial
(G
IS a
nd r
emot
e se
nsin
g) in
puts
. (S
ee ‘d
isag
greg
atio
n fa
ctor
’ di
scus
sion
in B
ox II
.1)
Mo
de
rn c
oo
kin
g fu
els
an
dIm
pro
ved
bio
mass
co
okin
g
Nat
iona
l nee
d fo
r LP
G
Cur
rent
nat
iona
l LPG
pen
etra
tion
rat
e: 5
%LP
G a
pplia
nce
and
fuel
cos
ts
Cos
t of
LPG
coo
ksto
ve a
nd c
anis
ter:
US
$5
0
Cos
t of
LPG
fue
l: U
S$7
50 p
er t
onne
Impr
oved
bio
mas
s co
okin
g
Cos
t of
initia
ting
sus
tain
able
bio
mas
s pr
oduc
tion
: U
S$
35 p
erho
useh
old
C
ost
of im
prov
ed c
ooks
tove
with
chim
ney
per
hous
ehol
d: U
S$
10
0
Thes
e es
tim
ates
ass
ume
that
50
% o
f th
e ne
ed f
or im
prov
ed f
uels
will
be
met
by
m
oder
n co
okin
g fu
el s
uch
as L
PG.
The
othe
r 5
0%
will
be
met
by
expa
ndin
g bi
omas
s
supp
ly a
nd c
lean
er u
se o
f bi
omas
s
Ele
ctri
fica
tio
n o
f u
rba
n a
nd
pe
ri-u
rba
n ho
use
ho
lds
Inpu
ts f
or e
stim
ate
of s
yste
m s
ize
%
of to
tal p
opul
atio
n re
sidi
ng in
urb
an a
reas
: 3
0%
Pe
netr
atio
n of
grid
elec
tric
ity
in u
rban
are
as: 1
5%
(8
5%
no
acce
ss)
Inpu
ts f
or e
stim
ate
of s
yste
m c
ost
C
ost
per
urba
n/pe
ri-u
rban
con
nect
ion:
US
$5
00
•
Thes
e pr
ojec
tion
s do
not
incl
ude
any
infr
astr
uctu
re o
r po
wer
nee
ds f
or t
he
indu
strial
sec
tor
•
Bot
h pr
ogra
ms
wou
ld a
ddre
ss 1
0%
of
the
uns
erve
d po
pula
tion
eac
h ye
ar
Acc
ess
to
mo
de
rn
ene
rgy
(ele
ctri
city
an
d m
ech
an
ica
l p
ow
er)
fo
r
all
ru
ral
com
mu
nit
y
cente
rs
Inpu
ts f
or e
stim
ate
of s
yste
m s
ize
R
ural
com
mun
ity
cent
ers
witho
ut e
lect
rici
ty: 9
5%
Ann
ual p
ower
con
sum
ptio
n pe
r el
ectr
ifie
d ce
nter
: 5,0
00 k
Wh
Inpu
ts f
or e
stim
ate
of s
yste
m c
ost
R
ecur
ring
cos
t of
ele
ctrici
ty g
ener
atio
n: U
S$
0.1
0 p
erkW
h
Line
cos
ts, m
ediu
m v
olta
ge: U
S$
15 p
er m
C
ost
mul
tiplie
r fo
r tr
ansf
orm
ers:
1.2
0 (
or +
20
%)
Inpu
ts f
or o
ff-g
rid
appr
oach
es
Cos
t of
mec
hani
cal p
ower
, pe
r vi
llage
of 2,0
00
: U
S$
15,0
00

80 Energy Services for the Millennium Development Goals
Modern cooking fuel A switch to a modern cooking fuel such as LPG requires a capital expenditure for the hardware, (i.e., cookstoves and canisters) and recurring costs for fuel. The capital expenditure for the hardware for each household is assumed to be US$50. If the number of households that already use modern cooking fuels is 5 percent of the total population, one would need to reach 45 percent of the population in the next 10 years to reach the 50 percent coverage target. This corresponds to 45 percent of the 7 million Kenyan households, or 3.15 million households). So the total cost for canisters and cookstoves over a 10-year period would be the prod-uct of 3.15 million households and US$50/household, for a total of US$157.5 million. If 10 percent coverage is achieved each year, the annual cost would be US$16 million.
The fuel component of the cost per household per year is computed assum-ing that each household would consume 200 kg of LPG per year if LPG were the only source of fuel. At an LPG cost of US$750 per tonne, this would work out to US$150 per household per year. If 10 percent of the 3.15 million households esti-mated in the prior paragraph are considered to be new consumers each year, we can compute the annual fuel cost for the first year to be the product of the annual cost of US$150 per household and 315,000 (the number of additional house-holds using LPG), resulting in US$47 million. When the entire 10 year span is considered, then this calculation must include both the costs for new customers added with LPG expansion each year as well as the need to serve customers from previous years’ expansion. This is done by summing the entire consumption as it grows throughout the 10-year period, then dividing by the 10-year duration of the project. So, for example, in the second year, the cost of serving the original 315,000 households would continue, and another set of households would be added, doubling the second-year cost to US$94 million. In the third year, the cost would be triple that of the first year, and so on. As this pattern continues, this creates a factor of (1 +2 + 3 + …. + 10 = 55) to characterize the total costs for 10 years. Finally, for simplicity, this total is divided by 10 to give the per year cost for the 10-year span. The result is that a factor of 55/10= 5.5 will accompany the LPG fuel cost calculation for the first year, giving a final annual cost of US$260 million for LPG fuel expenditures (see Table II.1).
Note that given specific country priorities some portion of the cost of mod-ern cooking fuels would be borne by the consumer.
Improved biomass cookingThe cost associated with initiating sustainable biomass production through agro-forestry, woodlots, farm trees, or community forests is assumed to be US$35 per household. This figure was arrived at assuming annual fuelwood consumption per family of 3.5 tonnes and a US$10 per tonne cost of initiating sustainable means of producing the biomass. Assuming that 3.5 million households (i.e., half of the 7 million Kenyan households) are targeted over a 10-year period, we

81Appendices
estimate a total 10-year cost to be US122.5 million. Assuming 10 percent cover-age is added each year, the annual cost would be US$12 million.
One way to switch to cleaner biomass use may be the use of biomass cook stoves with means to reduce exposure to smoke, for example through the use of chimneys. This approach is used for costing here, while recognizing that there may be other technologies and practices that may be more suitable depending upon the local cooking practice and the local source of biomass. We assume the cost per household of such an intervention is US$100. So the total 10-year cost of targeting the 3.5 million households is US$350 million. Assuming 10 percent coverage is added each year, the annual cost would be US$35 million (see Table II.1).
Costs of Energy Target 2: Electricity in urban and peri-urban areasThe second intervention requires an estimate of the cost of providing electric-ity connections to 100 percent of the urban and peri-urban poor. Due to the high population density, degree of aggregation, and proximity to pre-existing electrical grids of the urban population, this calculation is not carried out based on transmission line length (as is the case for rural areas, described in the next section) but instead assumes a flat capital expense for each additional grid con-nection. We begin with capital expenditures for urban grid electrification first, and follow with recurring costs for power generation.
The first question is determining the number of households that would need to be connected each year. If one takes the current urban electricity penetration rate to be 15 percent, one would need to reach the remaining 85 percent of the urban households over the next 10 years. The number of urban households in Kenya is estimated to be, 2.1 million (obtained as a ratio of the urban population in Kenya, which is about 30 percent of the national population, or about 10.5 mil-lion, and average household size which is taken to be 5). So the number of urban households that need to be connected in the next 10 years is 85 percent of 2.1 mil-lion, which works out to be 1.8 million households. If each of these connections cost, on average, US$300, the total capital cost is US$534 million. Following the earlier approach of ensuring a 10 percent coverage each year for 10 years, the annual cost would US$53 million. If represented as a per capita cost this target would represent a cost of US$1.53. Note that here the population base that is used to compute the per capita cost is the national population of 35 million.
Costs of Energy Target 3: Modern energy services (mechanical power and electricity) at the community level for all rural communities. The third target addresses the need for electricity access (through grid extension or through off-grid approaches) to institutions such as schools, clinics and com-munity centers for rural communities. The size of such rural communities is assumed to be, on average, 2,000 people, and the community center is assumed to be a centrally located institution, such as a school, clinic or hospital. Note that both these assumptions would strongly vary across different agroecologies

82 Energy Services for the Millennium Development Goals
in a country and also would vary from country to country. The target is to reach 100 percent of the rural population nationally by 2015. The electricity connection could serve any or all of several needs including lighting for a village school; refrigeration of vaccines and other crucial energy needs of a clinic or hos-pital; power for a central charging point for various small appliances distributed throughout the village; a node of high-wattage power for mechanical or light-manufacturing work; and a telecommunications hub, among others.
Initially, the cost estimate is based on grid extension. In remote and sparsely populated areas, off-grid approaches are likely to be more cost-effective, nevertheless the grid-based costs provide a bound of sorts for such estimates. The cost estimate is obtained as follows.
Unlike urban areas, where a cost estimate for each additional grid connec-tion can be adequately estimated by a single flat fee, in less-dense, rural areas, the costs of wire, transformers, and other features of the electrical grid itself are the dominant cost. Hence, one must estimate the distances between each com-munity center. A computation that assumes a perfectly uniform distribution of all rural community centers in Kenya would simply divide the total area of the nation (600,000 square kilometers) by the total number of all rural community centers in the country (estimated to be 12,250) and then taking the square root of the result (see Box II.1), giving nearly 7 kilometers. Note that the number of rural community centers was arrived at by dividing the rural population (70 per-cent of Kenya’s total population of 35 million, or 21.4 million people) by 2,000 (the estimated size of a rural community).
This distance of 7 kilometers between community centers, however, does not account for the tendency of settlement patterns to avoid some terrains (des-erts, especially) and concentrate people in clusters. To resolve this issue, a key assumption for this calculation is made, specifying the institutional ‘disaggrega-tion factor’ (also described in Box II.1). This factor for Kenya is taken to be 0.30; when multiplied by 7 (the assumed distance between rural community centers) results in a more realistic 2.1 kilometers between each rural community. Next, the number of rural institutions requiring grid electrification is estimated by multiplying the number of rural community centers computed above, 12,250, by the percentage lacking access to electrification (95 percent). This gives 11,600 rural community centers requiring electricity.
These results—11,600 rural electrification points that are, on average, 2.1 km apart—becomes the basis for computation of capital expenditure related to transmission and distribution—the largest single fraction of the total costs. Mul-tiplied together, they give the total length of medium voltage (MV) line required for transmission, or 24,400 km. At US$10,000 per km of MV line, this cost is US$244 million. Transformer costs are computed by simply using a multiplier cost of 20 percent raising this total network cost to US$293 million. Also, there is a cost of roughly US$5,000 per community center connection, multiplied by the number of connections (11,600) giving a connection cost of US$58 million.

83Appendices
When these two costs—the total network cost and total connection cost—are summed, the result is the total capital expenditure for grid expansion for Kenya amounts to approximately US$350 million. With an assumed 10 percent cov-erage per year, the annual cost would be US$35 million (see Table II.1), or US$30,000 per community center.
The main recurring cost is for purchasing power. Note that the framework for generation costs is that these costs would be paid to the electricity-generating entity in a transparent and explicit fashion. The investment cost of creating the generation capacity is included here as part of the per kWh cost of electricity. If each institution is assumed to consume about 5,000 kWh of electricity per year at a cost of US$0.10 per kWh, then a single institution’s consumption would cost US$500 for the first year. This figure would vary with the source of power among others. Where electricity is predominantly produced from liquid fuels the cost per kWh would be much higher. For all 11,600 institutions covered by the initial year of grid expansion, this amounts to US$5.8 million. As was the case with recurring costs for LPG fuel presented above, when the entire 10-year span is considered, the fuel generation cost must include both the costs for new customers added each year and the costs of serving customers from previous years’ expansion. This requires that the first-year power generation costs again include a factor of 5.5, giving a final value of US$32 million for power generation expenditures.
In the above analysis the cost of creating electricity access to each rural com-munity was estimated to be about US$30,000 (US$350 million divided by 11,600 rural communities). In remote and sparsely populated areas, it may be more cost-effective to provide off-grid access to community facilities such as clin-ics, schools and community centers. The actual technologies would depend upon available local resources (solar, wind, biomass, micro-hydro, diesel generators) and the anticipated demands and loads. For example, the need for mechanical power—for grinding, water pumping, and many other potential applications at the village level—could be estimated from the known costs for a multifunctional platform, US$15,000; this amount would provide, for example, a diesel engine with one or more related tools that would provide a range of services for a typical community of 2,000 persons. Appliances needed at clinics/schools may require additional costs. For estimating purposes, it is assumed that the total cost of off-grid electricity will be within or near about the US$30,000 per community figure for grid extension.
Summary of national and per capita costs for interventions All of the costs computed above are summarized in Table II.1. These are expressed first in terms of the entire costs for national interventions annu-ally and then in per capita annual terms. For macro-economic reasons and for cross-sectoral comparisons, the per capita values are computed simply by dividing the aggregate cost of the national interventions by the national pop-ulation of Kenya (35 million).
84 Energy Services for the Millennium Development Goals
An important component of these estimates is a geographic ‘disaggregation factor,’ which provides an estimate of the degree to which the rural population is spread sparsely over the landscape, or concentrated in town centers or other clusters. This factor is explained in more detail in Box II.1. This factor, between 0 and 1, indicates the degree to which the length of a network connecting features on the landscape—in this case community centers or houses —is smaller than the network length if all features were evenly spaced. A value of one indicates that all features are uniformly spaced and hence the network length is the maximum possible, while a value close to zero indicates that all features are clustered tightly together and hence the network length is small; both extremes are, obviously, not seen in real geographies. The network length scales with the mean distance between features.
A variety of cultural, geographic, biophysical, and economic reasons lead to variation in geographic disaggregation. In looking at rural community centers as the features of interest, as in Kenya, some important contributing factors are the large arid or semi-arid regions of the country, rivers, topography, concentration in urban centers, and other factors leading to aggregation, which contribute to a lower value. For the purposes of the cost estimates, this factor is used to compute inter-community distances in a part of Western Kenya near Lake Victoria. The disaggregation factors used for this estimate is 0.30, indicating that the inter-com-munity distance in rural Western Kenya tends to be approximately one third what one would predict by simply averaging their distribution evenly over the entire land area. This value is approximate, but has been ground-truthed and compared with distances typically found in satellite-sensed imagery and GIS data.

85Appendices
Box II.1 The geographic disaggregation
factor
∑dn
N = a
_
a_
a = f
√ = a AN
0 < f <_ 1;
If one has data describing the actual distance between reference points on a landscape
(people, buildings, town centers, etc.), then the average distance between each item, a_,
is simply the sum of each distance, d, divided by the total number of points, N:
If, however, one assumes that all reference points are spread evenly over the land-
scape, and the distance between them, a, is maximized, the formula becomes the square
root of the area of the country divided by the number of points:
The ratio of these two numbers—the actual average distance between points (a_)
divided by the maximum average distance between points (a)—expresses the degree to
which points are dispersed or aggregated across the landscape, which is referred to here
as the disaggregation factor, f, which will range between 0 and 1:
The factor is an expression of the ratio of the actual spacing of features versus their
maximum possible spacing. The closer this value is to 1, the more disaggregated are the
points over the landscape. An example of a relatively disaggregated landscape would be a
pattern of consistently sized farms with households placed more or less centrally on each
farm. Settlement patterns of roughly this type can be seen in geographies as diverse as
the American Midwest (which is sparsely settled, on average) to Western Kenya (which
is relatively densely settled). The opposite situation, where f is close to zero, refers to
a highly aggregated landscape. The settlement patterns of a country such as Australia,
with its population highly concentrated in coastal areas, is one example. Mountainous
island nations or communities, which have populations clustered in coastal lowlands, are
another example of a highly aggregated landscape. Again, the value of f has no necessary
relationship to average population density. A landscape can be very sparsely settled, on
average, and still have a high degree of aggregation if settlements, buildings, and people
are concentrated. On the other hand, a landscape can be very densely settled, on aver-
age, but still have a high disaggregation factor, close to 1, if the features are uniformly
spread over the landscape.

86 Energy Services for the Millennium Development Goals
Appendix III : Providing Energy Services for the MDGs: Assessing Needs and Planning for Scaling UpThe core recommendation of the UN Millennium Project is to put the MDGs at the center of national and international national development strategies through a series of specific and practical efforts by developing countries them-selves and their development partners. The Project’s recommended strategy begins at the country level. Every country that suffers from extreme poverty—including middle-income countries with pockets of extreme poverty—should be encouraged and supported to adopt an MDG-based national development strategy, building on existing strategies. The MDG-based national develop-ment strategy should set a serious 10-year timetable to 2015, with policies, governance strategies, and public investment plans. In order to achieve the MDGs, countries need to take the 2015 targets and time horizon seriously. This implies a major a shift in thinking and language: from planning around a marginal expansion of social services and infrastructure to planning around a long-term investment strategy to achieve the MDGs. The world thus needs to change its discussions from a focus on ‘accelerating progress towards the Goals’ to ‘achieving the Goals.’
As a first step toward developing MDG-based national development strate-gies, countries will need to work backwards from the MDG outcome targets to concretize the operational set and scale of public interventions—including human resources, infrastructure, and financial resources—needed as inputs in order to achieve the Goals by 2015. We call this quantification of required investments the ‘MDG needs assessment.’
Needs assessments quantify the human resources, infrastructure, and finan-cial resources required to meet the MDGs between now and 2015. These inter-ventions will need to be accompanied by policies that enable rapid and equitable scaling up of services and infrastructure needed to reach the MDGs. Reaching the MDGs requires a broad set of interrelated actions that can be divided into nine areas of activity—termed ‘investment clusters’:
1. Rural development—increasing food output and rural incomes2. Urban development—promoting jobs, upgrading slums, and developing
alternatives to new slum formation3. Health systems—ensuring universal access to essential health services4. Education—ensuring universal primary education and expanded post-
primary and higher education,5. Gender equality—investing to overcome pervasive gender bias6. Environment—investing in improved resource management7. Science, technology and innovation—building national capacities8. Cross-national infrastructure—trade integration and government co-
operation 9. Public sector management.

87Appendices
Investments in improved energy services are critical for supporting each of the clusters identified above. The UN Millennium Project is therefore recommend-ing to explicitly include investments in energy services. Energy services can be thought of as forming an integral part of rural and urban development strategies. Alternately, a needs assessment could treat energy as a separate investment cluster in itself.
The UN Millennium Project has divided the needs assessment into four analytical steps to answer the question “What investments are needed to achieve the MDGs?”
1. Identity interventions
2. Set targets for each set of interventions
4. Check results
3. Estimate resource needs
Presented below are some suggested interventions, targets, calculations, and sample results that may be useful for countries as they conduct a national energy needs assessment.
Step 1: Develop list of interventionsRural energy interventions may include:
• interventions to support the use of modern cooking fuels (such as LPG and kerosene) and modern cooking devices (such as stoves and canisters);
• interventions to reduce the adverse health impacts from cooking with biomass (improved ventilation, chimneys, smoke hoods, and behavioral change interventions);
• interventions to increase sustainable biomass production (agroforestry, woodlots or community forestry, area closures, etc.);
• interventions to increase the access of rural communities to reliable elec-tricity and mechanical power, including: electrification for rural social services such as schools, hospitals, and clinics (through grid extension, diesel generators, mini-grids, etc.);
• interventions to facilitate community-level access to electricity and mechanical power—for cooperatives, small businesses, and commu-nity centers—through support for electrification, fuel, and mechanical devices; and

88 Energy Services for the Millennium Development Goals
• interventions to facilitate the use of electricity in rural communities that are not connected to the grid, through low-cost technologies such as bat-teries.
Urban energy interventions may include:• interventions to support the use of modern cooking fuels (such as LPG
and kerosene) and modern cooking devices (such as stoves and canisters);• interventions to reduce the adverse health impacts from cooking with
biomass (improved ventilation, chimneys, smoke hoods, and behavioral change interventions);
• interventions to ensure access to reliable electricity and mechanical power for urban areas (through grid extension, lifeline rates, etc.);
• financing mechanisms to spread out first costs of electricity connection, fuel supply and devices, etc.; and
• bill collection and monitoring interventions (such as smart cards and per-sonnel).
Step 2: Specify targets for each set of interventions Each country needs to identify its output targets for energy services that link to the broader objective of meeting the MDGs. The UN Millennium Project proposes the following output targets that countries can adapt and expand to suit their own needs:
Suggested targets for rural areas:• enable the use of modern fuels and devices for 50 percent of those who
at present use traditional biomass for cooking, • reach other users of traditional biomass with efforts to develop and
adopt the use of improved cookstoves, measures to reduce the adverse health impacts from cooking with biomass, and measures to increase sustainable biomass production, and
• provide access to modern energy services at the community level for all rural communities (in the form of electricity and mechanical power). This entails (1) reaching 100 percent access to electricity for all schools, clinics, hospitals, and community health centers, (2) reaching rural coop-eratives, small businesses, and other community centers with adequate sources of electricity and mechanical power, and (3) the ability to meet basic household level electricity needs through community-level battery charging stations
Suggested targets for urban areas:• ensure reliable access to modern energy services (including electricity
services and improved fuels and devices) in the urban and peri-urban areas, including access for all households and schools, hospitals, clinics, and community health centers.
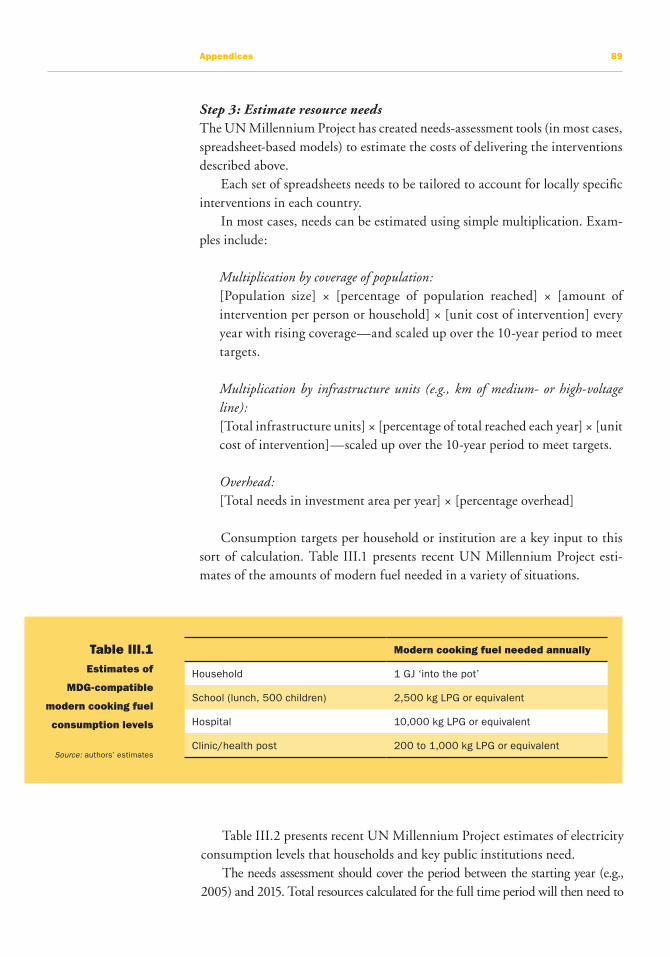
89Appendices
Step 3: Estimate resource needsThe UN Millennium Project has created needs-assessment tools (in most cases, spreadsheet-based models) to estimate the costs of delivering the interventions described above.
Each set of spreadsheets needs to be tailored to account for locally specific interventions in each country.
In most cases, needs can be estimated using simple multiplication. Exam-ples include:
Multiplication by coverage of population:[Population size] × [percentage of population reached] × [amount of intervention per person or household] × [unit cost of intervention] every year with rising coverage—and scaled up over the 10-year period to meet targets.
Multiplication by infrastructure units (e.g., km of medium- or high-voltage line):[Total infrastructure units] × [percentage of total reached each year] × [unit cost of intervention]—scaled up over the 10-year period to meet targets.
Overhead:[Total needs in investment area per year] × [percentage overhead]
Consumption targets per household or institution are a key input to this sort of calculation. Table III.1 presents recent UN Millennium Project esti-mates of the amounts of modern fuel needed in a variety of situations.
Table III.1 Estimates of
MDG-compatible
modern cooking fuel
consumption levels
Source: authors’ estimates
Modern cooking fuel needed annually
Household 1 GJ ‘into the pot’
School (lunch, 500 children) 2,500 kg LPG or equivalent
Hospital 10,000 kg LPG or equivalent
Clinic/health post 200 to 1,000 kg LPG or equivalent
Table III.2 presents recent UN Millennium Project estimates of electricity consumption levels that households and key public institutions need.
The needs assessment should cover the period between the starting year (e.g., 2005) and 2015. Total resources calculated for the full time period will then need to

90 Energy Services for the Millennium Development Goals
Table III.2 Estimates of MDG-
compatible electricity consumption levels
Source: authors’ estimates
Lighting/electrification
Households 75 kWh / 15 kWha
School 2,000 kWh
Hospital 50,000 kWh
Clinic/health post 2,000 to 8,000 kWh
a 75 kWh is sufficient to provide reading light in one room for 4 hours each day. House-holds that receive electricity through batteries charged at local schools will only be able to access enough electricity to cover minimal household lighting needs (15 kWh).
be divided into annual increments, depending on the scale up path of the invest-ments. This path will be determined by national priorities as well as by immediate capacity constraints. It will also be important to reassess and update unit costs as the interventions are implemented, as they may go up or down with increasing coverage.
The energy needs assessment tool, for example, calculates resource needs for energy interventions that reach rural and urban households as well as institutions that provide essential social services.
The needs assessment tool requires the following inputs:• current and target coverage for MDG-compatible cooking, space heating,
and mechanical power, • minimum cooking fuel and electricity consumption requirements to meet
the MDGs,• complementary infrastructure and services necessary for delivering inter-
ventions (such as grid extension, fuel delivery, and cookstoves), and• unit costs for each intervention.
Using these inputs, the spreadsheets allow the user to calculate:• number of households and social service institutions with access to MDG-
compatible energy services,• physical infrastructure and fuel inputs needed to achieve the targets,• resources needed for upgrading and maintenance, and • per capita and total costs of providing interventions.
Step 4: Check resultsWith any needs assessment, the results should be carefully reviewed to make sure that they are accurate and adequate to reach the MDGs. This report attempts rough estimates of the costs of meeting a set of energy-related MDG-based targets in East Africa, with Kenya as an example. This is with the view to understanding both the absolute cost of the entire set of goals, as well as the relative cost of each.

AFREPREN (African Energy Policy Research Network). 2004. African Energy Data and Terminology Handbook Year 2003 – 2004. Occasional Paper 23. Available at http://www.afrepren.org/datahandbook2/databk.htm.
Ahiataku-Togobo, Wisdom. 2002. Household Energy for Cooking in Ghana. Ministry of Energy: Accra, Ghana.
Anderson, Bridget, Silvia Fracchia, Remi Lang and Jem Porcaro. 2004. Mali Country Case Study. In: Achieving the Millennium Development Goals: The Role of Energy Services—Case Studies from Brazil, Mali, and the Phil-ippines.United Nations Development Programme: New York, USA. pp. 31–55. Available at http://www.ptfm.net/columbia%20english.pdf.
Ausubel, J.H. and R. Herman (eds). 1988. Cities and Their Vital Systems: Infra-structure, Past, Present, and Future. National Academy: Washington DC, USA. Available at http://phe.rockefeller.edu/cities/cities.pdf.
Barany, M., A.L. Hammett, A. Sene and B. Amichev. 2001. Nontimber forest benefits and HIV/AIDS in sub-Saharan Africa. Journal of Forestry 99 (12): 36-41.
Bruce, Nigel, Rogelio Perez-Padilla and Rachel Albalak. 2000. The Health Effects of Indoor Air Pollution Exposure in Developing Countries. World Health Organization: Geneva Available at http://www.who.int/ indoorair/publications/bulletin/en.
Brunetti, Aymo, Gregory Kisunko and Beatrice Weder. 1997. Institutional Obsta-cles to Doing Business: Region-by-Region Results from a Worldwide Survey of the Private Sector. Policy Research Working Paper 1759. World Bank: Washington, DC, USA. Available at http://www.worldbank.org/html/dec/Publications/Workpapers/WPS1700series/wps1759/wps1759.pdf.
Cecelski, Elizabeth. 1987. Energy and rural women’s work: Crisis, response, and policy alternatives. International Labour Review 126: 41–64.
References

92 Energy Services for the Millennium Development Goals
Cecelski, Elizabeth, Ahmed Ounalli, Moncef Aissa and Joy Dunkerley, 2004. Low Cost Electricity and Multisector Development in Rural Tunisia. World Bank Energy Lecture Series (11 February 2004). World Bank: Washington DC, USA.
CIESIN (Center for International Earth Science Information Net-work). 1999. Gridded Population of the World. Available at http://sedac.ciesin.columbia.edu/plue/gpw/index.html?main.html&2.
Claeson, M, E. Bos and I. Padmanathan. 1999. Reducing Child Mortality in India: Keeping the Pace. Health, Nutrition and Population Technical Paper, World Bank: Washington DC, USA.
Clarke, George R.G. and Scott J. Wallston. 2002. Universal(ly Bad) Service Pro-viding Infrastructure Services to Rural and Poor Urban Consumers. Research Policy Working Paper 2868. World Bank: Washington, DC, USA.
DFID (Department for International Development, UK). 2002. Energy for the Poor: Underpinning the Millennium Development Goals. August. Available at http://www.dfid-kar-energy.org.uk/assets/Energy_for_the_Poor.pdf.
Engh, Ida-Eline, Libor Stloukal and Jacques du Guerny. 2000. HIV/AIDS in Namibia: The Impact on the Livestock Sector. Sustainable Development Department, Food and Agriculture Organization of the United Nations (FAO): Rome, Italy Available at http://www.fao.org/sd/wpdirect/WPan0046.htm.
ESMAP (UNDP/World Bank Energy Sector Management Assistance Pro-gramme). 2005a. Advancing Bioenergy for Sustainable Development: Guideline for Policymakers and Investors. Report 300/05. World Bank: Washington, DC, USA.
ESMAP (UNDP/World Bank Energy Sector Management Assistance Pro-gramme). 2005b. The Impact of Higher Oil Prices on Low Income Countries and on the Poor. World Bank: Washington, DC, USA.
ESMAP (UNDP/World Bank Energy Sector Management Assistance Pro-gramme). 2005c. Nile Basin Initiative Shared Vision Program, Regional Power Trade Project, Part II: Minutes of the First Meeting of the Nile Basin Ministers Responsible for Electricity. Available at: http://wbln0018.world-bank.org/esmap/site.nsf/files/Part+II+_Final_+Record+of+First+Meeting+of+Nile+Basin+Mini%E2%80%A6.pdf/$FILE/Part+II+_Final_+Record+of+First+Meeting+of+Nile+Basin+Mini%E2%80%A6.pdf.
ESMAP (UNDP/World Bank Energy Sector Management Assistance Pro-gramme). 2005d. The Urban Challenge: The Energy Transition World Bank: Washington, DC, USA.
ESMAP (UNDP/World Bank Energy Sector Management Assistance Pro-gramme). 2004a. The Impact of Energy on Women’s Lives in Rural India. World Bank: Washington, DC, USA. Available at http://wbln0018.worldbank.org/esmap/site.nsf/files/Final_Indiafor_Web.pdf/$FILE/Final_Indiafor_Web.pdf.

93References
ESMAP (UNDP/World Bank Energy Sector Management Assistance Pro-gramme). 2004b. Indoor Air Pollution Associated with Household Fuel Use in India: An Exposure Assessment and Modeling Exercise in Rural Districts of Andhra Pradesh, India. World Bank: Washington, DC, USA.
ESMAP (UNDP/World Bank Energy Sector Management Assistance Pro-gramme). 2003. India: Access of the Poor to Clean Household Fuels. World Bank: Washington, DC, USA.
ESMAP (UNDP/World Bank Energy Sector Management Assistance Pro-gramme). 2002a. ESMAP Business Plan, 2002-2004. World Bank: Washington, DC, USA. Available at http://wbln0018.worldbank.org/esmap/site.nsf/files/2002-2004+Business+Plan.pdf/$FILE/2002-2004+Business+Plan.pdf.
ESMAP (UNDP/World Bank Energy Sector Management Assistance Pro-gramme). 2002b. Energy Strategies for Rural India: Evidence from Six States. World Bank: Washington, DC, USA. Available at http://www.worldbank.org/html/fpd/esmap/pdfs/258-02_intro.pdf.
ESMAP (UNDP/World Bank Energy Sector Management Assistance Pro-gramme). 2002c. Household Energy, Indoor Air Pollution, and Health. World Bank: Washington, DC, USA.
ESMAP (UNDP/World Bank Energy Sector Management Assistance Pro-gram). 2002d. Rural Electrification and Development in the Philippines: Measuring the Social and Economic Benefits. Report 255/02. World Bank: Washington, DC, USA.
ESMAP (UNDP/World Bank Energy Sector Management Assistance Pro-gramme). 2001a. Development of a Regional Power Market in the Greater Mekong Sub-Region (GMS). World Bank: Washington, DC, USA.
ESMAP (UNDP/World Bank Energy Sector Management Assistance Pro-gramme). 2001b. Peri-Urban Electricity Consumers: A Forgotten but Important Group—What Can We Do to Electrify Them? World Bank: Washington, DC, USA. Available at http://www.worldbank.org/html/fpd/esmap/pdfs/249-01.pdf.
ESMAP (UNDP/World Bank Energy Sector Management Assistance Pro-gramme). 2001c. Regional Electricity Markets Interconnections: Phase I—Identification of Issues for the Development of Regional Power Markets in South America. World Bank: Washington, DC, USA.
ESMAP (UNDP/World Bank Energy Sector Management Assistance Pro-gramme). 2000. Report 227/00. Reducing the Cost of Grid Extension for Rural Electrication. World Bank: Washington, DC, USA.
ESMAP (UNDP/World Bank Energy Sector Management Assistance Pro-gramme). 1989. Development Evaluation of L’Energie des Pays des Grands Lacs (EGL).World Bank: Washington, DC, USA.

94 Energy Services for the Millennium Development Goals
Ezzati, M. and D.M. Kammen. 2001. Indoor air pollution from biomass com-bustion as a risk factor for acute respiratory infections in Kenya: An expo-sure-response study. Lancet 358 (9282): 619–624 (erratum 358 (9287)).
FAO (Food and Agriculture Organization of the United Nations). 2001. AIDS: A Threat to Rural Africa. FAO: Rome, Italy.
Fitzgerald, K.B., D. Barnes and G. McGranahan. 1990. Interfuel Substitution and Changes in the Way Households Use Energy: The Case of Cooking and Lighting Behavior in Urban Java. Industry and Energy Department Working Paper 29. World Bank: Washington, DC, USA. Available at http://www-wds.worldbank.org/servlet/WDS_IBank_Servlet?pcont= details&eid=000009265_3960930104621.
Gangopadhyaya, Shubhashis, Bharat Ramaswamia and Wilima Wadhwaa. 2005. Reducing subsidies on household fuels in India: how will it affect the poor? Energy Policy 33 (18 )(December): 2326–2336.
Gaunt, C.T. 2005. Meeting electrification’s social objectives in South Africa, and implications for developing countries Energy Policy 33 (10): 1309–1317.
Geist, Helmut J. and Eric F. Lambin. 2002. Proximate causes and underlying driving forces of tropical deforestation. BioScience 52 (2): 143–150. Avail-able at http://www.bioone.org/pdfserv/i0006-3568-052-02-0143.pdf.
Glick, P. and D E. Sahn.1999. Schooling of girls and boys in a West African country: the effects of parental education, income, and household struc-ture. Economics of Education Review 19 (1).
GNESD (Global Network on Energy for Sustainable Development). 2004. Energy Access Theme Results Summary for Policymakers (SPM) ver. 21 (April). Available at http://www.gnesd.org/Downloadables/Energy_Access_I/SPM_ver_21_%20April_%202004.pdf.
Goldemberg, J., S.T. Coelho and O. Lucon. 2004. How adequate policies can push renewables. Energy Policy 32 (9): 1141–1146.
Gordon, Bruce, Richard Mackay and Eva Rehfuess. 2004. Inheriting the World: The Atlas of Children’s Health and the Environment. World Health Organ-ization: Geneva, Switerland.
Hammons, T.J., B.K. Blyden, A.C. Calitz, A.B. Gulstone, E. Isekemanga, R. Johnstone, K. Paluku, N.N. Simang and F. Taher. 2000. African electric-ity infrastructure interconnections and electricity exchanges. Institute of Electrical and Electronics Engineers (IEEE) Transactions on Energy Conver-sion 15 (4): 470–480.
Hughes, G. and M. Dunleavy. 2000. Why do babies and young children die in India? The Role of the Household Environment. South Asia Office, World Bank: Washington, DC, USA.
IBGE (Instituto Brasileiro de Geografia e Estatísticas). 2004. National House-hold Survey 2001. Available at www.ibge.gov.br.

95References
IEA (International Energy Agency). 2002a. Analysis of the Impact of High Oil Prices on the Global Economy. Organisation for Economic Co-operation and Development (OECD)/IEA: Paris, France.
IEA (International Energy Agency). 2002b. World Energy Outlook 2002. Chapter 10, Energy and Development. Organisation for Economic Co-operation and Development (OECD)/IEA: Paris, France.
Ilskog, Elizabeth, Björn Kjellström, Monica Gullberg, Maneno Katyega and William Chambala. 2005. Electrification co-operatives bring new light to rural Tanzania. Energy Policy 33 (10): 1299–1307.
Jannuzzi, G. and G. Sanga. 2004. LPG subsidies in Brazil: An estimate. Energy for Sustainable Development 8: 127–129 (September).
Johansson, Thomas B. and Jose Goldemberg (eds). 2002. Energy for Sustainable Development: A Policy Agenda. United Nations Development Programme: New York, USA.
King, E. M. and H. Alderman. 2001 Education. Brief No. 6 in Quisumb-ing, A. R., and R. S. Meinzen-Dick (eds). 2020 Focus 6: Empowering Women to Achieve Food Security. International Food Policy Research Institute (IFPRI): Washington, DC, USA. Available at http://www.ifpri.org/2020/focus/focus06.htm.
Layec, Michel. n.d. West Africal Power Pool (WAPP). PDF available for download at: http://wbln0018.worldbank.org/esmap/site.nsf/23e5e39594c064ee852 564ae004fa010/e42b2592c9c68cf085256e22005f39f3/$FILE/Michel_Layec_WestAfricaPool.pdf.
Leach, G. and R. Mearns. 1988. Beyond the Woodfuel Crises: People, Land, and Trees in Africa. Earthscan: London, UK.
Mahiri, I. and C. Howorth. 2001. Twenty years of resolving the irresolvable: Approaches to the fuelwood problem in Kenya. Land Degradation and Development 12 (3): 205–215 (May/June).
Marchetti, C. 1975. Transport and Storage of Energy: RR-75-038. International Institute for Applied Systems Analysis: Laxenburg, Austria Available at http://www.iiasa.ac.at/cgi-bin/pubsrch?RR75038.
Misana, S. and Karlsson, G. (eds). 2001. Generating Opportunties: Case Studies on Energy and Women. United Nations Development Programme, New York, USA.
Mishra, V., D. Retherford and R. Smith. 1997. Effects of Cooking Smoke on Preva-lence of Blindness in India, Working Paper Population Series # 91, 1997, East–West Center: Washington, DC, USA.
Mishra, Vinod K., Robert D. Retherford and Kirk R. Smith. 1999. Biomass cook-ing fuels and prevalence of blindness in India. Journal of Environmental Medicine 1: 189–199. Available at http://www3.interscience.wiley.com/ cgi-bin/abstract/77004264/ABSTRACT.
Morocco, Office National d’Electricité. http://www.one.org.ma/html/ m4_00.htm, site updated March 2005, accessed October 2005.

96 Energy Services for the Millennium Development Goals
Muchena, F. N., D. D. Onduru, G.N Gachini and A. de Jager. 2005. Turning the tides of soil degradation in Africa: Capturing the reality and exploring opportunities. Land Use Policy 22 (1): 23–32.
Oshikoya, W.T. and M. Nureldin Hussain. 2002. Infrastructure and Economic Development in Africa. In: Regional Integration in Africa. From the sec-ond meeting, March 2001, of the International Forum on African Per-spectives convened by the African Development Bank and the OECD Development Centre. Organisation for Economic Co-operation and Development (OECD): Paris, France.
Reddy, A.K.N. 1999. Goals, strategies, and policies for rural energy. Economic and Political Weekly 34 (49): 3435–45.
Rosen, S. and J. R. Vincent. 1999. Household Water Resources and Rural Pro-ductivity in sub-Saharan Africa: A Review of the Evidence. Harvard Insti-tute for International Development Paper DDP No. 673. Available at http://www.cid.harvard.edu/hiid.
Sarin, Mahdu. 1991. Improved stoves, women, and domestic energy. Environ-ment and Urbanization 3 (2): 51–56.
Sarfoh, J.A. 1993. Page 13, in: Réal Vavergne (ed). 1997. Regional Integration and Cooperation in West Africa. Africa World Press Inc.: Asmara, Eritrea.
Schultz, T. Paul. 1990. Returns to Women’s Education. Yale University Economic Growth Center Discussion Paper No. 603 (June). Yale University: Con-necticut, USA.
Smith, K. 2002. In praise of petroleum? Science 298 (5600): 1847. Available at http://www.sciencemag.org/cgi/reprint/298/5600/1847.pdf.
Smith, K.R. 1998. Indoor Air Pollution in India: National Health Impacts and Cost Effectiveness Intervention. Indira Gandhi Institute for Developmental Research: Mumbai, India.
Smith, K.R., S. Mehta and M. Feuz. 2003. Indoor smoke from household solid fuels. In: Ezzati, M., A. D. Rodgers, A.D. Lopez and C.J.L. Murray (eds) Comparative Quantification of Health Risks: Global and Regional Burden of Disease due to Selected Major Risk Factors, 3 volumes. World Health Organization: Geneva, Switzerland.
Stryker, J.D., Jeffrey C. Metzel and Lynne Salinger. 1997. A Regional Strategy for Trade and Growth in West Africa. In: Réal Vavergne (ed). Regional Integration and Cooperation in West Africa. Africa World Press, Inc.: Asmara, Eritrea.
UN (United Nations). United Nations Common Database. 2000. United Nations: New York , USA. Available at http://unstats.un.org/unsd/cdb/cdb_help/cdb_quick_start.asp.
UN Millennium Project. 2005a. Investing in Development: A Practical Plan to Achieve the MDGs. United Nations: New York, USA. Available at www.unmillenniumproject.org.

97References
UN Millennium Project. 2005b. Halving Hunger: It Can Be Done. United Nations: New York, USA. Available at http://www.unmillenniumproject.org/ who/tf2docs.htm.
UN Millennium Project. 2004. Millennium Development Goals Needs Assess-ments for Ghana, Tanzania, and Uganda. Background paper to Sachs, Jeffrey D., John W. McArthur, Guido Schmidt-Traub, Margaret Kruk, Chandrika Bahadur, Michael Faye and Gordon McCord. 2004. Ending Africa’s Poverty Trap Brookings Papers on Economic Activity. No. 2: 117–216.September 3. Available at http://www.unmillenniumproject.org/policy/backgroundpaper.htm.
UNAIDS (Joint United Nations Programme on HIV/AIDS). 1999. A Review of Household and Community Responses to the HIV/AIDS Epidemic in the Rural Areas of sub-Saharan Africa. UNAIDS: Geneva, Switzerland.
UNDP (United Nations Development Programme). 2005. Energizing the Mil-lennium Development Goals: Energy’s Role in Reducing Poverty.UNDP: New York, USA. Available at http://www.undp.org/energy/docs2/ENRG-MDG_Guide_all.pdf.
UNDP (United Nations Development Programme). 2004a. Achieving the Mil-lennium Development Goals: The Role of Energy Services, Mali case study, pp 48–49, Table 3.7. UNDP: New York, USA.
UNDP (United Nations Development Programme). 2004b. Human Develop-ment Report: Cultural Liberty in Today’s Diverse World. UNDP: New York, USA.Available at http://hdr.undp.org/reports/global/2004.
UNDP (United Nations Development Programme). 2003. Human Development Report: MDGs: A Compact Among Nations to End Human Poverty. UNDP: New York, USA. Available at http://hdr.undp.org/reports/global/2003.
UNDP (United Nations Development Programme). 2002. Energy for Sustain-able Development: A Policy Agenda, UNDP/ Institute of Electrical and Electronics Engineers(IEEE)/ International Electronics Inc (IEI), p. 13. UNDP: New York, USA.
UNDP (United Nations Development Programme). 2000. World Energy Assessment: Energy and the Challenge of Sustainability. UNDP: New York, USA. Available at http://www.undp.org/seed/eap/activities/wea/ drafts-frame.html.
UNDP (United Nations Development Programme). 1997. Energy After Rio: Prospects and Challenges, Chapter 2. UNDP: New York, USA. Available at www.undp.org/seed/energy/chapter2.html.
UNECA (United Nations Economic Commission for Africa). 2004. Economic Report on Africa: Unlocking Africa’s Trade Potential. UNECA: Addis Ababa, Ethiopia. Available at http://www.uneca.org/ERA2004.
UNIDO (United Nations Industrial Development Organization). 2004. Indus-trial Development Report 2004: Industrialization, Environment and the

98 Energy Services for the Millennium Development Goals
Millennium Development Goals in sub-Saharan Africa—The New Fron-tier in the Fight Against Poverty. UNIDO: Vienna, Austria. Available at http://www.unido.org/file-storage/download?file%5fid=24423.
van der Klaauw, Bas and Limin Wang. 2003. Child Mortality in Rural India: Deter-minants and Policy Implications. World Bank: Washington, DC, USA.
Viswanathan, Brinda and K.S. Kavi Kumar. 2005. Cooking fuel use patterns in India: 1983–2000. Energy Policy 33 (8): 1021–1036.
von Schirnding, Y., N. Bruce, K. Smith, G. Ballard-Tremeer, M. Ezzati and K. Lvovsky. 2002. Addressing the Impact of Household Energy and Indoor Air Pollution on the Health of the Poor: Implications for Policy Action and Intervention Measures. Paper prepared for the Commission on Mac-roeconomic and Health. Publication no. WHO/HDE/HID 02.9. World Health Organization: Geneva, Switzerland.Available at http://www.who.int/indoorair/publications/impact/en.
Warwick, Hugh and Alison Doig. 2004. Smoke: The Killer in the Kitchen—Indoor Air Pollution in Developing Countries. ITDG Publishing: Bourton on Dunsmore, UK. Available at http://itdg.org/smoke/.
Watson, Robert T. 2005. Energy and Environment. UN Millennium Project Task Force on Environmental Sustainability. United Nations: New York, USA.
World Bank. 2004a. Global Monitoring Report 2004: Policies and Actions for Achieving the Millennium Development Goals and Related Outcomes. World Bank: Washington, DC, USA.
World Bank 2003. World Development Indicators 2003. CD-ROM. World Bank: Washington, DC, USA.
World Bank. 2004b. World Development Indicators 2004. CD-ROM. World Bank: Washington, DC, USA.
World Bank/Africa Energy Team. 1998. A brighter future? Energy in Africa’s Development. World Bank: Washington DC. USA.
WHO (World Health Organization). 2002. The World Health Report 2002. WHO: Geneva, Switzerland.
WHO (World Health Organization). 2000. The World Health Report 2000. WHO: Geneva, Switzerland.

AFREPREN African Energy Policy Research NetworkALRI acute lower respiratory infectionARI acute respiratory infectionCDM Clean Development MechanismCIER Regional Integration Energy CommissionCIESIN Center for International Earth Science Information NetworkCIS Commonwealth of Independent StatesCOPD chronic obstructive pulmonary diseaseDFID Department for International Development (UK)DME dimethyl ether$PPP purchasing power parity dollarsESMAP UNDP/World Bank Energy Sector Management Assistance
ProgrammeFAO Food and Agriculture Organization of the United Nations GDP gross domestic productGHG greenhouse gasGIS geographic information systemGJ gigajouleGNESD Global Network on Energy for Sustainable Development HDI Human Development Index IBGE Instituto Brasileiro de Geografia e EstatísticasICT information and communication technologyIEA International Energy AgencyIFAD International Fund for Agricultural DevelopmentIEEE Institute of Electrical and Electronics EngineersIIMA Indian Institute of Management AhmedabadJPOI Johannesburg Plan of Implementation
Acronyms

100 Energy Services for the Millennium Development Goals
kgoe kilograms of oil equivalentKITE Kumasi Institute of Technology and Environment (Ghana)kWh kilowatt hourLDC Least-Developed CountryLPG Liquefied Petroleum GasLV low voltageMDG Millennium Development GoalMFP multifunctional platformMV medium voltageNEPAD New Partnership for Africa’s DevelopmentNGO non-governmental organizationODA official development assistanceOECD Organisation for Economic Co-operation and DevelopmentPRSP Poverty Reduction Strategy PaperPV photovoltaic SAPP Southern Africa Power PoolSEI Stockholm Environmental InstituteSida Swedish International Development AgencySME small and medium-sized enterpriseSTEG Tunisia Electricity and Gas Company SWER single wire earth return TANESCO Tanzania National Electric UtilityTWh Tetrawatt hoursUECCO Urambo Electric Consumers Cooperative SocietyUNAIDS Joint United Nations Programme on HIV/AIDSUNDESA United Nations Department for Economic and Social AffairsUNECA United Nations Economic Commission for AfricaUNIFEM United Nations Development Fund for WomenUNDP United Nations Development ProgrammeUNIDO United Nations Industrial Development OrganizationWAGP West Africa Gas PipelineWAPP West Africa Power PoolWHO World Health OrganizationWSSD World Summit on Sustainable Development


Front cover photo: IFAD/C. Salazar
Design: Communications Development Inc., USA, and Grundy & Northedge, UK
Layout and proofreading: Green Ink, UK (www.greenink.co.uk)
The Millennium Development Goals
Goal 1: Eradicate extreme poverty and hunger Target 1: Halve, between 1990 and 2015, the proportion of people whose income is less than $1 a day Target 2: Halve, between 1990 and 2015, the proportion of people who suffer from hunger
Goal 2: Achieve universal primary education Target 3: Ensure that, by 2015, children everywhere, boys and girls alike, will be able to complete a full course
of primary schooling
Goal 3: Promote gender equality and empower women Target 4: Eliminate gender disparity in primary and secondary education, preferably by 2005, and in all levels
of education no later than 2015
Goal 4: Reduce child mortality Target 5: Reduce by two-thirds, between 1990 and 2015, the under-five mortality rate
Goal 5: Improve maternal health Target 6: Reduce by three-quarters, between 1990 and 2015, the maternal mortality ratio
Goal 6: Combat HIV/AIDS, malaria and other diseases Target 7: Have halted by 2015 and begun to reverse the spread of HIV/AIDS Target 8: Have halted by 2015 and begun to reverse the incidence of malaria and other major diseases
Goal 7: Ensure environmental sustainability Target 9: Integrate the principles of sustainable development into country policies and programs and reverse
the loss of environmental resources Target 10: Halve, by 2015, the proportion of people without sustainable access to safe drinking water and
basic sanitation Target 11: Have achieved by 2020 a significant improvement in the lives of at least 100 million slum dwellers
Goal 8: Develop a global partnership for development Target 12: Develop further an open, rule-based, predictable, nondiscriminatory trading and financial system
(includes a commitment to good governance, development, and poverty reduction—both nationally and internationally)
Target 13: Address the special needs of the Least Developed Countries (includes tariff- and quota-free access for Least Developed Countries’ exports, enhanced program of debt relief for heavily indebted poor countries [HIPCs] and cancellation of official bilateral debt, and more generous official development assistance for countries committed to poverty reduction)
Target 14: Address the special needs of landlocked developing countries and small island developing states (through the Program of Action for the Sustainable Development of Small Island Developing States and 22nd General Assembly provisions)
Target 15: Deal comprehensively with the debt problems of developing countries through national and international measures in order to make debt sustainable in the long term. Some of the indicators are monitored separately for the least developed countries, Africa, landlocked developing countries, and small island developing states
Target 16: In cooperation with developing countries, develop and implement strategies for decent and productive work for youth
Target 17: In cooperation with pharmaceutical companies, provide access to affordable essential drugs in developing countries
Target 18: In cooperation with the private sector, make available the benefits of new technologies, especially information and communications technologies

The Millennium Development Goals are the world’s shared targets for dramatically reducing extreme poverty in its many dimensions – income poverty, hunger, disease, exclusion, lack of infrastructure and shelter – while promoting gender equality, education, health, and environmental sustainability, all by 2015. These bold Goals can be met in all parts of the world if nations follow through on their commitments to work together to meet them. While the Goals do not include any concrete energy targets, they will not be met unless access to improved energy services is increased.
The UN Millennium Project was commissioned by UN Secretary-General Kofi Annan to develop a practical plan of action to meet the Millennium Development Goals. An
independent advisory body directed by Professor Jeffrey D. Sachs, the UN Millennium Project presented its findings and recommendations to the UN Secretary-General in January 2005, laid out in Investing in Development and in the 13 reports of the UN Millennium Project Task Forces. These reports underscore the importance of energy services for achieving the Goals.
“Energy Services for the Millennium Development Goals” has been co-authored by ESMAP, UNDP, the UN Millennium Project, and the World Bank to outline practical strategies for providing the energy services needed to meet the Goals by 2015. The report draws on the findings of a working group on energy comprising experts from governments, academia,
international organizations, and civil society, which was led by Prof. Vijay Modi of Columbia University.
The report first describes the energy services and associated coverage targets that need to be met to achieve the Millennium Development Goals. It then outlines the operational challenges that the world’s poorest countries face in providing these services and lays out a set of practical recommendations for how these energy challenges can be met. In doing so, the report outlines how countries can increase access to energy services as part of their MDG based poverty reduction strategies.
Ab
ou
t this re
po
rt