Energy Revolution 2012
340
report 4th edition 2012 world energy scenario energy [r]evolution A SUSTAINABLE WORLD ENERGY OUTLOOK EUROPEAN RENEWABLE ENERGY COUNCIL
-
Upload
greenpeace-international -
Category
Documents
-
view
271 -
download
6
description
Greenpeace, EREC and GWEC present the Energy Revolution Scenario
Transcript of Energy Revolution 2012

report 4th edition 2012 world energy scenario
energy[r]evolutionA SUSTAINABLE WORLD ENERGY OUTLOOK
EUROPEAN RENEWABLE ENERGY COUNCIL

image A WOMAN CARRIES HER DAUGHTER AS SHE WALKS THROUGH A FLOODED STREET NEAR BANGPA-IN INDUSTRIAL PARK IN AYUTTHAYA, THAILAND. OVER SEVEN MAJORINDUSTRIAL PARKS IN BANGKOK AND THOUSANDS OF FACTORIES HAVE BEEN CLOSED IN THE CENTRAL THAI PROVINCE OF AYUTTHAYA AND NONTHABURI WITH MILLIONS OFTONNES OF RICE DAMAGED. THAILAND IS EXPERIENCING THE WORST FLOODING IN OVER 50 YEARS WHICH HAS AFFECTED MORE THAN NINE MILLION PEOPLE.
partners
Greenpeace International,European Renewable Energy Council (EREC),Global Wind Energy Council(GWEC)
date July 2012
isbn 978-90-73361-92-8
project manager & lead author Sven Teske,Greenpeace International
EREC Josche Muth
Greenpeace InternationalSven Teske
GWEC Steve Sawyer
research & co-authors Overall modelling: DLR, Institute of Technical Thermodynamics,Department of Systems Analysis andTechnology Assessment, Stuttgart,Germany: Dr. Thomas Pregger, Dr. Sonja Simon, Dr. Tobias Naegler,Marlene O’Sullivan
“will we look into the eyes of our children and confessthat we had the opportunity,but lacked the courage?that we had the technology,but lacked the vision?”
2

© ATHIT PERAWONGMETHA/GREENPEACE
Transport: DLR, Institute of VehicleConcepts, Stuttgart, Germany: Dr. Stephan Schmid, JohannesPagenkopf, Benjamin FrieskeEfficiency: Utrecht University, The Netherlands: Wina Graus,Katerina KermeliFossil Fuel Resource Assessment:Ludwig-Bölkow Systemtechnik,Munich, Germany; Dr. Werner Zittel
Employment: Institute forSustainable Futures, University ofTechnology, Sydney: Jay Rutovitzand Steve HarrisGrid and rural electrificationtechnology: energynautics GmbH,Langen/Germany; Dr. ThomasAckermann, Rena Ruwahata, Nils Martensen
editor Alexandra Dawe, Rebecca Short, Crispin Aubrey(basic document).
design & layout onehemisphere,Sweden, www.onehemisphere.se
[email protected]@erec.org
Revised version of 21st June 2012,with new foreword, new maps, REN 21 Renewable energy marketanalysis 2011 and edits.
for further information about the global, regional and national scenarios please visit the Energy [R]evolution website: www.energyblueprint.info/Published by Greenpeace International, EREC and GWEC. (GPI reference number JN 330). Printed on 100% post consumer recycled chlorine-free paper.
3

4
image LA DEHESA 50 MW PARABOLIC SOLAR THERMAL POWER PLANT. A WATER RESERVOIR AT LA DEHESA SOLAR POWER PLANT. LA DEHESA, 50 MW PARABOLIC THROUGHSOLAR THERMAL POWER PLANT WITH MOLTEN SALTS STORAGE. COMPLETED IN FEBRUARY 2011, IT IS LOCATED IN LA GAROVILLA AND IT IS OWNED BY RENOVABLES SAMCA.WITH AN ANNUAL PRODUCTION OF 160 MILLION KWH, LA DEHESA WILL BE ABLE TO COVER THE ELECTRICITY NEEDS OF MORE THAN 45,000 HOMES, PREVENTING THE EMISSIONOF 160,000 TONNES OF CARBON. THE 220 H PLANT HAS 225,792 MIRRORS ARRANGED IN ROWS AND 672 SOLAR COLLECTORS WHICH OCCUPY A TOTAL LENGTH OF 100KM. BADAJOZ.
The Global Energy[R]evolution seriespresents us with acompelling vision of anenergy future for asustainable world. Thescenarios proposed bythe Energy [R]evolutionhave gained a reputationfor the insight andexplanations theyprovide decision makers.
This fourth editioncarries on this tradition,by outlining an updatedand well-articulatedpathway to achieve thetransition to a globalsustainable energyfuture. The InternationalRenewable Energy Agency(IRENA) welcomes therecognition of the centralrole that renewableenergy will play in thisnew energy paradigm.
contents at a glance
foreword
foreword 4
introduction 12
executive summary 14
climate & energy policy 19
the energy [r]evolution concept 26
implementing the energy [r]evolution 48
scenarios for a futureenergy supply 54
1
2
3
4
5
© MARKEL REDONDO/GREENPEACE
Achieving this transition relies on addressing key energy issues suchas access to modern energy services, security of supply and thesustainability of the energy mix. Environmental degradation,increasing energy demand, and unsustainable resource use arecritical challenges that must be addressed. Renewable energy willplay an essential role in advancing sustainable development byimproving the access of millions to energy, whilst helping ensureenergy security, and mitigating the existential risk of climate changeby reducing emissions.
The benefits associated with renewable energy are influencing howcountries meet their energy needs, the increase in policies andinvestment globally attests to this. This growth in the uptake ofrenewable energy - the “Silent Revolution” - is playing out across theglobe: over the last decade 430,000 MW of renewable energycapacity has been installed, with global total investment reaching arecord $ 257 billion in 2011, a year in which renewable energybecame a trillion dollar industry, and the cost of modern renewableenergy technologies continued to fall.
Accelerating the “Silent Revolution” globally requires greaterlevels of commitment and cooperation to develop enabling policy,combined with practical business solutions. To enable this, policymakers, scientists and businesses require access to up-to-date,relevant and reliable data. Scenarios are a helpful aid for decisionmaking, by mapping out the complex issues and information thatmust be considered. Through its investigation of issues surroundingthe future of energy, the Global Energy [R]evolution 2012 makesan invaluable contribution to informing global decisions-makers.
The Global Energy [R]evolution publication provides an importantcomplement to IRENA’s efforts to provide knowledge and know-how,and to facilitate the flow of information encouraging the deploymentof renewables. Therefore, it is with pleasure that IRENA welcomesthis fourth edition of the Global Energy [R]evolution scenario, andthe contribution the European Renewable Energy Council andGreenpeace have made to the vital debate on transitioning the worldto a more secure and sustainable energy future.
Adnan Z. AminDIRECTOR-GENERAL
INTERNATIONAL RENEWABLE ENERGY AGENCY
JULY 2012
5
6
energy technologies 231
energy efficiency - more with less 260
transport 275
glossary & appendix 291
key results energy[r]evolution scenario 74
employment projections 188
7
8
9
10
11
12
the silent revolution – past & current market developments 198
energy resources andsecurity of supply 208

6
WORLD ENERGY [R]EVOLUTIONA SUSTAINABLE WORLD ENERGY OUTLOOK
foreword 4
introduction 12
executive summary 14
climate and energy policy 19
1.1 the UNFCCC and the kyoto protocol 201.2 international energy policy 201.3 renewable energy targets1.4 policy changes in the energy sector 211.4.1 the most effective way to implement
the energy [r]evolution: feed-in laws 211.4.2 bankable renewable energy support schemes 231.5 ftsm: special feed in law proposal
for developing countries 241.5.1 the feed-in tariff support mechanicsm 24
the energy [r]evolution concept 26
2.1 key principles 272.2 the “3 step implementation” 282.3 the new electricity grid 322.3.1 hybrid systems 332.3.2 smart grids 342.3.3 the super grid 362.3.4 baseload blocks progress 362.4 case study: a year after the german
nuclear phase out 392.4.1 target and method 392.4.2 carbon dioxide emissions trends 392.4.3 shortfall from first round of closures 392.4.4 the renewable energy sector in germany 392.5 case study: providing smart energy to
Bihar from the “bottom-up” 422.5.1 methodology 422.5.2 implementation 442.5.3 lessons from the study 442.6 greenpeace proposal to support a
renewable energy cluster 452.6.1 a rural feed-in tariff for bihar 462.7 energy [r]evolution cluster jobs 46
implementing the energy [r]evolution 48
3.1 renewable energy project planning basics 503.2 renewable energy financing basics 503.2.1 overcoming barriers to finance and investment
for renewable energy 523.2.2 how to overcome investment barriers
for renewable energy 53
scenarios for a future energy supply 54
4.1 scenario background 574.1.1 energy efficiency study for industry,
households and services 574.1.2 the future for transport 574.1.3 fossil fuel assessment report 574.1.4 status and future projections for renewable
heating technologies 574.2 main scenario assumptions 584.3 population development 594.4 economic growth 594.5 oil and gas price projections 604.6 cost of CO2 emissions 614.7 cost projections for efficient fossil fuel generation
and carbon capture and storage (CCS) 614.8 cost projections for renewable
energy technologies 624.8.1 photovoltaics (pv) 634.8.2 concentrating solar power (csp) 634.8.3 wind power 644.8.4 biomass 644.8.5 geothermal 654.8.6 ocean energy 654.8.7 hydro power 664.8.8 summary of renewable energy cost development 664.9 cost projections for renewable
heating technologies 674.9.1 solar thermal technologies 674.9.2 deep geothermal applications 674.9.3 heat pumps 674.9.3 biomass applications 674.10 assumptions for fossil fuel phase out 684.10.1 oil - production decline assumptions 684.10.2 coal - production decline assumptions 684.11 review: greenpeace scenario
projections of the past 694.11.1 the development of the global wind industry 694.11.2 the development of the global
solar photovoltaic industry 714.12 how does the energy [r]evolution scenario
compare to other scenarios 73
key results of energy [r]evolution scenario 74global scenario 75oecd north america 88latin america 98oecd europe 108africa 118middle east 128eastern europe/eurasia 138india 148non oecd asia 158china 168oecd asia oceania 178
contents
1
2
3
4
5

7
© GP/PETER CATON
image A WOMAN IN FRONT OF HER FLOODEDHOUSE IN SATJELLIA ISLAND. DUE TO THEREMOTENESS OF THE SUNDARBANS ISLANDS,SOLAR PANELS ARE USED BY MANY VILLAGERS. AS A HIGH TIDE INVADES THE ISLAND, PEOPLEREMAIN ISOLATED SURROUNDED BY THE FLOODS.
employment projections 188
6.1 methodology and assumptions 1896.2 employment factors 1906.3 regional adjustments 1916.3.1 regional job multipliers 1916.3.2 local employment factors 1916.3.3 local manufacturing and fuel production 1916.3.4 learning adjustments or ‘decline factors’ 1916.4 fossil fuels and nuclear energy - employment,
investment, and capacities 1936.4.1 employment in coal 1936.4.2 employment in gas, oil & diesel 1936.4.3 employment in nuclear energy 1936.5 employment in renewable energy technologies 1946.5.1 employment in wind energy 1946.5.2 employment in biomass 1946.5.3 employment in geothermal power 1956.5.1 employment in wave & tidal power 1956.5.2 employment in solar photovoltaics 1966.5.3 employment in solar thermal power 1966.6 employment in the renewable heating sector 1976.6.1 employment in solar heating 1976.6.2 employment in geothermal and heat pump heating 1976.6.2 employment in biomass heat 197
the silent revolution – past and current market developments 198
7.1 power plant markets in the us, europe and china 2007.2 the global market shares in the power plant
market: renewables gaining ground 202
energy resources and security of supply 208
8.1 oil 2108.1.1 the reserves chaoas 2108.1.2 non-conventional oil reserves 2118.2 gas 2118.2.1 shale gas 2118.3 coal 2118.4 nuclear 2208.5 renewable energy 2218.6 biomass in the 2012 energy [r]evolution 2288.6.1 how much biomass 229
energy technologies 231
9.1 fossil fuel technologies 2319.1.1 coal combustion technologies 2319.1.2 gas combustion technologies 2319.1.3 carbon reduction technologies 231
9.1.4 carbon dioxide storage 2329.1.5 carbon storage and climate change targets 2329.2 nuclear technologies 2349.2.1 nuclear reactor designs: evolution and safety issues 2349.3 renewable energy technologies 2359.3.1 solar power (photovoltaics) 2359.3.2 concentrating solar power (CSP) 2379.3.3 wind power 2399.3.4 biomass energy 2399.3.5 geothermal energy 2439.3.6 hydro power 2459.3.7 ocean energy 2489.3.8 renewable heating and cooling technologies 2519.3.9 geothermal, hydrothermal and aerothermal energy 2549.3.10 biomass heating technologies 2579.3.11 storage technologies 258
energy efficiency - more with less 260
10.1 methodology for the energy demand projections 26110.2 efficiency in industry 26310.2.1 energy demand reference scenario: industry 26310.3 low energy demand scenario: industry 26410.4 results for industry: efficiency pathway for
the energy [r]evolution 26510.5 buildings and agriculture 26611.5.1 energy demand reference scenario:
buildings and agriculture 26611.5.2 fuel and heat use 26711.5.3 electricity use 26810.6 the standard household concept 27010.7 low energy demand scenario:
buildings and agriculture 27210.8 results for building and agriculture:
the efficiency pathway for the energy [r]evolution 272
transport 275
11.1 the future of the transport sector in the energy[r]evolution scenario 276
11.2 technical and behavioural measures to reduce transport energy consumption 278
11.2.1 step 1: reduction of transport demand 27811.2.2 step 2: changes in transport mode 27911.2.3 step 3: efficiency improvements 28211.3 projection of the future LDV market 28811.3.1 projection of the future technology mix 28811.3.2 projection of the future vehicle segment split 28811.3.3 projection of the future switch to alternative fuels 28911.3.4 projection of the future global vehicle stock develoment 28911.3.5 projection of the future kilometres driven per year 29011.4 conclusion 290
glossary & appendix 291
12.1 glossary of commonly used terms and abbreviations 29212.2 definition of sectors 292scenario results data 293
6
7
8
9
10
11
12
8
WORLD ENERGY [R]EVOLUTIONA SUSTAINABLE WORLD ENERGY OUTLOOK
figure 1.1 ftsm scheme 25
figure 2.1 centralised generation systems waste more than two thirds of their original energy input 28
figure 2.2 a decentralised energy future 29figure 2.3 the smart-grid vision for the energy [r]evolution 35figure 2.4 a typical load curve throughout europe, shows
electricity use peaking and falling on a daily basis 37figure 2.5 the evolving approach to grids 37figure 2.6 renewable energy sources as a share of
energy supply in germany 40figure 2.7 renewable energy sources in total final energy
consumption in germany 2011/2010 40figure 2.8 phase out of nuclear energy 41figure 2.9 electricity imports/exports germany 41figure 2.10 development of household demand 42figure 2.11 process overview of supply system design by
production optimitsation 43figure 2.12 screenshot of PowerFactory grid model 43
figure 3.1 return characteristics of renewable energies 50figure 3.2 overview risk factors for renewable energy projects 51figure 3.3 investment stages of renewable energy projects 51figure 3.4 key barriers to renewable energy investment 53
figure 4.1 world regions used in the scenarios 58figure 4.2 future development of investment costs for
renewable energy technologies 66figure 4.3 expected development of electricity generation
costs from fossil fuel and renewable options 66figure 4.4 global oil production 1950 to 2011 and
projection till 2050 68figure 4.5 coal scenario: base decline of 2% per year
and new projects 68figure 4.6 wind power: short term prognosis vs real market
development - global cummulative capacity 69figure 4.7 wind power: long term market projects until 2030 70figure 4.8 photovoltaic: short term prognosis vs real market
development - global cummulative capacity 71figure 4.9 photovoltaic: long term market projects until 2030 72
figure 5.1 global: final energy intensity under reference scenario and the energy energy [r]evolution scenario 75
figure 5.2 global: total final energy demand under the reference scenario and the energy energy [r]evolution scenario 76
figure 5.3 global: development of electricity demand by sector in the energy [r]evolution scenario 77
figure 5.4 global: development of the transport demand by sector in the energy [r]evolution scenario 77
figure 5.5 global: development of heat demand by sector in the energy [r]evolution scenario 77
figure 5.6 global: electricity generation structure under the reference scenario and the energy [r]evolution scenario 78
figure 5.7 global: total electricity supply costs & specific electricity generation costs under two scenarios 79
figure 5.8 global: investment shares - reference scenario versus energy [r]evolution scenario 80
figure 5.9 global: change in cumulative power plant investment 80figure 5.10 global: heat supply structure under the reference
scenario and the energy [r]evolution scenario 81figure 5.11 global: investments for renewable heat generation
technologies under the reference scenario and the energy [r]evolution scenario 82
figure 5.12a global: employment in the energy scenario under the reference scenario and the energy [r]evolution scenarios 82
figure 5.12b global: proportion of fossil fuel and renewable employment at 2010 and 2030 84
figure 5.13 global: final energy consumption for transport under the reference scenario and the energy [r]evolution scenario 85
figure 5.14 global: primary energy consumption under the reference scenario and the energy [r]evolution scenario 86
figure 5.15 global: regional breakdown of CO2 emissions in the energy [r]evolution in 2050 87
figure 5.16 global: development of CO2 emissions by sectorunder the energy [r]evolution scenarios 87
figure 5.17 global: CO2 emissions by sector in the energy [r]evolution in 2050 87
figures 5.18-5.30 north america 88figures 5.31-5.43 latin america 98figures 5.44-5.56 oecd europe 108figures 5.57-5.69 africa 118figures 5.70-5.82 middle east 128figures 5.83-5.96 eastern europe/eurasia 138figures 5.96-5.108 india 148figures 5.109-5.121 non oecd asia 158figures 5.122-5.134 china 168figures 5.135-5.147 oecd asia oceania 178
figure 6.1 proportion of fossil fuel and renewable employment at 2010 and 2030 192
figure 7.1 global power plant market 1970-2010 199figure 7.2 global power plant market 1970-2010, excl china 200figure 7.3 usa: annual power plant market 1970-2010 200figure 7.4 europe (eu 27): annual power plant market
1970-2010 201figure 7.5 china: annual power plant market 1970-2010 201figure 7.6 power plant market shares 1970-2010 203figure 7.7 historic developments of the global
power plant market, by technology 204figure 7.8 global power plant market in 2011 207figure 7.9 global power plant market by region 207
figure 8.1 ranges of global technical potentials of renewable energy sources 226
figure 9.1 example of the photovoltaic effect 235figure 9.2 photovoltaic technology 235figure 9.3 csp technologies: parabolic trough, central
receiver/solar tower and parabolic dish 238figure 9.4 early wind turbine designs, including horizontal
and vertical axis turbines 239
list of figures
1
2
3
4
5
6
7
8
9

9
© ANTHONY UPTON 2003
image NORTH HOYLE WIND FARM, UK’S FIRST WIND FARM IN THE IRISH SEA WHICHWILL SUPPLY 50,000 HOMES WITH POWER.
figure 9.5 basic components of a modern horizontal axis wind turbine with a gear box 240
figure 9.6 growth in size of typical commercial wind turbines 240figure 9.7 biogas technology 242figure 9.8 geothermal energy 243figure 9.9 schematic diagram of a geothermal condensing
steam power plant and a binary cycle power plant 244figure 9.10 scheme showing conductive EGS resources 245figure 9.11 run-of-river hydropower plant 246figure 9.12 typical hydropower plant with resevoir 246figure 9.13 typical pumped storage project 247figure 9.14 typical in-stream hydropower project using
existing facilities 247figure 9.15 wave energy technologies: classification based
on principles of operation 248figure 9.16 oscillating water columns 249figure 9.17 oscillating body systems 249figure 9.18 overtopping devices 249figure 9.19 classification of current tidal and ocean energy
technologies (principles of operation) 250figure 9.20 twin turbine horizontal axis device 250figure 9.21 cross flow device 250figure 9.22 vertical axis device 251figure 9.23 natural flow systems vs. forced circulation systems 252figure 9.24 examples for heat pump systems 255figure 9.25 overview storage capacity of different energy
storage systems 259figure 9.26 renewable (power) (to) methane - renewable gas 259
figure 10.1 final energy demand (PJ) in reference scenario per sector worldwide 261
figure 10.2 final energy demand (PJ) in reference scenario per region 262
figure 10.3 final energy demand per capita in reference scenario 262
figure 10.4 final energy demand for the world by sub sector and fuel source in 2009 262
figure 10.5 projection of industrial energy demand in period 2009-2050 per region 263
figure 10.6 share of industry in total final energy demand per region in 2009 and 2050 263
figure 10.7 breakdown of final energy consumption in 2009 by sub sector for industry 263
figure 10.8 global final energy use in the period 2009-2050in industry 265
figure 10.9 final energy use in sector industries 265figure 10.10 fuel/heat use in sector industries 265figure 10.11 electricity use in sector industries 265figure 10.12 breakdown of energy demand in buildings and
agriculture in 2009 266figure 10.13 energy demand in buildings and agriculture in
reference scenario per region 266figure 10.14 share electricity and fuel consumption by
buildings and agriculture in total final energydemand in 2009 and 2050 in the reference scenario 266
figure 10.15 breakdown of final energy demand in buildings in 2009 for electricity and fuels/heat in ‘others’ 267
figure 10.16 breakdown of fuel and heat use in ‘others’ in 2009 267figure 10.17 elements of new building design that can
substantially reduce energy use 268figure 10.18 breakdown of electricity use by sub sector
in sector ‘others’ in 2009 269figure 10.19 efficiency in households - electricity demand
per capita 270
figure 10.20 electricity savings in households (E[R] vs. Ref) in 2050 271
figure 10.21 breakdown of energy savings in BLUE Map scenario for sector ‘others’ 272
figure 10.22 global final energy use in the period 2009-2050 in sector ‘others’ 274
figure 10.23 final energy use i sector ‘others’ 274figure 10.24 fuel/heat use in sector ‘others’ 274figure 10.25 electricity use in sector ‘others’ 274
figure 11.1 world final energy use per transport mode2009/2050 - reference scenario 277
figure 11.2 world transport final energy use by region 2009/2050 - reference scenario 277
figure 11.3 world average (stock-weighted) passenger transport energy intensity for 2009 and 2050 279
figure 11.4 aviation passenger-km in the reference and energy [r]evolution scenarios 280
figure 11.5 rail passenger-km in the reference and energy [r]evolution scenarios 280
figure 11.6 passenger-km over time in the reference scenario 280figure 11.7 passenger-km over time in the energy
[r]evolution scenario 280figure 11.8 world average (stock-weighted) freight transport
energy intensities for 2005 and 2050 281figure 11.9 tonne-km over time in the reference scenario 281figure 11.10 tonne-km over time in the energy
[r]evolution scenario 281figure 11.11 energy intensities (Mj/p-km) for air transport
in the energy [r]evolution scenario 282figure 11.12 fuel share of electric and diesel rail traction for
passenger transport 283figure 11.13 fuel share of electric and diesel rail traction for
freight transport 283figure 11.14 energy intensities for passenger rail transport
in the energy [r]evolution scenario 284figure 11.15 energy intensities for freight rail transport
in the energy [r]evolution scenario 284figure 11.16 HDV operating fully electrically under a catenary 284figure 11.17 fuel share of medium duty vehicles (global average)
by transport performance (ton-km) 285figure 11.18 fuel share of heavy duty vehicles (global average)
by transport performance (ton-km) 285figure 11.19 specific energy consumption of HDV and MDV in
litres of gasoline equivalent per 100 tkm in 2050 285figure 11.20 energy intensities for freight rail transport in
the energy [r]evolution scenario 287figure 11.21 LDV occupancy rates in 2009 and in the
energy [r]evolution 2050 287figure 11.22 sales share of conventional ICE, autonomous
hybrid and grid-connectable vehicles in 2050 288figure 11.23 vehicle sales by segment in 2009 and 2050 in the
energy [r]evolution scenario 288figure 11.24 fuel split in vehicle sales for 2050 energy
[r]evolution by world region 289figure 11.25 development of the global LDV stock
under the reference scenario 289figure 11.26 development of the global LDV stock
under the energy [r]evolution scenario 289figure 11.26 average annual LDV kilometres driven per
world region 290
10
11
10
WORLD ENERGY [R]EVOLUTIONA SUSTAINABLE WORLD ENERGY OUTLOOK
table 2.1 power plant value chain 30table 2.2 german government short, medium and
long term binding targets 41table 2.3 key results for energy [r]evolution village cluster 45table 2.4 village cluster demand overview 47
table 3.1 how does the current renewable energy market work in practice? 49
table 3.2 categorisation of barriers to renewable energy investment 52
table 4.1 assumed average growth rates and annual market volumes by renwable technologies 65
table 4.2 population development projections 59table 4.3 gdp development projections 60table 4.4 development projections for fossil fuel and
biomass prices in $ 2010 60table 4.5 assumptions on CO2 emissions cost development
for Annex-B and Non-Annex-B countries of the UNFCCC 61
table 4.6 development of efficiency and investment costs for selected new power plant technologies 61
table 4.7 photovoltaics (pv) cost assumptions 63table 4.8 concentrating solar power (csp) cost assumptions 63table 4.9 wind power cost assumptions 64table 4.10 biomass cost assumptions 64table 4.11 geothermal cost assumptions 65table 4.12 ocean energy cost assumptions 65table 4.13 hydro power cost assumptions 66table 4.14 overview over expected investment costs for
pathways for heating technologies 67table 4.15 overview of key parameter of the illustrative
scenarios based on assumptions that are exogenous to the models respective endogenous model results 73
table 5.1 global: renewable electricity generation capacity under the reference scenario and the energy [r]evolution scenario 78
table 5.2 global: investment costs for electricity generation and fuel cost savings under the energy [r]evolution scenario compared to the reference scenario 80
table 5.3 global: renewable heating capacities under the reference scenario and the energy [r]evolution scenario 81
table 5.4 global: renewable heat generation capacities under the reference scenario and the energy[r]evolution scenario 82
table 5.5 global: total employment in the energy sector 84table 5.6 global: transport energy demand by mode
under the reference scenario and the energy [r]evolution scenario 85
tables 5.7-5.12 north america 90figures 5.13-5.18 latin america 100figures 5.19-5.24 oecd europe 110figures 5.25-5.30 africa 120figures 5.31-5.36 middle east 130figures 5.37-5.42 eastern europe/eurasia 140figures 5.43-5.48 india 150figures 5.49-5.54 non oecd asia 160figures 5.55-5.60 china 170figures 5.61-5.66 oecd asia oceania 180
table 6.1 methodology overview 189table 6.2 summary of employment factors used in global
analysis in 2012 190table 6.3 employment factors used for coal fuel supply 191table 6.4 regional multipliers 191table 6.5 total global employment 192table 6.6 fossil fuels and nuclear energy: capacity,
investment and direct jobs 193table 6.7 wind energy: capacity, investment and
direct jobs 194table 6.8 biomass: capacity, investment and direct jobs 194table 6.9 geothermal power: capacity, investment and
direct jobs 195table 6.10 wave and tidal power: capacity, investment
and direct jobs 195table 6.11 solar photovoltaics: capacity, investment and
direct jobs 196table 6.12 solar thermal power: capacity, investment
and direct jobs 196table 6.13 solar heating: capacity, investment
and direct jobs 197table 6.14 geothermal and heat pump heating: capacity,
investment and direct jobs 197table 6.15 biomass heat: direct jobs in fuel supply 197
table 7.1 overview global renewable energy market 2011 207
table 8.1 global occurances of fossil and nuclear sources 209table 8.2 overview of the resulting emissions if all fossil
fuel resources were burned 210table 8.3 assumption on fossil fuel use in the
energy [r]evolution scenario 220table 8.4 renwable energy theoretical potential 221
list of tables
2
3
4
5
6
7
8

11
© GP/WILL ROSE
image A YOUNG INDIGENOUS NENET BOY PRACTICESWITH HIS REINDEER LASSO ROPE. THE INDIGENOUSNENETS PEOPLE MOVE EVERY 3 OR 4 DAYS SO THATTHEIR REINDEER DO NOT OVER GRAZE THE GROUNDAND THEY DO NOT OVER FISH THE LAKES. THE YAMALPENINSULA IS UNDER HEAVY THREAT FROM GLOBALWARMING AS TEMPERATURES INCREASE AND RUSSIASANCIENT PERMAFROST MELTS.
table 9.1 typical type and size of applications per market segment 236
table 10.1 reduction of energy use in comparison to the reference scenario per sector in 2050 264
table 10.2 share of technical potentials implemented in the energy [r]evolution scenario 264
table 10.3 reference and best practice electricity use by ‘wet appliances’ 269
table 10.4 effect on number of global operating power plants of introducing strict energy efficiency standards based on currently available technology 271
table 10.5 annual reduction of energy demand in ‘others’ sector in energy [r]evolution scenario in comparison to the corresponding reference scenario 272
table 10.6 global final energy consumption for sector ‘others’ (EJ) in 2030 and 2050 273
table 10.7 global final energy consumption for sector ‘others’ (EJ) in 2030 and 2050in underlying baseline scenarios 273
table 11.1 selection of measure and indicators 278table 11.2 LDV passenger-km per capita 278table 11.3 air traffic substitution potential of high
speed rail (HSR) 279table 11.4 modal shift of HDV tonne-km to freight rail
in 2050 281table 11.5 the world average energy intensities for MDV
and HDV in 2009 and 2050 energy [r]evolution 285table 11.6 technical efficiency potential for world
passenger transport 287table 11.7 technical efficiency potential for world
freight transport 287
table 12.1 conversion factors – fossil fuels 292table 12.2 conversion factors – different energy units 292table 12.3-12.17 global scenario results 293table 12.18-12.32 latin america america scenario results 297table 12.33-12.47 oecd europe scenario results 301table 12.48-12.62 africa scenario results 305table 12.63-12.77 middle east scenario results 309table 12.78-12.92 eastern europe/eurasia scenario results 313table 12.93-12.107 india scenario results 317table 12.108-12.122 oecd north america scenario results 321table 12.123-12.137 non oecd asia scenario results 325table 12.138-12.152 china scenario results 329table 12.153-12.167 oecd asia oceania scenario results 333
map 8.1 oil reference scenario and the energy [r]evolution scenario 212
map 8.2 gas reference scenario and the energy [r]evolution scenario 214
map 8.3 coal reference scenario and the energy [r]evolution scenario 216
map 8.4 water demand for thermal power generation 218map 8.5 solar reference scenario and the
energy [r]evolution scenario 222map 8.6 wind reference scenario and the
energy [r]evolution scenario 224map 8.7 regional renewable energy potential 227
list of maps
89
10
11
12

image DUST IS SEEN BLOWING ACROSS THE WEST COAST OF SOUTHERN AFRICA FROM ANGOLA TO SOUTH AFRICA.
© SEAWIFS PROJECT, NASA/GODDARD SPACE FLIGHT CENTER, AND ORBIMAGE
“FOR THE SAKE OF A SOUND ENVIRONMENT, POLITICAL STABILITY AND THRIVING ECONOMIES, NOW IS THE TIME TO COMMIT
TO A TRULY SECURE AND SUSTAINABLE ENERGY FUTURE.”
introduction
greenhouse gas emissions. This is much faster than anythingexperienced in human history. As average temperature increasesapproach 2°C or more, damage to ecosystems and disruption to theclimate system increases dramatically, threatening millions of peoplewith increased risk of hunger, disease, flooding and water shortage.
A certain amount of climate change is now “locked in”, based onthe amount of carbon dioxide and other greenhouse gases alreadyemitted into the atmosphere since industrialisation began. No oneknows how much warming is “safe” for life on the planet.However, what we know is that the effects of climate change arealready being felt by populations and ecosystems. We can alreadysee melting glaciers, disintegrating polar ice, thawing permafrost,dying coral reefs, rising sea levels, changing ecosystems and fatalheat waves that are made more severe by a changed climate.
Japan’s major nuclear accident at Fukushima in March 2011following a tsunami came 25 years after the disastrous explosion inthe Chernobyl nuclear power plant in former Soviet Union, showingthat nuclear energy is an inherently unsafe source of power. TheFukushima disaster triggered a surge in global renewable energyand energy efficiency deals. At the same time, the poor state of theglobal economy has resulted in decreasing carbon prices, somegovernments reducing support for renewables, and a stagnation ofoverall investment, particularly in the OECD.
The world’s energy system has bestowed great benefits on society,but it has also come with high price tag: climate change, which isoccurring due to a build of carbon dioxide and other greenhousegases in the atmosphere caused by human activity; military andeconomic conflict due to uneven distribution of fossil resources;and millions of premature deaths and illness due to the air andwater pollution inherent in fossil fuel production and consumption.
The largest proportion of global fossil fuel use is to generate power, forheating and lighting, and for transport. Business-as-usual growth offossil-fuels is fundamentally unsustainable. Climate change threatensall continents, coastal cities, food production and ecosystems. It willmean more natural disasters such as fire and floods, disruption ofagriculture and damage to property as sea levels rise.
The pursuit of energy security, while remaining dependent on fossilfuel will lead to increasing greenhouse gas emissions and moreextreme climate impacts. Rising demand and rising prices drives thefossil fuel industry towards unconventional sources such as tar sands,shale gas and super-coal mines which destroy ecosystems and putwater supplies in danger. The inherent volatility of fossil fuel pricesputs more strain on an already stressed global economy.
According to the Intergovernmental Panel on Climate Change,global mean temperatures are expected to increase over the nexthundred years by up to 6.4° C if no action is taken to reduce
WORLD ENERGY [R]EVOLUTIONA SUSTAINABLE WORLD ENERGY OUTLOOK
12

Rapid cost reductions in the renewable energy sector have made itpossible to increase their share in power generation, heating andcooling and the transport sector faster than in previous editions. Forthe first time, this report takes a closer look at required investmentcosts for renewable heating technologies. The employment calculationhas been expanded to the heating sector as well and the overallmethodology of the employment calculation has been improved.
For the urgently needed access to energy for the almost 2 billionpeople who lack it at present, we have developed a new “bottomup” electrification concept in the North Indian state of Bihar (seechapter 2). New technology coupled with innovative finance mayresult in a new wave of rural electrification programs implementedby local people. A power plant market analysis of the past 40 yearshas been added to further develop the replacement strategy for oldpower plants. While the solar photovoltaic and wind installationhave been increased, the use of bio-energy has been reduced due toenvironmental concerns (see page 212). Concentrated solar powerstations and offshore wind remain cornerstones of the Energy[R]evolution, while we are aware that both technologies experienceincreasing difficulty raising finance than some other renewabletechnologies. Therefore we urge governments to introduce therequired policy frameworks to lower the risks for investors. Newstorage technologies need to move from R&D to marketimplementation; again this requires long term policy decisions.Without those new storage technologies, e.g. methane producedfrom renewables (see chapter 9), a transition towards more efficientelectric mobility will be more difficult.
Last but not least, the automobile industry needs to movetowards smaller and lighter vehicles to bring down the energydemand and introduce new technologies. We urge carmanufactures to finally move forward and repeat the hugesuccesses of the renewable energy industry.
This fourth edition of the Energy [R]evolution shows that with only1% of global GDP invested in renewable energy by 2050, 12 million jobs would be created in the renewable sector alone; andthe fuel costs savings would cover the additional investment twotimes over. To conclude, there are no real technical or economicbarriers to implementing the Energy [R]evolution. It is the lack ofpolitical will that is to blame for the slow progress to date.
image WIND TURBINES AT THE NAN WIND FARM INNAN’AO. GUANGDONG PROVINCE HAS ONE OF THEBEST WIND RESOURCES IN CHINA AND IS ALREADYHOME TO SEVERAL INDUSTRIAL SCALE WIND FARMS.
© GP/XUAN CANXIONG
Rising oil demand is putting pressure on supply causing prices torise which make possible increased exploration for “marginal andunconventional” oil resources, such as regions of the Arctic newlyaccessible due to retreating polar ice, and the environmentallydestructive tar sands project in Canada.
For almost a decade it looked as if nothing could halt the growthof the renewable industries and their markets. The only way wasup. However the economic crisis in 2008/2009 and its continuingaftermath slowed growth and dampened demand. While therenewable industry is slowly recovering, increased competition,particularly in the solar PV and wind markets has driven downprices and shaved margins to the point where most manufacturersare struggling to survive. This is good news for the consumer,however, as the prices for solar PV fell more than 60% between2010 and 2012, and wind turbine prices have also decreasedsubstantially. This means that renewables are directly competitivewith heavily subsidized conventional generation in an increasingnumber of markets, but for the industry to meet its full potentialgovernments need to act to reduce the 600 billion USD/annum insubsidies to fossil fuels, and move ahead with pricing CO2 emissionsand other external costs of conventional generation.
As renewables play an increasing role in the energy system, one can nolonger speak of ‘integration’ of renewables’ but ‘transformation’, movingaway from the reliance on a few large power plants, or single fuels to aflexible system based on a wide variety of renewable sources of supply,some of which are variable. Investments in new infrastructure, smartergrids, better storage technologies and a new energy policy which takesall these new technologies into account are required.
the new energy [r]evolution
The IPCC’s Special Report on Renewable Energy and ClimateChange (SRREN) chose the last Energy [R]evolution edition(published in 2010) as one of the four benchmark scenarios forclimate mitigation energy scenarios. The Energy [R]evolution wasthe most ambitious, combining an uptake of renewable energy andrigorous energy efficiency measures to put forward the highestrenewable energy share by 2050, although some other scenariosactually had higher total quantities of renewables. Following thepublication of the SRREN in May 2011 in Abu Dhabi, the Energy[R]evolution has been widely quoted in the scientific literature.
The Energy [R]evolution 2012 takes into account the significantchanges in the global energy sector debate over the past two years. InJapan, the Fukushima Nuclear disaster following the devastatingtsunami triggered a faster phase-out of nuclear power in Germany, andraised the level of debate in many countries. The Deepwater Horizondisaster in the Gulf of Mexico in 2010 highlighted the damage that canbe done to eco-systems and livelihoods, while oil companies started newoil exploration in ever-more sensitive environments such as the ArcticCircle. The Energy [R]evolution oil pathway is based on a detailedanalysis of the global conventional oil resources, the currentinfrastructure of those industries, the estimated production capacitiesof existing oil wells in the light of projected production decline ratesand the investment plans known by end 2011. To end our addiction tooil, financial resources must flow from 2012 onwards to developingnew and larger markets for renewable energy technologies and energyefficiency to avoid “locking in” new fossil fuel infrastructure.
13
Sven TeskeCLIMATE & ENERGY UNIT
GREENPEACE INTERNATIONAL
JUNE 2012
Josche MuthPRESIDENT
EUROPEAN RENEWABLE
ENERGY COUNCIL (EREC)
Steve SawyerSECRETARY GENERAL
GLOBAL WIND ENERGY
COUNCIL (GWEC)

14
WORLD ENERGY [R]EVOLUTIONA SUSTAINABLE WORLD ENERGY OUTLOOK
The Energy [R]evolution Scenario has became a well known andwell respected energy analysis since it was first published forEurope in 2005. This is the fourth Global Energy [R]evolutionscenario; earlier editions were published in 2007, 2008 and 2010.
The Energy [R]evolution 2012 provides a consistent fundamentalpathway for how to protect our climate: getting the world fromwhere we are now to where we need to be by phasing out fossilfuels and cutting CO2 emissions while ensuring energy security.
The evolution of the scenarios has included a detailedemployment analysis in 2010, and now this edition expands theresearch further to incorporate new demand and transportprojections, new constraints for the oil and gas pathways andtechno-economic aspects of renewable heating systems. While the2010 edition had two scenarios – a basic and an advancedEnergy [R]evolution, this edition puts forward only one; based onthe previous ‘advanced’ case.
the fossil fuel dilemma
Raising energy demand is putting pressure on fossil fuel supplyand now pushing oil exploration towards “unconventional” oilresources. Remote and sensitive environments such as the Arcticare under threat from increased drilling, while theenvironmentally destructive tar sands projects in Canada arebeing pursued to extract more marginal sources. However,scarcity of conventional oil is not the most pressing reason tophase-out fossil fuels: cutting back dramatically is essential tosave the climate of our planet. Switching from fossil fuels torenewables also offers substantial benefits such as independencefrom world market fossil fuel prices and the creation of millionsof new green jobs. It can also provide energy to the two billionpeople currently without access to energy services. The Energy[R]evolution 2012 took a closer look at the measures required tophase-out oil faster in order to save the Arctic from oilexploration, avoid dangerous deep sea drilling projects and toleave oil shale in the ground.
executive summary
“AT THE CORE OF THE ENERGY [R]EVOLUTION WILL BE A CHANGE IN THE WAY THAT ENERGY IS PRODUCED, DISTRIBUTED AND CONSUMED.”
© MARKEL REDONDO/GREENPEACE
image GEMASOLAR, A 15 MWE SOLAR-ONLY POWER TOWER PLANT. IT’S 16-HOUR MOLTEN SALT STORAGE SYSTEM CAN DELIVER POWER AROUND THE CLOCK. IT RUNS THEEQUIVALENT OF 6,570 FULL HOURS OUT OF A 8,769 TOTAL. GEMASOLAR IS OWNED BY TORRESOL ENERGY AND HAS BEEN COMPLETED IN MAY 2011.
15
climate change threats
The threat of climate change, caused by rising globaltemperatures, is the most significant environmental challengefacing the world at the beginning of the 21st century. It hasmajor implications for the world’s social and economic stability,its natural resources and in particular, the way we produce our energy.
In order to avoid the most catastrophic impacts of climatechange, the global temperature increase must be kept as farbelow 2°C as possible. This is still possible, but time is runningout. To stay within this limit, global greenhouse gas emissions willneed to peak by 2015 and decline rapidly after that, reaching asclose to zero as possible by the middle of the 21st century. Themain greenhouse gas is carbon dioxide (CO2) produced by usingfossil fuels for energy and transport. Keeping the globaltemperature increase to 2°C is often referred to as a ‘safe level’of warming, but this does not reflect the reality of the latestscience. This shows that a warming of 2°C above pre-industriallevels would pose unacceptable risks to many of the world’s keynatural and human systems.1 Even with a 1.5°C warming,increases in drought, heat waves and floods, along with otheradverse impacts such as increased water stress for up to 1.7billion people, wildfire frequency and flood risks, are projected inmany regions. Neither does staying below 2°C rule out large-scale disasters such as melting ice sheets. Partial de-glaciation ofthe Greenland ice sheet, and possibly the West Antarctic icesheet, could even occur from additional warming within a rangeof 0.8 – 3.8°C above current levels.2 If rising temperatures are tobe kept within acceptable limits then we need to significantlyreduce our greenhouse gas emissions. This makes bothenvironmental and economic sense.
global negotiation
Recognising the global threats of climate change, the signatoriesto the 1992 UN Framework Convention on Climate Change(UNFCCC) agreed to the Kyoto Protocol in 1997. The Protocolentered into force in early 2005 and its 193 members meetcontinuously to negotiate further refinement and development ofthe agreement. Only one major industrialised nation, the UnitedStates, has not ratified the protocol. In 2011, Canada announcedits intention to withdraw from the protocol. In Copenhagen in2009, the members of the UNFCCC were not able to deliver anew climate change agreement towards ambitious and fairemission reductions. At the 2012 Conference of the Parties inDurban, there was agreement to reach a new agreement by 2015and to adopt a second commitment period at the end of 2012.However, the United Nations Environment Program’s examinationof the climate action pledges for 2020 shows a major gapbetween what the science demands to curb climate change andwhat the countries plan to do. The proposed mitigation pledgesput forward by governments are likely to allow global warming toat least 2.5 to 5 degrees temperature increase above pre-industrial levels.3
© GP/PETER CATON
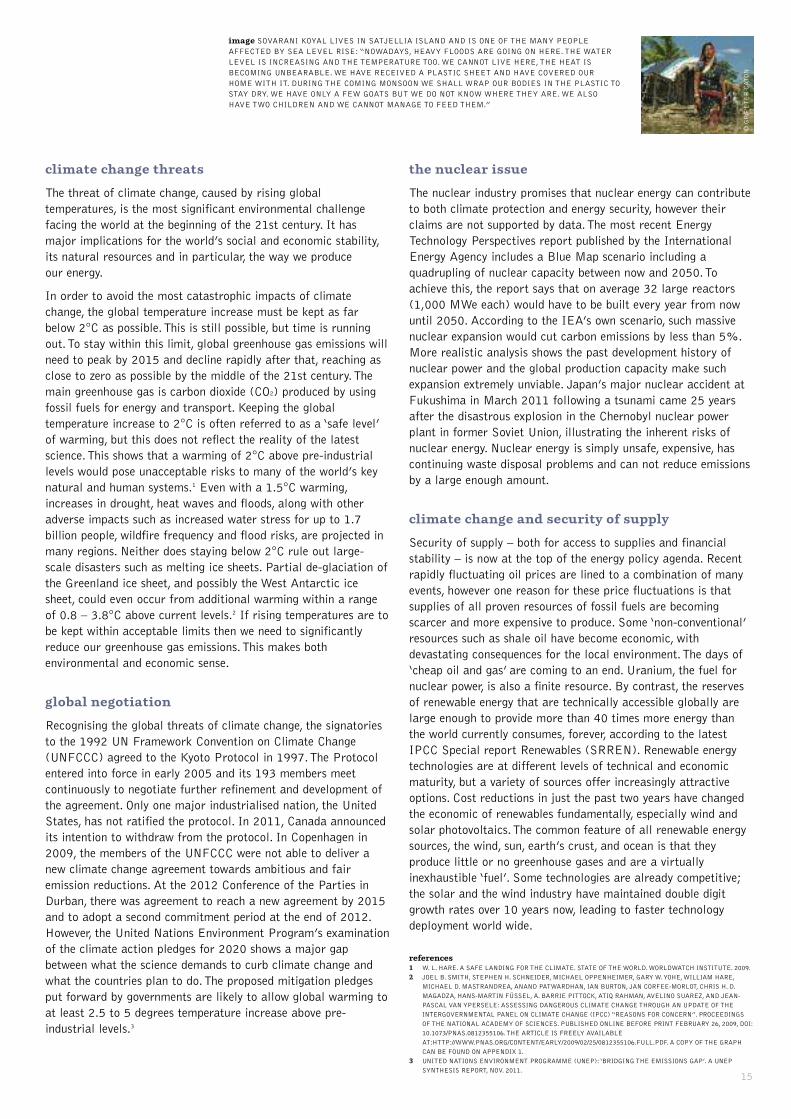
image SOVARANI KOYAL LIVES IN SATJELLIA ISLAND AND IS ONE OF THE MANY PEOPLEAFFECTED BY SEA LEVEL RISE: “NOWADAYS, HEAVY FLOODS ARE GOING ON HERE. THE WATERLEVEL IS INCREASING AND THE TEMPERATURE TOO. WE CANNOT LIVE HERE, THE HEAT ISBECOMING UNBEARABLE. WE HAVE RECEIVED A PLASTIC SHEET AND HAVE COVERED OURHOME WITH IT. DURING THE COMING MONSOON WE SHALL WRAP OUR BODIES IN THE PLASTIC TOSTAY DRY. WE HAVE ONLY A FEW GOATS BUT WE DO NOT KNOW WHERE THEY ARE. WE ALSOHAVE TWO CHILDREN AND WE CANNOT MANAGE TO FEED THEM.”
the nuclear issue
The nuclear industry promises that nuclear energy can contributeto both climate protection and energy security, however theirclaims are not supported by data. The most recent EnergyTechnology Perspectives report published by the InternationalEnergy Agency includes a Blue Map scenario including aquadrupling of nuclear capacity between now and 2050. Toachieve this, the report says that on average 32 large reactors(1,000 MWe each) would have to be built every year from nowuntil 2050. According to the IEA’s own scenario, such massivenuclear expansion would cut carbon emissions by less than 5%.More realistic analysis shows the past development history ofnuclear power and the global production capacity make suchexpansion extremely unviable. Japan’s major nuclear accident atFukushima in March 2011 following a tsunami came 25 yearsafter the disastrous explosion in the Chernobyl nuclear powerplant in former Soviet Union, illustrating the inherent risks ofnuclear energy. Nuclear energy is simply unsafe, expensive, hascontinuing waste disposal problems and can not reduce emissionsby a large enough amount.
climate change and security of supply
Security of supply – both for access to supplies and financialstability – is now at the top of the energy policy agenda. Recentrapidly fluctuating oil prices are lined to a combination of manyevents, however one reason for these price fluctuations is thatsupplies of all proven resources of fossil fuels are becomingscarcer and more expensive to produce. Some ‘non-conventional’resources such as shale oil have become economic, withdevastating consequences for the local environment. The days of‘cheap oil and gas’ are coming to an end. Uranium, the fuel fornuclear power, is also a finite resource. By contrast, the reservesof renewable energy that are technically accessible globally arelarge enough to provide more than 40 times more energy thanthe world currently consumes, forever, according to the latestIPCC Special report Renewables (SRREN). Renewable energytechnologies are at different levels of technical and economicmaturity, but a variety of sources offer increasingly attractiveoptions. Cost reductions in just the past two years have changedthe economic of renewables fundamentally, especially wind andsolar photovoltaics. The common feature of all renewable energysources, the wind, sun, earth’s crust, and ocean is that theyproduce little or no greenhouse gases and are a virtuallyinexhaustible ‘fuel’. Some technologies are already competitive;the solar and the wind industry have maintained double digitgrowth rates over 10 years now, leading to faster technologydeployment world wide.
references1 W. L. HARE. A SAFE LANDING FOR THE CLIMATE. STATE OF THE WORLD. WORLDWATCH INSTITUTE. 2009.
2 JOEL B. SMITH, STEPHEN H. SCHNEIDER, MICHAEL OPPENHEIMER, GARY W. YOHE, WILLIAM HARE,
MICHAEL D. MASTRANDREA, ANAND PATWARDHAN, IAN BURTON, JAN CORFEE-MORLOT, CHRIS H. D.
MAGADZA, HANS-MARTIN FÜSSEL, A. BARRIE PITTOCK, ATIQ RAHMAN, AVELINO SUAREZ, AND JEAN-
PASCAL VAN YPERSELE: ASSESSING DANGEROUS CLIMATE CHANGE THROUGH AN UPDATE OF THE
INTERGOVERNMENTAL PANEL ON CLIMATE CHANGE (IPCC) “REASONS FOR CONCERN”. PROCEEDINGS
OF THE NATIONAL ACADEMY OF SCIENCES. PUBLISHED ONLINE BEFORE PRINT FEBRUARY 26, 2009, DOI:
10.1073/PNAS.0812355106. THE ARTICLE IS FREELY AVAILABLE
AT:HTTP://WWW.PNAS.ORG/CONTENT/EARLY/2009/02/25/0812355106.FULL.PDF. A COPY OF THE GRAPH
CAN BE FOUND ON APPENDIX 1.
3 UNITED NATIONS ENVIRONMENT PROGRAMME (UNEP): ‘BRIDGING THE EMISSIONS GAP’. A UNEP
SYNTHESIS REPORT, NOV. 2011.
16
WORLD ENERGY [R]EVOLUTIONA SUSTAINABLE WORLD ENERGY OUTLOOK
Energy efficiency is a sleeping giant – offering the most costcompetitive way to reform the energy sector. There is enormouspotential for reducing our consumption of energy, while providingthe same level of energy services. New business models toimplement energy efficiency must be developed and must getmore political support. This study details a series of energyefficiency measures which can substantially reduce demandacross industry, homes, business and services as well as transport.
the energy [r]evolution key principles
The expert consensus is that this fundamental shift in the way weconsume and generate energy must begin immediately and be wellunderway within the next ten years in order to avert the worstimpacts of climate change.4 The scale of the challenge requires acomplete transformation of the way we produce, consume anddistribute energy, while maintaining economic growth. The five keyprinciples behind this Energy [R]evolution will be to:
• Implement renewable solutions, especially throughdecentralised energy systems and grid expansions
• Respect the natural limits of the environment
• Phase out dirty, unsustainable energy sources
• Create greater equity in the use of resources
• Decouple economic growth from the consumption of fossil fuels
Decentralised energy systems, where power and heat areproduced close to the point of final use reduce grid loads andenergy losses in distribution. Investments in ‘climateinfrastructure’ such as smart interactive grids and transmissiongrids to transport large quantities of offshore wind andconcentrating solar power are essential. Building up clusters ofrenewable micro grids, especially for people living in remoteareas, will be a central tool in providing sustainable electricity tothe almost two billion people around who currently don’t haveaccess to electricity.
the energy [r]evolution – key results
Renewable energy sources account for 13.5% of the world’sprimary energy demand in 2009. The main source is biomass,which is mostly used in the heat sector.
For electricity generation renewables contribute about 19.3%and for heat supply, around 25%, much of this is from traditionaluses such as firewood. About 81% of the primary energy supplytoday still comes from fossil fuels and 5.5% from nuclear energy.
The Energy [R]evolution scenario describes developmentpathways to a sustainable energy supply, achieving the urgentlyneeded CO2 reduction target and a nuclear phase-out, withoutunconventional oil resources. The results of the Energy[R]evolution scenario which will be achieved through thefollowing measures:
• Curbing global energy demand: The world’s energy demand isprojected by combining population development, GDP growthand energy intensity. Under the Reference scenario, totalprimary energy demand increases by 61% from about 500 EJ(Exajoules) per year in 2009 to 806 EJ per year in 2050. Inthe Energy [R]evolution scenario, demand increases by only10% compared to current consumption until 2020 anddecreases slightly afterwards to 2009 levels.
• Controlling global power demand: Under the Energy[R]evolution scenario, electricity demand is expected toincrease disproportionately, the main growth in households andservices. With adequate efficiency measures, however, a higherincrease can be avoided, leading to electricity demand ofaround 41,000 TWh/a in 2050. Compared to the Referencescenario, efficiency measures avoid the generation of 12,800 TWh/a.
• Reducing global heating demand: Efficiency gains in the heatsupply sector are even larger than in the electricity sector.Under the Energy [R]evolution scenario, final demand for heatsupply can eventually be reduced significantly. Compared to theReference scenario, consumption equivalent to 46,500 PJ/a isavoided through efficiency measures by 2050. The lowerdemand can be achieved by energy-related renovation of theexisting stock of residential buildings, introduction of lowenergy standards; even ‘energy-plus-houses’ for new buildings,so people can enjoy the same comfort and energy services.
references4 IPCC – SPECIAL REPORT RENEWABLES, CHAPTER 1, MAY 2011.
projections to reality
Projection of global installed wind power capacity at theend of 2010 in the first Global Energy [R]evolution,published in January 2007.
>> 156 GW
Actual global installed wind capacity at the end of 2010.
>> 197 GW
While at the end of 2011 already 237 GW have beeninstalled. More needs to be done.
17
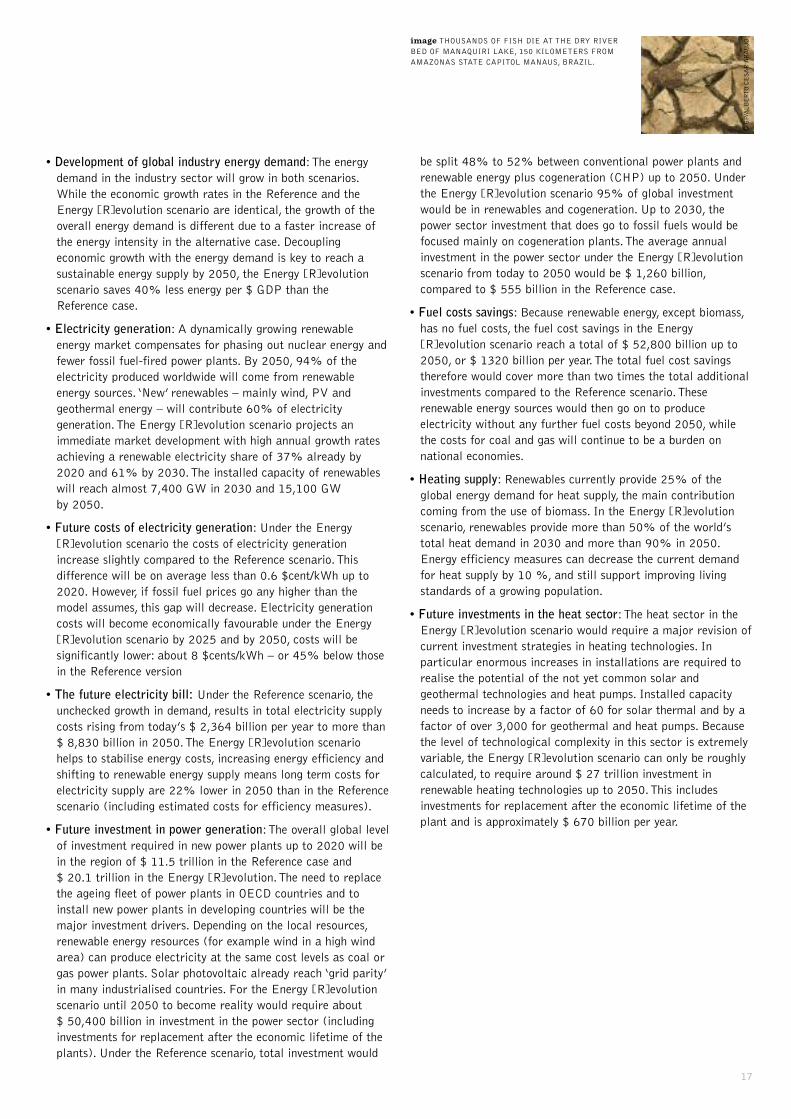
© GP/ALBERTO CESAR ARAUJOimage THOUSANDS OF FISH DIE AT THE DRY RIVER
BED OF MANAQUIRI LAKE, 150 KILOMETERS FROMAMAZONAS STATE CAPITOL MANAUS, BRAZIL.
• Development of global industry energy demand: The energydemand in the industry sector will grow in both scenarios.While the economic growth rates in the Reference and theEnergy [R]evolution scenario are identical, the growth of theoverall energy demand is different due to a faster increase ofthe energy intensity in the alternative case. Decouplingeconomic growth with the energy demand is key to reach asustainable energy supply by 2050, the Energy [R]evolutionscenario saves 40% less energy per $ GDP than the Reference case.
• Electricity generation: A dynamically growing renewableenergy market compensates for phasing out nuclear energy andfewer fossil fuel-fired power plants. By 2050, 94% of theelectricity produced worldwide will come from renewableenergy sources. ‘New’ renewables – mainly wind, PV andgeothermal energy – will contribute 60% of electricitygeneration. The Energy [R]evolution scenario projects animmediate market development with high annual growth ratesachieving a renewable electricity share of 37% already by2020 and 61% by 2030. The installed capacity of renewableswill reach almost 7,400 GW in 2030 and 15,100 GW by 2050.
• Future costs of electricity generation: Under the Energy[R]evolution scenario the costs of electricity generationincrease slightly compared to the Reference scenario. Thisdifference will be on average less than 0.6 $cent/kWh up to2020. However, if fossil fuel prices go any higher than themodel assumes, this gap will decrease. Electricity generationcosts will become economically favourable under the Energy[R]evolution scenario by 2025 and by 2050, costs will besignificantly lower: about 8 $cents/kWh – or 45% below thosein the Reference version
• The future electricity bill: Under the Reference scenario, theunchecked growth in demand, results in total electricity supplycosts rising from today’s $ 2,364 billion per year to more than$ 8,830 billion in 2050. The Energy [R]evolution scenariohelps to stabilise energy costs, increasing energy efficiency andshifting to renewable energy supply means long term costs forelectricity supply are 22% lower in 2050 than in the Referencescenario (including estimated costs for efficiency measures).
• Future investment in power generation: The overall global levelof investment required in new power plants up to 2020 will bein the region of $ 11.5 trillion in the Reference case and $ 20.1 trillion in the Energy [R]evolution. The need to replacethe ageing fleet of power plants in OECD countries and toinstall new power plants in developing countries will be themajor investment drivers. Depending on the local resources,renewable energy resources (for example wind in a high windarea) can produce electricity at the same cost levels as coal orgas power plants. Solar photovoltaic already reach ‘grid parity’in many industrialised countries. For the Energy [R]evolutionscenario until 2050 to become reality would require about $ 50,400 billion in investment in the power sector (includinginvestments for replacement after the economic lifetime of theplants). Under the Reference scenario, total investment would
be split 48% to 52% between conventional power plants andrenewable energy plus cogeneration (CHP) up to 2050. Underthe Energy [R]evolution scenario 95% of global investmentwould be in renewables and cogeneration. Up to 2030, thepower sector investment that does go to fossil fuels would befocused mainly on cogeneration plants. The average annualinvestment in the power sector under the Energy [R]evolutionscenario from today to 2050 would be $ 1,260 billion,compared to $ 555 billion in the Reference case.
• Fuel costs savings: Because renewable energy, except biomass,has no fuel costs, the fuel cost savings in the Energy[R]evolution scenario reach a total of $ 52,800 billion up to2050, or $ 1320 billion per year. The total fuel cost savingstherefore would cover more than two times the total additionalinvestments compared to the Reference scenario. Theserenewable energy sources would then go on to produceelectricity without any further fuel costs beyond 2050, whilethe costs for coal and gas will continue to be a burden onnational economies.
• Heating supply: Renewables currently provide 25% of theglobal energy demand for heat supply, the main contributioncoming from the use of biomass. In the Energy [R]evolutionscenario, renewables provide more than 50% of the world’stotal heat demand in 2030 and more than 90% in 2050.Energy efficiency measures can decrease the current demandfor heat supply by 10 %, and still support improving livingstandards of a growing population.
• Future investments in the heat sector: The heat sector in theEnergy [R]evolution scenario would require a major revision ofcurrent investment strategies in heating technologies. Inparticular enormous increases in installations are required torealise the potential of the not yet common solar andgeothermal technologies and heat pumps. Installed capacityneeds to increase by a factor of 60 for solar thermal and by afactor of over 3,000 for geothermal and heat pumps. Becausethe level of technological complexity in this sector is extremelyvariable, the Energy [R]evolution scenario can only be roughlycalculated, to require around $ 27 trillion investment inrenewable heating technologies up to 2050. This includesinvestments for replacement after the economic lifetime of theplant and is approximately $ 670 billion per year.

18
WORLD ENERGY [R]EVOLUTIONA SUSTAINABLE WORLD ENERGY OUTLOOK
• Future employment in the energy sector: The Energy[R]evolution scenario results in more global energy sector jobsat every stage of the projection.
There are 23.3 million energy sector jobs in the Energy [R]evolution in 2015, and 18.7 million in theReference scenario.
In 2020, there are 22.6 million jobs in the Energy [R]evolution scenario, and 17.8 million in the Reference scenario.
In 2030, there are 18.3 million jobs in the Energy [R]evolution scenario and 15.7 million in the Reference scenario.
There is a decline in overall job numbers under both scenariosbetween 2010 and 2030. Jobs in the coal sector declinesignificantly in both scenarios, leading to a drop of 6.8 millionenergy jobs in the Reference scenario by 2030. Strong growth inthe renewable sector leads to an increase of 4% in total energysector jobs in the Energy [R]evolution scenario by 2015. Jobnumbers fall after 2020, so jobs in the Energy [R]evolution are19% below 2010 levels at 2030. However, this is 2.5 millionmore jobs than in the Reference scenario. Renewable energyaccounts for 65% of energy jobs by 2030, with the majorityspread over wind, solar PV, solar heating, and biomass.
• Global transport: In the transport sector it is assumed that,energy consumption will continue to increase under the Energy[R]evolution scenario up to 2020 due to fast growing demandfor services. After that it falls back to the level of the currentdemand by 2050. Compared to the Reference scenario,transport energy demand is reduced overall by 60% or about90,000 PJ/a by 2050. Energy demand for transport under theEnergy [R]evolution scenario will therefore increase between2009 and 2050 by only 26% to about 60,500 PJ/a.Significant savings are made from a shift towards smaller carstriggered by economic incentives together with a significantshift in propulsion technology towards electrified power trains –together with reducing vehicle kilometres travelled per year. In2030, electricity will provide 12% of the transport sector’stotal energy demand in the Energy [R]evolution, while in 2050the share will be 44%.
• Primary energy consumption: Under the Energy [R]evolutionscenario the overall primary energy demand will be reduced by40% in 2050 compared to the Reference scenario. In thisprojection almost the entire global electricity supply, includingthe majority of the energy used in buildings and industry, wouldcome from renewable energy sources. The transport sector, inparticular aviation and shipping, would be the last sector tobecome fossil fuel free.
• Development of CO2 emissions: Worldwide CO2 emissions in theReference case will increase by 62% while under the Energy[R]evolution scenario they will decrease from 27,925 milliontons in 2009 to 3,076 million t in 2050. Annual per capitaemissions will drop from 4.1 tonne CO2 to 2.4 tonne CO2 in2030 and 0.3 tonne CO2 in 2050. Even with a phase out ofnuclear energy and increasing demand, CO2 emissions willdecrease in the electricity sector. In the long term, efficiencygains and greater use of renewable electricity for vehicles willalso reduce emissions in the transport sector. With a share of33% of CO2 emissions in 2050, the transport sector will be themain source of emissions ahead of the industry and powergeneration. By 2050 the Global Energy related CO2 emissionsare 85% under 1990 levels.
policy changes
To make the Energy [R]evolution real and to avoid dangerousclimate change, Greenpeace, GWEC and EREC demand that the following policies and actions are implemented in the energy sector:
1. Phase out all subsidies for fossil fuels and nuclear energy.
2. Internalise the external (social and environmental) costs ofenergy production through ‘cap and trade’ emissions trading.
3. Mandate strict efficiency standards for all energy consumingappliances, buildings and vehicles.
4. Establish legally binding targets for renewable energy andcombined heat and power generation.
5. Reform the electricity markets by guaranteeing priorityaccess to the grid for renewable power generators.
6. Provide defined and stable returns for investors, for exampleby feed-in tariff programmes.
7. Implement better labelling and disclosure mechanisms toprovide more environmental product information.
8. Increase research and development budgets for renewableenergy and energy efficiency.

19
1climate and energy policy
image HURRICANE BUD FORMING OVER THE EASTERN PACIFIC OCEAN, MAY 2012.
THE UNFCCC AND THE KYOTO PROTOCOL
INTERNATIONAL ENERGY POLICY
RENEWABLE ENERGY TARGETS
POLICY CHANGES IN THE ENERGY SECTOR
FTSM: A SPECIAL FEED-IN LAWPROPOSAL FOR DEVELOPINGCOUNTRIES
FINANCING THE ENERGY[R]EVOLUTION WITH FTSM
bridgingthe gap”“
© NASA/JEFF SCHMALTZ
1
If we do not take urgent and immediate action to protect theclimate, the threats from climate change could become irreversible.
The goal of climate policy should be to keep the global meantemperature rise to less than 2°C above pre-industrial levels. Wehave very little time within which we can change our energysystem to meet these targets. This means that global emissionswill have to peak and start to decline by the end of the nextdecade at the latest.
The only way forwards is a rapid reduction in the emission ofgreenhouse gases into the atmosphere.
1.1 the UNFCCC and the kyoto protocol
Recognising the global threats of climate change, the signatoriesto the 1992 UN Framework Convention on Climate Change(UNFCCC) agreed the Kyoto Protocol in 1997. The Protocolentered into force in early 2005 and its 193 members meetcontinuously to negotiate further refinement and development ofthe agreement. Only one major industrialised nation, the UnitedStates, has not ratified the protocol. In 2011, Canada announcedits intention to withdraw from the protocol.
In Copenhagen in 2009, the 195 members of the UNFCCC weresupposed to deliver a new climate change agreement towardsambitious and fair emission reductions. Unfortunately theambition to reach such an agreement failed at this conference.
At the 2012 Conference of the Parties in Durban, there wasagreement to reach a new agreement by 2015. There is alsoagreement to adopt a second commitment period at the end of2012. However, the United Nations Environment Program’sexamination of the climate action pledges for 2020 shows thatthere is still a major gap between what the science demands tocurb climate change and what the countries plan to do. Theproposed mitigation pledges put forward by governments arelikely to allow global warming to at least 2.5 to 5 degreestemperature increase above pre-industrial levels.5
This means that the new agreement in 2015, with the FifthAssessment Report of the IPCC on its heels, should strive forclimate action for 2020 that ensures that the world stay as farbelow an average temperature increase of 2°C as possible. Such anagreement will need to ensure:
• That industrialised countries reduce their emissions on averageby at least 40% by 2020 compared to their 1990 level.
• That industrialised countries provide funding of at least $140billion a year to developing countries under the newly establishedGreen Climate Fund to enable them to adapt to climate change,protect their forests and be part of the energy revolution.
• That developing countries reduce their greenhouse gas emissionsby 15 to 30% compared to their projected growth by 2020.
1.2 international energy policy
At present there is a distortion in many energy markets, whererenewable energy generators have to compete with old nuclearand fossil fuel power stations but not on a level playing field. Thisis because consumers and taxpayers have already paid theinterest and depreciation on the original investments so thegenerators are running at a marginal cost. Political action isneeded to overcome market distortions so renewable energytechnologies can compete on their own merits.
While governments around the world are liberalising theirelectricity markets, the increasing competitiveness of renewableenergy should lead to higher demand. Without political support,however, renewable energy remains at a disadvantage,marginalised because there has been decades of massivefinancial, political and structural support to conventionaltechnologies. Developing renewables will therefore require strongpolitical and economic efforts for example, through laws thatguarantee stable tariffs over a period of up to 20 years.Renewable energy will also contribute to sustainable economicgrowth, high quality jobs, technology development, globalcompetitiveness and industrial and research leadership.
1.3 renewable energy targets
A growing number of countries have established targets forrenewable energy in order to reduce greenhouse emissions andincrease energy security. Targets are usually expressed asinstalled capacity or as a percentage of energy consumption andthey are important catalysts for increasing the share ofrenewable energy worldwide.
However, in the electricity sector the investment horizon can beup to 40 years. Renewable energy targets therefore need to haveshort, medium and long term steps and must be legally binding inorder to be effective. They should also be supported by incentivemechanisms such as feed-in tariffs for renewable electricitygeneration. To get significant increases in the proportion ofrenewable energy, targets must be set in accordance with thelocal potential for each technology (wind, solar, biomass etc) andbe complemented by policies that develop the skills andmanufacturing bases to deliver the agreed quantity.
20
box 1.1: what does the kyoto protocol do?
The Kyoto Protocol commits 193 countries (signatories) toreduce their greenhouse gas emissions by 5.2% from their1990 level. The global target period to achieve cuts was2008-2012. Under the protocol, many countries andregions have adopted regional and national reductiontargets. The European Union commitment is for overallreduction of 8%, for example. In order to help reach thistarget, the EU also created a target to increase itsproportion of renewable energy from 6% to 12% by 2010.
reference5 UNEP EMISSIONS GAP REPORT.
1
climate &
energ
y policy
|THE UNFCCC & THE KYOTO PROTOCOL, IN
TERNATIONAL ENERGY POLICY, R
ENEWABLE ENERGY TARGETS
1
climate &
energ
y policy
|POLICY CHANGES IN
THE ENERGY SECTOR
21
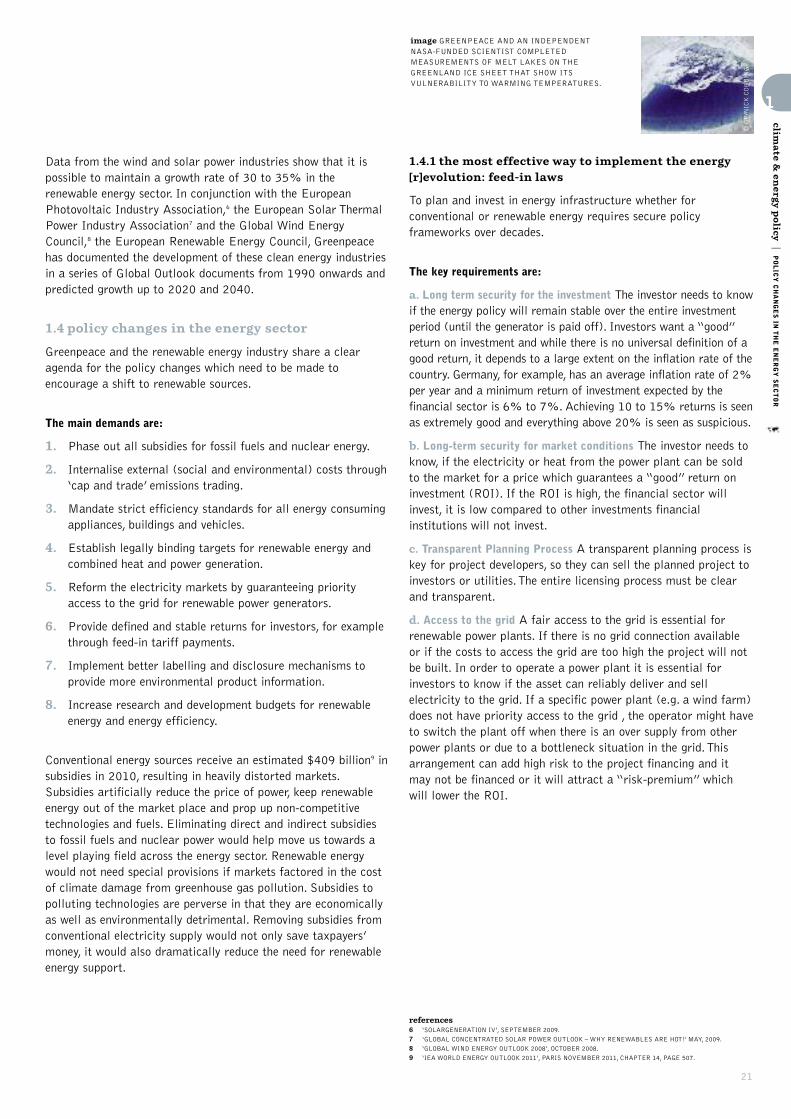
© GP/NICK COBBING
image GREENPEACE AND AN INDEPENDENT NASA-FUNDED SCIENTIST COMPLETEDMEASUREMENTS OF MELT LAKES ON THEGREENLAND ICE SHEET THAT SHOW ITSVULNERABILITY TO WARMING TEMPERATURES.
Data from the wind and solar power industries show that it ispossible to maintain a growth rate of 30 to 35% in therenewable energy sector. In conjunction with the EuropeanPhotovoltaic Industry Association,6 the European Solar ThermalPower Industry Association7 and the Global Wind EnergyCouncil,8 the European Renewable Energy Council, Greenpeacehas documented the development of these clean energy industriesin a series of Global Outlook documents from 1990 onwards andpredicted growth up to 2020 and 2040.
1.4 policy changes in the energy sector
Greenpeace and the renewable energy industry share a clearagenda for the policy changes which need to be made toencourage a shift to renewable sources.
The main demands are:
1. Phase out all subsidies for fossil fuels and nuclear energy.
2. Internalise external (social and environmental) costs through‘cap and trade’ emissions trading.
3. Mandate strict efficiency standards for all energy consumingappliances, buildings and vehicles.
4. Establish legally binding targets for renewable energy andcombined heat and power generation.
5. Reform the electricity markets by guaranteeing priorityaccess to the grid for renewable power generators.
6. Provide defined and stable returns for investors, for examplethrough feed-in tariff payments.
7. Implement better labelling and disclosure mechanisms toprovide more environmental product information.
8. Increase research and development budgets for renewableenergy and energy efficiency.
Conventional energy sources receive an estimated $409 billion9 insubsidies in 2010, resulting in heavily distorted markets.Subsidies artificially reduce the price of power, keep renewableenergy out of the market place and prop up non-competitivetechnologies and fuels. Eliminating direct and indirect subsidiesto fossil fuels and nuclear power would help move us towards alevel playing field across the energy sector. Renewable energywould not need special provisions if markets factored in the costof climate damage from greenhouse gas pollution. Subsidies topolluting technologies are perverse in that they are economicallyas well as environmentally detrimental. Removing subsidies fromconventional electricity supply would not only save taxpayers’money, it would also dramatically reduce the need for renewableenergy support.
1.4.1 the most effective way to implement the energy[r]evolution: feed-in laws
To plan and invest in energy infrastructure whether forconventional or renewable energy requires secure policyframeworks over decades.
The key requirements are:
a. Long term security for the investment The investor needs to knowif the energy policy will remain stable over the entire investmentperiod (until the generator is paid off). Investors want a “good”return on investment and while there is no universal definition of agood return, it depends to a large extent on the inflation rate of thecountry. Germany, for example, has an average inflation rate of 2%per year and a minimum return of investment expected by thefinancial sector is 6% to 7%. Achieving 10 to 15% returns is seenas extremely good and everything above 20% is seen as suspicious.
b. Long-term security for market conditions The investor needs toknow, if the electricity or heat from the power plant can be soldto the market for a price which guarantees a “good” return oninvestment (ROI). If the ROI is high, the financial sector willinvest, it is low compared to other investments financialinstitutions will not invest.
c. Transparent Planning Process A transparent planning process iskey for project developers, so they can sell the planned project toinvestors or utilities. The entire licensing process must be clearand transparent.
d. Access to the grid A fair access to the grid is essential forrenewable power plants. If there is no grid connection availableor if the costs to access the grid are too high the project will notbe built. In order to operate a power plant it is essential forinvestors to know if the asset can reliably deliver and sellelectricity to the grid. If a specific power plant (e.g. a wind farm)does not have priority access to the grid , the operator might haveto switch the plant off when there is an over supply from otherpower plants or due to a bottleneck situation in the grid. Thisarrangement can add high risk to the project financing and itmay not be financed or it will attract a “risk-premium” whichwill lower the ROI.
references6 ‘SOLARGENERATION IV’, SEPTEMBER 2009.
7 ‘GLOBAL CONCENTRATED SOLAR POWER OUTLOOK – WHY RENEWABLES ARE HOT!’ MAY, 2009.
8 ‘GLOBAL WIND ENERGY OUTLOOK 2008’, OCTOBER 2008.
9 ‘IEA WORLD ENERGY OUTLOOK 2011’, PARIS NOVEMBER 2011, CHAPTER 14, PAGE 507.

WORLD ENERGY [R]EVOLUTIONA SUSTAINABLE WORLD ENERGY OUTLOOK
1
climate &
energ
y policy
|POLICY CHANGES IN
THE ENERGY SECTOR
22
box 1.2: example of a sustainable feed-in tariff
The German Feed-in Law (“Erneuerbare Energien Gesetz” =EEG) is among the most effective pieces of legislation tophase in renewable energy technologies. Greenpeace supportsthis law and encourages other countries to implement a similareffective renewable energy law.
Structure of the German renewable energy Act:
a. Definitions & Purpose Chapter 1 of the law provides ageneral overview about the purpose, the scope of theapplications, specific definitions for all used terms in the lawas well as the statutory obligation.
b. Regulation of all grid related issues Chapter 2 of the lawprovides the general provisions of grid connection, technical andoperational requirements, how to establish and use gridconnection and how the renewable electricity purchase, thetransmission and distribution of this electricity must be organised.
c. Regulation how for grid expansion and renewable powermanagement in the grid This part of the law regulates the gridcapacity expansion and feed-in management, how to organisethe compensation for required grid expansion, the feed-inmanagement and a hardship clause.
d. Regulations for all tariff-related subjects This part provides thegeneral provisions regarding tariffs, the payment claims, how toorganise direct sale of renewable electricity, how to calculate thetariffs, details about tariffs paid for electricity from severalinstallations, the degression rate for each technology as well asthe commencement and duration of tariff payment and settingof payment claims. There are special provisions regarding tariffsfor the different fuel sources (hydropower, landfill gas, sewagetreatment gas, mine gas, biomass, geothermal energy, windenergy – re-powering, offshore wind energy, solar power, rooftopinstallations for solar radiation).
e. Equalisation scheme This part defines how to organise thenationwide equalisation scheme for the payment of all feed-intariffs. The delivery to transmission system operator, tariffspaid by transmission system operator, the equalisation amongsttransmission system operators, the delivery to suppliers,subsequent corrections and advance payments
f. Special regulations for energy intensive industries The partdefines the special equalisation scheme for electricity-intensiveenterprises and rail operators, the basic principle, the list ofsectors which are excluded from the payment of feed-in lawcosts and how to apply for this exclusion.
g. Transparency Regulations This part established a detailedprocess how to make the entire process transparent andpublicly accessible to minimise corruption, false treatments ofconsumers, or some scale power plant operators. Theregulations provides the basic information principles forinstallation operators, grid system operators, transmissionsystem operators, utility companies, certification, data to beprovided to the Federal Network Agency (the governmentalcontrol body for all 800 grid operators in Germany), data tobe made public, notification regulations, details for billing.
Another subchapter identifies regulations for the guarantee oforigin of the renewable electricity feed into the grid and theprohibition of multiple sales.
h. Legal roles and responsibilities This part identifies the legalprotection and official procedure for clearing house andconsumer protection, temporary legal protection, use ofmaritime shipping lanes, tasks of the Federal Network AgencyAdministrative fines provisions and supervision.
i. Governmental procedures to control and review the law on aregular basis Authorisation to issue ordinances, when and howto commission the progress report (published every secondyear to capture lessons learned and to change regulationwhich do not work), transitional provisions, authorisation toissue ordinances and transitional provisions.

23
1
climate &
energ
y policy
|POLICY CHANGES IN
THE ENERGY SECTOR
1.4.2 bankable renewable energy support schemes
Since the early development of renewable energies within thepower sector, there has been an ongoing debate about the bestand most effective type of support scheme. The EuropeanCommission published a survey in December 2005 whichconcluded that feed -in tariffs are by far the most efficient andsuccessful mechanism. A more recent update of this report,presented in March 2010 at the IEA Renewable EnergyWorkshop by the Fraunhofer Institute10 underscores the sameconclusion. The Stern Review on the Economics of ClimateChange also concluded that feed -in tariffs “achieve largerdeployment at lower costs”. Globally more than 40 countrieshave adopted some version of the system.
Although the organisational form of these tariffs differs fromcountry to country some criteria have emerged as essential forsuccessful renewable energy policy. At the heart of these is areliable, bankable support scheme for renewable projects whichprovides long term stability and certainty.11 Bankable supportschemes result in lower-cost projects because they lower the riskfor both investors and equipment suppliers. The cost of wind -powered electricity in Germany is up to 40% cheaper than in theUnited Kingdom,12 for example, because the support system ismore secure and reliable.
For developing countries, feed -in laws would be an idealmechanism to boost development of new renewable energies. Theextra costs to consumers’ electricity bills are an obstacle forcountries with low average incomes. In order to enabletechnology transfer from Annex 1 countries under the KyotoProtocol to developing countries, a mix of a feed -in law,international finance and emissions trading could establish alocally-based renewable energy infrastructure and industry withhelp from the wealthier countries.
Finance for renewable energy projects is one of the mainobstacles in developing countries. While large scale projects havefewer funding problems, there are difficulties for small,community-based projects, even though they have a high degreeof public support. The experiences from micro credits for smallhydro projects in Bangladesh, for example, or wind farms inDenmark and Germany, show how economic benefits can flow tothe local community. With careful project planning based on goodlocal knowledge and understanding, projects can achieve localinvolvement and acceptance. When the community identifies theproject rather than the project identifying the community, theresult is generally faster bottom- up growth of the renewableenergy sector.
The four main elements for successful renewable energy supportschemes are therefore:
• A clear, bankable pricing system.
• Priority access to the grid with clear identification of who isresponsible for the connection, and how it is incentivised.
• Clear, simple administrative and planning permissionprocedures.
• Public acceptance/support.
The first is fundamentally important, but it is no good if youdon’t have the other three elements as well.
box 1.3: experience of feed -in tariffs
• Feed- in tariffs are seen as the best way forward,especially in developing countries. By 2009 this systemhas created an incentive for 75% of PV capacityworldwide and 45% of wind capacity.
• Based on experience, feed- in tariffs are the most effectivemechanism to create a stable framework to build adomestic market for renewable energy. They have thelowest investment risk, highest technology diversity,lowest windfall profits for mature technologies andattract a broad spectrum of investors.13
• The main argument against them is the increase inelectricity prices for households and industry, because theextra costs are shared across all customers. This isparticularly difficult for developing countries, wheremany people can’t afford to spend more money forelectricity services.
references10 EFFECTIVE AND EFFICIENT LONG-TERM ORIENTED RENEWABLE ENERGY SUPPORT POLICIES,
FRAUNHOFER INSTITUTE, MARIO RAGWITZ, MARCH 2010.
11 ‘THE SUPPORT OF ELECTRICITY FROM RENEWABLE ENERGY SOURCES’, EUROPEAN COMMISSION, 2005.
12 SEE ABOVE REPORT, P. 27, FIGURE 4.
13 EFFECTIVE AND EFFICIENT LONG-TERM ORIENTED RENEWABLE ENERGY SUPPORT POLICIES,
FRAUNHOFER INSTITUTE, MARIO RAGWITZ, MARCH 2010.
© GP/JOHN NOVIS
image WANG WAN YI, AGE 76, ADJUSTS THESUNLIGHT POINT ON A SOLAR DEVICE USED TOBOIL HIS KETTLE. HE LIVES WITH HIS WIFE IN ONEROOM CARVED OUT OF THE SANDSTONE, A TYPICALDWELLING FOR LOCAL PEOPLE IN THE REGION.DROUGHT IS ONE OF THE MOST HARMFUL NATURALHAZARDS IN NORTHWEST CHINA. CLIMATE CHANGEHAS A SIGNIFICANT IMPACT ON CHINA’SENVIRONMENT AND ECONOMY.
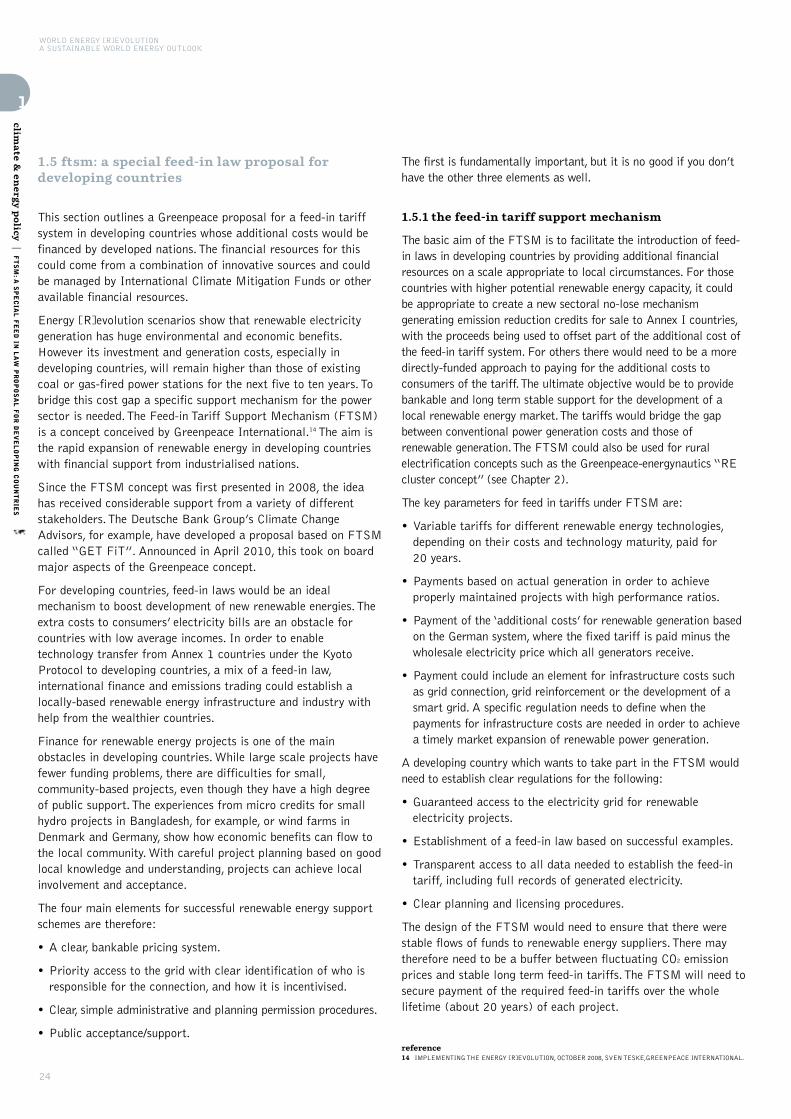
1.5 ftsm: a special feed-in law proposal fordeveloping countries
This section outlines a Greenpeace proposal for a feed-in tariffsystem in developing countries whose additional costs would befinanced by developed nations. The financial resources for thiscould come from a combination of innovative sources and couldbe managed by International Climate Mitigation Funds or otheravailable financial resources.
Energy [R]evolution scenarios show that renewable electricitygeneration has huge environmental and economic benefits.However its investment and generation costs, especially indeveloping countries, will remain higher than those of existingcoal or gas-fired power stations for the next five to ten years. Tobridge this cost gap a specific support mechanism for the powersector is needed. The Feed-in Tariff Support Mechanism (FTSM)is a concept conceived by Greenpeace International.14 The aim isthe rapid expansion of renewable energy in developing countrieswith financial support from industrialised nations.
Since the FTSM concept was first presented in 2008, the ideahas received considerable support from a variety of differentstakeholders. The Deutsche Bank Group’s Climate ChangeAdvisors, for example, have developed a proposal based on FTSMcalled “GET FiT”. Announced in April 2010, this took on boardmajor aspects of the Greenpeace concept.
For developing countries, feed-in laws would be an idealmechanism to boost development of new renewable energies. Theextra costs to consumers’ electricity bills are an obstacle forcountries with low average incomes. In order to enabletechnology transfer from Annex 1 countries under the KyotoProtocol to developing countries, a mix of a feed-in law,international finance and emissions trading could establish alocally-based renewable energy infrastructure and industry withhelp from the wealthier countries.
Finance for renewable energy projects is one of the mainobstacles in developing countries. While large scale projects havefewer funding problems, there are difficulties for small,community-based projects, even though they have a high degreeof public support. The experiences from micro credits for smallhydro projects in Bangladesh, for example, or wind farms inDenmark and Germany, show how economic benefits can flow tothe local community. With careful project planning based on goodlocal knowledge and understanding, projects can achieve localinvolvement and acceptance.
The four main elements for successful renewable energy supportschemes are therefore:
• A clear, bankable pricing system.
• Priority access to the grid with clear identification of who isresponsible for the connection, and how it is incentivised.
• Clear, simple administrative and planning permission procedures.
• Public acceptance/support.
The first is fundamentally important, but it is no good if you don’thave the other three elements as well.
1.5.1 the feed-in tariff support mechanism
The basic aim of the FTSM is to facilitate the introduction of feed-in laws in developing countries by providing additional financialresources on a scale appropriate to local circumstances. For thosecountries with higher potential renewable energy capacity, it couldbe appropriate to create a new sectoral no-lose mechanismgenerating emission reduction credits for sale to Annex I countries,with the proceeds being used to offset part of the additional cost ofthe feed-in tariff system. For others there would need to be a moredirectly-funded approach to paying for the additional costs toconsumers of the tariff. The ultimate objective would be to providebankable and long term stable support for the development of alocal renewable energy market. The tariffs would bridge the gapbetween conventional power generation costs and those ofrenewable generation. The FTSM could also be used for ruralelectrification concepts such as the Greenpeace-energynautics “REcluster concept” (see Chapter 2).
The key parameters for feed in tariffs under FTSM are:
• Variable tariffs for different renewable energy technologies,depending on their costs and technology maturity, paid for 20 years.
• Payments based on actual generation in order to achieveproperly maintained projects with high performance ratios.
• Payment of the ‘additional costs’ for renewable generation basedon the German system, where the fixed tariff is paid minus thewholesale electricity price which all generators receive.
• Payment could include an element for infrastructure costs suchas grid connection, grid reinforcement or the development of asmart grid. A specific regulation needs to define when thepayments for infrastructure costs are needed in order to achievea timely market expansion of renewable power generation.
A developing country which wants to take part in the FTSM wouldneed to establish clear regulations for the following:
• Guaranteed access to the electricity grid for renewableelectricity projects.
• Establishment of a feed-in law based on successful examples.
• Transparent access to all data needed to establish the feed-intariff, including full records of generated electricity.
• Clear planning and licensing procedures.
The design of the FTSM would need to ensure that there werestable flows of funds to renewable energy suppliers. There maytherefore need to be a buffer between fluctuating CO2 emissionprices and stable long term feed-in tariffs. The FTSM will need tosecure payment of the required feed-in tariffs over the wholelifetime (about 20 years) of each project.
WORLD ENERGY [R]EVOLUTIONA SUSTAINABLE WORLD ENERGY OUTLOOK
24
1
climate &
energ
y policy
|FTSM: A SPECIAL FEED IN
LAW PROPOSAL FOR DEVELOPING COUNTRIES
reference14 IMPLEMENTING THE ENERGY [R]EVOLUTION, OCTOBER 2008, SVEN TESKE,GREENPEACE INTERNATIONAL.

25
© LANGROCK/ZENIT/GP
image THE WIND TURBINES ARE GOING TO BEUSED FOR THE CONSTRUCTION OF AN OFFSHOREWINDFARM AT MIDDELGRUNDEN WHICH IS CLOSE TO COPENHAGEN, DENMARK.
1
climate &
energ
y policy
|FTSM: A SPECIAL FEED IN
LAW PROPOSAL FOR DEVELOPING COUNTRIES
In order to be eligible, all renewable energy projects must have aclear set of environmental criteria which are built into nationallicensing procedure in the country where the project will generateelectricity. The criteria’s minimum environmental standards will needto be defined by an independent monitoring group. If there arealready acceptable criteria developed these should be adopted ratherthan reinventing the wheel. The members of the monitoring groupwould include NGOs, energy and finance experts as well as membersof the governments involved. Funding will not be made available forspeculative investments, only as soft loans for FTSM projects.
The FTSM would also seek to create the conditions for privatesector actors, such as local banks and energy service companies,to gain experience in technology development, projectdevelopment, project financing and operation and maintenance inorder to develop track records which would help reduce barriersto further renewable energy development.
The key parameters for the FTSM fund will be:
• The mechanism will guarantee payment of the feed-in tariffs overa period of 20 years as long as the project is operated properly.
• The mechanism will receive annual income from emissionstrading or from direct funding.
• The mechanism will pay feed-in tariffs annually only on thebasis of generated electricity.
• Every FTSM project must have a professional maintenancecompany to ensure high availability.
• The grid operator must do its own monitoring and sendgeneration data to the FTSM fund. Data from the projectmanagers and grid operators will be compared regularly tocheck consistency.
FTSMroles and responsibilities
developing country:
Legislation:• feed-in law• guaranteed grid access• licensing
(inter-) national finance institute(s)
Organizing and Monitoring:• organize financial flow• monitoring• providing soft loans• guarantee the payment of the feed-in tariff
OECD country
Legislation:• CO2 credits under CDM• tax from Cap & Trade• auctioning CO2 Certificates
figure 1.1: ftsm scheme

26
2
2the energy [r]evolution concept
image TIKEHAU ATOLL, FRENCH POLYNESIA. THE ISLANDS AND CORAL ATOLLS OF FRENCH POLYNESIA, LOCATED IN THE SOUTHERN PACIFIC OCEAN, EPITOMIZE THE IDEA OFTROPICAL PARADISE: WHITE SANDY BEACHES, TURQUOISE LAGOONS, AND PALM TREES. EVEN FROM THE DISTANCE OF SPACE, THE VIEW OF THESE ATOLLS IS BEAUTIFUL.
KEY PRINCIPLES
THE “3 STEP IMPLEMENTATION”
THE NEW ELECTRICITY GRID CASE STUDY GERMANY CASE STUDY BIHAR, INDIA
smart use,generation
and distribution are at the core of the concept”
“
© NASA/JESSE ALLEN

27
2The expert consensus is that this fundamental shift in the way weconsume and generate energy must begin immediately and be wellunderway within the next ten years in order to avert the worstimpacts of climate change.15 The scale of the challenge requires acomplete transformation of the way we produce, consume anddistribute energy, while maintaining economic growth. Nothingshort of such a revolution will enable us to limit global warmingto a rise in temperature of lower than 2°C, above which theimpacts become devastating. This chapter explains the basicprinciples and strategic approach of the Energy [R]evolutionconcept, which is basis for the scenario modelling since the veryfirst Energy [R]evolution scenario published in 2005. However,this concept has been constantly improved as technologiesdevelops and new technical and economical possibilities emerge.
Current electricity generation relies mainly on burning fossil fuelsin very large power stations which generate carbon dioxide andalso waste much of their primary input energy. More energy islost as the power is moved around the electricity network and isconverted from high transmission voltage down to a supplysuitable for domestic or commercial consumers. The system isvulnerable to disruption: localised technical, weather-related oreven deliberately caused faults can quickly cascade, resulting inwidespread blackouts. Whichever technology generates theelectricity within this old fashioned configuration, it will inevitablybe subject to some, or all, of these problems. At the core of theEnergy [R]evolution there therefore there are change boths to theway that energy is produced and distributed.
2.1 key principles
The Energy [R]evolution can be achieved by adhering to five key principles:
1. Respect natural limits – phase out fossil fuels by the end of thiscenturyWe must learn to respect natural limits. There is only somuch carbon that the atmosphere can absorb. Each year we emitalmost 30 billion tonnes of carbon equivalent; we are literallyfilling up the sky. Geological resources of coal could provideseveral hundred years of fuel, but we cannot burn them and keepwithin safe limits. Oil and coal development must be ended.
The Energy [R]evolution scenario has a target to reduceenergy related CO2 emissions to a maximum of 3.5 Gigatonnes (Gt) by 2050 and phase out over 80% offossil fuels by 2050.
2. Equity and fair access to energy As long as there are naturallimits there needs to be a fair distribution of benefits and costswithin societies, between nations and between present and futuregenerations. At one extreme, a third of the world’s populationhas no access to electricity, whilst the most industrialisedcountries consume much more than their fair share.
The effects of climate change on the poorest communitiesare exacerbated by massive global energy inequality. If weare to address climate change, one of the principles must beequity and fairness, so that the benefits of energy services –such as light, heat, power and transport – are available forall: north and south, rich and poor. Only in this way can wecreate true energy security, as well as the conditions forgenuine human wellbeing.
The Energy [R]evolution scenario has a target to achieveenergy equity as soon as technically possible. By 2050 theaverage per capita emission should be between 0.5 and 1tonne of CO2.
3. Implement clean, renewable solutions and decentralise energysystems There is no energy shortage. All we need to do is useexisting technologies to harness energy effectively andefficiently. Renewable energy and energy efficiency measuresare ready, viable and increasingly competitive. Wind, solarand other renewable energy technologies have experienceddouble digit market growth for the past decade.16
Just as climate change is real, so is the renewable energy sector.Sustainable decentralised energy systems produce less carbonemissions, are cheaper and involve less dependence on importedfuel. They create more jobs and empower local communities.Decentralised systems are more secure and more efficient. Thisis what the Energy [R]evolution must aim to create.
To stop the earth’s climate spinning out of control, most ofthe world’s fossil fuel reserves – coal, oil and gas – mustremain in the ground. Our goal is for humans to live withinthe natural limits of our small planet.
4. Decouple growth from fossil fuel use Starting in the developedcountries, economic growth must be fully decoupled fromfossil fuel usage. It is a fallacy to suggest that economicgrowth must be predicated on their increased combustion.
We need to use the energy we produce much more efficiently,and we need to make the transition to renewable energy andaway from fossil fuels quickly in order to enable clean andsustainable growth.
5.Phase out dirty, unsustainable energyWe need to phase out coaland nuclear power. We cannot continue to build coal plants ata time when emissions pose a real and present danger to bothecosystems and people. And we cannot continue to fuel themyriad nuclear threats by pretending nuclear power can in anyway help to combat climate change. There is no role fornuclear power in the Energy [R]evolution.
“THE STONE AGE DID NOT END FOR LACK OF STONE, AND THE OIL
AGE WILL END LONG BEFORE THE WORLD RUNS OUT OF OIL.”
Sheikh Zaki Yamani, former Saudi Arabian oil minister
references15 IPCC – SPECIAL REPORT RENEWABLES, CHAPTER 1, MAY 2011.
16 REN 21, RENEWABLE ENERGY STATUS REPORT 2012, JUNE 2012.
© GP/EMMA STONER
image A WOMAN STUDIES SOLAR POWER SYSTEMS ATTHE BAREFOOT COLLEGE. THE COLLEGE SPECIALISESIN SUSTAINABLE DEVELOPMENT AND PROVIDES ASPACE WHERE STUDENTS FROM ALL OVER THE WORLDCAN LEARN TO UTILISE RENEWABLE ENERGY. THESTUDENTS TAKE THEIR NEW SKILLS HOME AND GIVETHEIR VILLAGES CLEAN ENERGY.
the en
ergy [r]evo
lutio
n co
ncep
t|KEY PRINCIPLES

2.2 the “3 step implementation”
In 2009, renewable energy sources accounted for 13% of theworld’s primary energy demand. Biomass, which is mostly usedfor heating, was the main renewable energy source. The share ofrenewable energy in electricity generation was 18%. About 81%of primary energy supply today still comes from fossil fuels.17
Now is the time to make substantial structural changes in the energyand power sector within the next decade. Many power plants inindustrialised countries, such as the USA, Japan and the EuropeanUnion, are nearing retirement; more than half of all operating powerplants are over 20 years old. At the same time developing countries,such as China, India, South Africa and Brazil, are looking to satisfythe growing energy demand created by their expanding economies.
Within this decade, the power sector will decide how newelectricity demand will be met, either by fossil and nuclear fuelsor by the efficient use of renewable energy. The Energy[R]evolution scenario puts forwards a policy and technical modelfor renewable energy and cogeneration combined with energyefficiency to meet the world’s needs.
Both renewable energy and cogeneration on a large scale andthrough decentralised, smaller units – have to grow faster thanoverall global energy demand. Both approaches must replace oldgenerating technologies and deliver the additional energy requiredin the developing world.
A transition phase is required to build up the necessaryinfrastructure because it is not possible to switch directly from alarge scale fossil and nuclear fuel based energy system to a fullrenewable energy supply. Whilst remaining firmly committed to thepromotion of renewable sources of energy, we appreciate thatconventional natural gas, used in appropriately scaled cogenerationplants, is valuable as a transition fuel, and can also drive cost-effective decentralisation of the energy infrastructure. With warmer
summers, tri-generation which incorporates heat-fired absorptionchillers to deliver cooling capacity in addition to heat and power,will become a valuable means of achieving emissions reductions.The Energy [R]evolution envisages a development pathway whichturns the present energy supply structure into a sustainable system.There are three main stages to this.
Step 1: energy efficiency and equity The Energy [R]evolutionmakes an ambitious exploitation of the potential for energyefficiency. It focuses on current best practice and technologiesthat will become available in the future, assuming continuousinnovation. The energy savings are fairly equally distributed overthe three sectors – industry, transport and domestic/business.Intelligent use, not abstinence, is the basic philosophy.
The most important energy saving options are improved heatinsulation and building design, super efficient electrical machines anddrives, replacement of old style electrical heating systems byrenewable heat production (such as solar collectors) and a reductionin energy consumption by vehicles used for goods and passengertraffic. Industrialised countries currently use energy in the mostinefficient way and can reduce their consumption drastically withoutthe loss of either housing comfort or information and entertainmentelectronics. The Energy [R]evolution scenario depends on energysaved in OECD countries to meet the increasing power requirementsin developing countries. The ultimate goal is stabilisation of globalenergy consumption within the next two decades. At the same timethe aim is to create ‘energy equity’ – shifting towards a fairerworldwide distribution of efficiently-used supply.
A dramatic reduction in primary energy demand compared to theReference scenario – but with the same GDP and populationdevelopment – is a crucial prerequisite for achieving a significantshare of renewable energy sources in the overall energy supplysystem, compensating for the phasing out of nuclear energy andreducing the consumption of fossil fuels.
WORLD ENERGY [R]EVOLUTIONA SUSTAINABLE WORLD ENERGY OUTLOOK
2
the en
ergy [r]evo
lutio
n co
ncep
t|KEY PRINCIPLES
28
reference17 ‘IEA WORLD ENERGY OUTLOOK 2011, PARIS NOVEMBER 2011.
© DREAMSTIME
figure 2.1: centralised generation systems waste more than two thirds of their original energy input
© DREAMSTIME
100 units >>ENERGY WITHIN FOSSIL FUEL
61.5 units LOST THROUGH INEFFICIENT
GENERATION AND HEAT WASTAGE
3.5 units LOST THROUGH TRANSMISSION
AND DISTRIBUTION
13 units WASTED THROUGH
INEFFICIENT END USE
38.5 units >>OF ENERGY FED TO NATIONAL GRID
35 units >>OF ENERGY SUPPLIED
22 unitsOF ENERGYACTUALLY UTILISED
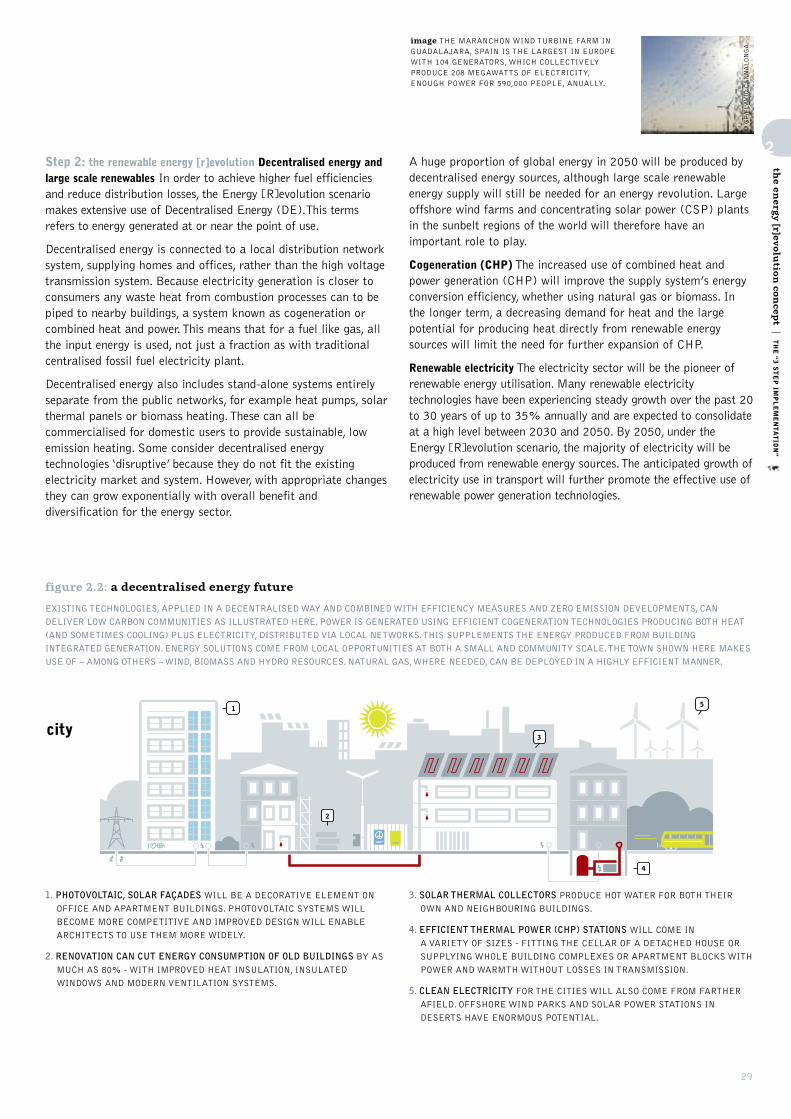
2
the en
ergy [r]evo
lutio
n co
ncep
t|THE “3 STEP IM
PLEMENTATION”
29
© GP/FLAVIO CANNALONGA
image THE MARANCHON WIND TURBINE FARM INGUADALAJARA, SPAIN IS THE LARGEST IN EUROPEWITH 104 GENERATORS, WHICH COLLECTIVELYPRODUCE 208 MEGAWATTS OF ELECTRICITY,ENOUGH POWER FOR 590,000 PEOPLE, ANUALLY.
Step 2: the renewable energy [r]evolution Decentralised energy andlarge scale renewables In order to achieve higher fuel efficienciesand reduce distribution losses, the Energy [R]evolution scenariomakes extensive use of Decentralised Energy (DE).This termsrefers to energy generated at or near the point of use.
Decentralised energy is connected to a local distribution networksystem, supplying homes and offices, rather than the high voltagetransmission system. Because electricity generation is closer toconsumers any waste heat from combustion processes can to bepiped to nearby buildings, a system known as cogeneration orcombined heat and power. This means that for a fuel like gas, allthe input energy is used, not just a fraction as with traditionalcentralised fossil fuel electricity plant.
Decentralised energy also includes stand-alone systems entirelyseparate from the public networks, for example heat pumps, solarthermal panels or biomass heating. These can all becommercialised for domestic users to provide sustainable, lowemission heating. Some consider decentralised energytechnologies ‘disruptive’ because they do not fit the existingelectricity market and system. However, with appropriate changesthey can grow exponentially with overall benefit anddiversification for the energy sector.
A huge proportion of global energy in 2050 will be produced bydecentralised energy sources, although large scale renewableenergy supply will still be needed for an energy revolution. Largeoffshore wind farms and concentrating solar power (CSP) plantsin the sunbelt regions of the world will therefore have animportant role to play.
Cogeneration (CHP) The increased use of combined heat andpower generation (CHP) will improve the supply system’s energyconversion efficiency, whether using natural gas or biomass. Inthe longer term, a decreasing demand for heat and the largepotential for producing heat directly from renewable energysources will limit the need for further expansion of CHP.
Renewable electricityThe electricity sector will be the pioneer ofrenewable energy utilisation. Many renewable electricitytechnologies have been experiencing steady growth over the past 20to 30 years of up to 35% annually and are expected to consolidateat a high level between 2030 and 2050. By 2050, under theEnergy [R]evolution scenario, the majority of electricity will beproduced from renewable energy sources. The anticipated growth ofelectricity use in transport will further promote the effective use ofrenewable power generation technologies.
1
2
3
4
5
1. PHOTOVOLTAIC, SOLAR FAÇADES WILL BE A DECORATIVE ELEMENT ONOFFICE AND APARTMENT BUILDINGS. PHOTOVOLTAIC SYSTEMS WILL
BECOME MORE COMPETITIVE AND IMPROVED DESIGN WILL ENABLE
ARCHITECTS TO USE THEM MORE WIDELY.
2. RENOVATION CAN CUT ENERGY CONSUMPTION OF OLD BUILDINGS BY ASMUCH AS 80% - WITH IMPROVED HEAT INSULATION, INSULATED
WINDOWS AND MODERN VENTILATION SYSTEMS.
3. SOLAR THERMAL COLLECTORS PRODUCE HOT WATER FOR BOTH THEIROWN AND NEIGHBOURING BUILDINGS.
4. EFFICIENT THERMAL POWER (CHP) STATIONS WILL COME IN A VARIETY OF SIZES - FITTING THE CELLAR OF A DETACHED HOUSE OR
SUPPLYING WHOLE BUILDING COMPLEXES OR APARTMENT BLOCKS WITH
POWER AND WARMTH WITHOUT LOSSES IN TRANSMISSION.
5. CLEAN ELECTRICITY FOR THE CITIES WILL ALSO COME FROM FARTHERAFIELD. OFFSHORE WIND PARKS AND SOLAR POWER STATIONS IN
DESERTS HAVE ENORMOUS POTENTIAL.
city
figure 2.2: a decentralised energy future
EXISTING TECHNOLOGIES, APPLIED IN A DECENTRALISED WAY AND COMBINED WITH EFFICIENCY MEASURES AND ZERO EMISSION DEVELOPMENTS, CAN
DELIVER LOW CARBON COMMUNITIES AS ILLUSTRATED HERE. POWER IS GENERATED USING EFFICIENT COGENERATION TECHNOLOGIES PRODUCING BOTH HEAT
(AND SOMETIMES COOLING) PLUS ELECTRICITY, DISTRIBUTED VIA LOCAL NETWORKS. THIS SUPPLEMENTS THE ENERGY PRODUCED FROM BUILDING
INTEGRATED GENERATION. ENERGY SOLUTIONS COME FROM LOCAL OPPORTUNITIES AT BOTH A SMALL AND COMMUNITY SCALE. THE TOWN SHOWN HERE MAKES
USE OF – AMONG OTHERS – WIND, BIOMASS AND HYDRO RESOURCES. NATURAL GAS, WHERE NEEDED, CAN BE DEPLOYED IN A HIGHLY EFFICIENT MANNER.
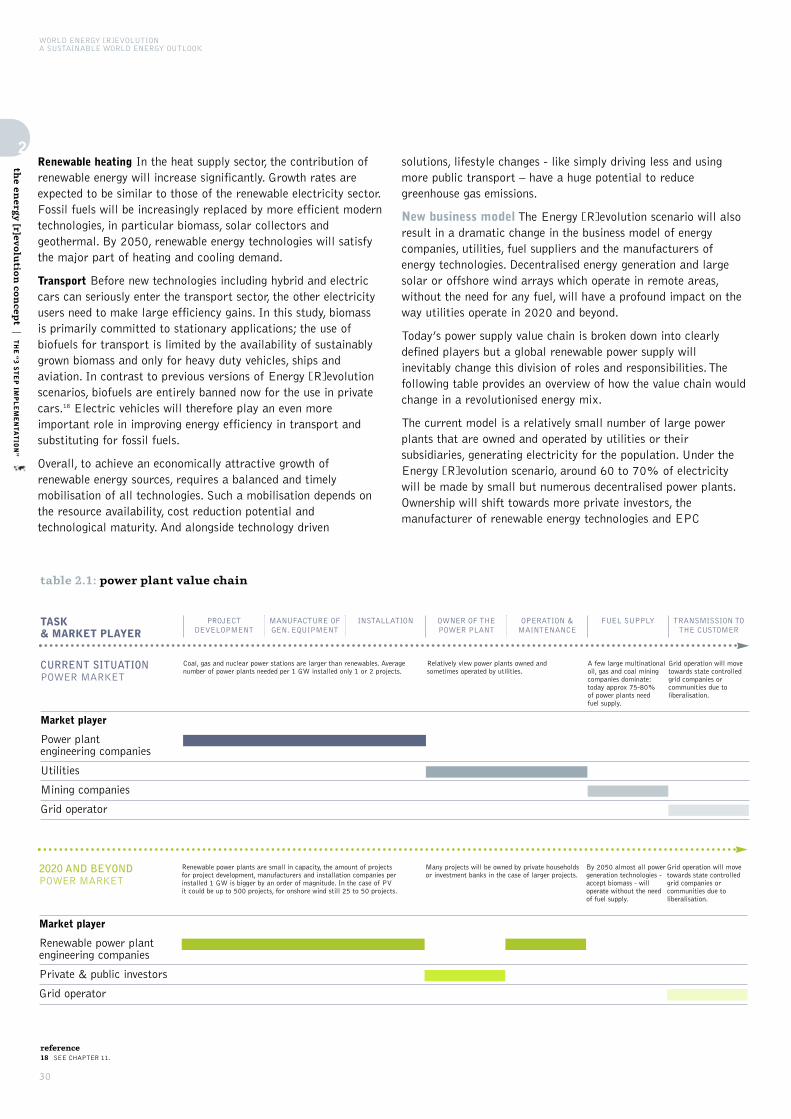
Renewable heating In the heat supply sector, the contribution ofrenewable energy will increase significantly. Growth rates areexpected to be similar to those of the renewable electricity sector.Fossil fuels will be increasingly replaced by more efficient moderntechnologies, in particular biomass, solar collectors andgeothermal. By 2050, renewable energy technologies will satisfythe major part of heating and cooling demand.
Transport Before new technologies including hybrid and electriccars can seriously enter the transport sector, the other electricityusers need to make large efficiency gains. In this study, biomassis primarily committed to stationary applications; the use ofbiofuels for transport is limited by the availability of sustainablygrown biomass and only for heavy duty vehicles, ships andaviation. In contrast to previous versions of Energy [R]evolutionscenarios, biofuels are entirely banned now for the use in privatecars.18 Electric vehicles will therefore play an even moreimportant role in improving energy efficiency in transport andsubstituting for fossil fuels.
Overall, to achieve an economically attractive growth ofrenewable energy sources, requires a balanced and timelymobilisation of all technologies. Such a mobilisation depends onthe resource availability, cost reduction potential andtechnological maturity. And alongside technology driven
solutions, lifestyle changes - like simply driving less and usingmore public transport – have a huge potential to reducegreenhouse gas emissions.
New business model The Energy [R]evolution scenario will alsoresult in a dramatic change in the business model of energycompanies, utilities, fuel suppliers and the manufacturers ofenergy technologies. Decentralised energy generation and largesolar or offshore wind arrays which operate in remote areas,without the need for any fuel, will have a profound impact on theway utilities operate in 2020 and beyond.
Today’s power supply value chain is broken down into clearlydefined players but a global renewable power supply willinevitably change this division of roles and responsibilities. Thefollowing table provides an overview of how the value chain wouldchange in a revolutionised energy mix.
The current model is a relatively small number of large powerplants that are owned and operated by utilities or theirsubsidiaries, generating electricity for the population. Under theEnergy [R]evolution scenario, around 60 to 70% of electricitywill be made by small but numerous decentralised power plants.Ownership will shift towards more private investors, themanufacturer of renewable energy technologies and EPC
WORLD ENERGY [R]EVOLUTIONA SUSTAINABLE WORLD ENERGY OUTLOOK
30
2
the en
ergy [r]evo
lutio
n co
ncep
t|THE “3 STEP IM
PLEMENTATION”
reference18 SEE CHAPTER 11.
table 2.1: power plant value chain
TRANSMISSION TOTHE CUSTOMER
TASK & MARKET PLAYER
CURRENT SITUATIONPOWER MARKET
Market player
Power plant engineering companies
Utilities
Mining companies
Grid operator
FUEL SUPPLYOPERATION &MAINTENANCE
OWNER OF THEPOWER PLANT
INSTALLATIONMANUFACTURE OFGEN. EQUIPMENT
PROJECTDEVELOPMENT
Grid operation will movetowards state controlledgrid companies orcommunities due toliberalisation.
A few large multinationaloil, gas and coal miningcompanies dominate:today approx 75-80% of power plants need fuel supply.
Relatively view power plants owned and sometimes operated by utilities.
Coal, gas and nuclear power stations are larger than renewables. Averagenumber of power plants needed per 1 GW installed only 1 or 2 projects.
2020 AND BEYONDPOWER MARKET
Market player
Renewable power plant engineering companies
Private & public investors
Grid operator
Grid operation will movetowards state controlledgrid companies orcommunities due toliberalisation.
By 2050 almost all powergeneration technologies -accept biomass - willoperate without the needof fuel supply.
Many projects will be owned by private householdsor investment banks in the case of larger projects.
Renewable power plants are small in capacity, the amount of projects for project development, manufacturers and installation companies per installed 1 GW is bigger by an order of magnitude. In the case of PV it could be up to 500 projects, for onshore wind still 25 to 50 projects.
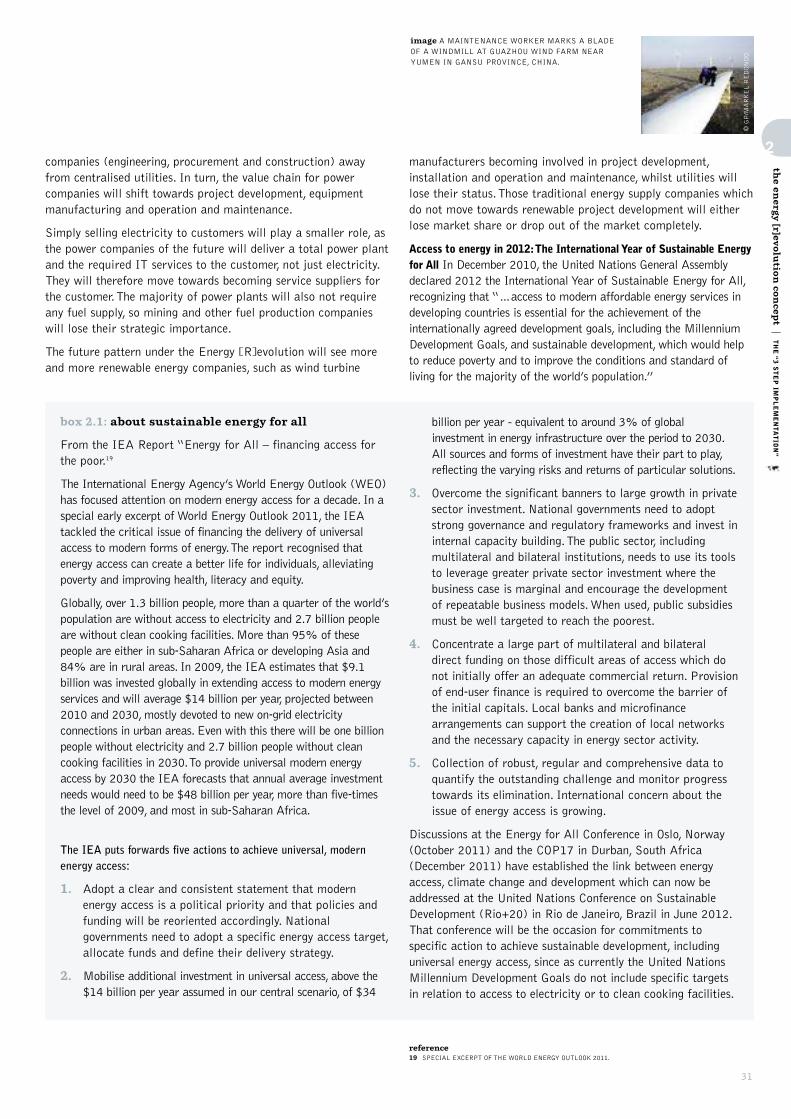
31
© GP/MARKEL REDONDO
image A MAINTENANCE WORKER MARKS A BLADEOF A WINDMILL AT GUAZHOU WIND FARM NEARYUMEN IN GANSU PROVINCE, CHINA.
2
the en
ergy [r]evo
lutio
n co
ncep
t|THE “3 STEP IM
PLEMENTATION”
companies (engineering, procurement and construction) awayfrom centralised utilities. In turn, the value chain for powercompanies will shift towards project development, equipmentmanufacturing and operation and maintenance.
Simply selling electricity to customers will play a smaller role, asthe power companies of the future will deliver a total power plantand the required IT services to the customer, not just electricity.They will therefore move towards becoming service suppliers forthe customer. The majority of power plants will also not requireany fuel supply, so mining and other fuel production companieswill lose their strategic importance.
The future pattern under the Energy [R]evolution will see moreand more renewable energy companies, such as wind turbine
manufacturers becoming involved in project development,installation and operation and maintenance, whilst utilities willlose their status. Those traditional energy supply companies whichdo not move towards renewable project development will eitherlose market share or drop out of the market completely.
Access to energy in 2012: The International Year of Sustainable Energyfor All In December 2010, the United Nations General Assemblydeclared 2012 the International Year of Sustainable Energy for All,recognizing that “…access to modern affordable energy services indeveloping countries is essential for the achievement of theinternationally agreed development goals, including the MillenniumDevelopment Goals, and sustainable development, which would helpto reduce poverty and to improve the conditions and standard ofliving for the majority of the world’s population.”
box 2.1: about sustainable energy for all
From the IEA Report “Energy for All – financing access forthe poor.19
The International Energy Agency’s World Energy Outlook (WEO)has focused attention on modern energy access for a decade. In aspecial early excerpt of World Energy Outlook 2011, the IEAtackled the critical issue of financing the delivery of universalaccess to modern forms of energy. The report recognised thatenergy access can create a better life for individuals, alleviatingpoverty and improving health, literacy and equity.
Globally, over 1.3 billion people, more than a quarter of the world’spopulation are without access to electricity and 2.7 billion peopleare without clean cooking facilities. More than 95% of thesepeople are either in sub‐Saharan Africa or developing Asia and84% are in rural areas. In 2009, the IEA estimates that $9.1billion was invested globally in extending access to modern energyservices and will average $14 billion per year, projected between2010 and 2030, mostly devoted to new on‐grid electricityconnections in urban areas. Even with this there will be one billionpeople without electricity and 2.7 billion people without cleancooking facilities in 2030. To provide universal modern energyaccess by 2030 the IEA forecasts that annual average investmentneeds would need to be $48 billion per year, more than five‐timesthe level of 2009, and most in sub‐Saharan Africa.
The IEA puts forwards five actions to achieve universal, modernenergy access:
1. Adopt a clear and consistent statement that modernenergy access is a political priority and that policies andfunding will be reoriented accordingly. Nationalgovernments need to adopt a specific energy access target,allocate funds and define their delivery strategy.
2. Mobilise additional investment in universal access, above the$14 billion per year assumed in our central scenario, of $34
billion per year - equivalent to around 3% of globalinvestment in energy infrastructure over the period to 2030.All sources and forms of investment have their part to play,reflecting the varying risks and returns of particular solutions.
3. Overcome the significant banners to large growth in privatesector investment. National governments need to adoptstrong governance and regulatory frameworks and invest ininternal capacity building. The public sector, includingmultilateral and bilateral institutions, needs to use its toolsto leverage greater private sector investment where thebusiness case is marginal and encourage the developmentof repeatable business models. When used, public subsidiesmust be well targeted to reach the poorest.
4. Concentrate a large part of multilateral and bilateraldirect funding on those difficult areas of access which donot initially offer an adequate commercial return. Provisionof end‐user finance is required to overcome the barrier ofthe initial capitals. Local banks and microfinancearrangements can support the creation of local networksand the necessary capacity in energy sector activity.
5. Collection of robust, regular and comprehensive data toquantify the outstanding challenge and monitor progresstowards its elimination. International concern about theissue of energy access is growing.
Discussions at the Energy for All Conference in Oslo, Norway(October 2011) and the COP17 in Durban, South Africa(December 2011) have established the link between energyaccess, climate change and development which can now beaddressed at the United Nations Conference on SustainableDevelopment (Rio+20) in Rio de Janeiro, Brazil in June 2012.That conference will be the occasion for commitments tospecific action to achieve sustainable development, includinguniversal energy access, since as currently the United NationsMillennium Development Goals do not include specific targetsin relation to access to electricity or to clean cooking facilities.
reference19 SPECIAL EXCERPT OF THE WORLD ENERGY OUTLOOK 2011.

WORLD ENERGY [R]EVOLUTIONA SUSTAINABLE WORLD ENERGY OUTLOOK
32
The General Assembly’s Resolution 65/151 called on UNSecretary-General Ban Ki-Moon to organize and coordinateactivities during the Year in order to “increase awareness of theimportance of addressing energy issues”, including access to andsustainability of affordable energy and energy efficiency at local,national, regional and international levels.
In response, the new global initiative, Sustainable Energy for All,launched at the General Assembly in September 2011, along witha High Level Group, is designed to mobilise action fromgovernments, the private sector and civil society globally. Theinitiative has three inter-linked objectives: universal access tomodern energy services, improved rates of energy efficiency, andexpanded use of renewable energy sources.
The role of sustainable, clean renewable energy To achieve thedramatic emissions cuts needed to avoid climate change, around80% in OECD countries by 2050, will require a massive uptake ofrenewable energy. The targets for renewable energy must be greatlyexpanded in industrialised countries both to substitute for fossilfuel and nuclear generation and to create the necessary economiesof scale necessary for global expansion. Within the Energy[R]evolution scenario we assume that modern renewable energysources, such as solar collectors, solar cookers and modern formsof bio energy, will replace inefficient, traditional biomass use.
Step 3: optimised integration – renewables 24/7 A completetransformation of the energy system will be necessary toaccommodate the significantly higher shares of renewable energyexpected under the Energy [R]evolution scenario. The grid networkof cables and sub-stations that brings electricity to our homes andfactories was designed for large, centralised generators running athuge loads, providing ‘baseload’ power. Until now, renewableenergy has been seen as an additional slice of the energy mix andhad had adapt to the grid’s operating conditions. If the Energy[R]evolution scenario is to be realised, this will have to change.
Because renewable energy relies mostly on natural resources,which are not available at all times, some critics say this makes itunsuitable for large portions of energy demand. Existing practicein a number of countries has already shown that this is false.
Clever technologies can track and manage energy use patterns,provide flexible power that follows demand through the day, usebetter storage options and group customers together to form‘virtual batteries’. With current and emerging solutions we cansecure the renewable energy future needed to avert catastrophicclimate change. Renewable energy 24/7 is technically andeconomically possible, it just needs the right policy and thecommercial investment to get things moving and ‘keep the lightson’.20 Further adaptations to how the grid network operates willallow integration of even larger quantities of renewable capacity.
Changes to the grid required to support decentralised energy Mostgrids around the world have large power plants in the middleconnected by high voltage alternating current (AC) power lines
and smaller distribution network carries power to finalconsumers. The centralised grid model was designed and plannedup to 60 years ago, and brought great benefit to cities and ruralareas. However the system is very wasteful, with much energylost in transition. A system based on renewable energy, requiringlots of smaller generators, some with variable amounts of poweroutput will need a new architecture.
The overall concept of a smart grid is one that balances fluctuationsin energy demand and supply to share out power effectively amongusers. New measures to manage demand, forecasting the weatherfor storage needs, plus advanced communication and controltechnologies will help deliver electricity effectively.
Technological opportunities Changes to the power system by 2050will create huge business opportunities for the information,communication and technology (ICT) sector. A smart grid haspower supplied from a diverse range of sources and places and itrelies on the gathering and analysis of a lot of data. Smart gridsrequire software, hardware and data networks capable ofdelivering data quickly, and of responding to the information thatthey contain. Several important ICT players are racing tosmarten up energy grids across the globe and hundreds ofcompanies could be involved with smart grids.
There are numerous IT companies offering products and servicesto manage and monitor energy. These include IBM, Fujitsu,Google, Microsoft and Cisco. These and other giants of thetelecommunications and technology sector have the power tomake the grid smarter, and to move us faster towards a cleanenergy future. Greenpeace has initiated the ‘Cool IT’ campaign toput pressure on the IT sector to make such technologies a reality.
2.3 the new electricity grid
All over the developed world, the grids were built with large fossilfuel power plants in the middle and high voltage alternatingcurrent (AC) transmission power lines connecting up to the areaswhere the power is used. A lower voltage distribution networkthen carries the current to the final consumers.
In the future power generators will be smaller and distributedthroughout the grid, which is more efficient and avoids energy lossesduring long distance transmission. There will also be some concentratedsupply from large renewable power plants. Examples of the largegenerators of the future are massive wind farms already being built inEurope’s North Sea and plans for large areas of concentrating solarmirrors to generate energy in Southern Europe or Northern Africa.
The challenge ahead will require an innovative power systemarchitecture involving both new technologies and new ways ofmanaging the network to ensure a balance between fluctuationsin energy demand and supply. The key elements of this new powersystem architecture are micro grids, smart grids and an efficientlarge scale super grid. The three types of system will support andinterconnect with each other (see Figure 2.3).
2
the en
ergy [r]evo
lutio
n co
ncep
t|THE “3 STEP IM
PLEMENTATION”
reference20 THE ARGUMENTS AND TECHNICAL SOLUTIONS OUTLINED HERE ARE EXPLAINED IN MORE DETAIL IN
THE EUROPEAN RENEWABLE ENERGY COUNCIL/GREENPEACE REPORT, “[R]ENEWABLES 24/7:
INFRASTRUCTURE NEEDED TO SAVE THE CLIMATE”, NOVEMBER 2009.

33
© GP/MARTIN ZAKORA
image AERIAL VIEW OF THE WORLD’S LARGESTOFFSHORE WINDPARK IN THE NORTH SEA HORNSREV IN ESBJERG, DENMARK.
2
the en
ergy [r]evo
lutio
n co
ncep
t|THE NEW ELECTRICITY GRID
2.3.1 hybrid systems
While grid in the developed world supply power to nearly 100%of the population, many rural areas in the developing world relyon unreliable grids or polluting electricity, for example fromstand-alone diesel generators. This is also very expensive forsmall communities.
The standard approach of extending the grid used in developedcountries is often not economic in rural areas of developingcountries where potential electricity is low and there are longdistances to existing grid.
Electrification based on renewable energy systems with a hybridmix of sources is often the cheapest as well as the least pollutingalternative. Hybrid systems connect renewable energy sourcessuch as wind and solar power to a battery via a charge controller,which stores the generated electricity and acts as the main powersupply. Back-up supply typically comes from a fossil fuel, forexample in a wind-battery-diesel or PV-battery-diesel system.
Such decentralised hybrid systems are more reliable, consumerscan be involved in their operation through innovative technologiesand they can make best use of local resources. They are also lessdependent on large scale infrastructure and can be constructedand connected faster, especially in rural areas.
Finance can often be an issue for relatively poor ruralcommunities wanting to install such hybrid renewable systems.Greenpeace’s funding model, the Feed-in Tariff SupportMechanism (FTSM), discussed in Chapter 1 allows project to bebundled together so the financial package is large enough to beeligible for international investment support. In the Pacific region,for example, power generation projects from a number of islands,an entire island state such as the Maldives or even several islandstates could be bundled into one project package. This wouldmake it large enough for funding as an international project byOECD countries. In terms of project planning, it is essential thatthe communities themselves are directly involved in the process.
box 2.2: definitions and technical terms
The electricity ‘grid’ is the collective name for all the cables,transformers and infrastructure that transport electricity frompower plants to the end users.
Micro grids supply local power needs. Monitoring and controlinfrastructure are embedded inside distribution networks anduse local energy generation resources. An example microgridwould be a combination of solar panels, micro turbines, fuelcells, energy efficiency and information/communicationtechnology to manage the load, for example on an island orsmall rural town.
Smart grids balance demand out over a region. A ‘smart’electricity grid connects decentralised renewable energysources and cogeneration and distributes power highlyefficiently. Advanced types of control and managementtechnologies for the electricity grid can also make it run moreefficiently overall. For example, smart electricity meters showreal-time use and costs, allowing big energy users to switch offor down on a signal from the grid operator, and avoid highpower prices.
Super grids transport large energy loads between regions. Thisrefers to interconnection - typically based on HVDCtechnology - between countries or areas with large supply andlarge demand. An example would be the interconnection of allthe large renewable based power plants in the North Sea or aconnection between Southern Europe and Africa whererenewable energy could be exported to bigger cities and towns,from places with large locally available resources.
Baseload is the concept that there must be a minimum,uninterruptible supply of power to the grid at all times,traditionally provided by coal or nuclear power. The Energy[R]evolution challenges this, and instead relies on a variety of‘flexible’ energy sources combined over a large area to meetdemand. Currently, ‘baseload’ is part of the business model fornuclear and coal power plants, where the operator can produceelectricity around the clock whether or not it is actually needed.
Constrained power refers to when there is a local oversupply offree wind and solar power which has to be shut down, eitherbecause it cannot be transferred to other locations (bottlenecks)or because it is competing with inflexible nuclear or coal powerthat has been given priority access to the grid. Constrained poweris also available for storage once the technology is available.
Variable power is electricity produced by wind or solar powerdepending on the weather. Some technologies can makevariable power dispatchable, eg by adding heat storage toconcentrated solar power.
Dispatchable is a type of power that can be stored and‘dispatched’ when needed to areas of high demand, e.g. gas-fired power plants or hydro power plants.
Interconnector is a transmission line that connects different partsof the electricity grid.Load curve is the typical pattern of electricitythrough the day, which has a predictable peak and trough that canbe anticipated from outside temperatures and historical data.
Node is a point of connection in the electricity grid betweenregions or countries, where there can be local supply feedinginto the grid as well.
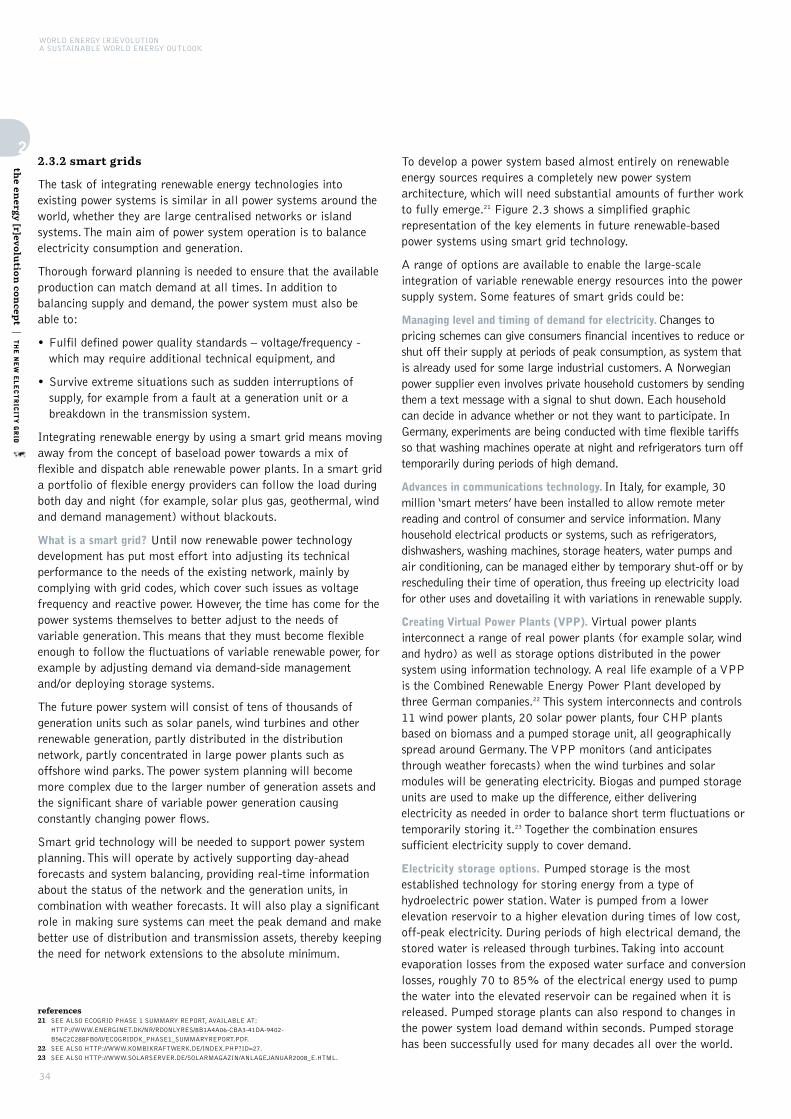
2.3.2 smart grids
The task of integrating renewable energy technologies intoexisting power systems is similar in all power systems around theworld, whether they are large centralised networks or islandsystems. The main aim of power system operation is to balanceelectricity consumption and generation.
Thorough forward planning is needed to ensure that the availableproduction can match demand at all times. In addition tobalancing supply and demand, the power system must also beable to:
• Fulfil defined power quality standards – voltage/frequency -which may require additional technical equipment, and
• Survive extreme situations such as sudden interruptions ofsupply, for example from a fault at a generation unit or abreakdown in the transmission system.
Integrating renewable energy by using a smart grid means movingaway from the concept of baseload power towards a mix offlexible and dispatch able renewable power plants. In a smart grida portfolio of flexible energy providers can follow the load duringboth day and night (for example, solar plus gas, geothermal, windand demand management) without blackouts.
What is a smart grid? Until now renewable power technologydevelopment has put most effort into adjusting its technicalperformance to the needs of the existing network, mainly bycomplying with grid codes, which cover such issues as voltagefrequency and reactive power. However, the time has come for thepower systems themselves to better adjust to the needs ofvariable generation. This means that they must become flexibleenough to follow the fluctuations of variable renewable power, forexample by adjusting demand via demand-side managementand/or deploying storage systems.
The future power system will consist of tens of thousands ofgeneration units such as solar panels, wind turbines and otherrenewable generation, partly distributed in the distributionnetwork, partly concentrated in large power plants such asoffshore wind parks. The power system planning will becomemore complex due to the larger number of generation assets andthe significant share of variable power generation causingconstantly changing power flows.
Smart grid technology will be needed to support power systemplanning. This will operate by actively supporting day-aheadforecasts and system balancing, providing real-time informationabout the status of the network and the generation units, incombination with weather forecasts. It will also play a significantrole in making sure systems can meet the peak demand and makebetter use of distribution and transmission assets, thereby keepingthe need for network extensions to the absolute minimum.
To develop a power system based almost entirely on renewableenergy sources requires a completely new power systemarchitecture, which will need substantial amounts of further workto fully emerge.21 Figure 2.3 shows a simplified graphicrepresentation of the key elements in future renewable-basedpower systems using smart grid technology.
A range of options are available to enable the large-scaleintegration of variable renewable energy resources into the powersupply system. Some features of smart grids could be:
Managing level and timing of demand for electricity. Changes topricing schemes can give consumers financial incentives to reduce orshut off their supply at periods of peak consumption, as system thatis already used for some large industrial customers. A Norwegianpower supplier even involves private household customers by sendingthem a text message with a signal to shut down. Each householdcan decide in advance whether or not they want to participate. InGermany, experiments are being conducted with time flexible tariffsso that washing machines operate at night and refrigerators turn offtemporarily during periods of high demand.
Advances in communications technology. In Italy, for example, 30million ‘smart meters’ have been installed to allow remote meterreading and control of consumer and service information. Manyhousehold electrical products or systems, such as refrigerators,dishwashers, washing machines, storage heaters, water pumps andair conditioning, can be managed either by temporary shut-off or byrescheduling their time of operation, thus freeing up electricity loadfor other uses and dovetailing it with variations in renewable supply.
Creating Virtual Power Plants (VPP). Virtual power plantsinterconnect a range of real power plants (for example solar, windand hydro) as well as storage options distributed in the powersystem using information technology. A real life example of a VPPis the Combined Renewable Energy Power Plant developed bythree German companies.22 This system interconnects and controls11 wind power plants, 20 solar power plants, four CHP plantsbased on biomass and a pumped storage unit, all geographicallyspread around Germany. The VPP monitors (and anticipatesthrough weather forecasts) when the wind turbines and solarmodules will be generating electricity. Biogas and pumped storageunits are used to make up the difference, either deliveringelectricity as needed in order to balance short term fluctuations ortemporarily storing it.23 Together the combination ensuressufficient electricity supply to cover demand.
Electricity storage options. Pumped storage is the mostestablished technology for storing energy from a type ofhydroelectric power station. Water is pumped from a lowerelevation reservoir to a higher elevation during times of low cost,off-peak electricity. During periods of high electrical demand, thestored water is released through turbines. Taking into accountevaporation losses from the exposed water surface and conversionlosses, roughly 70 to 85% of the electrical energy used to pumpthe water into the elevated reservoir can be regained when it isreleased. Pumped storage plants can also respond to changes inthe power system load demand within seconds. Pumped storagehas been successfully used for many decades all over the world.
WORLD ENERGY [R]EVOLUTIONA SUSTAINABLE WORLD ENERGY OUTLOOK
34
2
the en
ergy [r]evo
lutio
n co
ncep
t|THE NEW ELECTRICITY GRID
references21 SEE ALSO ECOGRID PHASE 1 SUMMARY REPORT, AVAILABLE AT:
HTTP://WWW.ENERGINET.DK/NR/RDONLYRES/8B1A4A06-CBA3-41DA-9402-
B56C2C288FB0/0/ECOGRIDDK_PHASE1_SUMMARYREPORT.PDF.
22 SEE ALSO HTTP://WWW.KOMBIKRAFTWERK.DE/INDEX.PHP?ID=27.
23 SEE ALSO HTTP://WWW.SOLARSERVER.DE/SOLARMAGAZIN/ANLAGEJANUAR2008_E.HTML.
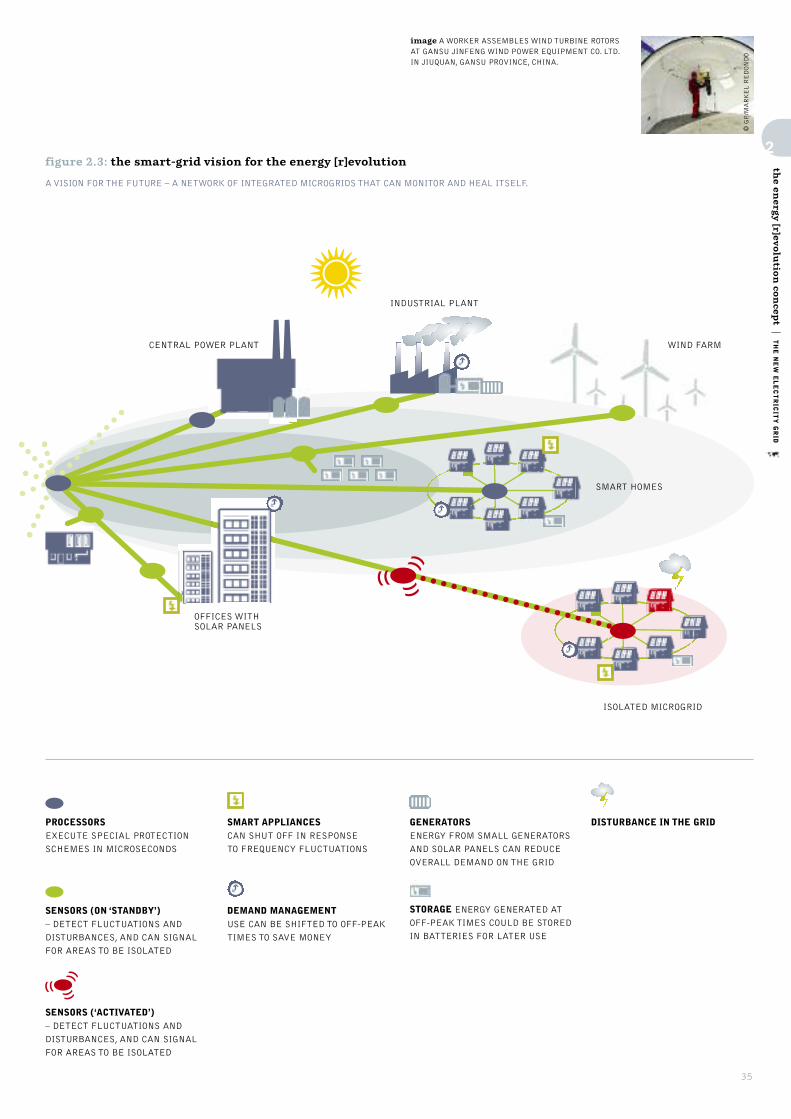
35
© GP/MARKEL REDONDO
image A WORKER ASSEMBLES WIND TURBINE ROTORSAT GANSU JINFENG WIND POWER EQUIPMENT CO. LTD.IN JIUQUAN, GANSU PROVINCE, CHINA.
2
the en
ergy [r]evo
lutio
n co
ncep
t|THE NEW ELECTRICITY GRID
figure 2.3: the smart-grid vision for the energy [r]evolution
A VISION FOR THE FUTURE – A NETWORK OF INTEGRATED MICROGRIDS THAT CAN MONITOR AND HEAL ITSELF.
PROCESSORSEXECUTE SPECIAL PROTECTION
SCHEMES IN MICROSECONDS
SENSORS (ON ‘STANDBY’)– DETECT FLUCTUATIONS AND
DISTURBANCES, AND CAN SIGNAL
FOR AREAS TO BE ISOLATED
SENSORS (‘ACTIVATED’)– DETECT FLUCTUATIONS AND
DISTURBANCES, AND CAN SIGNAL
FOR AREAS TO BE ISOLATED
SMART APPLIANCESCAN SHUT OFF IN RESPONSE
TO FREQUENCY FLUCTUATIONS
DEMAND MANAGEMENTUSE CAN BE SHIFTED TO OFF-PEAK
TIMES TO SAVE MONEY
GENERATORSENERGY FROM SMALL GENERATORS
AND SOLAR PANELS CAN REDUCE
OVERALL DEMAND ON THE GRID
STORAGE ENERGY GENERATED ATOFF-PEAK TIMES COULD BE STORED
IN BATTERIES FOR LATER USE
DISTURBANCE IN THE GRID
CENTRAL POWER PLANT
OFFICES WITHSOLAR PANELS
WIND FARM
ISOLATED MICROGRID
SMART HOMES
INDUSTRIAL PLANT

In 2007 the European Union had 38 GW of pumped storagecapacity, representing 5% of total electrical capacity.
Vehicle-to-Grid. Another way of ‘storing’ electricity is to use it todirectly meet the demand from electric vehicles. The number ofelectric cars and trucks is expected to increase dramatically underthe Energy [R]evolution scenario. The Vehicle-to-Grid (V2G)concept, for example, is based on electric cars equipped withbatteries that can be charged during times when there is surplusrenewable generation and then discharged to supply peaking capacityor ancillary services to the power system while they are parked.During peak demand times cars are often parked close to main loadcentres, for instance outside factories, so there would be no networkissues. Within the V2G concept a Virtual Power Plant would be builtusing ICT technology to aggregate the electric cars participating inthe relevant electricity markets and to meter the charging/de-charging activities. In 2009 the EDISON demonstration project waslaunched to develop and test the infrastructure for integratingelectric cars into the power system of the Danish island of Bornholm.
2.3.3 the super grid
Greenpeace simulation studies Renewables 24/7 (2010) and Battleof the Grids (2011) have shown that extreme situations with lowsolar radiation and little wind in many parts of Europe are notfrequent, but they can occur. The power system, even with massiveamounts of renewable energy, must be adequately designed to copewith such an event. A key element in achieving this is through theconstruction of new onshore and offshore super grids.
The Energy [R]evolution scenario assumes that about 70% of allgeneration is distributed and located close to load centres. Theremaining 30% will be large scale renewable generation such aslarge offshore wind farms or large arrays of concentrating solarpower plants. A North Sea offshore super grid, for example, wouldenable the efficient integration of renewable energy into the powersystem across the whole North Sea region, linking the UK, France,Germany, Belgium, the Netherlands, Denmark and Norway. Byaggregating power generation from wind farms spread across thewhole area, periods of very low or very high power flows would bereduced to a negligible amount. A dip in wind power generation inone area would be balanced by higher production in another area,even hundreds of kilometres away. Over a year, an installedoffshore wind power capacity of 68.4 GW in the North Sea wouldbe able to generate an estimated 247 TWh of electricity.24
2.3.4 baseload blocks progress
Generally, coal and nuclear plants run as so-called base load,meaning they work most of the time at maximum capacityregardless of how much electricity consumers need. Whendemand is low the power is wasted. When demand is highadditional gas is needed as a backup.
However, coal and nuclear cannot be turned down on windy days sowind turbines will get switched off to prevent overloading the system.
The recent global economic crisis triggered drop in energy demandand revealed system conflict between inflexible base load power,especially nuclear, and variable renewable sources, especially windpower, with wind operators told to shut off their generators. InNorthern Spain and Germany, this uncomfortable mix is alreadyexposing the limits of the grid capacity. If Europe continues tosupport nuclear and coal power alongside a growth in renewables,clashes will occur more and more, creating a bloated, inefficient grid.
Despite the disadvantages stacked against renewable energy it hasbegun to challenge the profitability of older plants. Afterconstruction costs, a wind turbine is generating electricity almostfor free and without burning any fuel. Meanwhile, coal and nuclearplants use expensive and highly polluting fuels. Even wherenuclear plants are kept running and wind turbines are switchedoff, conventional energy providers are concerned. Like anycommodity, oversupply reduces price across the market. In energymarkets, this affects nuclear and coal too. We can expect moreintense conflicts over access to the grids over the coming years.
WORLD ENERGY [R]EVOLUTIONA SUSTAINABLE WORLD ENERGY OUTLOOK
36
2
the en
ergy [r]evo
lutio
n co
ncep
t|THE NEW ELECTRICITY GRID
references24 GREENPEACE REPORT, ‘NORTH SEA ELECTRICITY GRID [R]EVOLUTION’, SEPTEMBER 2008.
25 BATTLE OF THE GRIDS, GREENPEACE INTERNATIONAL, FEBRUARY 2011.
box 2.3: do we need baseload power plants?25
Power from some renewable plants, such as wind and solar,varies during the day and week. Some see this as aninsurmountable problem, because up until now we haverelied on coal or nuclear to provide a fixed amount ofpower at all times. In current policy-making there is astruggle to determine which type of infrastructure ormanagement we choose and which energy mix to favour aswe move away from a polluting, carbon intensive energysystem. Some important facts include:
• electricity demand fluctuates in a predictable way.
• smart management can work with big electricity users, sotheir peak demand moves to a different part of the day,evening out the load on the overall system.
• electricity from renewable sources can be stored and‘dispatched’ to where it is needed in a number of ways,using advanced grid technologies.
Wind-rich countries in Europe are already experiencingconflict between renewable and conventional power. In Spain,where a lot of wind and solar is now connected to the grid,gas power is stepping in to bridge the gap between demandand supply. This is because gas plants can be switched off orrun at reduced power, for example when there is lowelectricity demand or high wind production. As we move to amostly renewable electricity sector, gas plants will be neededas backup for times of high demand and low renewableproduction. Effectively, a kWh from a wind turbine displacesa kWh from a gas plant, avoiding carbon dioxide emissions.Renewable electricity sources such as thermal solar plants(CSP), geothermal, hydro, biomass and biogas can graduallyphase out the need for natural gas. (See Case Studies formore). The gas plants and pipelines would then progressivelybe converted for transporting biogas.

37
© GP/PHILIP REYNAERS
image GREENPEACE OPENS A SOLAR ENERGYWORKSHOP IN BOMA. A MOBILE PHONE GETSCHARGED BY A SOLAR ENERGY POWERED CHARGER.
2
the en
ergy [r]evo
lutio
n co
ncep
t|THE NEW ELECTRICITY GRID
figure 2.4: a typical load curve throughout europe, shows electricity use peaking and falling on a daily basis
Time (hours/days)
Load (MW/GW)
DEMAND
Current supply system
• Low shares of fluctuating renewable energy
• The ‘base load’ power is a solid bar at the bottom of the graph.
• Renewable energy forms a ‘variable’ layer because sun and windlevels changes throughout the day.
• Gas and hydro power which can be switched on and off inresponse to demand. This is sustainable using weatherforecasting and clever grid management.
• With this arrangement there is room for about 25 percentvariable renewable energy.
To combat climate change much more than 25 percent renewableelectricity is needed.
Time of day (hour)
0h 6h 12h 18h 24h
GW
LOAD CURVE
‘FLEXIBLE POWER’.GRID OPERATORCOMBINES GAS & HYDRO
FLUCTUATING RE POWER
BASELOAD
Supply system with more than 25 percent fluctuating renewableenergy > base load priority
• This approach adds renewable energy but gives priority to base load.
• As renewable energy supplies grow they will exceed the demandat some times of the day, creating surplus power.
• To a point, this can be overcome by storing power, movingpower between areas, shifting demand during the day orshutting down the renewable generators at peak times.
Does not work when renewables exceed 50 percent of the mix, andcan not provide renewable energy as 90- 100% of the mix. Time of day (hour)
0h 6h 12h 18h 24h
GW
LOAD CURVE
SURPLUS RE - SEE FOLLOWINGOPTIONS
BASELOADPRIORITY: NOCURTAILMENTOF COAL ORNUCLEAR POWER
BASELOAD
figure 2.5: the evolving approach to grids
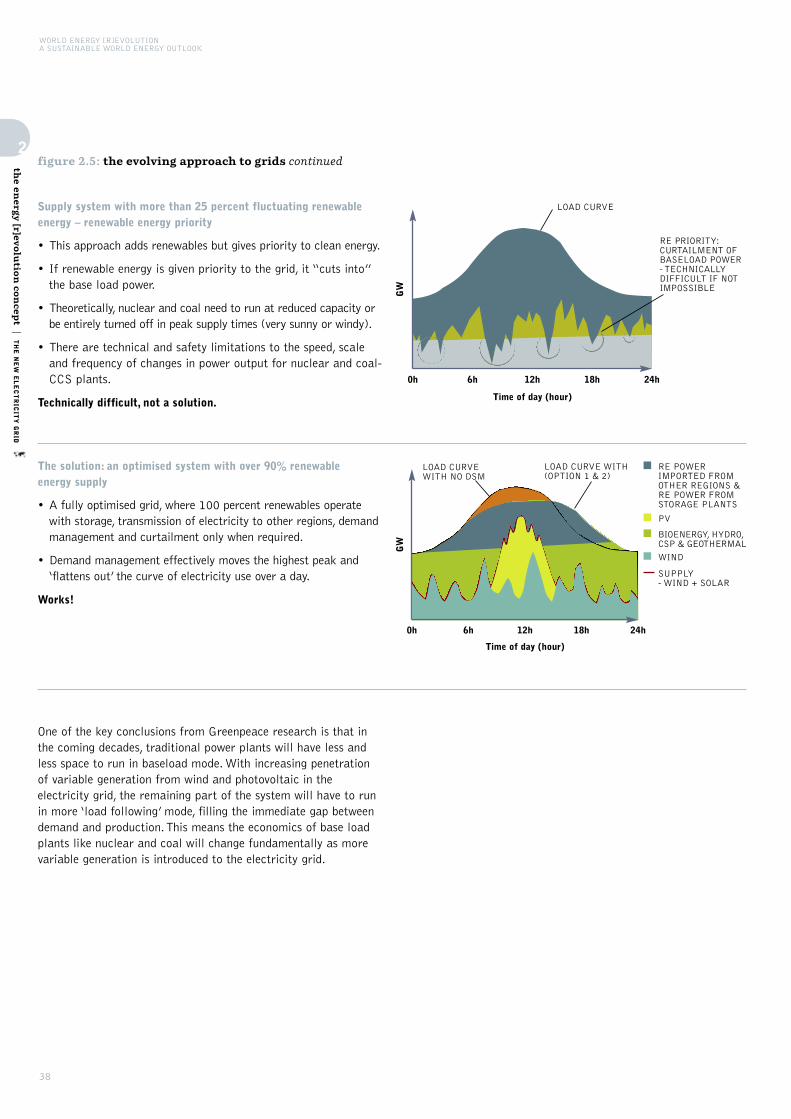
WORLD ENERGY [R]EVOLUTIONA SUSTAINABLE WORLD ENERGY OUTLOOK
38
2
the en
ergy [r]evo
lutio
n co
ncep
t|THE NEW ELECTRICITY GRID
One of the key conclusions from Greenpeace research is that inthe coming decades, traditional power plants will have less andless space to run in baseload mode. With increasing penetrationof variable generation from wind and photovoltaic in theelectricity grid, the remaining part of the system will have to runin more ‘load following’ mode, filling the immediate gap betweendemand and production. This means the economics of base loadplants like nuclear and coal will change fundamentally as morevariable generation is introduced to the electricity grid.
Supply system with more than 25 percent fluctuating renewableenergy – renewable energy priority
• This approach adds renewables but gives priority to clean energy.
• If renewable energy is given priority to the grid, it “cuts into”the base load power.
• Theoretically, nuclear and coal need to run at reduced capacity orbe entirely turned off in peak supply times (very sunny or windy).
• There are technical and safety limitations to the speed, scaleand frequency of changes in power output for nuclear and coal-CCS plants.
Technically difficult, not a solution. Time of day (hour)
0h 6h 12h 18h 24h
GW
LOAD CURVE
RE PRIORITY:CURTAILMENT OFBASELOAD POWER- TECHNICALLYDIFFICULT IF NOTIMPOSSIBLE
The solution: an optimised system with over 90% renewable energy supply
• A fully optimised grid, where 100 percent renewables operatewith storage, transmission of electricity to other regions, demandmanagement and curtailment only when required.
• Demand management effectively moves the highest peak and‘flattens out’ the curve of electricity use over a day.
Works!
Time of day (hour)
0h 6h 12h 18h 24h
GW
LOAD CURVE WITH NO DSM
LOAD CURVE WITH(OPTION 1 & 2)
RE POWERIMPORTED FROMOTHER REGIONS &RE POWER FROMSTORAGE PLANTS
SUPPLY - WIND + SOLAR
PV
WIND
BIOENERGY, HYDRO, CSP & GEOTHERMAL
figure 2.5: the evolving approach to grids continued
39
© GP
image LE NORDAIS WINDMILL PARK, ONE OF THEMOST IMPORTANT IN AMERICA, LOCATED ON THEGASPÈ PENINSULA IN CAP-CHAT, QUEBEC, CANADA.
2
the en
ergy [r]evo
lutio
n co
ncep
t|CASE STUDIES
2.4 case study: a year after the german nuclearphase out
On 30 May 2011, the German environment minister, NorbertRöttgen, announced the Germany would close its eight oldestnuclear plants and phase out the remaining nine reactors by2022. The plan is to replace most of the generating capacity ofthese nine reactors with renewables. The experience so far gives areal example of the steps needed for a global Energy[R]evolution at a national scale.
2.4.1 target and method
The German government expects renewables to generate 35% ofGerman electricity by 2020.26 The German Federal EnvironmentAgency believes that the phase out would be technically feasiblefrom 2017 , requiring only 5 GWh of additional combined heat-and-power or combined cycle gas plant (other than those alreadyunder construction) to meet peak time demand.27
2.4.2 carbon dioxide emissions trends
The Germany energy ambassador, Dr. Georg Maue reported to ameeting in the British Parliament in February 2012 thatGermany was still on track to meet its CO2 reduction targets of40% by 2020 and 80% by 2050 from 1990 levels. Figures forGermany’s 2011 greenhouse gas emissions were not available forthis report, although the small growth in use of lignite fuels islikely to have increased emissions in the short term.
However, the decision to phase out nuclear energy has renewedthe political pressure to deliver a secure climate-friendly energypolicy and ensure Germany still meets its greenhouse targets. TheEnergiewende (‘energy transition’) measures include € 200billioninvestment in renewable energy over the next decade, a majorpush on energy efficiency and an accelerated roll out ofinfrastructure to support the transition.28 Germany has alsobecome an advocate for renewables at the European level.29 Inthe longer-term, by deploying a large amount of renewablecapability Germany should be able to continue reducing itsemissions at this accelerated rate and its improved industrialproduction should make it more viable for other countries todeliver greater and faster emissions reductions.
2.4.3 shortfall from first round of closures
The oldest eight nuclear reactors were closed immediately andbased on figures available it looks like the ‘shortfall’ will becovered by a mix of lower demand, increasing renewable energysupply, and a small part by fossil-fuelled power.
In 2011 only 18% of the country’s energy generation came fromnuclear, as shown in Figure 2.7.30 In the previous year, nuclearenergy’s contribution had already fallen from 22% to 18%, a shortfall covered mostly by renewable electricity whichincreased from 16% to 20% in the same period, while use oflignite (a greenhouse-intensive fossil fuel) increased from 23% to 25% (Figure 2.6).
In the first half of 2011, Germany was a net exporter ofelectricity, exporting 29 billion kWh and importing 24 kWh.31
Complete figures for electricity imports and exports in the secondhalf of 2011, once nuclear reactors were decommissioned,however it is known that Germany exported electricity to Franceduring a cold spell in February 2012.32
Inside Germany, the demand for energy is falling.33 Between 2010and 2011 energy demand dropped by 5%, because the mildweather reduced demand for gas heating. While the Britishgovernment is planning for electricity demand in the UK todouble by 2050, the German government expects a cut of 25%from 2008 levels.34 Total energy demand is expected to halve overthe same time period.
2.4.4 the renewable energy sector in germany
Germany has successfully increased the share of renewableenergy constantly over the last twenty years, and the sector wasemploying over 350,000 employees by the end of 2011. The backbone of this development has been the Renewable Energy Act(Erneuerbare Energien Gesetz – EEG); a feed-in law whichguarantees a fixed tariff per kWh for 20 years. The tariffs aredifferent for each technology and between smaller and larger, toreflect their market penetration rates.
references26 HTTP://WWW.UMWELTDATEN.DE/PUBLIKATIONEN/FPDF-L/4147.PDF
27 HTTP://WWW.UMWELTDATEN.DE/PUBLIKATIONEN/FPDF-L/4147.PDF
28 HTTP://WWW.ERNEUERBARE-ENERGIEN.DE/INHALT/47872/3860/
29 HTTP://WWW.ERNEUERBARE-ENERGIEN.DE/INHALT/48192/3860/
30 THE GERMAN ASSOCIATION OF ENERGY AND WATER INDUSTRIES (BDEW), 16 DECEMBER 2011.
HTTP://WWW.BDEW.DE/INTERNET.NSF/ID/EN_?OPEN&CCM=900010020010
31 HTTP://WWW.BDEW.DE/INTERNET.NSF/ID/8EF9E5927BDAAE28C12579260029ED3B/$FILE/110912%
20RICHTIGSTELLUNG%20IMPORT-EXPORT-ZAHLEN_ENGLISCH.PDF
32 HTTP://WWW.REUTERS.COM/ARTICLE/2012/02/14/EUROPE-POWER-SUPPLY-IDUSL5E8DD87020120214
33 HTTP://WWW.AG-ENERGIEBILANZEN.DE/COMPONENTEN/DOWNLOAD.PHP?FILEDATA=1329148695.PDF&
FILENAME=AGEB_PRESSEDIENST_09_2011EN.PDF&MIMETYPE=APPLICATION/PDF
34 HTTP://WWW.BMU.DE/FILES/ENGLISH/PDF/APPLICATION/PDF/ENERGIEKONZEPT_BUNDESREGIERUNG_EN.PDF
(PAGE 5)
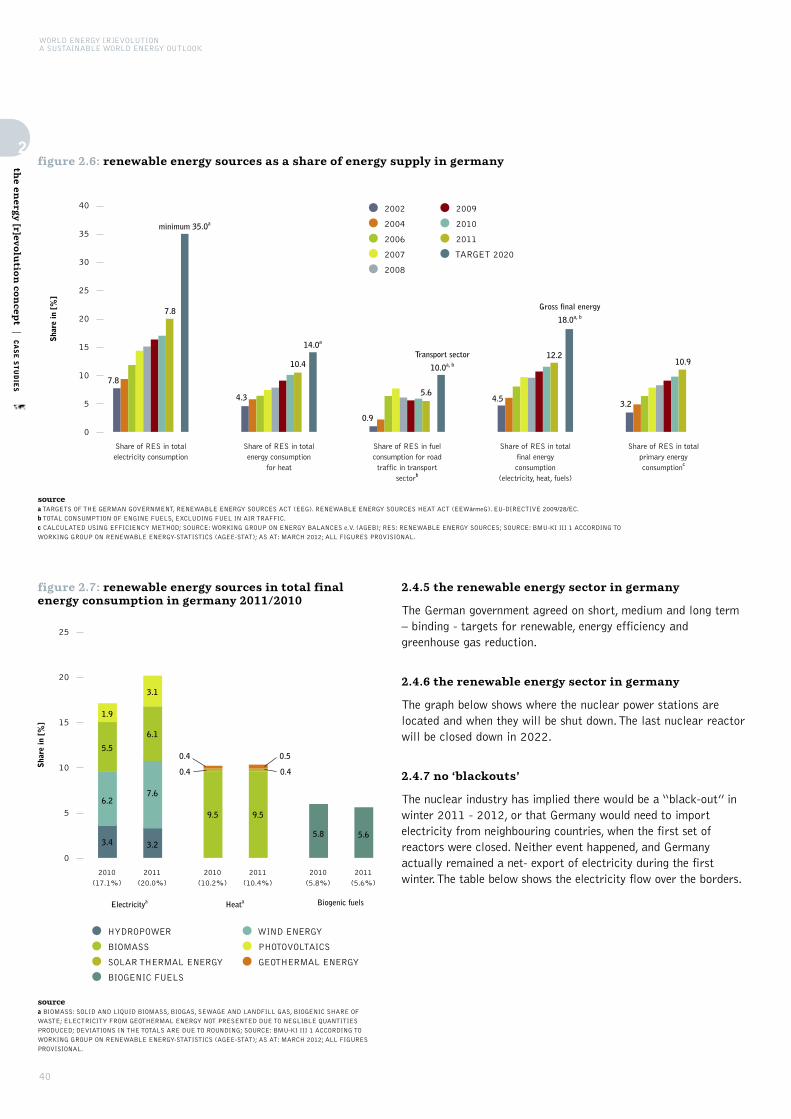
2.4.5 the renewable energy sector in germany
The German government agreed on short, medium and long term– binding - targets for renewable, energy efficiency andgreenhouse gas reduction.
2.4.6 the renewable energy sector in germany
The graph below shows where the nuclear power stations arelocated and when they will be shut down. The last nuclear reactorwill be closed down in 2022.
2.4.7 no ‘blackouts’
The nuclear industry has implied there would be a “black-out” inwinter 2011 - 2012, or that Germany would need to importelectricity from neighbouring countries, when the first set ofreactors were closed. Neither event happened, and Germanyactually remained a net- export of electricity during the firstwinter. The table below shows the electricity flow over the borders.
WORLD ENERGY [R]EVOLUTIONA SUSTAINABLE WORLD ENERGY OUTLOOK
40
2
the en
ergy [r]evo
lutio
n co
ncep
t|CASE STUDIES
figure 2.6: renewable energy sources as a share of energy supply in germany
•2002
• 2004
• 2006
• 2007
• 2008
• 2009
• 2010
• 2011
•TARGET 2020
Share in [%]
7.8
4.3
7.8
10.4
5.6
0.9
4.53.2
10.912.2
minimum 35.0a
14.0a
Transport sector
10.0a, b
Gross final energy
18.0a, b
Share of RES in totalelectricity consumption
Share of RES in totalenergy consumption
for heat
Share of RES in fuelconsumption for roadtraffic in transport
sectorb
Share of RES in totalfinal energyconsumption
(electricity, heat, fuels)
Share of RES in totalprimary energyconsumptionc
40
35
30
25
20
15
10
5
0
sourcea TARGETS OF THE GERMAN GOVERNMENT, RENEWABLE ENERGY SOURCES ACT (EEG). RENEWABLE ENERGY SOURCES HEAT ACT (EEWärmeG). EU-DIRECTIVE 2009/28/EC.b TOTAL CONSUMPTION OF ENGINE FUELS, EXCLUDING FUEL IN AIR TRAFFIC.c CALCULATED USING EFFICIENCY METHOD; SOURCE: WORKING GROUP ON ENERGY BALANCES e.V. (AGEB); RES: RENEWABLE ENERGY SOURCES; SOURCE: BMU-KI III 1 ACCORDING TOWORKING GROUP ON RENEWABLE ENERGY-STATISTICS (AGEE-STAT); AS AT: MARCH 2012; ALL FIGURES PROVISIONAL.
figure 2.7: renewable energy sources in total finalenergy consumption in germany 2011/2010
•HYDROPOWER
• BIOMASS
• SOLAR THERMAL ENERGY
• BIOGENIC FUELS
•WIND ENERGY
• PHOTOVOLTAICS
• GEOTHERMAL ENERGY
Share in [%]
3.4
6.2
5.5
1.9
2010 (17.1%)
2011 (20.0%)
3.2
7.6
6.1
3.1
Electricitya
9.5
0.4
0.4
2010 (10.2%)
2011 (10.4%)
9.5
0.4
0.5
Heata
5.8
2010 (5.8%)
2011 (5.6%)
5.6
Biogenic fuels
25
20
15
10
5
0
sourcea BIOMASS: SOLID AND LIQUID BIOMASS, BIOGAS, SEWAGE AND LANDFILL GAS, BIOGENIC SHARE OFWASTE; ELECTRICITY FROM GEOTHERMAL ENERGY NOT PRESENTED DUE TO NEGLIBLE QUANTITIES
PRODUCED; DEVIATIONS IN THE TOTALS ARE DUE TO ROUNDING; SOURCE: BMU-KI III 1 ACCORDING TO
WORKING GROUP ON RENEWABLE ENERGY-STATISTICS (AGEE-STAT); AS AT: MARCH 2012; ALL FIGURES
PROVISIONAL.
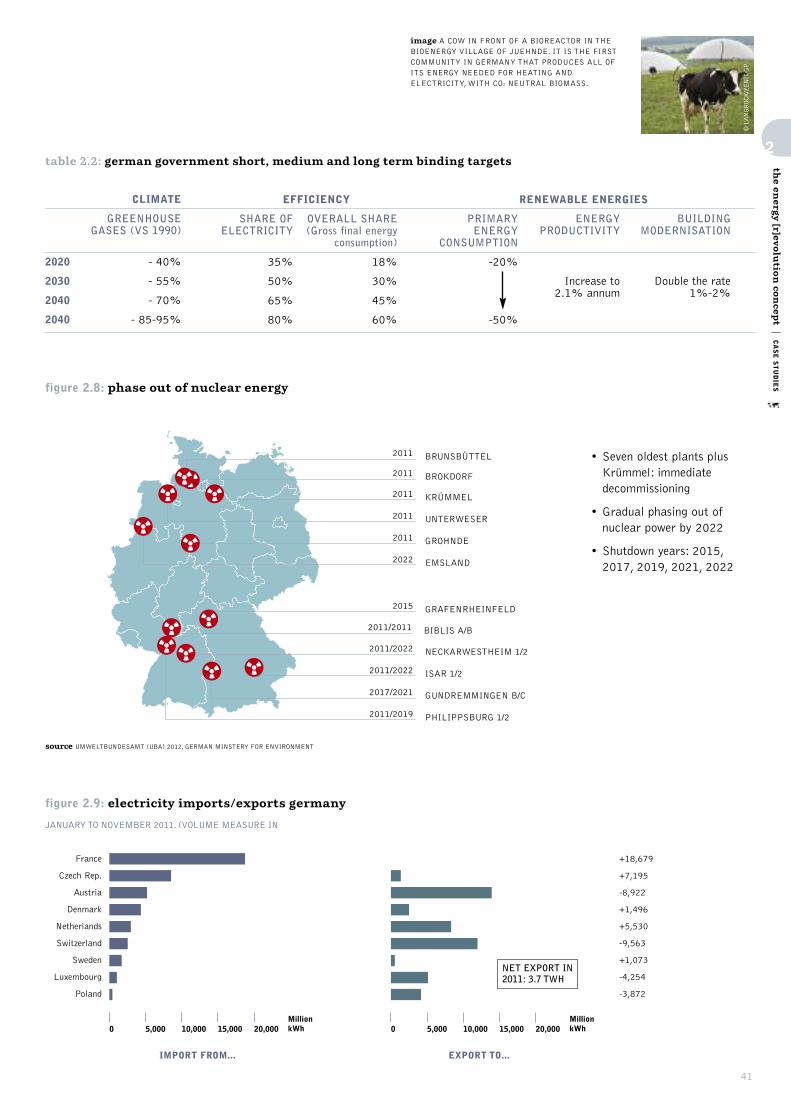
41
figure 2.8: phase out of nuclear energy
2
the en
ergy [r]evo
lutio
n co
ncep
t|CASE STUDIES
table 2.2: german government short, medium and long term binding targets
2020
2030
2040
2040
RENEWABLE ENERGIESCLIMATE
GREENHOUSEGASES (VS 1990)
- 40%
- 55%
- 70%
- 85-95%
PRIMARYENERGY
CONSUMPTION
-20%
-50%
ENERGYPRODUCTIVITY
Increase to2.1% annum
BUILDINGMODERNISATION
Double the rate1%-2%
EFFICIENCY
OVERALL SHARE (Gross final energy
consumption)
18%
30%
45%
60%
SHARE OFELECTRICITY
35%
50%
65%
80%
figure 2.9: electricity imports/exports germany
JANUARY TO NOVEMBER 2011. (VOLUME MEASURE IN
France
Czech Rep.
Austria
Denmark
Netherlands
Switzerland
Sweden
Luxembourg
Poland
0 5,000 10,000 15,000 20,000MillionkWh
MillionkWh
NET EXPORT IN2011: 3.7 TWH
IMPORT FROM...
+18,679
+7,195
-8,922
+1,496
+5,530
-9,563
+1,073
-4,254
-3,872
0 5,000 10,000 15,000 20,000
EXPORT TO...
2011 BROKDORF
2011 BRUNSBÜTTEL
2011 KRÜMMEL
2011 GROHNDE
2015 GRAFENRHEINFELD
2011/2011 BIBLIS A/B
2011 UNTERWESER
2022 EMSLAND
2011/2022 NECKARWESTHEIM 1/2
2017/2021 GUNDREMMINGEN B/C
2011/2022 ISAR 1/2
2011/2019 PHILIPPSBURG 1/2
• Seven oldest plants plusKrümmel: immediatedecommissioning
• Gradual phasing out ofnuclear power by 2022
• Shutdown years: 2015,2017, 2019, 2021, 2022
© LANGROCK/ZENIT/GP
image A COW IN FRONT OF A BIOREACTOR IN THEBIOENERGY VILLAGE OF JUEHNDE. IT IS THE FIRSTCOMMUNITY IN GERMANY THAT PRODUCES ALL OFITS ENERGY NEEDED FOR HEATING ANDELECTRICITY, WITH CO2 NEUTRAL BIOMASS.
source UMWELTBUNDESAMT (UBA) 2012, GERMAN MINSTERY FOR ENVIRONMENT
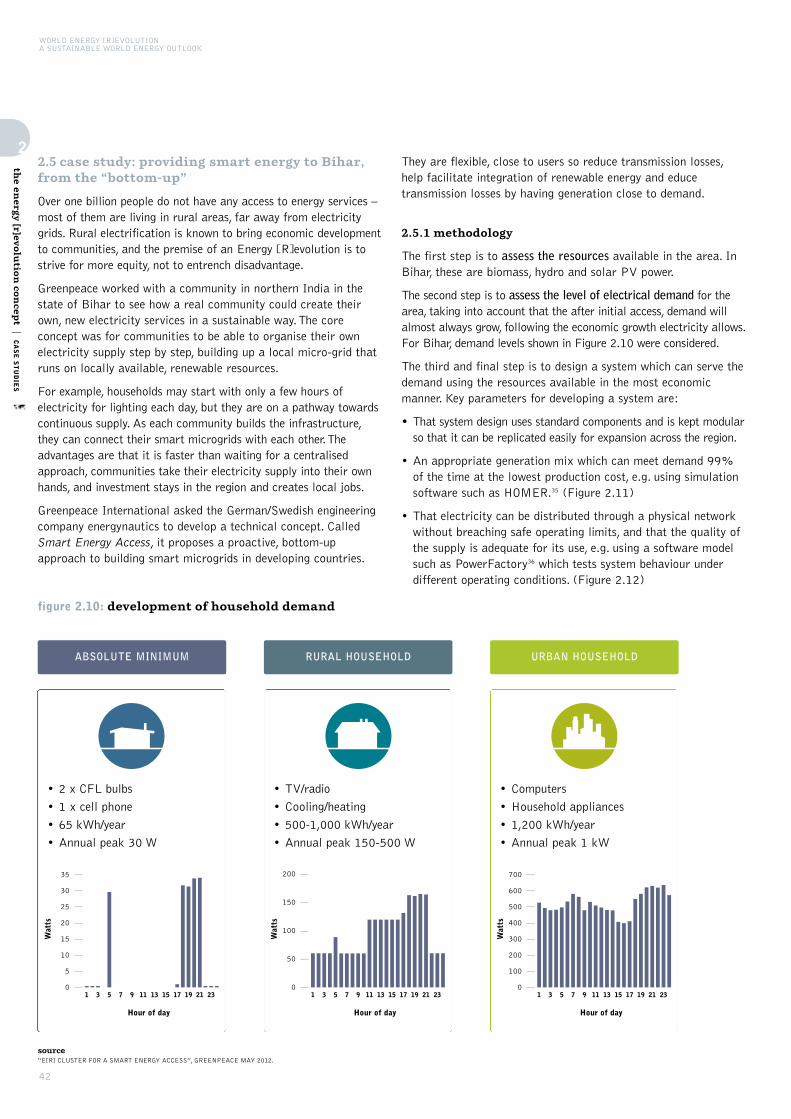
WORLD ENERGY [R]EVOLUTIONA SUSTAINABLE WORLD ENERGY OUTLOOK
42
2.5 case study: providing smart energy to Bihar,from the “bottom-up”
Over one billion people do not have any access to energy services –most of them are living in rural areas, far away from electricitygrids. Rural electrification is known to bring economic developmentto communities, and the premise of an Energy [R]evolution is tostrive for more equity, not to entrench disadvantage.
Greenpeace worked with a community in northern India in thestate of Bihar to see how a real community could create theirown, new electricity services in a sustainable way. The coreconcept was for communities to be able to organise their ownelectricity supply step by step, building up a local micro-grid thatruns on locally available, renewable resources.
For example, households may start with only a few hours ofelectricity for lighting each day, but they are on a pathway towardscontinuous supply. As each community builds the infrastructure,they can connect their smart microgrids with each other. Theadvantages are that it is faster than waiting for a centralisedapproach, communities take their electricity supply into their ownhands, and investment stays in the region and creates local jobs.
Greenpeace International asked the German/Swedish engineeringcompany energynautics to develop a technical concept. CalledSmart Energy Access, it proposes a proactive, bottom-upapproach to building smart microgrids in developing countries.
They are flexible, close to users so reduce transmission losses,help facilitate integration of renewable energy and educetransmission losses by having generation close to demand.
2.5.1 methodology
The first step is to assess the resources available in the area. InBihar, these are biomass, hydro and solar PV power.
The second step is to assess the level of electrical demand for thearea, taking into account that the after initial access, demand willalmost always grow, following the economic growth electricity allows.For Bihar, demand levels shown in Figure 2.10 were considered.
The third and final step is to design a system which can serve thedemand using the resources available in the most economicmanner. Key parameters for developing a system are:
• That system design uses standard components and is kept modularso that it can be replicated easily for expansion across the region.
• An appropriate generation mix which can meet demand 99%of the time at the lowest production cost, e.g. using simulationsoftware such as HOMER.35 (Figure 2.11)
• That electricity can be distributed through a physical networkwithout breaching safe operating limits, and that the quality ofthe supply is adequate for its use, e.g. using a software modelsuch as PowerFactory36 which tests system behaviour underdifferent operating conditions. (Figure 2.12)
2
the en
ergy [r]evo
lutio
n co
ncep
t|CASE STUDIES
figure 2.10: development of household demand
ABSOLUTE MINIMUM RURAL HOUSEHOLD URBAN HOUSEHOLD
ABSOLUTE MINIMUM
RURAL HOUSEHOLD
URBAN HOUSEHOLD
ABSOLUTE MINIMUM
RURAL HOUSEHOLD
URBAN HOUSEHOLD
ABSOLUTE MINIMUM
RURAL HOUSEHOLD
URBAN HOUSEHOLD
source“E[R] CLUSTER FOR A SMART ENERGY ACCESS”, GREENPEACE MAY 2012.
• 2 x CFL bulbs
• 1 x cell phone
• 65 kWh/year
• Annual peak 30 W
• TV/radio
• Cooling/heating
• 500-1,000 kWh/year
• Annual peak 150-500 W
• Computers
• Household appliances
• 1,200 kWh/year
• Annual peak 1 kW
35
30
25
20
15
10
5
0
Watts
Hour of day
1 3 5 7 9 11 13 15 17 19 21 23
200
150
100
50
0
Watts
Hour of day
1 3 5 7 9 11 13 15 17 19 21 23
700
600
500
400
300
200
100
0
Watts
Hour of day
1 3 5 7 9 11 13 15 17 19 21 23
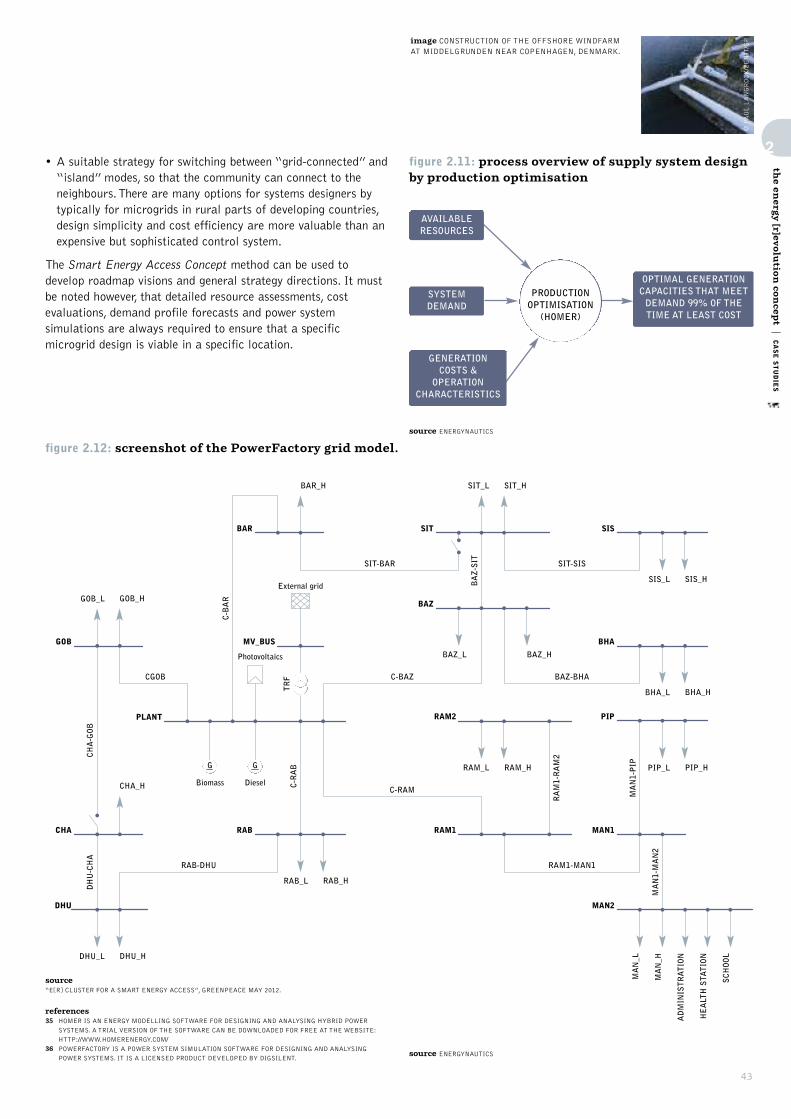
43
• A suitable strategy for switching between “grid-connected” and“island” modes, so that the community can connect to theneighbours. There are many options for systems designers bytypically for microgrids in rural parts of developing countries,design simplicity and cost efficiency are more valuable than anexpensive but sophisticated control system.
The Smart Energy Access Concept method can be used todevelop roadmap visions and general strategy directions. It mustbe noted however, that detailed resource assessments, costevaluations, demand profile forecasts and power systemsimulations are always required to ensure that a specificmicrogrid design is viable in a specific location.
2
the en
ergy [r]evo
lutio
n co
ncep
t|CASE STUDIES
references35 HOMER IS AN ENERGY MODELLING SOFTWARE FOR DESIGNING AND ANALYSING HYBRID POWER
SYSTEMS. A TRIAL VERSION OF THE SOFTWARE CAN BE DOWNLOADED FOR FREE AT THE WEBSITE:
HTTP://WWW.HOMERENERGY.COM/
36 POWERFACTORY IS A POWER SYSTEM SIMULATION SOFTWARE FOR DESIGNING AND ANALYSING
POWER SYSTEMS. IT IS A LICENSED PRODUCT DEVELOPED BY DIGSILENT.
AVAILABLE RESOURCES
SYSTEMDEMAND
GENERATIONCOSTS &
OPERATIONCHARACTERISTICS
OPTIMAL GENERATIONCAPACITIES THAT MEETDEMAND 99% OF THETIME AT LEAST COST
PRODUCTIONOPTIMISATION(HOMER)
figure 2.11: process overview of supply system designby production optimisation
source ENERGYNAUTICS
figure 2.12: screenshot of the PowerFactory grid model.
source ENERGYNAUTICS
GOB
BAR SIT
BAZ
BHA
SIS
BAZ_L BAZ_H
RAM_L RAM_H
RAM1-RAM2
MAN1-PIP
MAN1-MAN2
SIT-BAR SIT-SIS
MV_BUS
PLANT
Biomass Diesel
Photovoltaics
External grid
G
DHU_L DHU_H
RAB_L RAB_H
BAR_H SIT_HSIT_L
GOB_L GOB_H
CHA_H
CGOB
CHA RAB
RAB-DHU
CHA-GOB
C-BAR
BAZ-SIT
TRF
C-RAB
DHU-CHA
DHU
G
PIPRAM2
RAM1 MAN1
MAN2
C-BAZ BAZ-BHA
C-RAM
RAM1-MAN1
SIS_L SIS_H
BHA_L BHA_H
PIP_L
MAN_L
MAN_H
ADMINISTRATION
HEALTH STATION
SCHOOL
PIP_H
© PAUL LANGROCK/ZENIT/GPimage CONSTRUCTION OF THE OFFSHORE WINDFARM
AT MIDDELGRUNDEN NEAR COPENHAGEN, DENMARK.
source“E[R] CLUSTER FOR A SMART ENERGY ACCESS”, GREENPEACE MAY 2012.
WORLD ENERGY [R]EVOLUTIONA SUSTAINABLE WORLD ENERGY OUTLOOK
44
2.5.2 implementation
Once an electricity service is available, people generally increasetheir consumption. A typical pattern for system growth in India is:
• 60kWh per household, covering basic lighting, based on twoenergy-efficient globes per household for a few hours. In Bihar,this can be provided efficiently with a predominantly biomass-powered system, such as the Husk Power Systems37, which arealready in use in a number of villages.
• 500 kWh per household, provided by a predominantly biomass-diesel system or a biomass-hydro system (if water is availablenearby). Such systems can be achieved at costs of around 14-15 INR/kWh, or 9-10 INR/kWh respectively and will coverdemand from appliances such as fans, television sets andcellular phones
• 1,200 kWh per year per household – an urban level ofelectricity consumption – can not be provided by the simplesystems described above. Without hydro power solar PV wouldbe required, and where hydro power is available, diesel wouldneed to be included to cover seasonal flows. These systems canbe achieved also at costs of 14-15 INR/kWh, or 9-10 INR/kWh respectively.
2.5.3 lessons from the study
When considering bottom-up microgrid developments some keypoints for the system’s expansion are:
Unit Sizes. From 32 kW and 52 kW for biomass husks to 100kW minimum for an economic micro-hydro system (based on thegeneral flows for the state of Bihar) to a tiny 100-1,000 W forrooftop solar PV. Diesel generators which could operate withbiofuels come in all sizes as they are a more conventionalproduct. The system owner would have to decide how best toexpand the system in a piecewise fashion.
Connection to the grid.When eventually connected to State orNational grid, different arrangements mean the community canbe connected or autonomous, depending on the situation.However, expensive and experimental control systems thatmanage complex transitions would be difficult to implement in arural area in a developing country which has financial barriers,lower operational capacity, less market flexibility and regulatoryconsiderations. A simplified design concept limits transitions fromgrid-connected mode to “island mode” when there are centralgrid blackouts, and back again.
Capacity and number systems. To replicate this type of microgriddesign across the entire state of Bihar, a rough approximationbased on geographical division indicates that 13,960 villages canbe supplied by a non-hydro no wind system and 3,140 villageswith a hydro system. It is assumed that there is potential for upto 1,900 systems where wind power may be used, and that a totalnumber of 19,000 villages are appropriate to cover all ruralareas in the state of Bihar. With such an expansion strategy, atminimum (corresponding to demand scenario 2) approximately1,700 MW of biomass, 314 MW of hydro and 114 MW of PVpower installations would be required. At the stage whenmicrogrids are fully integrated with the central grid (demandscenario 4), it is expected that at least 4,000 MW of biomass,785 MW of hydro and 10,000 MW of PV power installationswould be required.
Distance to the grid. System costs of the optimal microgriddesigns were compared with the cost of extending the grid todetermine the break-even grid distance. Calculations show thebreak-even grid distance for a biomass + solar + hydro + dieselsystem (with or without wind) is approximately 5 kilometres,while for a biomass + solar + diesel system (with or withoutwind) is approximately 10 kilometres.
Technology type. The system costs did not vary significantly withthe addition of wind power in the generation mix, or with asignificant reduction in solar PV installation costs because thecosts per installed kilowatt of such systems are already higherthan for the other generators. However, when diesel pricesincrease, the overall system costs also rise, as the cost of energyproduction from the diesel units increase, but the installationcosts are still lower than for solar PV and wind power systems.
The case study in Bihar, India, show how microgrids can functionas an off-grid system, incorporate multiple generation sources,adapt to demand growth, and be integrated with the central gridwhile still separate and operate as an island grid if needed.
2
the en
ergy [r]evo
lutio
n co
ncep
t|CASE STUDIES
reference37 WWW.HUSKPOWERSYSTEMS.COM

45
2.6 greenpeace proposal to support a renewableenergy cluster
This energy cluster system builds upon Greenpeace’s Energy[R]evolution scenario38 which sets out a global energy pathway thatnot only phases out dirty and dangerous fossil fuels over time tohelp cut CO2 levels, but also brings energy to the 2 billion people onthe planet that currently don’t have access to energy. The mosteffective way to ensure financing for the energy [r]evolution in thepower sector is via Feed-in laws.
To plan and invest in an energy infrastructure, whether forconventional or renewable energy, requires secure policyframeworks over decades. The key requirements are:
long term security for the investment The investor needs to knowthe pattern of evolution of the energy policy over the entireinvestment period (until the generator is paid off). Investors wanta “good” return of investment and while there is no universaldefinition of a good return, it depends on the long termprofitability of the activity as well as on the inflation rate of thecountry and the short term availability of cash throughout theyear to sustain operations.
maximize the leverage of scarce financial resources Access toprivileged credit facilities, under State guarantee, are one of thepossible instruments that can be deployed by governments tomaximise the distribution of scarce public and internationalfinancial resources, leverage on private investment and incentivizedevelopers to rely on technologies that guarantee long termfinancial sustainability.
long-term security for market conditions The investor needs toknow if the electricity or heat from the power plant can be soldto the market for a price which guarantees a “good” return ofinvestment (ROI). If the ROI is high, the financial sector willinvest; if it is low compared to other investments then financialinstitutions will not invest. Moreover, the supply chain ofproducers needs to enjoy the same level of favourable marketconditions and stability (e.g. agricultural feedstock).
transparent planning process A transparent planning process iskey for project developers, so they can sell the planned project toinvestors or utilities. The entire licensing process must be clear,transparent and fast.
access to the (micro) grid A fair access to the grid is essential forrenewable power plants. If there is no grid connection availableor if the costs to access the grid are too high the project will notbe built. In order to operate a power plant it is essential forinvestors to know if the asset can reliably deliver and sellelectricity to the grid. If a specific power plant (e.g. a wind farm)does not have priority access to the grid, the operator might haveto switch the plant off when there is an oversupply from otherpower plants or due to a bottleneck situation in the grid. Thisarrangement can add high risk to the project financing and itmay not be financed or it will attract a “risk-premium” whichwill lower the ROI.
2
the en
ergy [r]evo
lutio
n co
ncep
t|CASE STUDIES
GRIDJobs
10
75
153
447
10
141
343
541
10
75
153
410
EMPLOYMENT
GENERATIONJobs
1,778
5,936
14,326
16,340
1,778
2,782
11,742
15,770
1,778
5,936
14,326
21,470
AVERAGE ACCROSSALL TECHNOLOGIES
INR/kWh
25
19
25
19
25
11
13
13
25
19
25
21
FIT
TOTALmillion t CO2/a
0.8
6.7
13.4
32.0
0.8
6.7
13.4
32.0
0.8
6.7
13.4
32.0
SPECIFICt CO2 /GWh
1,100
1,100
1,100
CO2 SAVINGS
TOTALJobs
1,788
6,011
14,479
16,787
1,788
2,922
12,085
16,311
1,788
6,011
14,479
21,880
table 2.3: key results for energy [r]evolution village cluster - state of bihar (rural) - employment, environment + fit
SCENARIO
Scenario A: Solar + Biomass
Absolute Minimum (state-wide)
Low income demand (state-wide)
Medium income demand (state-wide)
Urban households (state-wide)
Scenario B: Solar + Small Hydro + Biomass
Absolute Minimum (state-wide)
Low income demand (state-wide)
Medium income demand (state-wide)
Urban households (state-wide)
Scenario C: Solar + Wind + Biomass
Absolute Minimum (state-wide)
Low income demand (state-wide)
Medium income demand (state-wide)
Urban households (state-wide)
reference38 ENERGY [R]EVOLUTION – A SUSTAINABLE ENERG Y WORLD ENERGY OUTLOOK 2012,
GREENPEACE INTERNATIONAL, AMSTERDAM – THE NETHERLANDS, JUNE 2012.
© GP/BAS BEENTJES
image A TRUCK DROPS ANOTHER LOAD OF WOODCHIPS AT THE BIOMASS POWER PLANT INLELYSTAD, THE NETHERLANDS.
source“E[R] CLUSTER FOR A SMART ENERGY ACCESS”, GREENPEACE MAY 2012.
WORLD ENERGY [R]EVOLUTIONA SUSTAINABLE WORLD ENERGY OUTLOOK
46
2
the en
ergy [r]evo
lutio
n co
ncep
t|CASE STUDIES
2.6.1 a rural feed-in tariff for bihar
In order to help implement the Energy [R]evolution clusters inBihar, Greenpeace suggests starting a feed-in regulation for thecluster, which will be partly financed by international funds. Theinternational program should add a CO2 saving premium of 10Indian Rupee (INR) per kWh for 10 years. This premium shouldbe used to help finance the required power generation as well asthe required infrastructure (grids). In the Table 2.2 the CO2
savings, rough estimation of employment effects as well as therequired total funding for the CO2 premium for the state of Biharare shown.
2.7 energy [r]evolution cluster jobs
While the employment effect for the operation and maintenance(O&M) for solar photovoltaics (0.4/MW), wind (0.4/MW), hydro(0.2/MW) and bio energy (3.1/MW) are very well documented,39
the employment effect of grid operations and maintenance arenot. Therefore Greenpeace assumed in this calculation that foreach 100 GWh one job will be created. This number is based ongrid operators in Europe and might be too conservative. Howeverit is believed that the majority of the jobs will be created by theO&M of power generation; grid operation may be part of thiswork as well.
Due to the high uncertainty of employment effects from gridoperation, these numbers are only indicative.
Microgrids can offer reliable and cost competitive electricityservices, providing a viable alternative to the conventionaltopdown approach of extending grid services. The microgridapproach is “smart” because it can facilitate the integration ofrenewable energies, thereby contributing to national renewableenergy (RE) targets. In addition it can reduce transmission lossesby having generation close to demand. Being built from modulardistributed generation units, it can adequately adjust to demandgrowth. It can operate both in island mode and grid-connectedmode, making operation flexible and can also offer grid supportfeatures. This report demonstrates with a case study how thisbottom-up approach with microgrids would work. It focuses ondevelopment in the state of Bihar in India.
Step 1: renewable resource assessment The first step to thisapproach is to make an assessment of the resources available inthe area. In the case of Bihar, these are biomass, hydro and solarPV power. While there are no detailed wind measurementsavailable, there are indications that in some areas wind turbinescould operate economically as well.
Step 2: demand projections The second step is to assess the levelof electrical demand that will need to be serviced. Once there isaccess to electricity services, demand will almost always grow,accompanying economic growth. For the case of Bihar thefollowing demand levels were considered, which are characterisedby total energy consumption, peak demand and daily load profilesas shown in Figure 2.10.
As the proposed bottom-up electrification approach starts on a pervillage basis, a set of village demand profiles is generated based onthese hypothetical household demand profiles. The village demandprofiles also contain assumptions about non-household loads suchas a school, health stations or public lighting.
The village-based electricity supply system forms the smallestindividual unit of a supply system. Therefore the matching set ofgeneration assets is also determined on a per-village basis.
Step 3: define optimal generation mix The third step in thisapproach is to design a system which can serve the demand usingthe resources available in the most economic manner. At thispoint it is of utmost importance that the system design usesstandard components and is kept modular so that it can bereplicated easily for expansion across the entire state. Indesigning such a system, an appropriate generation mix needs tobe developed, which can meet demand 99% of the time at thelowest production cost. This can be determined using productionsimulation software such as HOMER40, which calculates theoptimal generation capacities based on a number of inputs aboutthe installation and operation costs of different types ofgeneration technologies in India.
reference39 INSTITUTE FOR SUSTAINABLE FUTURES (ISF), UNIVERS ITY OF TECHNOLOGY, SYDNEY, AUSTRALIA: JAY
RUTOVITZ, ALISON ATHERTON.
40 HOMER IS AN ENERGY MODELLING SOFTWARE FOR DESIGNING AND ANALYSING HYBRID
POWER SYSTEMS . A TRIAL VERSION OF THE SOFTWARE CAN BE DOWNLOADED FOR FREE AT
THE WEBSITE: HTTP://WWW.HOMERENERG Y.COM/

47
2
the en
ergy [r]evo
lutio
n co
ncep
t|CASE STUDIES
Step 4: network design Once the optimal supply system design isdetermined, it is also important to make sure that such a supplysystem can be distributed through a physical network withoutbreaching safe operating limits, and that the quality of thedelivered electricity is adequate for its use. This can be done bymodelling the physical system using power system simulationsoftware such as PowerFactory.41 In this way the behaviour of theelectrical system under different operating conditions can betested, for example in steady-state power flow calculations.Figure 2.12 shows a diagram of the village power system modelused in this study.
Step 5: control system considerations The final part of thesystem design involves the development of a suitable strategy forswitching between grid-connected and island modes. Dependingon the quality of service required by the loads in the microgrid,the regulations stipulated in the grid code for operation practices,and number of grid support features desired, several differentdesigns could be developed. For microgrids as part of ruralelectrification efforts in developing countries however, designsimplicity and cost efficiency weighs more than the benefits ofhaving an expensive but sophisticated control system. Through theuse of microgrids, the gap between rural electrification anduniversal electrification with grid expansion can be met, while atthe same time bringing many additional benefits both for theconsumers and grid operators. By developing a system which ismodular and constructed using standard components, it makes iteasier to replicate it across wide areas with varying geographiccharacteristics. The method demonstrated in this report can beused to develop roadmap visions and general strategy directions.It must be noted however, that detailed resource assessments,cost evaluations, demand profile forecasts and power systemsimulations are always required to ensure that a specificmicrogrid design is viable in a specific location.
TOTAL ANNUAL DEMANDkWh/a
40,514
321,563
640,117
1,530,037
DEMAND PER DAYkWh/day
111
881
1,754
4,192
TOTAL INSTALLED CAPACITYkW
31.5
106
265
800
PEAK DEMANDkW peak
22
99.4
271
554
SUPPLY NEEDSDEMAND SCENARIOS
table 2.4: village cluster demand overview
SCENARIO
Absolute Minimum (state-wide)
Low income demand (state-wide)
Medium income demand (state-wide)
Urban households (state-wide)
reference41 POWER FACTORY IS A POWER SYSTEM SIMULATION SOFTWARE FOR DESIGNING AND
ANALYSING POWER SYSTEMS. IT IS A LICENSED PRODUCT DEVELOPED BY DIGSILENT.
source“E[R] CLUSTER FOR A SMART ENERGY ACCESS”, GREENPEACE MAY 2012.
© GP/FLAVIO CANNALONGA
image CHECKING THE SOLAR PANELS ON TOP OF THEGREENPEACE POSITIVE ENERGY TRUCK IN BRAZIL.

48
3
3implementing the energy [r]evolution
image THE FORESTS OF THE SOUTH-CENTRAL AMAZON BASIN, RONDONIA, BRAZIL, 1975.
RENEWABLE ENERGY PROJECTPLANNING BASICS
RENEWABLE ENERGY FINANCING BASICS
investments in renewablesare investments in the future.”
“
© NASA

3
implem
entin
g th
e energ
y [r]evolu
tion
|RENEWABLE ENERGY PROJECT PLANNING BASICS
49
© GP/NICK COBBING
image GEOTHERMAL ACTIVITY NEARHOLSSELSNALAR CLOSE TO REYKJAVIK, ICELAND.
3.1 renewable energy project planning basics
The renewable energy market works significantly different than thecoal, gas or nuclear power market. The table below provides anoverview of the ten steps from “field to an operating power plant”for renewable energy projects in the current market situation. Those
steps are similar same for each renewable energy technology,however step 3 and 4 are especially important for wind and solarprojects. In developing countries the government and the mostlystate owned utilities might directly or indirectly takeresponsibilities of the project developers. The project developermight also work as a subdivision of a state owned utility.
table 3.1: how does the current renewable energy market work in practice?
P = Project developer, M = Meteorological Experts, I = Investor, U = utility.
STEP WHAT WILL BE DONE? NEEDED INFORMATION / POLICY AND/OR INVESTMENT FRAMEWORK
WHO?
Step 1:
Site identification
Identify the best locations for generators e.g. windturbines and pay special attention to technical andcommercial data, conservation issues and anyconcerns that local communities may have.
Resource analysis to identify possible sites
Policy stability in order to make sure that the policyis still in place once Step 10 has been reached.
Without a certainty that the renewable electricityproduced can be fed entirely into the grid to a reliabletariff, the entire process will not start.
P
Step 2:
Securing land under civil law
Secure suitable locations through purchase andlease agreements with land owners.
Transparent planning, efficient authorisation and permitting.
P
Step 3:
Determining site specificpotential
Site specific resource analysis (e.g. windmeasurement on hub height) from independentexperts. This will NOT be done by the projectdeveloper as (wind) data from independent expertsis a requirement for risk assessments by investors.
See above.P + M
Step 4:
Technical planning/micrositing
Specialists develop the optimum wind farmconfiguration or solar panel sites etc, taking a widerange of parameters into consideration in order toachieve the best performance.
See above.P
Step 5:
Permit process
Organise all necessary surveys, put together therequired documentation and follow the wholepermit process.
Transparent planning, efficient authorisation and permitting.
P
Step 6:
Grid connectionplanning
Electrical engineers work with grid operators todevelop the optimum grid connection concept.
Priority access to the grid.
Certainty that the entire amount of electricityproduced can be feed into the grid.
P + U
Step 7:
Financing
Once the entire project design is ready and theestimated annual output (in kWh/a) has beencalculated, all permits are processed and the totalfinance concept (incl. total investment and profitestimation) has been developed, the projectdeveloper will contact financial institutions to eitherapply for a loan and/or sell the entire project.
Long term power purchase contract.
Prior and mandatory access to the grid.
Site specific analysis (possible annual output).
P + I
Step 8:
Construction
Civil engineers organise the entire construction phase.This can be done by the project developer or another.
EPC (Engineering, procurement & construction)company – with the financial support from the investor.
Signed contracts with grid operator.
Signed contract with investors.
P + I
Step 9:
Start of operation
Electrical engineers make sure that the powerplant will be connected to the power grid.
Prior access to the grid (to avoid curtailment).P + U
Step 10:
Business andoperationsmanagement
Optimum technical and commercial operation ofpower plants/farms throughout their entireoperating life – for the owner (e.g. a bank).
Good technology & knowledge (A cost-savingapproach and “copy + paste engineering” will be moreexpensive in the long-term).
P + U + I

WORLD ENERGY [R]EVOLUTIONA SUSTAINABLE WORLD ENERGY OUTLOOK
3
implem
entin
g th
e energ
y [r]evolu
tion
|RENEWABLE ENERGY FINANCING BASICS
50
3.2 renewable energy financing basics
The Swiss RE Private Equity Partners have provide anintroduction to renewable energy infrastructure investing(September 2011) which describes what makes renewable energyprojects different from fossil-fuel based energy assets from afinance perspective:
• Renewable energy projects have short construction periodcompared to conventional energy generation and otherinfrastructure assets. Renewable projects have limited ramp-upperiods, and construction periods of one to three years, comparedto 10 years to build large conventional power plants.
• In several countries, renewable energy producers have beengranted priority of dispatch. Where in place, grid operators areusually obliged to connect renewable power plants to their gridand for retailers or other authorised entities to purchase allrenewable electricity produced.
• Renewable projects present relatively low operationalcomplexity compared to other energy generation assets or otherinfrastructure asset classes. Onshore wind and solar PVprojects in particular have well established operational trackrecords. This is obviously less the case for biomass or offshorewind plants.
• Renewable projects typically have non-recourse financining,through a mix of debt and equity. In contrast to traditionalcorporate lending, project finance relies on future cash flowsfor interest and debt repayment, rather than the asset value orthe historical financial performance of a company. Projectfinance debt typically covers 70–90% of the cost of a project,is non-recourse to the investors, and ideally matches theduration of the underlying contractual agreements.
• Renewable power typically has predictable cash flows and it isnot subject to fuel price volatility because the primary energyresource is generally freely available. Contractually guaranteedtariffs, as well as moderate costs of erecting, operating andmaintaining renewable generation facilities, allow for highprofit margins and predictable cash flows.
• Renewable electricity remuneration mechanisms often includesome kind of inflation indexation, although incentive schemesmay vary on a case-by-case basis. For example, several tariffsin the EU are indexed to consumer price indices and adjustedon an annual basis (e.g. Spain, Italy). In projects wherespecific inflation protection is not provided (e.g. Germany), theregulatory framework allows selling power on the spot market,should the power price be higher than the guaranteed tariff.
• Renewable power plants have expected long useful lives (over20 years). Transmission lines usually have economic lives ofover 40 years. Renewable assets are typically underpinned bylong-term contracts with utilities and benefit fromgovernmental support and manufacturer warranties.
• Renewable energy projects deliver attractive and stable sourcesof income, only loosely linked to the economic cycle. Projectowners do not have to manage fuel cost volatility and projectsgenerate high operating margins with relatively secure revenuesand generally limited market risk.
• The widespread development of renewable power generationwill require significant investments in the electricity network.As discussed in Chapter 2 future networks (smart grids) willhave to integrate an ever-increasing, decentralised, fluctuatingsupply of renewable energy. Furthermore, suppliers and/ordistribution companies will be expected to deliver asophisticated range of services by embedding digital griddevices into power networks.
Opportunites
Power generation Transmission & storage
Investors benefits
figure 3.1: return characteristics of renewable energies
sourceSWISS RE PRIVATE EQUITY PARTNERS.
SHORT CONSTRUCTIONPERIOD
GARANTEED POWER DISPATCH
LOW OPERATIONALCOMPLEXITY
NON-RECOURSEFINANCING
PREDICTABLE CASH FLOWS
INFLATION LINKAGE
LONG DURATION
RECURRINGINCOME
© LANGROCK / GREENPEACE
© DREAMSTIME

3
implem
entin
g th
e energ
y [r]evolu
tion
|RENEWABLE ENERGY FINANCING BASICS
51
© GP/EX-PRESS/HEIKE
image A LARGE SOLAR SYSTEM OF 63M2 RISES ONTHE ROOF OF A HOTEL IN CELERINA, SWITZERLAND.THE COLLECTOR IS EXPECTED TO PRODUCE HOTWATER AND HEATING SUPPORT AND CAN SAVEABOUT 6,000 LITERS OF OIL PER YEAR. THUS, THE CO2
EMISSIONS AND COMPANY COSTS CAN BE REDUCED.
Risk assessment and allocation is at the centre of project finance.Accordingly, project structuring and expected return are directlyrelated to the risk profile of the project. The four main risk factorsto consider when investing in renewable energy assets are:
• Regulatory risks refer to adverse changes in laws andregulations, unfavourable tariff setting and change or breach ofcontracts. As long as renewable energy relies on governmentpolicy dependent tariff schemes, it will remain vulnerable tochanges in regulation. However a diversified investment acrossregulatory jurisdictions, geographies, and technologies can helpmitigate those risks.
• Construction risks relate to the delayed or costly delivery of anasset, the default of a contracting party, or anengineering/design failure. Construction risks are less prevalentfor renewable energy projects because they have relativelysimple design, however, construction risks can be mitigated byselecting high-quality and experienced turnkey partners, usingproven technologies and established equipment suppliers as wellas agreeing on retentions and construction guarantees.
• Financing risks refer to the inadequate use of debt in thefinancial structure of an asset. This comprises the abusive useof leverage, the exposure to interest rate volatility as well asthe need to refinance at less favourable terms.
• Operational risks include equipment failure, counterparty defaultand reduced availability of the primary energy source (e.g. wind,heat, radiation). For renewable assets a lower than forecastedresource availability will result in lower revenues and profitabilityso this risk can damage the business case. For instance, abnormalwind regimes in Northern Europe over the last few years haveresulted in some cases in breach of coverage ratios and in theinability of some projects to pay dividends to shareholders.
REGULATORY RISKS CONSTRUCTION RISKS
figure 3.2: overview risk factors for renewable energy projects
FINANCING RISKS OPERATIONAL RISKS
sourceSWISS RE PRIVATE EQUITY PARTNERS.
Stage
Strategy
RISKS
DEVELOPMENT CONSTRUCTION OPERATIONS
EARLY-STAGE GREENFIELD LATE-STAGE GREENFIELD BROWNFIELD
figure 3.3: investment stages of renewable energy projects
sourceSWISS RE PRIVATE EQUITY PARTNERS.
• Site identification
• Approval & permitting process
• Land procurement
• Technical planning
• Financing close
• Equipment procurement
• Engineering
• Construction
• Commissioning
• Operations
• Maintenance
• Refinancing
• Refurbishment/Repowering
Higher Lower
© DAVIS / GREENPEACE
© DAVIS / GREENPEACE
© LANGROCK / GREENPEACE

Despite the relatively strong growth in renewable energies insome countries, there are still many barriers which hinder therapid uptake of renewable energy needed to achieve the scale ofdevelopment required. The key barriers to renewable energyinvestment identified by Greenpeace through a literature review42
and interviews with renewable energy sector financiers anddevelopers are shown in Figure 3.4.
There are broad categories of common barriers to renewable energydevelopment that are present in many countries, however the natureof the barriers differs significantly. At the local level, political andpolicy support, grid infrastructure, electricity markets and planningregulations have to be negotiated for new projects.
WORLD ENERGY [R]EVOLUTIONA SUSTAINABLE WORLD ENERGY OUTLOOK
52
3.2.1 overcoming barriers to finance and investment for renewable energy
table 3.2: categorisation of barriers to renewable energy investment
CATEGORY SUB-CATEGORY EXAMPLE BARRIERS
Barriers to finance Cost barriers
Insufficient information and experience
Financial structure
Project and industry scale
Investor confidence
Costs of renewable energy to generateMarket failures (e.g. No carbon price)Energy pricesTechnical barriersCompeting technologies (Gas, nuclear, CCS and coal)
Overrated risksLack of experienced investors Lack of experienced project developersWeak finance sectors in some countries
Up-front investment costCosts of debt and equityLeverageRisk levels and finance horizonEquity/credit/bond optionsSecurity for investment
Relative small industry scaleSmaller project scale
Confidence in long term policyConfidence in short term policyConfidence in the renewable energy market
Other investmentbarriers
Government renewable energy policy and law
System integration and infrastructure
Lock in of existing technologies
Permitting and planning regulation
Government economic position and policy
Skilled human resources
National governance and legal system
Feed-in tariffsRenewable energy targetsFramework law stabilityLocal content rules
Access to gridEnergy infrastructureOverall national infrastructure qualityEnergy marketContracts between generators and users
Subsidies to other technologies Grid lock-inSkills lock-inLobbying power
FavourabilityTransparencyPublic support
Monetary policy e.g. interest ratesFiscal policy e.g. stimulus and austerityCurrency risksTariffs in international trade
Lack of training courses
Political stabilityCorruptionRobustness of legal systemLitigation risksIntellectual property rightsInstitutional awareness
3
implem
entin
g th
e energ
y [r]evolu
tion
|RENEWABLE ENERGY FINANCING BASICS

53
© GP/MARKEL REDONDO
image AERIAL PHOTO OF THE ANDASOL 1 SOLARPOWER STATION, EUROPE’S FIRST COMMERCIALPARABOLIC TROUGH SOLAR POWER PLANT. ANDASOL1 WILL SUPPLY UP TO 200,000 PEOPLE WITHCLIMATE-FRIENDLY ELECTRICITY AND SAVE ABOUT149,000 TONNES OF CARBON DIOXIDE PER YEARCOMPARED WITH A MODERN COAL POWER PLANT.
In some regions, it is uncertainty of policy that is holding backinvestment more than an absence of policy support mechanisms. Inthe short term, investors aren’t confident rules will remain unalteredand aren’t confident that renewable energy goals will be met in thelonger term, let alone increased.
When investors are cautious about taking on these risks, it drives upinvestment costs and the difficulty in accessing finance is a barrierto renewable energy project developers. Contributing factors includea lack of information and experience among investors and projectdevelopers, involvement of smaller companies and projects and ahigh proportion of up-front costs.
Grid access and grid infrastructure is also a major barriers todevelopers, because they are not certain they will be able to sell all theelectricity they generate in many countries, during project development.
In many regions, both state owned and private utilities arecontributing to blocking renewable energy through their marketpower and political power, maintaining ‘status quo’ in the grid,electricity markets for centralised coal and nuclear power andlobbying against pro-renewable and climate protection laws.
The sometimes higher cost of renewable energy relative to competitorsis still a barrier, though many are confident that it will be overcome inthe coming decades. The Special Report on Renewable Energy Sourcesand Climate Change Mitigation (SRREN) identifies cost as the mostsignificant barrier to investment43 and while it exists, renewable energywill rely on policy intervention by governments in order to becompetitive, which creates additional risks for investors. It is importantto note though, that in some regions of the world specific renewabletechnologies are broadly competitive with current market energy prices(e.g. onshore wind in Europe and solar hot water heaters in China).
Concerns over planning and permit issues are significant, though varysignificantly in their strength and nature depending on the jurisdiction.
3.2.2 how to overcome investment barriers for renewable energy
To see an Energy [R]evolution will require a mix of policymeasures, finance, grid, and development. In summary:
• Additional and improved policy support mechanisms forrenewable energy are needed in all countries and regions.
• Building confidence in the existing policy mechanisms may be just asimportant as making them stronger, particularly in the short term.
• Improved policy mechanisms can also lower the cost of finance,particularly by providing longer durations of revenue supportand increasing revenue certainty.44
• Access to finance can be increased by greater involvement ofgovernments and development banks in programs like loanguarantees and green bonds as well as more active private investors.
• Grid access and infrastructure needs to be improved throughinvestment in smart, decentralised grids.
• Lowering the cost of renewable energy technologies directly willrequire industry development and boosted research and development.
• A smoother pathway for renewable energy needs to be establishedthrough planning and permit issues at the local level.
references42 SOURCES INCLUDE: INTERGOVERNMENTAL PANEL ON CLIMATE CHANGE (IPCC) (2011) SPECIAL REPORT ON
RENEWABLE ENERGY SOURCES AND CLIMATE CHANGE MITIGATION (SRREN), 15TH JUNE 2011. UNITED
NATIONS ENVIRONMENT PROGRAMME (UNEP), BLOOMBERG NEW ENERGY FINANCE (BNEF) (2011). GLOBAL
TRENDS IN RENEWABLE ENERGY INVESTMENT 2011, JULY 2011. RENEWABLE ENERGY POLICY NETWORK
FOR THE 21ST CENTURY (REN21) (2011). RENEWABLES 2011, GLOBAL STATUS REPORT, 12 JULY, 2011. ECOFYS,
FRAUNHOFER ISI, TU VIENNA EEG, ERNST & YOUNG (2011). FINANCING RENEWABLE ENERGY IN THE
EUROPEAN ENERGY MARKET BY ORDER OF EUROPEAN COMMISSION, DG ENERGY, 2ND OF JANUARY, 2011.
43 INTERGOVERNMENTAL PANEL ON CLIMATE CHANGE (IPCC) (2011) SPECIAL REPORT ON RENEWABLE
ENERGY SOURCES AND CLIMATE CHANGE MITIGATION (SRREN). 15TH JUNE 2011. CHP. 11, P.24.
44 CLIMATE POLICY INITIATIVE (2011):THE IMPACTS OF POLICY ON THE FINANCING OF RENEWABLE
PROJECTS: A CASE STUDY ANALYSIS, 3 OCTOBER 2011.
3
implem
entin
g th
e energ
y [r]evolu
tion
|RENEWABLE ENERGY FINANCING BASICS
figure 3.4: key barriers to renewable energy investment
Confidence in policy Lack of policy Access
to finance Grid access Utilities Price / cost Planning & permits
BARRIERS TO INVESTMENT
Govt. REpolicy & law
Lack of info.& exp.
Electricitymarket
Lack ofexisting tech. Lack of R+D Land
availability
Nat. economy& governance
Financialstructure
Access totech.
Financialcrisis
Lack ofskilled labour
ROI for RE
Project &industry scale

54
scenario for a future energy supply
SCENARIO BACKGROUND
MAIN SCENARIO ASSUMPTIONS
POPULATION DEVELOPMENT
ECONOMIC GROWTH
OIL AND GAS PRICE PROJECTIONS
COST OF CO2 EMISSIONS
COST PROJECTIONS FOR EFFICIENTFOSSIL FUEL GENERATION AND CCS
COST PROJECTIONS FORRENEWABLE ENERGY TECHNOLOGIES
ASSUMPTIONS FOR FOSSIL FUELPHASE OUT
REVIEW: GREENPEACE SCENARIOPROJECTS OF THE PAST
4
4image THE OB’ RIVER ON THE WESTERN EDGE OF THE CENTRAL SIBERIAN PLATEAU, JUNE 20, 2002. THE MOUTH OF THE OB’ RIVER (LARGE RIVER AT LEFT) WHERE ITEMPTIES INTO KARA SEA. IN THE FALSE-COLOR IMAGE, VEGETATION APPEARS IN BRIGHT GREEN, WATER APPEARS DARK BLUE OR BLACK, AND ICE APPEARS BRIGHT BLUE.
towards a sustainableenergy supplysystem.”
“
© JACQUES DESCLOITRES/NASA/GSFC
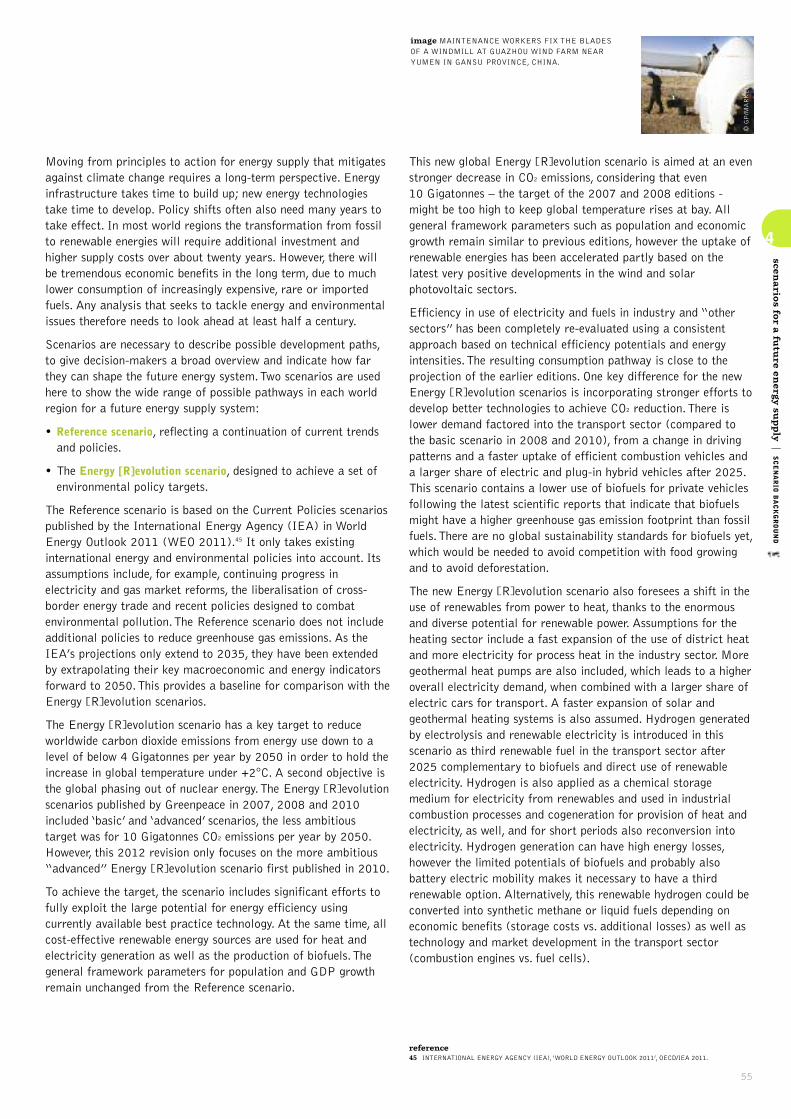
4
scenario
s for a
futu
re energ
y supply
|SCENARIO BACKGROUND
55
© GP/MARKEL REDONDO
image MAINTENANCE WORKERS FIX THE BLADESOF A WINDMILL AT GUAZHOU WIND FARM NEARYUMEN IN GANSU PROVINCE, CHINA.
Moving from principles to action for energy supply that mitigatesagainst climate change requires a long-term perspective. Energyinfrastructure takes time to build up; new energy technologiestake time to develop. Policy shifts often also need many years totake effect. In most world regions the transformation from fossilto renewable energies will require additional investment andhigher supply costs over about twenty years. However, there willbe tremendous economic benefits in the long term, due to muchlower consumption of increasingly expensive, rare or importedfuels. Any analysis that seeks to tackle energy and environmentalissues therefore needs to look ahead at least half a century.
Scenarios are necessary to describe possible development paths,to give decision-makers a broad overview and indicate how farthey can shape the future energy system. Two scenarios are usedhere to show the wide range of possible pathways in each worldregion for a future energy supply system:
• Reference scenario, reflecting a continuation of current trendsand policies.
• The Energy [R]evolution scenario, designed to achieve a set ofenvironmental policy targets.
The Reference scenario is based on the Current Policies scenariospublished by the International Energy Agency (IEA) in WorldEnergy Outlook 2011 (WEO 2011).45 It only takes existinginternational energy and environmental policies into account. Itsassumptions include, for example, continuing progress inelectricity and gas market reforms, the liberalisation of cross-border energy trade and recent policies designed to combatenvironmental pollution. The Reference scenario does not includeadditional policies to reduce greenhouse gas emissions. As theIEA’s projections only extend to 2035, they have been extendedby extrapolating their key macroeconomic and energy indicatorsforward to 2050. This provides a baseline for comparison with theEnergy [R]evolution scenarios.
The Energy [R]evolution scenario has a key target to reduceworldwide carbon dioxide emissions from energy use down to alevel of below 4 Gigatonnes per year by 2050 in order to hold theincrease in global temperature under +2°C. A second objective isthe global phasing out of nuclear energy. The Energy [R]evolutionscenarios published by Greenpeace in 2007, 2008 and 2010included ‘basic’ and ‘advanced’ scenarios, the less ambitioustarget was for 10 Gigatonnes CO2 emissions per year by 2050.However, this 2012 revision only focuses on the more ambitious“advanced” Energy [R]evolution scenario first published in 2010.
To achieve the target, the scenario includes significant efforts tofully exploit the large potential for energy efficiency usingcurrently available best practice technology. At the same time, allcost-effective renewable energy sources are used for heat andelectricity generation as well as the production of biofuels. Thegeneral framework parameters for population and GDP growthremain unchanged from the Reference scenario.
This new global Energy [R]evolution scenario is aimed at an evenstronger decrease in CO2 emissions, considering that even 10 Gigatonnes – the target of the 2007 and 2008 editions -might be too high to keep global temperature rises at bay. Allgeneral framework parameters such as population and economicgrowth remain similar to previous editions, however the uptake ofrenewable energies has been accelerated partly based on thelatest very positive developments in the wind and solarphotovoltaic sectors.
Efficiency in use of electricity and fuels in industry and “othersectors” has been completely re-evaluated using a consistentapproach based on technical efficiency potentials and energyintensities. The resulting consumption pathway is close to theprojection of the earlier editions. One key difference for the newEnergy [R]evolution scenarios is incorporating stronger efforts todevelop better technologies to achieve CO2 reduction. There islower demand factored into the transport sector (compared tothe basic scenario in 2008 and 2010), from a change in drivingpatterns and a faster uptake of efficient combustion vehicles anda larger share of electric and plug-in hybrid vehicles after 2025.This scenario contains a lower use of biofuels for private vehiclesfollowing the latest scientific reports that indicate that biofuelsmight have a higher greenhouse gas emission footprint than fossilfuels. There are no global sustainability standards for biofuels yet,which would be needed to avoid competition with food growingand to avoid deforestation.
The new Energy [R]evolution scenario also foresees a shift in theuse of renewables from power to heat, thanks to the enormousand diverse potential for renewable power. Assumptions for theheating sector include a fast expansion of the use of district heatand more electricity for process heat in the industry sector. Moregeothermal heat pumps are also included, which leads to a higheroverall electricity demand, when combined with a larger share ofelectric cars for transport. A faster expansion of solar andgeothermal heating systems is also assumed. Hydrogen generatedby electrolysis and renewable electricity is introduced in thisscenario as third renewable fuel in the transport sector after2025 complementary to biofuels and direct use of renewableelectricity. Hydrogen is also applied as a chemical storagemedium for electricity from renewables and used in industrialcombustion processes and cogeneration for provision of heat andelectricity, as well, and for short periods also reconversion intoelectricity. Hydrogen generation can have high energy losses,however the limited potentials of biofuels and probably alsobattery electric mobility makes it necessary to have a thirdrenewable option. Alternatively, this renewable hydrogen could beconverted into synthetic methane or liquid fuels depending oneconomic benefits (storage costs vs. additional losses) as well astechnology and market development in the transport sector(combustion engines vs. fuel cells).
reference45 INTERNATIONAL ENERGY AGENCY (IEA), ‘WORLD ENERGY OUTLOOK 2011’, OECD/IEA 2011.

WORLD ENERGY [R]EVOLUTIONA SUSTAINABLE WORLD ENERGY OUTLOOK
4
scenario
s for a
futu
re energ
y supply
|SCENARIO BACKGROUND
56
In all sectors, the latest market development projections of therenewable energy industry46 have been taken into account (SeeTable 4.1 “Assumed average growth rates and annual marketvolumes by renewable technology”). In developing countries inparticular, a shorter operational lifetime for coal power plants, ofup to 20 instead of 35 years, has been assumed in order to allowa faster uptake of renewable energy. This is particularly the caseof China, as around 90% of new global coal power plants builtbetween 2005 and 2011 have been in China (see Chapter 7). Thefast introduction of electric vehicles, combined with theimplementation of smart grids and faster expansion oftransmission grids (accelerated by about 10 years compared toprevious scenarios) allows a higher share of fluctuating renewablepower generation (photovoltaic and wind) to be employed. In thisscenario, renewable energy would pass 30% of the global energysupply just after 2020.
The global quantities of biomass power generators and largehydro power remain limited in the new Energy [R]evolutionscenarios, for reasons of ecological sustainability.
These scenarios by no means claim to predict the future; theysimply describe and compare two potential consistent developmentpathways out of the broad range of possible ‘futures’. The Energy[R]evolution scenarios are designed to indicate the efforts andactions required to achieve their ambitious objectives and toillustrate the options we have at hand to change our energy supplysystem into one that is truly sustainable.
reference46 SEE EREC (‘RE-THINKING 2050’), GWEC, EPIA ET AL.
REF
28,49035,46148,316
1583416963581269
1,1271,7102,841
118172301
574937
1,629
21356
4,2234,8345,887
GENERATION (TWh/a)
ENERGY PARAMETER
E[R]
5416222384469
107274257
51826
142617
51629
2513065
REF
82143014
316753
122
71611
001
2613977
ANNUAL MARKETVOLUME (GW/a)
E[R]
48%13%12%55%21%15%
26%10%8%
21%14%13%
21%6%7%
73%17%16%
2%1%1%
REF
22%9%8%16%10%14%
13%5%6%
6%4%6%
15%6%6%
8%24%17%
3%2%2%
ANNUAL GROWTH RATE (%/a)
E[R]
24,02833,04146,573
8782,6347,290466
2,6729,348
2,9896,97113,767
4001,3013,765
9321,5212,691
139560
2,053
4,1924,5425,009
table 4.1: assumed average growth rates and annual market volumes by renewable technology
RE
202020302050
SolarPV 2020PV 2030PV 2050CSP 2020CSP 2030CSP 2050
WindOn + Offshore 2020On + Offshore 2030On + Offshore 2050
Geothermal (for power generation)2020 20302050
Bioenergy (for power generation)2020 20302050
Ocean2020 20302050
Hydro2020 20302050

4
scenario
s for a
futu
re energ
y supply
|MAIN SCENARIO ASSUMPTIONS
57
© THE UNITED STATES
COAST GUARD
image FIRE BOAT RESPONSE CREWS BATTLE THEBLAZING REMNANTS OF THE OFFSHORE OIL RIGDEEPWATER HORIZON APRIL 21, 2010. MULTIPLECOAST GUARD HELICOPTERS, PLANES ANDCUTTERS RESPONDED TO RESCUE THE DEEPWATERHORIZON’S 126 PERSON CREW.
4.1 scenario background
The scenarios in this report were jointly commissioned byGreenpeace and the European Renewable Energy Council fromthe Systems Analysis group of the Institute of TechnicalThermodynamics, part of the German Aerospace Center (DLR).The supply scenarios were calculated using the MESAP/PlaNetsimulation model adopted in the previous Energy [R]evolutionstudies.47 The new energy demand projections were developedfrom Utrecht University, Netherlands, based on a new analysis ofthe future potential for energy efficiency measures in 2012. Thebiomass potential calculated for previous editions, judgedaccording to Greenpeace sustainability criteria, has beendeveloped by the German Biomass Research Centre in 2009 andhas been further reduced for precautionary principles. The futuredevelopment pathway for car technologies is based on a specialreport produced in 2012 by the Institute of Vehicle Concepts,DLR for Greenpeace International. These studies are describedbriefly below.
4.1.1 energy efficiency study for industry, householdsand services
The demand study by Utrecht University aimed to develop a lowenergy demand scenario for the period 2009 to 2050 covering theworld regions as defined in the IEA’s World Energy Outlookreport series. Calculations were made for each decade from 2009onwards. Energy demand was split up into electricity and fuelsand their consumption was considered in industry and for ‘other’consumers, including households, agriculture and services.
Under the low energy demand scenario, worldwide final energydemand in industry and other sectors is 31% lower in 2050compared to the Reference scenario, resulting in a final energydemand of 256 EJ (ExaJoules). The energy savings are fairlyequally distributed over the two main sectors. The most importantenergy saving options would be efficient production andcombustion processes and improved heat insulation and buildingdesign. Chapter 10 provides more details about this study. Thedemand projections for the Reference scenario have been updatedon the basis of the Current Policies scenario from IEA’s WorldEnergy Outlook 2011.
4.1.2 the future for transport
The DLR Institute of Vehicle Concepts in Stuttgart, Germany hasdeveloped a global scenario for all transport modes covering tenworld regions. The aim was to produce a demanding but feasiblescenario to lower global CO2 emissions from transport in keepingwith the overall objectives of this report. The approach takes intoaccount a vast range of technical measures to reduce the energyconsumption of vehicles, but also considers the dramatic increasein vehicle ownership and annual mileage taking place indeveloping countries. The major parameters are vehicletechnology, alternative fuels, changes in sales of different vehiclesizes of light duty vehicles (called the segment split) and changesin tonne-kilometres and vehicle-kilometres travelled (described asmodal split). The Reference scenario for the transport sector isalso based on the fuel consumption path of the Current Policiesscenario from WEO 2011.
By combining ambitious efforts towards higher efficiency in vehicletechnologies, a major switch to grid-connected electric vehicles(especially LDVs) and incentives for vehicle users to save carbondioxide the study finds that it is possible to reduce CO2 emissionsfrom ‘well-to-wheel’ in the transport sector in 2050 by roughly77%48 compared to 1990 and 81% compared to 2009. By 2050,in this scenario, 25% of the final energy used in transport will stillcome from fossil sources, mainly gasoline, kerosene and diesel.Renewable electricity will cover 41%, biofuels 11% and hydrogen20%. Total energy consumption will be reduced by 26% in 2050compared to 2009 even though there are enormous increases infuel use in some regions of the world. The peak in global CO2
emissions from transport occurs between 2015 and 2020. From2012 onwards, new legislation in the US and Europe willcontribute to breaking the upwards trend. From 2020, the effect ofintroducing grid-connected electric cars can be clearly seen.Chapter 11 provides more details of this report.
4.1.3 fossil fuel assessment report
As part of the Energy [R]evolution scenario, Greenpeace alsocommissioned the Ludwig-Bölkow-Systemtechnik Institute inMunich, Germany to research a new fossil fuel resourcesassessment taking into account planned and ongoing investmentsin coal, gas and oil on a global and regional basis (see fossil fuelpathway Chapter 7).
4.1.4 status and future projections for renewableheating technologies
EREC and the DLR undertook a detailed research about thecurrent renewable heating technology markets, market forecasts,cost projections and state of the technology development. Thecost projection (see section 4.9) as well as the technology option(see Chapter 9) have been used as an input information for thisnew Energy [R]evolution scenario.
references47 ENERGY [R]EVOLUTION: A SUSTAINABLE WORLD ENERGY OUTLOOK’, GREENPEACE INTERNATIONAL,
2007, 2008 AND 2010.
48 TRANSPORT EMISSIONS IN 1990 BASED ON WEO 2011.
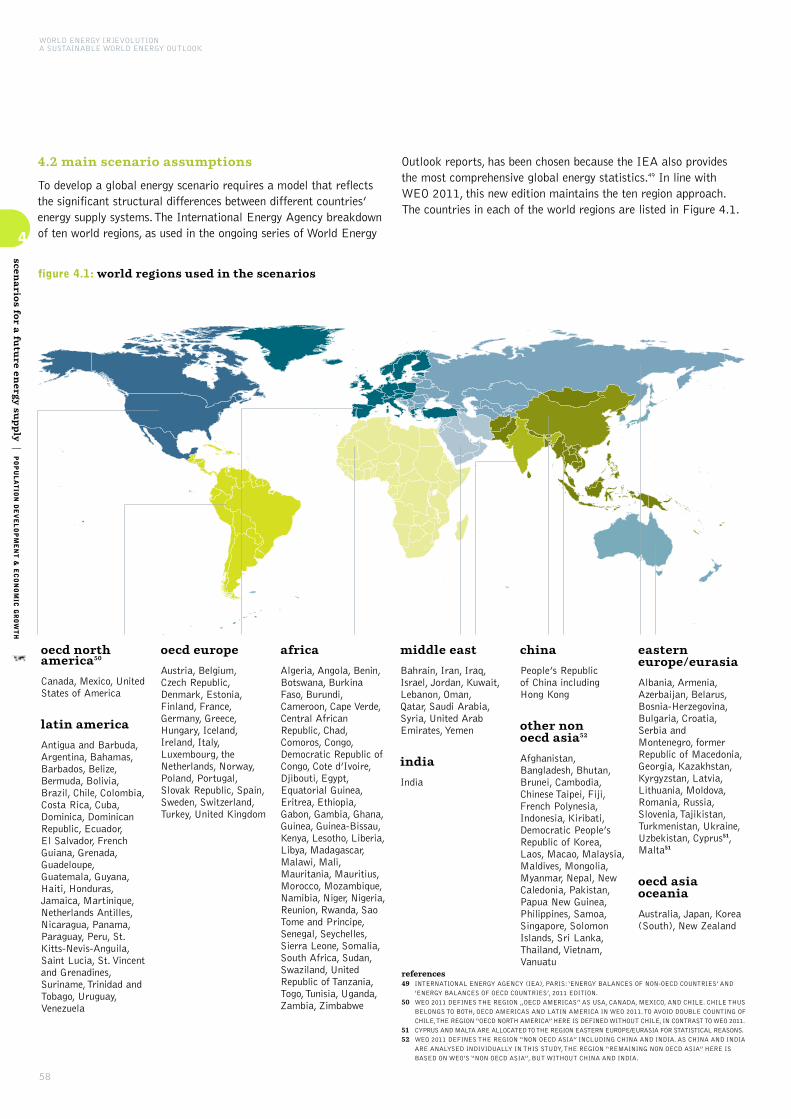
WORLD ENERGY [R]EVOLUTIONA SUSTAINABLE WORLD ENERGY OUTLOOK
58
4
scenario
s for a
futu
re energ
y supply
|POPULATION DEVELOPMENT & ECONOMIC GROWTH
4.2 main scenario assumptions
To develop a global energy scenario requires a model that reflectsthe significant structural differences between different countries’energy supply systems. The International Energy Agency breakdownof ten world regions, as used in the ongoing series of World Energy
Outlook reports, has been chosen because the IEA also providesthe most comprehensive global energy statistics.49 In line withWEO 2011, this new edition maintains the ten region approach.The countries in each of the world regions are listed in Figure 4.1.
references49 INTERNATIONAL ENERGY AGENCY (IEA), PARIS: ‘ENERGY BALANCES OF NON-OECD COUNTRIES’ AND
‘ENERGY BALANCES OF OECD COUNTRIES’, 2011 EDITION.
50 WEO 2011 DEFINES THE REGION „OECD AMERICAS” AS USA, CANADA, MEXICO, AND CHILE. CHILE THUS
BELONGS TO BOTH, OECD AMERICAS AND LATIN AMERICA IN WEO 2011. TO AVOID DOUBLE COUNTING OF
CHILE, THE REGION “OECD NORTH AMERICA” HERE IS DEFINED WITHOUT CHILE, IN CONTRAST TO WEO 2011.
51 CYPRUS AND MALTA ARE ALLOCATED TO THE REGION EASTERN EUROPE/EURASIA FOR STATISTICAL REASONS.
52 WEO 2011 DEFINES THE REGION “NON OECD ASIA” INCLUDING CHINA AND INDIA. AS CHINA AND INDIA
ARE ANALYSED INDIVIDUALLY IN THIS STUDY, THE REGION “REMAINING NON OECD ASIA” HERE IS
BASED ON WEO’S “NON OECD ASIA”, BUT WITHOUT CHINA AND INDIA.
figure 4.1: world regions used in the scenarios
oecd northamerica50
Canada, Mexico, UnitedStates of America
latin america
Antigua and Barbuda,Argentina, Bahamas,Barbados, Belize,Bermuda, Bolivia,Brazil, Chile, Colombia,Costa Rica, Cuba,Dominica, DominicanRepublic, Ecuador, El Salvador, FrenchGuiana, Grenada,Guadeloupe,Guatemala, Guyana,Haiti, Honduras,Jamaica, Martinique,Netherlands Antilles,Nicaragua, Panama,Paraguay, Peru, St.Kitts-Nevis-Anguila,Saint Lucia, St. Vincentand Grenadines,Suriname, Trinidad andTobago, Uruguay,Venezuela
africa
Algeria, Angola, Benin,Botswana, BurkinaFaso, Burundi,Cameroon, Cape Verde,Central AfricanRepublic, Chad,Comoros, Congo,Democratic Republic ofCongo, Cote d’Ivoire,Djibouti, Egypt,Equatorial Guinea,Eritrea, Ethiopia,Gabon, Gambia, Ghana,Guinea, Guinea-Bissau,Kenya, Lesotho, Liberia,Libya, Madagascar,Malawi, Mali,Mauritania, Mauritius,Morocco, Mozambique,Namibia, Niger, Nigeria,Reunion, Rwanda, SaoTome and Principe,Senegal, Seychelles,Sierra Leone, Somalia,South Africa, Sudan,Swaziland, UnitedRepublic of Tanzania,Togo, Tunisia, Uganda,Zambia, Zimbabwe
middle east
Bahrain, Iran, Iraq,Israel, Jordan, Kuwait,Lebanon, Oman, Qatar, Saudi Arabia,Syria, United ArabEmirates, Yemen
india
India
easterneurope/eurasia
Albania, Armenia,Azerbaijan, Belarus,Bosnia-Herzegovina,Bulgaria, Croatia,Serbia andMontenegro, formerRepublic of Macedonia,Georgia, Kazakhstan,Kyrgyzstan, Latvia,Lithuania, Moldova,Romania, Russia,Slovenia, Tajikistan,Turkmenistan, Ukraine,Uzbekistan, Cyprus51,Malta51
oecd asiaoceania
Australia, Japan, Korea(South), New Zealand
china
People’s Republic of China including Hong Kong
other non oecd asia52
Afghanistan,Bangladesh, Bhutan,Brunei, Cambodia,Chinese Taipei, Fiji,French Polynesia,Indonesia, Kiribati,Democratic People’sRepublic of Korea,Laos, Macao, Malaysia,Maldives, Mongolia,Myanmar, Nepal, NewCaledonia, Pakistan,Papua New Guinea,Philippines, Samoa,Singapore, SolomonIslands, Sri Lanka,Thailand, Vietnam,Vanuatu
oecd europe
Austria, Belgium, Czech Republic,Denmark, Estonia,Finland, France,Germany, Greece,Hungary, Iceland,Ireland, Italy,Luxembourg, theNetherlands, Norway,Poland, Portugal,Slovak Republic, Spain,Sweden, Switzerland,Turkey, United Kingdom
59
© GP/EMMA STONER
image A WOMAN STUDIES SOLAR POWER SYSTEMS ATTHE BAREFOOT COLLEGE. THE COLLEGE SPECIALISESIN SUSTAINABLE DEVELOPMENT AND PROVIDES ASPACE WHERE STUDENTS FROM ALL OVER THE WORLDCAN LEARN TO UTILISE RENEWABLE ENERGY. THESTUDENTS TAKE THEIR NEW SKILLS HOME AND GIVETHEIR VILLAGES CLEAN ENERGY.
4.3 population development
Future population development is an important factor in energyscenario building because population size affects the size andcomposition of energy demand, directly and through its impact oneconomic growth and development. The IEA World EnergyOutlook 2011 uses the United Nations Development Programme(UNDP) projections for population development. For this studythe most recent population projections from UNDP up to 2050are applied53, in addition, the current national populationprojection is used for China (see Table 4.2).
Based on UNDP’s 2010 assessment, the world’s population isexpected to grow by 0.76 % on average over the period 2007 to2050, from 6.8 billion people in 2009 to nearly 9.3 billion by 2050.The rate of population growth will slow over the projection period,from 1.1% per year during 2009-2020 to 0.5% per year during2040-2050. The updated projections show an increase in populationestimates by 2050 of around 150 million compared to the UNDP2008 edition. This will slightly increase the demand for energy. Froma regional perspective,the population of the developing regions willcontinue to grow most rapidly. The Eastern Europe/Eurasia will facea continuous decline, followed after a short while by the OECD AsiaOceania. The population in OECD Europe and OECD North Americaare expected to increase through 2050. The share of the populationliving in today’s non-OECD countries will increase from the current82% to 85% in 2050. China’s contribution to world population willdrop from 20% today to 14% in 2050. Africa will remain theregion with the highest growth rate, leading to a share of 24% ofworld population in 2050.
Satisfying the energy needs of a growing population in thedeveloping regions of the world in an environmentally friendlymanner is the fundamental challenge to achieve a globalsustainable energy supply.
4.4 economic growth
Economic growth is a key driver for energy demand. Since 1971,each 1% increase in global Gross Domestic Product (GDP) hasbeen accompanied by a 0.6% increase in primary energyconsumption. The decoupling of energy demand and GDP growthis therefore a prerequisite for an Energy [R]evolution. Mostglobal energy/economic/environmental models constructed in thepast have relied on market exchange rates to place countries in acommon currency for estimation and calibration. This approachhas been the subject of considerable discussion in recent years,and an alternative has been proposed in the form of purchasingpower parity (PPP) exchange rates. Purchasing power paritiescompare the costs in different currencies of a fixed basket oftraded and non-traded goods and services and yield a widely-based measure of the standard of living. This is important inanalysing the main drivers of energy demand or for comparingenergy intensities among countries.
Although PPP assessments are still relatively imprecisecompared to statistics based on national income and producttrade and national price indexes, they are considered to provide abetter basis for global scenario development.54 Thus all data oneconomic development in WEO 2011 refers to purchasing poweradjusted GDP. However, as WEO 2011 only covers the time periodup to 2035, the projections for 2035-2050 for the Energy[R]evolution scenario are based on our own estimates.Furthermore, estimates of Africa’s GDP development have beenadjusted upward compared to WEO 2011.
Prospects for GDP growth have decreased considerably since theprevious study, due to the financial crisis at the beginning of2009, although underlying growth trends continue much thesame. GDP growth in all regions is expected to slow graduallyover the coming decades. World GDP is assumed to grow onaverage by 3.8% per year over the period 2009-2030, comparedto 3.1% from 1971 to 2007, and on average by 3.1% per yearover the entire modelling period (2009-2011). China and Indiaare expected to grow faster than other regions, followed by theMiddle East, Africa, remaining Non OECD Asia, and EasternEurope/Eurasia. The Chinese economy will slow as it becomesmore mature, but will nonetheless become the largest in theworld in PPP terms early in the 2020s. GDP in OECD Europeand OECD Asia Oceania is assumed to grow by around 1.6 and1.3% per year over the projection period, while economic growthin OECD North America is expected to be slightly higher. TheOECD share of global PPP-adjusted GDP will decrease from56% in 2009 to 33% in 2050.
4
scenario
s for a
futu
re energ
y supply
|OIL AND GAS PRICE PROJECTS
references53 ‘WORLD POPULATION PROSPECTS: THE 2010 REVISION (MEDIUM VARIANT)’, UNITED NATIONS,
POPULATION DIVISION, DEPARTMENT OF ECONOMIC AND SOCIAL AFFAIRS (UNDP), 2011.
54 NORDHAUS, W, ‘ALTERNATIVE MEASURES OF OUTPUT IN GLOBAL ECONOMIC-ENVIRONMENTAL
MODELS: PURCHASING POWER PARITY OR MARKET EXCHANGE RATES?’, REPORT PREPARED FOR IPCC
EXPERT MEETING ON EMISSION SCENARIOS, US-EPA WASHINGTON DC, JANUARY 12-14, 2005.
table 4.2: population development projections(IN MILLIONS)
source UN WORLD POPULATION PROSPECTS - 2010 REVISION, MEDIUM VARIANT,AND NATIONAL POPULATION SCENARIO FOR CHINA.
2015
7,284
570
484
204
340
1,308
1,377
1,128
499
1.045
229
2009
6,818
555
458
201
339
1,208
1,342
1,046
468
999
203
2020
7,668
579
504
205
341
1,387
1,407
1,194
522
1,278
250
2025
8,036
587
524
205
340
1,459
1,436
1,254
544
1,417
270
2030
8,372
593
541
204
337
1,523
1,452
1,307
562
1,562
289
2040
8,978
599
571
199
331
1,627
1,474
1,392
589
1,870
326
2050
9,469
600
595
193
324
1,692
1,468
1,445
603
2,192
358
REGION
World
OECD Europe
OECD North America
OECD AsiaOceania
Eastern Europe/Eurasia
India
China
Non OECDAsia
Latin America
Africa
Middle East
WORLD ENERGY [R]EVOLUTIONA SUSTAINABLE WORLD ENERGY OUTLOOK
60
4
scenario
s for a
futu
re energ
y supply
|COST OF CO
2EMISSIONS, COST PROJECTIONS FOR EFFICIENT FOSSIL FUEL GENERATION AND CCS
4.5 oil and gas price projections
The recent dramatic fluctuations in global oil prices have resultedin slightly higher forward price projections for fossil fuels. Underthe 2004 ‘high oil and gas price’ scenario from the EuropeanCommission, for example, an oil price of just $ 34 per barrel wasassumed in 2030. More recent projections of oil prices by 2035in the IEA’s WEO 2011 range from $2010 97/bbl in the 450 ppmscenario up to $2010 140/bbl in current policies scenario.
Since the first Energy [R]evolution study was published in 2007,however, the actual price of oil has moved over $ 100/bbl for thefirst time, and in July 2008 reached a record high of more than $ 140/bbl. Although oil prices fell back to $ 100/bbl inSeptember 2008 and around $ 80/bbl in April 2010, prices haveincreased to more than $ 110/bbl in early 2012. Thus, theprojections in the IEA Current Policies scenario might still beconsidered too conservative. Taking into account the growingglobal demand for oil we have assumed a price development pathfor fossil fuels slightly higher than the IEA WEO 2011 “CurrentPolicies” case extrapolated forward to 2050 (see Table 4.4).
As the supply of natural gas is limited by the availability of pipelineinfrastructure, there is no world market price for gas. In most regionsof the world the gas price is directly tied to the price of oil. Gasprices are therefore assumed to increase to $24-30/GJ by 2050.
table 4.3: gdp development projections(AVERAGE ANNUAL GROWTH RATES)
source 2009-2035: IEA WEO 2011 AND 2035-2050: DLR, PERSONAL COMMUNICATION(2012)
2020-2035
3.2%
2.3%
1.4%
1.8%
3.2%
5.8%
4.2%
3.2%
2.8%
3.7%
4.4%
2009-2020
4.2%
2.7%
2.4%
2.1%
4.2%
7.6%
8.2%
5.2%
4.0%
4.3%
4.5%
2035-2050
2.2%
1.2%
0.5%
1.0%
1.9%
3.1%
2.7%
2.6%
2.2%
2.8%
4.2%
2009-2050
3.1%
2.0%
1.3%
1.6%
3.0%
5.3%
4.7%
3.5%
2.9%
3.5%
4.4%
REGION
World
OECD Americas
OECD AsiaOceania
OECD Europe
Eastern Europe/Eurasia
India
China
Non OECD Asia
Latin America
Middle East
Africa
table 4.4: development projections for fossil fuel and biomass prices in $ 2010
UNIT
barrelbarrelbarrelbarrel
GJGJGJ
GJGJGJ
GJGJGJ
GJGJGJ
tonnetonnetonnetonne
GJGJGJ
2000
35
5.073.756.18
42
2005
51
2.354.554.58
50
2007
76
3.286.376.41
70
7.503.342.74
2008
98
122
2010
78787878
4.647.9111.61
4.647.9111.61
4.647.9111.61
4.647.9111.61
999999
7.803.442.84
2015
97106112
6.229.9212.56
6.4410.3413.40
8.4914.2216.22
100105
126.7
8.313.553.24
2020
97106112
6.8610.3412.66
7.3911.6114.24
10.8416.7819.08
93109139
9.323.853.55
2025
97106112
8.4410.3412.66
8.1212.5614.98
12.5618.2220.63
83113
162.3
9.724.103.80
2030
97135152
8.8510.2312.77
8.8513.2915.61
14.5719.5422.12
74116
171.0
10.134.364.05
2040
152
18.3422.2925.12
199.0
10.434.764.66
2035
97140152
8.239.9212.77
9.5013.7216.04
16.4520.9123.62
68118
181.3
10.284.564.36
2050
152
24.0426.3729.77
206.3
10.645.274.96
FOSSIL FUEL
Crude oil importsHistoric prices (from WEO)WEO “450 ppm scenario”WEO Current policiesEnergy [R]evolution 2012
Natural gas importsHistoric prices (from WEO)United StatesEuropeJapan LNG
WEO 2011 “450 ppm scenario”United StatesEuropeJapan LNG
WEO 2011 Current policiesUnited StatesEuropeJapan LNG
Energy [R]evolution 2012United StatesEuropeJapan LNG
OECD steam coal importsHistoric prices (from WEO)WEO 2011 “450 ppm scenario”WEO 2011 Current policiesEnergy [R]evolution 2012
Biomass (solid) Energy [R]evolution 2012OECD EuropeOECD Asia Oceania & North AmericaOther regions
source IEA WEO 2009 & 2011 own assumptions.
61
© DIGITAL GLOBE
image SATELLITE IMAGE OF JAPAN’S DAI ICHIPOWER PLANT SHOWING DAMAGE AFTER THEEARTHQUAKE AND TSUNAMI OF 2011.
4.6 cost of CO2 emissions
Assuming that a carbon emissions trading system is establishedacross all world regions in the longer term, the cost of CO2
allowances needs to be included in the calculation of electricitygeneration costs. Projections of emissions costs are even moreuncertain than energy prices, and a broad range of futureestimates has been made in studies. The CO2 costs assumed in2050 are often higher than those included in this Energy[R]evolution study (75 $2010/tCO2)55, reflecting estimates of thetotal external costs of CO2 emissions. The CO2 cost estimates inthe 2010 version of Energy [R]evolution were rather conservative(50 $2008/t). CO2 costs are applied in Kyoto Protocol Non-Annex Bcountries only from 2030 on.
4.7 cost projections for efficient fossil fuelgeneration and carbon capture and storage (CCS)
Further cost reduction potentials are assumed for fuel powertechnologies in use today for coal, gas, lignite and oil. Becausethey are at an advanced stage of market development thepotential for cost reductions is limited, and will be achievedmainly through an increase in efficiency.56
There is much speculation about the potential for carbon captureand storage (CCS) to mitigate the effect of fossil fuelconsumption on climate change, even though the technology isstill under development.
CCS means trapping CO2 from fossil fuels, either before or afterthey are burned, and ‘storing’ (effectively disposing of) it in thesea or beneath the surface of the earth. There are currently threedifferent methods of capturing CO2: ‘pre-combustion’, ‘post-combustion’ and ‘oxyfuel combustion’. However, development is ata very early stage and CCS will not be implemented - in the bestcase - before 2020 and will probably not become commerciallyviable as a possible effective mitigation option until 2030.
Cost estimates for CCS vary considerably, depending on factors suchas power station configuration, technology, fuel costs, size of projectand location. One thing is certain, however: CCS is expensive. Itrequires significant funds to construct the power stations and thenecessary infrastructure to transport and store carbon. The IPCCspecial report on CCS assesses costs at $15-75 per ton of capturedCO2
57, while a 2007 US Department of Energy report foundinstalling carbon capture systems to most modern plants resulted ina near doubling of costs.58 These costs are estimated to increase theprice of electricity in a range from 21-91%.59
4
scenario
s for a
futu
re energ
y supply
|COST PROJECTIONS FOR RENEWABLE ENERGY TECHNOLOGIES
Max. efficiency (%)Investment costs ($2010/kW)CO2 emissions a)(g/kWh)
Max. efficiency (%)Investment costs ($2010/kW)CO2 emissions a)(g/kWh)
Max. efficiency (%)Investment costs ($2010/kW)CO2 emissions a)(g/kWh)
Coal-fired condensingpower plant
Lignite-fired condensingpower plant
Natural gas combined cycle
2030 2040 2050POWER PLANT
table 4.6: development of efficiency and investment costs for selected new power plant technologies
202020152009
501,330670
44,51,545898
62701325
521,295644
451,511888
63666320
531,262632
451,478888
64631315
481,363697
441,578908
61736330
461,384728
431,614929
59754342
451,436744
411,693975
57777354
sourceWEO 2010, DLR 2010 a)CO2 emissions refer to power station outputs only; life-cycle emissions are not considered.
references55 KREWITT, W., SCHLOMANN, B., EXTERNAL COSTS OF ELECTRICITY GENERATION FROM RENEWABLE
ENERGIES COMPARED TO ELECTRICITY GENERATION FROM FOSSIL ENERGY SOURCES, GERMAN FEDERAL
MINISTRY FOR THE ENVIRONMENT, NATURE CONSERVATION AND NUCLEAR SAFETY, BERLIN 2006.
56 GREENPEACE INTERNATIONAL BRIEFING: CARBON CAPTURE AND STORAGE’, GOERNE, 2007.
57 ABANADES, J C ET AL., 2005, PG 10.
58 NATIONAL ENERGY TECHNOLOGY LABORATORIES, 2007.
59 RUBIN ET AL., 2005A, PG 40.
table 4.5: assumptions on CO2 emissions cost developmentfor Annex-B and Non-Annex-B countries of the UNFCCC.($2000/tCO2)
2015
15
0
2010
0
0
2020
25
0
2030
40
40
2040
55
55
2050
75
75
COUNTRIES
Annex-B countries
Non-Annex-B countries

WORLD ENERGY [R]EVOLUTIONA SUSTAINABLE WORLD ENERGY OUTLOOK
62
4
scenario
s for a
futu
re energ
y supply
|COST PROJECTIONS FOR RENEWABLE ENERGY TECHNOLOGIES
Pipeline networks will also need to be constructed to move CO2 tostorage sites. This is likely to require a considerable outlay ofcapital.60 Costs will vary depending on a number of factors,including pipeline length, diameter and manufacture fromcorrosion-resistant steel, as well as the volume of CO2 to betransported. Pipelines built near population centres or on difficultterrain, such as marshy or rocky ground, are more expensive.61
The Intergovernmental Panel on Climate Change (IPCC)estimates a cost range for pipelines of $1-8/tonne of CO2
transported. A United States Congressional Research Servicesreport calculated capital costs for an 11 mile pipeline in theMidwestern region of the US at approximately $6 million. Thesame report estimates that a dedicated interstate pipelinenetwork in North Carolina would cost upwards of $5 billion dueto the limited geological sequestration potential in that part ofthe country.62 Storage and subsequent monitoring and verificationcosts are estimated by the IPCC to range from $0.5-8/tCO2 (forstorage) and $0.1-0.3/tCO2 (for monitoring). The overall cost ofCCS could therefore be a major barrier to its deployment.63
For the above reasons, CCS power plants are not included in oureconomic analysis.
Table 4.6 summarises our assumptions on the technical andeconomic parameters of future fossil-fuelled power planttechnologies. Based on estimates from WEO 2010, we assume thatfurther technical innovation will not prevent an increase of futureinvestment costs because raw material costs and technicalcomplexity will continue to increase. Also, improvements in powerplant efficiency are outweighed by the expected increase in fossil fuelprices, which would increase electricity generation costs significantly.
4.8 cost projections for renewable energy technologies
The different renewable energy technologies available today allhave different technical maturity, costs and development potential.Whereas hydro power has been widely used for decades, othertechnologies, such as the gasification of biomass or ocean energy,have yet to find their way to market maturity. Some renewablesources by their very nature, including wind and solar power,provide a variable supply, requiring a revised coordination with thegrid network. But although in many cases renewable energytechnologies are ‘distributed’ - their output being generated anddelivered locally to the consumer – in the future we can also havelarge-scale applications like offshore wind parks, photovoltaicpower plants or concentrating solar power stations.
It is possible to develop a wide spectrum of options to marketmaturity, using the individual advantages of the differenttechnologies, and linking them with each other, and integratingthem step by step into the existing supply structures. Thisapproach will provide a complementary portfolio ofenvironmentally friendly technologies for heat and power supplyand the provision of transport fuels.
Many of the renewable technologies employed today are at arelatively early stage of market development. As a result, thecosts of electricity, heat and fuel production are generally higherthan those of competing conventional systems - a reminder thatthe environmental and social costs of conventional powerproduction are not reflected in market prices. It is expected,however that large cost reductions can come from technicaladvances, manufacturing improvements and large-scaleproduction, unlike conventional technologies. The dynamic trendof cost developments over time plays a crucial role in identifyingeconomically sensible expansion strategies for scenarios spanningseveral decades.
To identify long-term cost developments, learning curves havebeen applied to the model calculations to reflect how cost of aparticular technology change in relation to the cumulativeproduction volumes. For many technologies, the learning factor(or progress ratio) is between 0.75 for less mature systems to0.95 and higher for well-established technologies. A learningfactor of 0.9 means that costs are expected to fall by 10% everytime the cumulative output from the technology doubles.Empirical data shows, for example, that the learning factor forPV solar modules has been fairly constant at 0.8 over 30 yearswhilst that for wind energy varies from 0.75 in the UK to 0.94 inthe more advanced German market.
Assumptions on future costs for renewable electricity technologiesin the Energy [R]evolution scenario are derived from a review oflearning curve studies, for example by Lena Neij and others64, fromthe analysis of recent technology foresight and road mappingstudies, including the European Commission funded NEEDSproject (New Energy Externalities Developments forSustainability)65 or the IEA Energy Technology Perspectives 2008,projections by the European Renewable Energy Council publishedin April 2010 (“Re-Thinking 2050”) and discussions with expertsfrom different sectors of the renewable energy industry.
references60 RAGDEN, P ET AL., 2006, PG 18.
61 HEDDLE, G ET AL., 2003, PG 17.
62 PARFOMAK, P & FOLGER, P, 2008, PG 5 AND 12.
63 RUBIN ET AL., 2005B, PG 4444.
64 NEIJ, L, ‘COST DEVELOPMENT OF FUTURE TECHNOLOGIES FOR POWER GENERATION - A STUDY BASED
ON EXPERIENCE CURVES AND COMPLEMENTARY BOTTOM-UP ASSESSMENTS’, ENERGY POLICY 36
(2008), 2200-2211.
65 WWW.NEEDS-PROJECT.ORG.
63
© GP/MARKEL REDONDO
image AN EXCAVATOR DIGS A HOLE AT GUAZHOUWIND FARM CONSTRUCTION SITE, CHINA, WHERE ITIS PLANNED TO BUILD 134 WINDMILLS.
4.8.1 photovoltaics (PV)
The worldwide photovoltaics (PV) market has been growing at over40% per annum in recent years and the contribution is starting tomake a significant contribution to electricity generation.
Photovoltaics are important because of their decentralised/centralised character, its flexibility for use in an urban environmentand huge potential for cost reduction. The PV industry has beenincreasingly exploiting this potential during the last few years,with installation prices more than halving in the last few years.Current development is focused on improving existing modules andsystem components by increasing their energy efficiency andreducing material usage. Technologies like PV thin film (usingalternative semiconductor materials) or dye sensitive solar cellsare developing quickly and present a huge potential for costreduction. The mature technology crystalline silicon, with a provenlifetime of 30 years, is continually increasing its cell and moduleefficiency (by 0.5% annually), whereas the cell thickness israpidly decreasing (from 230 to 180 microns over the last fiveyears). Commercial module efficiency varies from 14 to 21%,depending on silicon quality and fabrication process.
The learning factor for PV modules has been fairly constant overthe last 30 years with costs reducing by 20% each time theinstalled capacity doubles, indicating a high rate of technicallearning. Assuming a globally installed capacity of about 1,500 GWbetween 2030 and 2040 in the Energy [R]evolution scenario withan electricity output of 2,600 TWh/a, generation costs of around $ 5-10 cents/kWh (depending on the region) will be achieved.During the following five to ten years, PV will become competitivewith retail electricity prices in many parts of the world, andcompetitive with fossil fuel costs around 2030. Cost data applied inthis study is shown in Table 4.7. In the long term, additional costsfor the integration into the power supply system of up to 25% ofPV investment have been taken into account (estimation for localbatteries and load and generation management measures).
4.8.2 concentrating solar power (CSP)
Solar thermal ‘concentrating’ power stations (CSP) can only usedirect sunlight and are therefore dependent on very sunnylocations. North Africa, for example, has a technical potential forthis technology which far exceeds regional demand. The varioussolar thermal technologies (detailed in Chapter 9) have goodprospects for further development and cost reductions. Because oftheir more simple design, ‘Fresnel’ collectors are considered as anoption for additional cost trimming. The efficiency of centralreceiver systems can be increased by producing compressed air at atemperature of up to 1,000°C, which is then used to run acombined gas and steam turbine.
Thermal storage systems are a way for CSP electricity generatorsto reduce costs. The Spanish Andasol 1 plant, for example, isequipped with molten salt storage with a capacity of 7.5 hours. Ahigher level of full load operation can be realised by using a thermalstorage system and a large collector field. Although this leads tohigher investment costs, it reduces the cost of electricity generation.
Depending on the level of irradiation and mode of operation, it isexpected that long term future electricity generation costs of $ 6-10 cents/kWh can be achieved. This presupposes rapid marketintroduction in the next few years. CSP investment costs assumedfor this study and shown in Table 4.8 include costs for anincreasing storage capacity up to 12 hours per day and additionalsolar fields up to solar multiple 3, achieving a maximum of 6,500full load hours per year.
4
scenario
s for a
futu
re energ
y supply
|COST PROJECTIONS FOR RENEWABLE ENERGY TECHNOLOGIES
E[R]
Investment costs ($/kWp)O & M costs $/(kW ∙ a)
2030 2040 2050SCENARIO
table 4.7: photovoltaics (PV) cost assumptions INCLUDING ADDITIONAL COSTS FOR GRID INTEGRATION OF UP TO 25% OF PV INVESTMENT
202020152009
1,28015
1,04014
1,06015
1,65021
2,30038
3,00043
E[R]
Investment costs ($/kWp)O & M costs $/(kW ∙ a)
2030 2040 2050SCENARIO
table 4.8: concentrating solar power (CSP) cost assumptionsINCLUDING COSTS FOR HEAT STORAGE AND ADDITIONAL SOLAR FIELDS
202020152009
5,750229
5,300211
4,800193
6,600265
8,100330
9,300420
O & M = Operation and maintenance.O & M = Operation and maintenance.
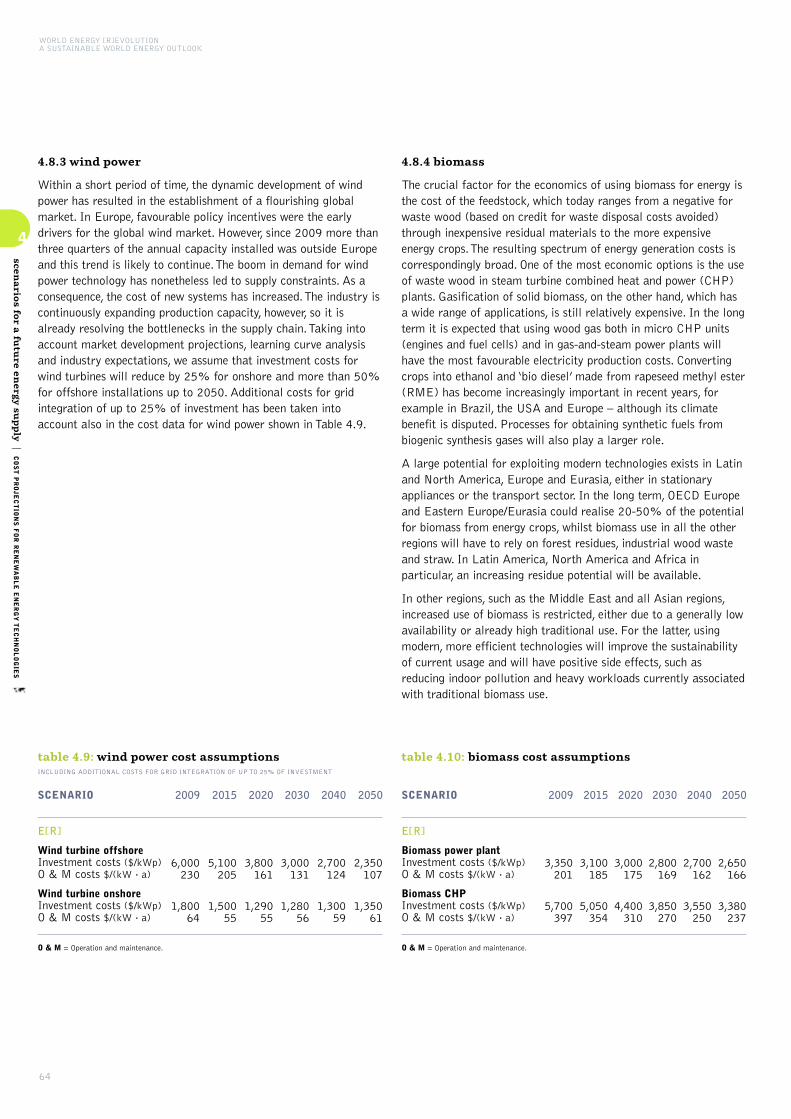
WORLD ENERGY [R]EVOLUTIONA SUSTAINABLE WORLD ENERGY OUTLOOK
64
4
scenario
s for a
futu
re energ
y supply
|COST PROJECTIONS FOR RENEWABLE ENERGY TECHNOLOGIES
4.8.3 wind power
Within a short period of time, the dynamic development of windpower has resulted in the establishment of a flourishing globalmarket. In Europe, favourable policy incentives were the earlydrivers for the global wind market. However, since 2009 more thanthree quarters of the annual capacity installed was outside Europeand this trend is likely to continue. The boom in demand for windpower technology has nonetheless led to supply constraints. As aconsequence, the cost of new systems has increased. The industry iscontinuously expanding production capacity, however, so it isalready resolving the bottlenecks in the supply chain. Taking intoaccount market development projections, learning curve analysisand industry expectations, we assume that investment costs forwind turbines will reduce by 25% for onshore and more than 50%for offshore installations up to 2050. Additional costs for gridintegration of up to 25% of investment has been taken intoaccount also in the cost data for wind power shown in Table 4.9.
4.8.4 biomass
The crucial factor for the economics of using biomass for energy isthe cost of the feedstock, which today ranges from a negative forwaste wood (based on credit for waste disposal costs avoided)through inexpensive residual materials to the more expensiveenergy crops. The resulting spectrum of energy generation costs iscorrespondingly broad. One of the most economic options is the useof waste wood in steam turbine combined heat and power (CHP)plants. Gasification of solid biomass, on the other hand, which hasa wide range of applications, is still relatively expensive. In the longterm it is expected that using wood gas both in micro CHP units(engines and fuel cells) and in gas-and-steam power plants willhave the most favourable electricity production costs. Convertingcrops into ethanol and ‘bio diesel’ made from rapeseed methyl ester(RME) has become increasingly important in recent years, forexample in Brazil, the USA and Europe – although its climatebenefit is disputed. Processes for obtaining synthetic fuels frombiogenic synthesis gases will also play a larger role.
A large potential for exploiting modern technologies exists in Latinand North America, Europe and Eurasia, either in stationaryappliances or the transport sector. In the long term, OECD Europeand Eastern Europe/Eurasia could realise 20-50% of the potentialfor biomass from energy crops, whilst biomass use in all the otherregions will have to rely on forest residues, industrial wood wasteand straw. In Latin America, North America and Africa inparticular, an increasing residue potential will be available.
In other regions, such as the Middle East and all Asian regions,increased use of biomass is restricted, either due to a generally lowavailability or already high traditional use. For the latter, usingmodern, more efficient technologies will improve the sustainabilityof current usage and will have positive side effects, such asreducing indoor pollution and heavy workloads currently associatedwith traditional biomass use.
E[R]
Wind turbine offshore Investment costs ($/kWp)O & M costs $/(kW ∙ a)
Wind turbine onshoreInvestment costs ($/kWp)O & M costs $/(kW ∙ a)
2030 2040 2050SCENARIO
table 4.9: wind power cost assumptions INCLUDING ADDITIONAL COSTS FOR GRID INTEGRATION OF UP TO 25% OF INVESTMENT
202020152009
3,000131
1,28056
2,700124
1,30059
2,350107
1,35061
3,800161
1,29055
5,100205
1,50055
6,000230
1,80064
E[R]
Biomass power plantInvestment costs ($/kWp)O & M costs $/(kW ∙ a)
Biomass CHPInvestment costs ($/kWp)O & M costs $/(kW ∙ a)
2030 2040 2050SCENARIO
table 4.10: biomass cost assumptions
202020152009
2,800169
3,850270
2,700162
3,550250
2,650166
3,380237
3,000175
4,400310
3,100185
5,050354
3,350201
5,700397
O & M = Operation and maintenance.O & M = Operation and maintenance.

E[R]
Geothermal power plantInvestment costs ($/kWp)O & M costs $/(kW ∙ a)
2030 2040 2050SCENARIO
table 4.12: ocean energy cost assumptions
202020152009
2,30091
1,90077
1,70068
3,300132
4,650185
5,900237
O & M = Operation and maintenance.
65
© GP/MARKEL REDONDO
image ANDASOL 1 SOLAR POWER STATION IS EUROPE’SFIRST COMMERCIAL PARABOLIC TROUGH SOLAR POWERPLANT. IT WILL SUPPLY UP TO 200,000 PEOPLE WITHCLIMATE-FRIENDLY ELECTRICITY AND SAVE ABOUT149,000 TONNES OF CARBON DIOXIDE PER YEARCOMPARED WITH A MODERN COAL POWER PLANT.
4.8.5 geothermal
Geothermal energy has long been used worldwide for supplyingheat, and since the beginning of the last century for electricitygeneration. Geothermally generated electricity was previouslylimited to sites with specific geological conditions, but furtherintensive research and development work widened potential sites.In particular the creation of large underground heat exchangesurfaces - Enhanced Geothermal Systems (EGS) - and theimprovement of low temperature power conversion, for examplewith the Organic Rankine Cycle, could make it possible toproduce geothermal electricity anywhere. Advanced heat andpower cogeneration plants will also improve the economics ofgeothermal electricity.
A large part of the costs for a geothermal power plant comefrom deep underground drilling, so further development ofinnovative drilling technology is expected. Assuming a globalaverage market growth for geothermal power capacity of 15%per year up to 2020, adjusting to 12% up to 2030 and still 7%per year beyond 2030, the result would be a cost reductionpotential of more than 60% by 2050:
• for conventional geothermal power (without heat credits), from$ 15 cents/kWh to about $ 9 cents/kWh;
• for EGS, despite the presently high figures (about $ 20-30cents/kWh), electricity production costs - depending on the creditsfor heat supply - are expected to come down to around $ 8 cents/kWh in the long term.
Because of its non-fluctuating supply and a grid load operatingalmost 100% of the time, geothermal energy is considered to bea key element in a future supply structure based on renewablesources. Up to now we have only used a marginal part of thepotential. Shallow geothermal drilling, for example, can deliverenergy for heating and cooling at any time anywhere, and can beused for thermal energy storage.
4.8.6 ocean energy
Ocean energy, particularly offshore wave energy, is a significantresource and has the potential to satisfy an important percentageof electricity supply worldwide. Globally, the potential of oceanenergy has been estimated at around 90,000 TWh/year. The mostsignificant advantages are the vast availability and highpredictability of the resource and a technology with very lowvisual impact and no CO2 emissions. Many different concepts anddevices have been developed, including taking energy from thetides, waves, currents and both thermal and saline gradientresources. Many of these are in an advanced phase of researchand development, large scale prototypes have been deployed inreal sea conditions and some have reached pre-marketdeployment. There are a few grid connected, fully operationalcommercial wave and tidal generating plants.
The cost of energy from initial tidal and wave energy farms hasbeen estimated to be in the range of $ 25-95 cents/kWh66, and forinitial tidal stream farms in the range of $ 14-28 cents/kWh.Generation costs of $ 8-10 cents/kWh are expected by 2030. Keyareas for development will include concept design, optimisation ofthe device configuration, reduction of capital costs by exploring theuse of alternative structural materials, economies of scale andlearning from operation. According to the latest research findings,the learning factor is estimated to be 10-15% for offshore waveand 5-10% for tidal stream. In the long term, ocean energy has thepotential to become one of the most competitive and cost effectiveforms of generation. In the next few years a dynamic marketpenetration is expected, following a similar curve to wind energy.
Because of the early development stage any future cost estimatesfor ocean energy systems are uncertain. Present cost estimates arebased on analysis from the European NEEDS project.67
4
scenario
s for a
futu
re energ
y supply
|COST PROJECTIONS FOR RENEWABLE ENERGY TECHNOLOGIES
references66 G.J. DALTON, T. LEWIS (2011): PERFORMANCE AND ECONOMIC FEASIBILITY ANALYSIS OF 5 WAVE
ENERGY DEVICES OFF THE WEST COAST OF IRELAND; EWTEC 2011.
67 WWW.NEEDS-PROJECT.ORG.
E[R]
Geothermal power plantInvestment costs ($/kWp)O & M costs $/(kW ∙ a)
2030 2040 2050SCENARIO
table 4.11: geothermal cost assumptions
202020152009
6,400318
5,300297
4,550281
9,300418
11,100538
13,500637
O & M = Operation and maintenance.
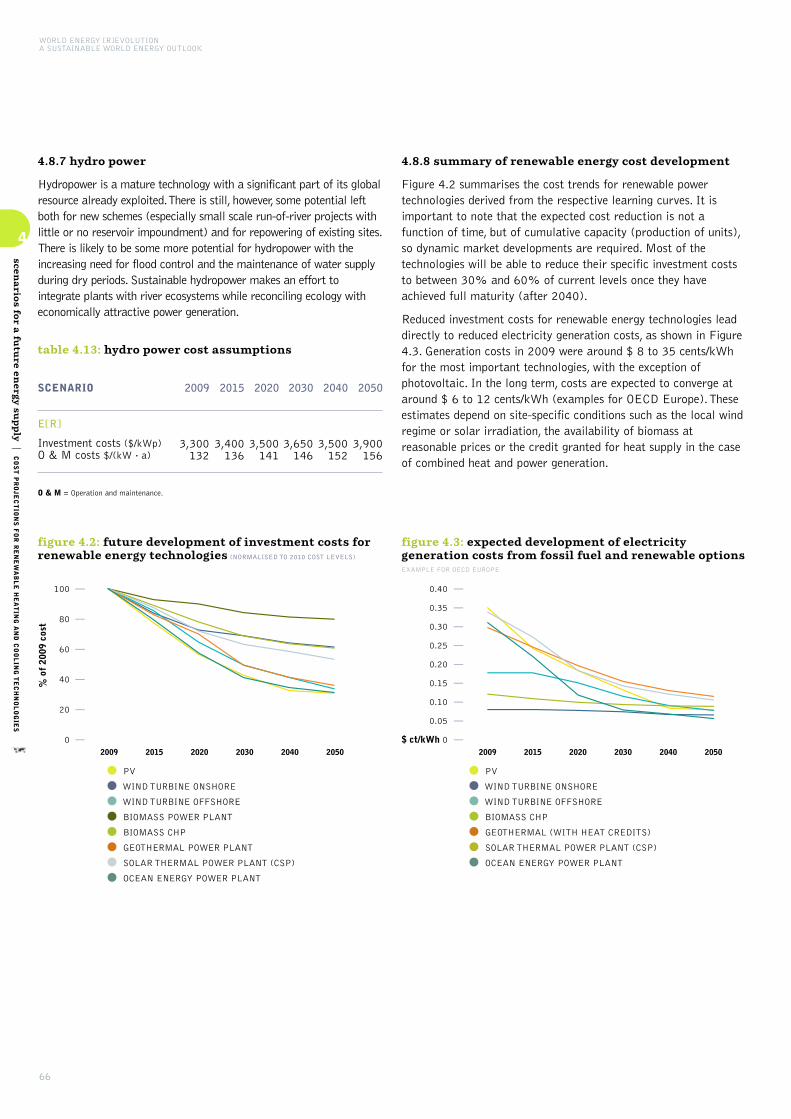
WORLD ENERGY [R]EVOLUTIONA SUSTAINABLE WORLD ENERGY OUTLOOK
66
4
scenario
s for a
futu
re energ
y supply
|COST PROJECTIONS FOR RENEWABLE HEATING AND COOLING TECHNOLOGIES
4.8.7 hydro power
Hydropower is a mature technology with a significant part of its globalresource already exploited. There is still, however, some potential leftboth for new schemes (especially small scale run-of-river projects withlittle or no reservoir impoundment) and for repowering of existing sites.There is likely to be some more potential for hydropower with theincreasing need for flood control and the maintenance of water supplyduring dry periods. Sustainable hydropower makes an effort tointegrate plants with river ecosystems while reconciling ecology witheconomically attractive power generation.
4.8.8 summary of renewable energy cost development
Figure 4.2 summarises the cost trends for renewable powertechnologies derived from the respective learning curves. It isimportant to note that the expected cost reduction is not afunction of time, but of cumulative capacity (production of units),so dynamic market developments are required. Most of thetechnologies will be able to reduce their specific investment coststo between 30% and 60% of current levels once they haveachieved full maturity (after 2040).
Reduced investment costs for renewable energy technologies leaddirectly to reduced electricity generation costs, as shown in Figure4.3. Generation costs in 2009 were around $ 8 to 35 cents/kWhfor the most important technologies, with the exception ofphotovoltaic. In the long term, costs are expected to converge ataround $ 6 to 12 cents/kWh (examples for OECD Europe). Theseestimates depend on site-specific conditions such as the local windregime or solar irradiation, the availability of biomass atreasonable prices or the credit granted for heat supply in the caseof combined heat and power generation.
E[R]
Investment costs ($/kWp)O & M costs $/(kW ∙ a)
2030 2040 2050SCENARIO
table 4.13: hydro power cost assumptions
202020152009
3,650146
3,500152
3,900156
3,500141
3,400136
3,300132
O & M = Operation and maintenance.
figure 4.2: future development of investment costs forrenewable energy technologies (NORMALISED TO 2010 COST LEVELS)
• PV
•WIND TURBINE ONSHORE
•WIND TURBINE OFFSHORE
• BIOMASS POWER PLANT
• BIOMASS CHP
• GEOTHERMAL POWER PLANT
• SOLAR THERMAL POWER PLANT (CSP)
• OCEAN ENERGY POWER PLANT
• PV
•WIND TURBINE ONSHORE
•WIND TURBINE OFFSHORE
• BIOMASS CHP
• GEOTHERMAL (WITH HEAT CREDITS)
• SOLAR THERMAL POWER PLANT (CSP)
• OCEAN ENERGY POWER PLANT
figure 4.3: expected development of electricitygeneration costs from fossil fuel and renewable options EXAMPLE FOR OECD EUROPE
2009 2015 2020 2030 2040 2050
0
20
40
60
80
100
% o
f 20
09 c
ost
$ ct/kWh 0
0.05
0.10
0.15
0.20
0.25
0.30
0.35
0.40
2009 2015 2020 2030 2040 2050

67
© DIGITAL GLOBE
image A SATELLITE IMAGE OF EYJAFJALLAJOKULLVOLCANO ERUPTION, ICELAND, 2010.
4.9 cost projections for renewable heating technologies
Renewable heating has the longest tradition of all renewabletechnologies. In a joint survey EREC and DLR carried out asurvey on renewable heating technologies in Europe (see alsotechnology chapter 9). The report analyses installation costs ofrenewable heating technologies, ranging from direct solar collectorsystems to geothermal and ambient heat applications and biomasstechnologies. Some technologies are already mature and competeon the market – especially simple heating systems in the domesticsector. However, more sophisticated technologies, which canprovide higher shares of heat demand from renewable sources, arestill under development. Costs of different technologies show quitea large range depending not only on the maturity of thetechnology but also on the complexity of the system as well as thelocal conditions. Market barriers slow down the furtherimplementation and cost reduction of renewable heating systems,especially for heating networks. Nevertheless, significant learningrates can be expected if renewable heating is increasinglyimplemented as projected in the Energy [R]evolution scenario.
4.9.1 solar thermal technologies
Solar collectors depend on direct solar irradiation, so the yieldstrongly depends on the location. In very sunny regions even verysimple collectors can provide hot water to households at very lowcost. In Europe, thermosiphon systems can provide total hotwater demand in households at around 400 €/m2 installationcosts. In regions with less sun, where additional space heating isneeded, installation cost for pumped systems are twice as high. Inthese areas, economies of scales can decrease solar heating costssignificantly. Large scale solar collector system are known from250-600 €/m2, depending on the share of solar energy in thewhole heating system and the level of storage required. Whilethose cost assumptions were transferred to all OECD Regions andthe Eastern European Economies, a lower cost level forhouseholds was assumed in very sunny or developing regions.
4.9.2 deep geothermal applications
(Deep) geothermal heat from aquifers or reservoirs can be useddirectly in hydrothermal heating plants to supply heat demandclose to the plant or in a district heating network for severaldifferent types of heat (see Chapter 8). Due to the high drillingcosts deep geothermal energy is mostly feasibly for largeapplications in combination with heat networks. It is alreadyeconomic feasible and has been in use for a long time, whereaquifers can be found near the surface, e.g. in the Pacific Island oralong the Pacific ring of fire. Also in Europe deep geothermalapplications are being developed for heating purposes at investmentcosts from 500€/kWth (shallow) to 3000 €/kWth (deep), with thecosts strongly dependent on the drilling depth. As deep geothermalsystems require a high technology level, European cost assumptionswere transferred to all regions worldwide.
4.9.3 heat pumps
Heat pumps typically provide hot water or space heat for heatingsystems with relatively low supply temperature or can serve as asupplement to other heating technologies. They have becomeincreasingly popular for underfloor heating in buildings in Europe.Economies of scale are less important than for deep geothermal, sothere is focus on small household applications with investment costs inEurope ranging from 500-1,600 €/kW for ground water systems andfrom 1,200-3,000 €/kW for ground source or aerothermal systems.
4.9.4 biomass applications
There is broad portfolio of modern technologies for heat productionfrom biomass, ranging from small scale single room stoves to heatingor CHP-plants in MW scale. Investments costs in Europe show asimilar variety: simple log wood stoves can be obtained from 100€/kW, more sophisticated automated heating systems that cover thewhole heat demand of a building are significantly more expensive.Log wood or pellet boilers range from 400-1200 €/kW, with largeapplications being cheaper than small systems. Considering thepossible applications of this wide range of technologies especially inthe household sector, higher investment costs were assumed forhightech regions of the OECD, the Eastern European Economies andMiddle East. Sunny regions with low space heat demand as well asdeveloping regions are covered with very low investment costs.Economy of scales apply to heating plants above 500kW, withinvestment cost between 400-700 €/kW. Heating plants can deliverprocess heat or provide whole neighbourhoods with heat. Even if heatnetworks demand additional investment, there is great potential touse solid biomass for heat generation in both small and large heatingcentres linked to local heating networks.
Cost reductions expected vary strongly within each technologysector, depending on the maturity of a specific technology. E.g.Small wood stoves will not see significant cost reductions, whilethere is still learning potential for automated pellet heating systems.Cost for simple solar collectors for swimming pools might bealready optimised, whereas integration in large systems is neithertechnological nor economical mature. Table 4.14 shows averagedevelopment pathways for a variety of heat technology options.
4
scenario
s for a
futu
re energ
y supply
|COST PROJECTIONS FOR RENEWABLE HEATING AND COOLING TECHNOLOGIES
table 4.14: overview over expected investment costspathways for heating technologies IN $/KW
* WITHOUT NETWORK
2020
2,5201,930140
1,120
910
1,030130900640
2040
2,0001,710140890
720
820130800570
2050
1,7601,600140750
610
690130750530
Geothermal distict heating*Heat pumpsLow tech solar collectorsSmall solar collector systemsLarge solar collector systemsSolar district heating*Low tech biomass stovesBiomass heating systemsBiomass district heating*
2030
2,2501,810140
1,010
810
920130850600
2015
2,6501,990140
1,170
950
1,080130930660
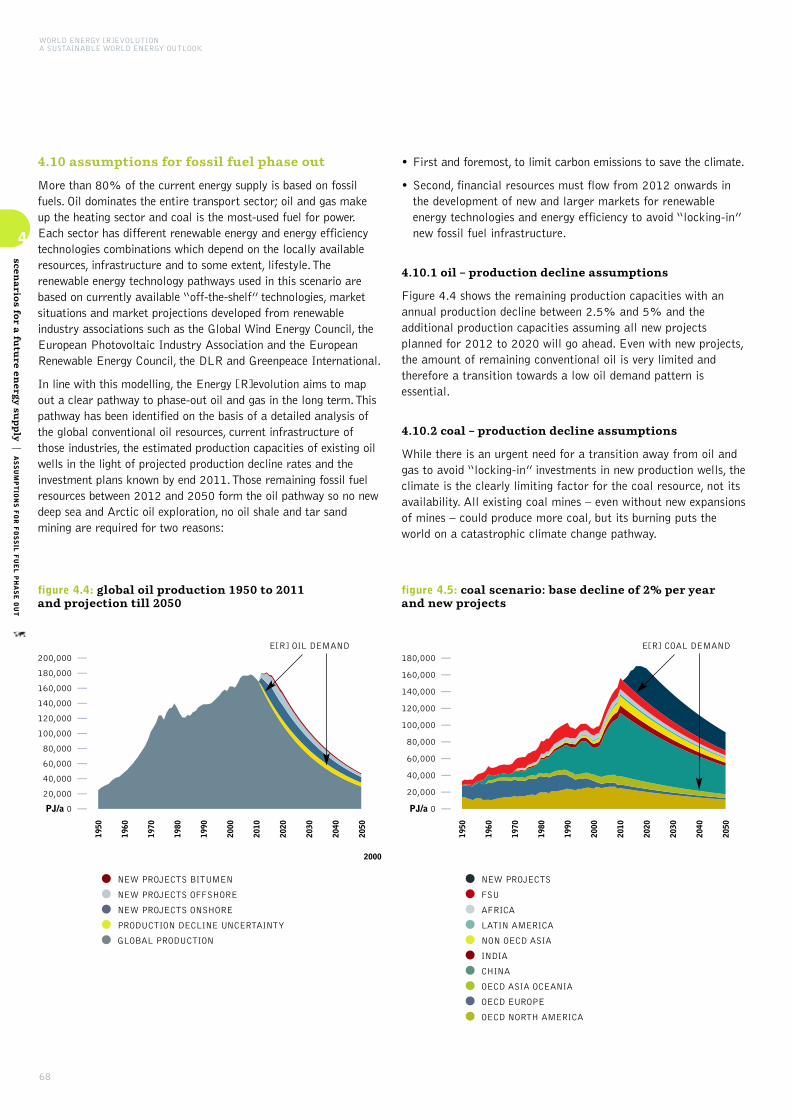
figure 4.5: coal scenario: base decline of 2% per year and new projects
•NEW PROJECTS
• FSU
• AFRICA
• LATIN AMERICA
• NON OECD ASIA
• INDIA
• CHINA
• OECD ASIA OCEANIA
• OECD EUROPE
• OECD NORTH AMERICA
1950
1960
1970
1980
1990
2000
2010
2020
2030
2040
2050
PJ/a 0
20,000
40,000
60,000
80,000
100,000
120,000
140,000
160,000
180,000
4.10 assumptions for fossil fuel phase out
More than 80% of the current energy supply is based on fossilfuels. Oil dominates the entire transport sector; oil and gas makeup the heating sector and coal is the most-used fuel for power.Each sector has different renewable energy and energy efficiencytechnologies combinations which depend on the locally availableresources, infrastructure and to some extent, lifestyle. Therenewable energy technology pathways used in this scenario arebased on currently available “off-the-shelf” technologies, marketsituations and market projections developed from renewableindustry associations such as the Global Wind Energy Council, theEuropean Photovoltaic Industry Association and the EuropeanRenewable Energy Council, the DLR and Greenpeace International.
In line with this modelling, the Energy [R]evolution aims to mapout a clear pathway to phase-out oil and gas in the long term. Thispathway has been identified on the basis of a detailed analysis ofthe global conventional oil resources, current infrastructure ofthose industries, the estimated production capacities of existing oilwells in the light of projected production decline rates and theinvestment plans known by end 2011. Those remaining fossil fuelresources between 2012 and 2050 form the oil pathway so no newdeep sea and Arctic oil exploration, no oil shale and tar sandmining are required for two reasons:
• First and foremost, to limit carbon emissions to save the climate.
• Second, financial resources must flow from 2012 onwards inthe development of new and larger markets for renewableenergy technologies and energy efficiency to avoid “locking-in”new fossil fuel infrastructure.
4.10.1 oil – production decline assumptions
Figure 4.4 shows the remaining production capacities with anannual production decline between 2.5% and 5% and theadditional production capacities assuming all new projectsplanned for 2012 to 2020 will go ahead. Even with new projects,the amount of remaining conventional oil is very limited andtherefore a transition towards a low oil demand pattern isessential.
4.10.2 coal – production decline assumptions
While there is an urgent need for a transition away from oil andgas to avoid “locking-in” investments in new production wells, theclimate is the clearly limiting factor for the coal resource, not itsavailability. All existing coal mines – even without new expansionsof mines – could produce more coal, but its burning puts theworld on a catastrophic climate change pathway.
WORLD ENERGY [R]EVOLUTIONA SUSTAINABLE WORLD ENERGY OUTLOOK
68
4
scenario
s for a
futu
re energ
y supply
|ASSUMPTIONS FOR FOSSIL FUEL PHASE OUT
2000
figure 4.4: global oil production 1950 to 2011 and projection till 2050
•NEW PROJECTS BITUMEN
• NEW PROJECTS OFFSHORE
• NEW PROJECTS ONSHORE
• PRODUCTION DECLINE UNCERTAINTY
• GLOBAL PRODUCTION
E[R] COAL DEMAND
1950
1960
1970
1980
1990
2000
2010
2020
2030
2040
2050
PJ/a 0
20,000
40,000
60,000
80,000
100,000
120,000
140,000
160,000
180,000
200,000E[R] OIL DEMAND

69
4.11 review: greenpeace scenario projections of the past
Greenpeace has published numerous projections in cooperationwith Renewable Industry Associations and scientific institutionsin the past decade. This section provides an overview of theprojections between 2000 and 2011 and compares them withreal market developments and projections of the IEA WorldEnergy Outlook – our Reference scenario.
4.11.1 the development of the global wind industry
Greenpeace and the European Wind Energy Association published“Windforce 10” for the first time in 1999– a global marketprojection for wind turbines until 2030. Since then, an updatedprognosis has been published every second year. Since 2006 thereport has been renamed to “Global Wind Energy Outlook” witha new partner – the Global Wind Energy Council (GWEC) – anew umbrella organisation of all regional wind industry
associations. Figure 4.6 shows the projections made each yearbetween 2000 and 2010 compared to the real market data. Thegraph also includes the first two Energy [R]evolution (ER)editions (published in 2007 and 2008) against the IEA’s windprojections published in World Energy Outlook (WEO) 2000,2002, 2005 and 2007.
The projections from the “Wind force 10” and “Windforce 12”were calculated by BTM consultants, Denmark. “Windforce 10”(2001 - 2011) exact projection for the global wind marketpublished during this time, at 10% below the actual marketdevelopment. Also all following editions where around 10%above or below the real market. In 2006, the new “Global WindEnergy Outlook” had two different scenarios, a moderate and anadvanced wind power market projections calculated by GWECand Greenpeace International. The figures here show only theadvanced projections, as the moderate were too low. However,these very projections were the most criticised at the time, beingcalled “over ambitious” or even “impossible”.
4
scenario
s for a
futu
re energ
y supply
|REVIEW: G
REENPEACE SCENARIO PROJECTIONS OF THE PAST
figure 4.6: wind power: short term prognosis vs real market development - global cummulative capacity
2010
197,637
181,252
233,905
153,759
186,309
156,149
163,855
32,500
55,000
107,541
123,660
2009
158,864
140,656
189,081
30,990
52,013
97,851
113,713
2008
120,291
109,428
151,728
29,480
49,025
88,161
103,767
2007
93,820
85,407
120,600
27,970
46,038
78,471
93,820
2006
74,052
66,929
94,660
26,460
43,050
68,781
2005
59,091
52,715
73,908
24,950
40,063
59,091
2004
47,620
41,781
57,306
23,440
37,075
2003
39,431
33,371
44,025
21,930
34,088
2002
31,100
26,901
20,420
31,100
2001
23,900
21,510
18,910
2000
17,400
17,400
REAL
WF 10 (1999)
WF 12 (2002)
GWEO 2006 (Advanced)
GWEO 2008 (Advanced)
ER 2007
ER 2008
ADVANCED ER 2010
IEA WEO 2000 (REF)
IEA WEO 2002 (REF)
IEA WEO 2005 (REF)
IEA WEO 2007 (REF)
0
50,000
100,000
150,000
200,000
250,000
MW
© GP/PETER CATON
image A PRAWN SEED FARM ON MAINLANDINDIA’S SUNDARBANS COAST LIES FLOODED AFTERCYCLONE AILA. INUNDATING AND DESTROYINGNEARBY ROADS AND HOUSES WITH SALT WATER.
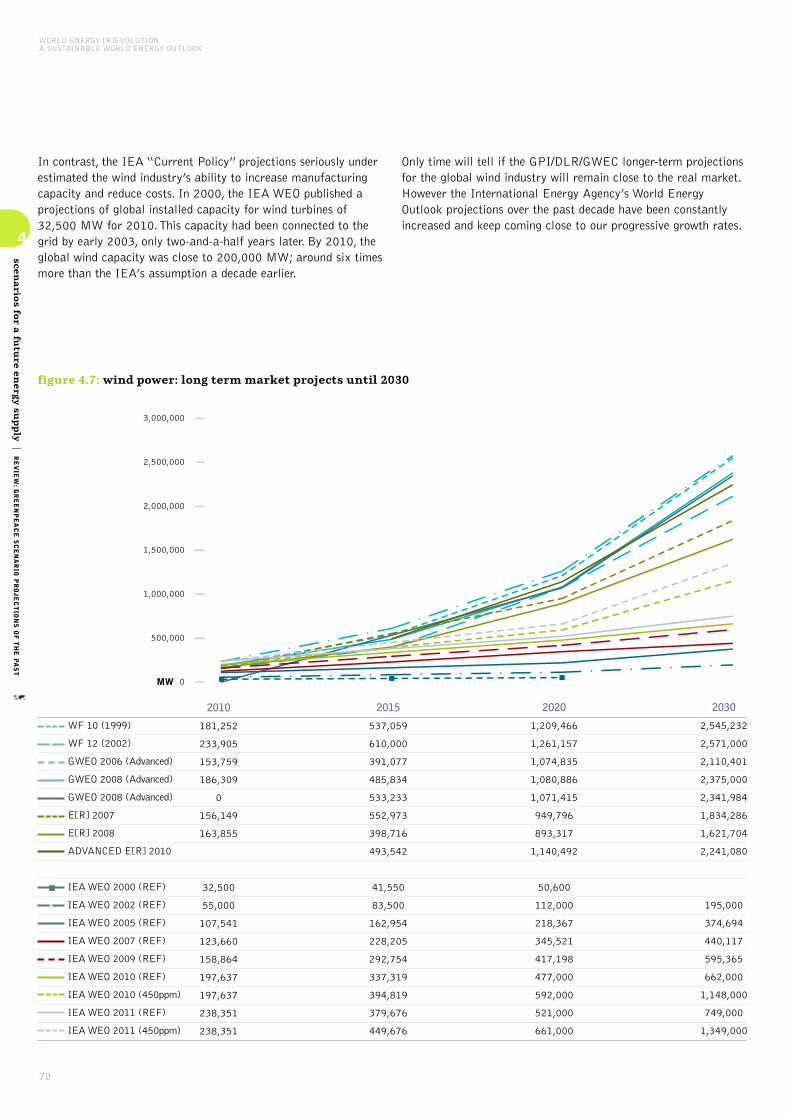
In contrast, the IEA “Current Policy” projections seriously underestimated the wind industry’s ability to increase manufacturingcapacity and reduce costs. In 2000, the IEA WEO published aprojections of global installed capacity for wind turbines of32,500 MW for 2010. This capacity had been connected to thegrid by early 2003, only two-and-a-half years later. By 2010, theglobal wind capacity was close to 200,000 MW; around six timesmore than the IEA’s assumption a decade earlier.
Only time will tell if the GPI/DLR/GWEC longer-term projectionsfor the global wind industry will remain close to the real market.However the International Energy Agency’s World EnergyOutlook projections over the past decade have been constantlyincreased and keep coming close to our progressive growth rates.
WORLD ENERGY [R]EVOLUTIONA SUSTAINABLE WORLD ENERGY OUTLOOK
70
4
scenario
s for a
futu
re energ
y supply
|REVIEW: G
REENPEACE SCENARIO PROJECTIONS OF THE PAST
figure 4.7: wind power: long term market projects until 2030
2010
181,252
233,905
153,759
186,309
0
156,149
163,855
32,500
55,000
107,541
123,660
158,864
197,637
197,637
238,351
238,351
2015
537,059
610,000
391,077
485,834
533,233
552,973
398,716
493,542
41,550
83,500
162,954
228,205
292,754
337,319
394,819
379,676
449,676
2020
1,209,466
1,261,157
1,074,835
1,080,886
1,071,415
949,796
893,317
1,140,492
50,600
112,000
218,367
345,521
417,198
477,000
592,000
521,000
661,000
2030
2,545,232
2,571,000
2,110,401
2,375,000
2,341,984
1,834,286
1,621,704
2,241,080
195,000
374,694
440,117
595,365
662,000
1,148,000
749,000
1,349,000
WF 10 (1999)
WF 12 (2002)
GWEO 2006 (Advanced)
GWEO 2008 (Advanced)
GWEO 2008 (Advanced)
E[R] 2007
E[R] 2008
ADVANCED E[R] 2010
IEA WEO 2000 (REF)
IEA WEO 2002 (REF)
IEA WEO 2005 (REF)
IEA WEO 2007 (REF)
IEA WEO 2009 (REF)
IEA WEO 2010 (REF)
IEA WEO 2010 (450ppm)
IEA WEO 2011 (REF)
IEA WEO 2011 (450ppm)
0
500,000
1,000,000
1,500,000
2,000,000
2,500,000
3,000,000
MW
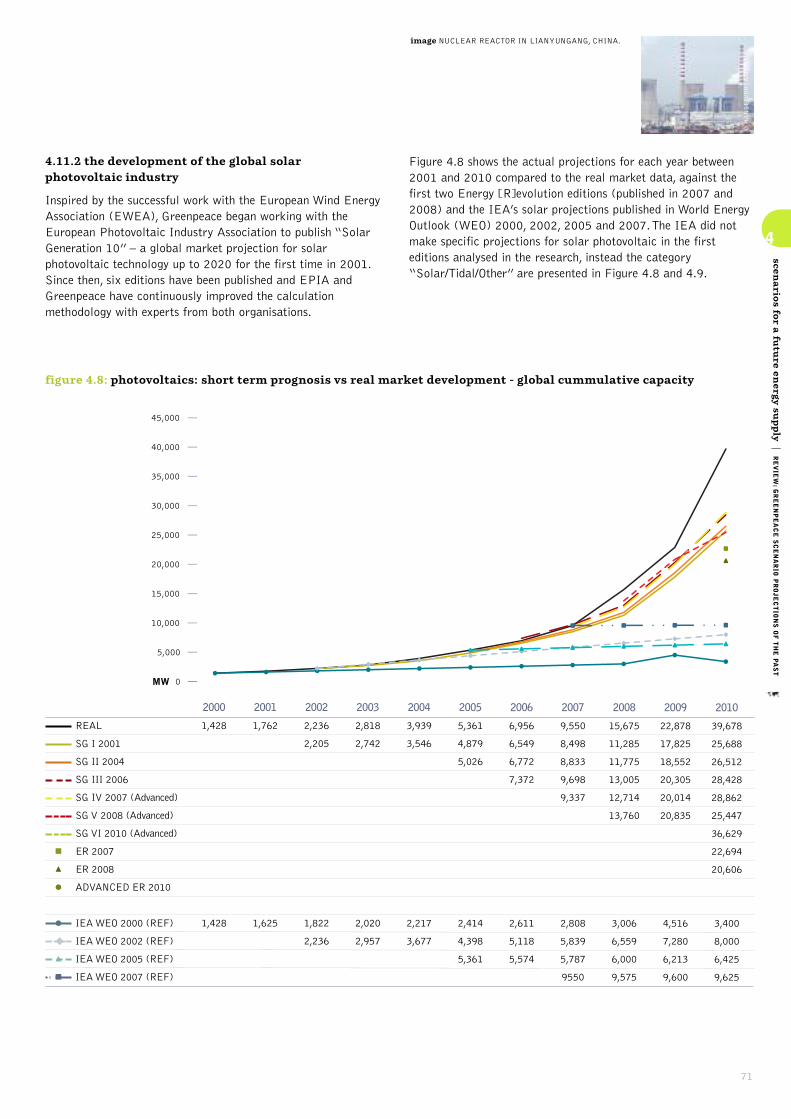
71
4.11.2 the development of the global solar photovoltaic industry
Inspired by the successful work with the European Wind EnergyAssociation (EWEA), Greenpeace began working with theEuropean Photovoltaic Industry Association to publish “SolarGeneration 10” – a global market projection for solarphotovoltaic technology up to 2020 for the first time in 2001.Since then, six editions have been published and EPIA andGreenpeace have continuously improved the calculationmethodology with experts from both organisations.
Figure 4.8 shows the actual projections for each year between2001 and 2010 compared to the real market data, against thefirst two Energy [R]evolution editions (published in 2007 and2008) and the IEA’s solar projections published in World EnergyOutlook (WEO) 2000, 2002, 2005 and 2007. The IEA did notmake specific projections for solar photovoltaic in the firsteditions analysed in the research, instead the category“Solar/Tidal/Other” are presented in Figure 4.8 and 4.9.
4
scenario
s for a
futu
re energ
y supply
|REVIEW: G
REENPEACE SCENARIO PROJECTIONS OF THE PAST
figure 4.8: photovoltaics: short term prognosis vs real market development - global cummulative capacity
REAL
SG I 2001
SG II 2004
SG III 2006
SG IV 2007 (Advanced)
SG V 2008 (Advanced)
SG VI 2010 (Advanced)
ER 2007
ER 2008
ADVANCED ER 2010
IEA WEO 2000 (REF)
IEA WEO 2002 (REF)
IEA WEO 2005 (REF)
IEA WEO 2007 (REF)
2010
39,678
25,688
26,512
28,428
28,862
25,447
36,629
22,694
20,606
3,400
8,000
6,425
9,625
2009
22,878
17,825
18,552
20,305
20,014
20,835
4,516
7,280
6,213
9,600
2008
15,675
11,285
11,775
13,005
12,714
13,760
3,006
6,559
6,000
9,575
2007
9,550
8,498
8,833
9,698
9,337
2,808
5,839
5,787
9550
2006
6,956
6,549
6,772
7,372
2,611
5,118
5,574
2005
5,361
4,879
5,026
2,414
4,398
5,361
2004
3,939
3,546
2,217
3,677
2003
2,818
2,742
2,020
2,957
2002
2,236
2,205
1,822
2,236
2001
1,762
1,625
2000
1,428
1,428
0
5,000
10,000
15,000
20,000
25,000
30,000
35,000
40,000
45,000
MW
image NUCLEAR REACTOR IN LIANYUNGANG, CHINA.
© HANSEN/DREAMSTIME
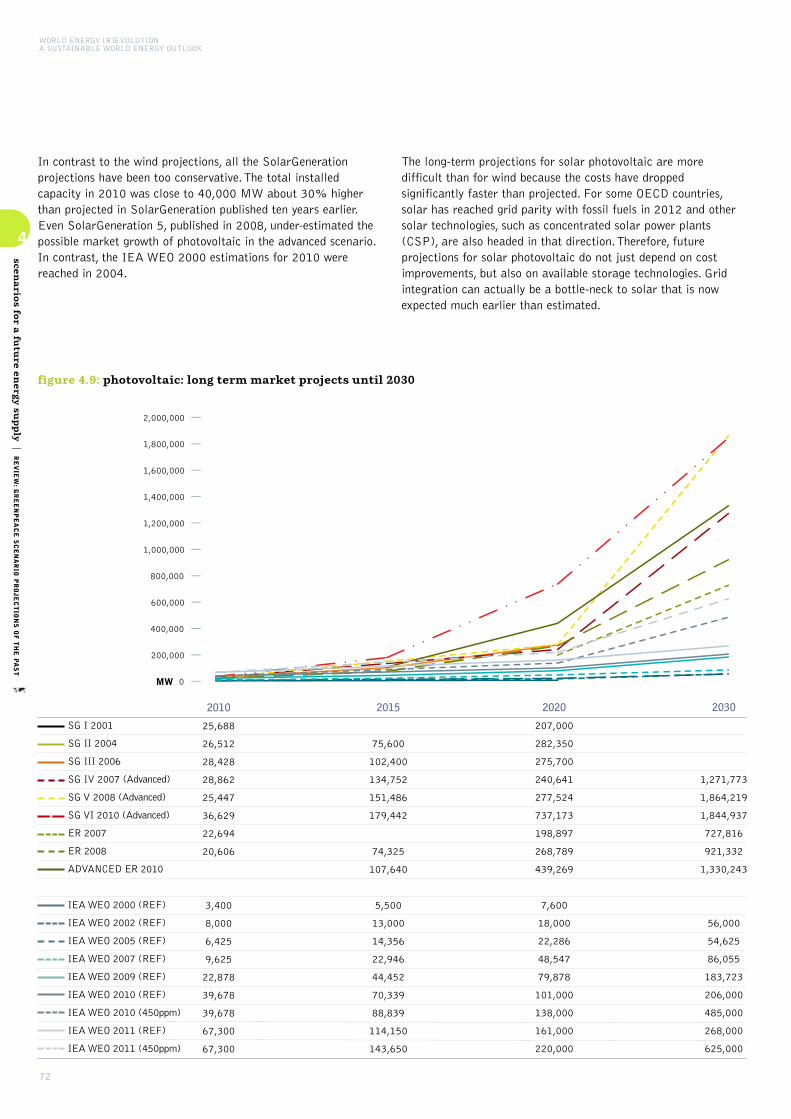
In contrast to the wind projections, all the SolarGenerationprojections have been too conservative. The total installedcapacity in 2010 was close to 40,000 MW about 30% higherthan projected in SolarGeneration published ten years earlier.Even SolarGeneration 5, published in 2008, under-estimated thepossible market growth of photovoltaic in the advanced scenario.In contrast, the IEA WEO 2000 estimations for 2010 werereached in 2004.
The long-term projections for solar photovoltaic are moredifficult than for wind because the costs have droppedsignificantly faster than projected. For some OECD countries,solar has reached grid parity with fossil fuels in 2012 and othersolar technologies, such as concentrated solar power plants(CSP), are also headed in that direction. Therefore, futureprojections for solar photovoltaic do not just depend on costimprovements, but also on available storage technologies. Gridintegration can actually be a bottle-neck to solar that is nowexpected much earlier than estimated.
WORLD ENERGY [R]EVOLUTIONA SUSTAINABLE WORLD ENERGY OUTLOOK
72
4
scenario
s for a
futu
re energ
y supply
|REVIEW: G
REENPEACE SCENARIO PROJECTIONS OF THE PAST
figure 4.9: photovoltaic: long term market projects until 2030
2010
25,688
26,512
28,428
28,862
25,447
36,629
22,694
20,606
3,400
8,000
6,425
9,625
22,878
39,678
39,678
67,300
67,300
2015
75,600
102,400
134,752
151,486
179,442
74,325
107,640
5,500
13,000
14,356
22,946
44,452
70,339
88,839
114,150
143,650
2020
207,000
282,350
275,700
240,641
277,524
737,173
198,897
268,789
439,269
7,600
18,000
22,286
48,547
79,878
101,000
138,000
161,000
220,000
2030
1,271,773
1,864,219
1,844,937
727,816
921,332
1,330,243
56,000
54,625
86,055
183,723
206,000
485,000
268,000
625,000
SG I 2001
SG II 2004
SG III 2006
SG IV 2007 (Advanced)
SG V 2008 (Advanced)
SG VI 2010 (Advanced)
ER 2007
ER 2008
ADVANCED ER 2010
IEA WEO 2000 (REF)
IEA WEO 2002 (REF)
IEA WEO 2005 (REF)
IEA WEO 2007 (REF)
IEA WEO 2009 (REF)
IEA WEO 2010 (REF)
IEA WEO 2010 (450ppm)
IEA WEO 2011 (REF)
IEA WEO 2011 (450ppm)
0
200,000
1,800,000
1,600,000
1,400,000
1,200,000
1,000,000
800,000
600,000
400,000
2,000,000
MW
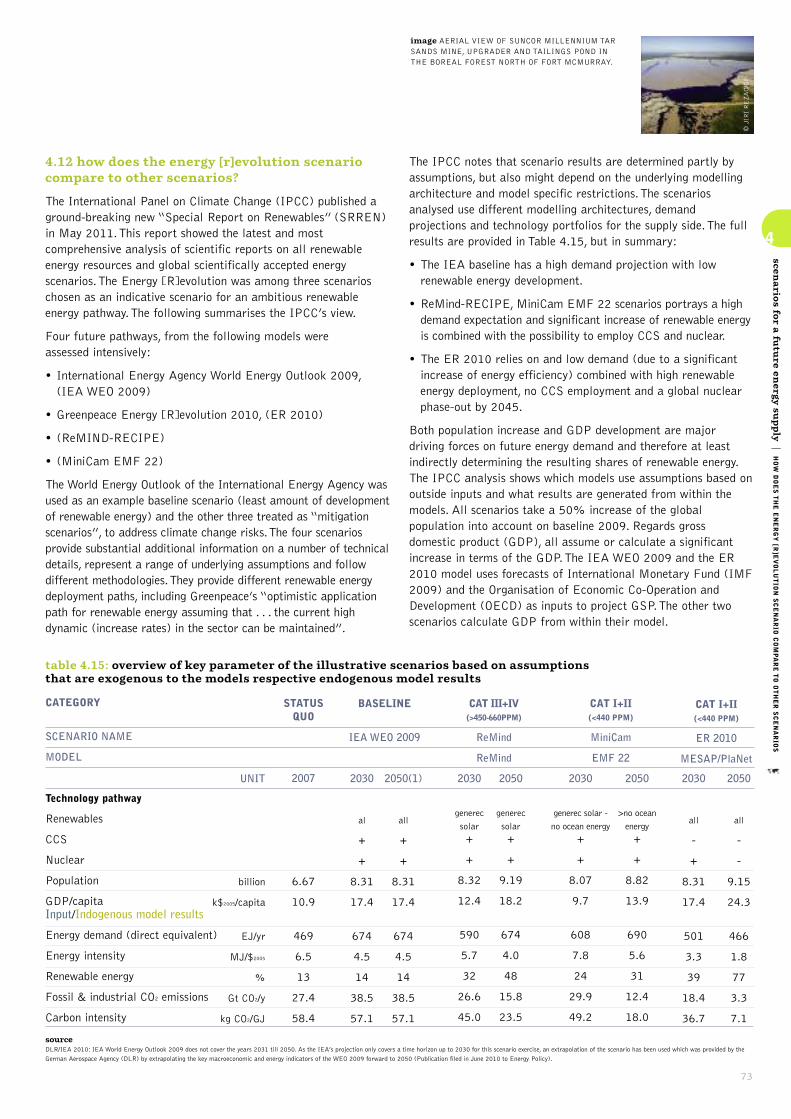
73
4.12 how does the energy [r]evolution scenariocompare to other scenarios?
The International Panel on Climate Change (IPCC) published aground-breaking new “Special Report on Renewables” (SRREN)in May 2011. This report showed the latest and mostcomprehensive analysis of scientific reports on all renewableenergy resources and global scientifically accepted energyscenarios. The Energy [R]evolution was among three scenarioschosen as an indicative scenario for an ambitious renewableenergy pathway. The following summarises the IPCC’s view.
Four future pathways, from the following models were assessed intensively:
• International Energy Agency World Energy Outlook 2009,(IEA WEO 2009)
• Greenpeace Energy [R]evolution 2010, (ER 2010)
• (ReMIND-RECIPE)
• (MiniCam EMF 22)
The World Energy Outlook of the International Energy Agency wasused as an example baseline scenario (least amount of developmentof renewable energy) and the other three treated as “mitigationscenarios”, to address climate change risks. The four scenariosprovide substantial additional information on a number of technicaldetails, represent a range of underlying assumptions and followdifferent methodologies. They provide different renewable energydeployment paths, including Greenpeace’s “optimistic applicationpath for renewable energy assuming that . . . the current highdynamic (increase rates) in the sector can be maintained”.
The IPCC notes that scenario results are determined partly byassumptions, but also might depend on the underlying modellingarchitecture and model specific restrictions. The scenariosanalysed use different modelling architectures, demandprojections and technology portfolios for the supply side. The fullresults are provided in Table 4.15, but in summary:
• The IEA baseline has a high demand projection with lowrenewable energy development.
• ReMind-RECIPE, MiniCam EMF 22 scenarios portrays a highdemand expectation and significant increase of renewable energyis combined with the possibility to employ CCS and nuclear.
• The ER 2010 relies on and low demand (due to a significantincrease of energy efficiency) combined with high renewableenergy deployment, no CCS employment and a global nuclearphase-out by 2045.
Both population increase and GDP development are majordriving forces on future energy demand and therefore at leastindirectly determining the resulting shares of renewable energy.The IPCC analysis shows which models use assumptions based onoutside inputs and what results are generated from within themodels. All scenarios take a 50% increase of the globalpopulation into account on baseline 2009. Regards grossdomestic product (GDP), all assume or calculate a significantincrease in terms of the GDP. The IEA WEO 2009 and the ER2010 model uses forecasts of International Monetary Fund (IMF2009) and the Organisation of Economic Co-Operation andDevelopment (OECD) as inputs to project GSP. The other twoscenarios calculate GDP from within their model.
4
scenario
s for a
futu
re energ
y supply
|HOW DOES THE ENERGY [R
]EVOLUTION SCENARIO COMPARE TO OTHER SCENARIOS
table 4.15: overview of key parameter of the illustrative scenarios based on assumptions that are exogenous to the models respective endogenous model results
UNIT
billion
k$2005/capita
EJ/yr
MJ/$2005
%
Gt CO2/y
kg CO2/GJ
STATUS QUO
2007
6.67
10.9
469
6.5
13
27.4
58.4
2030
al
+
+
8.31
17.4
674
4.5
14
38.5
57.1
2050(1)
all
+
+
8.31
17.4
674
4.5
14
38.5
57.1
2030
generec
solar
+
+
8.32
12.4
590
5.7
32
26.6
45.0
2050
generec
solar
+
+
9.19
18.2
674
4.0
48
15.8
23.5
2030
generec solar -
no ocean energy
+
+
8.07
9.7
608
7.8
24
29.9
49.2
2050
>no ocean
energy
+
+
8.82
13.9
690
5.6
31
12.4
18.0
2030
all
-
+
8.31
17.4
501
3.3
39
18.4
36.7
2050
all
-
-
9.15
24.3
466
1.8
77
3.3
7.1
CATEGORY
SCENARIO NAME
MODEL
Technology pathway
Renewables
CCS
Nuclear
Population
GDP/capitaInput/Indogenous model results
Energy demand (direct equivalent)
Energy intensity
Renewable energy
Fossil & industrial CO2 emissions
Carbon intensity
sourceDLR/IEA 2010: IEA World Energy Outlook 2009 does not cover the years 2031 till 2050. As the IEA’s projection only covers a time horizon up to 2030 for this scenario exercise, an extrapolation of the scenario has been used which was provided by the
German Aerospace Agency (DLR) by extrapolating the key macroeconomic and energy indicators of the WEO 2009 forward to 2050 (Publication filed in June 2010 to Energy Policy).
BASELINE
IEA WEO 2009
CAT III+IV(>450-660PPM)
ReMind
ReMind
CAT I+II(<440 PPM)
MiniCam
EMF 22
CAT I+II(<440 PPM)
ER 2010
MESAP/PlaNet© JIRI REZAC/GP
image AERIAL VIEW OF SUNCOR MILLENNIUM TARSANDS MINE, UPGRADER AND TAILINGS POND INTHE BOREAL FOREST NORTH OF FORT MCMURRAY.
74
key results of the energy [r]evolution scenario
GLOBAL SCENARIO OECD NORTH AMERICALATIN AMERICAOECD EUROPE AFRICA
MIDDLE EASTEASTERN EUROPE/EURASIAINDIA
NON OECD ASIACHINAOECD ASIA OCEANIA
5
5image SPRAWLING OVER PARTS OF SAUDI ARABIA, YEMEN, OMAN, AND THE UNITED ARAB EMIRATES, THE EMPTY QUARTER—OR RUB’ AL KHALI—IS THE WORLD’S LARGESTSAND SEA. ROUGHLY THE SIZE OF FRANCE, THE EMPTY QUARTER HOLDS ABOUT HALF AS MUCH SAND AS THE ENTIRE SAHARA DESERT. MUCH OF THE LAND IN THIS REGIONACTUALLY LIES AT AN ELEVATION BELOW SEA LEVEL, BUT NEAR THE YEMEN BORDER, DUNES CAN REACH AN ALTITUDE OF 1,200 METERS ABOVE SEA LEVEL.
for us todevelop in a
sustainable way,strong measure haveto be taken to combatclimate change”
“
© NASA/JESSE ALLEN, ROBERT SIM
MON
HU JINTAOPRESIDENT OF CHINA

75
5
key resu
lts|GLOBAL - P
ROJECTION OF ENERGY IN
TENSITY & ENERGY DEMAND
The development of future global energy demand is determinedby three key factors:
• Population development: the number of people consumingenergy or using energy services.
• Economic development, for which Gross Domestic Product(GDP) is the most commonly used indicator: in general anincrease in GDP triggers an increase in energy demand.
• Energy intensity: how much energy is required to produce a unit of GDP.
The Reference scenario and the Energy [R]evolution scenario arebased on the same projections of population and economicdevelopment. The future development of energy intensity, however,differs between the reference and the alternative case, taking intoaccount the measures to increase energy efficiency under theEnergy [R]evolution scenario.
global: projection of energy intensity
An increase in economic activity and a growing population does notnecessarily have to result in an equivalent increase in energydemand. There is still a large potential for exploiting energyefficiency measures. Under the Reference scenario we assume thatenergy intensity will be reduced by 1.7% on average per year,leading to a reduction in final energy demand per unit of GDP of
about 50% between 2009 and 2050. Under the Energy[R]evolution scenario it is assumed that active policy and technicalsupport for energy efficiency measures will lead to an even higherreduction in energy intensity of almost 70% until 2050.
global: development of global energy demand
Combining the projections on population development, GDPgrowth and energy intensity results in future developmentpathways for the world’s energy demand. These are shown inFigure 5.2 for the Reference and the Energy [R]evolutionscenario. Under the Reference scenario, total primary energydemand increases by 61% from 499,024 PJ/a in 2009 to about805,600 PJ/a in 2050. In the Energy [R]evolution scenario,demand increases by 10% until 2020 and decreases by 4%afterwards and it is expected by 2050 to reach 481,050 PJ/a.
The accelerated increase in energy efficiency, which is a crucialprerequisite for achieving a sufficiently large share of renewableenergy sources in our energy supply, is beneficial not only for theenvironment but also for economics. Taking into account the fulllifecycle costs, in most cases the implementation of energyefficiency measures saves money compared to creating anadditional energy supply. A dedicated energy efficiency strategytherefore helps to compensate in part for the additional costsrequired during the market introduction phase of renewableenergy technologies.
figure 5.1: global: final energy intensity under the reference scenario and the energy [r]evolution scenario
•REFERENCE
• ENERGY [R]EVOLUTION
MJ/$GDP 0.0
0.5
1.5
1.5
2.0
2.5
3.0
3.5
4.0
2010 2015 2020 2025 2030 2035 2040 2045 2050
© GP/ZENIT/LANGROCK
image FOREST CREEK WIND FARM PRODUCING 2.3MW WITH WIND TURBINES MADE BY SIEMENS. AWORKER WORKING ON TOP OF THE WIND TURBINE.
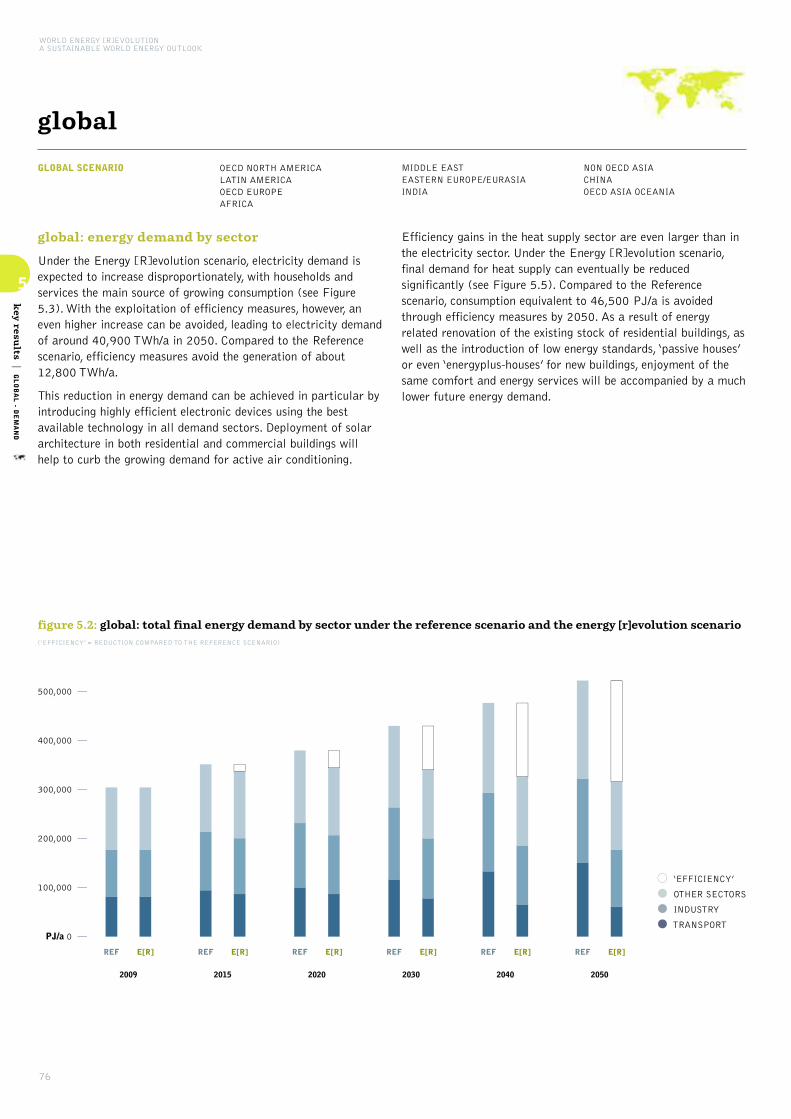
76
5
key resu
lts|GLOBAL - D
EMAND
WORLD ENERGY [R]EVOLUTIONA SUSTAINABLE WORLD ENERGY OUTLOOK
GLOBAL SCENARIO OECD NORTH AMERICALATIN AMERICAOECD EUROPE AFRICA
MIDDLE EASTEASTERN EUROPE/EURASIAINDIA
NON OECD ASIACHINAOECD ASIA OCEANIA
global
global: energy demand by sector
Under the Energy [R]evolution scenario, electricity demand isexpected to increase disproportionately, with households andservices the main source of growing consumption (see Figure5.3). With the exploitation of efficiency measures, however, aneven higher increase can be avoided, leading to electricity demandof around 40,900 TWh/a in 2050. Compared to the Referencescenario, efficiency measures avoid the generation of about12,800 TWh/a.
This reduction in energy demand can be achieved in particular byintroducing highly efficient electronic devices using the bestavailable technology in all demand sectors. Deployment of solararchitecture in both residential and commercial buildings willhelp to curb the growing demand for active air conditioning.
Efficiency gains in the heat supply sector are even larger than inthe electricity sector. Under the Energy [R]evolution scenario,final demand for heat supply can eventually be reducedsignificantly (see Figure 5.5). Compared to the Referencescenario, consumption equivalent to 46,500 PJ/a is avoidedthrough efficiency measures by 2050. As a result of energyrelated renovation of the existing stock of residential buildings, aswell as the introduction of low energy standards, ‘passive houses’or even ‘energyplus-houses’ for new buildings, enjoyment of thesame comfort and energy services will be accompanied by a muchlower future energy demand.
figure 5.2: global: total final energy demand by sector under the reference scenario and the energy [r]evolution scenario(‘EFFICIENCY’ = REDUCTION COMPARED TO THE REFERENCE SCENARIO)
• ‘EFFICIENCY’
• OTHER SECTORS
• INDUSTRY
•TRANSPORT
REF E[R]
2009
REF E[R]
2015
REF E[R]
2020
REF E[R]
2030
REF E[R]
2040
REF E[R]
2050
PJ/a 0
100,000
200,000
300,000
400,000
500,000

77
5
key resu
lts|GLOBAL - D
EMAND
figure 5.3: global: development of electricity demand bysector in the energy [r]evolution scenario(‘EFFICIENCY’ = REDUCTION COMPARED TO THE REFERENCE SCENARIO)
• ‘EFFICIENCY’
• OTHER SECTORS
• INDUSTRY
•TRANSPORT
E[R] E[R] E[R] E[R] E[R] E[R]
2009 2015 2020 2030 2040 2050
PJ/a 0
20,000
40,000
60,000
80,000
100,000
120,000
140,000
figure 5.4: global: development of the transport demandby sector in the energy [r]evolution scenario
•‘EFFICIENCY’
• DOMESTIC NAVIGATION
• DOMESTIC AVIATION
• ROAD
• RAIL
E[R] E[R] E[R] E[R] E[R] E[R]
2009 2015 2020 2030 2040 2050
PJ/a 0
30,000
60,000
90,000
120,000
150,000
E[R] E[R] E[R] E[R] E[R] E[R]
2009 2015 2020 2030 2040 2050
PJ/a 0
40,000
80,000
120,000
160,000
200,000
figure 5.5: global: development of heat demand bysector in the energy [r]evolution scenario(‘EFFICIENCY’ = REDUCTION COMPARED TO THE REFERENCE SCENARIO)
• ‘EFFICIENCY’
• OTHER SECTORS
• INDUSTRY
The energy demand in the industry sector will grow in bothscenarios. While the economic growth rates in the Reference andthe Energy [R]evolution scenario are identical, the growth of theoverall energy demand is different due to a faster increase of theenergy intensity in the alternative case. Decoupling economicgrowth with the energy demand is key to reach a sustainableenergy supply. By 2050, the Energy [R]evolution scenariorequires 40% less than the Reference scenario.
© GP/MARKEL REDONDO
© GP/MARKEL REDONDO
image THE PS20 SOLAR TOWER PLANT SITS AT SANLUCAR LA MAYOR OUTSIDESEVILLE, SPAIN. THE FIRST COMMERCIAL SOLAR TOWER PLANT IN THE WORLD ISOWNED BY THE SPANISH COMPANY SOLUCAR (ABENGOA) AND CAN PROVIDEELECTRICITY FOR UP TO 6,000 HOMES. SOLUCAR (ABENGOA) PLANS TO BUILD ATOTAL OF 9 SOLAR TOWERS OVER THE NEXT 7 YEARS TO PROVIDE ELECTRICITY FORAN ESTIMATED 180,000 HOMES.
image MAINTENANCE WORKERS FIX THE BLADES OF A WINDMILL AT GUAZHOUWIND FARM NEAR YUMEN IN GANSU PROVINCE, CHINA.
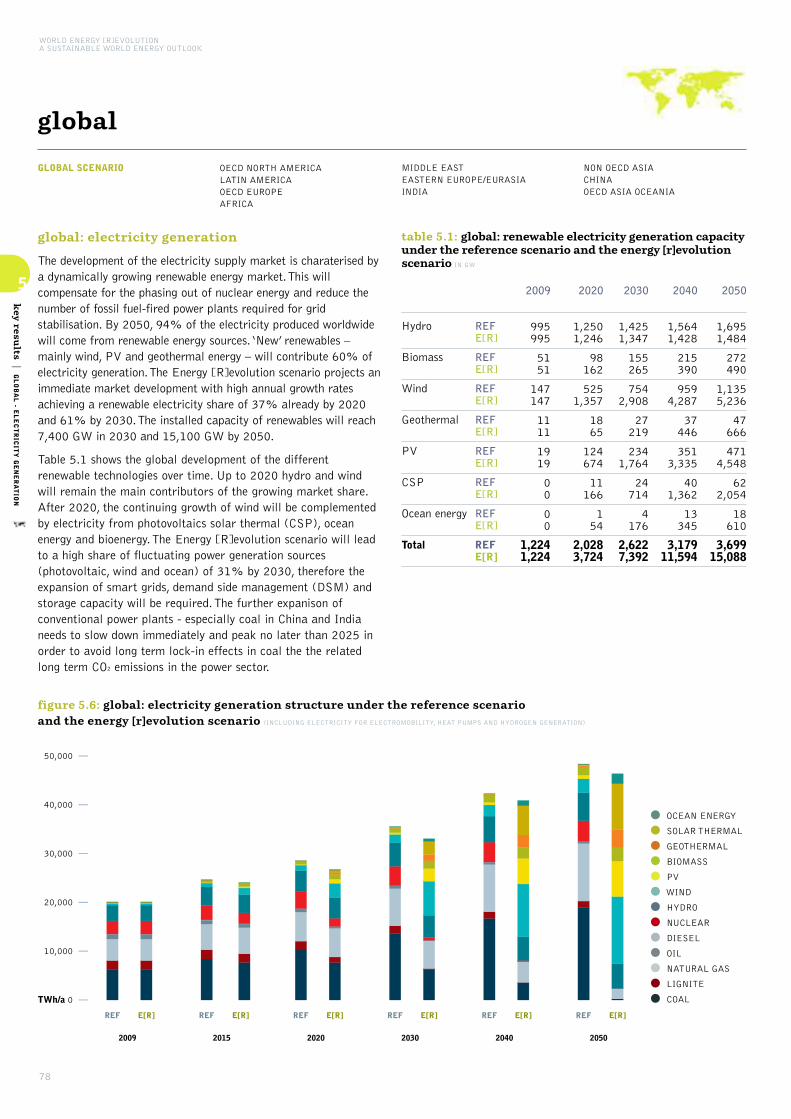
78
5
key resu
lts|GLOBAL - E
LECTRICITY GENERATION
WORLD ENERGY [R]EVOLUTIONA SUSTAINABLE WORLD ENERGY OUTLOOK
GLOBAL SCENARIO OECD NORTH AMERICALATIN AMERICAOECD EUROPE AFRICA
MIDDLE EASTEASTERN EUROPE/EURASIAINDIA
NON OECD ASIACHINAOECD ASIA OCEANIA
global
global: electricity generation
The development of the electricity supply market is charaterised bya dynamically growing renewable energy market. This willcompensate for the phasing out of nuclear energy and reduce thenumber of fossil fuel-fired power plants required for gridstabilisation. By 2050, 94% of the electricity produced worldwidewill come from renewable energy sources. ‘New’ renewables –mainly wind, PV and geothermal energy – will contribute 60% ofelectricity generation. The Energy [R]evolution scenario projects animmediate market development with high annual growth ratesachieving a renewable electricity share of 37% already by 2020and 61% by 2030. The installed capacity of renewables will reach7,400 GW in 2030 and 15,100 GW by 2050.
Table 5.1 shows the global development of the differentrenewable technologies over time. Up to 2020 hydro and windwill remain the main contributors of the growing market share.After 2020, the continuing growth of wind will be complementedby electricity from photovoltaics solar thermal (CSP), oceanenergy and bioenergy. The Energy [R]evolution scenario will leadto a high share of fluctuating power generation sources(photovoltaic, wind and ocean) of 31% by 2030, therefore theexpansion of smart grids, demand side management (DSM) andstorage capacity will be required. The further expanison ofconventional power plants - especially coal in China and Indianeeds to slow down immediately and peak no later than 2025 inorder to avoid long term lock-in effects in coal the the relatedlong term CO2 emissions in the power sector.
table 5.1: global: renewable electricity generation capacityunder the reference scenario and the energy [r]evolutionscenario IN GW
2020
1,2501,246
98162
5251,357
1865
124674
11166
154
2,0283,724
2040
1,5641,428
215390
9594,287
37446
3513,335
401,362
13345
3,17911,594
2050
1,6951,484
272490
1,1355,236
47666
4714,548
622,054
18610
3,69915,088
Hydro
Biomass
Wind
Geothermal
PV
CSP
Ocean energy
Total
REFE[R]
REFE[R]
REFE[R]
REFE[R]
REFE[R]
REFE[R]
REFE[R]
REFE[R]
2030
1,4251,347
155265
7542,908
27219
2341,764
24714
4176
2,6227,392
2009
995995
5151
147147
1111
1919
00
00
1,2241,224
figure 5.6: global: electricity generation structure under the reference scenario and the energy [r]evolution scenario (INCLUDING ELECTRICITY FOR ELECTROMOBILITY, HEAT PUMPS AND HYDROGEN GENERATION)
TWh/a 0
10,000
20,000
30,000
40,000
50,000
REF REF REF REF REF REFE[R] E[R] E[R] E[R] E[R] E[R]
2009 2015 2020 2030 2040 2050
•OCEAN ENERGY
• SOLAR THERMAL
• GEOTHERMAL
• BIOMASS
• PV
•WIND
• HYDRO
• NUCLEAR
• DIESEL
• OIL
• NATURAL GAS
• LIGNITE
• COAL

79
5
key resu
lts|GLOBAL - E
LECTRICITY GENERATION & FUTURE IN
VESTMENTS
global: future costs of electricity generation
Figure 5.7 shows that the introduction of renewable technologiesunder the Energy [R]evolution scenario slightly increases thecosts of electricity generation compared to the Referencescenario. This difference will be less than $ 0.6 cent/kWh up to2020. Any increase in fossil fuel prices beyond the projectiongiven in table 4.3, however, will reduce the gap. Because of thelower CO2 intensity of electricity generation, electricity generationcosts will become economically favourable under the Energy [R]evolution scenario and by 2050 costs will be $ 7.9 cents/kWh below those in the Reference version.
Under the Reference scenario, the unchecked growth in demand,an increase in fossil fuel prices and the cost of CO2 emissionsresult in total electricity supply costs rising from today’s $ 2,364 billion per year to about $ 8,830 billion in 2050. Figure5.7 shows that the Energy [R]evolution scenario not onlycomplies with CO2 reduction targets but also helps to stabiliseenergy costs. Increasing energy efficiency and shifting energysupply to enewables lead to long term costs for electricity supplythat are 22% lower in 2050 than in the Reference scenario(including estimated costs for efficiency measures up to $ 4 ct/kWh).
figure 5.7: global: total electricity supply costs andspecific electricity generation costs under two scenarios
0
1,000
2,000
3,000
4,000
5,000
6,000
7,000
8,000
9,000
10,000
2009 2015 2020 2030 2040 2050
0
2
4
6
8
10
12
14
16
18
ct/kWhBn$/a
SPEC. ELECTRICITY GENERATION COSTS (REF)
SPEC. ELECTRICITY GENERATION COSTS (E[R])
• ‘EFFICIENCY’ MEASURES
• REFERENCE SCENARIO (REF)
• ENERGY [R]EVOLUTION (E[R])
global: future investments in the power sector
The overall global level of investment required in new powerplants up to 2030 will be in the region of $ 11.5 trillion in theReference case and $ 20.1 trillion in the Energy [R]evolution. Amajor driving force for investment in new generation capacity willbe the replacement of the ageing fleet of power plants in OECDcountries and the build up of new power plants in developingcountries. Utilities and new players such as project developersand independent power producers base their technology choiceson current and future equipment costs and national energypolicies, in particular market liberalisation, renewable energy andCO2 reduction targets. Within Europe, the EU emissions tradingscheme could have a major impact on whether the majority ofinvestment goes into fossil fueled power plants or renewableenergy and co-generation. In developing countries, internationalfinancial institutions will play a major role in future technologychoices, as well as whether the investment costs for renewableenergy become competitive with conventional power plants.
In regions with a good wind regime, for example, wind farms canalready produce electricity at the same cost levels as coal or gaspower plants. While solar photovoltaics already reach ‘grid parity’in many industrialized countries. It would require about $ 50,400 billion in investment in the power sector for the Energy [R]evolution scenario to become reality (includinginvestments for replacement after the economic lifetime of theplants) - approximately $ 714 billion annual more than in theReference scenario.
Under the Reference version, the levels of investment inconventional power plants add up to almost 49% whileapproximately 51% would be invested in renewable energy andcogeneration (CHP) until 2050. Under the Energy [R]evolutionscenario the global investment would shift by 95% towardsrenewables and cogeneration. Until 2030, the fossil fuel share ofpower sector investment would be focused mainly on CHP plants.The average annual investment in the power sector under theEnergy [R]evolution scenario between today and 2050 would be $ 1,260 billion.
© GP/ZHIYONG FU
© P. VISHWANATHAN/GP
image 23 YEAR OLD PARMARAM WORKS ON THE REVERSE OSMOSIS PLANT, AT THEMANTHAN CAMPUS IN KOTRI RAJASTHAN, INDIA. PARMARAM IS A DALIT AND HEGOT HIS PRIMARY EDUCATION AT THE NIGHT SCHOOL. AFTER SCHOOL, HEUNDERTOOK TRAINING IN CARPENTRY, FOLLOWED BY TRAINING IN WATER TESTINGAND AS A BAREFOOT SOLAR ENGINEER. HE ASSEMBLES, INSTALLS AND REPAIRSSOLAR LANTERNS AND FIXED SOLAR UNITS FOR VILLAGERS WHO NEED THEM. HEHAS ALSO BEEN OPERATING THE SOLAR-POWERED REVERE OSMOSIS PLANT ATMANTHAN CAMPUS.
image WORKERS AT DAFENG POWER STATION, CHINA’S LARGEST SOLARPHOTOVOLTAIC-WIND HYBRID POWER STATION, WITH 220MW OF GRID-CONNECTEDCAPACITY, OF WHICH 20 MW IS SOLAR PV. LOCATED IN YANCHENG, JIANGSU PROVINCE,IT CAME INTO OPERATION ON DECEMBER 31, 2010 AND HAS 1,100 ANNUAL UTILIZATIONHOURS. EVERY YEAR IT CAN GENERATE 23 MILLION KW-H OF ELECTRICITY, ALLOWINGIT TO SAVE 7,000 TONS OF COAL AND 18,600 TONS OF CARBON DIOXIDE EMISSIONS.
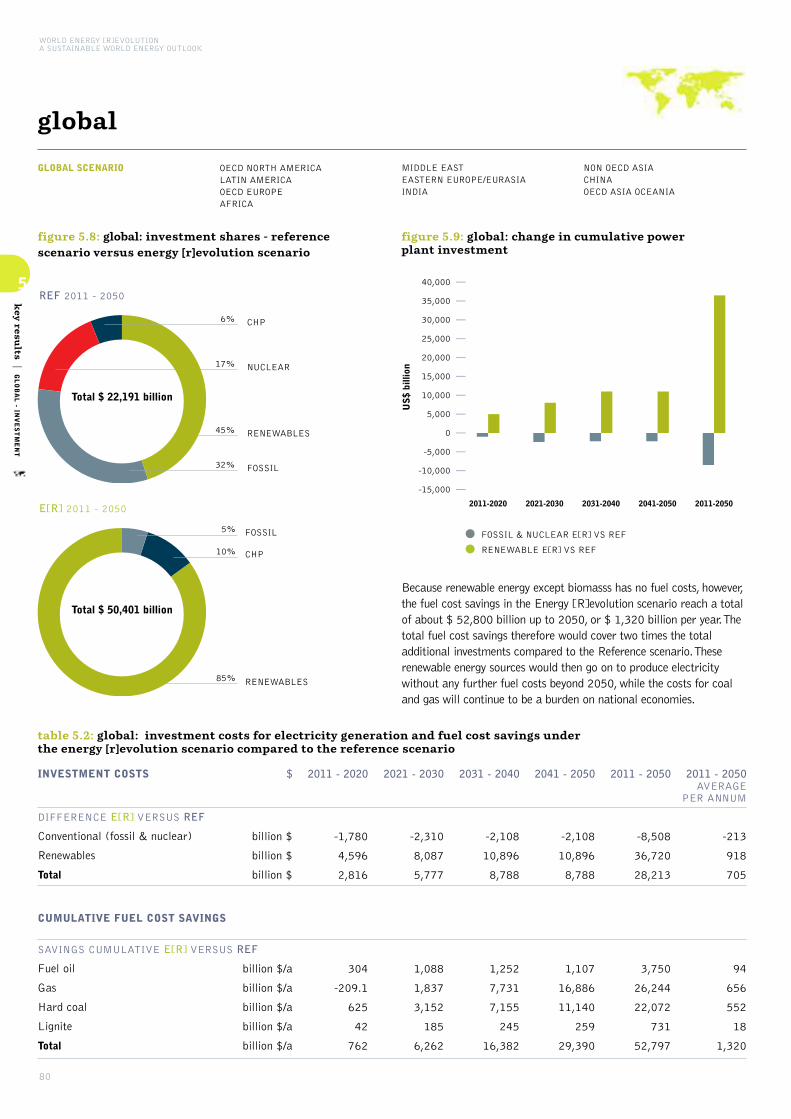
80
5
key resu
lts|GLOBAL - IN
VESTMENT
WORLD ENERGY [R]EVOLUTIONA SUSTAINABLE WORLD ENERGY OUTLOOK
GLOBAL SCENARIO OECD NORTH AMERICALATIN AMERICAOECD EUROPE AFRICA
MIDDLE EASTEASTERN EUROPE/EURASIAINDIA
NON OECD ASIACHINAOECD ASIA OCEANIA
global
Because renewable energy except biomasss has no fuel costs, however,the fuel cost savings in the Energy [R]evolution scenario reach a totalof about $ 52,800 billion up to 2050, or $ 1,320 billion per year. Thetotal fuel cost savings therefore would cover two times the totaladditional investments compared to the Reference scenario. Theserenewable energy sources would then go on to produce electricitywithout any further fuel costs beyond 2050, while the costs for coaland gas will continue to be a burden on national economies.
figure 5.8: global: investment shares - referencescenario versus energy [r]evolution scenario
REF 2011 - 2050
32% FOSSIL
17% NUCLEAR
6% CHP
45% RENEWABLES
Total $ 22,191 billion
E[R] 2011 - 2050
5% FOSSIL
10% CHP
85% RENEWABLES
Total $ 50,401 billion
table 5.2: global: investment costs for electricity generation and fuel cost savings under the energy [r]evolution scenario compared to the reference scenario
INVESTMENT COSTS
DIFFERENCE E[R] VERSUS REF
Conventional (fossil & nuclear)
Renewables
Total
CUMULATIVE FUEL COST SAVINGS
SAVINGS CUMULATIVE E[R] VERSUS REF
Fuel oil
Gas
Hard coal
Lignite
Total
$
billion $
billion $
billion $
billion $/a
billion $/a
billion $/a
billion $/a
billion $/a
2021 - 2030
-2,310
8,087
5,777
1,088
1,837
3,152
185
6,262
2011 - 2020
-1,780
4,596
2,816
304
-209.1
625
42
762
2011 - 2050
-8,508
36,720
28,213
3,750
26,244
22,072
731
52,797
2011 - 2050 AVERAGE
PER ANNUM
-213
918
705
94
656
552
18
1,320
2041 - 2050
-2,108
10,896
8,788
1,107
16,886
11,140
259
29,390
2031 - 2040
-2,108
10,896
8,788
1,252
7,731
7,155
245
16,382
figure 5.9: global: change in cumulative power plant investment
•FOSSIL & NUCLEAR E[R] VS REF
• RENEWABLE E[R] VS REF
2011-2020 2021-2030 2031-2040 2041-2050 2011-2050
-15,000
-10,000
-5,000
0
5,000
10,000
15,000
20,000
25,000
30,000
35,000
40,000
US
$ bi
llion
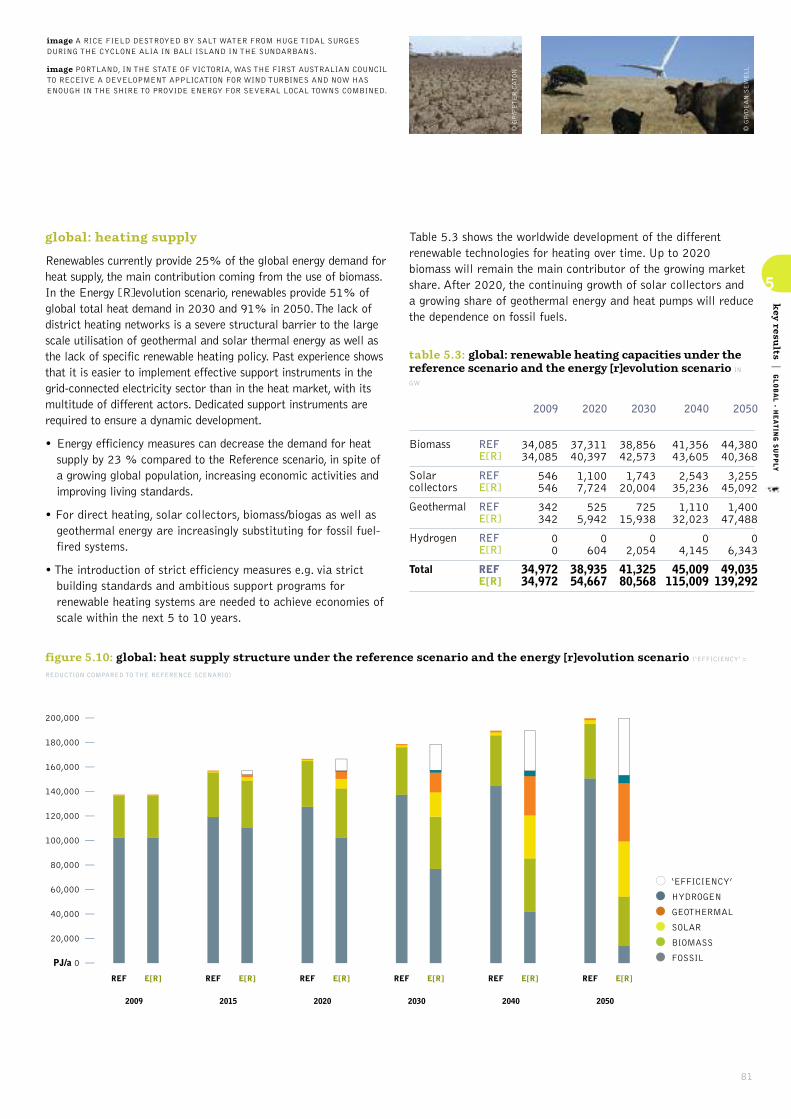
81
5
key resu
lts|GLOBAL - H
EATING SUPPLY
global: heating supply
Renewables currently provide 25% of the global energy demand forheat supply, the main contribution coming from the use of biomass.In the Energy [R]evolution scenario, renewables provide 51% ofglobal total heat demand in 2030 and 91% in 2050. The lack ofdistrict heating networks is a severe structural barrier to the largescale utilisation of geothermal and solar thermal energy as well asthe lack of specific renewable heating policy. Past experience showsthat it is easier to implement effective support instruments in thegrid-connected electricity sector than in the heat market, with itsmultitude of different actors. Dedicated support instruments arerequired to ensure a dynamic development.
• Energy efficiency measures can decrease the demand for heatsupply by 23 % compared to the Reference scenario, in spite ofa growing global population, increasing economic activities andimproving living standards.
• For direct heating, solar collectors, biomass/biogas as well asgeothermal energy are increasingly substituting for fossil fuel-fired systems.
• The introduction of strict efficiency measures e.g. via strictbuilding standards and ambitious support programs forrenewable heating systems are needed to achieve economies ofscale within the next 5 to 10 years.
Table 5.3 shows the worldwide development of the differentrenewable technologies for heating over time. Up to 2020biomass will remain the main contributor of the growing marketshare. After 2020, the continuing growth of solar collectors anda growing share of geothermal energy and heat pumps will reducethe dependence on fossil fuels.
table 5.3: global: renewable heating capacities under thereference scenario and the energy [r]evolution scenario INGW
2020
37,31140,397
1,1007,724
5255,942
0604
38,93554,667
2040
41,35643,605
2,54335,236
1,11032,023
04,145
45,009115,009
2050
44,38040,368
3,25545,092
1,40047,488
06,343
49,035139,292
Biomass
Solarcollectors
Geothermal
Hydrogen
Total
REFE[R]
REFE[R]
REFE[R]
REFE[R]
REFE[R]
2030
38,85642,573
1,74320,004
72515,938
02,054
41,32580,568
2009
34,08534,085
546546
342342
00
34,97234,972
figure 5.10: global: heat supply structure under the reference scenario and the energy [r]evolution scenario (‘EFFICIENCY’ =
REDUCTION COMPARED TO THE REFERENCE SCENARIO)
PJ/a 0
20,000
40,000
60,000
80,000
100,000
120,000
140,000
160,000
180,000
200,000
REF REF REF REF REF REFE[R] E[R] E[R] E[R] E[R] E[R]
2009 2015 2020 2030 2040 2050
•‘EFFICIENCY’
• HYDROGEN
• GEOTHERMAL
• SOLAR
• BIOMASS
• FOSSIL
© GP/PETER CATON
© GP/DEAN SEWELL
image A RICE FIELD DESTROYED BY SALT WATER FROM HUGE TIDAL SURGESDURING THE CYCLONE ALIA IN BALI ISLAND IN THE SUNDARBANS.
image PORTLAND, IN THE STATE OF VICTORIA, WAS THE FIRST AUSTRALIAN COUNCILTO RECEIVE A DEVELOPMENT APPLICATION FOR WIND TURBINES AND NOW HASENOUGH IN THE SHIRE TO PROVIDE ENERGY FOR SEVERAL LOCAL TOWNS COMBINED.

82
5
key resu
lts|GLOBAL - F
UTURE IN
VESTMENTS AND FUTURE EMPLOYMENT
WORLD ENERGY [R]EVOLUTIONA SUSTAINABLE WORLD ENERGY OUTLOOK
GLOBAL SCENARIO OECD NORTH AMERICALATIN AMERICAOECD EUROPE AFRICA
MIDDLE EASTEASTERN EUROPE/EURASIAINDIA
NON OECD ASIACHINAOECD ASIA OCEANIA
global
global: future investments in the heat sector
Also in the heat sector the Energy [R]evolution scenario wouldrequire a major revision of current investment strategies inheating technologies. Especially the not yet so common solar andgeothermal and heat pump technologies need an enormousincrease in installations, if these potentials are to be tapped forthe heat sector. Installed capacity needs to increase by the factorof 60 for solar thermal and even by the factor of 3,000 forgeothermal and heat pumps. Capacity of biomass technologies,which are already rather wide spread still need to remain a mainpillar of heat supply, however current combustion systems mostlyneed to be replaced by new efficient technologies.
Renewable heating technologies are extremely variable, from lowtech biomass stoves and unglazed solar collectors to verysophisticated enhanced geothermal systems and solar themaldistrict heating plants with seasonal storage.Thus it can onlyroughly be calculated, that the Energy [R]evolution scenario intotal requires around $ 27,000 billion to be invested in renewableheating technologies until 2050 (including investments forreplacement after the economic lifetime of the plants) -approximately $ 670 billion per year.
table 5.4: global: renewable heat generation capacitiesunder the reference scenario and the energy [r]evolutionscenario IN GW
2020
12,11512,092
3448
3432,027
87538
12,54815,105
2040
12,54810,387
392,152
7669,089
1682,372
13,52124,000
2050
13,0978,639
523,099
96511,266
2073,399
14,32126,402
Biomass
Geothermal
Solar thermal
Heat pumps
Total
REFE[R]
REFE[R]
REFE[R]
REFE[R]
REFE[R]
2030
12,24211,394
121,086
5335,148
1161,392
12,90219,019
2009
11,75311,753
11
175175
5959
11,98811,988
figure 5.11: global: investments for renewable heat generation technologies under the reference scenario and the energy [r]evolution scenario
REF 2011 - 2050
16% SOLAR
3% GEOTHERMAL
71% BIOMASS
10% HEAT PUMPS
Total $ 4,417 billion
E[R] 2011 - 2050
38% SOLAR
31% HEAT PUMPS
7% BIOMASS
25% GEOTHERMAL
Total $ 26,856 billion
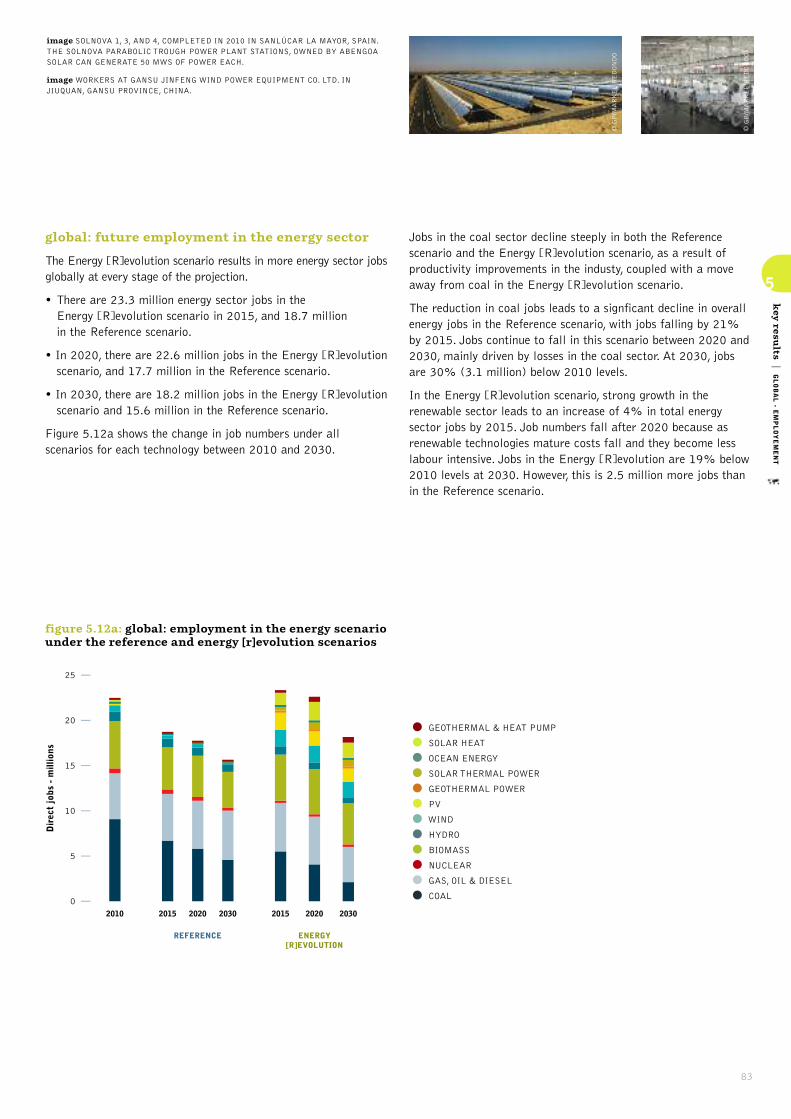
83
5
key resu
lts|GLOBAL - E
MPLOYEMENT
global: future employment in the energy sector
The Energy [R]evolution scenario results in more energy sector jobsglobally at every stage of the projection.
• There are 23.3 million energy sector jobs in the Energy [R]evolution scenario in 2015, and 18.7 million in the Reference scenario.
• In 2020, there are 22.6 million jobs in the Energy [R]evolutionscenario, and 17.7 million in the Reference scenario.
• In 2030, there are 18.2 million jobs in the Energy [R]evolutionscenario and 15.6 million in the Reference scenario.
Figure 5.12a shows the change in job numbers under allscenarios for each technology between 2010 and 2030.
Jobs in the coal sector decline steeply in both the Referencescenario and the Energy [R]evolution scenario, as a result ofproductivity improvements in the industy, coupled with a moveaway from coal in the Energy [R]evolution scenario.
The reduction in coal jobs leads to a signficant decline in overallenergy jobs in the Reference scenario, with jobs falling by 21%by 2015. Jobs continue to fall in this scenario between 2020 and2030, mainly driven by losses in the coal sector. At 2030, jobsare 30% (3.1 million) below 2010 levels.
In the Energy [R]evolution scenario, strong growth in therenewable sector leads to an increase of 4% in total energysector jobs by 2015. Job numbers fall after 2020 because asrenewable technologies mature costs fall and they become lesslabour intensive. Jobs in the Energy [R]evolution are 19% below2010 levels at 2030. However, this is 2.5 million more jobs thanin the Reference scenario.
REFERENCE ENERGY[R]EVOLUTION
2010 2015 2020 2030 2015 2020 2030
0
5
10
15
20
25
Dir
ect
jobs
- m
illio
ns
figure 5.12a: global: employment in the energy scenariounder the reference and energy [r]evolution scenarios
•GEOTHERMAL & HEAT PUMP
• SOLAR HEAT
• OCEAN ENERGY
• SOLAR THERMAL POWER
• GEOTHERMAL POWER
• PV
•WIND
• HYDRO
• BIOMASS
• NUCLEAR
• GAS, OIL & DIESEL
• COAL
© GP/MARKEL REDONDO
© GP/MARKEL REDONDO
image SOLNOVA 1, 3, AND 4, COMPLETED IN 2010 IN SANLÚCAR LA MAYOR, SPAIN.THE SOLNOVA PARABOLIC TROUGH POWER PLANT STATIONS, OWNED BY ABENGOASOLAR CAN GENERATE 50 MWS OF POWER EACH.
image WORKERS AT GANSU JINFENG WIND POWER EQUIPMENT CO. LTD. INJIUQUAN, GANSU PROVINCE, CHINA.
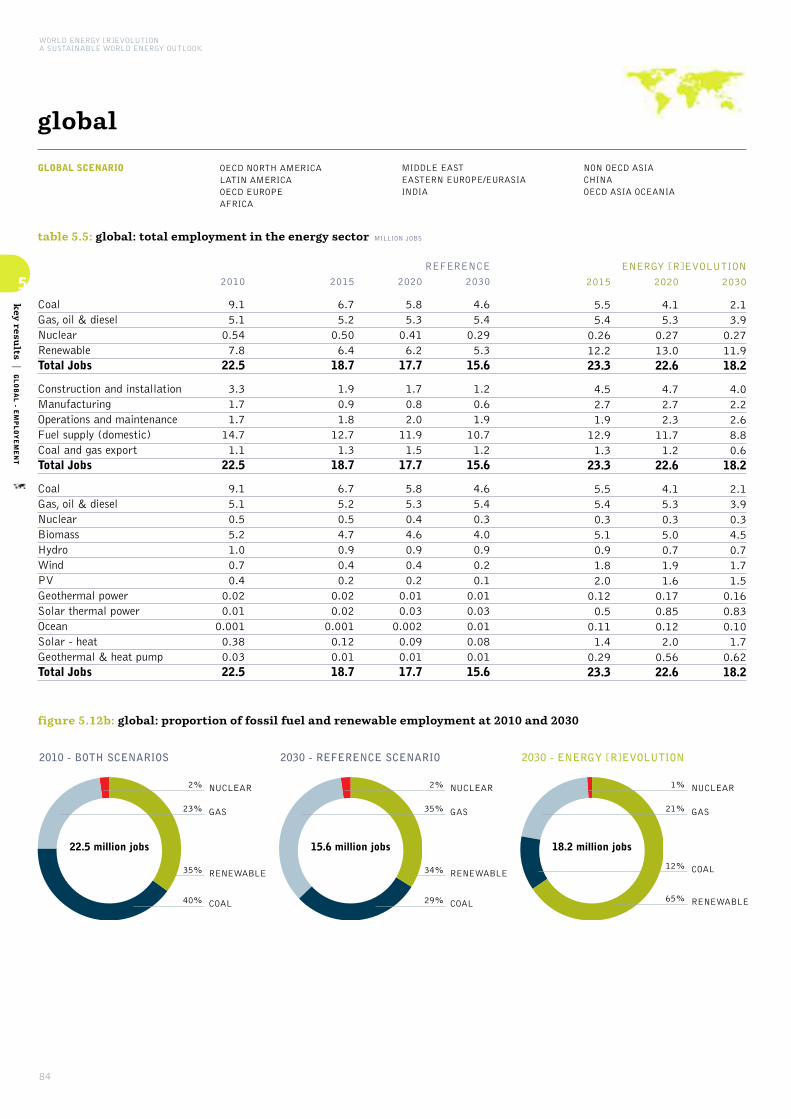
84
5
key resu
lts|GLOBAL - E
MPLOYEMENT
WORLD ENERGY [R]EVOLUTIONA SUSTAINABLE WORLD ENERGY OUTLOOK
GLOBAL SCENARIO OECD NORTH AMERICALATIN AMERICAOECD EUROPE AFRICA
MIDDLE EASTEASTERN EUROPE/EURASIAINDIA
NON OECD ASIACHINAOECD ASIA OCEANIA
global
table 5.5: global: total employment in the energy sector MILLION JOBS
CoalGas, oil & dieselNuclearRenewableTotal Jobs
Construction and installationManufacturingOperations and maintenanceFuel supply (domestic)Coal and gas exportTotal Jobs
CoalGas, oil & dieselNuclearBiomassHydroWindPVGeothermal powerSolar thermal powerOceanSolar - heatGeothermal & heat pumpTotal Jobs
2015
5.55.40.2612.223.3
4.52.71.912.91.323.3
5.55.40.35.10.91.82.00.120.50.111.40.2923.3
2020
4.15.30.2713.022.6
4.72.72.311.71.222.6
4.15.30.35.00.71.91.60.170.850.122.00.5622.6
2030
2.13.90.2711.918.2
4.02.22.68.80.618.2
2.13.90.34.50.71.71.50.160.830.101.70.6218.2
ENERGY [R]EVOLUTION
2015
6.75.20.506.418.7
1.90.91.812.71.318.7
6.75.20.54.70.90.40.20.020.020.0010.120.0118.7
2010
9.15.10.547.822.5
3.31.71.714.71.122.5
9.15.10.55.21.00.70.40.020.010.0010.380.0322.5
2020
5.85.30.416.217.7
1.70.82.011.91.517.7
5.85.30.44.60.90.40.20.010.030.0020.090.0117.7
2030
4.65.40.295.315.6
1.20.61.910.71.215.6
4.65.40.34.00.90.20.10.010.030.010.080.0115.6
REFERENCE
figure 5.12b: global: proportion of fossil fuel and renewable employment at 2010 and 2030
2010 - BOTH SCENARIOS
40% COAL
35% RENEWABLE
23% GAS
2% NUCLEAR
22.5 million jobs
2030 - REFERENCE SCENARIO
29% COAL
34% RENEWABLE
35% GAS
2% NUCLEAR
15.6 million jobs
2030 - ENERGY [R]EVOLUTION
12% COAL
65% RENEWABLE
21% GAS
1% NUCLEAR
18.2 million jobs
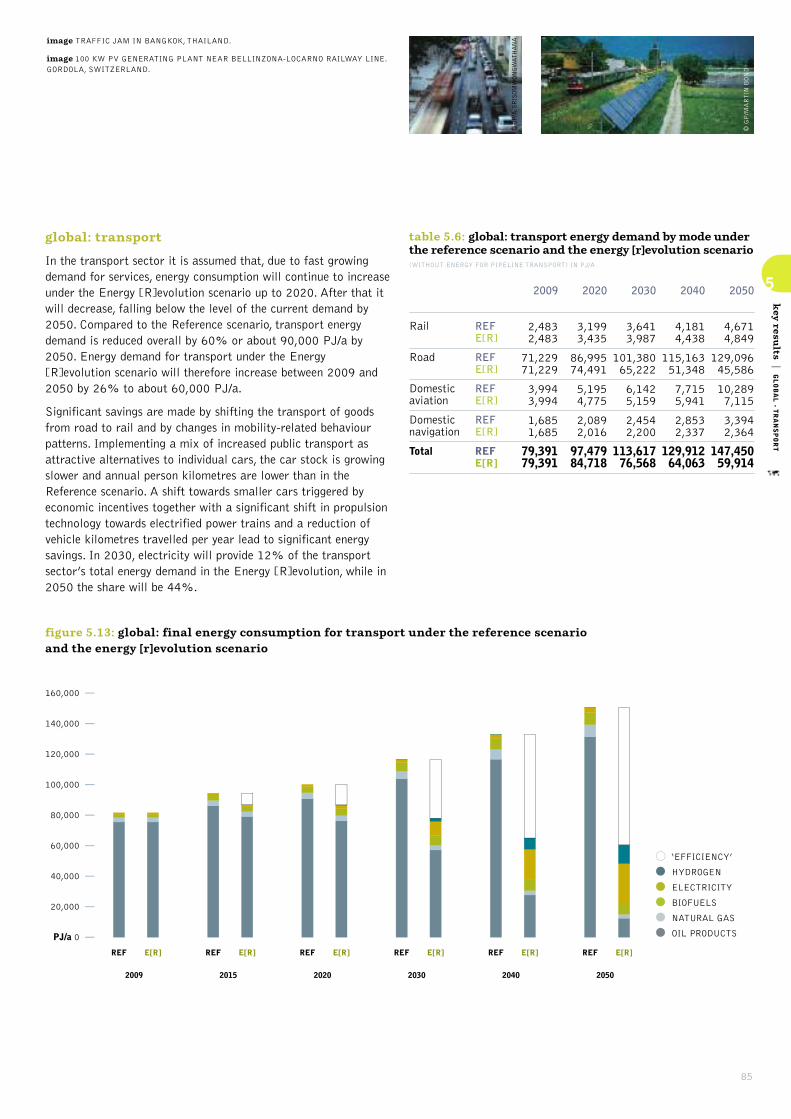
85
5
key resu
lts|GLOBAL - T
RANSPORT
global: transport
In the transport sector it is assumed that, due to fast growingdemand for services, energy consumption will continue to increaseunder the Energy [R]evolution scenario up to 2020. After that itwill decrease, falling below the level of the current demand by2050. Compared to the Reference scenario, transport energydemand is reduced overall by 60% or about 90,000 PJ/a by2050. Energy demand for transport under the Energy[R]evolution scenario will therefore increase between 2009 and2050 by 26% to about 60,000 PJ/a.
Significant savings are made by shifting the transport of goodsfrom road to rail and by changes in mobility-related behaviourpatterns. Implementing a mix of increased public transport asattractive alternatives to individual cars, the car stock is growingslower and annual person kilometres are lower than in theReference scenario. A shift towards smaller cars triggered byeconomic incentives together with a significant shift in propulsiontechnology towards electrified power trains and a reduction ofvehicle kilometres travelled per year lead to significant energysavings. In 2030, electricity will provide 12% of the transportsector’s total energy demand in the Energy [R]evolution, while in2050 the share will be 44%.
table 5.6: global: transport energy demand by mode underthe reference scenario and the energy [r]evolution scenario(WITHOUT ENERGY FOR PIPELINE TRANSPORT) IN PJ/A
2020
3,1993,435
86,99574,491
5,1954,775
2,0892,016
97,47984,718
2040
4,1814,438
115,16351,348
7,7155,941
2,8532,337
129,91264,063
2050
4,6714,849
129,09645,586
10,2897,115
3,3942,364
147,45059,914
Rail
Road
Domesticaviation
Domesticnavigation
Total
REFE[R]
REFE[R]
REFE[R]
REFE[R]
REFE[R]
2030
3,6413,987
101,38065,222
6,1425,159
2,4542,200
113,61776,568
2009
2,4832,483
71,22971,229
3,9943,994
1,6851,685
79,39179,391
figure 5.13: global: final energy consumption for transport under the reference scenario and the energy [r]evolution scenario
PJ/a 0
20,000
40,000
60,000
80,000
100,000
120,000
140,000
160,000
REF REF REF REF REF REFE[R] E[R] E[R] E[R] E[R] E[R]
2009 2015 2020 2030 2040 2050
•‘EFFICIENCY’
• HYDROGEN
• ELECTRICITY
• BIOFUELS
• NATURAL GAS
• OIL PRODUCTS
© GP/A. SRISOM
WONGWATHANA
© GP/MARTIN BOND
image TRAFFIC JAM IN BANGKOK, THAILAND.
image 100 KW PV GENERATING PLANT NEAR BELLINZONA-LOCARNO RAILWAY LINE.GORDOLA, SWITZERLAND.

86
5
key resu
lts|GLOBAL - P
RIM
ARY ENERGY CONSUMPTION
WORLD ENERGY [R]EVOLUTIONA SUSTAINABLE WORLD ENERGY OUTLOOK
GLOBAL SCENARIO OECD NORTH AMERICALATIN AMERICAOECD EUROPE AFRICA
MIDDLE EASTEASTERN EUROPE/EURASIAINDIA
NON OECD ASIACHINAOECD ASIA OCEANIA
global
global: primary energy consumption
Taking into account the assumptions discussed above, the resultingprimary energy consumption under the Energy [R]evolution scenario isshown in Figure 5.14. Compared to the Reference scenario, overallprimary energy demand will be reduced by 40% in 2050.
The Energy [R]evolution scenario would even achieve a renewableenergy share of 41% by 2030 and 82% by 2050. In this projectionalmost the entire global electricity supply, including the majority ofthe energy used in buildings and industry, would come fromrenewable energy sources. The transport sector, in particular aviationand shipping, would be the last sector to become fossil fuel free.
figure 5.14: global: primary energy consumption under the reference scenario and the energy [r]evolution scenario (‘EFFICIENCY’ = REDUCTION COMPARED TO THE REFERENCE SCENARIO)
PJ/a 0
200,000
100,000
400,000
300,000
600,000
500,000
800,000
700,000
REF REF REF REF REF REFE[R] E[R] E[R] E[R] E[R] E[R]
2009 2015 2020 2030 2040 2050
•‘EFFICIENCY’
• OCEAN ENERGY
• GEOTHERMAL
• SOLAR
• BIOMASS
•WIND
• HYDRO
• NATURAL GAS
• OIL
• COAL
• NUCLEAR

87
5
key resu
lts|GLOBAL - C
O2EMISSIONS
global: development of CO2 emissions
Whilst worldwide CO2 emissions will increase by 62% in theReference scenario, under the Energy [R]evolution scenario theywill decrease from 27,925 million tonnes in 2009 to 3,076 million tonnes in 2050 (excluding international bunkers).Annual per capita emissions will drop from 4.1 tonnes to 2.4tonnes in 2030 and 0.3 tonne in 2050. In spite of the phasingout of nuclear energy and increasing demand, CO2 emissions willdecrease in the electricity sector. In the long run efficiency gainsand the increased use of renewable electricity in vehicles willeven reduce emissions in the transport sector. With a share of23% of CO2 emissions in 2050, the power sector will drop belowtransport as the largest source of emissions. By 2050, global CO2
emissions are 15% of 1990 levels.
global: energy related CO2 emissions from bio energy
The Energy [R]evolution scenario is an energy scenario, thereforeonly direct energy related CO2 emissions of combustion processesare calculated and presented. Greenpeace estimates that alsosustainable bio energy may result in indirect CO2 emissions in therange of 10% to 40% of the replaced fossil fuels, leading toadditional CO2 emissions between 358 and 1,432 million tonnesby 2050 (see also Bio Energy disclaimer in Chapter 8).
figure 5.16: global: development of CO2 emissions by sector under the energy [r]evolution scenario(‘EFFICIENCY’ = REDUCTION COMPARED TO THE REFERENCE SCENARIO)
REF REF REF REF REF REFE[R] E[R] E[R] E[R] E[R] E[R]
2009 2015 2020 2030 2040 2050
0
10,000
20,000
30,000
40,000
50,000
0
1,000
2,000
3,000
4,000
5,000
6,000
7,000
8,000
9,000
Mill t/aMillion people
POPULATION DEVELOPMENT
• SAVINGS FROM ‘EFFICIENCY’ & RENEWABLES
• OTHER SECTORS
• INDUSTRY
•TRANSPORT
• POWER GENERATION
figure 5.15: global: regional breakdown of CO2 emissions in the energy [r]evolution in 2050
5% OECD ASIA OCEANIA
12% AFRICA
6% OECD EUROPE5% LATIN AMERICA
14% INDIA
8% EASTERN EUROPE/EURASIA
9% NON OECD ASIA
6% MIDDLE EAST28% CHINA
7% OECD NORTH AMERICA
figure 5.17: global: CO2 emissions by sector in the energy [r]evolution in 2050
10% OTHER SECTORS
21% INDUSTRY
21% POWER GENERATION
7% OTHER CONVERSION
12% INTERNATIONAL BUNKERS
29% TRANSPORT
© LES STONE/GP
© GP/EX-PRESS/M. FORTE
image COWS FROM A FARM WITH A BIOGAS PLANT IN ITTIGEN BERN,SWITZERLAND. THE FARMER PETER WYSS PRODUCES ON HIS FARM WITH A BIOGASPLANT, GREEN ELECTRICITY WITH DUNG FROM COWS, LIQUID MANURE AND WASTEFROM FOOD PRODUCTION.
image SMOKE BILLOWING FROM THE CHIMNEY AT THE MARSHALL STEAM STATIONIN CATAWBA COUNTY, NORTH CAROLINA. THIS COAL-FIRED POWER STATION HAS A2,090-MEGAWATT GENERATING CAPACITY AND EMITS 14.5 MILLION TONS OFCARBON DIOXIDE ANNUALLY.
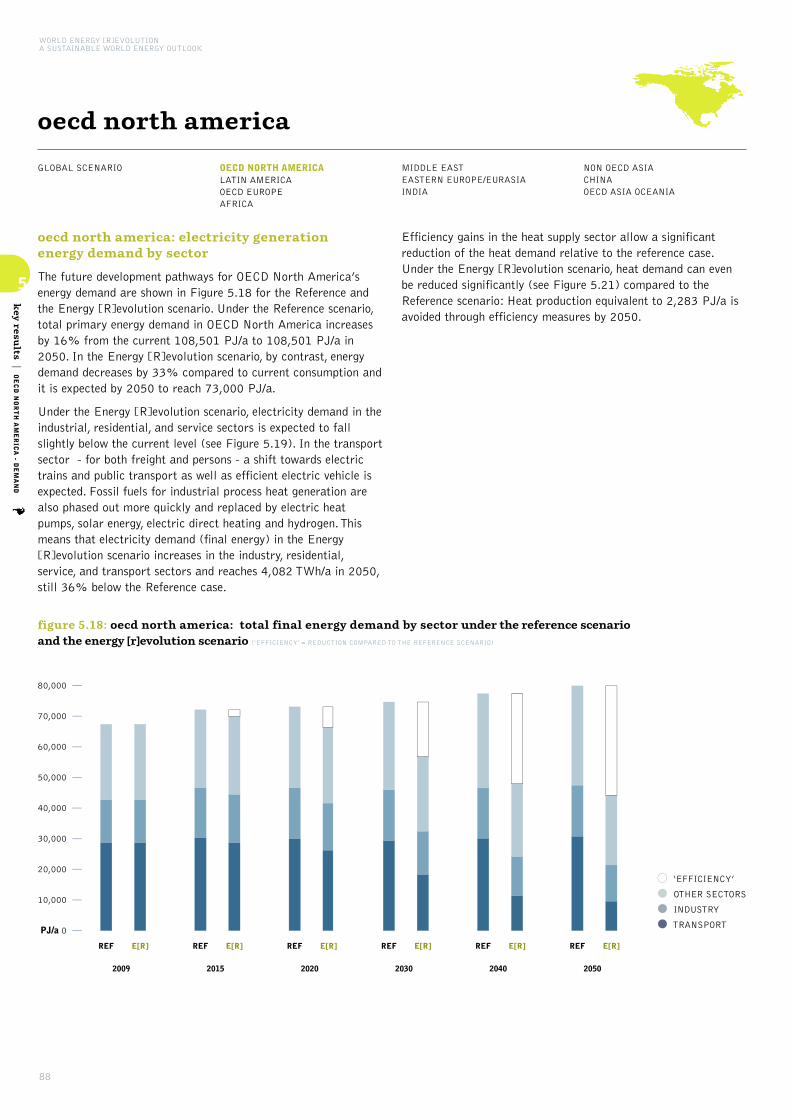
88
5
key resu
lts|OECD NORTH AMERICA - D
EMAND
WORLD ENERGY [R]EVOLUTIONA SUSTAINABLE WORLD ENERGY OUTLOOK
GLOBAL SCENARIO OECD NORTH AMERICALATIN AMERICAOECD EUROPE AFRICA
MIDDLE EASTEASTERN EUROPE/EURASIAINDIA
NON OECD ASIACHINAOECD ASIA OCEANIA
oecd north america
oecd north america: electricity generation energy demand by sector
The future development pathways for OECD North America’senergy demand are shown in Figure 5.18 for the Reference andthe Energy [R]evolution scenario. Under the Reference scenario,total primary energy demand in OECD North America increasesby 16% from the current 108,501 PJ/a to 108,501 PJ/a in2050. In the Energy [R]evolution scenario, by contrast, energydemand decreases by 33% compared to current consumption andit is expected by 2050 to reach 73,000 PJ/a.
Under the Energy [R]evolution scenario, electricity demand in theindustrial, residential, and service sectors is expected to fallslightly below the current level (see Figure 5.19). In the transportsector - for both freight and persons - a shift towards electrictrains and public transport as well as efficient electric vehicle isexpected. Fossil fuels for industrial process heat generation arealso phased out more quickly and replaced by electric heatpumps, solar energy, electric direct heating and hydrogen. Thismeans that electricity demand (final energy) in the Energy[R]evolution scenario increases in the industry, residential,service, and transport sectors and reaches 4,082 TWh/a in 2050,still 36% below the Reference case.
Efficiency gains in the heat supply sector allow a significantreduction of the heat demand relative to the reference case.Under the Energy [R]evolution scenario, heat demand can evenbe reduced significantly (see Figure 5.21) compared to theReference scenario: Heat production equivalent to 2,283 PJ/a isavoided through efficiency measures by 2050.
figure 5.18: oecd north america: total final energy demand by sector under the reference scenario and the energy [r]evolution scenario (‘EFFICIENCY’ = REDUCTION COMPARED TO THE REFERENCE SCENARIO)
• ‘EFFICIENCY’
• OTHER SECTORS
• INDUSTRY
•TRANSPORTPJ/a 0
10,000
20,000
30,000
40,000
50,000
60,000
70,000
80,000
REF REF REF REF REF REFE[R] E[R] E[R] E[R] E[R] E[R]
2009 2015 2020 2030 2040 2050

89
5
key resu
lts|OECD NORTH AMERICA - D
EMAND
figure 5.19: oecd north america: development of electricity demand by sector in the energy [r]evolution scenario(‘EFFICIENCY’ = REDUCTION COMPARED TO THE REFERENCE SCENARIO)
• ‘EFFICIENCY’
• OTHER SECTORS
• INDUSTRY
•TRANSPORT
E[R] E[R] E[R] E[R] E[R] E[R]
2009 2015 2020 2030 2040 2050
PJ/a 0
5,000
10,000
15,000
20,000
25,000
30,000
35,000
figure 5.20: oecd north america: development of the transport demand by sector in the energy [r]evolution scenario
•‘EFFICIENCY’
• DOMESTIC NAVIGATION
• RAIL
• DOMESTIC AVIATION
• ROAD
E[R] E[R] E[R] E[R] E[R] E[R]
2009 2015 2020 2030 2040 2050
PJ/a 0
5,000
10,000
15,000
20,000
25,000
E[R] E[R] E[R] E[R] E[R] E[R]
2009 2015 2020 2030 2040 2050
PJ/a 0
5,000
10,000
15,000
20,000
25,000
30,000
figure 5.21: oecd north america: development of heatdemand by sector in the energy [r]evolution scenario(‘EFFICIENCY’ = REDUCTION COMPARED TO THE REFERENCE SCENARIO)
• ‘EFFICIENCY’
• OTHER SECTORS
• INDUSTRY
In the transport sector, it is assumed under the Energy[R]evolution scenario that energy demand will decrease by 67%to 9,554 PJ/a by 2050, saving 69% compared to the Referencescenario. The Energy [R]evolution scenario factors in a fasterdecrease of the final energy demand for transport. This can beachieved through a mix of increased public transport, reducedannual person kilometres and wider use of more efficient enginesand electric drives. Consequently, electricity demand in thetransport sector increases, the final energy use of fossil fuels fallsto 1,451 PJ/a, compared to 27,203 PJ/a in the Reference case.
© JAMES PEREZ/GP
© JAMES PEREZ/GP
image CONTROL ROOM OF LUZ SOLAR POWER PLANT, CALIFORNIA, USA.
image LUZ INTERNATIONAL SOLAR POWER PLANT, CALIFORNIA, USA.

90
5
key resu
lts|OECD NORTH AMERICA - E
LECTRICITY GENERATION
WORLD ENERGY [R]EVOLUTIONA SUSTAINABLE WORLD ENERGY OUTLOOK
GLOBAL SCENARIO OECD NORTH AMERICALATIN AMERICAOECD EUROPE AFRICA
MIDDLE EASTEASTERN EUROPE/EURASIAINDIA
NON OECD ASIACHINAOECD ASIA OCEANIA
oecd north america
oecd north america: electricity generation
The development of the electricity supply market is charaterisedby a dynamically growing renewable energy market and anincreasing share of renewable electricity. This will compensate forthe phasing out of nuclear energy and reduce the number of fossilfuel-fired power plants required for grid stabilisation. By 2050,97% of the electricity produced in OECD North America willcome from renewable energy sources. ‘New’ renewables – mainlywind, solar thermal energy and PV – will contribute 84% ofelectricity generation. The Energy [R]evolution scenario projectsan immediate market development with higher annual growthrates achieving a renewable electricity share of 42% by 2020and 75% by 2030. The installed capacity of renewables willreach 1,721 GW in 2030 and 2,780 GW by 2050.
Table 5.7 shows the comparative evolution of the differentrenewable technologies in OECD North America over time. Up to2020 hydro and wind will remain the main contributors of thegrowing market share. After 2020, the continuing growth of windwill be complemented by elelctricty mainly from photovoltaics,solar thermal (CSP), and geothermal energy. The Energy[R]evolution scenario will lead to a high share of fluctuatingpower generation source (photovoltaic, wind and ocean) of 43%by 2030, therefore the expansion of smart grids, demand sidemanagement (DSM) and storage capacity from the increasedshare of electric vehicles will be used for a better grid integrationand power generation management.
table 5.7: oecd north america: renewable electricitygeneration capacity under the reference scenario and the energy [r]evolution scenario IN GW
2020
197217
2320
109386
623
22132
346
020
361843
2040
208224
4934
192961
1093
51552
12467
189
5232,420
2050
214224
5940
2411,011
12107
55639
22651
2108
6062,780
Hydro
Biomass
Wind
Geothermal
PV
CSP
Ocean energy
Total
REFE[R]
REFE[R]
REFE[R]
REFE[R]
REFE[R]
REFE[R]
REFE[R]
REFE[R]
2030
204224
3626
150759
959
39384
7218
151
4451,721
2009
187187
1515
3939
44
22
00
00
247247
figure 5.22: oecd north america: electricity generation structure under the reference scenario and the energy [r]evolution scenario (INCLUDING ELECTRICITY FOR ELECTROMOBILITY, HEAT PUMPS AND HYDROGEN GENERATION)
REF REF REF REF REF REFE[R] E[R] E[R] E[R] E[R] E[R]
2009 2015 2020 2030 2040 2050
TWh/a 0
1,000
2,000
3,000
4,000
5,000
6,000
7,000
8,000
•OCEAN ENERGY
• SOLAR THERMAL
• GEOTHERMAL
• BIOMASS
• PV
•WIND
• HYDRO
• NUCLEAR
• DIESEL
• OIL
• NATURAL GAS
• LIGNITE
• COAL
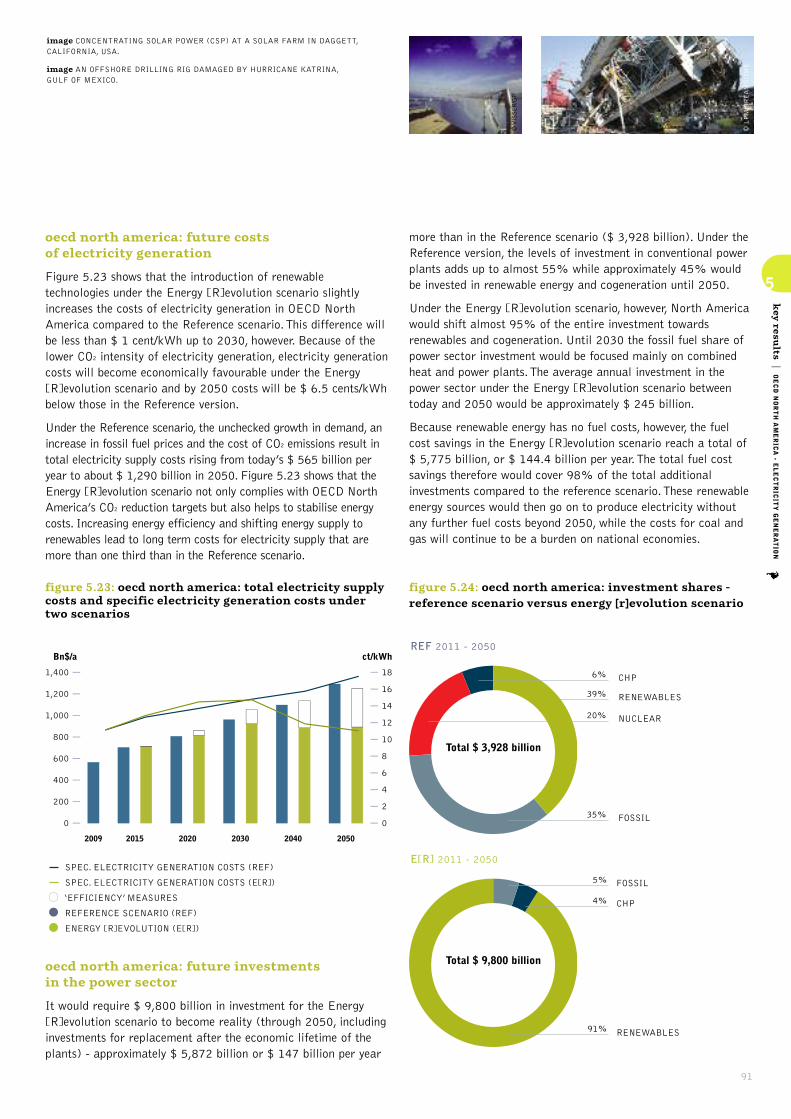
91
5
key resu
lts|OECD NORTH AMERICA - E
LECTRICITY GENERATION
oecd north america: future costs of electricity generation
Figure 5.23 shows that the introduction of renewabletechnologies under the Energy [R]evolution scenario slightlyincreases the costs of electricity generation in OECD NorthAmerica compared to the Reference scenario. This difference willbe less than $ 1 cent/kWh up to 2030, however. Because of thelower CO2 intensity of electricity generation, electricity generationcosts will become economically favourable under the Energy[R]evolution scenario and by 2050 costs will be $ 6.5 cents/kWhbelow those in the Reference version.
Under the Reference scenario, the unchecked growth in demand, anincrease in fossil fuel prices and the cost of CO2 emissions result intotal electricity supply costs rising from today’s $ 565 billion peryear to about $ 1,290 billion in 2050. Figure 5.23 shows that theEnergy [R]evolution scenario not only complies with OECD NorthAmerica’s CO2 reduction targets but also helps to stabilise energycosts. Increasing energy efficiency and shifting energy supply torenewables lead to long term costs for electricity supply that aremore than one third than in the Reference scenario.
figure 5.23: oecd north america: total electricity supplycosts and specific electricity generation costs under two scenarios
0
200
400
600
800
1,000
1,200
1,400
2009 2015 2020 2030 2040 2050
0
2
4
6
8
10
12
14
16
18
ct/kWhBn$/a
SPEC. ELECTRICITY GENERATION COSTS (REF)
SPEC. ELECTRICITY GENERATION COSTS (E[R])
• ‘EFFICIENCY’ MEASURES
• REFERENCE SCENARIO (REF)
• ENERGY [R]EVOLUTION (E[R])
oecd north america: future investments in the power sector
It would require $ 9,800 billion in investment for the Energy[R]evolution scenario to become reality (through 2050, includinginvestments for replacement after the economic lifetime of theplants) - approximately $ 5,872 billion or $ 147 billion per year
more than in the Reference scenario ($ 3,928 billion). Under theReference version, the levels of investment in conventional powerplants adds up to almost 55% while approximately 45% wouldbe invested in renewable energy and cogeneration until 2050.
Under the Energy [R]evolution scenario, however, North Americawould shift almost 95% of the entire investment towardsrenewables and cogeneration. Until 2030 the fossil fuel share ofpower sector investment would be focused mainly on combinedheat and power plants. The average annual investment in thepower sector under the Energy [R]evolution scenario betweentoday and 2050 would be approximately $ 245 billion.
Because renewable energy has no fuel costs, however, the fuelcost savings in the Energy [R]evolution scenario reach a total of$ 5,775 billion, or $ 144.4 billion per year. The total fuel costsavings therefore would cover 98% of the total additionalinvestments compared to the reference scenario. These renewableenergy sources would then go on to produce electricity withoutany further fuel costs beyond 2050, while the costs for coal andgas will continue to be a burden on national economies.
figure 5.24: oecd north america: investment shares -reference scenario versus energy [r]evolution scenario
REF 2011 - 2050
35% FOSSIL
20% NUCLEAR
6% CHP
39% RENEWABLES
Total $ 3,928 billion
E[R] 2011 - 2050
5% FOSSIL
4% CHP
91% RENEWABLES
Total $ 9,800 billion
© VISSER/GP
© LPM/DREAMSTIME
image CONCENTRATING SOLAR POWER (CSP) AT A SOLAR FARM IN DAGGETT,CALIFORNIA, USA.
image AN OFFSHORE DRILLING RIG DAMAGED BY HURRICANE KATRINA, GULF OF MEXICO.
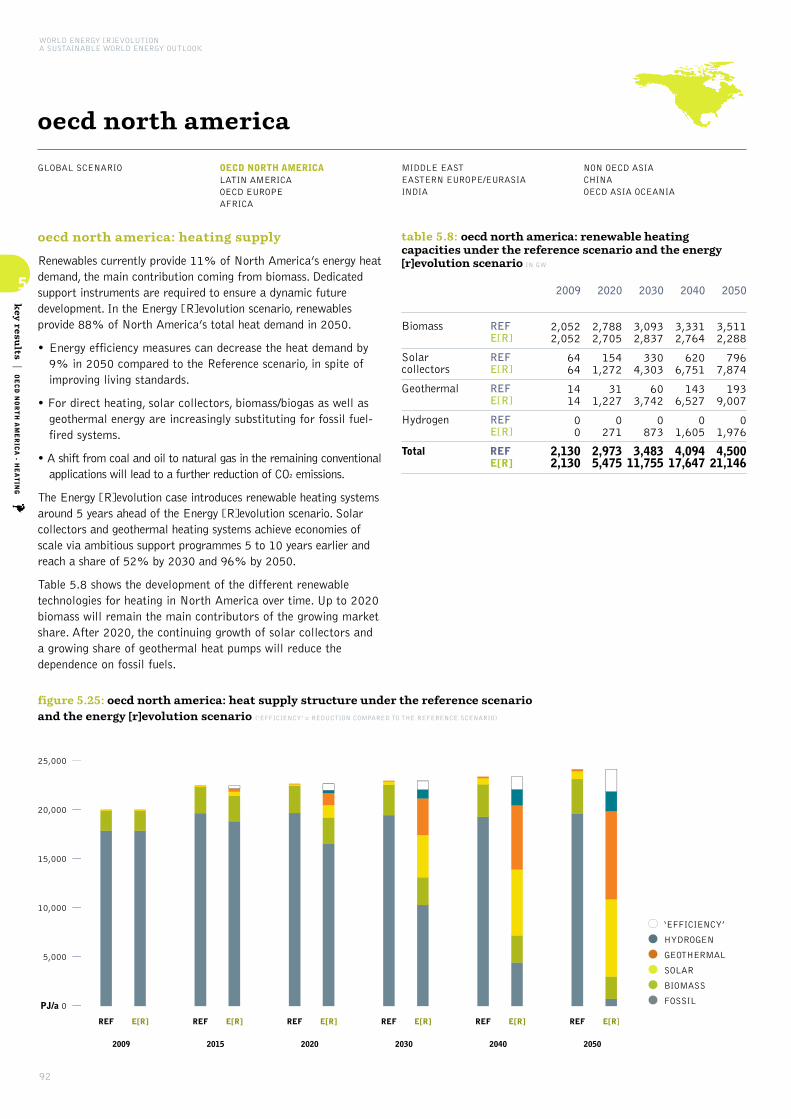
92
5
key resu
lts|OECD NORTH AMERICA - H
EATING
WORLD ENERGY [R]EVOLUTIONA SUSTAINABLE WORLD ENERGY OUTLOOK
GLOBAL SCENARIO OECD NORTH AMERICALATIN AMERICAOECD EUROPE AFRICA
MIDDLE EASTEASTERN EUROPE/EURASIAINDIA
NON OECD ASIACHINAOECD ASIA OCEANIA
oecd north america
oecd north america: heating supply
Renewables currently provide 11% of North America’s energy heatdemand, the main contribution coming from biomass. Dedicatedsupport instruments are required to ensure a dynamic futuredevelopment. In the Energy [R]evolution scenario, renewablesprovide 88% of North America’s total heat demand in 2050.
• Energy efficiency measures can decrease the heat demand by9% in 2050 compared to the Reference scenario, in spite ofimproving living standards.
• For direct heating, solar collectors, biomass/biogas as well asgeothermal energy are increasingly substituting for fossil fuel-fired systems.
• A shift from coal and oil to natural gas in the remaining conventionalapplications will lead to a further reduction of CO2 emissions.
The Energy [R]evolution case introduces renewable heating systemsaround 5 years ahead of the Energy [R]evolution scenario. Solarcollectors and geothermal heating systems achieve economies ofscale via ambitious support programmes 5 to 10 years earlier andreach a share of 52% by 2030 and 96% by 2050.
Table 5.8 shows the development of the different renewabletechnologies for heating in North America over time. Up to 2020biomass will remain the main contributors of the growing marketshare. After 2020, the continuing growth of solar collectors anda growing share of geothermal heat pumps will reduce thedependence on fossil fuels.
table 5.8: oecd north america: renewable heatingcapacities under the reference scenario and the energy[r]evolution scenario IN GW
2020
2,7882,705
1541,272
311,227
0271
2,9735,475
2040
3,3312,764
6206,751
1436,527
01,605
4,09417,647
2050
3,5112,288
7967,874
1939,007
01,976
4,50021,146
Biomass
Solarcollectors
Geothermal
Hydrogen
Total
REFE[R]
REFE[R]
REFE[R]
REFE[R]
REFE[R]
2030
3,0932,837
3304,303
603,742
0873
3,48311,755
2009
2,0522,052
6464
1414
00
2,1302,130
figure 5.25: oecd north america: heat supply structure under the reference scenario and the energy [r]evolution scenario (‘EFFICIENCY’ = REDUCTION COMPARED TO THE REFERENCE SCENARIO)
REF REF REF REF REF REFE[R] E[R] E[R] E[R] E[R] E[R]
2009 2015 2020 2030 2040 2050
PJ/a 0
5,000
10,000
15,000
20,000
25,000
•‘EFFICIENCY’
• HYDROGEN
• GEOTHERMAL
• SOLAR
• BIOMASS
• FOSSIL

93
5
key resu
lts|OECD NORTH AMERICA - IN
VESTMENT
oecd north america: future investments in the heat sector
Also in the heat sector the Energy [R]evolution scenario wouldrequire a major revision of current investment strategies inheating technologies. Especially the not yet so common solar andgeothermal and heat pump technologies need enourmous increasein installations, if these potentials are to be tapped for the heatsector. Installed capacity needs to increase from today 19 GW tomore than 2000 GW for solar thermal and from 2 GW to morethan 1400 GW for geothermal and heat pumps. Capacity ofbiomass technologies, which are already rather wide spread willdecrease by more than 50% due to the limited availability ofsustainable biomass.
Renewable heating technologies are extremely variable, from lowtech biomass stoves and unglazed solar collectors to verysophisticated enhanced geothermal systems and solar thermaldistrict heating plants with seasonal storage. Thus it can onlyroughly be calculated, that the Energy [R]evolution scenario intotal requires around $ 6,300 billion to be invested in renewableheating technologies until 2050 (including investments forreplacement after the economic lifetime of the plants) -approximately $ 160 billion per year.”
table 5.9: oecd north america: renewable heat generationcapacities under the reference scenario and the energy [r]evolution scenario IN GW
2020
374337
185
45329
3140
424891
2040
465250
36448
1821,709
7666
6893,073
2050
496149
49505
2322,016
9916
7863,586
Biomass
Geothermal
Solar thermal
Heat pumps
Total
REFE[R]
REFE[R]
REFE[R]
REFE[R]
REFE[R]
2030
422297
9271
971,088
4407
5332,063
2009
310310
00
1919
22
331331
figure 5.26: oecd north america: investments for renewable heat generation technologies under the reference scenario and the energy [r]evolution scenario
REF 2011 - 2050
33% SOLAR
14% GEOTHERMAL
51% BIOMASS
2% HEAT PUMPS
Total $ 866 billion
E[R] 2011 - 2050
43% SOLAR
37% HEAT PUMPS
2% BIOMASS
18% GEOTHERMAL
Total $ 6,300 billion
© VISSER/GP
© GP/EM
image AN OPEN-PIT MINE IN FRONT OF SYNCRUDES MILDRED LAKE FACILITY ATTHE ALBERTA TAR SANDS. CANADA’S TAR SANDS ARE AN OIL RESERVE THE SIZE OFENGLAND. EXTRACTING THE CRUDE OIL CALLED BITUMEN FROM UNDERNEATHUNSPOILED WILDERNESS REQUIRES A MASSIVE INDUSTRIALIZED EFFORT WITHFAR-REACHING IMPACTS ON THE LAND, AIR, WATER, AND CLIMATE.
image CONCENTRATING SOLAR POWER (CSP) AT A SOLAR FARM IN DAGGETT,CALIFORNIA, USA.

94
5
key resu
lts|OECD NORTH AMERICA - E
MPLOYMENT
WORLD ENERGY [R]EVOLUTIONA SUSTAINABLE WORLD ENERGY OUTLOOK
GLOBAL SCENARIO OECD NORTH AMERICALATIN AMERICAOECD EUROPE AFRICA
MIDDLE EASTEASTERN EUROPE/EURASIAINDIA
NON OECD ASIACHINAOECD ASIA OCEANIA
oecd north america
oecd north america: future employment in the energy sector
The Energy [R]evolution scenario results in more energy sectorjobs in the OECD Americas at every stage of the projection.
• There are 2 million energy sector jobs in the Energy [R]evolutionscenario in 2015, and 1.4 million in the Reference scenario.
• In 2020, there are 2.1 million jobs in the Energy [R]evolutionscenario, and 1.4 million in the Reference scenario.
• In 2030, there are 1.8 million jobs in the Energy [R]evolutionscenario and 1.4 million in the Reference scenario.
Figure 5.27 shows the change in job numbers under bothscenarios for each technology between 2010 and 2030. Jobs inthe coal sector decline in both scenarios, leading to a smalldecline in overall energy jobs in the Reference scenario.
Strong growth in the renewable sector leads to an increase of 44%in total energy sector jobs in the [R]evolution scenario by 2015. At 2030, jobs are 29% above 2010 levels. Renewable energyaccounts for 67% of energy jobs by 2030, with the majorityspread evenly over wind, solar PV, solar heating, and biomass.
REFERENCE ENERGY[R]EVOLUTION
2010 2015 2020 2030 2015 2020 2030
0
0.5
1.0
1.5
2.0
2.5
Dir
ect
jobs
- m
illio
ns
figure 5.27: oecd north america: employment in the energy scenario under the reference and energy [r]evolution scenarios
•GEOTHERMAL & HEAT PUMP
• SOLAR HEAT
• OCEAN ENERGY
• SOLAR THERMAL POWER
• GEOTHERMAL POWER
• PV
•WIND
• HYDRO
• BIOMASS
• NUCLEAR
• GAS, OIL & DIESEL
• COAL
table 5.11: oecd north america: total employment in the energy sector THOUSAND JOBS
CoalGas, oil & dieselNuclearRenewableTotal Jobs
Construction and installationManufacturingOperations and maintenanceFuel supply (domestic)Coal and gas exportTotal Jobs
2015
13174054
1,0621,987
464332254
933.64
1,987
2020
10266574
1,2552,095
5454072928511
2,095
2030
3447779
1,1931,782
503299355626
-1,782
ENERGY [R]EVOLUTION
2015
22875556386
1,425
124652439867
1,425
2010
18176160375
1,377
130642269534
1,377
2020
19373654424
1,408
1016025997810
1,408
2030
17173353426
1,383
734027798210
1,383
REFERENCE

95
5
key resu
lts|OECD NORTH AMERICA - T
RANSPORT
oecd north america: transport
In the transport sector, it is assumed under the Energy[R]evolution scenario that an energy demand reduction of21,207 PJ/a can be achieved by 2050 compared to theReference scenario, saving 69%. This reduction can be achievedby the introduction of highly efficient vehicles, by shifting thetransport of goods from road to rail and by changes in mobility-related behaviour patterns. Implementing attractive alternativesto individual cars, the car stock is growing slower than in theReference scenario.
A shift towards smaller cars triggered by economic incentivestogether with a significant shift in propulsion technology towardselectrified power trains and a reduction of vehicle kilometrestravelled by 0.25% per year leads to significant final energy savings.In 2030, electricity will provide 5% of the transport sector’s totalenergy demand in the Energy [R]evolution, 33% by 2050.
table 5.10: oecd north america: transport energy demandby mode under the reference scenario and the energy[r]evolution scenario (WITHOUT ENERGY FOR PIPELINE TRANSPORT) IN PJ/A
2020
699832
25,90222,319
2,3212,151
286294
29,20825,596
2040
719826
25,9178,120
2,4461,827
299271
29,38211,044
2050
746764
26,2246,382
2,7531,947
312263
30,0369,356
Rail
Road
Domesticaviation
Domesticnavigation
Total
REFE[R]
REFE[R]
REFE[R]
REFE[R]
REFE[R]
2030
692839
25,37814,810
2,2721,906
286285
28,62817,839
2009
522522
24,97524,975
2,1862,186
237237
27,92027,920
figure 5.28: oecd north america: final energy consumption for transport under the reference scenario and the energy [r]evolution scenario
REF REF REF REF REF REFE[R] E[R] E[R] E[R] E[R] E[R]
2009 2015 2020 2030 2040 2050
PJ/a 0
5,000
10,000
15,000
20,000
25,000
30,000
35,000
•‘EFFICIENCY’
• HYDROGEN
• ELECTRICITY
• BIOFUELS
• NATURAL GAS
• OIL PRODUCTS
•WIND
• HYDRO
• BIOMASS
• NUCLEAR
• GAS, OIL & DIESEL
• COAL
© LES STONE/GP
© KARUNA ANG/GP
image GAS PIPELINE CONSTRUCTION IN THE BRADFORD COUNTY COUNTRYSIDE. INDECEMBER 2011, THE PITTSBURGH TRIBUNE-REVIEW REPORTED THAT THE 8,500 MILES(29,773 KMS) OF GAS PIPELINE IN PENNSYLVANIA COULD QUADRUPLE OVER THE NEXT20 YEARS. THE ARTICLE POINTS OUT THAT COMPANIES HAVE ALREADY DOUBLEDANNUAL SPENDING ON PIPELINE PROJECTS IN PENNSYLVANIA TO $800 MILLION.
image WIND TURBINES ON THE STORY COUNTY 1 ENERGY CENTER, JUST NORTH OFCOLO. EACH TURBINE HAS A 1.5-MEGAWATT CAPACITY AND CONTRIBUTES TOGENERATING ELECTRICITY FOR UP TO 75,000 HOMES. THE NEXTERA ENERGY-OWNEDWIND FARM HAS BEEN IN OPERATION SINCE 2008.
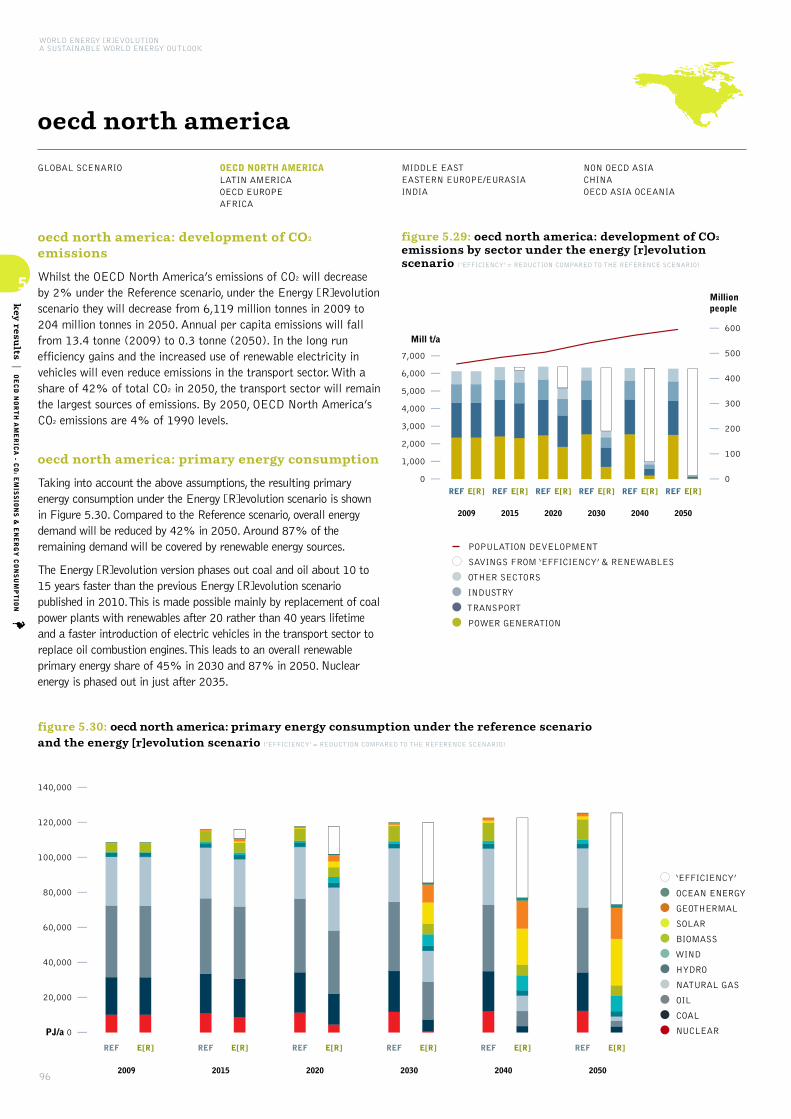
96
5
key resu
lts|OECD NORTH AMERICA - C
O2EMISSIONS & ENERGY CONSUMPTION
WORLD ENERGY [R]EVOLUTIONA SUSTAINABLE WORLD ENERGY OUTLOOK
GLOBAL SCENARIO OECD NORTH AMERICALATIN AMERICAOECD EUROPE AFRICA
MIDDLE EASTEASTERN EUROPE/EURASIAINDIA
NON OECD ASIACHINAOECD ASIA OCEANIA
oecd north america
oecd north america: development of CO2
emissions
Whilst the OECD North America’s emissions of CO2 will decreaseby 2% under the Reference scenario, under the Energy [R]evolutionscenario they will decrease from 6,119 million tonnes in 2009 to204 million tonnes in 2050. Annual per capita emissions will fallfrom 13.4 tonne (2009) to 0.3 tonne (2050). In the long runefficiency gains and the increased use of renewable electricity invehicles will even reduce emissions in the transport sector. With ashare of 42% of total CO2 in 2050, the transport sector will remainthe largest sources of emissions. By 2050, OECD North America’sCO2 emissions are 4% of 1990 levels.
oecd north america: primary energy consumption
Taking into account the above assumptions, the resulting primaryenergy consumption under the Energy [R]evolution scenario is shownin Figure 5.30. Compared to the Reference scenario, overall energydemand will be reduced by 42% in 2050. Around 87% of theremaining demand will be covered by renewable energy sources.
The Energy [R]evolution version phases out coal and oil about 10 to15 years faster than the previous Energy [R]evolution scenariopublished in 2010. This is made possible mainly by replacement of coalpower plants with renewables after 20 rather than 40 years lifetimeand a faster introduction of electric vehicles in the transport sector toreplace oil combustion engines. This leads to an overall renewableprimary energy share of 45% in 2030 and 87% in 2050. Nuclearenergy is phased out in just after 2035.
figure 5.29: oecd north america: development of CO2
emissions by sector under the energy [r]evolutionscenario (‘EFFICIENCY’ = REDUCTION COMPARED TO THE REFERENCE SCENARIO)
REF REF REF REF REF REFE[R] E[R] E[R] E[R] E[R] E[R]
2009 2015 2020 2030 2040 2050
0
1,000
2,000
3,000
4,000
5,000
6,000
7,000
0
100
200
300
400
500
600Mill t/a
Million people
POPULATION DEVELOPMENT
• SAVINGS FROM ‘EFFICIENCY’ & RENEWABLES
• OTHER SECTORS
• INDUSTRY
•TRANSPORT
• POWER GENERATION
figure 5.30: oecd north america: primary energy consumption under the reference scenario and the energy [r]evolution scenario (‘EFFICIENCY’ = REDUCTION COMPARED TO THE REFERENCE SCENARIO)
PJ/a 0
20,000
40,000
60,000
80,000
100,000
120,000
140,000
REF REF REF REF REF REFE[R] E[R] E[R] E[R] E[R] E[R]
2009 2015 2020 2030 2040 2050
•‘EFFICIENCY’
• OCEAN ENERGY
• GEOTHERMAL
• SOLAR
• BIOMASS
•WIND
• HYDRO
• NATURAL GAS
• OIL
• COAL
• NUCLEAR
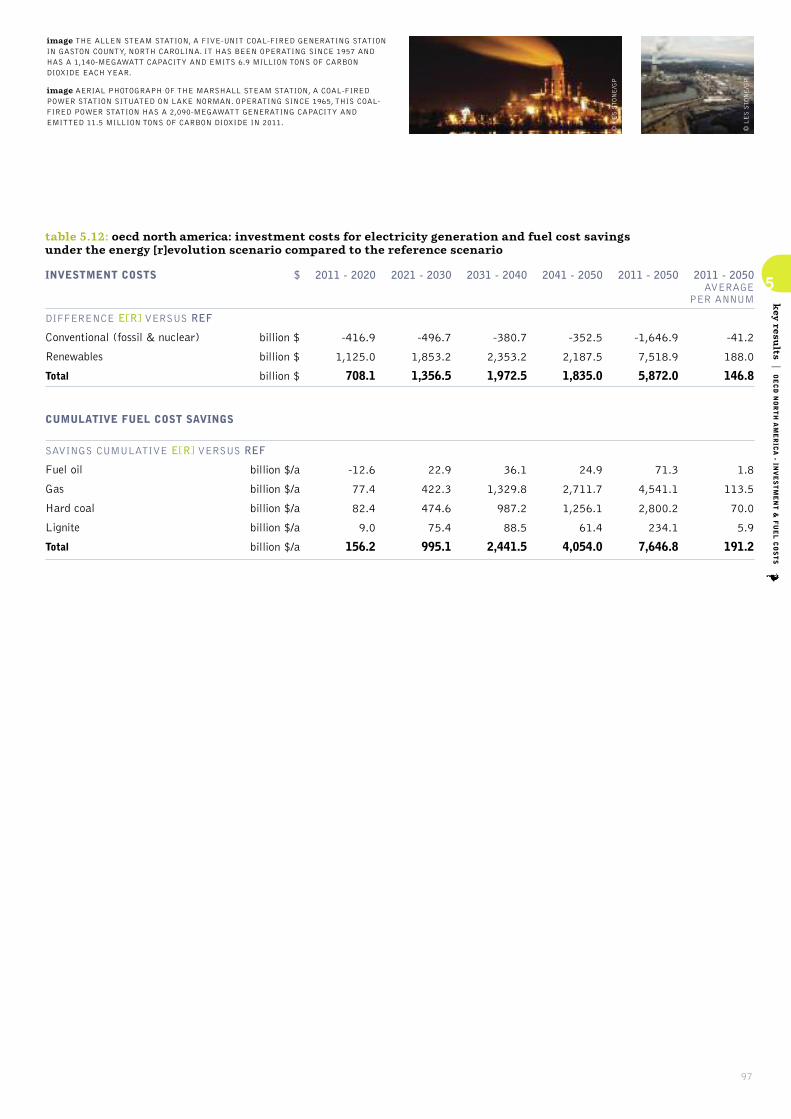
97
5
key resu
lts|OECD NORTH AMERICA - IN
VESTMENT & FUEL COSTS
table 5.12: oecd north america: investment costs for electricity generation and fuel cost savings under the energy [r]evolution scenario compared to the reference scenario
INVESTMENT COSTS
DIFFERENCE E[R] VERSUS REF
Conventional (fossil & nuclear)
Renewables
Total
CUMULATIVE FUEL COST SAVINGS
SAVINGS CUMULATIVE E[R] VERSUS REF
Fuel oil
Gas
Hard coal
Lignite
Total
$
billion $
billion $
billion $
billion $/a
billion $/a
billion $/a
billion $/a
billion $/a
2021 - 2030
-496.7
1,853.2
1,356.5
22.9
422.3
474.6
75.4
995.1
2011 - 2020
-416.9
1,125.0
708.1
-12.6
77.4
82.4
9.0
156.2
2011 - 2050
-1,646.9
7,518.9
5,872.0
71.3
4,541.1
2,800.2
234.1
7,646.8
2011 - 2050 AVERAGE
PER ANNUM
-41.2
188.0
146.8
1.8
113.5
70.0
5.9
191.2
2041 - 2050
-352.5
2,187.5
1,835.0
24.9
2,711.7
1,256.1
61.4
4,054.0
2031 - 2040
-380.7
2,353.2
1,972.5
36.1
1,329.8
987.2
88.5
2,441.5
© LES STONE/GP
© LES STONE/GP
image THE ALLEN STEAM STATION, A FIVE-UNIT COAL-FIRED GENERATING STATIONIN GASTON COUNTY, NORTH CAROLINA. IT HAS BEEN OPERATING SINCE 1957 ANDHAS A 1,140-MEGAWATT CAPACITY AND EMITS 6.9 MILLION TONS OF CARBONDIOXIDE EACH YEAR.
image AERIAL PHOTOGRAPH OF THE MARSHALL STEAM STATION, A COAL-FIREDPOWER STATION SITUATED ON LAKE NORMAN. OPERATING SINCE 1965, THIS COAL-FIRED POWER STATION HAS A 2,090-MEGAWATT GENERATING CAPACITY ANDEMITTED 11.5 MILLION TONS OF CARBON DIOXIDE IN 2011.

98
5
key resu
lts|LATIN AMERICA - D
EMAND
WORLD ENERGY [R]EVOLUTIONA SUSTAINABLE WORLD ENERGY OUTLOOK
GLOBAL SCENARIO OECD NORTH AMERICALATIN AMERICAOECD EUROPE AFRICA
MIDDLE EASTEASTERN EUROPE/EURASIAINDIA
NON OECD ASIACHINAOECD ASIA OCEANIA
latin america
latin america: energy demand by sector
Combining the projections on population development, GDPgrowth and energy intensity results in future developmentpathways for Latin America’s energy demand. These are shown inFigure 5.31 for both the Reference and the Energy [R]evolutionscenario. Under the Reference scenario, total primary energydemand almost doubles from the current 22,050 PJ/a to 40,740PJ/a in 2050. In the Energy [R]evolution scenario a smallerincrease of 34% compared to current consumption is expected,reaching 29,500 PJ/a by 2050.
Under the Energy [R]evolution scenario, electricity demand isexpected to increase disproportionately, with households andservices the main sources for growing consumption. This is due towider access to energy services especially in the developingregions within Latin America (see Figure 5.32). With theexploitation of efficiency measures, however an even higherincrease can be avoided, leading to an electricity demand ofaround 2030 TWh/a in 2050.
Compared to the Reference scenario, efficiency measures in theindustry, residential and service sectors avoid the generation ofabout 605 TWh/a. This reduction can be achieved in particular byintroducing highly efficient electronic devices. Employment ofsolar architecture in both residential and commercial buildingswill help to curb the growing demand for air-conditioning.
Efficiency gains in the heat supply sector are even larger. Underthe Energy [R]evolution scenario, final energy demand for heatsupply eventually even stagnates (see Figure 5.34). Compared tothe Reference scenario, consumption equivalent to 2,370 PJ/a isavoided through efficiency gains by 2050. In the transport sector,it is assumed under the Energy [R]evolution scenario that energydemand will peak around 2020 and will drop back to 5,400 PJ/aby 2050, saving 51% compared to the Reference scenario.
figure 5.31: latin america: total final energy demand by sector under the reference scenario and the energy [r]evolution scenario (‘EFFICIENCY’ = REDUCTION COMPARED TO THE REFERENCE SCENARIO)
• ‘EFFICIENCY’
• OTHER SECTORS
• INDUSTRY
•TRANSPORTPJ/a 0
4,000
8,000
12,000
16,000
20,000
24,000
28,000
32,000
REF REF REF REF REF REFE[R] E[R] E[R] E[R] E[R] E[R]
2009 2015 2020 2030 2040 2050
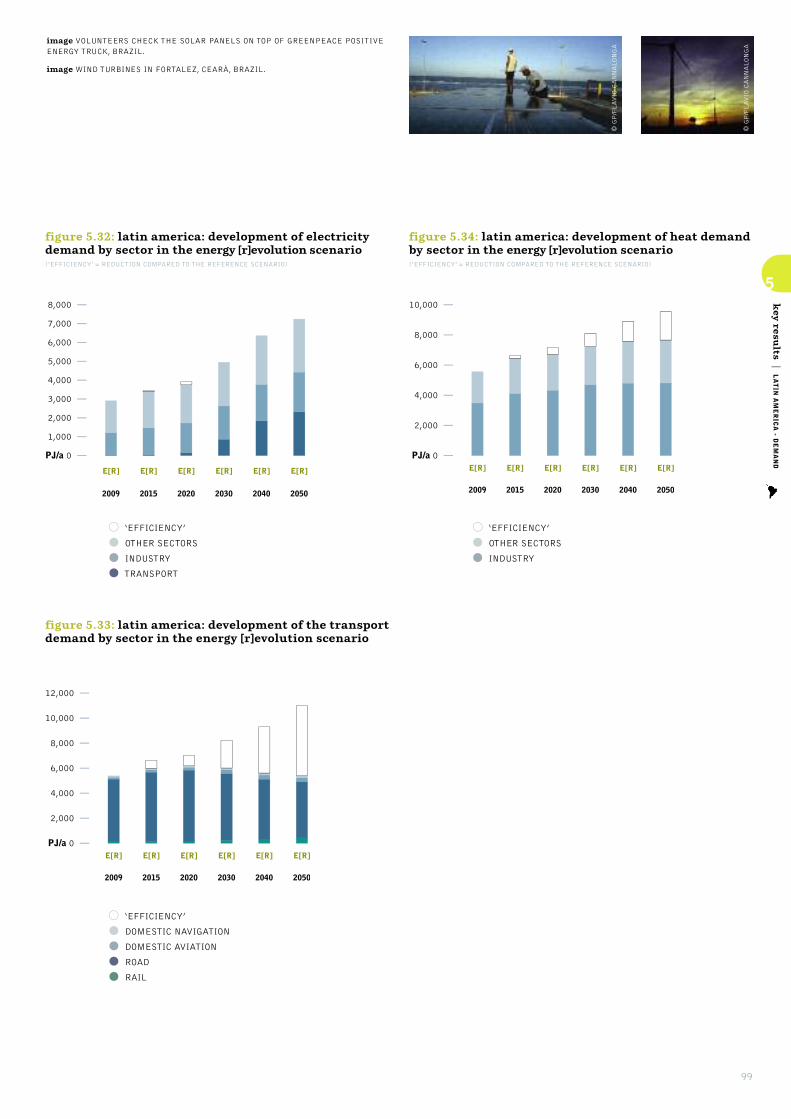
99
5
key resu
lts|LATIN AMERICA - D
EMAND
figure 5.32: latin america: development of electricitydemand by sector in the energy [r]evolution scenario(‘EFFICIENCY’ = REDUCTION COMPARED TO THE REFERENCE SCENARIO)
• ‘EFFICIENCY’
• OTHER SECTORS
• INDUSTRY
•TRANSPORT
E[R] E[R] E[R] E[R] E[R] E[R]
2009 2015 2020 2030 2040 2050
PJ/a 0
2,000
4,000
6,000
8,000
10,000
12,000
figure 5.33: latin america: development of the transportdemand by sector in the energy [r]evolution scenario
•‘EFFICIENCY’
• DOMESTIC NAVIGATION
• DOMESTIC AVIATION
• ROAD
• RAIL
E[R] E[R] E[R] E[R] E[R] E[R]
2009 2015 2020 2030 2040 2050
PJ/a 0
1,000
2,000
3,000
4,000
5,000
6,000
7,000
8,000
E[R] E[R] E[R] E[R] E[R] E[R]
2009 2015 2020 2030 2040 2050
PJ/a 0
2,000
4,000
6,000
8,000
10,000
figure 5.34: latin america: development of heat demandby sector in the energy [r]evolution scenario(‘EFFICIENCY’ = REDUCTION COMPARED TO THE REFERENCE SCENARIO)
• ‘EFFICIENCY’
• OTHER SECTORS
• INDUSTRY
© GP/FLAVIO CANNALONGA
© GP/FLAVIO CANNALONGA
image VOLUNTEERS CHECK THE SOLAR PANELS ON TOP OF GREENPEACE POSITIVEENERGY TRUCK, BRAZIL.
image WIND TURBINES IN FORTALEZ, CEARÀ, BRAZIL.

100
5
key resu
lts|LATIN AMERICA - E
LECTRICITY GENERATION
WORLD ENERGY [R]EVOLUTIONA SUSTAINABLE WORLD ENERGY OUTLOOK
GLOBAL SCENARIO OECD NORTH AMERICALATIN AMERICAOECD EUROPE AFRICA
MIDDLE EASTEASTERN EUROPE/EURASIAINDIA
NON OECD ASIACHINAOECD ASIA OCEANIA
latin america
latin america: electricity generation
The development of the electricity supply market in the Energy[R]evolution scenario is charaterised by an increasing share ofrenewable energy sources. By 2050, 95% of the electricityproduced in Latin America will come from renewable energysources. ‘New’ renewables – mainly wind, PV and biomass – willcontribute 54% of electricity generation. The installed capacityof renewable energy technologies will grow from the current 148GW to 436 GW in 2030 and 863 GW in 2050, increasingrenewable capacity by a factor of six within the next 40 years.
Table 5.13 shows the comparative evolution of the differentrenewable technologies in Latin America over time. Up to 2030hydro will remain the main contributor, while wind andphotovoltaics (PV) gain a growing market share. After 2020, thecontinuing growth of wind and PV will be complemented byelectricity from biomass and solar thermal (CSP) energy. TheEnergy [R]evolution scenario will lead to a high share ofrenewables achieving an electricity share of 80% already by2020 and 86% by 2030.
table 5.13: latin america: renewable electricity generationcapacity under the reference scenario and the energy [r]evolution scenario IN GW
2020
170159
715
649
12
433
08
01
188266
2040
218169
1050
17202
212
17152
244
025
266654
2050
228170
1266
27258
319
25243
369
037
298863
Hydro
Biomass
Wind
Geothermal
PV
CSP
Ocean energy
Total
REFE[R]
REFE[R]
REFE[R]
REFE[R]
REFE[R]
REFE[R]
REFE[R]
REFE[R]
2030
198167
933
11130
24
1174
121
07
231436
2009
142142
55
11
11
00
00
00
148148
figure 5.35: latin america: electricity generation structure under the reference scenario and the energy [r]evolution scenario (INCLUDING ELECTRICITY FOR ELECTROMOBILITY, HEAT PUMPS AND HYDROGEN GENERATION)
TWh/a 0
500
1,000
1,500
2,000
2,500
3,000
REF REF REF REF REF REFE[R] E[R] E[R] E[R] E[R] E[R]
2009 2015 2020 2030 2040 2050
•OCEAN ENERGY
• SOLAR THERMAL
• GEOTHERMAL
• BIOMASS
• PV
•WIND
• HYDRO
• NUCLEAR
• DIESEL
• OIL
• NATURAL GAS
• LIGNITE
• COAL
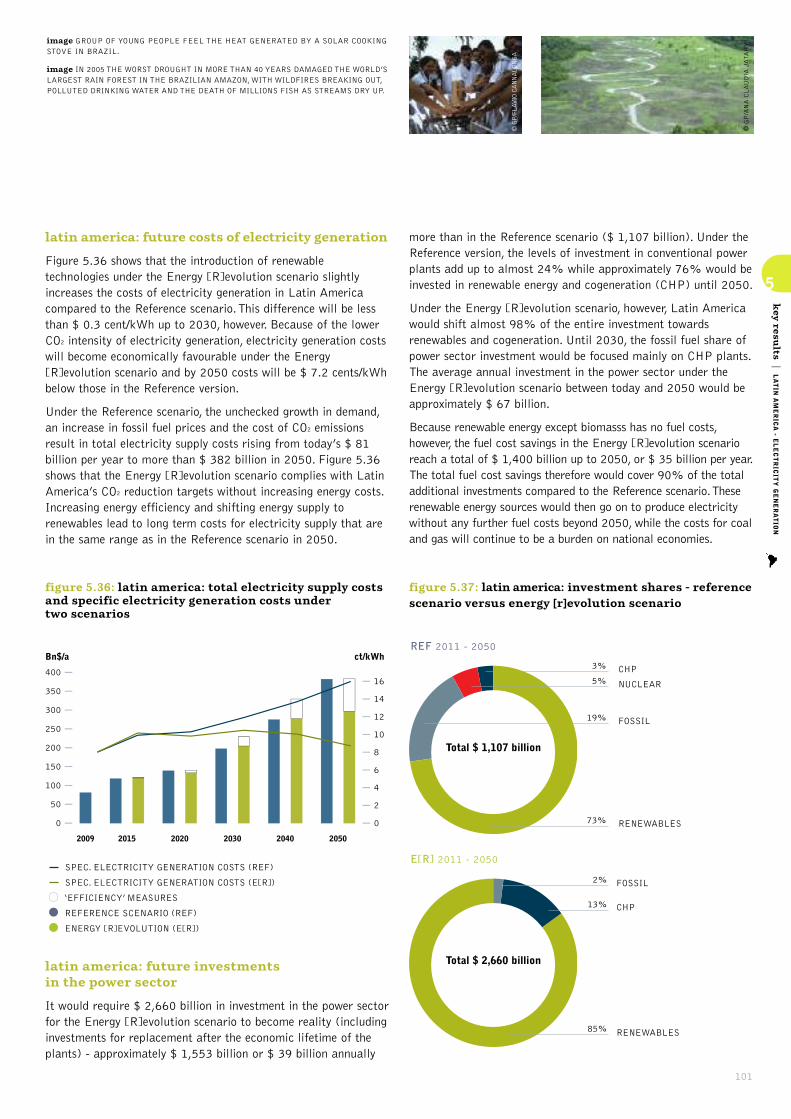
101
5
key resu
lts|LATIN AMERICA - E
LECTRICITY GENERATION
latin america: future costs of electricity generation
Figure 5.36 shows that the introduction of renewabletechnologies under the Energy [R]evolution scenario slightlyincreases the costs of electricity generation in Latin Americacompared to the Reference scenario. This difference will be lessthan $ 0.3 cent/kWh up to 2030, however. Because of the lowerCO2 intensity of electricity generation, electricity generation costswill become economically favourable under the Energy[R]evolution scenario and by 2050 costs will be $ 7.2 cents/kWhbelow those in the Reference version.
Under the Reference scenario, the unchecked growth in demand,an increase in fossil fuel prices and the cost of CO2 emissionsresult in total electricity supply costs rising from today’s $ 81billion per year to more than $ 382 billion in 2050. Figure 5.36shows that the Energy [R]evolution scenario complies with LatinAmerica’s CO2 reduction targets without increasing energy costs.Increasing energy efficiency and shifting energy supply torenewables lead to long term costs for electricity supply that arein the same range as in the Reference scenario in 2050.
figure 5.36: latin america: total electricity supply costsand specific electricity generation costs under two scenarios
0
50
100
150
200
250
300
350
400
2009 2015 2020 2030 2040 2050
0
2
4
6
8
10
12
14
16
ct/kWhBn$/a
SPEC. ELECTRICITY GENERATION COSTS (REF)
SPEC. ELECTRICITY GENERATION COSTS (E[R])
• ‘EFFICIENCY’ MEASURES
• REFERENCE SCENARIO (REF)
• ENERGY [R]EVOLUTION (E[R])
latin america: future investments in the power sector
It would require $ 2,660 billion in investment in the power sectorfor the Energy [R]evolution scenario to become reality (includinginvestments for replacement after the economic lifetime of theplants) - approximately $ 1,553 billion or $ 39 billion annually
more than in the Reference scenario ($ 1,107 billion). Under theReference version, the levels of investment in conventional powerplants add up to almost 24% while approximately 76% would beinvested in renewable energy and cogeneration (CHP) until 2050.
Under the Energy [R]evolution scenario, however, Latin Americawould shift almost 98% of the entire investment towardsrenewables and cogeneration. Until 2030, the fossil fuel share ofpower sector investment would be focused mainly on CHP plants.The average annual investment in the power sector under theEnergy [R]evolution scenario between today and 2050 would beapproximately $ 67 billion.
Because renewable energy except biomasss has no fuel costs,however, the fuel cost savings in the Energy [R]evolution scenarioreach a total of $ 1,400 billion up to 2050, or $ 35 billion per year.The total fuel cost savings therefore would cover 90% of the totaladditional investments compared to the Reference scenario. Theserenewable energy sources would then go on to produce electricitywithout any further fuel costs beyond 2050, while the costs for coaland gas will continue to be a burden on national economies.
figure 5.37: latin america: investment shares - referencescenario versus energy [r]evolution scenario
REF 2011 - 2050
19% FOSSIL
5% NUCLEAR
3% CHP
73% RENEWABLES
Total $ 1,107 billion
E[R] 2011 - 2050
2% FOSSIL
13% CHP
85% RENEWABLES
Total $ 2,660 billion
© GP/FLAVIO CANNALONGA
© GP/ANA CLAUDIA JATAHYimage GROUP OF YOUNG PEOPLE FEEL THE HEAT GENERATED BY A SOLAR COOKING
STOVE IN BRAZIL.
image IN 2005 THE WORST DROUGHT IN MORE THAN 40 YEARS DAMAGED THE WORLD’SLARGEST RAIN FOREST IN THE BRAZILIAN AMAZON, WITH WILDFIRES BREAKING OUT,POLLUTED DRINKING WATER AND THE DEATH OF MILLIONS FISH AS STREAMS DRY UP.

102
5
key resu
lts|LATIN AMERICA - H
EATING
WORLD ENERGY [R]EVOLUTIONA SUSTAINABLE WORLD ENERGY OUTLOOK
GLOBAL SCENARIO OECD NORTH AMERICALATIN AMERICAOECD EUROPE AFRICA
MIDDLE EASTEASTERN EUROPE/EURASIAINDIA
NON OECD ASIACHINAOECD ASIA OCEANIA
latin america
latin america: heating supply
Renewables currently provide 38% of Latin America’s energydemand for heat supply, the main contribution coming from theuse of biomass. The lack of district heating networks is a severestructural barrier to the large scale utilisation of geothermal andsolar thermal energy. In the Energy [R]evolution scenario,renewables provide 67% of Latin America’s total heat demand in2030 and 97% in 2050.
• Energy efficiency measures can restrict the future primaryenergy demand for heat supply to a 29% increase, in spite ofimproving living standards.
• In the industry sector solar collectors, biomass/biogas as wellas geothermal energy are increasingly replacing conventionalfossil fuelled heating systems.
• A shift from coal and oil to natural gas in the remainingconventional applications leads to a further reduction of CO2 emissions.
In the Energy [R]evolution scenario about 2,370 PJ/a are savedby 2050, or 25% compared to the Reference scenario.
Table 5.14 shows the development of the different renewabletechnologies for heating in Latin America over time. Biomass willremain the main contributor for renewable heat. After 2020, thecontinuing growth of solar collectors and a growing share ofgeothermal heat (including heat pumps) will reduce thedependence on fossil fuels.
table 5.14: latin america: renewable heating capacitiesunder the reference scenario and the energy [r]evolution scenario IN GW
2020
2,4522,679
42461
3257
071
2,4973,467
2040
2,8013,529
1261,262
151,213
0322
2,9416,327
2050
2,9023,451
2091,465
251,757
0303
3,1366,976
Biomass
Solarcollectors
Geothermal
Hydrogen
Total
REFE[R]
REFE[R]
REFE[R]
REFE[R]
REFE[R]
2030
2,6263,117
72840
7563
0261
2,7054,781
2009
2,0892,089
1717
00
00
2,1062,106
figure 5.38: latin america: heat supply structure under the reference scenario and the energy [r]evolution scenario(‘EFFICIENCY’ = REDUCTION COMPARED TO THE REFERENCE SCENARIO)
REF REF REF REF REF REFE[R] E[R] E[R] E[R] E[R] E[R]
2009 2015 2020 2030 2040 2050
PJ/a 0
2,000
4,000
6,000
8,000
10,000
•‘EFFICIENCY’
• HYDROGEN
• GEOTHERMAL
• SOLAR
• BIOMASS
• FOSSIL
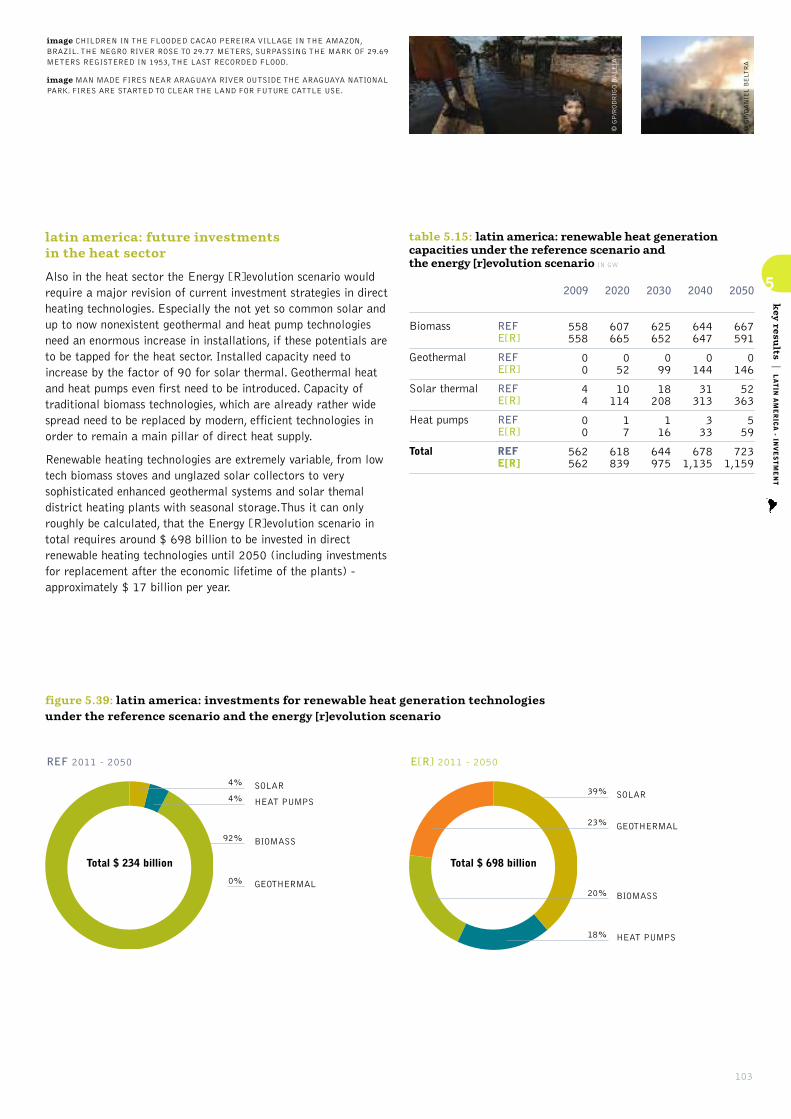
103
5
key resu
lts|LATIN AMERICA - IN
VESTMENT
latin america: future investments in the heat sector
Also in the heat sector the Energy [R]evolution scenario wouldrequire a major revision of current investment strategies in directheating technologies. Especially the not yet so common solar andup to now nonexistent geothermal and heat pump technologiesneed an enormous increase in installations, if these potentials areto be tapped for the heat sector. Installed capacity need toincrease by the factor of 90 for solar thermal. Geothermal heatand heat pumps even first need to be introduced. Capacity oftraditional biomass technologies, which are already rather widespread need to be replaced by modern, efficient technologies inorder to remain a main pillar of direct heat supply.
Renewable heating technologies are extremely variable, from lowtech biomass stoves and unglazed solar collectors to verysophisticated enhanced geothermal systems and solar themaldistrict heating plants with seasonal storage.Thus it can onlyroughly be calculated, that the Energy [R]evolution scenario intotal requires around $ 698 billion to be invested in directrenewable heating technologies until 2050 (including investmentsfor replacement after the economic lifetime of the plants) -approximately $ 17 billion per year.
table 5.15: latin america: renewable heat generationcapacities under the reference scenario and the energy [r]evolution scenario IN GW
2020
607665
052
10114
17
618839
2040
644647
0144
31313
333
6781,135
2050
667591
0146
52363
559
7231,159
Biomass
Geothermal
Solar thermal
Heat pumps
Total
REFE[R]
REFE[R]
REFE[R]
REFE[R]
REFE[R]
2030
625652
099
18208
116
644975
2009
558558
00
44
00
562562
figure 5.39: latin america: investments for renewable heat generation technologies under the reference scenario and the energy [r]evolution scenario
REF 2011 - 2050
4% SOLAR
0% GEOTHERMAL
92% BIOMASS
4% HEAT PUMPS
Total $ 234 billion
E[R] 2011 - 2050
39% SOLAR
18% HEAT PUMPS
20% BIOMASS
23% GEOTHERMAL
Total $ 698 billion
© GP/DANIEL BELTRA
© GP/RODRIGO BALÈIA
image CHILDREN IN THE FLOODED CACAO PEREIRA VILLAGE IN THE AMAZON,BRAZIL. THE NEGRO RIVER ROSE TO 29.77 METERS, SURPASSING THE MARK OF 29.69METERS REGISTERED IN 1953, THE LAST RECORDED FLOOD.
image MAN MADE FIRES NEAR ARAGUAYA RIVER OUTSIDE THE ARAGUAYA NATIONALPARK. FIRES ARE STARTED TO CLEAR THE LAND FOR FUTURE CATTLE USE.

104
5
key resu
lts|LATIN AMERICA - E
MPLOYMENT
WORLD ENERGY [R]EVOLUTIONA SUSTAINABLE WORLD ENERGY OUTLOOK
GLOBAL SCENARIO OECD NORTH AMERICALATIN AMERICAOECD EUROPE AFRICA
MIDDLE EASTEASTERN EUROPE/EURASIAINDIA
NON OECD ASIACHINAOECD ASIA OCEANIA
latin america
latin america: future employment in the energy sector
The Energy [R]evolution scenario results in more energy sectorjobs in Latin America at every stage of the projection.
• There are 1.6 million energy sector jobs in the Energy [R]evolution scenario in 2015, and 1.2 million in the Reference scenario.
• In 2020, there are 1.7 million jobs in the Energy [R]evolutionscenario, and 1.3 million in the Reference scenario.
• In 2030, there are 1.6 million jobs in the Energy [R]evolutionscenario and 1.3 million in the Reference scenario.
Figure 5.40 shows the change in job numbers under bothscenarios for each technology between 2010 and 2030. Jobs inthe Reference scenario increase by 10% by 2030. Gas has thelargest share, followed by biomass.
Exceptionally strong growth in renewable energy leads to anincrease of 33% in energy sector jobs in the Energy [R]evolutionscenario by 2015, and further growth to 41% above 2010 levelsby 2030. Renewable energy accounts for 78% of energy sectorjobs in 2030, with biomass having the largest share (41%),followed by solar PV, wind, and solar heating.
REFERENCE ENERGY[R]EVOLUTION
2010 2015 2020 2030 2015 2020 2030
0
0.2
0.4
0.6
0.8
1.0
1.2
1.4
1.6
1.8
Dir
ect
jobs
- m
illio
ns
figure 5.40: latin america: employment in the energy scenario under the reference and energy [r]evolution scenarios
•GEOTHERMAL & HEAT PUMP
• SOLAR HEAT
• OCEAN ENERGY
• SOLAR THERMAL POWER
• GEOTHERMAL POWER
• PV
•WIND
• HYDRO
• BIOMASS
• NUCLEAR
• GAS, OIL & DIESEL
• COAL
table 5.16: latin america: total employment in the energy sector THOUSAND JOBS
CoalGas, oil & dieselNuclearRenewableTotal Jobs
Construction and installationManufacturingOperations and maintenanceFuel supply (domestic)Coal and gas exportTotal Jobs
2015
444223
1,0821,551
331142198
807.073
1,551
2020
243923
1,2471,666
38018524780153
1,666
2030
223364
1,2841,646
30317533880921
1,646
ENERGY [R]EVOLUTION
2015
8644111670
1,208
963217881191
1,208
2010
6941414668
1,165
1123516676785
1,165
2020
914578
6971,252
9837196816106
1,252
2030
1024919
6771,279
8734224830103
1,279
REFERENCE

105
5
key resu
lts|LATIN AMERICA - T
RANSPORT
latin america: transport
Despite a huge growth in transport services, the energyconsumption in the transport sector by 2050 can be limited tothe current level in the Energy [R]evolution scenario. Dependencyon fossil fuels, which now account for 89% of this supply, isgradually transformed by using 15% renewable energy by 2030and 35% by 2030. The electricity share in the transport sectorfurther increases up to 21% by 2050.
A shift towards smaller cars triggered by economic incentivestogether with a significant shift in propulsion technology towardselectrified power trains and a reduction of vehicle kilometrestravelled per year leads to significant energy savings. In 2030,electricity will provide 14% of the transport sector’s total energydemand in the Energy [R]evolution, while in 2050 the share will be 43%.
table 5.17: latin america: transport energy demand by mode under the reference scenario and the energy[r]evolution scenario (WITHOUT ENERGY FOR PIPELINE TRANSPORT) IN PJ/A
2020
140174
6,4585,649
238222
145132
6,9826,177
2040
186336
8,4474,763
437328
192159
9,2635,586
2050
220432
9,8444,482
561309
330166
10,9555,389
Rail
Road
Domesticaviation
Domesticnavigation
Total
REFE[R]
REFE[R]
REFE[R]
REFE[R]
REFE[R]
2030
164240
7,5265,319
329280
170143
8,1895,982
2009
106106
4,9954,995
152152
111111
5,3645,364
figure 5.41: latin america: final energy consumption for transport under the reference scenario and the energy [r]evolution scenario
REF REF REF REF REF REFE[R] E[R] E[R] E[R] E[R] E[R]
2009 2015 2020 2030 2040 2050
PJ/a 0
2,000
4,000
6,000
8,000
10,000
12,000
•‘EFFICIENCY’
• HYDROGEN
• ELECTRICITY
• BIOFUELS
• NATURAL GAS
• OIL PRODUCTS
•WIND
• HYDRO
• BIOMASS
• NUCLEAR
• GAS, OIL & DIESEL
• COAL
© PETER CATON/GP
© PETER CATON/GP
image THE INTAKE/OUTLET PIPE FROM THE ANGRA NUCLEAR REACTOR FROMWHICH SEAWATER USED TO COOL THE POWER PLANT IS POURED BACK INTO THESEA. A POPULAR SWIMMING SPOT BECAUSE OF THE WARMED WATER, THERE IS NOWARNING SIGN. BRAZIL.
image ANGRA 1 AND 2 NUCLEAR POWER STATION. IF BNP PARIBAS FINANCINGGOES AHEAD, A THIRD REACTOR ANGRA 3 WILL BE BUILT USING DANGEROUSLYOBSOLETE TECHNOLOGY BURDENING BRAZIL WITH A REACTOR THAT WOULD NOT BEPERMITTED IN THE COUNTRIES THAT ARE FINANCING IT.

106
5
key resu
lts|LATIN AMERICA - C
O2EMISSIONS & ENERGY CONSUMPTION
WORLD ENERGY [R]EVOLUTIONA SUSTAINABLE WORLD ENERGY OUTLOOK
GLOBAL SCENARIO OECD NORTH AMERICALATIN AMERICAOECD EUROPE AFRICA
MIDDLE EASTEASTERN EUROPE/EURASIAINDIA
NON OECD ASIACHINAOECD ASIA OCEANIA
latin america
latin america: development of CO2 emissions
While Latin America’s emissions of CO2 will almost double under theReference scenario, under the Energy [R]evolution scenario they willdecrease from 972 million tonnes in 2009 to 155 million tonnes in2050. Annual per capita emissions will drop from 2.1 tonnes to 1.2tonnes in 2030 and 0.3 tonne in 2050. In spite of the phasing out ofnuclear energy and increasing demand, CO2 emissions will decrease inthe electricity sector. In the long run efficiency gains and the increaseduse of renewable electricity in vehicles will even reduce emissions inthe transport sector. With a share of 38% of CO2 emissions in 2050,the transport sector will remain the largest source of emissions. By2050, Latin America’s CO2 emissions are 27% of 1990 levels.
latin america: primary energy consumption
Taking into account the assumptions discussed above, theresulting primary energy consumption under the Energy[R]evolution scenario is shown in Figure 5.43. Compared to theReference scenario, overall primary energy demand will bereduced by 28% in 2050. Latin America’s primary energydemand will increase from 22,045 PJ/a to about 29,500 PJ/a.
The Energy [R]evolution version phases out coal and oil about 5to 10 years faster than the previous Energy [R]evolution scenariopublished in 2010. This is made possible mainly by replacementof fossil-fueled power plants with renewables and a fasterintroduction of very efficient electric vehicles in the transportsector to replace conventional combustion engines. This leads toan overall renewable primary energy share of 57% in 2030 and85% in 2050. Nuclear energy is phased out before 2030.
figure 5.42: latin america: development of CO2 emissionsby sector under the energy [r]evolution scenario(‘EFFICIENCY’ = REDUCTION COMPARED TO THE REFERENCE SCENARIO)
REF REF REF REF REF REFE[R] E[R] E[R] E[R] E[R] E[R]
2009 2015 2020 2030 2040 2050
0
400
800
1,200
1,600
2,000
0
100
200
300
400
500
600
Mill t/aMillion people
POPULATION DEVELOPMENT
• SAVINGS FROM ‘EFFICIENCY’ & RENEWABLES
• OTHER SECTORS
• INDUSTRY
•TRANSPORT
• POWER GENERATION
figure 5.43: latin america: primary energy consumption under the reference scenario and the energy [r]evolution scenario (‘EFFICIENCY’ = REDUCTION COMPARED TO THE REFERENCE SCENARIO)
PJ/a 0
10,000
20,000
30,000
40,000
REF REF REF REF REF REFE[R] E[R] E[R] E[R] E[R] E[R]
2009 2015 2020 2030 2040 2050
•‘EFFICIENCY’
• OCEAN ENERGY
• GEOTHERMAL
• SOLAR
• BIOMASS
•WIND
• HYDRO
• NATURAL GAS
• OIL
• COAL
• NUCLEAR
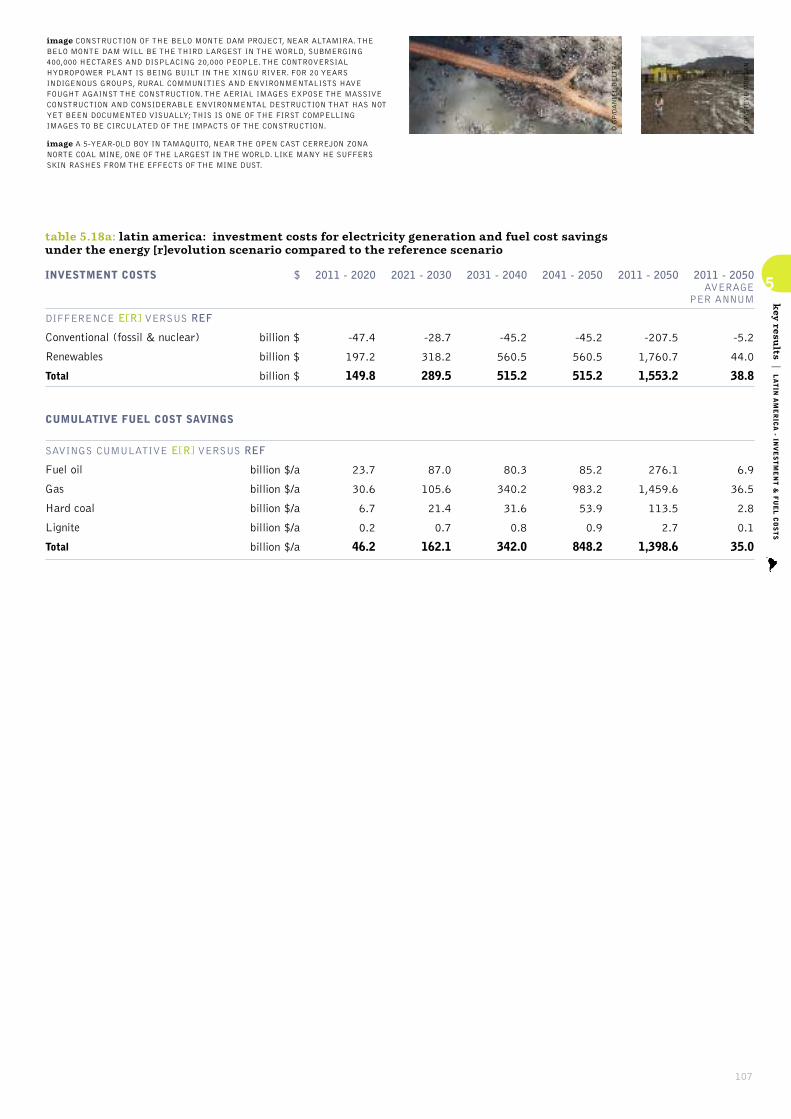
107
5
key resu
lts|LATIN AMERICA - IN
VESTMENT & FUEL COSTS
table 5.18a: latin america: investment costs for electricity generation and fuel cost savings under the energy [r]evolution scenario compared to the reference scenario
INVESTMENT COSTS
DIFFERENCE E[R] VERSUS REF
Conventional (fossil & nuclear)
Renewables
Total
CUMULATIVE FUEL COST SAVINGS
SAVINGS CUMULATIVE E[R] VERSUS REF
Fuel oil
Gas
Hard coal
Lignite
Total
$
billion $
billion $
billion $
billion $/a
billion $/a
billion $/a
billion $/a
billion $/a
2021 - 2030
-28.7
318.2
289.5
87.0
105.6
21.4
0.7
162.1
2011 - 2020
-47.4
197.2
149.8
23.7
30.6
6.7
0.2
46.2
2011 - 2050
-207.5
1,760.7
1,553.2
276.1
1,459.6
113.5
2.7
1,398.6
2011 - 2050 AVERAGE
PER ANNUM
-5.2
44.0
38.8
6.9
36.5
2.8
0.1
35.0
2041 - 2050
-45.2
560.5
515.2
85.2
983.2
53.9
0.9
848.2
2031 - 2040
-45.2
560.5
515.2
80.3
340.2
31.6
0.8
342.0
© GP/STEVE MORGAN
© GP/DANIEL BELTRA
image CONSTRUCTION OF THE BELO MONTE DAM PROJECT, NEAR ALTAMIRA. THEBELO MONTE DAM WILL BE THE THIRD LARGEST IN THE WORLD, SUBMERGING400,000 HECTARES AND DISPLACING 20,000 PEOPLE. THE CONTROVERSIALHYDROPOWER PLANT IS BEING BUILT IN THE XINGU RIVER. FOR 20 YEARSINDIGENOUS GROUPS, RURAL COMMUNITIES AND ENVIRONMENTALISTS HAVEFOUGHT AGAINST THE CONSTRUCTION. THE AERIAL IMAGES EXPOSE THE MASSIVECONSTRUCTION AND CONSIDERABLE ENVIRONMENTAL DESTRUCTION THAT HAS NOTYET BEEN DOCUMENTED VISUALLY; THIS IS ONE OF THE FIRST COMPELLINGIMAGES TO BE CIRCULATED OF THE IMPACTS OF THE CONSTRUCTION.
image A 5-YEAR-OLD BOY IN TAMAQUITO, NEAR THE OPEN CAST CERREJON ZONANORTE COAL MINE, ONE OF THE LARGEST IN THE WORLD. LIKE MANY HE SUFFERSSKIN RASHES FROM THE EFFECTS OF THE MINE DUST.

108
5
key resu
lts|OECD EUROPE - D
EMAND
WORLD ENERGY [R]EVOLUTIONA SUSTAINABLE WORLD ENERGY OUTLOOK
GLOBAL SCENARIO OECD NORTH AMERICALATIN AMERICAOECD EUROPE AFRICA
MIDDLE EASTEASTERN EUROPE/EURASIAINDIA
NON OECD ASIACHINAOECD ASIA OCEANIA
oecd europe
oecd europe: energy demand by sector
The future development pathways for Europe’s energy demandare shown in Figure 5.44 for the Reference and the Energy[R]evolution scenario. Under the Reference scenario, totalprimary energy demand in OECD Europe increases by 9% fromthe current 75,200 PJ/a to 82,080 PJ/a in 2050. The energydemand in 2050 in the Energy [R]evolution scenario decreasesby 36% compared to current consumption and it is expected by2050 to reach 47,800 PJ/a.
Under the Energy [R]evolution scenario, electricity demand in theindustry as well as in the residential and service sectors isexpected to decrease after 2015 (see Figure 5.45). Because ofthe growing shares of electric vehicles, heat pumps and hydrogengeneration however, electricity demand increases to 3,470 TWh/ain 2050, still 21% below the Reference case.
Efficiency gains in the heat supply sector are larger than in theelectricity sector. Under the Energy [R]evolution scenario, finaldemand for heat supply can even be reduced significantly (seeFigure 5.47). Compared to the Reference scenario, consumptionequivalent to 8,921 PJ/a is avoided through efficiency measuresby 2050. As a result of energy-related renovation of the existingstock of residential buildings, as well as the introduction of lowenergy standards and ‘passive houses’ for new buildings,enjoyment of the same comfort and energy services will beaccompanied by a much lower future energy demand.
figure 5.44: oecd europe: total final energy demand by sector under the reference scenario and the energy [r]evolution scenario (‘EFFICIENCY’ = REDUCTION COMPARED TO THE REFERENCE SCENARIO)
• ‘EFFICIENCY’
• OTHER SECTORS
• INDUSTRY
•TRANSPORT
REF E[R]
2009
REF E[R]
2015
REF E[R]
2020
REF E[R]
2030
REF E[R]
2040
REF E[R]
2050
PJ/a 0
10,000
20,000
30,000
40,000
50,000
60,000

109
5
key resu
lts|OECD EUROPE - D
EMAND
figure 5.45: oecd europe: development of electricitydemand by sector in the energy [r]evolution scenario(‘EFFICIENCY’ = REDUCTION COMPARED TO THE REFERENCE SCENARIO)
• ‘EFFICIENCY’
• OTHER SECTORS
• INDUSTRY
•TRANSPORT
E[R] E[R] E[R] E[R] E[R] E[R]
2009 2015 2020 2030 2040 2050
PJ/a 0
2,000
4,000
6,000
8,000
10,000
12,000
14,000
16,000
figure 5.46: oecd europe: development of the transportdemand by sector in the energy [r]evolution scenario
•‘EFFICIENCY’
• DOMESTIC NAVIGATION
• DOMESTIC AVIATION
• ROAD
• RAIL
E[R] E[R] E[R] E[R] E[R] E[R]
2009 2015 2020 2030 2040 2050
PJ/a 0
2,000
4,000
6,000
8,000
10,000
12,000
14,000
16,000
E[R] E[R] E[R] E[R] E[R] E[R]
2009 2015 2020 2030 2040 2050
PJ/a 0
5,000
10,000
15,000
20,000
25,000
30,000
figure 5.47: oecd europe: development of heat demandby sector in the energy [r]evolution scenario(‘EFFICIENCY’ = REDUCTION COMPARED TO THE REFERENCE SCENARIO)
• ‘EFFICIENCY’
• OTHER SECTORS
• INDUSTRY
© GP/COBBING
© REDONDO/GP
image PLANT NEAR REYKJAVIK WHERE ENERGY IS PRODUCED FROM THEGEOTHERMAL ACTIVITY.
image WORKERS EXAMINE PARABOLIC TROUGH COLLECTORS IN THE PS10 SOLARTOWER PLANT AT SAN LUCAR LA MAYOR OUTSIDE SEVILLE, SPAIN, 2008.

110
5
key resu
lts|OECD EUROPE - E
LECTRICITY GENERATION
WORLD ENERGY [R]EVOLUTIONA SUSTAINABLE WORLD ENERGY OUTLOOK
GLOBAL SCENARIO OECD NORTH AMERICALATIN AMERICAOECD EUROPE AFRICA
MIDDLE EASTEASTERN EUROPE/EURASIAINDIA
NON OECD ASIACHINAOECD ASIA OCEANIA
oecd europe
oecd europe: electricity generation
The development of the electricity supply market is charaterised bya dynamically growing renewable energy market. This willcompensate for the phasing out of nuclear energy and reduce thenumber of fossil fuel-fired power plants required for gridstabilisation. By 2050, 96% of the electricity produced in OECDEurope will come from renewable energy sources. ‘New’ renewables– mainly wind, solar thermal energy and PV – will contribute 71%of electricity generation. The Energy [R]evolution scenario projectsan immediate market development with high annual growth ratesachieving a renewable electricity share of 49% already by 2020and 71% by 2030. The installed capacity of renewables will reach1038 GW in 2030 and 1,498 GW by 2050.
Table 5.19 shows the comparative evolution of the differentrenewable technologies in OECD Europe over time. Up to 2020hydro and wind will remain the main contributors of the growingmarket share. After 2020, the continuing growth of wind will becomplemented by electricity from biomass, photovoltaics andsolar thermal (CSP) energy. The Energy [R]evolution scenariowill lead to a high share of fluctuating power generation sources(photovoltaic, wind and ocean) of 37% by 2030, therefore theexpansion of smart grids, demand side management (DSM) and storage capacity e.g. from the increased share of electricvehicles will be used for a better grid integration and powergeneration management.
table 5.19: oecd europe: renewable electricity generationcapacity under the reference scenario and the energy [r]evolution scenario IN GW
2020
210207
3048
195276
38
45197
212
03
486750
2040
227218
4372
295496
445
115489
555
931
6991,407
2050
234219
4970
313516
553
152518
682
1140
7701,498
Hydro
Biomass
Wind
Geothermal
PV
CSP
Ocean energy
Total
REFE[R]
REFE[R]
REFE[R]
REFE[R]
REFE[R]
REFE[R]
REFE[R]
REFE[R]
2030
220215
3760
256414
330
79270
432
218
6021,038
2009
193193
2121
7676
22
1414
00
00
306306
figure 5.48: oecd europe: electricity generation structure under the reference scenario and the energy [r]evolution scenario (INCLUDING ELECTRICITY FOR ELECTROMOBILITY, HEAT PUMPS AND HYDROGEN GENERATION)
TWh/a 0
500
1,000
1,500
2,000
2,500
3,000
3,500
4,000
4,500
5,000
REF REF REF REF REF REFE[R] E[R] E[R] E[R] E[R] E[R]
2009 2015 2020 2030 2040 2050
•OCEAN ENERGY
• SOLAR THERMAL
• GEOTHERMAL
• BIOMASS
• PV
•WIND
• HYDRO
• NUCLEAR
• DIESEL
• OIL
• NATURAL GAS
• LIGNITE
• COAL
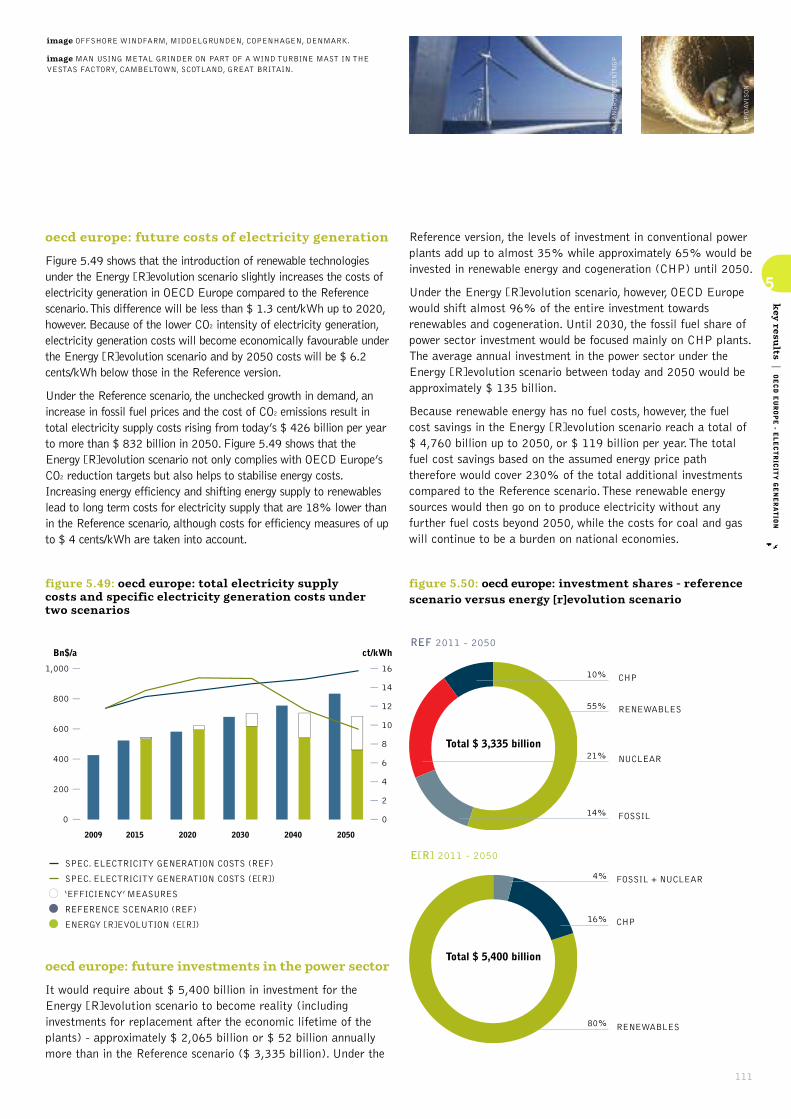
111
5
key resu
lts|OECD EUROPE - E
LECTRICITY GENERATION
oecd europe: future costs of electricity generation
Figure 5.49 shows that the introduction of renewable technologiesunder the Energy [R]evolution scenario slightly increases the costs ofelectricity generation in OECD Europe compared to the Referencescenario. This difference will be less than $ 1.3 cent/kWh up to 2020,however. Because of the lower CO2 intensity of electricity generation,electricity generation costs will become economically favourable underthe Energy [R]evolution scenario and by 2050 costs will be $ 6.2cents/kWh below those in the Reference version.
Under the Reference scenario, the unchecked growth in demand, anincrease in fossil fuel prices and the cost of CO2 emissions result intotal electricity supply costs rising from today’s $ 426 billion per yearto more than $ 832 billion in 2050. Figure 5.49 shows that theEnergy [R]evolution scenario not only complies with OECD Europe’sCO2 reduction targets but also helps to stabilise energy costs.Increasing energy efficiency and shifting energy supply to renewableslead to long term costs for electricity supply that are 18% lower thanin the Reference scenario, although costs for efficiency measures of upto $ 4 cents/kWh are taken into account.
figure 5.49: oecd europe: total electricity supply costs and specific electricity generation costs under two scenarios
0
200
400
600
800
1,000
2009 2015 2020 2030 2040 2050
0
2
4
6
8
10
12
14
16
ct/kWhBn$/a
SPEC. ELECTRICITY GENERATION COSTS (REF)
SPEC. ELECTRICITY GENERATION COSTS (E[R])
• ‘EFFICIENCY’ MEASURES
• REFERENCE SCENARIO (REF)
• ENERGY [R]EVOLUTION (E[R])
oecd europe: future investments in the power sector
It would require about $ 5,400 billion in investment for theEnergy [R]evolution scenario to become reality (includinginvestments for replacement after the economic lifetime of theplants) - approximately $ 2,065 billion or $ 52 billion annuallymore than in the Reference scenario ($ 3,335 billion). Under the
Reference version, the levels of investment in conventional powerplants add up to almost 35% while approximately 65% would beinvested in renewable energy and cogeneration (CHP) until 2050.
Under the Energy [R]evolution scenario, however, OECD Europewould shift almost 96% of the entire investment towardsrenewables and cogeneration. Until 2030, the fossil fuel share ofpower sector investment would be focused mainly on CHP plants.The average annual investment in the power sector under theEnergy [R]evolution scenario between today and 2050 would beapproximately $ 135 billion.
Because renewable energy has no fuel costs, however, the fuelcost savings in the Energy [R]evolution scenario reach a total of$ 4,760 billion up to 2050, or $ 119 billion per year. The totalfuel cost savings based on the assumed energy price paththerefore would cover 230% of the total additional investmentscompared to the Reference scenario. These renewable energysources would then go on to produce electricity without anyfurther fuel costs beyond 2050, while the costs for coal and gaswill continue to be a burden on national economies.
figure 5.50: oecd europe: investment shares - referencescenario versus energy [r]evolution scenario
REF 2011 - 2050
14% FOSSIL
21% NUCLEAR
10% CHP
55% RENEWABLES
Total $ 3,335 billion
E[R] 2011 - 2050
4% FOSSIL + NUCLEAR
16% CHP
80% RENEWABLES
Total $ 5,400 billion
© GP/DAVISON
© LANGROCK/ZENIT/GP
image OFFSHORE WINDFARM, MIDDELGRUNDEN, COPENHAGEN, DENMARK.
image MAN USING METAL GRINDER ON PART OF A WIND TURBINE MAST IN THEVESTAS FACTORY, CAMBELTOWN, SCOTLAND, GREAT BRITAIN.

112
5
key resu
lts|OECD EUROPE - H
EATING
WORLD ENERGY [R]EVOLUTIONA SUSTAINABLE WORLD ENERGY OUTLOOK
GLOBAL SCENARIO OECD NORTH AMERICALATIN AMERICAOECD EUROPE AFRICA
MIDDLE EASTEASTERN EUROPE/EURASIAINDIA
NON OECD ASIACHINAOECD ASIA OCEANIA
oecd europe
oecd europe: heating supply
Renewables currently provide 14% of OECD Europe’s energydemand for heat supply, the main contribution coming from theuse of biomass. The lack of district heating networks is a severestructural barrier to the large scale utilisation of geothermal andsolar thermal energy. In the Energy [R]evolution scenario,renewables provide 48% of OECD Europe’s total heat demand in2030 and 92% in 2050.
• Energy efficiency measures can decrease the current total demandfor heat supply by at least 10%, in spite of growing populationand economic activities and improving living standards.
• For direct heating, solar collectors, biomass/biogas as well asgeothermal energy are increasingly substituting for fossil fuel-fired systems.
• The introduction of strict efficiency measures e.g. via strictbuilding standards and ambitious support programs forrenewable heating systems are needed to achieve economies ofscale within the next 5 to 10 years.
Table 5.20 shows the development of the different renewabletechnologies for heating in OECD Europe over time. Up to 2020biomass will remain the main contributors of the growing marketshare. After 2020, the continuing growth of solar collectors anda growing share of geothermal heat pumps will reduce thedependence on fossil fuels.
table 5.20: oecd europe: renewable heating capacitiesunder the reference scenario and the energy [r]evolution scenario IN GW
2020
3,2914,170
204954
2611,345
00
3,7566,469
2040
4,4564,061
4594,441
4755,012
037
5,39013,551
2050
4,9073,580
5865,675
5686,741
0204
6,06116,199
Biomass
Solarcollectors
Geothermal
Hydrogen
Total
REFE[R]
REFE[R]
REFE[R]
REFE[R]
REFE[R]
2030
3,8654,265
3322,697
3362,781
01
4,5339,744
2009
2,4132,413
6464
186186
00
2,6622,662
figure 5.51: oecd europe: heat supply structure under the reference scenario and the energy [r]evolution scenario(‘EFFICIENCY’ = REDUCTION COMPARED TO THE REFERENCE SCENARIO)
REF E[R]
2009
REF E[R]
2015
REF E[R]
2020
REF E[R]
2030
REF E[R]
2040
REF E[R]
2050
PJ/a 0
5,000
10,000
15,000
20,000
25,000
30,000
•‘EFFICIENCY’
• HYDROGEN
• GEOTHERMAL
• SOLAR
• BIOMASS
• FOSSIL

113
5
key resu
lts|OECD EUROPE - IN
VESTMENT
oecd europe: future investments in the heat sector
Also in the heat sector the Energy [R]evolution scenario wouldrequire a major revision of current investment strategies in heatingtechnologies. Especially the not yet so common solar, geothermaland heat pump technologies need enormous increase ininstallations, if these potentials are to be tapped for the heatsector. Installed capacity needs to be increased by a factor of 70for solar thermal and even by the factor of 510 for geothermal andheat pumps. Capacity of biomass technologies, which are alreadyrather wide spread still need to remain a pillar of heat supply.
Renewable heating technologies are extremely variable, from lowtech biomass stoves and unglazed solar collectors to verysophisticated enhanced geothermal systems and solar thermaldistrict heating plants with seasonal storage.Thus it can onlyroughly be calculated, that the Energy [R]evolution scenario intotal requires around $ 3,896 billion to be invested in renewableheating technologies until 2050 (including investments forreplacement after the economic lifetime of the plants) -approximately $ 97 billion per year. Due to a lack of (regional)information on costs for conventional heating systems and fuelprices, total investments and fuel cost savings for the heat supplyin the scenarios have not been estimated.
table 5.21: oecd europe: renewable heat generationcapacities under the reference scenario and the energy [r]evolution scenario IN GW
2020
481523
193
67279
45114
5931,009
2040
653435
1396
1501,209
84296
8882,336
2050
709354
1495
1911,513
101420
1,0022,782
Biomass
Geothermal
Solar thermal
Heat pumps
Total
REFE[R]
REFE[R]
REFE[R]
REFE[R]
REFE[R]
2030
569506
1214
108781
58204
7371,705
2009
390390
11
2121
3232
443443
figure 5.52: oecd europe: investments for renewable heat generation technologies under the reference scenario and the energy [r]evolution scenario
REF 2011 - 2050
23% SOLAR
0% GEOTHERMAL
58% BIOMASS
19% HEAT PUMPSTotal $ 1,163 billion
E[R] 2011 - 2050
50% SOLAR
27% HEAT PUMPS
8% BIOMASS
15% GEOTHERMAL
Total $ 3,896 billion
© PAUL LANGROCK/ZENIT/GP
© GP/DANIEL BELTRA
image INSTALLATION AND TESTING OF A WINDPOWER STATION IN RYSUMERNACKEN NEAR EMDEN WHICH IS MADE FOR OFFSHORE USAGE ONSHORE. A WORKERCONTROLS THE SECURITY LIGHTS AT DARK.
image THE MARANCHON WIND FARM IS THE LARGEST IN EUROPE WITH 104GENERATORS, AND IS OPERATED BY IBERDROLA, THE LARGEST WIND ENERGYCOMPANY IN THE WORLD.
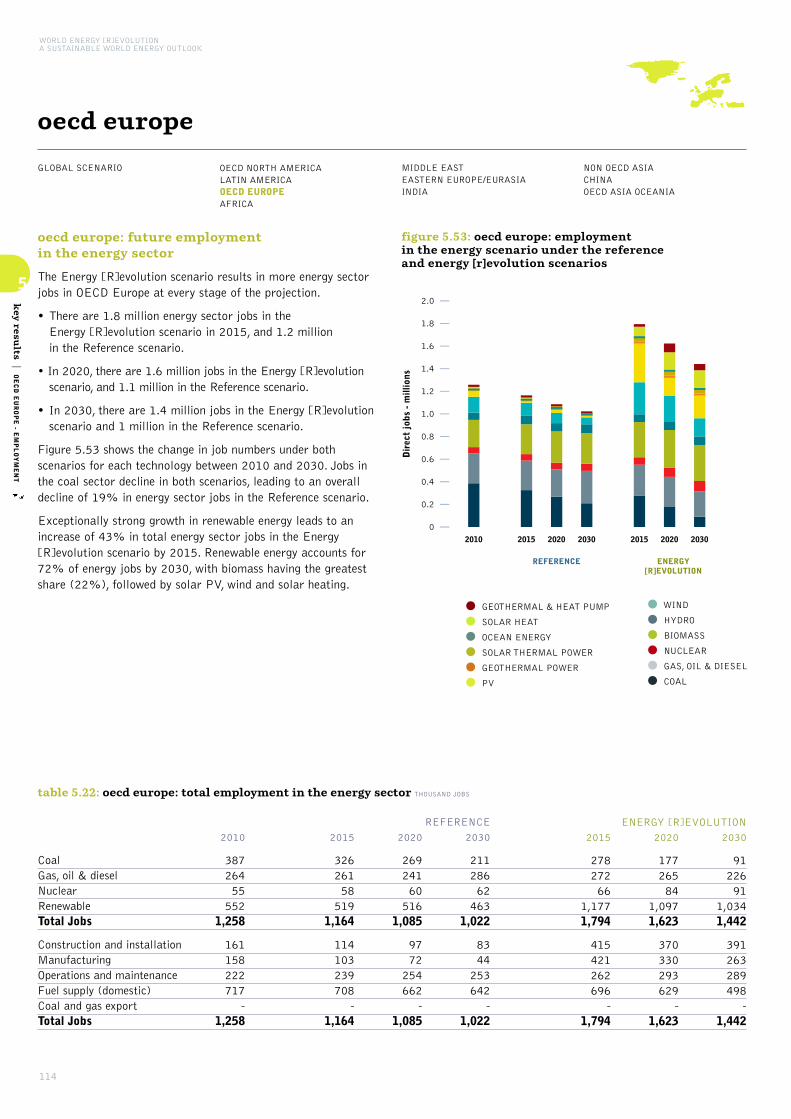
114
5
key resu
lts|OECD EUROPE - E
MPLOYMENT
WORLD ENERGY [R]EVOLUTIONA SUSTAINABLE WORLD ENERGY OUTLOOK
GLOBAL SCENARIO OECD NORTH AMERICALATIN AMERICAOECD EUROPE AFRICA
MIDDLE EASTEASTERN EUROPE/EURASIAINDIA
NON OECD ASIACHINAOECD ASIA OCEANIA
oecd europe
oecd europe: future employment in the energy sector
The Energy [R]evolution scenario results in more energy sectorjobs in OECD Europe at every stage of the projection.
• There are 1.8 million energy sector jobs in the Energy [R]evolution scenario in 2015, and 1.2 million in the Reference scenario.
• In 2020, there are 1.6 million jobs in the Energy [R]evolutionscenario, and 1.1 million in the Reference scenario.
• In 2030, there are 1.4 million jobs in the Energy [R]evolutionscenario and 1 million in the Reference scenario.
Figure 5.53 shows the change in job numbers under bothscenarios for each technology between 2010 and 2030. Jobs inthe coal sector decline in both scenarios, leading to an overalldecline of 19% in energy sector jobs in the Reference scenario.
Exceptionally strong growth in renewable energy leads to anincrease of 43% in total energy sector jobs in the Energy[R]evolution scenario by 2015. Renewable energy accounts for72% of energy jobs by 2030, with biomass having the greatestshare (22%), followed by solar PV, wind and solar heating.
REFERENCE ENERGY[R]EVOLUTION
2010 2015 2020 2030 2015 2020 2030
0
0.2
0.4
0.6
0.8
1.0
1.2
1.4
1.6
1.8
2.0
Dir
ect
jobs
- m
illio
ns
figure 5.53: oecd europe: employment in the energy scenario under the reference and energy [r]evolution scenarios
•GEOTHERMAL & HEAT PUMP
• SOLAR HEAT
• OCEAN ENERGY
• SOLAR THERMAL POWER
• GEOTHERMAL POWER
• PV
•WIND
• HYDRO
• BIOMASS
• NUCLEAR
• GAS, OIL & DIESEL
• COAL
table 5.22: oecd europe: total employment in the energy sector THOUSAND JOBS
CoalGas, oil & dieselNuclearRenewableTotal Jobs
Construction and installationManufacturingOperations and maintenanceFuel supply (domestic)Coal and gas exportTotal Jobs
2015
27827266
1,1771,794
415421262696
-1,794
2020
17726584
1,0971,623
370330293629
-1,623
2030
9122691
1,0341,442
391263289498
-1,442
ENERGY [R]EVOLUTION
2015
32626158519
1,164
114103239708
-1,164
2010
38726455552
1,258
161158222717
-1,258
2020
26924160516
1,085
9772254662
-1,085
2030
21128662463
1,022
8344253642
-1,022
REFERENCE
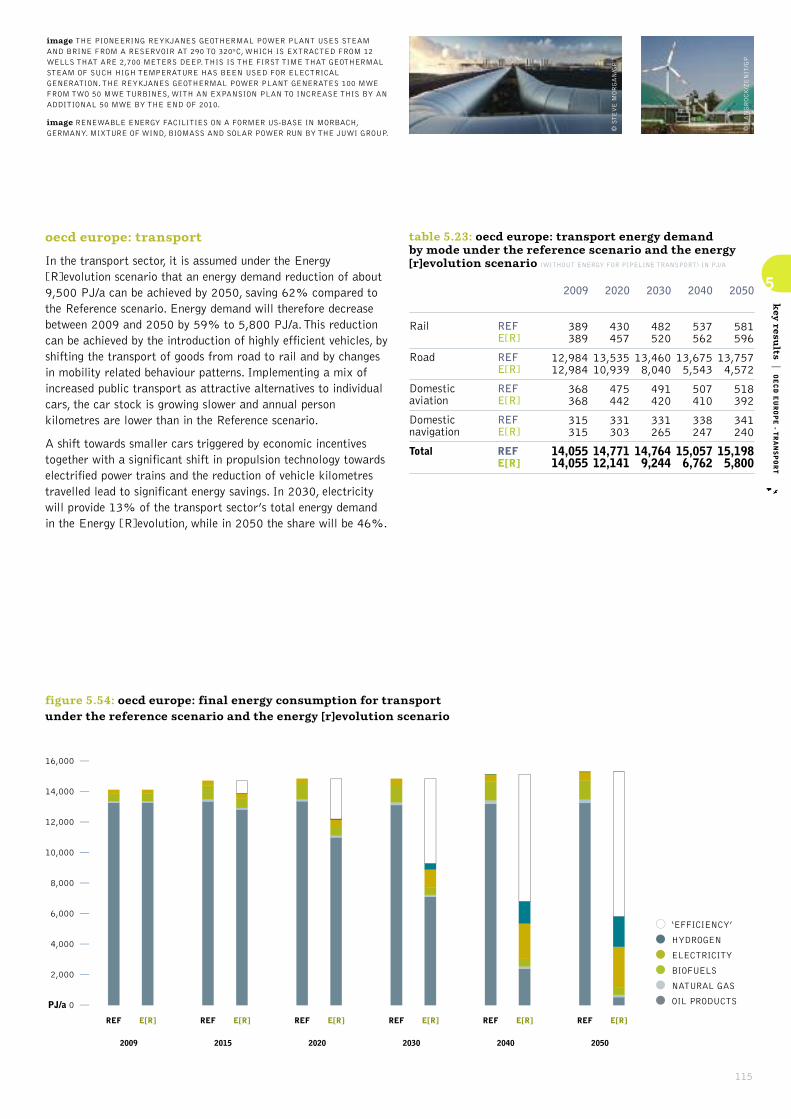
115
5
key resu
lts|OECD EUROPE - T
RANSPORT
oecd europe: transport
In the transport sector, it is assumed under the Energy[R]evolution scenario that an energy demand reduction of about9,500 PJ/a can be achieved by 2050, saving 62% compared tothe Reference scenario. Energy demand will therefore decreasebetween 2009 and 2050 by 59% to 5,800 PJ/a. This reductioncan be achieved by the introduction of highly efficient vehicles, byshifting the transport of goods from road to rail and by changesin mobility related behaviour patterns. Implementing a mix ofincreased public transport as attractive alternatives to individualcars, the car stock is growing slower and annual personkilometres are lower than in the Reference scenario.
A shift towards smaller cars triggered by economic incentivestogether with a significant shift in propulsion technology towardselectrified power trains and the reduction of vehicle kilometrestravelled lead to significant energy savings. In 2030, electricitywill provide 13% of the transport sector’s total energy demandin the Energy [R]evolution, while in 2050 the share will be 46%.
table 5.23: oecd europe: transport energy demand by mode under the reference scenario and the energy[r]evolution scenario (WITHOUT ENERGY FOR PIPELINE TRANSPORT) IN PJ/A
2020
430457
13,53510,939
475442
331303
14,77112,141
2040
537562
13,6755,543
507410
338247
15,0576,762
2050
581596
13,7574,572
518392
341240
15,1985,800
Rail
Road
Domesticaviation
Domesticnavigation
Total
REFE[R]
REFE[R]
REFE[R]
REFE[R]
REFE[R]
2030
482520
13,4608,040
491420
331265
14,7649,244
2009
389389
12,98412,984
368368
315315
14,05514,055
figure 5.54: oecd europe: final energy consumption for transport under the reference scenario and the energy [r]evolution scenario
PJ/a 0
2,000
4,000
6,000
8,000
10,000
12,000
14,000
16,000
REF REF REF REF REF REFE[R] E[R] E[R] E[R] E[R] E[R]
2009 2015 2020 2030 2040 2050
•‘EFFICIENCY’
• HYDROGEN
• ELECTRICITY
• BIOFUELS
• NATURAL GAS
• OIL PRODUCTS
•WIND
• HYDRO
• BIOMASS
• NUCLEAR
• GAS, OIL & DIESEL
• COAL
© LANGROCK/ZENIT/GP
© STEVE MORGAN/GP
image THE PIONEERING REYKJANES GEOTHERMAL POWER PLANT USES STEAMAND BRINE FROM A RESERVOIR AT 290 TO 320ºC, WHICH IS EXTRACTED FROM 12WELLS THAT ARE 2,700 METERS DEEP. THIS IS THE FIRST TIME THAT GEOTHERMALSTEAM OF SUCH HIGH TEMPERATURE HAS BEEN USED FOR ELECTRICALGENERATION. THE REYKJANES GEOTHERMAL POWER PLANT GENERATES 100 MWEFROM TWO 50 MWE TURBINES, WITH AN EXPANSION PLAN TO INCREASE THIS BY ANADDITIONAL 50 MWE BY THE END OF 2010.
image RENEWABLE ENERGY FACILITIES ON A FORMER US-BASE IN MORBACH,GERMANY. MIXTURE OF WIND, BIOMASS AND SOLAR POWER RUN BY THE JUWI GROUP.

116
5
key resu
lts|OECD EUROPE - C
O2EMISSIONS & ENERGY CONSUMPTION
WORLD ENERGY [R]EVOLUTIONA SUSTAINABLE WORLD ENERGY OUTLOOK
GLOBAL SCENARIO OECD NORTH AMERICALATIN AMERICAOECD EUROPE AFRICA
MIDDLE EASTEASTERN EUROPE/EURASIAINDIA
NON OECD ASIACHINAOECD ASIA OCEANIA
oecd europe
oecd europe: development of CO2 emissions
While CO2 emissions in OECD Europe will decrease by 4% in theReference scenario, under the Energy [R]evolution scenario theywill decrease from around 3,800 million tonnes in 2009 to 192million tonnes in 2050. Annual per capita emissions will drop from6.8 tonnes to 2.9 tonnes in 2030 and 0.3 tonne in 2050. In spiteof the phasing out of nuclear energy and increasing demand, CO2
emissions will decrease in the electricity sector. In the long runefficiency gains and the increased use of renewable electricity invehicles will reduce emissions in the transport sector. With a shareof 28% of CO2 emissions in 2050, the power sector will drop belowtransport and other sectors as the largest sources of emissions. By2050, OECD Europe’s CO2 emissions are 5% of 1990 levels.
oecd europe: primary energy consumption
Taking into account the assumptions discussed above, theresulting primary energy consumption under the Energy[R]evolution scenario is shown in Figure 5.56. Compared to theReference scenario, overall primary energy demand will bereduced by 43% in 2050. Around 85% of the remaining demandwill be covered by renewable energy sources.
The Energy [R]evolution version phases out coal and oil about10 to 15 years faster than the previous Energy [R]evolutionscenario published in 2010. This is made possible mainly by thereplacement of coal power plants with renewables and a fasterintroduction of very efficient electric vehicles in the transport
sector to replace oil combustion engines. This leads to an overallrenewable primary energy share of 46% in 2030 and 85% in2050. Nuclear energy is phased out just after 2030.
figure 5.55: oecd europe: development of CO2 emissionsby sector under the energy [r]evolution scenario(‘EFFICIENCY’ = REDUCTION COMPARED TO THE REFERENCE SCENARIO)
REF REF REF REF REF REFE[R] E[R] E[R] E[R] E[R] E[R]
2009 2015 2020 2030 2040 2050
0
1,000
2,000
3,000
4,000
0
100
200
300
400
500
600
Mill t/aMillion people
POPULATION DEVELOPMENT
• SAVINGS FROM ‘EFFICIENCY’ & RENEWABLES
• OTHER SECTORS
• INDUSTRY
•TRANSPORT
• POWER GENERATION
figure 5.56: oecd europe: primary energy consumption under the reference scenario and the energy [r]evolution scenario (‘EFFICIENCY’ = REDUCTION COMPARED TO THE REFERENCE SCENARIO)
PJ/a 0
10,000
20,000
30,000
40,000
50,000
60,000
70,000
80,000
90,000
REF REF REF REF REF REFE[R] E[R] E[R] E[R] E[R] E[R]
2009 2015 2020 2030 2040 2050
•‘EFFICIENCY’
• OCEAN ENERGY
• GEOTHERMAL
• SOLAR
• BIOMASS
•WIND
• HYDRO
• NATURAL GAS
• OIL
• COAL
• NUCLEAR
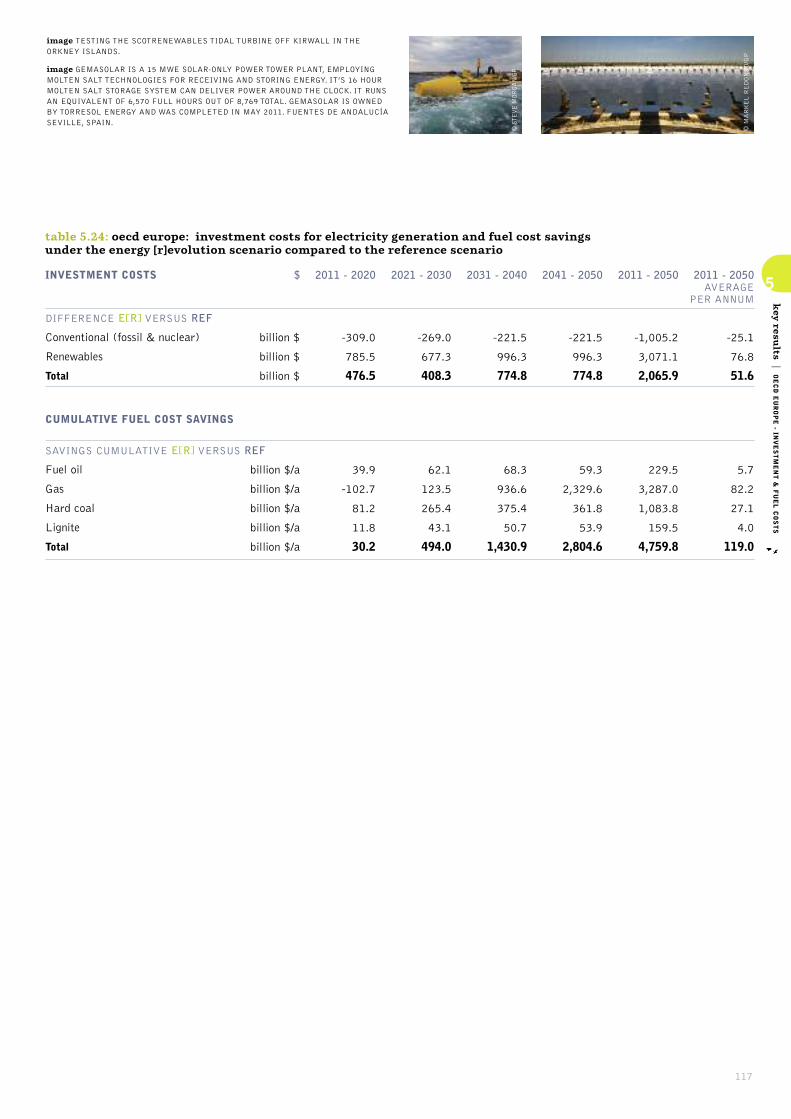
117
5
key resu
lts|OECD EUROPE - IN
VESTMENT & FUEL COSTS
table 5.24: oecd europe: investment costs for electricity generation and fuel cost savings under the energy [r]evolution scenario compared to the reference scenario
INVESTMENT COSTS
DIFFERENCE E[R] VERSUS REF
Conventional (fossil & nuclear)
Renewables
Total
CUMULATIVE FUEL COST SAVINGS
SAVINGS CUMULATIVE E[R] VERSUS REF
Fuel oil
Gas
Hard coal
Lignite
Total
$
billion $
billion $
billion $
billion $/a
billion $/a
billion $/a
billion $/a
billion $/a
2021 - 2030
-269.0
677.3
408.3
62.1
123.5
265.4
43.1
494.0
2011 - 2020
-309.0
785.5
476.5
39.9
-102.7
81.2
11.8
30.2
2011 - 2050
-1,005.2
3,071.1
2,065.9
229.5
3,287.0
1,083.8
159.5
4,759.8
2011 - 2050 AVERAGE
PER ANNUM
-25.1
76.8
51.6
5.7
82.2
27.1
4.0
119.0
2041 - 2050
-221.5
996.3
774.8
59.3
2,329.6
361.8
53.9
2,804.6
2031 - 2040
-221.5
996.3
774.8
68.3
936.6
375.4
50.7
1,430.9
© STEVE MORGAN/GP
© MARKEL REDONDO/GP
image TESTING THE SCOTRENEWABLES TIDAL TURBINE OFF KIRWALL IN THEORKNEY ISLANDS.
image GEMASOLAR IS A 15 MWE SOLAR-ONLY POWER TOWER PLANT, EMPLOYINGMOLTEN SALT TECHNOLOGIES FOR RECEIVING AND STORING ENERGY. IT’S 16 HOURMOLTEN SALT STORAGE SYSTEM CAN DELIVER POWER AROUND THE CLOCK. IT RUNSAN EQUIVALENT OF 6,570 FULL HOURS OUT OF 8,769 TOTAL. GEMASOLAR IS OWNEDBY TORRESOL ENERGY AND WAS COMPLETED IN MAY 2011. FUENTES DE ANDALUCÍASEVILLE, SPAIN.
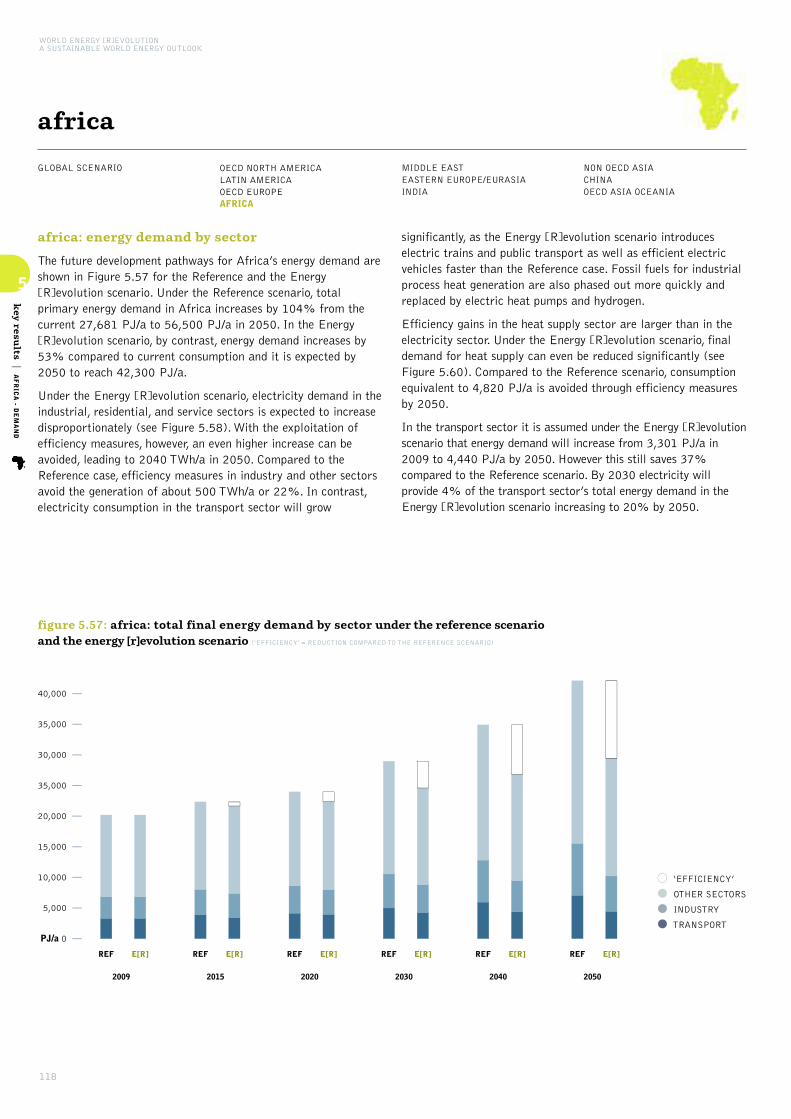
118
5
key resu
lts|AFRICA - D
EMAND
WORLD ENERGY [R]EVOLUTIONA SUSTAINABLE WORLD ENERGY OUTLOOK
GLOBAL SCENARIO OECD NORTH AMERICALATIN AMERICAOECD EUROPE AFRICA
MIDDLE EASTEASTERN EUROPE/EURASIAINDIA
NON OECD ASIACHINAOECD ASIA OCEANIA
africa
africa: energy demand by sector
The future development pathways for Africa’s energy demand areshown in Figure 5.57 for the Reference and the Energy[R]evolution scenario. Under the Reference scenario, totalprimary energy demand in Africa increases by 104% from thecurrent 27,681 PJ/a to 56,500 PJ/a in 2050. In the Energy[R]evolution scenario, by contrast, energy demand increases by53% compared to current consumption and it is expected by2050 to reach 42,300 PJ/a.
Under the Energy [R]evolution scenario, electricity demand in theindustrial, residential, and service sectors is expected to increasedisproportionately (see Figure 5.58). With the exploitation ofefficiency measures, however, an even higher increase can beavoided, leading to 2040 TWh/a in 2050. Compared to theReference case, efficiency measures in industry and other sectorsavoid the generation of about 500 TWh/a or 22%. In contrast,electricity consumption in the transport sector will grow
significantly, as the Energy [R]evolution scenario introduceselectric trains and public transport as well as efficient electricvehicles faster than the Reference case. Fossil fuels for industrialprocess heat generation are also phased out more quickly andreplaced by electric heat pumps and hydrogen.
Efficiency gains in the heat supply sector are larger than in theelectricity sector. Under the Energy [R]evolution scenario, finaldemand for heat supply can even be reduced significantly (seeFigure 5.60). Compared to the Reference scenario, consumptionequivalent to 4,820 PJ/a is avoided through efficiency measuresby 2050.
In the transport sector it is assumed under the Energy [R]evolutionscenario that energy demand will increase from 3,301 PJ/a in2009 to 4,440 PJ/a by 2050. However this still saves 37%compared to the Reference scenario. By 2030 electricity willprovide 4% of the transport sector’s total energy demand in theEnergy [R]evolution scenario increasing to 20% by 2050.
figure 5.57: africa: total final energy demand by sector under the reference scenario and the energy [r]evolution scenario (‘EFFICIENCY’ = REDUCTION COMPARED TO THE REFERENCE SCENARIO)
• ‘EFFICIENCY’
• OTHER SECTORS
• INDUSTRY
•TRANSPORT
PJ/a 0
5,000
10,000
15,000
20,000
35,000
30,000
35,000
40,000
REF REF REF REF REF REFE[R] E[R] E[R] E[R] E[R] E[R]
2009 2015 2020 2030 2040 2050
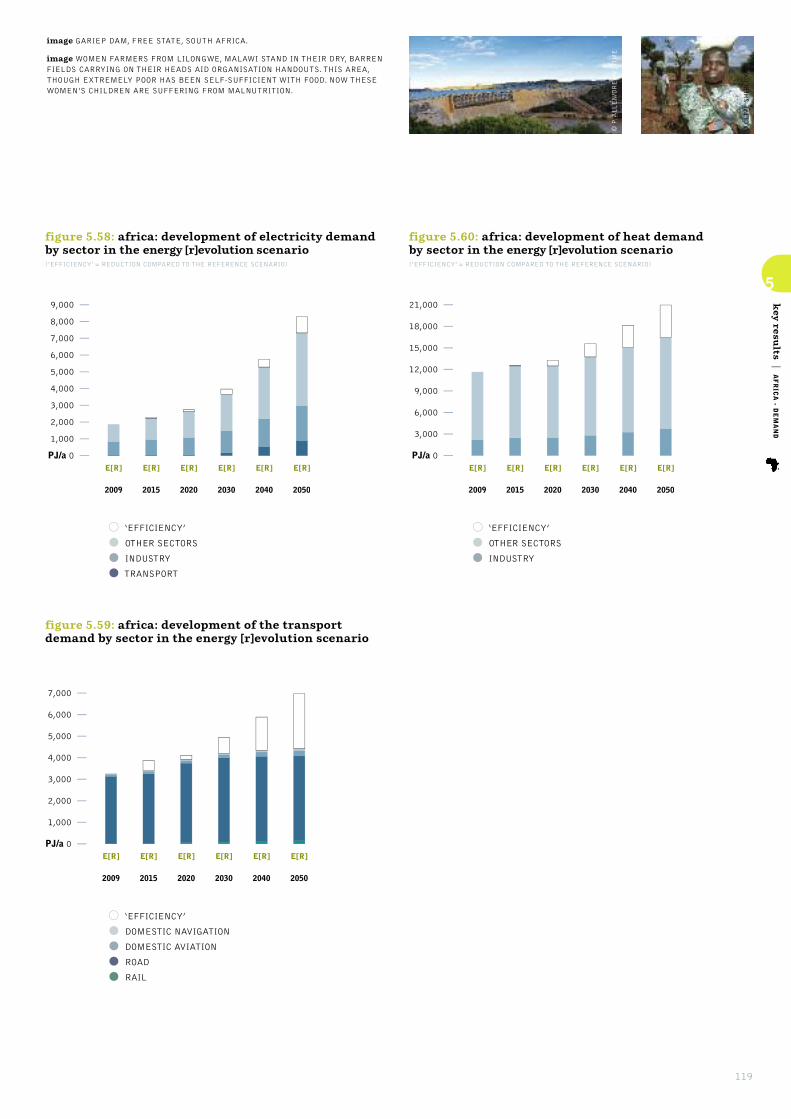
119
5
key resu
lts|AFRICA - D
EMAND
figure 5.58: africa: development of electricity demandby sector in the energy [r]evolution scenario(‘EFFICIENCY’ = REDUCTION COMPARED TO THE REFERENCE SCENARIO)
• ‘EFFICIENCY’
• OTHER SECTORS
• INDUSTRY
•TRANSPORT
E[R] E[R] E[R] E[R] E[R] E[R]
2009 2015 2020 2030 2040 2050
PJ/a 0
1,000
2,000
3,000
4,000
5,000
6,000
7,000
figure 5.59: africa: development of the transportdemand by sector in the energy [r]evolution scenario
•‘EFFICIENCY’
• DOMESTIC NAVIGATION
• DOMESTIC AVIATION
• ROAD
• RAIL
E[R] E[R] E[R] E[R] E[R] E[R]
2009 2015 2020 2030 2040 2050
PJ/a 0
1,000
2,000
3,000
4,000
5,000
6,000
7,000
8,000
9,000
E[R] E[R] E[R] E[R] E[R] E[R]
2009 2015 2020 2030 2040 2050
PJ/a 0
3,000
6,000
9,000
12,000
15,000
18,000
21,000
figure 5.60: africa: development of heat demand by sector in the energy [r]evolution scenario(‘EFFICIENCY’ = REDUCTION COMPARED TO THE REFERENCE SCENARIO)
• ‘EFFICIENCY’
• OTHER SECTORS
• INDUSTRY
© CLIVE SHIRLEY/GP
© P. ALLEN/DREAMSTIME
image GARIEP DAM, FREE STATE, SOUTH AFRICA.
image WOMEN FARMERS FROM LILONGWE, MALAWI STAND IN THEIR DRY, BARRENFIELDS CARRYING ON THEIR HEADS AID ORGANISATION HANDOUTS. THIS AREA,THOUGH EXTREMELY POOR HAS BEEN SELF-SUFFICIENT WITH FOOD. NOW THESEWOMEN’S CHILDREN ARE SUFFERING FROM MALNUTRITION.
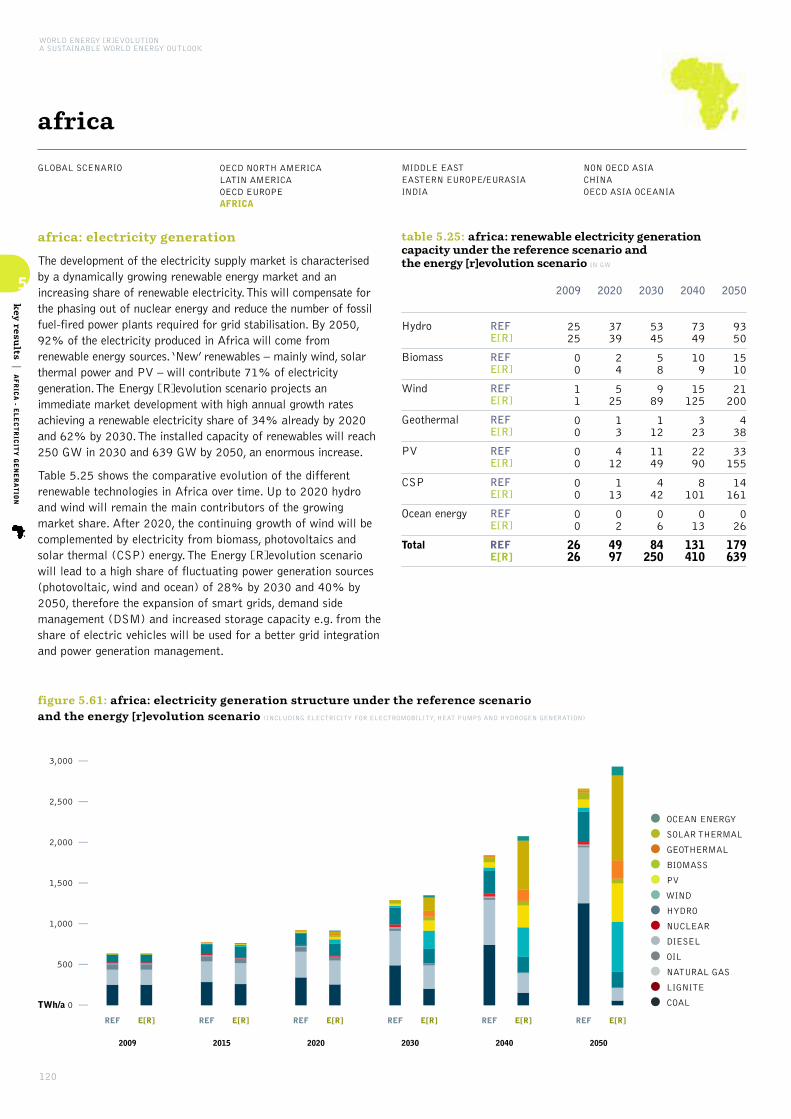
120
5
key resu
lts|AFRICA - E
LECTRICITY GENERATION
WORLD ENERGY [R]EVOLUTIONA SUSTAINABLE WORLD ENERGY OUTLOOK
GLOBAL SCENARIO OECD NORTH AMERICALATIN AMERICAOECD EUROPE AFRICA
MIDDLE EASTEASTERN EUROPE/EURASIAINDIA
NON OECD ASIACHINAOECD ASIA OCEANIA
africa
africa: electricity generation
The development of the electricity supply market is characterisedby a dynamically growing renewable energy market and anincreasing share of renewable electricity. This will compensate forthe phasing out of nuclear energy and reduce the number of fossilfuel-fired power plants required for grid stabilisation. By 2050,92% of the electricity produced in Africa will come fromrenewable energy sources. ‘New’ renewables – mainly wind, solarthermal power and PV – will contribute 71% of electricitygeneration. The Energy [R]evolution scenario projects animmediate market development with high annual growth ratesachieving a renewable electricity share of 34% already by 2020and 62% by 2030. The installed capacity of renewables will reach250 GW in 2030 and 639 GW by 2050, an enormous increase.
Table 5.25 shows the comparative evolution of the differentrenewable technologies in Africa over time. Up to 2020 hydroand wind will remain the main contributors of the growingmarket share. After 2020, the continuing growth of wind will becomplemented by electricity from biomass, photovoltaics andsolar thermal (CSP) energy. The Energy [R]evolution scenariowill lead to a high share of fluctuating power generation sources(photovoltaic, wind and ocean) of 28% by 2030 and 40% by2050, therefore the expansion of smart grids, demand sidemanagement (DSM) and increased storage capacity e.g. from theshare of electric vehicles will be used for a better grid integrationand power generation management.
table 5.25: africa: renewable electricity generationcapacity under the reference scenario and the energy [r]evolution scenario IN GW
2020
3739
24
525
13
412
113
02
4997
2040
7349
109
15125
323
2290
8101
013
131410
2050
9350
1510
21200
438
33155
14161
026
179639
Hydro
Biomass
Wind
Geothermal
PV
CSP
Ocean energy
Total
REFE[R]
REFE[R]
REFE[R]
REFE[R]
REFE[R]
REFE[R]
REFE[R]
REFE[R]
2030
5345
58
989
112
1149
442
06
84250
2009
2525
00
11
00
00
00
00
2626
figure 5.61: africa: electricity generation structure under the reference scenario and the energy [r]evolution scenario (INCLUDING ELECTRICITY FOR ELECTROMOBILITY, HEAT PUMPS AND HYDROGEN GENERATION)
TWh/a 0
500
1,000
1,500
2,000
2,500
3,000
REF REF REF REF REF REFE[R] E[R] E[R] E[R] E[R] E[R]
2009 2015 2020 2030 2040 2050
•OCEAN ENERGY
• SOLAR THERMAL
• GEOTHERMAL
• BIOMASS
• PV
•WIND
• HYDRO
• NUCLEAR
• DIESEL
• OIL
• NATURAL GAS
• LIGNITE
• COAL
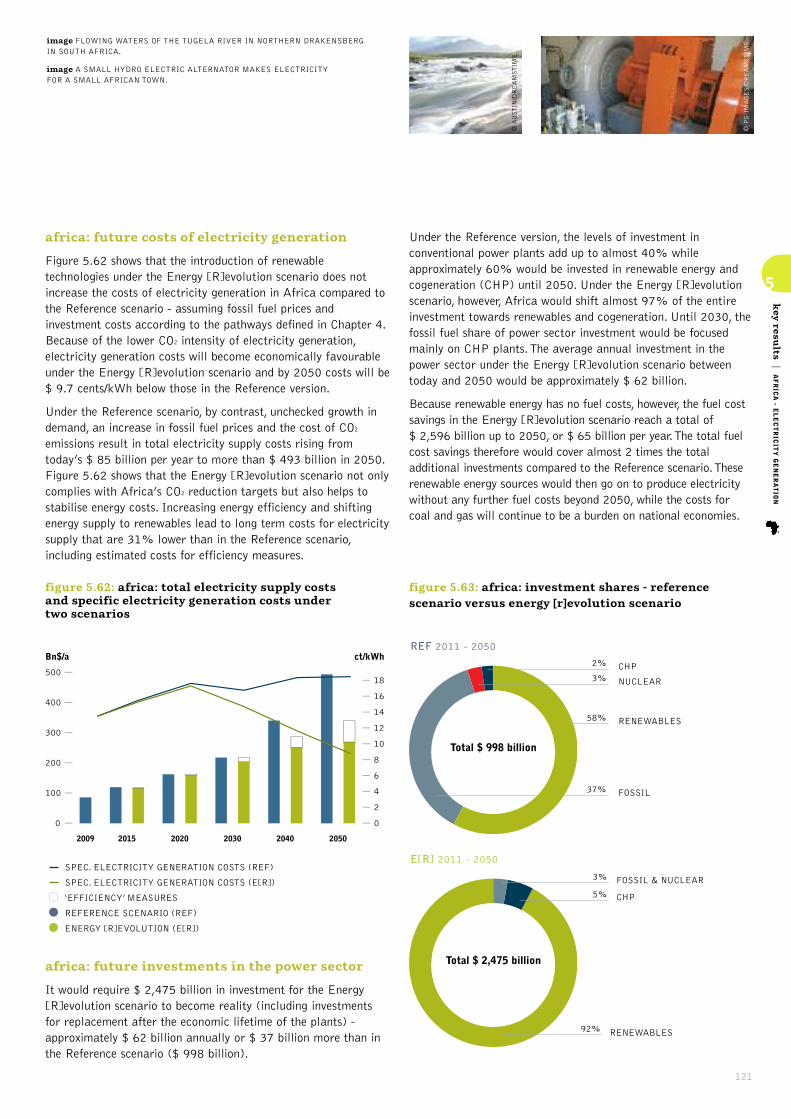
121
5
key resu
lts|AFRICA - E
LECTRICITY GENERATION
africa: future costs of electricity generation
Figure 5.62 shows that the introduction of renewabletechnologies under the Energy [R]evolution scenario does notincrease the costs of electricity generation in Africa compared tothe Reference scenario - assuming fossil fuel prices andinvestment costs according to the pathways defined in Chapter 4.Because of the lower CO2 intensity of electricity generation,electricity generation costs will become economically favourableunder the Energy [R]evolution scenario and by 2050 costs will be$ 9.7 cents/kWh below those in the Reference version.
Under the Reference scenario, by contrast, unchecked growth indemand, an increase in fossil fuel prices and the cost of CO2
emissions result in total electricity supply costs rising fromtoday’s $ 85 billion per year to more than $ 493 billion in 2050.Figure 5.62 shows that the Energy [R]evolution scenario not onlycomplies with Africa’s CO2 reduction targets but also helps tostabilise energy costs. Increasing energy efficiency and shiftingenergy supply to renewables lead to long term costs for electricitysupply that are 31% lower than in the Reference scenario,including estimated costs for efficiency measures.
figure 5.62: africa: total electricity supply costs and specific electricity generation costs under two scenarios
0
100
200
300
400
500
2009 2015 2020 2030 2040 2050
0
2
4
6
8
10
12
14
16
18
ct/kWhBn$/a
SPEC. ELECTRICITY GENERATION COSTS (REF)
SPEC. ELECTRICITY GENERATION COSTS (E[R])
• ‘EFFICIENCY’ MEASURES
• REFERENCE SCENARIO (REF)
• ENERGY [R]EVOLUTION (E[R])
africa: future investments in the power sector
It would require $ 2,475 billion in investment for the Energy[R]evolution scenario to become reality (including investmentsfor replacement after the economic lifetime of the plants) -approximately $ 62 billion annually or $ 37 billion more than inthe Reference scenario ($ 998 billion).
Under the Reference version, the levels of investment inconventional power plants add up to almost 40% whileapproximately 60% would be invested in renewable energy andcogeneration (CHP) until 2050. Under the Energy [R]evolutionscenario, however, Africa would shift almost 97% of the entireinvestment towards renewables and cogeneration. Until 2030, thefossil fuel share of power sector investment would be focusedmainly on CHP plants. The average annual investment in thepower sector under the Energy [R]evolution scenario betweentoday and 2050 would be approximately $ 62 billion.
Because renewable energy has no fuel costs, however, the fuel costsavings in the Energy [R]evolution scenario reach a total of $ 2,596 billion up to 2050, or $ 65 billion per year. The total fuelcost savings therefore would cover almost 2 times the totaladditional investments compared to the Reference scenario. Theserenewable energy sources would then go on to produce electricitywithout any further fuel costs beyond 2050, while the costs forcoal and gas will continue to be a burden on national economies.
figure 5.63: africa: investment shares - referencescenario versus energy [r]evolution scenario
REF 2011 - 2050
37% FOSSIL
3% NUCLEAR
2% CHP
58% RENEWABLES
Total $ 998 billion
E[R] 2011 - 2050
3% FOSSIL & NUCLEAR
5% CHP
92% RENEWABLES
Total $ 2,475 billion
© AUSTIN/DREAMSTIME
© PG-IMAGES/DREAMSTIMEimage FLOWING WATERS OF THE TUGELA RIVER IN NORTHERN DRAKENSBERG
IN SOUTH AFRICA.
image A SMALL HYDRO ELECTRIC ALTERNATOR MAKES ELECTRICITY FOR A SMALL AFRICAN TOWN.

122
5
key resu
lts|AFRICA - H
EATING
WORLD ENERGY [R]EVOLUTIONA SUSTAINABLE WORLD ENERGY OUTLOOK
GLOBAL SCENARIO OECD NORTH AMERICALATIN AMERICAOECD EUROPE AFRICA
MIDDLE EASTEASTERN EUROPE/EURASIAINDIA
NON OECD ASIACHINAOECD ASIA OCEANIA
africa
africa: heating supply
Today, renewables provide 79% of Africa’s energy demand forheat supply, the main contribution coming from the traditionaluse of biomass. Dedicated support instruments are required toensure a dynamic future development. In the Energy [R]evolutionscenario, renewables provide 84% of Africa’s total heat demandin 2030 and 93% in 2050.
• Energy efficiency measures will restrict the future energydemand for heat supply in 2020 to an increase of 18%compared to 34% in the Reference scenario, in spite ofimproving living standards.
• In the industry sector solar collectors, biomass/biogas as wellas geothermal energy are increasingly substituted forconventional fossil-fired heating systems.
• A shift from coal and oil to natural gas in the remainingconventional applications leads to a further reduction of CO2 emissions.
Table 5.26 shows the development of the different renewabletechnologies for heating in Africa over time. Biomass will remainthe main contributor of the growing market share. After 2020,the continuing growth of solar collectors and a growing share ofgeothermal energy and heat pumps will reduce the dependence onfossil fuels.
table 5.26: africa: renewable heating capacities under thereference scenario and the energy [r]evolution scenario INGW
2020
10,1698,999
8791
037
00
10,1789,827
2040
13,1968,698
1113,306
91,274
018
13,31513,296
2050
14,9007,893
1665,004
121,972
0208
15,07715,077
Biomass
Solarcollectors
Geothermal
Hydrogen
Total
REFE[R]
REFE[R]
REFE[R]
REFE[R]
REFE[R]
2030
11,5178,918
572,143
4517
00
11,57811,577
2009
9,1489,148
33
00
00
9,1509,150
figure 5.64: africa: heat supply structure under the reference scenario and the energy [r]evolution scenario (‘EFFICIENCY’ =
REDUCTION COMPARED TO THE REFERENCE SCENARIO)
PJ/a 0
3,000
6,000
9,000
12,000
15,000
18,000
21,000
REF REF REF REF REF REFE[R] E[R] E[R] E[R] E[R] E[R]
2009 2015 2020 2030 2040 2050
•‘EFFICIENCY’
• HYDROGEN
• GEOTHERMAL
• SOLAR
• BIOMASS
• FOSSIL
123
5
key resu
lts|AFRICA - IN
VESTMENT
africa: future investments in the heat sector
In the heat sector, the Energy [R]evolution scenario wouldrequire also a major revision of current investment strategies.Especially solar, geothermal and heat pump technologies need anenormous increase in installations, if these potentials are to betapped for the heat sector. Installed capacity for direct heating(excluding district heating and CHP) need to be increased up toaround 1,000 GW for solar thermal and up to 300 GW forgeothermal and heat pumps. Capacity of biomass use for heatsupply needs to remain a pillar of heat supply, however currenttraditional combustion systems need to be replaced by newefficient technologies.
Renewable heating technologies are extremely variable, from lowtech biomass stoves and unglazed solar collectors to verysophisticated enhanced geothermal systems and solar thermaldistrict heating plants with seasonal storage.Thus it can onlyroughly be calculated, that the Energy [R]evolution scenario intotal requires around $ 1,170 billion to be invested in renewabledirect heating technologies until 2050 (including investments forreplacement after the economic lifetime of the plants) -approximately $ 29 billion per year.
table 5.27: africa: renewable heat generation capacitiesunder the reference scenario and the energy [r]evolution scenario IN GW
2020
3,9833,513
02
2163
01
3,9853,679
2040
5,1283,360
013
23680
2173
5,1534,226
2050
5,7603,049
029
341,030
2251
5,7964,358
Biomass
Geothermal
Solar thermal
Heat pumps
Total
REFE[R]
REFE[R]
REFE[R]
REFE[R]
REFE[R]
2030
4,4973,431
08
12441
167
4,5093,948
2009
3,6433,643
00
11
00
3,6443,644
figure 5.65: africa: investments for renewable heat generation technologies under the reference scenario and the energy [r]evolution scenario
REF 2011 - 2050
1% SOLAR
0% GEOTHERMAL
99% BIOMASS
1% HEAT PUMPS
Total $ 977 billion
E[R] 2011 - 2050
31% SOLAR
47% HEAT PUMPS
15% BIOMASS
7% GEOTHERMAL
Total $ 1,170 billion
© ONEHEMISPHERE
© GP/RICHARD DOBSON
image MAMA SARA OBAMA, THE US PRESIDENT’S GRANDMOTHER, FLICKS ON THELIGHTS AFTER A GREENPEACE TEAM INSTALLED A SOLAR POWER SYSTEM AT HERHOME IN KOGELO VILLAGE.
image STORM OVER SODWANA BAY, SOUTH AFRICA.

124
5
key resu
lts|AFRICA - E
MPLOYMENT
WORLD ENERGY [R]EVOLUTIONA SUSTAINABLE WORLD ENERGY OUTLOOK
GLOBAL SCENARIO OECD NORTH AMERICALATIN AMERICAOECD EUROPE AFRICA
MIDDLE EASTEASTERN EUROPE/EURASIAINDIA
NON OECD ASIACHINAOECD ASIA OCEANIA
africa
africa: future employment in the energy sector
The Energy [R]evolution scenario results in more energy sectorjobs in Africa at every stage of the projection.
• There are 3.5 million energy sector jobs in the Energy [R]evolution scenario in 2015, and 2.8 million in the Reference scenario.
• In 2020, there are 3.7 million jobs in the Energy [R]evolutionscenario, and 3 million in the Reference scenario.
• In 2030, there are 3.5 million jobs in the Energy [R]evolutionscenario and 3.2 million in the Reference scenario.
Figure 5.66 shows the change in job numbers under bothscenarios for each technology between 2010 and 2030. Jobs inthe Reference scenario increase by 16% by 2030. Bionergyaccounts for the largest share of jobs in both scenarios.
Strong growth in renewable energy leads to an increase of 28%in energy sector jobs in the Energy [R]evolution scenario by2015. Energy jobs increase to 36% above 2010 levels by 2020,and are still 28% above 2010 levels in 2030. Renewable energyaccounts for 73% of energy sector jobs by 2030, with biomasshaving the largest share (46%), followed by solar heating.
REFERENCE ENERGY[R]EVOLUTION
2010 2015 2020 2030 2015 2020 2030
0
0.5
1.0
1.5
2.0
2.5
3.0
3.5
4.0
Dir
ect
jobs
- m
illio
ns
figure 5.66: africa: employment in the energy scenariounder the reference and energy [r]evolution scenarios
•GEOTHERMAL & HEAT PUMP
• SOLAR HEAT
• OCEAN ENERGY
• SOLAR THERMAL POWER
• GEOTHERMAL POWER
• PV
•WIND
• HYDRO
• BIOMASS
• NUCLEAR
• GAS, OIL & DIESEL
• COAL
table 5.28: africa: total employment in the energy sector THOUSAND JOBS
CoalGas, oil & dieselNuclearRenewableTotal Jobs
Construction and installationManufacturingOperations and maintenanceFuel supply (domestic)Coal and gas exportTotal Jobs
2015
761,076
12,3093,461
51414963
2,091.0645
3,461
2020
651,187
32,4123,667
614186114
2,048705
3,667
2030
538815
2,5393,478
595241219
2,049374
3,478
ENERGY [R]EVOLUTION
2015
1438379
1,8162,806
1105956
2,096485
2,806
2010
1067231
1,8802,709
1004642
2,123398
2,709
2020
13490117
1,9623,014
1425173
2,217531
3,014
2030
1818887
2,0773,153
16478108
2,336466
3,153
REFERENCE

125
5
key resu
lts|AFRICA - T
RANSPORT
africa: transport
In 2050, the car fleet in Africa will be significantly larger thantoday. Today, a large share of old cars are driven in Africa. Withgrowing individual mobility, an increasing share of small efficientcars is projected, with vehicle kilometres driven resemblingindustrialised countries averages. More efficient propulsiontechnologies, including hybrid-electric power trains, will help tolimit the growth in total transport energy demand to a factor of1.3, reaching 4,400 PJ/a in 2050. In Africa, the fleet of electricvehicles will grow to the point where almost 20% of totaltransport energy is covered by electricity.
By 2030 electricity will provide 4% of the transport sector’stotal energy demand under the Energy [R]evolution scenario.Under both scenario road transport volumes increasessignificantly. However, under the Energy [R]evolution scenario,the total energy demand for road transport increases from 3,100PJ/a in 2009 to 3,940 PJ/a in 2050, compared to 6,390 PJ/a inthe Reference case.
table 5.29: africa: transport energy demand by modeunder the reference scenario and the energy[r]evolution scenario (WITHOUT ENERGY FOR PIPELINE TRANSPORT) IN PJ/A
2020
4552
3,8973,697
130127
3838
4,1103,914
2040
61103
5,4933,961
257200
7668
5,8874,332
2050
73143
6,3933,943
410254
9879
6,9744,420
Rail
Road
Domesticaviation
Domesticnavigation
Total
REFE[R]
REFE[R]
REFE[R]
REFE[R]
REFE[R]
2030
5274
4,6553,926
177155
5652
4,9414,207
2009
3636
3,0963,096
105105
2828
3,2643,264
figure 5.67: africa: final energy consumption for transport under the reference scenario and the energy [r]evolution scenario
REF REF REF REF REF REFE[R] E[R] E[R] E[R] E[R] E[R]
2009 2015 2020 2030 2040 2050
PJ/a 0
1,000
2,000
3,000
4,000
5,000
6,000
7,000
•‘EFFICIENCY’
• HYDROGEN
• ELECTRICITY
• BIOFUELS
• NATURAL GAS
• OIL PRODUCTS
•WIND
• HYDRO
• BIOMASS
• NUCLEAR
• GAS, OIL & DIESEL
• COAL
© B. KURZEN/GP
© SHAYNE ROBINSON/GP
image A SOLAR COOKER BEING USED TO PREPARE POP CORN AT THE JERICHOCOMMUNITY CENTER. A SOLAR POWERED PUBLIC VIEWING AREA WAS CREATED FORTHE WORLD CUP.
image ESKOM’S KUSILE POWER PLANT IN THE DELMAS MUNICIPAL AREA OF THEMPUMALANGA PROVINCE IS SET TO BECOME WORLDS FOURTH MOST POLLUTINGPOWER PLANT IN TERMS OF GREENHOUSE GAS EMISSIONS.
126
5
key resu
lts|AFRICA - C
O2EMISSIONS & ENERGY CONSUMPTION
WORLD ENERGY [R]EVOLUTIONA SUSTAINABLE WORLD ENERGY OUTLOOK
GLOBAL SCENARIO OECD NORTH AMERICALATIN AMERICAOECD EUROPE AFRICA
MIDDLE EASTEASTERN EUROPE/EURASIAINDIA
NON OECD ASIACHINAOECD ASIA OCEANIA
africa
africa: development of CO2 emissions
Whilst Africa’s emissions of CO2 will increase by 157% under theReference scenario, under the Energy [R]evolution scenario they willdecrease from 928 million tonnes in 2009 to 381 million tonnes in2050. Annual per capita emissions will increase from 0.9 tonne to0.8 tonne in 2030 and decrease afterward to 0.2 tonne in 2050. In the long run efficiency gains and the increased use of renewableelectricity in vehicles will also significantly reduce emissions in thetransport sector. With a share of 51% of CO2 emissions in 2050, the transport sector will be the largest energy related source ofemissions. By 2050, Africa’s CO2 emissions are 70% of 1990 levels.
africa: primary energy consumption
Taking into account the above assumptions, the resulting primaryenergy consumption under the Energy [R]evolution scenario is shownin Figure 5.69. Compared to the Reference scenario, overall primaryenergy demand will be reduced by 23% in 2050. Around 84% of theremaining demand will be covered by renewable energy sources.
The coal demand in the Energy [R]evolution scenario will peak by2020 with 3,700 PJ/a compared to 4,560 PJ/a in 2009 anddecrease afterwards to 869 PJ/a by 2050. This is made possiblemainly by replacement of coal power plants with renewables after 20rather than 40 years lifetime. This leads to an overall renewableprimary energy share of 63% in 2030 and 84% in 2050. Nuclearenergy is phased out before 2030.
figure 5.68: africa: development of CO2 emissions by sector under the energy [r]evolution scenario(‘EFFICIENCY’ = REDUCTION COMPARED TO THE REFERENCE SCENARIO)
REF REF REF REF REF REFE[R] E[R] E[R] E[R] E[R] E[R]
2009 2015 2020 2030 2040 2050
0
500
1,000
1,500
2,000
2,500
0
200
400
600
800
1,000
1,200
1,400
1,600
1,800
2,000
2,200
Mill t/aMillion people
POPULATION DEVELOPMENT
• SAVINGS FROM ‘EFFICIENCY’ & RENEWABLES
• OTHER SECTORS
• INDUSTRY
•TRANSPORT
• POWER GENERATION
figure 5.69: africa: primary energy consumption under the reference scenario and the energy [r]evolution scenario (‘EFFICIENCY’ = REDUCTION COMPARED TO THE REFERENCE SCENARIO)
PJ/a 0
10,000
20,000
30,000
40,000
50,000
60,000
REF REF REF REF REF REFE[R] E[R] E[R] E[R] E[R] E[R]
2009 2015 2020 2030 2040 2050
•‘EFFICIENCY’
• OCEAN ENERGY
• GEOTHERMAL
• SOLAR
• BIOMASS
•WIND
• HYDRO
• NATURAL GAS
• OIL
• COAL
• NUCLEAR

127
5
key resu
lts|AFRICA - IN
VESTMENT & FUEL COSTS
table 5.30: africa: investment costs for electricity generation and fuel cost savings under the energy [r]evolution scenario compared to the reference scenario
INVESTMENT COSTS
DIFFERENCE E[R] VERSUS REF
Conventional (fossil & nuclear)
Renewables
Total
CUMULATIVE FUEL COST SAVINGS
SAVINGS CUMULATIVE E[R] VERSUS REF
Fuel oil
Gas
Hard coal
Lignite
Total
$
billion $
billion $
billion $
billion $/a
billion $/a
billion $/a
billion $/a
billion $/a
2021 - 2030
-64.1
375.9
311.7
30.6
98.5
100.5
0.0
229.6
2011 - 2020
-27.0
182.9
155.9
18.7
7.6
19.9
0.0
46.2
2011 - 2050
-301.1
1,778.7
1,477.5
127.5
1,465.7
1,003.0
0.0
2,596.3
2011 - 2050 AVERAGE
PER ANNUM
-7.5
44.5
36.9
3.2
36.6
25.1
0.0
64.9
2041 - 2050
-69.9
463.2
393.3
40.4
967.2
626.1
0.0
1,633.7
2031 - 2040
-69.9
463.2
393.3
37.8
392.4
256.6
0.0
686.9
© GP/PHILIP REYNAERS
© GP/PHILIP REYNAERS
image PANORAMIC VIEW OF THE SOMAIR URANIUM MINE IN ARLIT, OPERATED BYFRENCH COMPANY AREVA.
image CRACKED SOIL IN AKOKAN.
128
5
key resu
lts|MIDDLE EAST - D
EMAND
WORLD ENERGY [R]EVOLUTIONA SUSTAINABLE WORLD ENERGY OUTLOOK
GLOBAL SCENARIO OECD NORTH AMERICALATIN AMERICAOECD EUROPE AFRICA
MIDDLE EASTEASTERN EUROPE/EURASIAINDIA
NON OECD ASIACHINAOECD ASIA OCEANIA
middle east
middle east: energy demand by sector
The future development pathways for Middle East’s energydemand are shown in Figure 5.70 for the Reference and theEnergy [R]evolution scenario. Under the Reference scenario, totalprimary energy demand in Middle East increases by 104% fromthe current 24,750 PJ/a to about 50,600 PJ/a in 2050. Theenergy demand in 2050 in the Energy [R]evolution scenarioincreases by 9% compared to current consumption and it isexpected by 2050 to reach 27,100 PJ/a.
Under the Energy [R]evolution scenario, electricity demand in theindustry as well as in the residential, and service sectors isexpected to stagnate after 2020 (see Figure 5.71). Because ofthe growing use of electric vehicles however, electricityconsumption increases strongly to 1,958 TWh/a by 2050 just10% below the electricity demand of the Reference case.
Efficiency gains in the heat supply sector are larger than in theelectricity sector. Under the Energy [R]evolution scenario, finaldemand for heat supply can eventually even be reducedsignificantly (see Figure 5.73). Compared to the Referencescenario, consumption equivalent to 1,939 PJ/a is avoidedthrough efficiency measures by 2050. As a result of energy-related renovation of the existing stock of residential buildings, aswell as the introduction of low energy standards and ‘passivehouses’ for new buildings, enjoyment of the same comfort andenergy services will be accompanied by a much lower futureenergy demand.
figure 5.70: middle east: total final energy demand by sector under the reference scenario and the energy [r]evolution scenario (‘EFFICIENCY’ = REDUCTION COMPARED TO THE REFERENCE SCENARIO)
• ‘EFFICIENCY’
• OTHER SECTORS
• INDUSTRY
•TRANSPORT
REF E[R]
2009
REF E[R]
2015
REF E[R]
2020
REF E[R]
2030
REF E[R]
2040
REF E[R]
2050
PJ/a 0
5,000
10,000
15,000
20,000
25,000
30,000
35,000

129
5
key resu
lts|MIDDLE EAST - D
EMAND
figure 5.71: middle east: development of electricitydemand by sector in the energy [r]evolution scenario(‘EFFICIENCY’ = REDUCTION COMPARED TO THE REFERENCE SCENARIO)
• ‘EFFICIENCY’
• OTHER SECTORS
• INDUSTRY
•TRANSPORT
E[R] E[R] E[R] E[R] E[R] E[R]
2009 2015 2020 2030 2040 2050
PJ/a 0
2,000
4,000
6,000
8,000
10,000
12,000
figure 5.72: middle east: development of the transportdemand by sector in the energy [r]evolution scenario
•‘EFFICIENCY’
• DOMESTIC NAVIGATION
• DOMESTIC AVIATION
• ROAD
• RAIL
E[R] E[R] E[R] E[R] E[R] E[R]
2009 2015 2020 2030 2040 2050
PJ/a 0
1,000
2,000
3,000
4,000
5,000
6,000
7,000
8,000
E[R] E[R] E[R] E[R] E[R] E[R]
2009 2015 2020 2030 2040 2050
PJ/a 0
2,000
4,000
6,000
8,000
10,000
figure 5.73: middle east: development of heat demandby sector in the energy [r]evolution scenario(‘EFFICIENCY’ = REDUCTION COMPARED TO THE REFERENCE SCENARIO)
• ‘EFFICIENCY’
• OTHER SECTORS
• INDUSTRY
© N. ARMONN/DREAMSTIME
© Y. TAFLEV/DREAMSTIME
image A LARGE POWER PLANT ALONG THE ROCKY COASTLINE IN CAESAREA, ISRAEL.
image WIND TURBINES IN THE GOLAN HEIGHTS IN ISRAEL.

130
5
key resu
lts|MIDDLE EAST - E
LECTRICITY GENERATION
WORLD ENERGY [R]EVOLUTIONA SUSTAINABLE WORLD ENERGY OUTLOOK
GLOBAL SCENARIO OECD NORTH AMERICALATIN AMERICAOECD EUROPE AFRICA
MIDDLE EASTEASTERN EUROPE/EURASIAINDIA
NON OECD ASIACHINAOECD ASIA OCEANIA
middle east
middle east: electricity generation
The development of the electricity supply market is charaterised bya dynamically growing renewable energy market. This willcompensate for the phasing out of nuclear energy, reduce thenumber of fossil fuel-fired power plants required for gridstabilisation and will cover the demand for additionally necessarystorable fuels such as hydrogen (increasing to more than 900 TWhin 2050). By 2050, 98% of the electricity produced in Middle Eastwill come from renewable energy sources. ‘New’ renewables –mainly wind, PV and solar thermal energy – will contribute 94%of electricity generation. The Energy [R]evolution scenario projectsan immediate market development with high annual growth ratesachieving a renewable electricity share of 27% already by 2020and 62% by 2030. The installed capacity of renewables will reach412 GW in 2030 and 1089 GW by 2050.
Table 5.31 shows the comparative evolution of the differentrenewable technologies in Middle East over time. Up to 2020wind, photovoltaics and solar thermal power will overtake hydroas the main contributor of the growing market share. After 2020,the continuing growth of wind, PV and CSP will becomplemented by electricity from geothermal and ocean energy.The Energy [R]evolution scenario will lead to a high share offluctuating power generation sources (photovoltaic, wind andocean) of 32% by 2030, therefore the expansion of smart grids,demand side management (DSM) and new storage capacities e.g.from the increased share of electric vehicles will be used for abetter grid integration and power generation management.
table 5.31: middle east: renewable electricity generationcapacity under the reference scenario and the energy [r]evolution scenario IN GW
2020
1818
12
231
02
247
125
04
25130
2040
2525
26
10181
016
11340
4146
029
52742
2050
2828
38
14283
020
16474
6235
041
671,089
Hydro
Biomass
Wind
Geothermal
PV
CSP
Ocean energy
Total
REFE[R]
REFE[R]
REFE[R]
REFE[R]
REFE[R]
REFE[R]
REFE[R]
REFE[R]
2030
2424
14
5106
04
8162
3102
09
42412
2009
66
00
00
00
00
00
00
66
figure 5.74: middle east: electricity generation structure under the reference scenario and the energy [r]evolution scenario (INCLUDING ELECTRICITY FOR ELECTROMOBILITY, HEAT PUMPS AND HYDROGEN GENERATION)
TWh/a 0
REF REF REF REF REF REFE[R] E[R] E[R] E[R] E[R] E[R]
2009 2015 2020 2030 2040 2050
500
1,000
1,500
2,000
2,500
3,000
3,500
•OCEAN ENERGY
• SOLAR THERMAL
• GEOTHERMAL
• BIOMASS
• PV
•WIND
• HYDRO
• NUCLEAR
• DIESEL
• OIL
• NATURAL GAS
• LIGNITE
• COAL
131
5
key resu
lts|MIDDLE EAST - E
LECTRICITY GENERATION
middle east: future costs of electricity generation
Figure 5.75 shows that the introduction of renewable technologiesunder the Energy [R]evolution scenario does not increase the costsof electricity generation in Middle East compared to the Referencescenario - if fossil fuel prices and investment costs are assumedaccording to the pathways defined in Chapter 4. Because of thelower CO2 intensity of electricity generation and the high share ofgas power plants in the Reference scenario, electricity generationcosts will become economically favourable under the Energy[R]evolution scenario and by 2050 costs will be about 20cents/kWh below those in the Reference version.
Under the Reference scenario, the unchecked growth in demand, anincrease in fossil fuel prices and the cost of CO2 emissions result intotal electricity supply costs rising from today’s $ 146 billion peryear to more than $ 751 billion in 2050. Figure 5.75 shows thatthe Energy [R]evolution scenario not only complies with MiddleEast’s CO2 reduction targets but also helps to stabilise energycosts. Increasing energy efficiency and shifting energy supply torenewables lead to long term costs for electricity supply that are44% lower in 2050 than in the Reference scenario.
figure 5.75: middle east: total electricity supply costs and specific electricity generation costs under two scenarios
0
100
200
300
400
500
600
700
800
2009 2015 2020 2030 2040 2050
0
5
10
15
20
25
30
ct/kWhBn$/a
SPEC. ELECTRICITY GENERATION COSTS (REF)
SPEC. ELECTRICITY GENERATION COSTS (E[R])
• ‘EFFICIENCY’ MEASURES
• REFERENCE SCENARIO (REF)
• ENERGY [R]EVOLUTION (E[R])
middle east: future investments in the power sector
It would require $ 3,840 billion in investment for the Energy[R]evolution scenario to become reality (including investmentsfor replacement after the economic lifetime of the plants) -approximately $ 3,124 billion or $ 78 billion annually more thanin the Reference scenario ($ 716 billion).
Under the Reference version, the levels of investment inconventional power plants add up to almost 66% whileapproximately 34% would be invested in renewable energy andcogeneration (CHP) until 2050. Under the Energy [R]evolutionscenario, however, Middle East would shift almost 96% of theentire investment towards renewables and cogeneration.
Until 2030, the fossil fuel share of power sector investment wouldbe focused mainly on CHP plants. The average annual investmentin the power sector under the Energy [R]evolution scenariobetween today and 2050 would be approximately $ 96 billion.
Because renewable energy except biomass has no fuel costs,however, the fuel cost savings in the Energy [R]evolution scenarioreach a total of $ 8,281 billion up to 2050, or $ 207 billion peryear. The total fuel cost savings therefore would cover 270% ofthe total additional investments compared to the Referencescenario. These renewable energy sources would then go on toproduce electricity without any further fuel costs beyond 2050,while the costs for fossil fuels will continue to be a burden onnational economies.
figure 5.76: middle east: investment shares - referencescenario versus energy [r]evolution scenario
REF 2011 - 2050
61% FOSSIL
5% NUCLEAR
2% CHP
32% RENEWABLES
Total $ 716 billion
E[R] 2011 - 2050
4% FOSSIL3% CHP
93% RENEWABLES
Total $ 3,840 billion
© O. ÇAM/DREAMSTIME
© S. W
EIWEI/DREAMSTIME
image THE BAHRAIN WORLD TRADE CENTER IN MANAMA GENERATES PART OF ITSOWN ENERGY USING WIND TURBINES.
image SUBURBS OF DUBAI, UNITED ARAB EMIRATES.

132
5
key resu
lts|MIDDLE EAST - H
EATING
WORLD ENERGY [R]EVOLUTIONA SUSTAINABLE WORLD ENERGY OUTLOOK
GLOBAL SCENARIO OECD NORTH AMERICALATIN AMERICAOECD EUROPE AFRICA
MIDDLE EASTEASTERN EUROPE/EURASIAINDIA
NON OECD ASIACHINAOECD ASIA OCEANIA
middle east
middle east: heating supply
Renewables currently provide 0.5% of Middle East’s energydemand for heat supply, the main contribution coming from theuse of biomass. In the Energy [R]evolution scenario, renewablesprovide 34% of Middle East’s total heat demand in 2030 and89% in 2050.
• Energy efficiency measures can lower specific process heatconsumption and can therefore limit demand increase in a regionwith a fast growing population and increasing industrial activities.
• For direct heating, solar collectors, biomass/biogas as well asgeothermal energy are increasingly substituting for fossil fuel-fired systems.
• The introduction of strict efficiency measures e.g. via ambitioussupport programs for renewable heating systems are needed toachieve economies of scale within the next 5 to 10 years.
Table 5.32 shows the development of the different renewabletechnologies for heating in Middle East over time. Up to 2020solar energy becomes the main contributor of the growing marketshare. After 2020, the continuing growth of solar collectors anda growing share of geothermal energy and heat pumps cansignificantly reduce the dependence on fossil fuels.
table 5.32: middle east: renewable heating capacitiesunder the reference scenario and the energy [r]evolution scenario IN GW
2020
32100
62571
3216
0145
971,032
2040
69394
1132,954
141,026
0754
1965,127
2050
77508
1514,426
391,708
0890
2677,531
Biomass
Solarcollectors
Geothermal
Hydrogen
Total
REFE[R]
REFE[R]
REFE[R]
REFE[R]
REFE[R]
2030
48203
901,449
7538
0504
1462,694
2009
2020
55
11
00
2727
figure 5.77: middle east: heat supply structure under the reference scenario and the energy [r]evolution scenario(‘EFFICIENCY’ = REDUCTION COMPARED TO THE REFERENCE SCENARIO)
REF REF REF REF REF REFE[R] E[R] E[R] E[R] E[R] E[R]
2009 2015 2020 2030 2040 2050
PJ/a 0
2,000
4,000
6,000
8,000
10,000
•‘EFFICIENCY’
• HYDROGEN
• GEOTHERMAL
• SOLAR
• BIOMASS
• FOSSIL
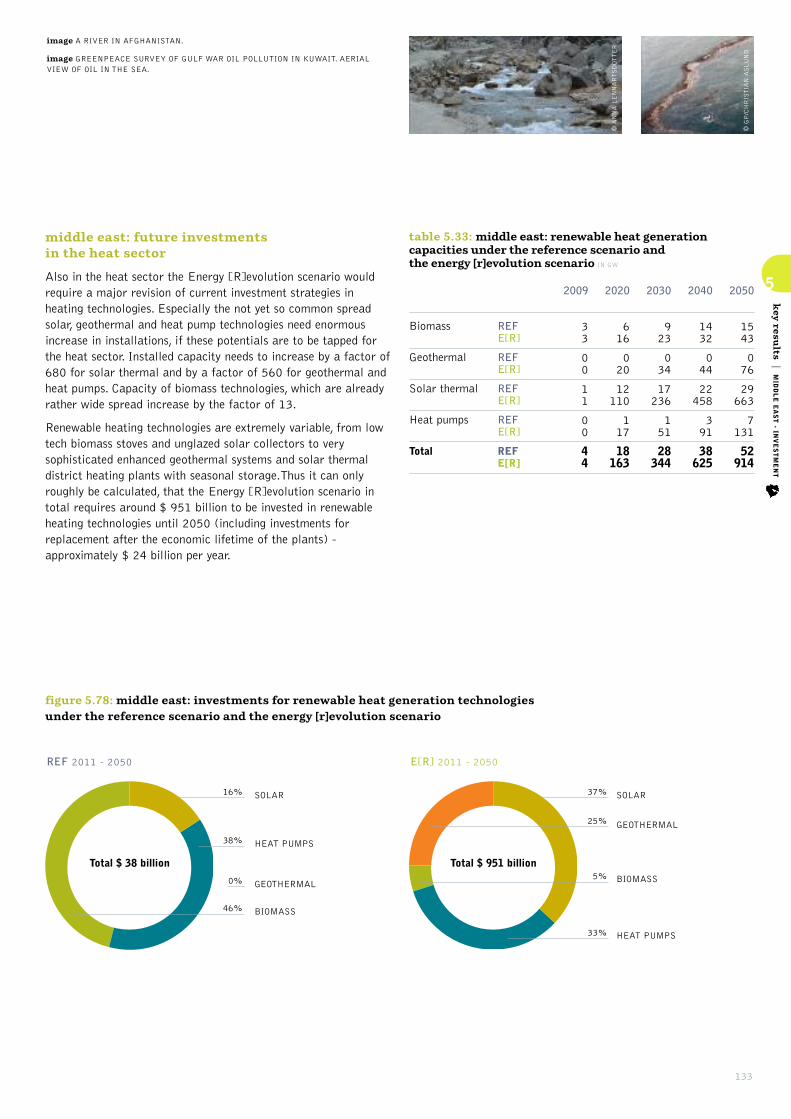
133
5
key resu
lts|MIDDLE EAST - IN
VESTMENT
middle east: future investments in the heat sector
Also in the heat sector the Energy [R]evolution scenario wouldrequire a major revision of current investment strategies inheating technologies. Especially the not yet so common spreadsolar, geothermal and heat pump technologies need enormousincrease in installations, if these potentials are to be tapped forthe heat sector. Installed capacity needs to increase by a factor of680 for solar thermal and by a factor of 560 for geothermal andheat pumps. Capacity of biomass technologies, which are alreadyrather wide spread increase by the factor of 13.
Renewable heating technologies are extremely variable, from lowtech biomass stoves and unglazed solar collectors to verysophisticated enhanced geothermal systems and solar thermaldistrict heating plants with seasonal storage.Thus it can onlyroughly be calculated, that the Energy [R]evolution scenario intotal requires around $ 951 billion to be invested in renewableheating technologies until 2050 (including investments forreplacement after the economic lifetime of the plants) -approximately $ 24 billion per year.
table 5.33: middle east: renewable heat generationcapacities under the reference scenario and the energy [r]evolution scenario IN GW
2020
616
020
12110
117
18163
2040
1432
044
22458
391
38625
2050
1543
076
29663
7131
52914
Biomass
Geothermal
Solar thermal
Heat pumps
Total
REFE[R]
REFE[R]
REFE[R]
REFE[R]
REFE[R]
2030
923
034
17236
151
28344
2009
33
00
11
00
44
figure 5.78: middle east: investments for renewable heat generation technologies under the reference scenario and the energy [r]evolution scenario
REF 2011 - 2050
16% SOLAR
0% GEOTHERMAL
46% BIOMASS
38% HEAT PUMPS
Total $ 38 billion
E[R] 2011 - 2050
37% SOLAR
33% HEAT PUMPS
5% BIOMASS
25% GEOTHERMAL
Total $ 951 billion
© GP/CHRISTIAN ASLUND
© ANNA LENNARTSDOTTER
image A RIVER IN AFGHANISTAN.
image GREENPEACE SURVEY OF GULF WAR OIL POLLUTION IN KUWAIT. AERIALVIEW OF OIL IN THE SEA.

134
5
key resu
lts|MIDDLE EAST - E
MPLOYMENT
WORLD ENERGY [R]EVOLUTIONA SUSTAINABLE WORLD ENERGY OUTLOOK
GLOBAL SCENARIO OECD NORTH AMERICALATIN AMERICAOECD EUROPE AFRICA
MIDDLE EASTEASTERN EUROPE/EURASIAINDIA
NON OECD ASIACHINAOECD ASIA OCEANIA
middle east
middle east: future employment in the energy sector
The Energy [R]evolution scenario results in more energy sectorjobs in Middle East at every stage of the projection.
• There are 1.8 million energy sector jobs in the Energy [R]evolution scenario in 2015, and 1.3 million in the Reference scenario.
• In 2020, there are 2 million jobs in the Energy [R]evolutionscenario, and 1.4 million in the Reference scenario.
• In 2030, there are 1.6 million jobs in the Energy [R]evolutionscenario and 1.5 million in the Reference scenario.
Figure 5.79 shows the change in job numbers under bothscenarios for each technology between 2010 and 2030. Jobs inthe Reference scenario increase gradually to 12% above 2010levels by 2030. The gas sector accounts for 95% of energy sectorjobs in this scenario.
Growth in renewable energy leads to an increase of 37% in totalenergy sector jobs in the Energy [R]evolution scenario by 2015,and compensates for a decline in gas sector jobs. There is areduction between 2020 and 2030, but Energy [R]evolution jobsremain 23% above 2010 levels in 2030.
REFERENCE ENERGY[R]EVOLUTION
2010 2015 2020 2030 2015 2020 2030
0
0.5
1.0
1.5
2.0
2.5
Dir
ect
jobs
- m
illio
ns
figure 5.79: middle east: employment in the energy scenario under the reference and energy [r]evolution scenarios
•GEOTHERMAL & HEAT PUMP
• SOLAR HEAT
• OCEAN ENERGY
• SOLAR THERMAL POWER
• GEOTHERMAL POWER
• PV
•WIND
• HYDRO
• BIOMASS
• NUCLEAR
• GAS, OIL & DIESEL
• COAL
table 5.34: middle east: total employment in the energy sector THOUSAND JOBS
CoalGas, oil & dieselNuclearRenewableTotal Jobs
Construction and installationManufacturingOperations and maintenanceFuel supply (domestic)Coal and gas exportTotal Jobs
2015
11,184
0613
1,798
45211986
935.2207
1,798
2020
11,237
0742
1,980
485126127
1,029213
1,980
2030
18630
7491,613
40010919682187
1,613
ENERGY [R]EVOLUTION
2015
21,241
1487
1,344
902770960196
1,344
2010
71,228
973
1,317
1235051900193
1,317
2020
11,340
1566
1,422
632179
1,057203
1,422
2030
11,409
564
1,479
452189
1,182143
1,479
REFERENCE

135
5
key resu
lts|MIDDLE EAST - T
RANSPORT
middle east: transport
In the transport sector, it is assumed under the Energy[R]evolution scenario compared to the Refence scenario anenergy demand reduction of 8,160 PJ/a or 66% can be achievedby 2050. Energy demand will therefore decrease between 2009and 2050 by 11% to 4,140 PJ/a (including energy for pipelinetransport). This reduction can be achieved by the introduction ofhighly efficient vehicles, by shifting the transport of goods fromroad to rail and by changes in mobility-related behaviourpatterns. Implementing a mix of increased public transport asattractive alternatives to individual cars, the car stock is growingslower and annual person kilometres are lower than in theReference scenario.
A shift towards smaller cars triggered by economic incentivestogether with a significant shift in propulsion technology towardselectrified power trains and a reduction of vehicle kilometrestravelled per year leads to significant energy savings. In 2030,electricity will provide 9% of the transport sector’s total energydemand in the Energy [R]evolution, while in 2050 the share will be 41%.
table 5.35: middle east: transport energy demand by mode under the reference scenario and the energy[r]evolution scenario (WITHOUT ENERGY FOR PIPELINE TRANSPORT) IN PJ/A
2020
24
7,1905,961
5148
00
7,2436,013
2040
212
11,1294,481
5855
00
11,1894,549
2050
219
12,2024,058
5350
00
12,2564,127
Rail
Road
Domesticaviation
Domesticnavigation
Total
REFE[R]
REFE[R]
REFE[R]
REFE[R]
REFE[R]
2030
28
10,0245,373
6158
00
10,0865,438
2009
11
4,6234,623
3838
00
4,6624,662
figure 5.80: middle east: final energy consumption for transport under the reference scenario and the energy [r]evolution scenario
REF REF REF REF REF REFE[R] E[R] E[R] E[R] E[R] E[R]
2009 2015 2020 2030 2040 2050
PJ/a 0
2,000
4,000
6,000
8,000
10,000
12,000
•‘EFFICIENCY’
• HYDROGEN
• ELECTRICITY
• BIOFUELS
• NATURAL GAS
• OIL PRODUCTS
•WIND
• HYDRO
• BIOMASS
• NUCLEAR
• GAS, OIL & DIESEL
• COAL
© GP/JIM HODSON
© GP/PIERRE GLEIZES
image LAKE OF OIL, AL BURGAN OILFIELD, KUWAIT.
image ASHDOD COAL POWER PLANT IN ISRAEL.

136
5
key resu
lts|MIDDLE EAST - C
O2EMISSIONS & ENERGY CONSUMPTION
WORLD ENERGY [R]EVOLUTIONA SUSTAINABLE WORLD ENERGY OUTLOOK
GLOBAL SCENARIO OECD NORTH AMERICALATIN AMERICAOECD EUROPE AFRICA
MIDDLE EASTEASTERN EUROPE/EURASIAINDIA
NON OECD ASIACHINAOECD ASIA OCEANIA
middle east
middle east: development of CO2 emissions
While CO2 emissions in Middle East will increase by 104% in theReference scenario, under the Energy [R]evolution scenario they willdecrease from 1,510 million tonnes in 2009 to 173 million tonnesin 2050. Annual per capita emissions will drop from 7.4 tonnes to 4tonnes in 2030 and 0.5 tonne in 2050. In spite of the phasing outof nuclear energy and increasing demand, CO2 emissions willdecrease in the electricity sector. In the long run efficiency gains andthe increased use of renewable electricity in vehicles will evenreduce emissions in the transport sector. With a share of 13% ofCO2 emissions in 2050, the power sector will drop below transportas the largest sources of emissions. By 2050, Middle East’s CO2
emissions are 31% of 1990 levels.
middle east: primary energy consumption
Taking into account the assumptions discussed above, the resultingprimary energy consumption under the Energy [R]evolution scenario isshown in Figure 5.81. Compared to the Reference scenario, overallprimary energy demand will be reduced by 45% in 2050.
The Energy [R]evolution version phases out fossil fuels about 10 to15 years faster than the previous Energy [R]evolution scenariopublished in 2010 This is made possible mainly by replacement ofcoal power plants with renewables and a faster introduction of veryefficient electric vehicles in the transport sector to replace oilcombustion engines. This leads to an overall renewable primaryenergy share of 26% in 2030 and 75% in 2050. Nuclear energy isphased out just after 2030.
figure 5.81: middle east: development of CO2 emissionsby sector under the energy [r]evolution scenario(‘EFFICIENCY’ = REDUCTION COMPARED TO THE REFERENCE SCENARIO)
REF REF REF REF REF REFE[R] E[R] E[R] E[R] E[R] E[R]
2009 2015 2020 2030 2040 2050
0
500
1,000
1,500
2,000
2,500
3,000
0
50
100
150
200
250
300
350 Mill t/a
Million people
POPULATION DEVELOPMENT
• SAVINGS FROM ‘EFFICIENCY’ & RENEWABLES
• OTHER SECTORS
• INDUSTRY
•TRANSPORT
• POWER GENERATION
figure 5.82: middle east: primary energy consumption under the reference scenario and the energy [r]evolution scenario (‘EFFICIENCY’ = REDUCTION COMPARED TO THE REFERENCE SCENARIO)
PJ/a 0
10,000
20,000
30,000
40,000
50,000
REF REF REF REF REF REFE[R] E[R] E[R] E[R] E[R] E[R]
2009 2015 2020 2030 2040 2050
•‘EFFICIENCY’
• OCEAN ENERGY
• GEOTHERMAL
• SOLAR
• BIOMASS
•WIND
• HYDRO
• NATURAL GAS
• OIL
• COAL
• NUCLEAR

137
5
key resu
lts|MIDDLE EAST - IN
VESTMENT & FUEL COSTS
table 5.36: middle east: investment costs for electricity generation and fuel cost savings under the energy [r]evolution scenario compared to the reference scenario
INVESTMENT COSTS
DIFFERENCE E[R] VERSUS REF
Conventional (fossil & nuclear)
Renewables
Total
CUMULATIVE FUEL COST SAVINGS
SAVINGS CUMULATIVE E[R] VERSUS REF
Fuel oil
Gas
Hard coal
Lignite
Total
$
billion $
billion $
billion $
billion $/a
billion $/a
billion $/a
billion $/a
billion $/a
2021 - 2030
-85.1
801.0
715.9
616.8
501.5
2.7
0.0
1,121.0
2011 - 2020
-50.8
367.7
316.8
156.4
25.6
1.4
0.0
183.4
2011 - 2050
-329.4
3,453.5
3,124.1
2,107.6
6,160.1
13.1
0.0
8,280.8
2011 - 2050 AVERAGE
PER ANNUM
-8.2
86.3
78.1
52.7
154.0
0.3
0.0
207.0
2041 - 2050
-85.5
811.0
725.5
622.0
3,735.5
5.2
0.0
4,362.7
2031 - 2040
-85.5
811.0
725.5
712.4
1,897.5
3.7
0.0
2,613.7
© GP/PIERRE GLEIZES
© J. OERLEMANS/PANOS/GP
image ALMOST A MONTH AFTER THE ISRAELI AIR FORCE BOMBED IT, SMOKE STILLRISES FROM THE JIYEH POWER PLANT, 20 MILES SOUTH OF BEIRUT. THE ATTACKCAUSED A MASSIVE OIL SPILL THAT HAS BROUGHT AN ENVIRONMENTAL DISASTERUPON THE SHORES OF LEBANON.
image AN AEROPLANE FLIES OVER BEIRUT CITY.
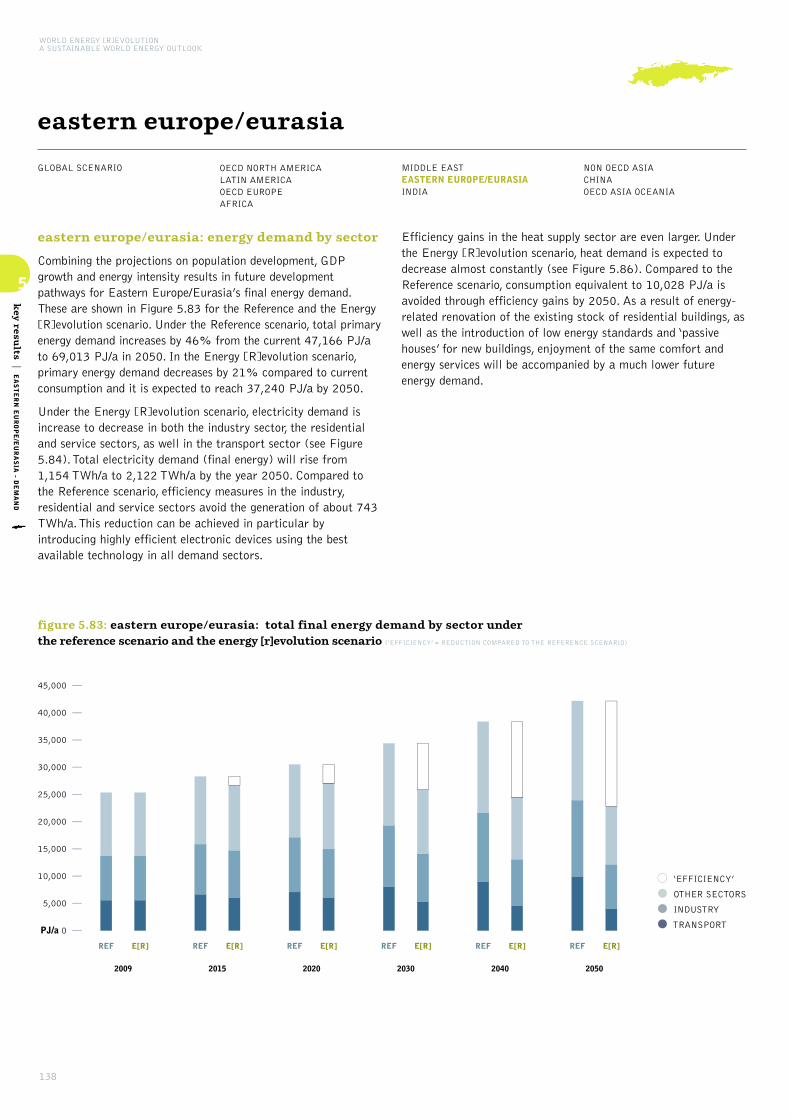
138
5
key resu
lts|EASTERN EUROPE/EURASIA - D
EMAND
WORLD ENERGY [R]EVOLUTIONA SUSTAINABLE WORLD ENERGY OUTLOOK
GLOBAL SCENARIO OECD NORTH AMERICALATIN AMERICAOECD EUROPE AFRICA
MIDDLE EASTEASTERN EUROPE/EURASIAINDIA
NON OECD ASIACHINAOECD ASIA OCEANIA
eastern europe/eurasia
eastern europe/eurasia: energy demand by sector
Combining the projections on population development, GDPgrowth and energy intensity results in future developmentpathways for Eastern Europe/Eurasia’s final energy demand.These are shown in Figure 5.83 for the Reference and the Energy[R]evolution scenario. Under the Reference scenario, total primaryenergy demand increases by 46% from the current 47,166 PJ/ato 69,013 PJ/a in 2050. In the Energy [R]evolution scenario,primary energy demand decreases by 21% compared to currentconsumption and it is expected to reach 37,240 PJ/a by 2050.
Under the Energy [R]evolution scenario, electricity demand isincrease to decrease in both the industry sector, the residentialand service sectors, as well in the transport sector (see Figure5.84). Total electricity demand (final energy) will rise from1,154 TWh/a to 2,122 TWh/a by the year 2050. Compared tothe Reference scenario, efficiency measures in the industry,residential and service sectors avoid the generation of about 743TWh/a. This reduction can be achieved in particular byintroducing highly efficient electronic devices using the bestavailable technology in all demand sectors.
Efficiency gains in the heat supply sector are even larger. Underthe Energy [R]evolution scenario, heat demand is expected todecrease almost constantly (see Figure 5.86). Compared to theReference scenario, consumption equivalent to 10,028 PJ/a isavoided through efficiency gains by 2050. As a result of energy-related renovation of the existing stock of residential buildings, aswell as the introduction of low energy standards and ‘passivehouses’ for new buildings, enjoyment of the same comfort andenergy services will be accompanied by a much lower futureenergy demand.
figure 5.83: eastern europe/eurasia: total final energy demand by sector under the reference scenario and the energy [r]evolution scenario (‘EFFICIENCY’ = REDUCTION COMPARED TO THE REFERENCE SCENARIO)
• ‘EFFICIENCY’
• OTHER SECTORS
• INDUSTRY
•TRANSPORT
REF E[R]
2009
REF E[R]
2015
REF E[R]
2020
REF E[R]
2030
REF E[R]
2040
REF E[R]
2050
PJ/a 0
5,000
10,000
15,000
20,000
25,000
30,000
35,000
40,000
45,000

139
5
key resu
lts|EASTERN EUROPE/EURASIA - D
EMAND
figure 5.84: eastern europe/eurasia: development of electricity demand by sector in the energy [r]evolution scenario(‘EFFICIENCY’ = REDUCTION COMPARED TO THE REFERENCE SCENARIO)
• ‘EFFICIENCY’
• OTHER SECTORS
• INDUSTRY
•TRANSPORT
E[R] E[R] E[R] E[R] E[R] E[R]
2009 2015 2020 2030 2040 2050
PJ/a 0
1,000
2,000
3,000
4,000
5,000
6,000
7,000
8,000
9,000
figure 5.85: eastern europe/eurasia: development of the transport demand by sector in the energy [r]evolution scenario
•‘EFFICIENCY’
• DOMESTIC NAVIGATION
• RAIL
• DOMESTIC AVIATION
• ROAD
E[R] E[R] E[R] E[R] E[R] E[R]
2009 2015 2020 2030 2040 2050
PJ/a 0
1,000
2,000
3,000
4,000
5,000
6,000
7,000
8,000
9,000
10,000
E[R] E[R] E[R] E[R] E[R] E[R]
2009 2015 2020 2030 2040 2050
PJ/a 0
5,000
10,000
15,000
20,000
25,000
figure 5.86: eastern europe/eurasia: development ofheat demand by sector in the energy [r]evolution scenario(‘EFFICIENCY’ = REDUCTION COMPARED TO THE REFERENCE SCENARIO)
• ‘EFFICIENCY’
• OTHER SECTORS
• INDUSTRY
© GP/WILL ROSE
© GP/STEVE MORGAN
image AN INDIGENOUS NENET WOMAN WITH HER REINDEER. THE NENETS PEOPLEMOVE EVERY 3 OR 4 DAYS SO THAT THEIR HERDS DO NOT OVER GRAZE THE GROUND.THE ENTIRE REGION AND ITS INHABITANTS ARE UNDER HEAVY THREAT FROM GLOBALWARMING AS TEMPERATURES INCREASE AND RUSSIA’S ANCIENT PERMAFROST MELTS.
image A SITE OF A DISAPPEARED LAKE AFTER PERMAFROST SUBSIDENCE IN RUSSIA.
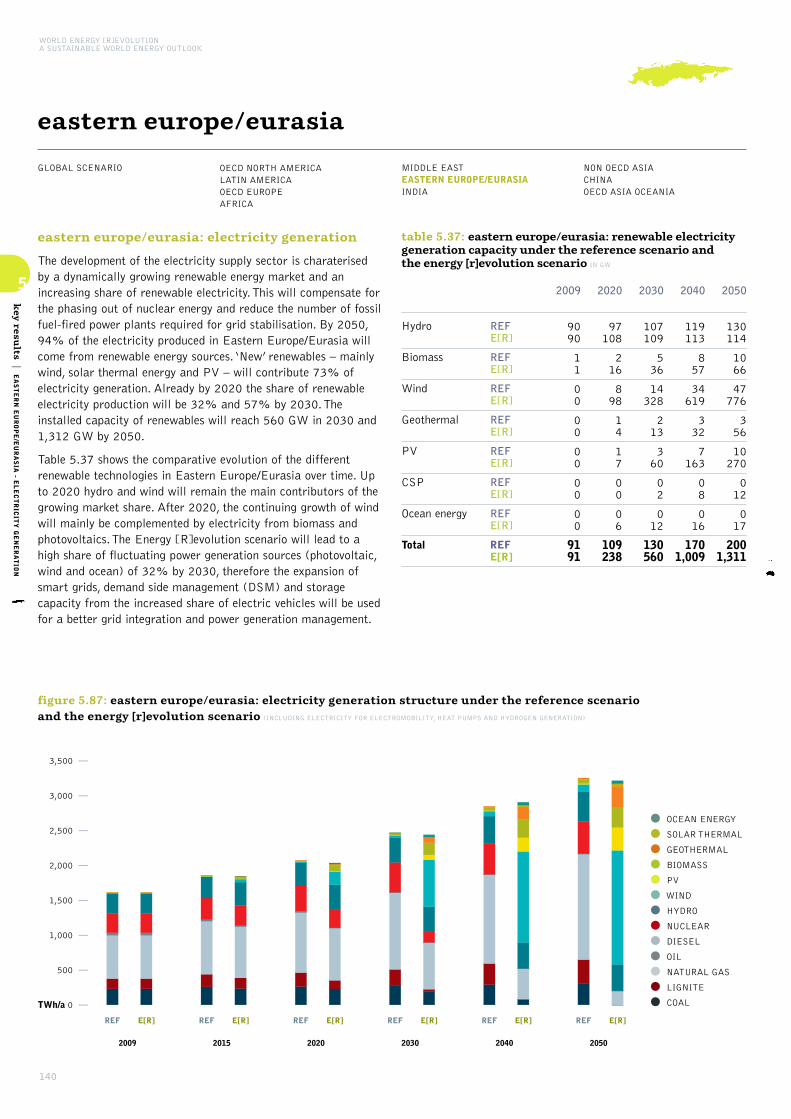
140
5
key resu
lts|EASTERN EUROPE/EURASIA - E
LECTRICITY GENERATION
WORLD ENERGY [R]EVOLUTIONA SUSTAINABLE WORLD ENERGY OUTLOOK
GLOBAL SCENARIO OECD NORTH AMERICALATIN AMERICAOECD EUROPE AFRICA
MIDDLE EASTEASTERN EUROPE/EURASIAINDIA
NON OECD ASIACHINAOECD ASIA OCEANIA
eastern europe/eurasia
eastern europe/eurasia: electricity generation
The development of the electricity supply sector is charaterisedby a dynamically growing renewable energy market and anincreasing share of renewable electricity. This will compensate forthe phasing out of nuclear energy and reduce the number of fossilfuel-fired power plants required for grid stabilisation. By 2050,94% of the electricity produced in Eastern Europe/Eurasia willcome from renewable energy sources. ‘New’ renewables – mainlywind, solar thermal energy and PV – will contribute 73% ofelectricity generation. Already by 2020 the share of renewableelectricity production will be 32% and 57% by 2030. Theinstalled capacity of renewables will reach 560 GW in 2030 and1,312 GW by 2050.
Table 5.37 shows the comparative evolution of the differentrenewable technologies in Eastern Europe/Eurasia over time. Upto 2020 hydro and wind will remain the main contributors of thegrowing market share. After 2020, the continuing growth of windwill mainly be complemented by electricity from biomass andphotovoltaics. The Energy [R]evolution scenario will lead to ahigh share of fluctuating power generation sources (photovoltaic,wind and ocean) of 32% by 2030, therefore the expansion ofsmart grids, demand side management (DSM) and storagecapacity from the increased share of electric vehicles will be usedfor a better grid integration and power generation management.
table 5.37: eastern europe/eurasia: renewable electricitygeneration capacity under the reference scenario and the energy [r]evolution scenario IN GW
2020
97108
216
898
14
17
00
06
109238
2040
119113
857
34619
332
7163
08
016
1701,009
2050
130114
1066
47776
356
10270
012
017
2001,311
Hydro
Biomass
Wind
Geothermal
PV
CSP
Ocean energy
Total
REFE[R]
REFE[R]
REFE[R]
REFE[R]
REFE[R]
REFE[R]
REFE[R]
REFE[R]
2030
107109
536
14328
213
360
02
012
130560
2009
9090
11
00
00
00
00
00
9191
figure 5.87: eastern europe/eurasia: electricity generation structure under the reference scenario and the energy [r]evolution scenario (INCLUDING ELECTRICITY FOR ELECTROMOBILITY, HEAT PUMPS AND HYDROGEN GENERATION)
TWh/a 0
REF REF REF REF REF REFE[R] E[R] E[R] E[R] E[R] E[R]
2009 2015 2020 2030 2040 2050
500
1,000
1,500
2,000
2,500
3,000
3,500
•OCEAN ENERGY
• SOLAR THERMAL
• GEOTHERMAL
• BIOMASS
• PV
•WIND
• HYDRO
• NUCLEAR
• DIESEL
• OIL
• NATURAL GAS
• LIGNITE
• COAL

141
5
key resu
lts|EASTERN EUROPE/EURASIA - E
LECTRICITY GENERATION
eastern europe/eurasia: future costs of electricity generation
Figure 5.88 shows that the introduction of renewable technologiesunder the Energy [R]evolution scenario significantly decreases thefuture costs of electricity generation compared to the Referencescenario. This difference will be less than $ 1.5 cent/kWh up to2020, however. Because of high prices for conventional fuels and thelower CO2 intensity of electricity generation, electricity generationcosts will become even more economically favourable under theEnergy [R]evolution scenario and by 2050 costs will be $ 12.9cents/kWh below those in the Reference version.
Under the Reference scenario, on the other hand, unchecked growthin demand, an increase in fossil fuel prices and the cost of CO2
emissions result in total electricity supply costs rising from today’s$ 282 billion per year to more than $ 830 billion in 2050. Figure5.88 shows that the Energy [R]evolution scenario not onlycomplies with Eastern Europe/Eurasia’s CO2 reduction targets, butalso helps to stabilise energy costs and relieve the economicpressure on society. Increasing energy efficiency and shifting energysupply to renewables lead to long term costs for electricity supplythat are more than 55% lower than in the Reference scenario.
figure 5.88: eastern europe/eurasia: total electricitysupply costs and specific electricity generation costsunder two scenarios
0
100
200
300
400
500
600
700
800
900
2009 2015 2020 2030 2040 2050
0
5
10
15
20
25
ct/kWhBn$/a
SPEC. ELECTRICITY GENERATION COSTS (REF)
SPEC. ELECTRICITY GENERATION COSTS (E[R])
• ‘EFFICIENCY’ MEASURES
• REFERENCE SCENARIO (REF)
• ENERGY [R]EVOLUTION (E[R])
eastern europe/eurasia: future investments in the power sector
It would require $ 3,385 billion in investment for the Energy[R]evolution scenario to become reality (including investmentsfor replacement after the economic lifetime of the plants) -
approximately $ 1,961 billion (or annually $ 49 billion) morethan in the Reference scenario ($ 1,424 billion). Under theReference version, the levels of investment in conventional powerplants add up to almost 48% while approximately 52% would beinvested in renewable energy and cogeneration (CHP) until 2050.
Under the Energy [R]evolution scenario, however, EasternEurope/Eurasia would shift almost 97% of the entire investmenttowards renewables and cogeneration. Until 2030, the fossil fuelshare of power sector investment would be focused mainly onCHP plants. The average annual investment in the power sectorunder the Energy [R]evolution scenario between today and 2050would be approximately $ 85 billion.
Because renewable energy has no fuel costs, however, the fuelcost savings in the Energy [R]evolution scenario reach a total of$ 7,705 billion up to 2050, or $ 193 billion per year. The totalfuel cost savings therefore would cover 390% of the totaladditional investments compared to the Reference scenario. Theserenewable energy sources would then go on to produce electricitywithout any further fuel costs beyond 2050, while the costs forcoal and gas will continue to be a burden on national economies.
figure 5.89: eastern europe/eurasia: investment shares -reference scenario versus energy [r]evolution scenario
REF 2011 - 2050
19% FOSSIL
29% NUCLEAR
16% CHP
36% RENEWABLES
Total $ 1,424 billion
E[R] 2011 - 2050
3% FOSSIL
24% CHP
73% RENEWABLES
Total $ 3,385 billion
© GP/SHIRLEY
© GP/MIZUKOSHI
image CHERNOBYL NUCLEAR POWER STATION, UKRAINE.
image THE SUN OVER LAKE BAIKAL, RUSSIA.
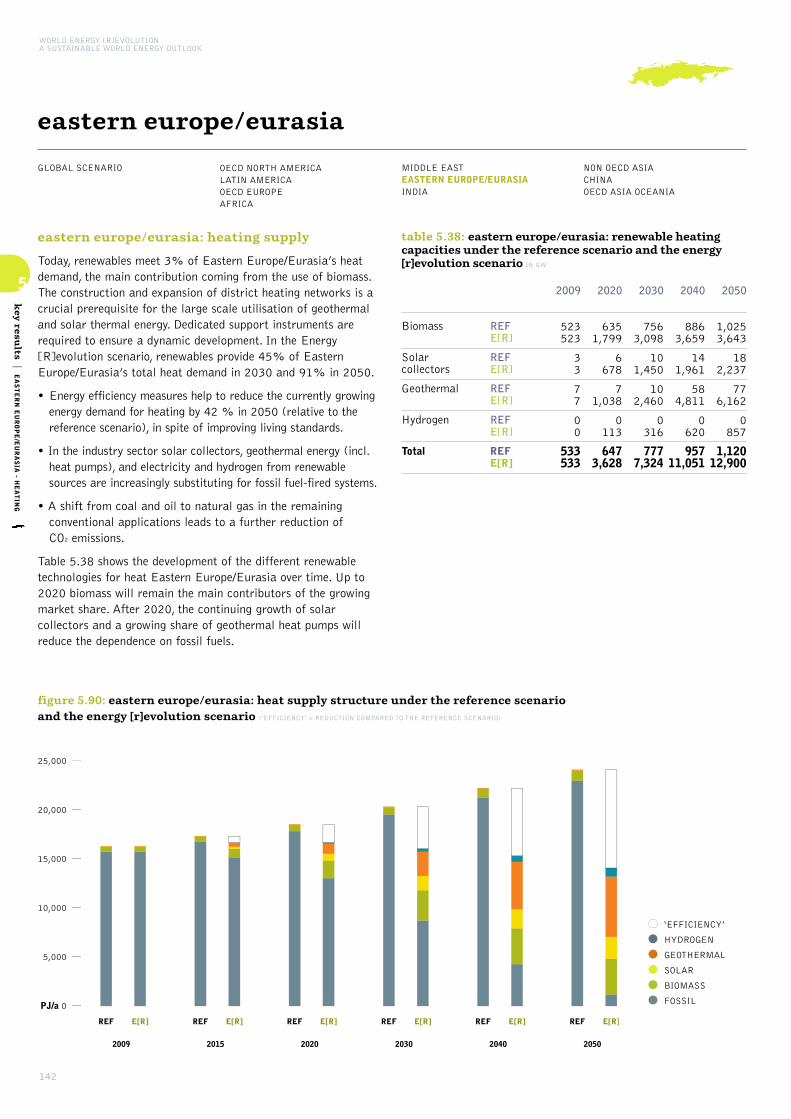
142
5
key resu
lts|EASTERN EUROPE/EURASIA - H
EATING
WORLD ENERGY [R]EVOLUTIONA SUSTAINABLE WORLD ENERGY OUTLOOK
GLOBAL SCENARIO OECD NORTH AMERICALATIN AMERICAOECD EUROPE AFRICA
MIDDLE EASTEASTERN EUROPE/EURASIAINDIA
NON OECD ASIACHINAOECD ASIA OCEANIA
eastern europe/eurasia
eastern europe/eurasia: heating supply
Today, renewables meet 3% of Eastern Europe/Eurasia’s heatdemand, the main contribution coming from the use of biomass.The construction and expansion of district heating networks is acrucial prerequisite for the large scale utilisation of geothermaland solar thermal energy. Dedicated support instruments arerequired to ensure a dynamic development. In the Energy[R]evolution scenario, renewables provide 45% of EasternEurope/Eurasia’s total heat demand in 2030 and 91% in 2050.
• Energy efficiency measures help to reduce the currently growingenergy demand for heating by 42 % in 2050 (relative to thereference scenario), in spite of improving living standards.
• In the industry sector solar collectors, geothermal energy (incl.heat pumps), and electricity and hydrogen from renewablesources are increasingly substituting for fossil fuel-fired systems.
• A shift from coal and oil to natural gas in the remainingconventional applications leads to a further reduction of CO2 emissions.
Table 5.38 shows the development of the different renewabletechnologies for heat Eastern Europe/Eurasia over time. Up to2020 biomass will remain the main contributors of the growingmarket share. After 2020, the continuing growth of solarcollectors and a growing share of geothermal heat pumps willreduce the dependence on fossil fuels.
table 5.38: eastern europe/eurasia: renewable heatingcapacities under the reference scenario and the energy[r]evolution scenario IN GW
2020
6351,799
6678
71,038
0113
6473,628
2040
8863,659
141,961
584,811
0620
95711,051
2050
1,0253,643
182,237
776,162
0857
1,12012,900
Biomass
Solarcollectors
Geothermal
Hydrogen
Total
REFE[R]
REFE[R]
REFE[R]
REFE[R]
REFE[R]
2030
7563,098
101,450
102,460
0316
7777,324
2009
523523
33
77
00
533533
figure 5.90: eastern europe/eurasia: heat supply structure under the reference scenario and the energy [r]evolution scenario (‘EFFICIENCY’ = REDUCTION COMPARED TO THE REFERENCE SCENARIO)
REF REF REF REF REF REFE[R] E[R] E[R] E[R] E[R] E[R]
2009 2015 2020 2030 2040 2050
PJ/a 0
5,000
10,000
15,000
20,000
25,000
•‘EFFICIENCY’
• HYDROGEN
• GEOTHERMAL
• SOLAR
• BIOMASS
• FOSSIL
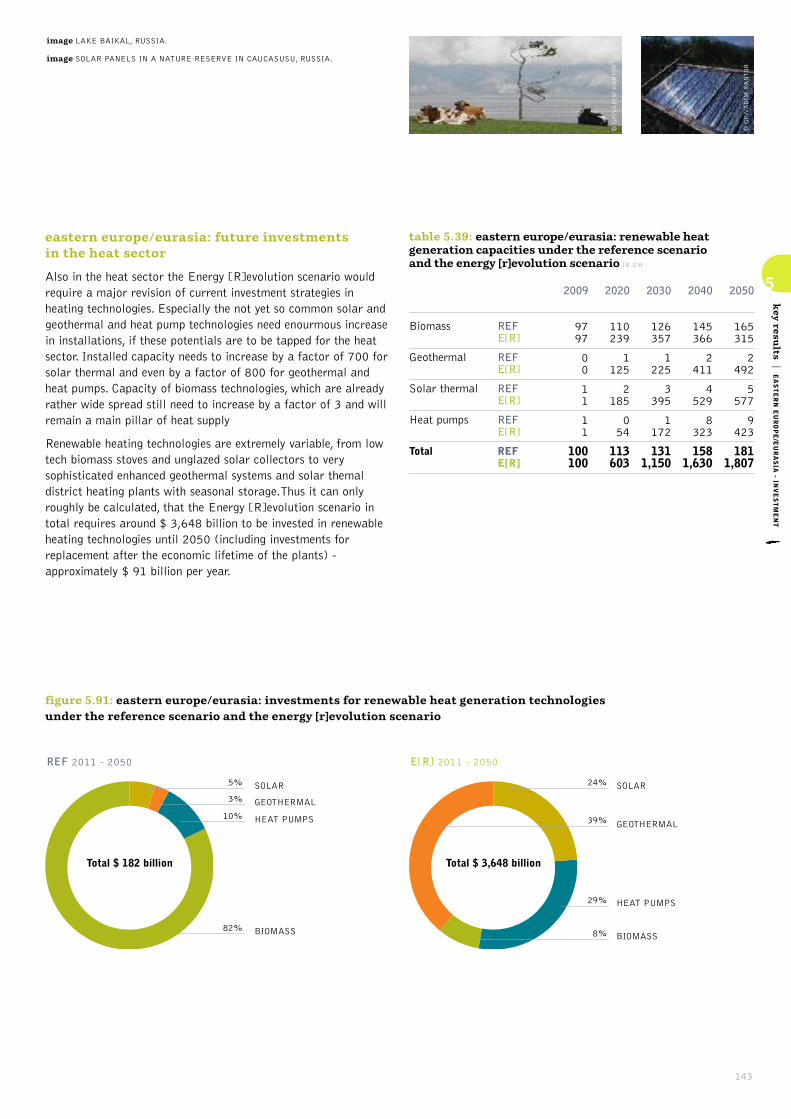
143
5
key resu
lts|EASTERN EUROPE/EURASIA - IN
VESTMENT
eastern europe/eurasia: future investments in the heat sector
Also in the heat sector the Energy [R]evolution scenario wouldrequire a major revision of current investment strategies inheating technologies. Especially the not yet so common solar andgeothermal and heat pump technologies need enourmous increasein installations, if these potentials are to be tapped for the heatsector. Installed capacity needs to increase by a factor of 700 forsolar thermal and even by a factor of 800 for geothermal andheat pumps. Capacity of biomass technologies, which are alreadyrather wide spread still need to increase by a factor of 3 and willremain a main pillar of heat supply
Renewable heating technologies are extremely variable, from lowtech biomass stoves and unglazed solar collectors to verysophisticated enhanced geothermal systems and solar themaldistrict heating plants with seasonal storage.Thus it can onlyroughly be calculated, that the Energy [R]evolution scenario intotal requires around $ 3,648 billion to be invested in renewableheating technologies until 2050 (including investments forreplacement after the economic lifetime of the plants) -approximately $ 91 billion per year.
table 5.39: eastern europe/eurasia: renewable heatgeneration capacities under the reference scenario and the energy [r]evolution scenario IN GW
2020
110239
1125
2185
054
113603
2040
145366
2411
4529
8323
1581,630
2050
165315
2492
5577
9423
1811,807
Biomass
Geothermal
Solar thermal
Heat pumps
Total
REFE[R]
REFE[R]
REFE[R]
REFE[R]
REFE[R]
2030
126357
1225
3395
1172
1311,150
2009
9797
00
11
11
100100
figure 5.91: eastern europe/eurasia: investments for renewable heat generation technologies under the reference scenario and the energy [r]evolution scenario
REF 2011 - 2050
5% SOLAR
3% GEOTHERMAL
82% BIOMASS
10% HEAT PUMPS
Total $ 182 billion
E[R] 2011 - 2050
24% SOLAR
29% HEAT PUMPS
8% BIOMASS
39% GEOTHERMAL
Total $ 3,648 billion
© GP/VADIM KANTOR
© GP/VADIM KANTOR
image LAKE BAIKAL, RUSSIA.
image SOLAR PANELS IN A NATURE RESERVE IN CAUCASUSU, RUSSIA.
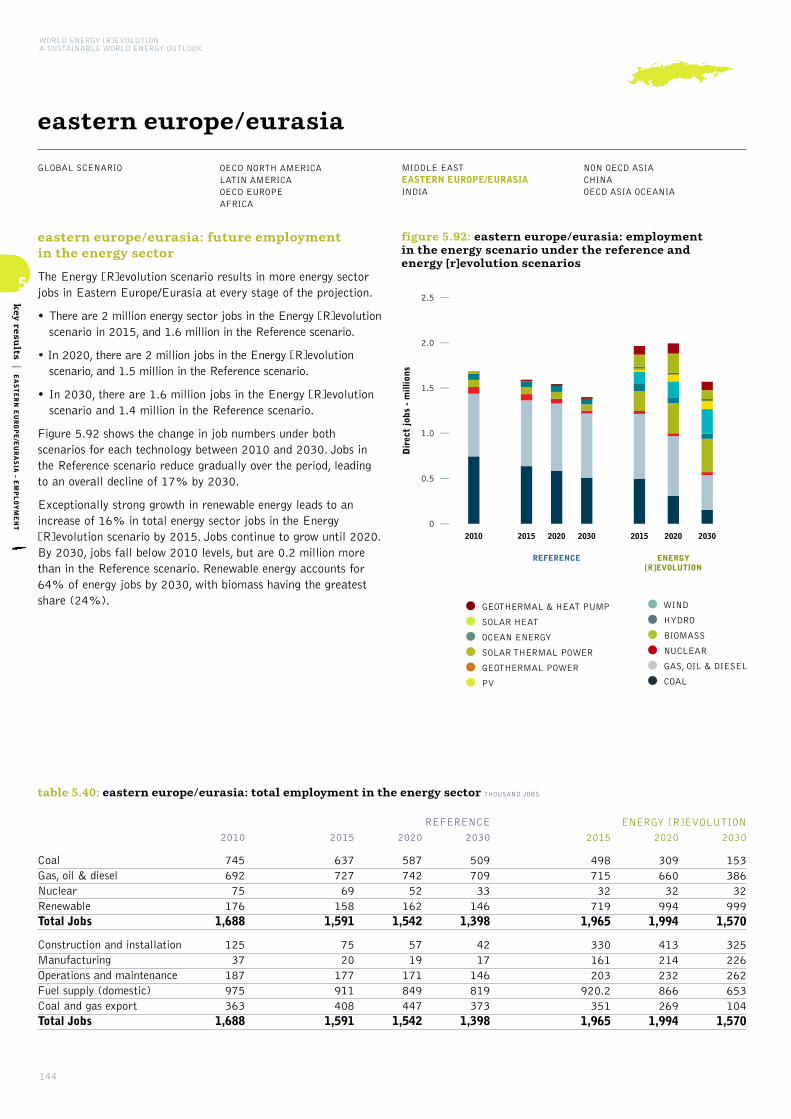
144
5
key resu
lts|EASTERN EUROPE/EURASIA - E
MPLOYMENT
WORLD ENERGY [R]EVOLUTIONA SUSTAINABLE WORLD ENERGY OUTLOOK
GLOBAL SCENARIO OECD NORTH AMERICALATIN AMERICAOECD EUROPE AFRICA
MIDDLE EASTEASTERN EUROPE/EURASIAINDIA
NON OECD ASIACHINAOECD ASIA OCEANIA
eastern europe/eurasia
eastern europe/eurasia: future employment in the energy sector
The Energy [R]evolution scenario results in more energy sectorjobs in Eastern Europe/Eurasia at every stage of the projection.
• There are 2 million energy sector jobs in the Energy [R]evolutionscenario in 2015, and 1.6 million in the Reference scenario.
• In 2020, there are 2 million jobs in the Energy [R]evolutionscenario, and 1.5 million in the Reference scenario.
• In 2030, there are 1.6 million jobs in the Energy [R]evolutionscenario and 1.4 million in the Reference scenario.
Figure 5.92 shows the change in job numbers under bothscenarios for each technology between 2010 and 2030. Jobs inthe Reference scenario reduce gradually over the period, leadingto an overall decline of 17% by 2030.
Exceptionally strong growth in renewable energy leads to anincrease of 16% in total energy sector jobs in the Energy[R]evolution scenario by 2015. Jobs continue to grow until 2020.By 2030, jobs fall below 2010 levels, but are 0.2 million morethan in the Reference scenario. Renewable energy accounts for64% of energy jobs by 2030, with biomass having the greatestshare (24%).
REFERENCE ENERGY[R]EVOLUTION
2010 2015 2020 2030 2015 2020 2030
0
0.5
1.0
1.5
2.0
2.5
Dir
ect
jobs
- m
illio
ns
figure 5.92: eastern europe/eurasia: employment in the energy scenario under the reference and energy [r]evolution scenarios
•GEOTHERMAL & HEAT PUMP
• SOLAR HEAT
• OCEAN ENERGY
• SOLAR THERMAL POWER
• GEOTHERMAL POWER
• PV
•WIND
• HYDRO
• BIOMASS
• NUCLEAR
• GAS, OIL & DIESEL
• COAL
table 5.40: eastern europe/eurasia: total employment in the energy sector THOUSAND JOBS
CoalGas, oil & dieselNuclearRenewableTotal Jobs
Construction and installationManufacturingOperations and maintenanceFuel supply (domestic)Coal and gas exportTotal Jobs
2015
49871532719
1,965
330161203
920.2351
1,965
2020
30966032994
1,994
413214232866269
1,994
2030
15338632999
1,570
325226262653104
1,570
ENERGY [R]EVOLUTION
2015
63772769158
1,591
7520177911408
1,591
2010
74569275176
1,688
12537187975363
1,688
2020
58774252162
1,542
5719171849447
1,542
2030
50970933146
1,398
4217146819373
1,398
REFERENCE
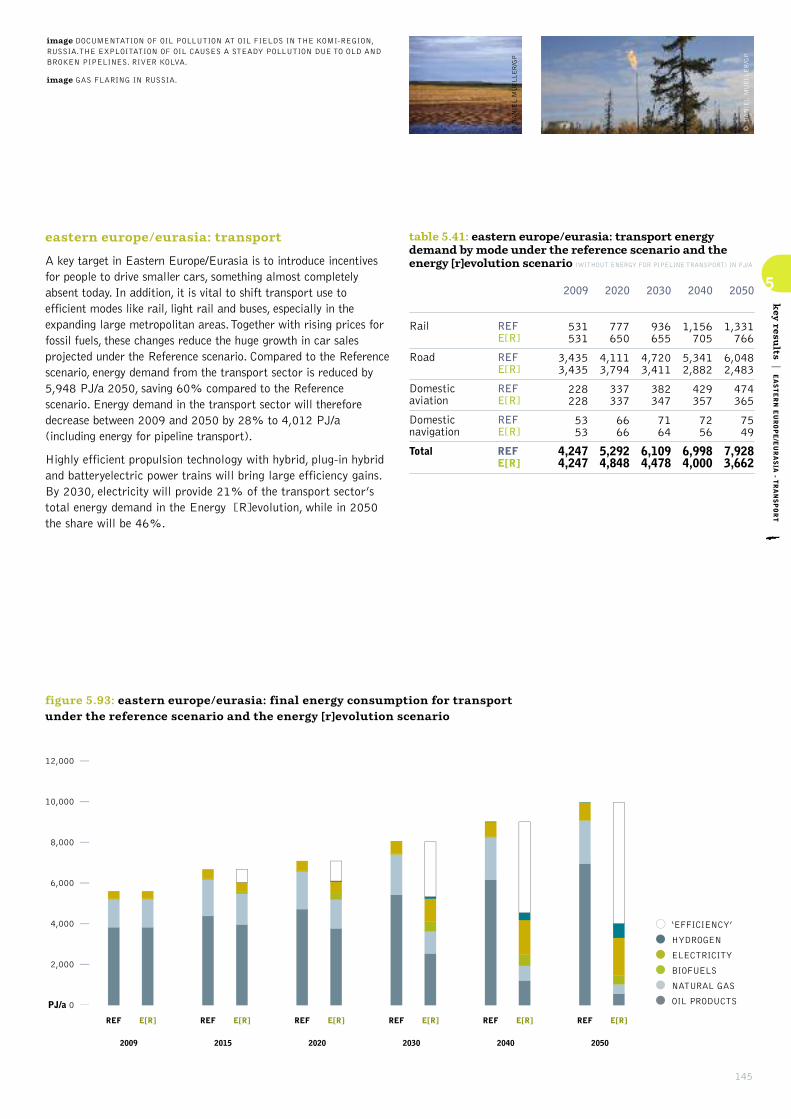
145
5
key resu
lts|EASTERN EUROPE/EURASIA - T
RANSPORT
eastern europe/eurasia: transport
A key target in Eastern Europe/Eurasia is to introduce incentivesfor people to drive smaller cars, something almost completelyabsent today. In addition, it is vital to shift transport use toefficient modes like rail, light rail and buses, especially in theexpanding large metropolitan areas. Together with rising prices forfossil fuels, these changes reduce the huge growth in car salesprojected under the Reference scenario. Compared to the Referencescenario, energy demand from the transport sector is reduced by5,948 PJ/a 2050, saving 60% compared to the Referencescenario. Energy demand in the transport sector will thereforedecrease between 2009 and 2050 by 28% to 4,012 PJ/a(including energy for pipeline transport).
Highly efficient propulsion technology with hybrid, plug-in hybridand batteryelectric power trains will bring large efficiency gains.By 2030, electricity will provide 21% of the transport sector’stotal energy demand in the Energy [R]evolution, while in 2050the share will be 46%.
table 5.41: eastern europe/eurasia: transport energydemand by mode under the reference scenario and theenergy [r]evolution scenario (WITHOUT ENERGY FOR PIPELINE TRANSPORT) IN PJ/A
2020
777650
4,1113,794
337337
6666
5,2924,848
2040
1,156705
5,3412,882
429357
7256
6,9984,000
2050
1,331766
6,0482,483
474365
7549
7,9283,662
Rail
Road
Domesticaviation
Domesticnavigation
Total
REFE[R]
REFE[R]
REFE[R]
REFE[R]
REFE[R]
2030
936655
4,7203,411
382347
7164
6,1094,478
2009
531531
3,4353,435
228228
5353
4,2474,247
figure 5.93: eastern europe/eurasia: final energy consumption for transport under the reference scenario and the energy [r]evolution scenario
REF REF REF REF REF REFE[R] E[R] E[R] E[R] E[R] E[R]
2009 2015 2020 2030 2040 2050
PJ/a 0
2,000
4,000
6,000
8,000
10,000
12,000
•‘EFFICIENCY’
• HYDROGEN
• ELECTRICITY
• BIOFUELS
• NATURAL GAS
• OIL PRODUCTS
•WIND
• HYDRO
• BIOMASS
• NUCLEAR
• GAS, OIL & DIESEL
• COAL
© DANIEL MUELLER/GP
© DANIEL MUELLER/GP
image DOCUMENTATION OF OIL POLLUTION AT OIL FIELDS IN THE KOMI-REGION,RUSSIA.THE EXPLOITATION OF OIL CAUSES A STEADY POLLUTION DUE TO OLD ANDBROKEN PIPELINES. RIVER KOLVA.
image GAS FLARING IN RUSSIA.

146
5
key resu
lts|EASTERN EUROPE/EURASIA - C
O2EMISSIONS & ENERGY CONSUMPTION
WORLD ENERGY [R]EVOLUTIONA SUSTAINABLE WORLD ENERGY OUTLOOK
GLOBAL SCENARIO OECD NORTH AMERICALATIN AMERICAOECD EUROPE AFRICA
MIDDLE EASTEASTERN EUROPE/EURASIAINDIA
NON OECD ASIACHINAOECD ASIA OCEANIA
eastern europe/eurasia
eastern europe/eurasia: development of CO2 emissions
Whilst Eastern Europe/Eurasia`s emissions of CO2 will increase by43% between 2009 and 2050 under the Reference scenario,under the Energy [R]evolution scenario they will decrease from2,483 million tonnes in 2009 to 243 million tonnes in 2050.Annual per capita emissions will drop from 7.3 tonnes to 0.7tonne. In spite of the phasing out of nuclear energy and increasingdemand, CO2 emissions will decrease in the electricity sector. Inthe long run efficiency gains and the increased use of renewableenergy in vehicles will reduce emissions in the transport sector.With a share of 43% of CO2, the power sector will be the largestsources of emissions in 2050. By 2050, Eastern Europe/Eurasia’sCO2 emissions are 94% below 1990 levels.
eastern europe/eurasia: primary energy consumption
Taking into account the assumptions discussed above, theresulting primary energy consumption under the Energy[R]evolution scenario is shown in Figure 5.95. Compared to theReference scenario, overall primary energy demand will be lowerby 46% in 2050. Around 78% of the remaining demand will becovered by renewable energy sources.
The Energy [R]evolution version aims to phases out coal and oil asfast as technically and economically possible. This is made possiblemainly by replacement of coal power plants with renewables and afast introduction of very efficient electric vehicles in the transportsector to replace oil combustion engines. This leads to an overallrenewable primary energy share of 36% in 2030 and 78% in2050. Nuclear energy is phased out just after 2035.
figure 5.94: eastern europe/eurasia: development of CO2
emissions by sector under the energy [r]evolutionscenario (‘EFFICIENCY’ = REDUCTION COMPARED TO THE REFERENCE SCENARIO)
REF REF REF REF REF REFE[R] E[R] E[R] E[R] E[R] E[R]
2009 2015 2020 2030 2040 2050
0
500
1,000
1,500
2,000
2,500
3,000
3,500
4,000
0
50
100
150
200
250
300
350
Mill t/aMillion people
POPULATION DEVELOPMENT
• SAVINGS FROM ‘EFFICIENCY’ & RENEWABLES
• OTHER SECTORS
• INDUSTRY
•TRANSPORT
• POWER GENERATION
figure 5.95: eastern europe/eurasia: primary energy consumption under the reference scenario and the energy [r]evolution scenario (‘EFFICIENCY’ = REDUCTION COMPARED TO THE REFERENCE SCENARIO)
PJ/a 0
10,000
20,000
30,000
40,000
50,000
60,000
70,000
REF REF REF REF REF REFE[R] E[R] E[R] E[R] E[R] E[R]
2009 2015 2020 2030 2040 2050
•‘EFFICIENCY’
• OCEAN ENERGY
• GEOTHERMAL
• SOLAR
• BIOMASS
•WIND
• HYDRO
• NATURAL GAS
• OIL
• COAL
• NUCLEAR

147
5
key resu
lts|EASTERN EUROPE/EURASIA - IN
VESTMENT & FUEL COSTS
table 5.42: eastern europe/eurasia: investment costs for electricity generation and fuel cost savings under the energy [r]evolution scenario compared to the reference scenario
INVESTMENT COSTS
DIFFERENCE E[R] VERSUS REF
Conventional (fossil & nuclear)
Renewables
Total
CUMULATIVE FUEL COST SAVINGS
SAVINGS CUMULATIVE E[R] VERSUS REF
Fuel oil
Gas
Hard coal
Lignite
Total
$
billion $
billion $
billion $
billion $/a
billion $/a
billion $/a
billion $/a
billion $/a
2021 - 2030
-158.4
504.8
346.4
114.7
910.1
72.1
33.2
1,130.1
2011 - 2020
-161.4
291.8
130.5
51.5
144.1
29.9
8.4
234.0
2011 - 2050
-629.9
2,590.7
1,960.8
346.8
6,681.7
486.7
189.6
7,704.8
2011 - 2050 AVERAGE
PER ANNUM
-15.7
64.8
49.0
8.7
167.0
12.2
4.7
192.6
2041 - 2050
-171.0
925.1
754.1
79.4
3,376.7
235.0
85.5
3,776.5
2031 - 2040
-139.1
868.9
729.8
101.3
2,250.8
149.7
62.5
2,564.3
© DENIS SINYAKOV/GP
© GP/STEVE MORGAN
image AN AERIAL VIEW OF PERMAFROST TUNDRA IN THE YAMAL PENINSULA. THEENTIRE REGION IS UNDER HEAVY THREAT FROM GLOBAL WARMING ASTEMPERATURES INCREASE AND RUSSIAS ANCIENT PERMAFROST MELTS.
image A VIEW OF THE NEW MUSLYUMOVO VILLAGE, JUST 1,6 KMS OUTSIDE THE OLDMUSLYUMOVO, ONE OF THE COUNTRY’S MOST LETHAL NUCLEAR DUMPING GROUNDS.

148
5
key resu
lts|INDIA - D
EMAND
WORLD ENERGY [R]EVOLUTIONA SUSTAINABLE WORLD ENERGY OUTLOOK
GLOBAL SCENARIO OECD NORTH AMERICALATIN AMERICAOECD EUROPE AFRICA
MIDDLE EASTEASTERN EUROPE/EURASIAINDIA
NON OECD ASIACHINAOECD ASIA OCEANIA
india
india: energy demand by sector
The future development pathways for India’s energy demand areshown in Figure 5.96 for the Reference scenario and the Energy[R]evolution scenario. Under the Reference scenario, totalprimary energy demand in India increases by 206% from thecurrent 29,149 PJ/a to about 89,100 PJ/a in 2050. In theEnergy [R]evolution scenario, by contrast, energy demandincreases by 70% compared to current consumption and it isexpected by 2050 to reach 49,600 PJ/a.
Under the Energy [R]evolution scenario, electricity demand in theindustrial, residential, and service sectors is expected to fallslightly below the current level (see Figure 5.97). In the transportsector – for both freight and persons – a shift towards electrictrains and public transport as well as efficient electric vehicles isexpected. Fossil fuels for industrial process heat generation arealso phased out and replaced by electric geothermal heat pumpsand hydrogen. This means that electricity demand in the Energy[R]evolution increases in those sectors. Total electricity demandreaches 4,050 TWh/a in 2050, 4% above the Reference case.
Efficiency gains in the heat supply sector are larger than in theelectricity sector. Under the Energy [R]evolution scenario, finaldemand for heat supply can even be reduced significantly (see Figure 5.99). Compared to the Reference scenario,consumption equivalent to 3560 PJ/a is avoided throughefficiency measures by 2050.
figure 5.96: india: total final energy demand by sector under the reference scenario and the energy [r]evolution scenario (‘EFFICIENCY’ = REDUCTION COMPARED TO THE REFERENCE SCENARIO)
• ‘EFFICIENCY’
• OTHER SECTORS
• INDUSTRY
•TRANSPORT
REF E[R]
2009
REF E[R]
2015
REF E[R]
2020
REF E[R]
2030
REF E[R]
2040
REF E[R]
2050
PJ/a 0
5,000
10,000
15,000
20,000
25,000
30,000
35,000
40,000
45,000
50,000
55,000
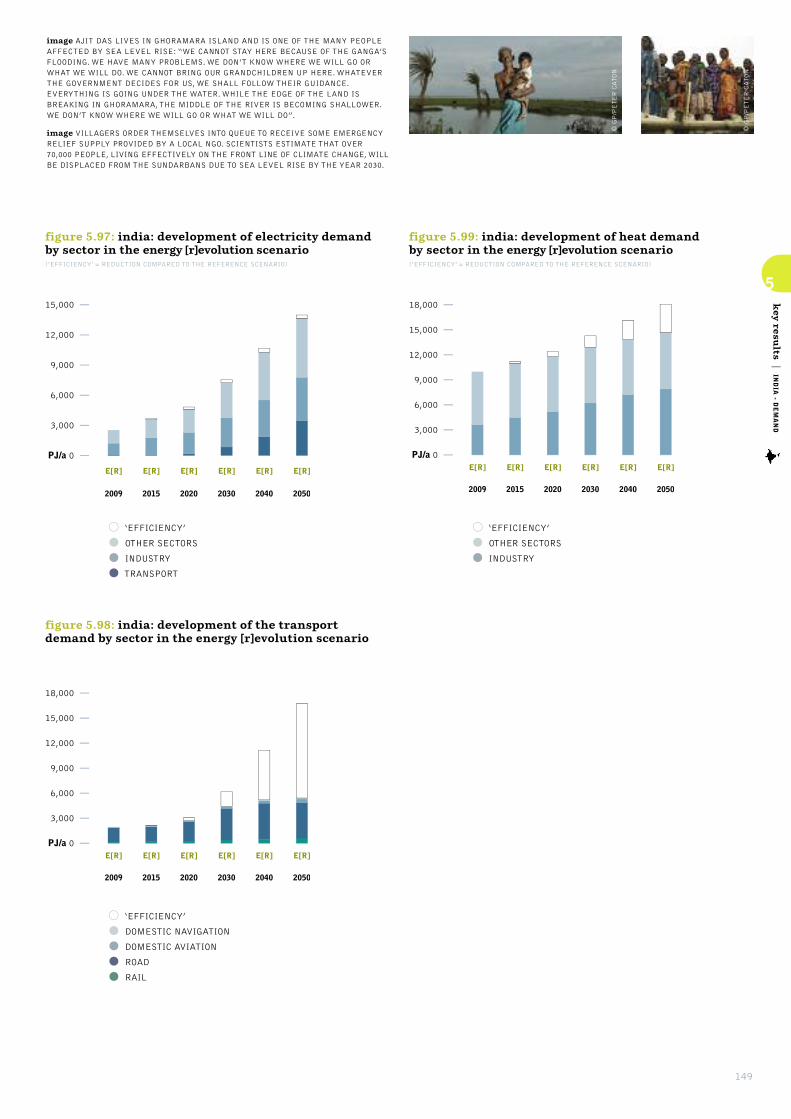
149
5
key resu
lts|INDIA - D
EMAND
figure 5.97: india: development of electricity demand by sector in the energy [r]evolution scenario(‘EFFICIENCY’ = REDUCTION COMPARED TO THE REFERENCE SCENARIO)
• ‘EFFICIENCY’
• OTHER SECTORS
• INDUSTRY
•TRANSPORT
E[R] E[R] E[R] E[R] E[R] E[R]
2009 2015 2020 2030 2040 2050
PJ/a 0
3,000
6,000
9,000
12,000
15,000
18,000
figure 5.98: india: development of the transportdemand by sector in the energy [r]evolution scenario
•‘EFFICIENCY’
• DOMESTIC NAVIGATION
• DOMESTIC AVIATION
• ROAD
• RAIL
E[R] E[R] E[R] E[R] E[R] E[R]
2009 2015 2020 2030 2040 2050
PJ/a 0
3,000
6,000
9,000
12,000
15,000
E[R] E[R] E[R] E[R] E[R] E[R]
2009 2015 2020 2030 2040 2050
PJ/a 0
3,000
6,000
9,000
12,000
15,000
18,000
figure 5.99: india: development of heat demand by sector in the energy [r]evolution scenario(‘EFFICIENCY’ = REDUCTION COMPARED TO THE REFERENCE SCENARIO)
• ‘EFFICIENCY’
• OTHER SECTORS
• INDUSTRY
© GP/PETER CATON
© GP/PETER CATON
image AJIT DAS LIVES IN GHORAMARA ISLAND AND IS ONE OF THE MANY PEOPLEAFFECTED BY SEA LEVEL RISE: “WE CANNOT STAY HERE BECAUSE OF THE GANGA’SFLOODING. WE HAVE MANY PROBLEMS. WE DON’T KNOW WHERE WE WILL GO ORWHAT WE WILL DO. WE CANNOT BRING OUR GRANDCHILDREN UP HERE. WHATEVERTHE GOVERNMENT DECIDES FOR US, WE SHALL FOLLOW THEIR GUIDANCE.EVERYTHING IS GOING UNDER THE WATER. WHILE THE EDGE OF THE LAND ISBREAKING IN GHORAMARA, THE MIDDLE OF THE RIVER IS BECOMING SHALLOWER.WE DON’T KNOW WHERE WE WILL GO OR WHAT WE WILL DO”.
image VILLAGERS ORDER THEMSELVES INTO QUEUE TO RECEIVE SOME EMERGENCYRELIEF SUPPLY PROVIDED BY A LOCAL NGO. SCIENTISTS ESTIMATE THAT OVER70,000 PEOPLE, LIVING EFFECTIVELY ON THE FRONT LINE OF CLIMATE CHANGE, WILLBE DISPLACED FROM THE SUNDARBANS DUE TO SEA LEVEL RISE BY THE YEAR 2030.

150
5
key resu
lts|INDIA - E
LECTRICITY GENERATION
WORLD ENERGY [R]EVOLUTIONA SUSTAINABLE WORLD ENERGY OUTLOOK
GLOBAL SCENARIO OECD NORTH AMERICALATIN AMERICAOECD EUROPE AFRICA
MIDDLE EASTEASTERN EUROPE/EURASIAINDIA
NON OECD ASIACHINAOECD ASIA OCEANIA
india
india: electricity generation
The development of the electricity supply market is charaterisedby a dynamically growing renewable energy market and anincreasing share of renewable electricity. This will compensate forthe phasing out of nuclear energy and reduce the number of fossilfuel-fired power plants required for grid stabilisation. By 2050,92% of the electricity produced in India will come fromrenewable energy sources. ‘New’ renewables – mainly wind, solarthermal energy and PV – will contribute 74% of electricitygeneration. The Energy [R]evolution scenario projects animmediate market development with high annual growth ratesachieving a renewable electricity share of 32% already by 2020and 62% by 2030. The installed capacity of renewables willreach 548 GW in 2030 and 1,356 GW by 2050.
Table 5.43 shows the comparative evolution of the differentrenewable technologies in India over time. Up to 2020 hydro andwind will remain the main contributors of the growing marketshare. After 2020, the continuing growth of wind will becomplemented by electricity from biomass, photovoltaics andsolar thermal (CSP) energy. The Energy [R]evolution scenariowill lead to a high share of fluctuating power generation sources(photovoltaic, wind and ocean) of 31% by 2030 and 40% by2050, therefore the expansion of smart grids, demand sidemanagement (DSM) and storage capacity e.g. from the increasedshare of electric vehicles will be used for a better grid integrationand power generation management.
table 5.43: india: renewable electricity generationcapacity under the reference scenario and the energy [r]evolution scenario IN GW
2020
5562
413
3096
01
1030
04
01
99207
2040
9866
1838
51265
060
44338
0142
029
213937
2050
11967
2762
60335
0103
68519
1223
047
2761,356
Hydro
Biomass
Wind
Geothermal
PV
CSP
Ocean energy
Total
REFE[R]
REFE[R]
REFE[R]
REFE[R]
REFE[R]
REFE[R]
REFE[R]
REFE[R]
2030
7764
1019
42185
024
26161
079
017
155548
2009
3939
22
1111
00
00
00
00
5252
figure 5.100: india: electricity generation structure under the reference scenario and the energy [r]evolution scenario (INCLUDING ELECTRICITY FOR ELECTROMOBILITY, HEAT PUMPS AND HYDROGEN GENERATION)
TWh/a 0
1,000
2,000
3,000
4,000
5,000
REF REF REF REF REF REFE[R] E[R] E[R] E[R] E[R] E[R]
2009 2015 2020 2030 2040 2050
•OCEAN ENERGY
• SOLAR THERMAL
• GEOTHERMAL
• BIOMASS
• PV
•WIND
• HYDRO
• NUCLEAR
• DIESEL
• OIL
• NATURAL GAS
• LIGNITE
• COAL

151
5
key resu
lts|INDIA - E
LECTRICITY GENERATION
india: future costs of electricity generation
Figure 5.101 shows that the introduction of renewable technologiesunder the Energy [R]evolution scenario slightly increases the costsof electricity generation in India compared to the Referencescenario. This difference will be less than $ 1 cent/kWh up to 2020,however. Because of the lower CO2 intensity of electricitygeneration, electricity generation costs will become economicallyfavourable under the Energy [R]evolution scenario and by 2050costs will be $ 7.2 cents/kWh below those in the Reference version.
Under the Reference scenario, by contrast, unchecked growth indemand, an increase in fossil fuel prices and the cost of CO2
emissions result in total electricity supply costs rising from today’s $100 billion per year to more than $ 932 billion in 2050. Figure5.101 shows that the Energy [R]evolution scenario not onlycomplies with India’s CO2 reduction targets but also helps tostabilise energy costs. Increasing energy efficiency and shiftingenergy supply to renewables lead to long term costs for electricitysupply that are 23% lower than in the Reference scenario.
figure 5.101: india: total electricity supply costs and specific electricity generation costs under two scenarios
2009 2015 2020 2030 2040 2050
0
2
4
6
8
10
12
14
16
18
ct/kWhBn$/a
0
200
400
600
800
1,000
SPEC. ELECTRICITY GENERATION COSTS (REF)
SPEC. ELECTRICITY GENERATION COSTS (E[R])
• ‘EFFICIENCY’ MEASURES
• REFERENCE SCENARIO (REF)
• ENERGY [R]EVOLUTION (E[R])
india: future investments in the power sector
It would require about $ 4,680 billion in additional investmentfor the Energy [R]evolution scenario to become reality (includinginvestments for replacement after the economic lifetime of theplants) - approximately $ 117 billion annually or $ 69 billionmore than in the Reference scenario ($ 1,905 billion). Under theReference version, the levels of investment in conventional power
plants add up to almost 56% while approximately 44% would beinvested in renewable energy and cogeneration (CHP) until 2050.Under the Energy [R]evolution scenario, however, India wouldshift almost 97% of the entire investment towards renewablesand cogeneration. Until 2030, the fossil fuel share of powersector investment would be focused mainly on CHP plants. Theaverage annual investment in the power sector under the Energy[R]evolution scenario between today and 2050 would beapproximately $ 117 billion.
Because renewable energy has no fuel costs, however, the fuelcost savings in the Energy [R]evolution scenario reach a total of$ 5,500 billion up to 2050, or $ 138 billion per year. The totalfuel cost savings herefore would cover 200% of the totaladditional investments compared to the Reference scenario. Theserenewable energy sources would then go on to produce electricitywithout any further fuel costs beyond 2050, while the costs forcoal and gas will continue to be a burden on national economies.
figure 5.102: india: investment shares - referencescenario versus energy [r]evolution scenario
REF 2011 - 2050
44% FOSSIL
13% NUCLEAR
5% CHP
38% RENEWABLES
Total $ 1,905 billion
E[R] 2011 - 2050
3% FOSSIL & NUCLEAR
11% CHP
86% RENEWABLES
Total $ 4,680 billion
© GP/PETER CATON
© MARCUS FRANKEN/GP
image A LOCAL BENGALI WOMAN PLANTS A MANGROVE (SUNDARI) SAPLING ONSAGAR ISLAND IN THE ECOLOGICALLY SENSITIVE SUNDERBANS RIVER DELTAREGION, IN WEST BENGAL. THOUSANDS OF LOCAL PEOPLE WILL JOIN THEMANGROVE PLANTING INITIATIVE LED BY PROFESSOR SUGATA HAZRA FROMJADAVAPUR UNIVERSITY, WHICH WILL HELP TO PROTECT THE COAST FROM EROSIONAND WILL ALSO PROVIDE NUTRIENTS FOR FISH AND CAPTURE CARBON IN THEIREXTENSIVE ROOT SYSTEMS.
image FEMALE WORKER CLEANING A SOLAR OVEN AT A COLLEGE IN TILONIA,RAJASTHAN, INDIA.

152
5
key resu
lts|INDIA - H
EATING
WORLD ENERGY [R]EVOLUTIONA SUSTAINABLE WORLD ENERGY OUTLOOK
GLOBAL SCENARIO OECD NORTH AMERICALATIN AMERICAOECD EUROPE AFRICA
MIDDLE EASTEASTERN EUROPE/EURASIAINDIA
NON OECD ASIACHINAOECD ASIA OCEANIA
india
india: heating supply
Renewables currently provide 55% of India’s energy demand forheat supply, the main contribution coming from biomass.Dedicated support instruments are required to ensure a dynamicfuture development. In the Energy [R]evolution scenario,renewables provide 68% of India’s total heat demand in 2030and 91% in 2050.
• Energy efficiency measures can decrease the specific demand inspite of improving living standards.
• For direct heating, solar collectors, new biomass/biogas heatingsystems as well as geothermal energy are increasingly substitutingfor fossil fuel-fired systems and traditional biomass use.
• A shift from coal and oil to natural gas in the remainingconventional applications will lead to a further reduction ofCO2 emissions.
Table 5.44 shows the development of the different renewabletechnologies for heating in India over time. After 2020, thecontinuing growth of solar collectors and a growing share ofgeothermal heat pumps will reduce the dependence on fossil fuelsand biomass.
table 5.44: india: renewable heating capacities under thereference scenario and the energy [r]evolution scenario INGW
2020
5,8136,117
28742
5205
00
5,8457,064
2040
5,8685,852
902,989
491,908
0341
6,00811,090
2050
5,9945,242
1594,215
733,116
0741
6,22613,313
Biomass
Solarcollectors
Geothermal
Hydrogen
Total
REFE[R]
REFE[R]
REFE[R]
REFE[R]
REFE[R]
2030
5,8335,951
471,981
22814
065
5,9028,811
2009
5,4975,497
1111
00
00
5,5085,508
figure 5.103: india: heat supply structure under the reference scenario and the energy [r]evolution scenario(‘EFFICIENCY’ = REDUCTION COMPARED TO THE REFERENCE SCENARIO)
REF E[R]
2009
REF E[R]
2015
REF E[R]
2020
REF E[R]
2030
REF E[R]
2040
REF E[R]
2050
PJ/a 0
3,000
6,000
9,000
12,000
15,000
18,000
•‘EFFICIENCY’
• HYDROGEN
• GEOTHERMAL
• SOLAR
• BIOMASS
• FOSSIL
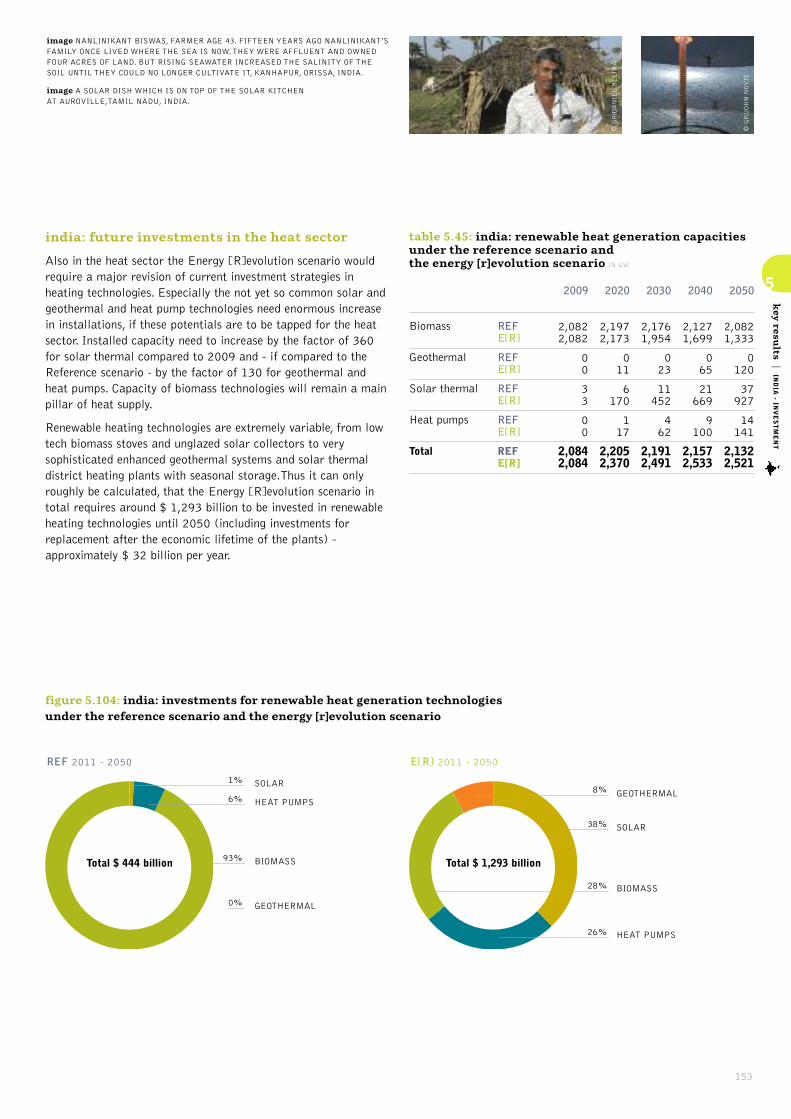
153
5
key resu
lts|INDIA - IN
VESTMENT
india: future investments in the heat sector
Also in the heat sector the Energy [R]evolution scenario wouldrequire a major revision of current investment strategies inheating technologies. Especially the not yet so common solar andgeothermal and heat pump technologies need enormous increasein installations, if these potentials are to be tapped for the heatsector. Installed capacity need to increase by the factor of 360for solar thermal compared to 2009 and - if compared to theReference scenario - by the factor of 130 for geothermal andheat pumps. Capacity of biomass technologies will remain a mainpillar of heat supply.
Renewable heating technologies are extremely variable, from lowtech biomass stoves and unglazed solar collectors to verysophisticated enhanced geothermal systems and solar thermaldistrict heating plants with seasonal storage.Thus it can onlyroughly be calculated, that the Energy [R]evolution scenario intotal requires around $ 1,293 billion to be invested in renewableheating technologies until 2050 (including investments forreplacement after the economic lifetime of the plants) -approximately $ 32 billion per year.
table 5.45: india: renewable heat generation capacitiesunder the reference scenario and the energy [r]evolution scenario IN GW
2020
2,1972,173
011
6170
117
2,2052,370
2040
2,1271,699
065
21669
9100
2,1572,533
2050
2,0821,333
0120
37927
14141
2,1322,521
Biomass
Geothermal
Solar thermal
Heat pumps
Total
REFE[R]
REFE[R]
REFE[R]
REFE[R]
REFE[R]
2030
2,1761,954
023
11452
462
2,1912,491
2009
2,0822,082
00
33
00
2,0842,084
figure 5.104: india: investments for renewable heat generation technologies under the reference scenario and the energy [r]evolution scenario
REF 2011 - 2050
1% SOLAR
0% GEOTHERMAL
93% BIOMASS
6% HEAT PUMPS
Total $ 444 billion
E[R] 2011 - 2050
38% SOLAR
26% HEAT PUMPS
28% BIOMASS
8% GEOTHERMAL
Total $ 1,293 billion
© GP/JOHN NOVIS
© GP/DANIEL BELTRÁ
image NANLINIKANT BISWAS, FARMER AGE 43. FIFTEEN YEARS AGO NANLINIKANT’SFAMILY ONCE LIVED WHERE THE SEA IS NOW. THEY WERE AFFLUENT AND OWNEDFOUR ACRES OF LAND. BUT RISING SEAWATER INCREASED THE SALINITY OF THESOIL UNTIL THEY COULD NO LONGER CULTIVATE IT, KANHAPUR, ORISSA, INDIA.
image A SOLAR DISH WHICH IS ON TOP OF THE SOLAR KITCHEN AT AUROVILLE,TAMIL NADU, INDIA.

154
5
key resu
lts|INDIA - E
MPLOYMENT
WORLD ENERGY [R]EVOLUTIONA SUSTAINABLE WORLD ENERGY OUTLOOK
GLOBAL SCENARIO OECD NORTH AMERICALATIN AMERICAOECD EUROPE AFRICA
MIDDLE EASTEASTERN EUROPE/EURASIAINDIA
NON OECD ASIACHINAOECD ASIA OCEANIA
india
india: future employment in the energy sector
The Energy [R]evolution scenario results in more energy sectorjobs in India at 2015 and 2020. In 2030, job numbers are thesame in both scenarios.
• There are 2.3 million energy sector jobs in the Energy [R]evolution scenario in 2015, and 1.7 million in the Reference scenario.
• In 2020, there are 2.4 million jobs in the Energy [R]evolutionscenario, and 1.8 million in the Reference scenario.
• In 2030, there are 1.5 million jobs in the Energy [R]evolutionscenario and the Reference scenario.
Figure 5.105 shows the change in job numbers under bothscenarios for each technology between 2010 and 2030. Jobs inthe Reference scenario reduce sharply, by 29% by 2015, and39% by 2030.
Exceptionally strong growth in renewable energy compensates forsome of the losses in the fossil fuel sector, particularly in earlieryears. Energy [R]evolution jobs fall by 4% by 2015, increasesomewhat by 2020, and then reduce to 38% below 2010 levelsby 2030. Renewable energy accounts for 78% of energy jobs by2030, with biomass having the greatest share (27%), followed bysolar heating, solar PV, and wind.
REFERENCE ENERGY[R]EVOLUTION
2010 2015 2020 2030 2015 2020 2030
0
0.5
1.0
1.5
2.0
2.5
3.0
Dir
ect
jobs
- m
illio
ns
figure 5.105: india: employment in the energy scenariounder the reference and energy [r]evolution scenarios
•GEOTHERMAL & HEAT PUMP
• SOLAR HEAT
• OCEAN ENERGY
• SOLAR THERMAL POWER
• GEOTHERMAL POWER
• PV
•WIND
• HYDRO
• BIOMASS
• NUCLEAR
• GAS, OIL & DIESEL
• COAL
table 5.46: india: total employment in the energy sector THOUSAND JOBS
CoalGas, oil & dieselNuclearRenewableTotal Jobs
Construction and installationManufacturingOperations and maintenanceFuel supply (domestic)Coal and gas exportTotal Jobs
2015
5821568
1,5582,304
404428161
1,310.2-
2,304
2020
4671317
1,8082,412
591496200
1,125-
2,412
2030
2081203
1,1571,488
393274190632
-1,488
ENERGY [R]EVOLUTION
2015
73513439809
1,716
221111152
1,233-
1,716
2010
1,14216533
1,0642,405
494246135
1,530-
2,405
2020
88013839738
1,794
327155154
1,159-
1,794
2030
84215629432
1,460
22799147987
-1,460
REFERENCE
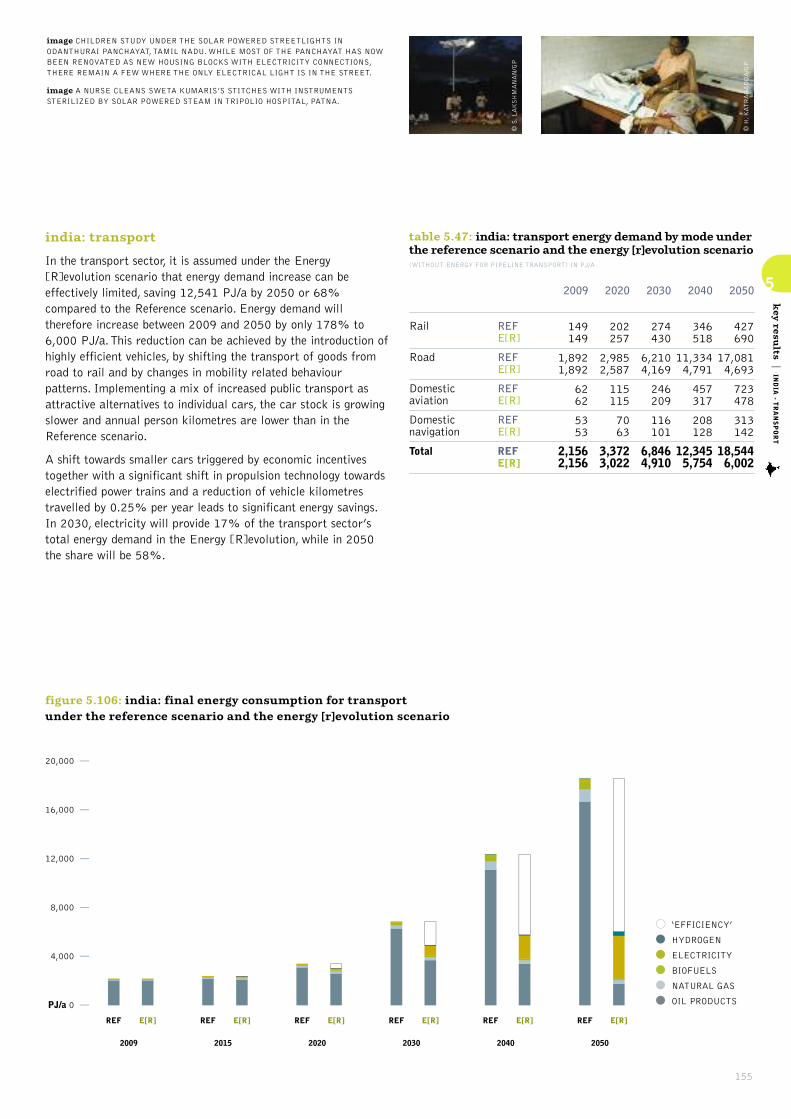
155
5
key resu
lts|INDIA - T
RANSPORT
india: transport
In the transport sector, it is assumed under the Energy[R]evolution scenario that energy demand increase can beeffectively limited, saving 12,541 PJ/a by 2050 or 68%compared to the Reference scenario. Energy demand willtherefore increase between 2009 and 2050 by only 178% to6,000 PJ/a. This reduction can be achieved by the introduction ofhighly efficient vehicles, by shifting the transport of goods fromroad to rail and by changes in mobility related behaviourpatterns. Implementing a mix of increased public transport asattractive alternatives to individual cars, the car stock is growingslower and annual person kilometres are lower than in theReference scenario.
A shift towards smaller cars triggered by economic incentivestogether with a significant shift in propulsion technology towardselectrified power trains and a reduction of vehicle kilometrestravelled by 0.25% per year leads to significant energy savings.In 2030, electricity will provide 17% of the transport sector’stotal energy demand in the Energy [R]evolution, while in 2050the share will be 58%.
table 5.47: india: transport energy demand by mode underthe reference scenario and the energy [r]evolution scenario(WITHOUT ENERGY FOR PIPELINE TRANSPORT) IN PJ/A
2020
202257
2,9852,587
115115
7063
3,3723,022
2040
346518
11,3344,791
457317
208128
12,3455,754
2050
427690
17,0814,693
723478
313142
18,5446,002
Rail
Road
Domesticaviation
Domesticnavigation
Total
REFE[R]
REFE[R]
REFE[R]
REFE[R]
REFE[R]
2030
274430
6,2104,169
246209
116101
6,8464,910
2009
149149
1,8921,892
6262
5353
2,1562,156
figure 5.106: india: final energy consumption for transport under the reference scenario and the energy [r]evolution scenario
REF REF REF REF REF REFE[R] E[R] E[R] E[R] E[R] E[R]
2009 2015 2020 2030 2040 2050
PJ/a 0
4,000
8,000
12,000
16,000
20,000
•‘EFFICIENCY’
• HYDROGEN
• ELECTRICITY
• BIOFUELS
• NATURAL GAS
• OIL PRODUCTS
•WIND
• HYDRO
• BIOMASS
• NUCLEAR
• GAS, OIL & DIESEL
• COAL
© S. LAKSHMANAN/GP
© H. KATRAGADDA/GP
image CHILDREN STUDY UNDER THE SOLAR POWERED STREETLIGHTS INODANTHURAI PANCHAYAT, TAMIL NADU. WHILE MOST OF THE PANCHAYAT HAS NOWBEEN RENOVATED AS NEW HOUSING BLOCKS WITH ELECTRICITY CONNECTIONS,THERE REMAIN A FEW WHERE THE ONLY ELECTRICAL LIGHT IS IN THE STREET.
image A NURSE CLEANS SWETA KUMARIS’S STITCHES WITH INSTRUMENTSSTERILIZED BY SOLAR POWERED STEAM IN TRIPOLIO HOSPITAL, PATNA.

156
5
key resu
lts|INDIA - C
O2EMISSIONS & ENERGY CONSUMPTION
WORLD ENERGY [R]EVOLUTIONA SUSTAINABLE WORLD ENERGY OUTLOOK
GLOBAL SCENARIO OECD NORTH AMERICALATIN AMERICAOECD EUROPE AFRICA
MIDDLE EASTEASTERN EUROPE/EURASIAINDIA
NON OECD ASIACHINAOECD ASIA OCEANIA
india
india: development of CO2 emissions
Whilst India’s emissions of CO2 will increase by 251% under theReference scenario, under the Energy [R]evolution scenario they willdecrease from 1,704 million tonnes in 2009 to 426 million tonnesin 2050. Annual per capita emissions will fall from 1.4 tonnes to 1 tonne in 2030 and 0.3 tonne in 2050. In the long run, efficiencygains and the increased use of renewable electricity in vehicles willalso significantly reduce emissions in the transport sector. With ashare of 34% of CO2 emissions in 2050, the power generationsector will remain the largest energy related source of emissions. By 2050, India’s CO2 emissions are 72% of 1990 levels.
india: primary energy consumption
Taking into account the above assumptions, the resulting primaryenergy consumption under the Energy [R]evolution scenario isshown in Figure 5.108. Compared to the Reference scenario,overall primary energy demand will be reduced by 45% in 2050.Around 81% of the remaining demand (including non energyconsumption) will be covered by renewable energy sources.
The Energy [R]evolution version phases out coal and oil about 10 to15 years faster than the previous Energy [R]evolution scenariopublished in 2010. This is made possible mainly by replacement ofcoal power plants with renewables after 20 rather than 40 yearslifetime and a faster introduction of electric vehicles in the transportsector to replace oil combustion engines. This leads to an overallrenewable primary energy share of 48% in 2030 and 81% in 2050.Nuclear energy is phased out just after 2045.
figure 5.107: india: development of CO2 emissions by sector under the energy [r]evolution scenario(‘EFFICIENCY’ = REDUCTION COMPARED TO THE REFERENCE SCENARIO)
REF REF REF REF REF REFE[R] E[R] E[R] E[R] E[R] E[R]
2009 2015 2020 2030 2040 2050
0 0
200
400
600
800
1,000
1,200
1,400
1,600
1,800
1,000
2,000
3,000
4,000
5,000
6,000
7,000
Mill t/aMillion people
POPULATION DEVELOPMENT
• SAVINGS FROM ‘EFFICIENCY’ & RENEWABLES
• OTHER SECTORS
• INDUSTRY
•TRANSPORT
• POWER GENERATION
figure 5.108: india: primary energy consumption under the reference scenario and the energy [r]evolution scenario (‘EFFICIENCY’ = REDUCTION COMPARED TO THE REFERENCE SCENARIO)
PJ/a 0
10,000
20,000
30,000
40,000
50,000
60,000
70,000
80,000
90,000
REF REF REF REF REF REFE[R] E[R] E[R] E[R] E[R] E[R]
2009 2015 2020 2030 2040 2050
•‘EFFICIENCY’
• OCEAN ENERGY
• GEOTHERMAL
• SOLAR
• BIOMASS
•WIND
• HYDRO
• NATURAL GAS
• OIL
• COAL
• NUCLEAR

157
5
key resu
lts|INDIA - IN
VESTMENT & FUEL COSTS
table 5.48: india: investment costs for electricity generation and fuel cost savings under the energy [r]evolution scenario compared to the reference scenario
INVESTMENT COSTS
DIFFERENCE E[R] VERSUS REF
Conventional (fossil & nuclear)
Renewables
Total
CUMULATIVE FUEL COST SAVINGS
SAVINGS CUMULATIVE E[R] VERSUS REF
Fuel oil
Gas
Hard coal
Lignite
Total
$
billion $
billion $
billion $
billion $/a
billion $/a
billion $/a
billion $/a
billion $/a
2021 - 2030
-247.1
950.2
703.2
79.1
-18.2
589.3
9.0
659.2
2011 - 2020
-87.0
243.0
156.0
21.5
-37.7
84.7
2.9
71.5
2011 - 2050
-1,002.0
3,772.9
2,770.9
254.5
1,119.7
4,074.1
55.9
5,504.1
2011 - 2050 AVERAGE
PER ANNUM
-25.0
94.3
69.3
6.4
28.0
101.9
1.4
137.6
2041 - 2050
-310.5
1,055.0
744.5
67.5
860.0
2,076.8
27.4
3,031.6
2031 - 2040
-310.5
1,055.0
744.5
86.4
315.5
1,323.3
16.6
1,741.8
© H. KATRAGADDA/GP
© VIVEK M/GP
image ANANTHAMMA, A LOCAL WOMAN, RUNS A SMALL SHOP FROM HER HOME INVADIGERE VILLAGE, AN ACTIVITY ENABLED DUE TO THE TIME SAVED BY RUNNINGHER KITCHEN ON BIOGAS. THE COMMUNITY IN BAGEPALLI HAS PIONEERED THE USEOF RENEWABLE ENERGY IN ITS DAILY LIFE THANKS TO THE BIOGAS CLEANDEVELOPMENT MECHANISM (CDM) PROJECT STARTED IN 2006.
image THE 100 KWP STAND-ALONE SOLAR PHOTOVOLTAIC POWER PLANT ATTANGTSE, DURBUK BLOCK, LADAKH. LOCATED 14,500 FEET AMSL IN THE HIMALAYA,THE PLANT SUPPLIES ELECTRICITY TO A CLINIC, SCHOOL AND 347 HOUSES IN THISREMOTE LOCATION, FOR AROUND FIVE HOURS EACH DAY.

158
5
key resu
lts|NON OECD ASIA - D
EMAND
WORLD ENERGY [R]EVOLUTIONA SUSTAINABLE WORLD ENERGY OUTLOOK
GLOBAL SCENARIO OECD NORTH AMERICALATIN AMERICAOECD EUROPE AFRICA
MIDDLE EASTEASTERN EUROPE/EURASIAINDIA
NON OECD ASIACHINAOECD ASIA OCEANIA
non oecd asia
non oecd asia: energy demand by sector
The future development pathways for Non OECD Asia’s finalenergy demand are shown in Figure 5.109 for the Reference andthe Energy [R]evolution scenario. Under the Reference scenario,total primary energy demand in Remaining Asia more thandoubles form the current 32,536 PJ/a to 73,869 PJ/a in 2050.In the Energy [R]evolution scenario, a much smaller 45%increase is expected, reaching 47,026 PJ/a.
Under the Energy [R]evolution scenario, electricity demand isexpected to increase disproportionately in Non OECD Asia (seeFigure 5.110). With the introduction of serious efficiencymeasures in the industry, residential and service sectors, however,an even higher increase can be avoided, leading to electricitydemand (final energy) of around 3,205 TWh/a in 2050.Compared to the Reference case, efficiency measures avoid thegeneration of 1,117 TWh/a or 30% in the industry, residentialand service sectors.
Efficiency gains in the heating sector are also significant (seeFigure 5.112). Compared to the Reference scenario, consumptionequivalent to 3,495 PJ/a is avoided through efficiency measuresby 2050. In the transport sector it is assumed under the Energy[R]evolution scenario that energy demand will rise from 4,887PJ/a in 2009 to 5,707 PJ/a by 2050.
However this still saves 55% compared to the Referencescenario. By 2030 electricity will provide 15% of the transportsector’s total energy demand in the Energy [R]evolution scenarioincreasing to 37% by 2050.
figure 5.109: non oecd asia: total final energy demand by sector under the reference scenario and the energy [r]evolution scenario (‘EFFICIENCY’ = REDUCTION COMPARED TO THE REFERENCE SCENARIO)
• ‘EFFICIENCY’
• OTHER SECTORS
• INDUSTRY
•TRANSPORT
REF E[R]
2009
REF E[R]
2015
REF E[R]
2020
REF E[R]
2030
REF E[R]
2040
REF E[R]
2050
PJ/a 0
10,000
20,000
30,000
40,000
50,000
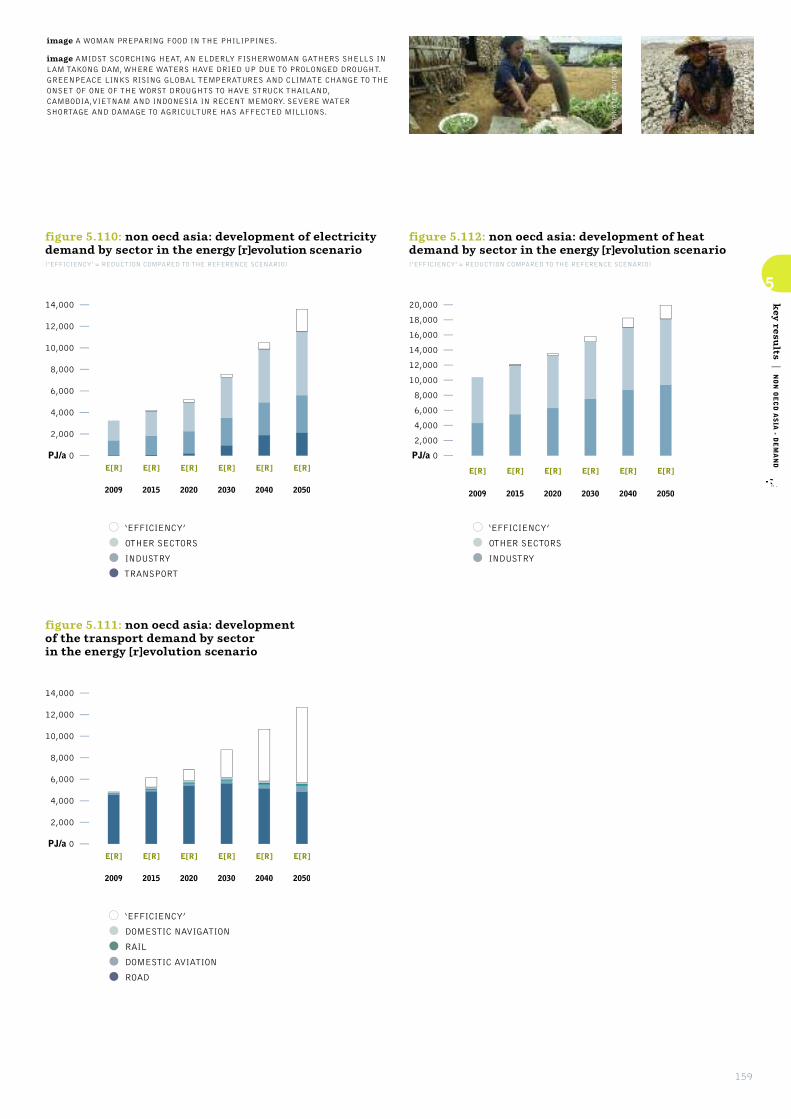
159
5
key resu
lts|NON OECD ASIA - D
EMAND
figure 5.110: non oecd asia: development of electricitydemand by sector in the energy [r]evolution scenario(‘EFFICIENCY’ = REDUCTION COMPARED TO THE REFERENCE SCENARIO)
• ‘EFFICIENCY’
• OTHER SECTORS
• INDUSTRY
•TRANSPORT
E[R] E[R] E[R] E[R] E[R] E[R]
2009 2015 2020 2030 2040 2050
PJ/a 0
2,000
4,000
6,000
8,000
10,000
12,000
14,000
figure 5.111: non oecd asia: development of the transport demand by sector in the energy [r]evolution scenario
•‘EFFICIENCY’
• DOMESTIC NAVIGATION
• RAIL
• DOMESTIC AVIATION
• ROAD
E[R] E[R] E[R] E[R] E[R] E[R]
2009 2015 2020 2030 2040 2050
PJ/a 0
2,000
4,000
6,000
8,000
10,000
12,000
14,000
E[R] E[R] E[R] E[R] E[R] E[R]
2009 2015 2020 2030 2040 2050
PJ/a 0
2,000
4,000
6,000
8,000
10,000
12,000
14,000
16,000
18,000
20,000
figure 5.112: non oecd asia: development of heatdemand by sector in the energy [r]evolution scenario(‘EFFICIENCY’ = REDUCTION COMPARED TO THE REFERENCE SCENARIO)
• ‘EFFICIENCY’
• OTHER SECTORS
• INDUSTRY
© GP/SATAPORN THONGMA
© GP/KATE DAVISON
image A WOMAN PREPARING FOOD IN THE PHILIPPINES.
image AMIDST SCORCHING HEAT, AN ELDERLY FISHERWOMAN GATHERS SHELLS INLAM TAKONG DAM, WHERE WATERS HAVE DRIED UP DUE TO PROLONGED DROUGHT.GREENPEACE LINKS RISING GLOBAL TEMPERATURES AND CLIMATE CHANGE TO THEONSET OF ONE OF THE WORST DROUGHTS TO HAVE STRUCK THAILAND,CAMBODIA,VIETNAM AND INDONESIA IN RECENT MEMORY. SEVERE WATERSHORTAGE AND DAMAGE TO AGRICULTURE HAS AFFECTED MILLIONS.
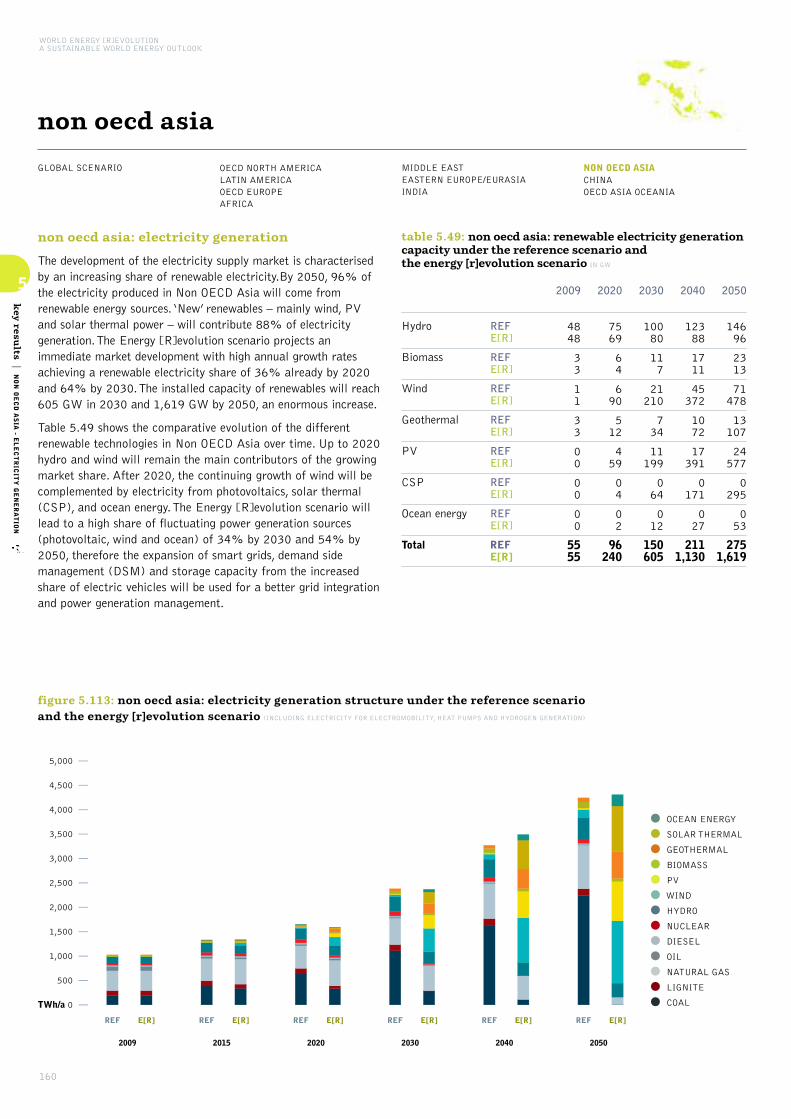
160
5
key resu
lts|NON OECD ASIA - E
LECTRICITY GENERATION
WORLD ENERGY [R]EVOLUTIONA SUSTAINABLE WORLD ENERGY OUTLOOK
GLOBAL SCENARIO OECD NORTH AMERICALATIN AMERICAOECD EUROPE AFRICA
MIDDLE EASTEASTERN EUROPE/EURASIAINDIA
NON OECD ASIACHINAOECD ASIA OCEANIA
non oecd asia
non oecd asia: electricity generation
The development of the electricity supply market is characterisedby an increasing share of renewable electricity.By 2050, 96% ofthe electricity produced in Non OECD Asia will come fromrenewable energy sources. ‘New’ renewables – mainly wind, PVand solar thermal power – will contribute 88% of electricitygeneration. The Energy [R]evolution scenario projects animmediate market development with high annual growth ratesachieving a renewable electricity share of 36% already by 2020and 64% by 2030. The installed capacity of renewables will reach605 GW in 2030 and 1,619 GW by 2050, an enormous increase.
Table 5.49 shows the comparative evolution of the differentrenewable technologies in Non OECD Asia over time. Up to 2020hydro and wind will remain the main contributors of the growingmarket share. After 2020, the continuing growth of wind will becomplemented by electricity from photovoltaics, solar thermal(CSP), and ocean energy. The Energy [R]evolution scenario willlead to a high share of fluctuating power generation sources(photovoltaic, wind and ocean) of 34% by 2030 and 54% by2050, therefore the expansion of smart grids, demand sidemanagement (DSM) and storage capacity from the increasedshare of electric vehicles will be used for a better grid integrationand power generation management.
table 5.49: non oecd asia: renewable electricity generationcapacity under the reference scenario and the energy [r]evolution scenario IN GW
2020
7569
64
690
512
459
04
02
96240
2040
12388
1711
45372
1072
17391
0171
027
2111,130
2050
14696
2313
71478
13107
24577
0295
053
2751,619
Hydro
Biomass
Wind
Geothermal
PV
CSP
Ocean energy
Total
REFE[R]
REFE[R]
REFE[R]
REFE[R]
REFE[R]
REFE[R]
REFE[R]
REFE[R]
2030
10080
117
21210
734
11199
064
012
150605
2009
4848
33
11
33
00
00
00
5555
figure 5.113: non oecd asia: electricity generation structure under the reference scenario and the energy [r]evolution scenario (INCLUDING ELECTRICITY FOR ELECTROMOBILITY, HEAT PUMPS AND HYDROGEN GENERATION)
TWh/a 0
500
1,000
1,500
2,000
2,500
3,000
3,500
4,000
4,500
5,000
REF REF REF REF REF REFE[R] E[R] E[R] E[R] E[R] E[R]
2009 2015 2020 2030 2040 2050
•OCEAN ENERGY
• SOLAR THERMAL
• GEOTHERMAL
• BIOMASS
• PV
•WIND
• HYDRO
• NUCLEAR
• DIESEL
• OIL
• NATURAL GAS
• LIGNITE
• COAL

161
5
key resu
lts|NON OECD ASIA - E
LECTRICITY GENERATION
non oecd asia: future costs of electricity generation
Figure 5.114 shows that the introduction of renewabletechnologies under the Energy [R]evolution scenario significantlydecreases future costs of electricity generation in Non OECDAsia compared to the Reference scenario. Because of the lowerCO2 intensity of electricity generation, electricity generation costswill become economically favourable under the Energy[R]evolution scenario and by 2050 costs will be $ 7.2 cents/kWhbelow those in the Reference version.
Under the Reference scenario, on the other hand, uncheckedgrowth in demand, an increase in fossil fuel prices and the cost ofCO2 emissions result in total electricity supply costs rising fromtoday’s $ 145 billion per year to more than $ 777 billion in2050. Figure 5.114 shows that the Energy [R]evolution scenariohelps Non OECD Asia to stabilise energy costs and relieve theeconomic pressure on society. Increasing energy efficiency andshifting energy supply to renewables lead to long term costs forelectricity supply that are 14% lower than in the Referencescenario, including estimated costs for efficiency measures.
figure 5.114: non oecd asia: total electricity supply costs and specific electricity generation costs under two scenarios
0
100
200
300
400
500
600
700
800
2009 2015 2020 2030 2040 2050
0
2
4
6
8
10
12
14
16
18
20
ct/kWhBn$/a
SPEC. ELECTRICITY GENERATION COSTS (REF)
SPEC. ELECTRICITY GENERATION COSTS (E[R])
• ‘EFFICIENCY’ MEASURES
• REFERENCE SCENARIO (REF)
• ENERGY [R]EVOLUTION (E[R])
non oecd asia: future investments in the power sector
It would require $ 5,150 billion in investment for the Energy[R]evolution scenario to become reality (including investmentsfor replacement after the economic lifetime of the plants) -approximately $ 129 billion annually or $ 88 billion more than inthe Reference scenario ($ 1,645 billion).
Under the Reference version, the levels of investment inconventional power plants add up to almost 47% whileapproximately 53% would be invested in renewable energy andcogeneration (CHP) until 2050. Under the Energy [R]evolutionscenario, however, Non OECD Asia would shift almost 97% ofthe entire investment towards renewables and cogeneration. Until2030, the fossil fuel share of power sector investment would befocused mainly on CHP plants. The average annual investment inthe power sector under the Energy [R]evolution scenario betweentoday and 2050 would be approximately $ 129 billion.
figure 5.115: non oecd asia: investment shares -reference scenario versus energy [r]evolution scenario
REF 2011 - 2050
42% FOSSIL
5% NUCLEAR
2% CHP
51% RENEWABLES
Total $ 1,645 billion
E[R] 2011 - 2050
3% FOSSIL & NUCLEAR
5% CHP
92% RENEWABLES
Total $ 5,150 billion
© GP/SIMANJUNTAK
© GP/RIOS
image GREENPEACE DONATES A SOLAR POWER SYSTEM TO A COASTAL VILLAGE INACEH, INDONESIA, ONE OF THE WORST HIT AREAS BY THE TSUNAMI IN DECEMBER2004. IN COOPERATION WITH UPLINK, A LOCAL DEVELOPMENT NGO, GREENPEACEOFFERED ITS EXPERTISE ON ENERGY EFFICIENCY AND RENEWABLE ENERGY ANDINSTALLED RENEWABLE ENERGY GENERATORS FOR ONE OF THE BADLY HITVILLAGES BY THE TSUNAMI.
image A WOMAN GATHERS FIREWOOD ON THE SHORES CLOSE TO THE WIND FARMOF ILOCOS NORTE, AROUND 500 KILOMETERS NORTH OF MANILA.
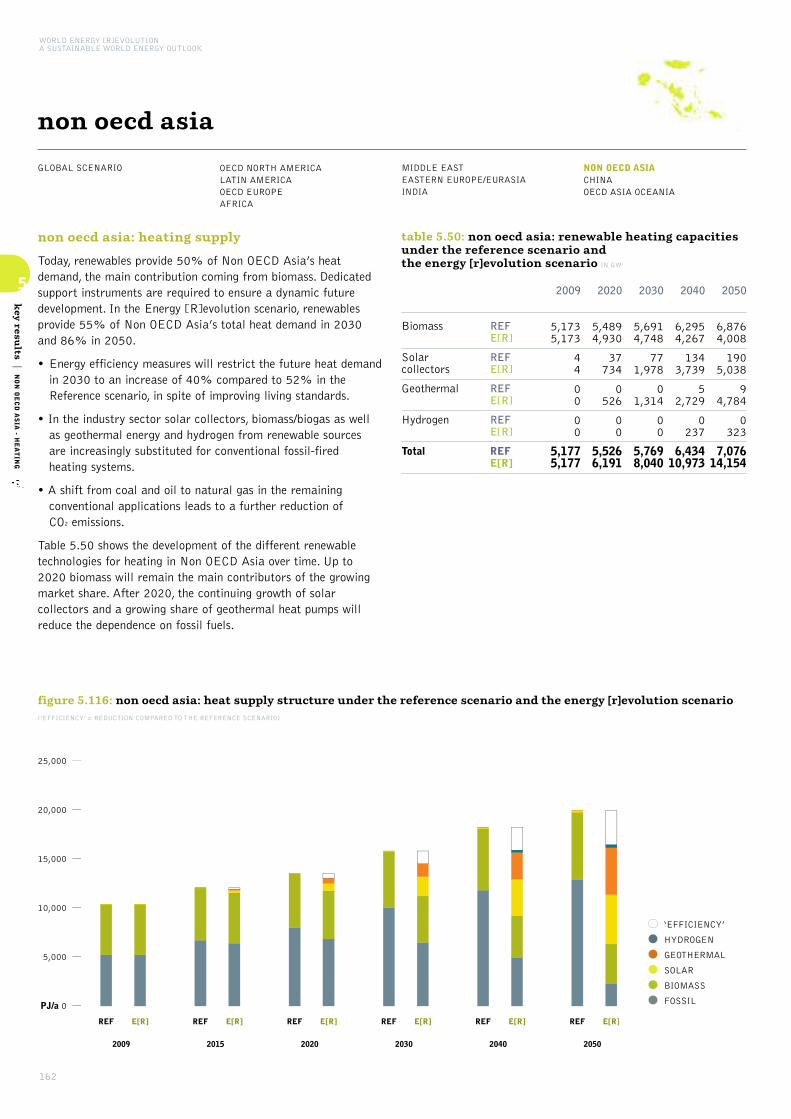
162
5
key resu
lts|NON OECD ASIA - H
EATING
WORLD ENERGY [R]EVOLUTIONA SUSTAINABLE WORLD ENERGY OUTLOOK
GLOBAL SCENARIO OECD NORTH AMERICALATIN AMERICAOECD EUROPE AFRICA
MIDDLE EASTEASTERN EUROPE/EURASIAINDIA
NON OECD ASIACHINAOECD ASIA OCEANIA
non oecd asia
non oecd asia: heating supply
Today, renewables provide 50% of Non OECD Asia’s heatdemand, the main contribution coming from biomass. Dedicatedsupport instruments are required to ensure a dynamic futuredevelopment. In the Energy [R]evolution scenario, renewablesprovide 55% of Non OECD Asia’s total heat demand in 2030and 86% in 2050.
• Energy efficiency measures will restrict the future heat demandin 2030 to an increase of 40% compared to 52% in theReference scenario, in spite of improving living standards.
• In the industry sector solar collectors, biomass/biogas as wellas geothermal energy and hydrogen from renewable sources are increasingly substituted for conventional fossil-fired heating systems.
• A shift from coal and oil to natural gas in the remainingconventional applications leads to a further reduction of CO2 emissions.
Table 5.50 shows the development of the different renewabletechnologies for heating in Non OECD Asia over time. Up to2020 biomass will remain the main contributors of the growingmarket share. After 2020, the continuing growth of solarcollectors and a growing share of geothermal heat pumps willreduce the dependence on fossil fuels.
table 5.50: non oecd asia: renewable heating capacitiesunder the reference scenario and the energy [r]evolution scenario IN GW
2020
5,4894,930
37734
0526
00
5,5266,191
2040
6,2954,267
1343,739
52,729
0237
6,43410,973
2050
6,8764,008
1905,038
94,784
0323
7,07614,154
Biomass
Solarcollectors
Geothermal
Hydrogen
Total
REFE[R]
REFE[R]
REFE[R]
REFE[R]
REFE[R]
2030
5,6914,748
771,978
01,314
00
5,7698,040
2009
5,1735,173
44
00
00
5,1775,177
figure 5.116: non oecd asia: heat supply structure under the reference scenario and the energy [r]evolution scenario(‘EFFICIENCY’ = REDUCTION COMPARED TO THE REFERENCE SCENARIO)
REF REF REF REF REF REFE[R] E[R] E[R] E[R] E[R] E[R]
2009 2015 2020 2030 2040 2050
PJ/a 0
5,000
10,000
15,000
20,000
25,000
•‘EFFICIENCY’
• HYDROGEN
• GEOTHERMAL
• SOLAR
• BIOMASS
• FOSSIL
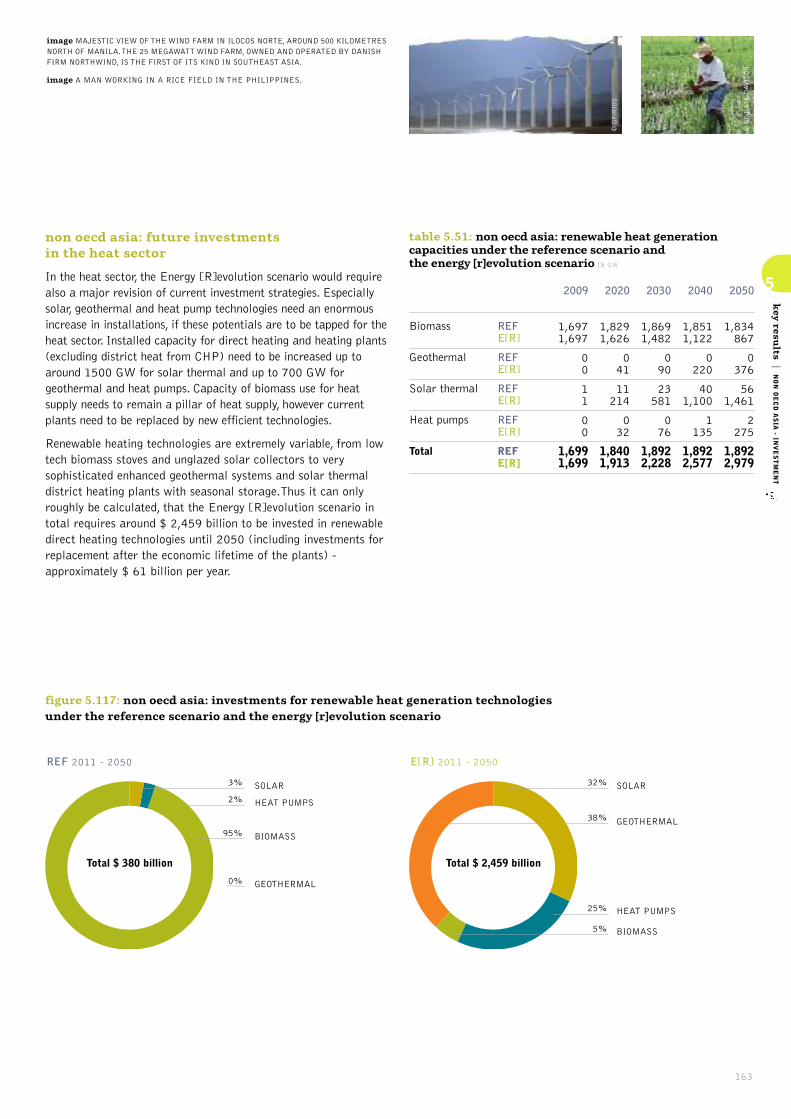
163
5
key resu
lts|NON OECD ASIA - IN
VESTMENT
non oecd asia: future investments in the heat sector
In the heat sector, the Energy [R]evolution scenario would requirealso a major revision of current investment strategies. Especiallysolar, geothermal and heat pump technologies need an enormousincrease in installations, if these potentials are to be tapped for theheat sector. Installed capacity for direct heating and heating plants(excluding district heat from CHP) need to be increased up toaround 1500 GW for solar thermal and up to 700 GW forgeothermal and heat pumps. Capacity of biomass use for heatsupply needs to remain a pillar of heat supply, however currentplants need to be replaced by new efficient technologies.
Renewable heating technologies are extremely variable, from lowtech biomass stoves and unglazed solar collectors to verysophisticated enhanced geothermal systems and solar thermaldistrict heating plants with seasonal storage.Thus it can onlyroughly be calculated, that the Energy [R]evolution scenario intotal requires around $ 2,459 billion to be invested in renewabledirect heating technologies until 2050 (including investments forreplacement after the economic lifetime of the plants) -approximately $ 61 billion per year.
table 5.51: non oecd asia: renewable heat generationcapacities under the reference scenario and the energy [r]evolution scenario IN GW
2020
1,8291,626
041
11214
032
1,8401,913
2040
1,8511,122
0220
401,100
1135
1,8922,577
2050
1,834867
0376
561,461
2275
1,8922,979
Biomass
Geothermal
Solar thermal
Heat pumps
Total
REFE[R]
REFE[R]
REFE[R]
REFE[R]
REFE[R]
2030
1,8691,482
090
23581
076
1,8922,228
2009
1,6971,697
00
11
00
1,6991,699
figure 5.117: non oecd asia: investments for renewable heat generation technologies under the reference scenario and the energy [r]evolution scenario
REF 2011 - 2050
3% SOLAR
0% GEOTHERMAL
95% BIOMASS
2% HEAT PUMPS
Total $ 380 billion
E[R] 2011 - 2050
32% SOLAR
25% HEAT PUMPS
5% BIOMASS
38% GEOTHERMAL
Total $ 2,459 billion
© GP/KATE DAVISON
© GP/RIOS
image MAJESTIC VIEW OF THE WIND FARM IN ILOCOS NORTE, AROUND 500 KILOMETRESNORTH OF MANILA. THE 25 MEGAWATT WIND FARM, OWNED AND OPERATED BY DANISHFIRM NORTHWIND, IS THE FIRST OF ITS KIND IN SOUTHEAST ASIA.
image A MAN WORKING IN A RICE FIELD IN THE PHILIPPINES.
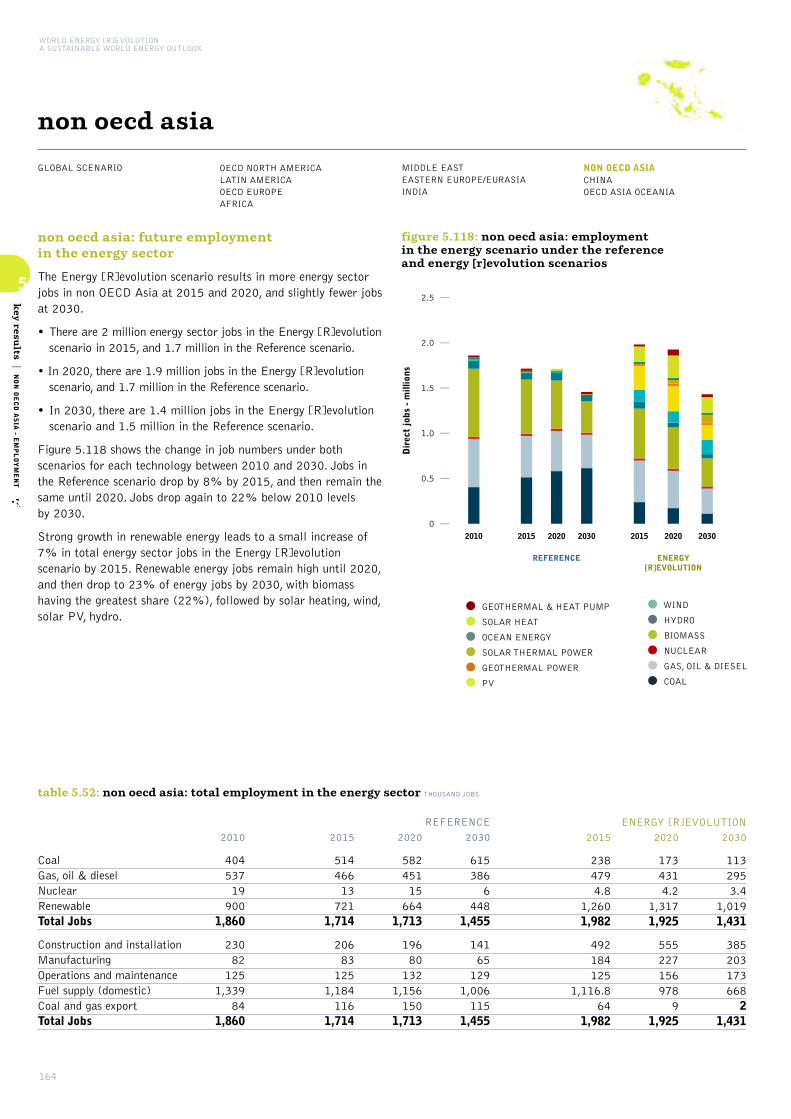
164
5
key resu
lts|NON OECD ASIA - E
MPLOYMENT
WORLD ENERGY [R]EVOLUTIONA SUSTAINABLE WORLD ENERGY OUTLOOK
GLOBAL SCENARIO OECD NORTH AMERICALATIN AMERICAOECD EUROPE AFRICA
MIDDLE EASTEASTERN EUROPE/EURASIAINDIA
NON OECD ASIACHINAOECD ASIA OCEANIA
non oecd asia
non oecd asia: future employment in the energy sector
The Energy [R]evolution scenario results in more energy sectorjobs in non OECD Asia at 2015 and 2020, and slightly fewer jobsat 2030.
• There are 2 million energy sector jobs in the Energy [R]evolutionscenario in 2015, and 1.7 million in the Reference scenario.
• In 2020, there are 1.9 million jobs in the Energy [R]evolutionscenario, and 1.7 million in the Reference scenario.
• In 2030, there are 1.4 million jobs in the Energy [R]evolutionscenario and 1.5 million in the Reference scenario.
Figure 5.118 shows the change in job numbers under bothscenarios for each technology between 2010 and 2030. Jobs inthe Reference scenario drop by 8% by 2015, and then remain thesame until 2020. Jobs drop again to 22% below 2010 levels by 2030.
Strong growth in renewable energy leads to a small increase of7% in total energy sector jobs in the Energy [R]evolutionscenario by 2015. Renewable energy jobs remain high until 2020,and then drop to 23% of energy jobs by 2030, with biomasshaving the greatest share (22%), followed by solar heating, wind,solar PV, hydro.
REFERENCE ENERGY[R]EVOLUTION
2010 2015 2020 2030 2015 2020 2030
0
0.5
1.0
1.5
2.0
2.5
Dir
ect
jobs
- m
illio
ns
figure 5.118: non oecd asia: employment in the energy scenario under the reference and energy [r]evolution scenarios
•GEOTHERMAL & HEAT PUMP
• SOLAR HEAT
• OCEAN ENERGY
• SOLAR THERMAL POWER
• GEOTHERMAL POWER
• PV
•WIND
• HYDRO
• BIOMASS
• NUCLEAR
• GAS, OIL & DIESEL
• COAL
table 5.52: non oecd asia: total employment in the energy sector THOUSAND JOBS
CoalGas, oil & dieselNuclearRenewableTotal Jobs
Construction and installationManufacturingOperations and maintenanceFuel supply (domestic)Coal and gas exportTotal Jobs
2015
2384794.8
1,2601,982
492184125
1,116.864
1,982
2020
1734314.2
1,3171,925
5552271569789
1,925
2030
1132953.4
1,0191,431
3852031736682
1,431
ENERGY [R]EVOLUTION
2015
51446613721
1,714
20683125
1,184116
1,714
2010
40453719900
1,860
23082125
1,33984
1,860
2020
58245115664
1,713
19680132
1,156150
1,713
2030
6153866
4481,455
14165129
1,006115
1,455
REFERENCE
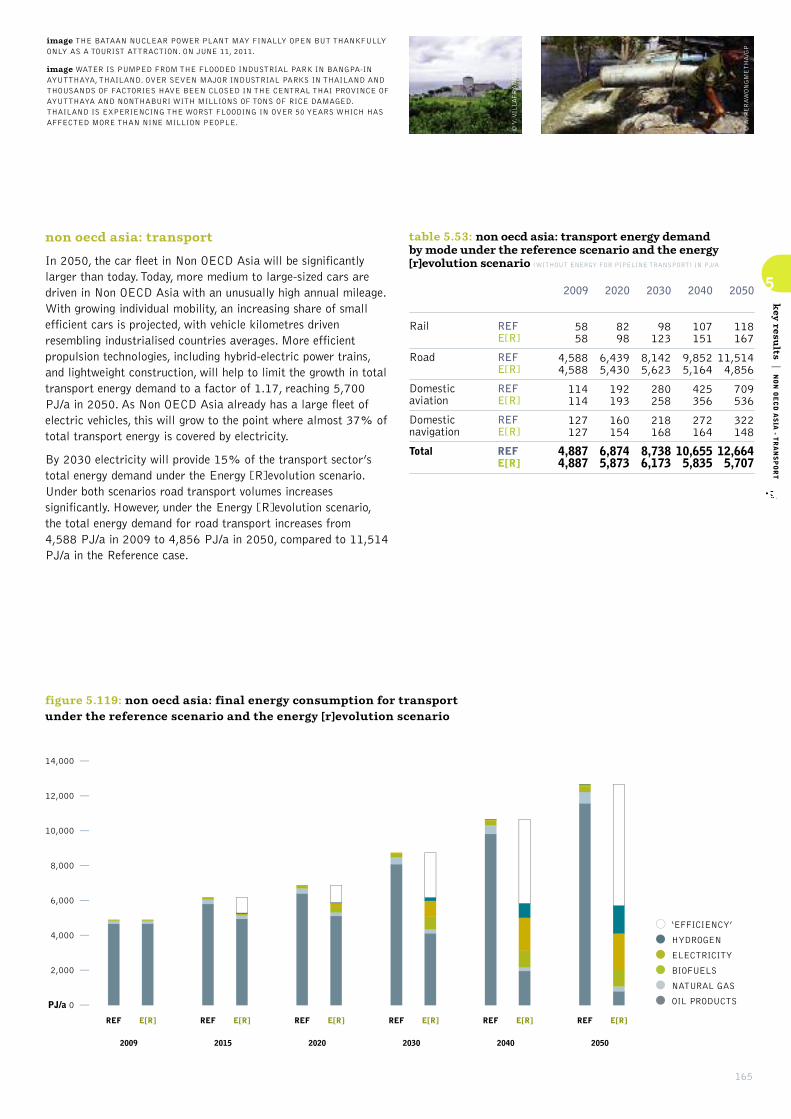
165
5
key resu
lts|NON OECD ASIA - T
RANSPORT
non oecd asia: transport
In 2050, the car fleet in Non OECD Asia will be significantlylarger than today. Today, more medium to large-sized cars aredriven in Non OECD Asia with an unusually high annual mileage.With growing individual mobility, an increasing share of smallefficient cars is projected, with vehicle kilometres drivenresembling industrialised countries averages. More efficientpropulsion technologies, including hybrid-electric power trains,and lightweight construction, will help to limit the growth in totaltransport energy demand to a factor of 1.17, reaching 5,700PJ/a in 2050. As Non OECD Asia already has a large fleet ofelectric vehicles, this will grow to the point where almost 37% oftotal transport energy is covered by electricity.
By 2030 electricity will provide 15% of the transport sector’stotal energy demand under the Energy [R]evolution scenario.Under both scenarios road transport volumes increasessignificantly. However, under the Energy [R]evolution scenario,the total energy demand for road transport increases from 4,588 PJ/a in 2009 to 4,856 PJ/a in 2050, compared to 11,514PJ/a in the Reference case.
table 5.53: non oecd asia: transport energy demand by mode under the reference scenario and the energy[r]evolution scenario (WITHOUT ENERGY FOR PIPELINE TRANSPORT) IN PJ/A
2020
8298
6,4395,430
192193
160154
6,8745,873
2040
107151
9,8525,164
425356
272164
10,6555,835
2050
118167
11,5144,856
709536
322148
12,6645,707
Rail
Road
Domesticaviation
Domesticnavigation
Total
REFE[R]
REFE[R]
REFE[R]
REFE[R]
REFE[R]
2030
98123
8,1425,623
280258
218168
8,7386,173
2009
5858
4,5884,588
114114
127127
4,8874,887
figure 5.119: non oecd asia: final energy consumption for transport under the reference scenario and the energy [r]evolution scenario
REF REF REF REF REF REFE[R] E[R] E[R] E[R] E[R] E[R]
2009 2015 2020 2030 2040 2050
PJ/a 0
2,000
4,000
6,000
8,000
10,000
12,000
14,000
•‘EFFICIENCY’
• HYDROGEN
• ELECTRICITY
• BIOFUELS
• NATURAL GAS
• OIL PRODUCTS
•WIND
• HYDRO
• BIOMASS
• NUCLEAR
• GAS, OIL & DIESEL
• COAL
© V. VILLAFRANCA/GP
© A. PERAWONGMETHA/GP
image THE BATAAN NUCLEAR POWER PLANT MAY FINALLY OPEN BUT THANKFULLYONLY AS A TOURIST ATTRACTION. ON JUNE 11, 2011.
image WATER IS PUMPED FROM THE FLOODED INDUSTRIAL PARK IN BANGPA-INAYUTTHAYA, THAILAND. OVER SEVEN MAJOR INDUSTRIAL PARKS IN THAILAND ANDTHOUSANDS OF FACTORIES HAVE BEEN CLOSED IN THE CENTRAL THAI PROVINCE OFAYUTTHAYA AND NONTHABURI WITH MILLIONS OF TONS OF RICE DAMAGED.THAILAND IS EXPERIENCING THE WORST FLOODING IN OVER 50 YEARS WHICH HASAFFECTED MORE THAN NINE MILLION PEOPLE.
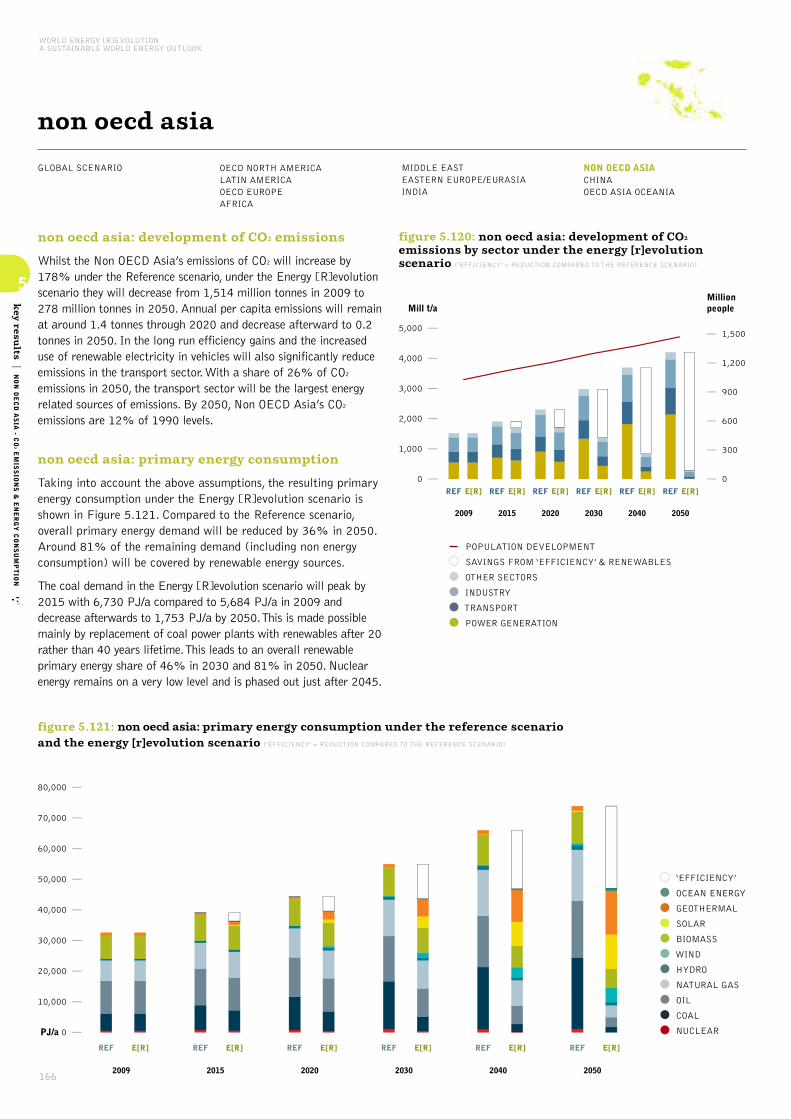
166
5
key resu
lts|NON OECD ASIA - C
O2EMISSIONS & ENERGY CONSUMPTION
WORLD ENERGY [R]EVOLUTIONA SUSTAINABLE WORLD ENERGY OUTLOOK
GLOBAL SCENARIO OECD NORTH AMERICALATIN AMERICAOECD EUROPE AFRICA
MIDDLE EASTEASTERN EUROPE/EURASIAINDIA
NON OECD ASIACHINAOECD ASIA OCEANIA
non oecd asia
non oecd asia: development of CO2 emissions
Whilst the Non OECD Asia’s emissions of CO2 will increase by178% under the Reference scenario, under the Energy [R]evolutionscenario they will decrease from 1,514 million tonnes in 2009 to278 million tonnes in 2050. Annual per capita emissions will remainat around 1.4 tonnes through 2020 and decrease afterward to 0.2tonnes in 2050. In the long run efficiency gains and the increaseduse of renewable electricity in vehicles will also significantly reduceemissions in the transport sector. With a share of 26% of CO2
emissions in 2050, the transport sector will be the largest energyrelated sources of emissions. By 2050, Non OECD Asia’s CO2
emissions are 12% of 1990 levels.
non oecd asia: primary energy consumption
Taking into account the above assumptions, the resulting primaryenergy consumption under the Energy [R]evolution scenario isshown in Figure 5.121. Compared to the Reference scenario,overall primary energy demand will be reduced by 36% in 2050.Around 81% of the remaining demand (including non energyconsumption) will be covered by renewable energy sources.
The coal demand in the Energy [R]evolution scenario will peak by2015 with 6,730 PJ/a compared to 5,684 PJ/a in 2009 anddecrease afterwards to 1,753 PJ/a by 2050. This is made possiblemainly by replacement of coal power plants with renewables after 20rather than 40 years lifetime. This leads to an overall renewableprimary energy share of 46% in 2030 and 81% in 2050. Nuclearenergy remains on a very low level and is phased out just after 2045.
figure 5.120: non oecd asia: development of CO2
emissions by sector under the energy [r]evolutionscenario (‘EFFICIENCY’ = REDUCTION COMPARED TO THE REFERENCE SCENARIO)
REF REF REF REF REF REFE[R] E[R] E[R] E[R] E[R] E[R]
2009 2015 2020 2030 2040 2050
0
1,000
2,000
3,000
4,000
5,000
0
300
600
900
1,200
1,500
Mill t/aMillion people
POPULATION DEVELOPMENT
• SAVINGS FROM ‘EFFICIENCY’ & RENEWABLES
• OTHER SECTORS
• INDUSTRY
•TRANSPORT
• POWER GENERATION
figure 5.121: non oecd asia: primary energy consumption under the reference scenario and the energy [r]evolution scenario (‘EFFICIENCY’ = REDUCTION COMPARED TO THE REFERENCE SCENARIO)
PJ/a 0
20,000
10,000
40,000
30,000
60,000
50,000
80,000
70,000
REF REF REF REF REF REFE[R] E[R] E[R] E[R] E[R] E[R]
2009 2015 2020 2030 2040 2050
•‘EFFICIENCY’
• OCEAN ENERGY
• GEOTHERMAL
• SOLAR
• BIOMASS
•WIND
• HYDRO
• NATURAL GAS
• OIL
• COAL
• NUCLEAR

167
5
key resu
lts|NON OECD ASIA - IN
VESTMENT & FUEL COSTS
table 5.54: non oecd asia: investment costs for electricity generation and fuel cost savings under the energy [r]evolution scenario compared to the reference scenario
INVESTMENT COSTS
DIFFERENCE E[R] VERSUS REF
Conventional (fossil & nuclear)
Renewables
Total
CUMULATIVE FUEL COST SAVINGS
SAVINGS CUMULATIVE E[R] VERSUS REF
Fuel oil
Gas
Hard coal
Lignite
Total
$
billion $
billion $
billion $
billion $/a
billion $/a
billion $/a
billion $/a
billion $/a
2021 - 2030
-158.5
838.5
680.0
6.5
-10.7
372.3
14.1
382.3
2011 - 2020
-89.1
327.8
238.7
2.9
-75.7
77.3
5.1
9.6
2011 - 2050
-590.9
4,096.1
3,505.2
49.2
1,377.6
2,551.9
65.8
4,044.5
2011 - 2050 AVERAGE
PER ANNUM
-14.8
102.4
87.6
1.2
34.4
63.8
1.6
101.1
2041 - 2050
-196.7
1,576.0
1,379.2
23.6
1,139.1
1,272.6
26.2
2,461.6
2031 - 2040
-146.6
1,353.9
1,207.3
16.1
324.7
829.7
20.4
1,190.9
© A. PERAWONGMETHA/GP
© PAUL HILTON/GP
image A STORM OVER THE PACIFIC OCEAN.
image A BOY WASHES NEAR HITEC INDUSTRIAL PARK IN AYUTTHAYA, THAILANDDURING THE WORST FLOODING IN OVER 50 YEARS.
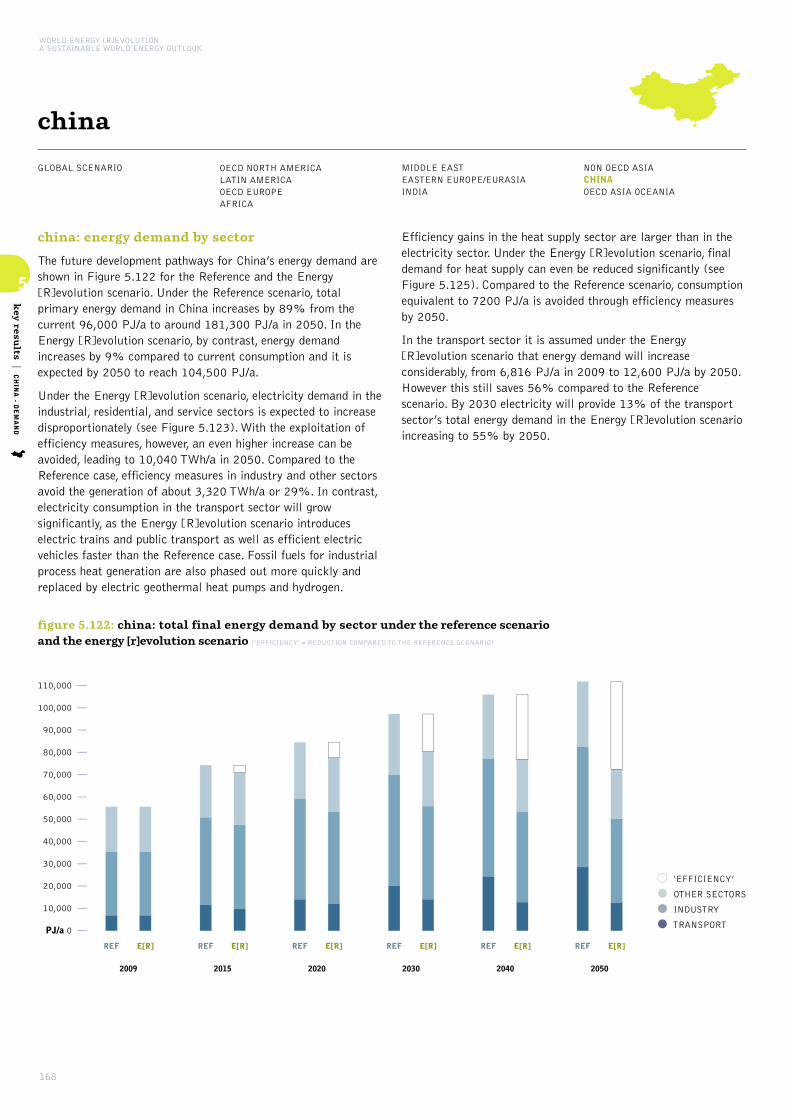
168
5
key resu
lts|CHINA - D
EMAND
WORLD ENERGY [R]EVOLUTIONA SUSTAINABLE WORLD ENERGY OUTLOOK
GLOBAL SCENARIO OECD NORTH AMERICALATIN AMERICAOECD EUROPE AFRICA
MIDDLE EASTEASTERN EUROPE/EURASIAINDIA
NON OECD ASIACHINAOECD ASIA OCEANIA
china
china: energy demand by sector
The future development pathways for China’s energy demand areshown in Figure 5.122 for the Reference and the Energy[R]evolution scenario. Under the Reference scenario, totalprimary energy demand in China increases by 89% from thecurrent 96,000 PJ/a to around 181,300 PJ/a in 2050. In theEnergy [R]evolution scenario, by contrast, energy demandincreases by 9% compared to current consumption and it isexpected by 2050 to reach 104,500 PJ/a.
Under the Energy [R]evolution scenario, electricity demand in theindustrial, residential, and service sectors is expected to increasedisproportionately (see Figure 5.123). With the exploitation ofefficiency measures, however, an even higher increase can beavoided, leading to 10,040 TWh/a in 2050. Compared to theReference case, efficiency measures in industry and other sectorsavoid the generation of about 3,320 TWh/a or 29%. In contrast,electricity consumption in the transport sector will growsignificantly, as the Energy [R]evolution scenario introduceselectric trains and public transport as well as efficient electricvehicles faster than the Reference case. Fossil fuels for industrialprocess heat generation are also phased out more quickly andreplaced by electric geothermal heat pumps and hydrogen.
Efficiency gains in the heat supply sector are larger than in theelectricity sector. Under the Energy [R]evolution scenario, finaldemand for heat supply can even be reduced significantly (seeFigure 5.125). Compared to the Reference scenario, consumptionequivalent to 7200 PJ/a is avoided through efficiency measuresby 2050.
In the transport sector it is assumed under the Energy[R]evolution scenario that energy demand will increaseconsiderably, from 6,816 PJ/a in 2009 to 12,600 PJ/a by 2050.However this still saves 56% compared to the Referencescenario. By 2030 electricity will provide 13% of the transportsector’s total energy demand in the Energy [R]evolution scenarioincreasing to 55% by 2050.
figure 5.122: china: total final energy demand by sector under the reference scenario and the energy [r]evolution scenario (‘EFFICIENCY’ = REDUCTION COMPARED TO THE REFERENCE SCENARIO)
• ‘EFFICIENCY’
• OTHER SECTORS
• INDUSTRY
•TRANSPORT
REF E[R]
2009
REF E[R]
2015
REF E[R]
2020
REF E[R]
2030
REF E[R]
2040
REF E[R]
2050
PJ/a 0
10,000
20,000
30,000
40,000
50,000
60,000
70,000
80,000
90,000
100,000
110,000

169
5
key resu
lts|CHINA - D
EMAND
figure 5.123: china: development of electricity demandby sector in the energy [r]evolution scenario(‘EFFICIENCY’ = REDUCTION COMPARED TO THE REFERENCE SCENARIO)
• ‘EFFICIENCY’
• OTHER SECTORS
• INDUSTRY
•TRANSPORT
E[R] E[R] E[R] E[R] E[R] E[R]
2009 2015 2020 2030 2040 2050
PJ/a 0
5,000
10,000
15,000
20,000
25,000
30,000
figure 5.124: china: development of the transportdemand by sector in the energy [r]evolution scenario
•‘EFFICIENCY’
• DOMESTIC NAVIGATION
• DOMESTIC AVIATION
• ROAD
• RAIL
E[R] E[R] E[R] E[R] E[R] E[R]
2009 2015 2020 2030 2040 2050
PJ/a 0
5,000
10,000
15,000
20,000
25,000
30,000
35,000
40,000
45,000
E[R] E[R] E[R] E[R] E[R] E[R]
2009 2015 2020 2030 2040 2050
PJ/a 0
5,000
10,000
15,000
20,000
25,000
30,000
35,000
40,000
45,000
figure 5.125: china: development of heat demand by sector in the energy [r]evolution scenario(‘EFFICIENCY’ = REDUCTION COMPARED TO THE REFERENCE SCENARIO)
• ‘EFFICIENCY’
• OTHER SECTORS
• INDUSTRY
© GP/MARKEL REDONDO
© GP/JOHN NOVIS
image WANG WAN YI, AGE 76, AND LINANG JUN QIN, AGE 72, EAT NOODLES IN THEIRONE ROOM HOME CARVED OUT OF THE SANDSTONE, A TYPICAL DWELLING FORLOCAL PEOPLE IN THE REGION. DROUGHT IS ONE OF THE MOST HARMFUL NATURALHAZARDS IN NORTHWEST CHINA. CLIMATE CHANGE HAS A SIGNIFICANT IMPACT ONCHINA’S ENVIRONMENT AND ECONOMY.
image image THE BLADES OF A WINDMILL SIT ON THE GROUND WAITING FORINSTALLATION AT GUAZHOU WIND FARM NEAR YUMEN IN GANSU PROVINCE.

170
5
key resu
lts|CHINA - E
LECTRICITY GENERATION
WORLD ENERGY [R]EVOLUTIONA SUSTAINABLE WORLD ENERGY OUTLOOK
GLOBAL SCENARIO OECD NORTH AMERICALATIN AMERICAOECD EUROPE AFRICA
MIDDLE EASTEASTERN EUROPE/EURASIAINDIA
NON OECD ASIACHINAOECD ASIA OCEANIA
china
china: electricity generation
The development of the electricity supply market is characterisedby a dynamically growing renewable energy market and anincreasing share of renewable electricity. This will compensate forthe phasing out of nuclear energy and reduce the number of fossilfuel-fired power plants required for grid stabilisation. By 2050,92% of the electricity produced in China will come from renewableenergy sources. ‘New’ renewables – mainly wind, solar thermalpower and PV – will contribute 60% of electricity generation. TheEnergy [R]evolution scenario projects an immediate marketdevelopment with high annual growth rates achieving a renewableelectricity share of 27% already by 2020 and 43% by 2030. Theinstalled capacity of renewables will reach 1,298 GW in 2030 and3,076 GW by 2050, an enormous increase.
Table 5.55 shows the comparative evolution of the differentrenewable technologies in China over time. Up to 2020 hydro andwind will remain the main contributors of the growing marketshare. After 2020, the continuing growth of wind will becomplemented by electricity from biomass, photovoltaics andsolar thermal (CSP) energy. The Energy [R]evolution scenariowill lead to a high share of fluctuating power generation sources(photovoltaic, wind and ocean) of 19% by 2030 and 48% by2050, therefore the expansion of smart grids, demand sidemanagement (DSM) and storage capacity e.g. from theincreasing share of electric vehicles will be used for a better gridintegration and power generation management.
table 5.55: china: renewable electricity generationcapacity under the reference scenario and the energy [r]evolution scenario IN GW
2020
320294
1831
150234
02
2283
142
01
511685
2040
402397
4881
266845
169
45542
2203
028
7642,166
2050
433433
63112
3051,139
2133
62803
3295
0161
8683,076
Hydro
Biomass
Wind
Geothermal
PV
CSP
Ocean energy
Total
REFE[R]
REFE[R]
REFE[R]
REFE[R]
REFE[R]
REFE[R]
REFE[R]
REFE[R]
2030
370341
3251
222517
122
30221
2138
09
6571,298
2009
197197
11
1313
00
00
00
00
212212
figure 5.126: china: electricity generation structure under the reference scenario and the energy [r]evolution scenario (INCLUDING ELECTRICITY FOR ELECTROMOBILITY, HEAT PUMPS AND HYDROGEN GENERATION)
TWh/a 0
REF REF REF REF REF REFE[R] E[R] E[R] E[R] E[R] E[R]
2009 2015 2020 2030 2040 2050
2,000
4,000
6,000
8,000
10,000
12,000
14,000
•OCEAN ENERGY
• SOLAR THERMAL
• GEOTHERMAL
• BIOMASS
• PV
•WIND
• HYDRO
• NUCLEAR
• DIESEL
• OIL
• NATURAL GAS
• LIGNITE
• COAL

171
5
key resu
lts|CHINA - E
LECTRICITY GENERATION
china: future costs of electricity generation
Figure 5.127 shows that the introduction of renewabletechnologies under the Energy [R]evolution scenario slightlyincreases the costs of electricity generation in China compared tothe Reference scenario. However, this difference will be less than0.4 cent/kWh up to 2020, if the price pathway for fossil fuelsdefined in Chapter 4 is applied. Because of the lower CO2
intensity of electricity generation, electricity generation costs willbecome economically favourable under the Energy [R]evolutionscenario and by 2050 costs will be $ 6.3 cents/kWh below thosein the Reference version.
Under the Reference scenario, by contrast, unchecked growth indemand, an increase in fossil fuel prices and the cost of CO2
emissions result in total electricity supply costs rising fromtoday’s $ 366 billion per year to more than $ 2,096 billion in2050. Figure 5.127 shows that the Energy [R]evolution scenarionot only complies with China’s CO2 reduction targets but alsohelps to stabilise energy costs. Increasing energy efficiency andshifting energy supply to renewables lead to long term costs forelectricity supply that are 24% lower than in the Referencescenario, including estimated costs for efficiency measures.
figure 5.127: china: total electricity supply costs and specific electricity generation costs under two scenarios
0
200
400
600
800
1,000
1,200
1,400
1,600
1,800
2,000
2,200
2009 2015 2020 2030 2040 2050
0
2
4
6
8
10
12
14
16
ct/kWhBn$/a
SPEC. ELECTRICITY GENERATION COSTS (REF)
SPEC. ELECTRICITY GENERATION COSTS (E[R])
• ‘EFFICIENCY’ MEASURES
• REFERENCE SCENARIO (REF)
• ENERGY [R]EVOLUTION (E[R])
china: future investments in the power sector
It would require $ 10,090 billion in investment for the Energy[R]evolution scenario to become reality (including investmentsfor replacement after the economic lifetime of the plants) -approximately $ 252 billion annually or $ 111 billion more than
in the Reference scenario ($ 5,658 billion). Under the Referenceversion, the levels of investment in conventional power plants addup to almost 49% while approximately 51% would be invested inrenewable energy and cogeneration (CHP) until 2050.
Under the Energy [R]evolution scenario, however, China wouldshift almost 95% of the entire investment towards renewablesand cogeneration. Until 2030, the fossil fuel share of powersector investment would be focused mainly on CHP plants. Theaverage annual investment in the power sector under the Energy[R]evolution scenario between today and 2050 would beapproximately $ 252 billion.
Because renewable energy has no fuel costs, savings in the Energy[R]evolution scenario reach a total of $ 9,870 billion up to 2050,or $ 247 billion per year. The total fuel cost savings thereforewould cover almost 2 times the total additional investmentscompared to the Reference scenario. These renewable energysources would then go on to produce electricity without anyfurther fuel costs beyond 2050, while the costs for coal and gaswill continue to be a burden on national economies.
figure 5.128: china: investment shares - referencescenario versus energy [r]evolution scenario
REF 2011 - 2050
35% FOSSIL
14% NUCLEAR
6% CHP
45% RENEWABLES
Total $ 5,658 billion
E[R] 2011 - 2050
5% FOSSIL & NUCLEAR
14% CHP
81% RENEWABLES
Total $ 10,090 billion
© GP/HU WEI
© N. BEHRING-CHISHOLM/GPimage A WORKER ENTERS A TURBINE TOWER FOR MAINTENANCE AT DABANCHENG
WIND FARM. CHINA’S BEST WIND RESOURCES ARE MADE POSSIBLE BY THENATURAL BREACH IN TIANSHAN (TIAN MOUNTAIN).
image WOMEN WEAR MASKS AS THEY RIDE BIKES TO WORK IN THE POLLUTEDTOWN OF LINFEN. LINFEN, A CITY OF ABOUT 4.3 MILLION, IS ONE OF THE MOSTPOLLUTED CITIES IN THE WORLD. CHINA’S INCREASINGLY POLLUTEDENVIRONMENT IS LARGELY A RESULT OF THE COUNTRY’S RAPID DEVELOPMENTAND CONSEQUENTLY A LARGE INCREASE IN PRIMARY ENERGY CONSUMPTION,WHICH IS ALMOST ENTIRELY PRODUCED BY BURNING COAL.

172
5
key resu
lts|CHINA - H
EATING
WORLD ENERGY [R]EVOLUTIONA SUSTAINABLE WORLD ENERGY OUTLOOK
GLOBAL SCENARIO OECD NORTH AMERICALATIN AMERICAOECD EUROPE AFRICA
MIDDLE EASTEASTERN EUROPE/EURASIAINDIA
NON OECD ASIACHINAOECD ASIA OCEANIA
china
china: heating supply
Today, renewables provide 23% of China’s energy demand forheat supply, the main contribution coming from biomass.Dedicated support instruments are required to ensure a dynamicfuture development. In the Energy [R]evolution scenario,renewables provide 35% of China’s total heat demand in 2030and 86% in 2050.
• Energy efficiency measures will restrict the future energydemand for heat supply in 2030 to an increase of 15%compared to 29% in the Reference scenario, in spite ofimproving living standards.
• In the industry sector solar collectors, biomass/biogas as wellas geothermal energy are increasingly substituted forconventional fossil-fired heating systems.
• A shift from coal and oil to natural gas in the remainingconventional applications leads to a further reduction of CO2 emissions.
Table 5.56 shows the development of the different renewabletechnologies for heating in China over time. Up to 2020, biomasswill remain the main contributor of the growing market share.After 2020, the continuing growth of solar collectors and agrowing share of geothermal heat pumps will reduce thedependence on fossil fuels.
table 5.56: china: renewable heating capacities under thereference scenario and the energy [r]evolution scenario IN GW
2020
6,2468,054
5041,199
181737
00
6,9319,991
2040
3,9168,637
7556,560
2886,125
0102
4,95921,424
2050
3,5977,949
8427,676
33610,424
0543
4,77526,592
Biomass
Solarcollectors
Geothermal
Hydrogen
Total
REFE[R]
REFE[R]
REFE[R]
REFE[R]
REFE[R]
2030
4,9537,984
6312,287
2372,259
00
5,82112,530
2009
6,8336,833
301301
104104
00
7,2387,238
figure 5.129: china: heat supply structure under the reference scenario and the energy [r]evolution scenario(‘EFFICIENCY’ = REDUCTION COMPARED TO THE REFERENCE SCENARIO)
PJ/a 0
5,000
10,000
15,000
20,000
25,000
30,000
35,000
40,000
REF REF REF REF REF REFE[R] E[R] E[R] E[R] E[R] E[R]
2009 2015 2020 2030 2040 2050
•‘EFFICIENCY’
• HYDROGEN
• GEOTHERMAL
• SOLAR
• BIOMASS
• FOSSIL
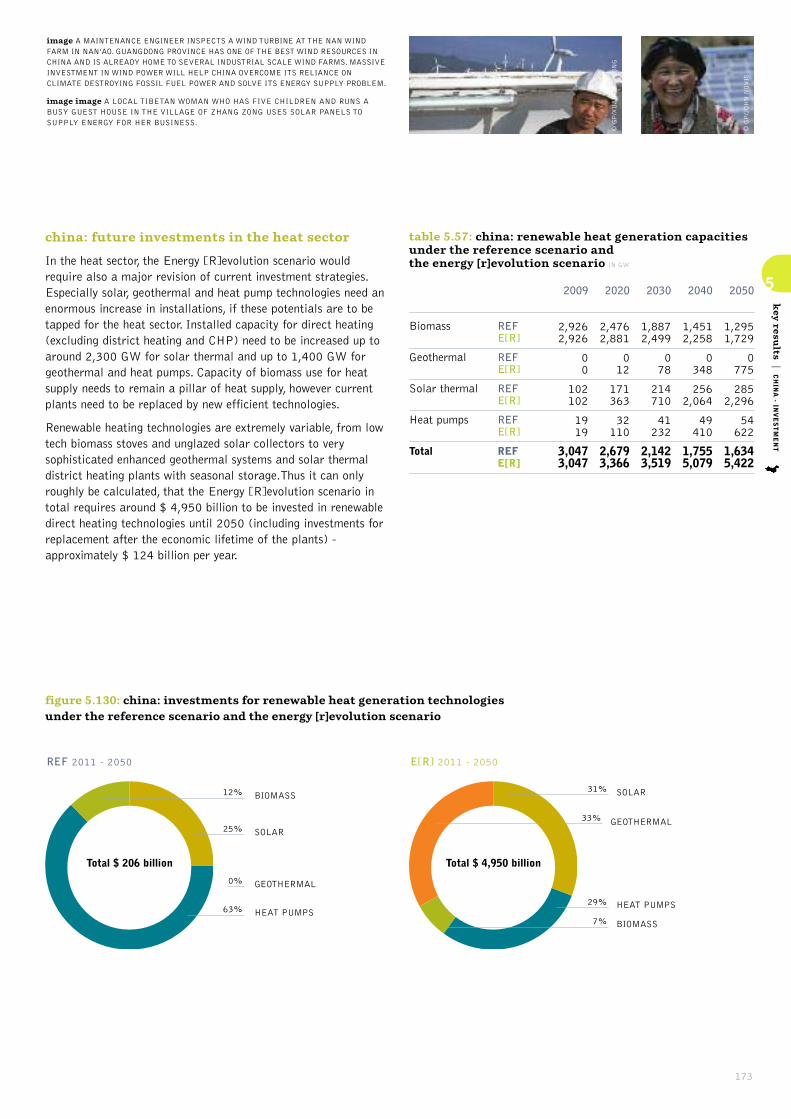
173
5
key resu
lts|CHINA - IN
VESTMENT
china: future investments in the heat sector
In the heat sector, the Energy [R]evolution scenario wouldrequire also a major revision of current investment strategies.Especially solar, geothermal and heat pump technologies need anenormous increase in installations, if these potentials are to betapped for the heat sector. Installed capacity for direct heating(excluding district heating and CHP) need to be increased up toaround 2,300 GW for solar thermal and up to 1,400 GW forgeothermal and heat pumps. Capacity of biomass use for heatsupply needs to remain a pillar of heat supply, however currentplants need to be replaced by new efficient technologies.
Renewable heating technologies are extremely variable, from lowtech biomass stoves and unglazed solar collectors to verysophisticated enhanced geothermal systems and solar thermaldistrict heating plants with seasonal storage.Thus it can onlyroughly be calculated, that the Energy [R]evolution scenario intotal requires around $ 4,950 billion to be invested in renewabledirect heating technologies until 2050 (including investments forreplacement after the economic lifetime of the plants) -approximately $ 124 billion per year.
table 5.57: china: renewable heat generation capacitiesunder the reference scenario and the energy [r]evolution scenario IN GW
2020
2,4762,881
012
171363
32110
2,6793,366
2040
1,4512,258
0348
2562,064
49410
1,7555,079
2050
1,2951,729
0775
2852,296
54622
1,6345,422
Biomass
Geothermal
Solar thermal
Heat pumps
Total
REFE[R]
REFE[R]
REFE[R]
REFE[R]
REFE[R]
2030
1,8872,499
078
214710
41232
2,1423,519
2009
2,9262,926
00
102102
1919
3,0473,047
figure 5.130: china: investments for renewable heat generation technologies under the reference scenario and the energy [r]evolution scenario
REF 2011 - 2050
25% SOLAR
0% GEOTHERMAL
12% BIOMASS
63% HEAT PUMPS
Total $ 206 billion
E[R] 2011 - 2050
31% SOLAR
29% HEAT PUMPS
7% BIOMASS
33% GEOTHERMAL
Total $ 4,950 billion
© GP/JOHN NOVIS
© GP/XUAN CANXIONG
image A MAINTENANCE ENGINEER INSPECTS A WIND TURBINE AT THE NAN WINDFARM IN NAN’AO. GUANGDONG PROVINCE HAS ONE OF THE BEST WIND RESOURCES INCHINA AND IS ALREADY HOME TO SEVERAL INDUSTRIAL SCALE WIND FARMS. MASSIVEINVESTMENT IN WIND POWER WILL HELP CHINA OVERCOME ITS RELIANCE ONCLIMATE DESTROYING FOSSIL FUEL POWER AND SOLVE ITS ENERGY SUPPLY PROBLEM.
image image A LOCAL TIBETAN WOMAN WHO HAS FIVE CHILDREN AND RUNS ABUSY GUEST HOUSE IN THE VILLAGE OF ZHANG ZONG USES SOLAR PANELS TOSUPPLY ENERGY FOR HER BUSINESS.

174
5
key resu
lts|CHINA - E
MPLOYMENT
WORLD ENERGY [R]EVOLUTIONA SUSTAINABLE WORLD ENERGY OUTLOOK
GLOBAL SCENARIO OECD NORTH AMERICALATIN AMERICAOECD EUROPE AFRICA
MIDDLE EASTEASTERN EUROPE/EURASIAINDIA
NON OECD ASIACHINAOECD ASIA OCEANIA
china
china: future employment in the energy sector
The Energy [R]evolution scenario results in more energy sectorjobs in China at every stage of the projection, despite signficantreductions in fossil fuel jobs in both scenarios.
• There are 6 million energy sector jobs in the Energy [R]evolutionscenario in 2015, and 5.5 million in the Reference scenario.
• In 2020, there are 4.7 million jobs in the Energy [R]evolutionscenario, and 4.2 million in the Reference scenario.
• In 2030, there are 3.2 million jobs in the Energy [R]evolutionscenario and 2.8 million in the Reference scenario.
Figure 5.131 shows the change in job numbers under bothscenarios for each technology between 2010 and 2030. Jobs inthe coal sector decline sharply in both scenarios, reflectingsignificant increases in productivity in China’s coal industry.
Strong growth in the renewable sector compensates for some ofthe losses in the coal industry, so jobs in the Energy [R]evolutionscenario are generally 0.5 million higher than jobs in theReference scenario. Renewable energy accounts for 47% ofenergy jobs by 2030.
REFERENCE ENERGY[R]EVOLUTION
2010 2015 2020 2030 2015 2020 2030
0
1.0
3.0
3.0
4.0
5.0
6.0
7.0
8.0
9.0
Dir
ect
jobs
- m
illio
ns
figure 5.131: china: employment in the energy scenariounder the reference and energy [r]evolution scenarios
•GEOTHERMAL & HEAT PUMP
• SOLAR HEAT
• OCEAN ENERGY
• SOLAR THERMAL POWER
• GEOTHERMAL POWER
• PV
•WIND
• HYDRO
• BIOMASS
• NUCLEAR
• GAS, OIL & DIESEL
• COAL
table 5.58: china: total employment in the energy sector THOUSAND JOBS
CoalGas, oil & dieselNuclearRenewableTotal Jobs
Construction and installationManufacturingOperations and maintenanceFuel supply (domestic)Coal and gas exportTotal Jobs
2015
3,61825040
2,1306,038
883702495
3,957.1-
6,038
2020
2,72526318
1,7354,741
514444554
3,229-
4,741
2030
1,4282629
1,5363,235
499390459
1,888-
3,235
ENERGY [R]EVOLUTION
2015
3,972223185
1,1165,496
868394504
3,730-
5,496
2010
5,969223231
2,0288,451
1,725930478
5,318-
8,451
2020
3,010213101908
4,233
571280539
2,842-
4,233
2030
1,89430253512
2,762
339159429
1,836-
2,762
REFERENCE

175
5
key resu
lts|CHINA - T
RANSPORT
china: transport
In 2050, the car fleet in China will be 10 times larger than today.Today, more medium to large-sized cars are driven in China withan unusually high annual mileage. With growing individualmobility, an increasing share of small efficient cars is projected,with vehicle kilometres driven resembling industrialised countriesaverages. More efficient propulsion technologies, including hybrid-electric power trains, and lightweight construction, will help tolimit the growth in total transport energy demand to a factor of2, reaching 12,600 PJ/a in 2050. As China already has a largefleet of electric vehicles, this will grow to the point where almost55% of total transport energy is covered by electricity.
By 2030 electricity will provide 13% of the transport sector’stotal energy demand under the Energy [R]evolution scenario.Under both scenarios road transport volumes increasessignificantly. However, under the Energy [R]evolution scenario,the toal energy demand for road transport increases from 5,224PJ/a in 2009 to 7,794 PJ/a in 2050, compared to about 22,400PJ/a in the Reference case.
table 5.59: china: transport energy demand by mode underthe reference scenario and the energy [r]evolution scenario(WITHOUT ENERGY FOR PIPELINE TRANSPORT) IN PJ/A
2020
681752
11,5509,607
1,022862
779775
14,03211,996
2040
9361,062
19,8838,768
2,3101,846
1,1671,085
24,29612,760
2050
1,0561,118
22,3787,794
3,7092,560
1,3701,137
28,51212,609
Rail
Road
Domesticaviation
Domesticnavigation
Total
REFE[R]
REFE[R]
REFE[R]
REFE[R]
REFE[R]
2030
804932
16,75010,908
1,5481,268
985949
20,08714,058
2009
541541
5,2245,224
488488
558558
6,8116,811
figure 5.132: china: final energy consumption for transport under the reference scenario and the energy [r]evolution scenario
REF REF REF REF REF REFE[R] E[R] E[R] E[R] E[R] E[R]
2009 2015 2020 2030 2040 2050
PJ/a 0
5,000
10,000
15,000
20,000
25,000
30,000
•‘EFFICIENCY’
• HYDROGEN
• ELECTRICITY
• BIOFUELS
• NATURAL GAS
• OIL PRODUCTS
•WIND
• HYDRO
• BIOMASS
• NUCLEAR
• GAS, OIL & DIESEL
• COAL
© GP/ALEX HOFFORD
© ZHAO GANG/GP
image A WOMAN WASHES UP DISHES USING HOT WATER PROVIDED BY A SOLARTHERMAL WATER HEATER ON THE ROOF OF HER APARTMENT BLOCK. THE CITY OFDEZHOU IS LEADING THE WAY IN ADOPTING SOLAR ENERGY AND HAS BECOMEKNOWN AS THE SOLAR VALLEY OF CHINA.
image ZHAO PICHENGS HOME IN SHUIMOTOU VILLAGE HAS BEEN RUINED BY THESHENTOU NUMBER 2 POWER PLANT IN SHUOZHOU, SHANXI PROVINCE. CONTINUEDLEAKAGE FROM THE PLANTS COAL ASH POND HAS RAISED GROUNDWATER LEVELS,FLOODING CELLARS IN THE VILLAGE. EXCESS WATER HAS ALSO DAMAGED HOUSINGFOUNDATIONS, CAUSING THE BUILDINGS TO DEVELOP CRACKS OR EVEN COLLAPSE.AFTER A LARGE PART OF HIS ROOF FELL OFF, ZHAO PICHENG AND HIS FAMILY HADNO CHOICE BUT TO MOVE.
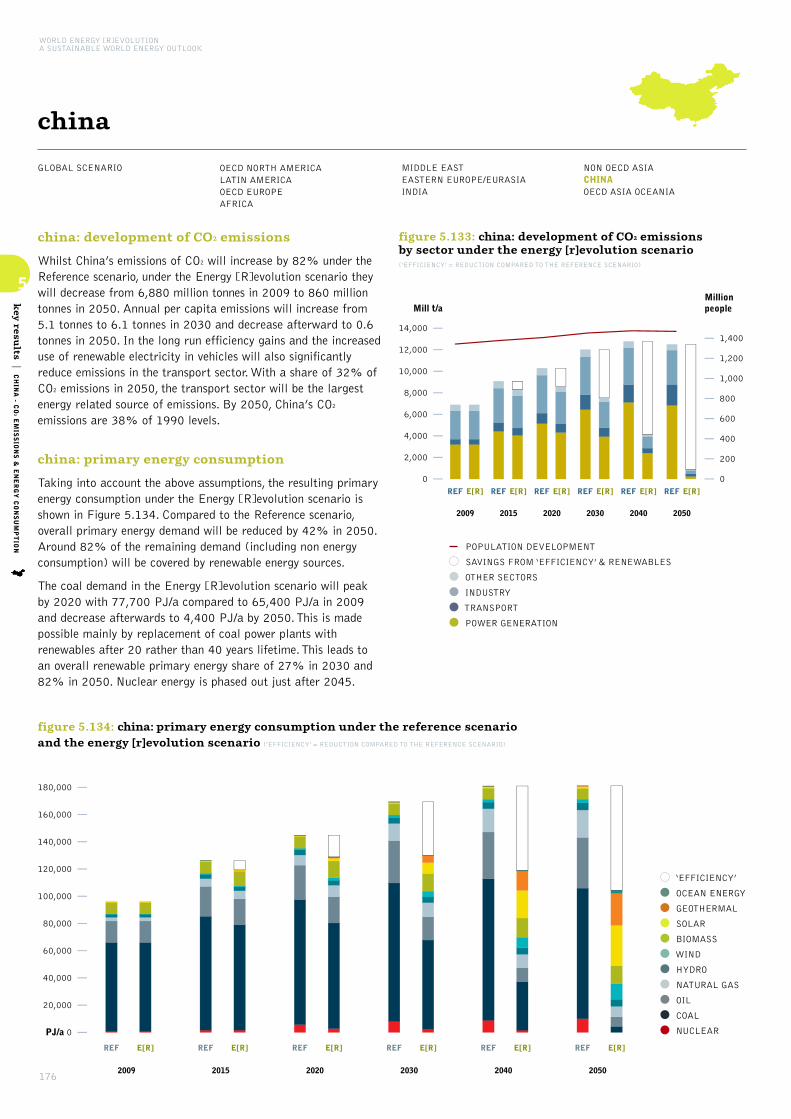
176
5
key resu
lts|CHINA - C
O2EMISSIONS & ENERGY CONSUMPTION
WORLD ENERGY [R]EVOLUTIONA SUSTAINABLE WORLD ENERGY OUTLOOK
GLOBAL SCENARIO OECD NORTH AMERICALATIN AMERICAOECD EUROPE AFRICA
MIDDLE EASTEASTERN EUROPE/EURASIAINDIA
NON OECD ASIACHINAOECD ASIA OCEANIA
china
china: development of CO2 emissions
Whilst China’s emissions of CO2 will increase by 82% under theReference scenario, under the Energy [R]evolution scenario theywill decrease from 6,880 million tonnes in 2009 to 860 milliontonnes in 2050. Annual per capita emissions will increase from5.1 tonnes to 6.1 tonnes in 2030 and decrease afterward to 0.6tonnes in 2050. In the long run efficiency gains and the increaseduse of renewable electricity in vehicles will also significantlyreduce emissions in the transport sector. With a share of 32% ofCO2 emissions in 2050, the transport sector will be the largestenergy related source of emissions. By 2050, China’s CO2
emissions are 38% of 1990 levels.
china: primary energy consumption
Taking into account the above assumptions, the resulting primaryenergy consumption under the Energy [R]evolution scenario isshown in Figure 5.134. Compared to the Reference scenario,overall primary energy demand will be reduced by 42% in 2050.Around 82% of the remaining demand (including non energyconsumption) will be covered by renewable energy sources.
The coal demand in the Energy [R]evolution scenario will peakby 2020 with 77,700 PJ/a compared to 65,400 PJ/a in 2009and decrease afterwards to 4,400 PJ/a by 2050. This is madepossible mainly by replacement of coal power plants withrenewables after 20 rather than 40 years lifetime. This leads toan overall renewable primary energy share of 27% in 2030 and82% in 2050. Nuclear energy is phased out just after 2045.
figure 5.133: china: development of CO2 emissions by sector under the energy [r]evolution scenario(‘EFFICIENCY’ = REDUCTION COMPARED TO THE REFERENCE SCENARIO)
REF REF REF REF REF REFE[R] E[R] E[R] E[R] E[R] E[R]
2009 2015 2020 2030 2040 2050
0 0
200
400
600
800
1,000
1,200
1,400
2,000
4,000
6,000
8,000
10,000
12,000
14,000
Mill t/aMillion people
POPULATION DEVELOPMENT
• SAVINGS FROM ‘EFFICIENCY’ & RENEWABLES
• OTHER SECTORS
• INDUSTRY
•TRANSPORT
• POWER GENERATION
figure 5.134: china: primary energy consumption under the reference scenario and the energy [r]evolution scenario (‘EFFICIENCY’ = REDUCTION COMPARED TO THE REFERENCE SCENARIO)
PJ/a 0
20,000
40,000
60,000
80,000
100,000
120,000
140,000
160,000
180,000
REF REF REF REF REF REFE[R] E[R] E[R] E[R] E[R] E[R]
2009 2015 2020 2030 2040 2050
•‘EFFICIENCY’
• OCEAN ENERGY
• GEOTHERMAL
• SOLAR
• BIOMASS
•WIND
• HYDRO
• NATURAL GAS
• OIL
• COAL
• NUCLEAR
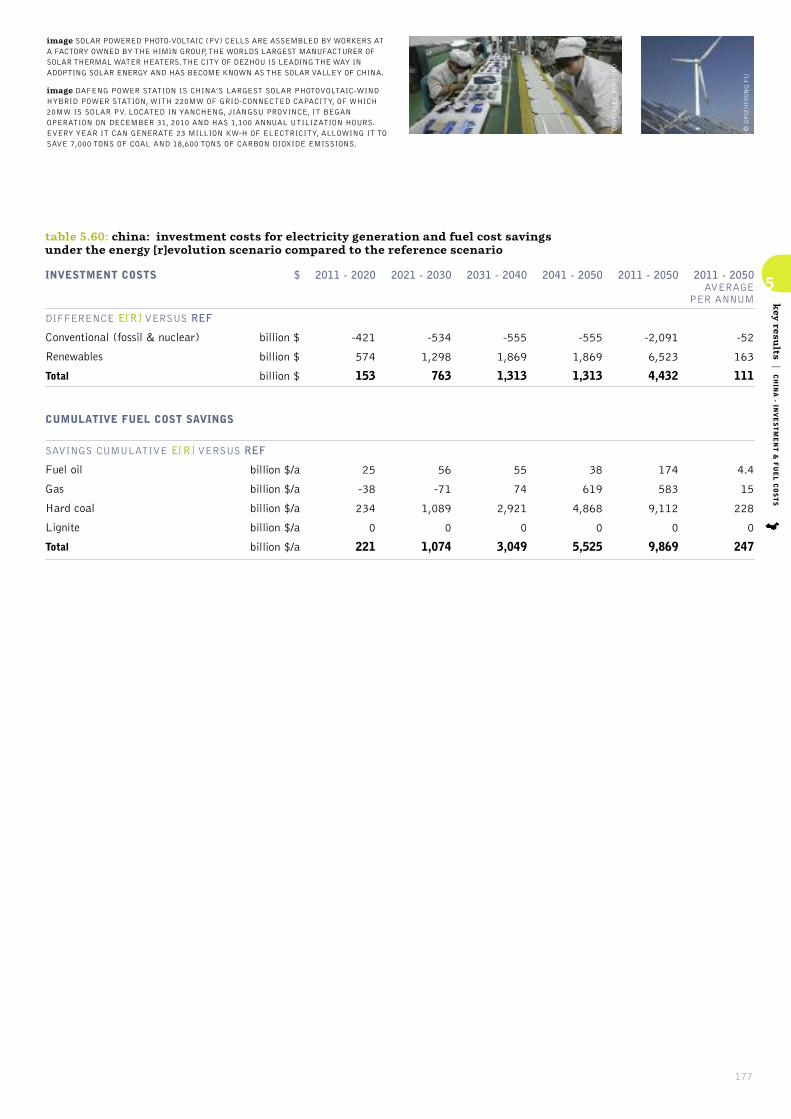
177
5
key resu
lts|CHINA - IN
VESTMENT & FUEL COSTS
table 5.60: china: investment costs for electricity generation and fuel cost savings under the energy [r]evolution scenario compared to the reference scenario
INVESTMENT COSTS
DIFFERENCE E[R] VERSUS REF
Conventional (fossil & nuclear)
Renewables
Total
CUMULATIVE FUEL COST SAVINGS
SAVINGS CUMULATIVE E[R] VERSUS REF
Fuel oil
Gas
Hard coal
Lignite
Total
$
billion $
billion $
billion $
billion $/a
billion $/a
billion $/a
billion $/a
billion $/a
2021 - 2030
-534
1,298
763
56
-71
1,089
0
1,074
2011 - 2020
-421
574
153
25
-38
234
0
221
2011 - 2050
-2,091
6,523
4,432
174
583
9,112
0
9,869
2011 - 2050 AVERAGE
PER ANNUM
-52
163
111
4.4
15
228
0
247
2041 - 2050
-555
1,869
1,313
38
619
4,868
0
5,525
2031 - 2040
-555
1,869
1,313
55
74
2,921
0
3,049
© GP/ZHIYONG FU
© GP/ALEX HOFFORD
image SOLAR POWERED PHOTO-VOLTAIC (PV) CELLS ARE ASSEMBLED BY WORKERS ATA FACTORY OWNED BY THE HIMIN GROUP, THE WORLDS LARGEST MANUFACTURER OFSOLAR THERMAL WATER HEATERS. THE CITY OF DEZHOU IS LEADING THE WAY INADOPTING SOLAR ENERGY AND HAS BECOME KNOWN AS THE SOLAR VALLEY OF CHINA.
image DAFENG POWER STATION IS CHINA’S LARGEST SOLAR PHOTOVOLTAIC-WINDHYBRID POWER STATION, WITH 220MW OF GRID-CONNECTED CAPACITY, OF WHICH20MW IS SOLAR PV. LOCATED IN YANCHENG, JIANGSU PROVINCE, IT BEGANOPERATION ON DECEMBER 31, 2010 AND HAS 1,100 ANNUAL UTILIZATION HOURS.EVERY YEAR IT CAN GENERATE 23 MILLION KW-H OF ELECTRICITY, ALLOWING IT TOSAVE 7,000 TONS OF COAL AND 18,600 TONS OF CARBON DIOXIDE EMISSIONS.
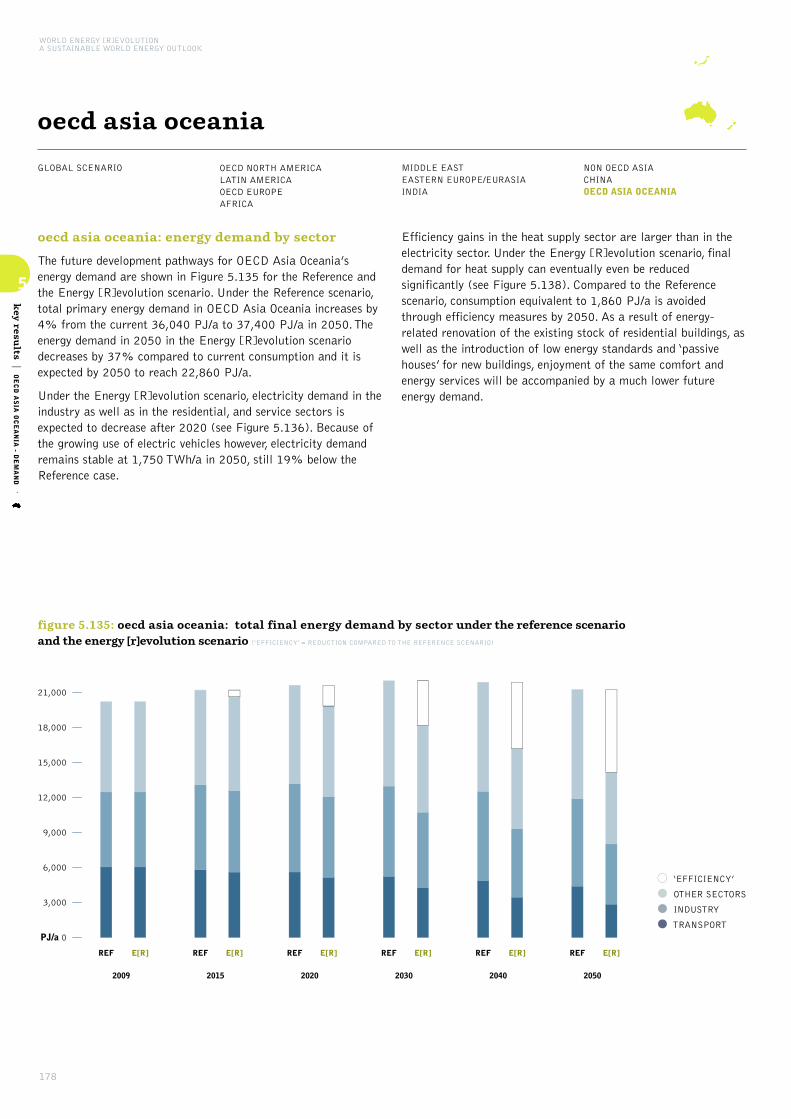
178
5
key resu
lts|OECD ASIA OCEANIA - D
EMAND
WORLD ENERGY [R]EVOLUTIONA SUSTAINABLE WORLD ENERGY OUTLOOK
GLOBAL SCENARIO OECD NORTH AMERICALATIN AMERICAOECD EUROPE AFRICA
MIDDLE EASTEASTERN EUROPE/EURASIAINDIA
NON OECD ASIACHINAOECD ASIA OCEANIA
oecd asia oceania
oecd asia oceania: energy demand by sector
The future development pathways for OECD Asia Oceania’senergy demand are shown in Figure 5.135 for the Reference andthe Energy [R]evolution scenario. Under the Reference scenario,total primary energy demand in OECD Asia Oceania increases by4% from the current 36,040 PJ/a to 37,400 PJ/a in 2050. Theenergy demand in 2050 in the Energy [R]evolution scenariodecreases by 37% compared to current consumption and it isexpected by 2050 to reach 22,860 PJ/a.
Under the Energy [R]evolution scenario, electricity demand in theindustry as well as in the residential, and service sectors isexpected to decrease after 2020 (see Figure 5.136). Because ofthe growing use of electric vehicles however, electricity demandremains stable at 1,750 TWh/a in 2050, still 19% below theReference case.
Efficiency gains in the heat supply sector are larger than in theelectricity sector. Under the Energy [R]evolution scenario, finaldemand for heat supply can eventually even be reducedsignificantly (see Figure 5.138). Compared to the Referencescenario, consumption equivalent to 1,860 PJ/a is avoidedthrough efficiency measures by 2050. As a result of energy-related renovation of the existing stock of residential buildings, aswell as the introduction of low energy standards and ‘passivehouses’ for new buildings, enjoyment of the same comfort andenergy services will be accompanied by a much lower futureenergy demand.
figure 5.135: oecd asia oceania: total final energy demand by sector under the reference scenario and the energy [r]evolution scenario (‘EFFICIENCY’ = REDUCTION COMPARED TO THE REFERENCE SCENARIO)
• ‘EFFICIENCY’
• OTHER SECTORS
• INDUSTRY
•TRANSPORTPJ/a 0
3,000
6,000
9,000
12,000
15,000
18,000
21,000
REF REF REF REF REF REFE[R] E[R] E[R] E[R] E[R] E[R]
2009 2015 2020 2030 2040 2050

179
5
key resu
lts|OECD ASIA OCEANIA - D
EMAND
figure 5.136: oecd asia oceania: development of electricity demand by sector in the energy [r]evolution scenario(‘EFFICIENCY’ = REDUCTION COMPARED TO THE REFERENCE SCENARIO)
• ‘EFFICIENCY’
• OTHER SECTORS
• INDUSTRY
•TRANSPORT
E[R] E[R] E[R] E[R] E[R] E[R]
2009 2015 2020 2030 2040 2050
PJ/a 0
1,000
2,000
3,000
4,000
5,000
6,000
figure 5.137: oecd asia oceania: development of the transport demand by sector in the energy [r]evolution scenario
•‘EFFICIENCY’
• DOMESTIC NAVIGATION
• DOMESTIC AVIATION
• ROAD
• RAIL
E[R] E[R] E[R] E[R] E[R] E[R]
2009 2015 2020 2030 2040 2050
PJ/a 0
1,000
2,000
3,000
4,000
5,000
6,000
7,000
8,000
E[R] E[R] E[R] E[R] E[R] E[R]
2009 2015 2020 2030 2040 2050
PJ/a 0
1,000
2,000
3,000
4,000
5,000
6,000
7,000
8,000
9,000
figure 5.138: oecd asia oceania: development of heatdemand by sector in the energy [r]evolution scenario(‘EFFICIENCY’ = REDUCTION COMPARED TO THE REFERENCE SCENARIO)
• ‘EFFICIENCY’
• OTHER SECTORS
• INDUSTRY
© GP/DEAN SEWELL
© GP/DEAN SEWELL
image PORTLAND, IN THE STATE OF VICTORIA, WAS THE FIRST AUSTRALIAN COUNCILTO RECEIVE A DEVELOPMENT APPLICATION FOR WIND TURBINES AND NOW HASENOUGH IN THE SHIRE TO PROVIDE ENERGY FOR SEVERAL LOCAL TOWNS COMBINED.
image THE FORTUNES OF THE TOWN OF INNAMINCKA ARE ABOUT TO CHANGE,BECAUSE THEY ARE SITTING ON THE EDGE OF THE COOPER BASIN. IT MAY BESIZZLING ABOVE GROUND, BUT THE ROCKS FIVE KILOMETRES BELOW INNAMINCKAARE SUPER-HEATED, PROVIDING A NEW AND CLEAN SOURCE OF ENERGY. RESIDENTLEON, THE PUBLICAN SAYS, EVERYONE IN TOWN IS EXCITED, EVERYONE HAS TOLIVE NEXT TO A NOISY GENERATOR. AND ANYTHING YOU DO OUT HERE ISEXPENSIVE, IT ALL HAS TO BE FREIGHTED IN. ANYWHERE YOU CAN SAVE SOMEMONEY IS GREAT. UP UNTIL NOW, THE PUB HAS BEEN USING BETWEEN AROUND3,000 LITRES OF DIESEL FUEL EVERY WEEK. WHEN THE NEW GENERATOR ISSWITCHED ON THAT SHOULD DROP TO ZERO.
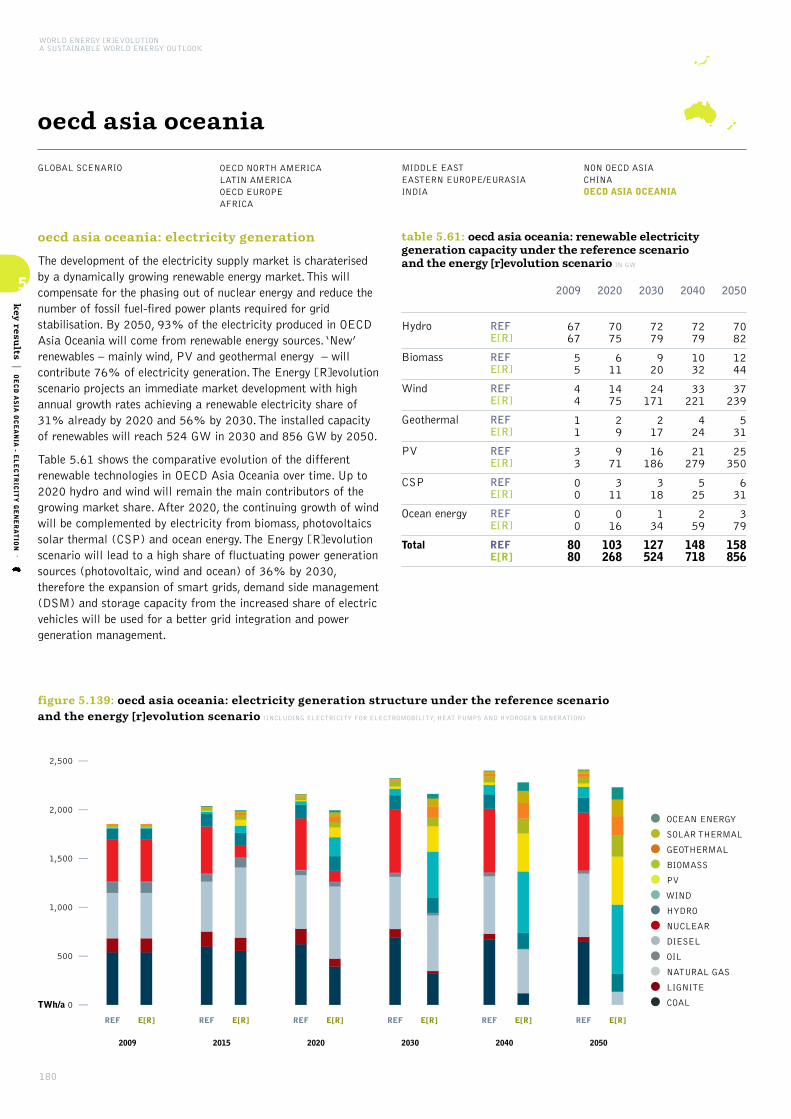
180
5
key resu
lts|OECD ASIA OCEANIA - E
LECTRICITY GENERATION
WORLD ENERGY [R]EVOLUTIONA SUSTAINABLE WORLD ENERGY OUTLOOK
GLOBAL SCENARIO OECD NORTH AMERICALATIN AMERICAOECD EUROPE AFRICA
MIDDLE EASTEASTERN EUROPE/EURASIAINDIA
NON OECD ASIACHINAOECD ASIA OCEANIA
oecd asia oceania
oecd asia oceania: electricity generation
The development of the electricity supply market is charaterisedby a dynamically growing renewable energy market. This willcompensate for the phasing out of nuclear energy and reduce thenumber of fossil fuel-fired power plants required for gridstabilisation. By 2050, 93% of the electricity produced in OECDAsia Oceania will come from renewable energy sources. ‘New’renewables – mainly wind, PV and geothermal energy – willcontribute 76% of electricity generation. The Energy [R]evolutionscenario projects an immediate market development with highannual growth rates achieving a renewable electricity share of31% already by 2020 and 56% by 2030. The installed capacityof renewables will reach 524 GW in 2030 and 856 GW by 2050.
Table 5.61 shows the comparative evolution of the differentrenewable technologies in OECD Asia Oceania over time. Up to2020 hydro and wind will remain the main contributors of thegrowing market share. After 2020, the continuing growth of windwill be complemented by electricity from biomass, photovoltaicssolar thermal (CSP) and ocean energy. The Energy [R]evolutionscenario will lead to a high share of fluctuating power generationsources (photovoltaic, wind and ocean) of 36% by 2030,therefore the expansion of smart grids, demand side management(DSM) and storage capacity from the increased share of electricvehicles will be used for a better grid integration and powergeneration management.
table 5.61: oecd asia oceania: renewable electricitygeneration capacity under the reference scenario and the energy [r]evolution scenario IN GW
2020
7075
611
1475
29
971
311
016
103268
2040
7279
1032
33221
424
21279
525
259
148718
2050
7082
1244
37239
531
25350
631
379
158856
Hydro
Biomass
Wind
Geothermal
PV
CSP
Ocean energy
Total
REFE[R]
REFE[R]
REFE[R]
REFE[R]
REFE[R]
REFE[R]
REFE[R]
REFE[R]
2030
7279
920
24171
217
16186
318
134
127524
2009
6767
55
44
11
33
00
00
8080
figure 5.139: oecd asia oceania: electricity generation structure under the reference scenario and the energy [r]evolution scenario (INCLUDING ELECTRICITY FOR ELECTROMOBILITY, HEAT PUMPS AND HYDROGEN GENERATION)
TWh/a 0
500
1,000
1,500
2,000
2,500
REF REF REF REF REF REFE[R] E[R] E[R] E[R] E[R] E[R]
2009 2015 2020 2030 2040 2050
•OCEAN ENERGY
• SOLAR THERMAL
• GEOTHERMAL
• BIOMASS
• PV
•WIND
• HYDRO
• NUCLEAR
• DIESEL
• OIL
• NATURAL GAS
• LIGNITE
• COAL

181
5
key resu
lts|OECD ASIA OCEANIA - E
LECTRICITY GENERATION
oecd asia oceania: future costs of electricity generation
Figure 5.140 shows that the introduction of renewabletechnologies under the Energy [R]evolution scenario slightlyincreases the costs of electricity generation in OECD AsiaOceania compared to the Reference scenario. This difference willbe less than $ 2.3 cent/kWh up to 2030, however. Because of thelower CO2 intensity of electricity generation, electricity generationcosts will become economically favourable under the Energy[R]evolution scenario and by 2050 costs will be $ 7.2 cents/kWhbelow those in the Reference version.
Under the Reference scenario, the unchecked growth in demand, anincrease in fossil fuel prices and the cost of CO2 emissions result intotal electricity supply costs rising from today’s $ 168 billion peryear to more than $ 436 billion in 2050. Figure 5.140 shows thatthe Energy [R]evolution scenario not only complies with OECD AsiaOceania’s CO2 reduction targets but also helps to stabilise energycosts. Increasing energy efficiency and shifting energy supply torenewables lead to long term costs for electricity supply that are17% lower in 2050 than in the Reference scenario.
figure 5.140: oecd asia oceania: total electricity supplycosts and specific electricity generation costs under two scenarios
0
50
100
150
200
250
300
350
400
450
500
2009 2015 2020 2030 2040 2050
0
2
4
6
8
10
12
14
16
18
ct/kWhBn$/a
SPEC. ELECTRICITY GENERATION COSTS (REF)
SPEC. ELECTRICITY GENERATION COSTS (E[R])
• ‘EFFICIENCY’ MEASURES
• REFERENCE SCENARIO (REF)
• ENERGY [R]EVOLUTION (E[R])
oecd asia oceania: future investments in the power sector
It would require $ 2,930 billion in investment in the power sectorfor the Energy [R]evolution scenario to become reality (includinginvestments for replacement after the economic lifetime of theplants) - approximately $ 1,450 billion or
$ 36 billion annually more than in the Reference scenario ($ 1,475 billion). Under the Reference version, the levels ofinvestment in conventional power plants add up to almost 67%while approximately 33% would be invested in renewable energyand cogeneration (CHP) until 2050.
Under the Energy [R]evolution scenario, however, OECD AsiaOceania would shift almost 90% of the entire investment towardsrenewables and cogeneration. Until 2030, the fossil fuel share ofpower sector investment would be focused mainly on CHP plants.The average annual investment in the power sector under theEnergy [R]evolution scenario between today and 2050 would beapproximately $ 73 billion.
Because renewable energy except biomasss has no fuel costs, thefuel cost savings in the Energy [R]evolution scenario reached atotal of $ 1,320 billion up to 2050, or $ 33 billion per year. Thetotal fuel cost savings therefore would cover 90% of the totaladditional investments compared to the Reference scenario. Theserenewable energy sources would then go on to produce electricitywithout any further fuel costs beyond 2050, while the costs forcoal and gas will continue to be a burden on national economies.
figure 5.141: oecd asia oceania: investment shares -reference scenario versus energy [r]evolution scenario
REF 2011 - 2050
26% FOSSIL
41% NUCLEAR
3% CHP
30% RENEWABLES
Total $ 1,475 billion
E[R] 2011 - 2050
10% FOSSIL
10% CHP
80% RENEWABLES
Total $ 2,930 billion
© GP/SOLNESS
© GP/NAOMI TOYODA
image SOLAR PANELS ON CONISTON STATION, NORTH WEST OF ALICE SPRINGS,NORTHERN TERRITORY.
image THE “CITIZENS’ WINDMILL” IN AOMORI, NORTHERN JAPAN. PUBLIC GROUPS,SUCH AS CO-OPERATIVES, ARE BUILDING AND RUNNING LARGE-SCALE WINDTURBINES IN SEVERAL CITIES AND TOWNS ACROSS JAPAN.

182
5
key resu
lts|OECD ASIA OCEANIA - H
EATING
WORLD ENERGY [R]EVOLUTIONA SUSTAINABLE WORLD ENERGY OUTLOOK
GLOBAL SCENARIO OECD NORTH AMERICALATIN AMERICAOECD EUROPE AFRICA
MIDDLE EASTEASTERN EUROPE/EURASIAINDIA
NON OECD ASIACHINAOECD ASIA OCEANIA
oecd asia oceania
oecd asia oceania: heating supply
Renewables currently provide 6% of OECD Asia Oceania’s energydemand for heat supply, the main contribution coming from theuse of biomass. The lack of district heating networks is a severestructural barrier to the large scale utilisation of geothermal andsolar thermal energy. In the Energy [R]evolution scenario,renewables provide 47% of OECD Asia Oceania’s total heatdemand in 2030 and 90% in 2050.
• Energy efficiency measures can decrease the current demandfor heat supply by 13%, in spite of improving living standards.
• For direct heating, solar collectors, biomass/biogas as well asgeothermal energy are increasingly substituting for fossil fuel-fired systems.
• The introduction of strict efficiency measures e.g. via strictbuilding standards and ambitious support programms forrenewable heating systems are needed to achieve economies ofscale within the next 5 to 10 years.
Table 5.62 shows the development of the different renewabletechnologies for heating in OECD Asia Oceania over time. Up to2020 biomass will remain the main contributors of the growingmarket share. After 2020, the continuing growth of solarcollectors and a growing share of geothermal heat pumps willreduce the dependence on fossil fuels.
table 5.62: oecd asia oceania: renewable heatingcapacities under the reference scenario and the energy [r]evolution scenario IN GW
2020
396845
57323
34354
04
4861,526
2040
5391,745
1211,272
541,398
0108
7144,523
2050
5921,808
1381,482
691,806
0297
7985,393
Biomass
Solarcollectors
Geothermal
Hydrogen
Total
REFE[R]
REFE[R]
REFE[R]
REFE[R]
REFE[R]
2030
4731,469
96880
42953
034
6113,336
2009
338338
7474
2929
00
440440
figure 5.142: oecd asia oceania: heat supply structure under the reference scenario and the energy [r]evolution scenario (‘EFFICIENCY’ = REDUCTION COMPARED TO THE REFERENCE SCENARIO)
PJ/a 0
1,000
2,000
3,000
4,000
5,000
6,000
7,000
8,000
REF REF REF REF REF REFE[R] E[R] E[R] E[R] E[R] E[R]
2009 2015 2020 2030 2040 2050
•‘EFFICIENCY’
• HYDROGEN
• GEOTHERMAL
• SOLAR
• BIOMASS
• FOSSIL
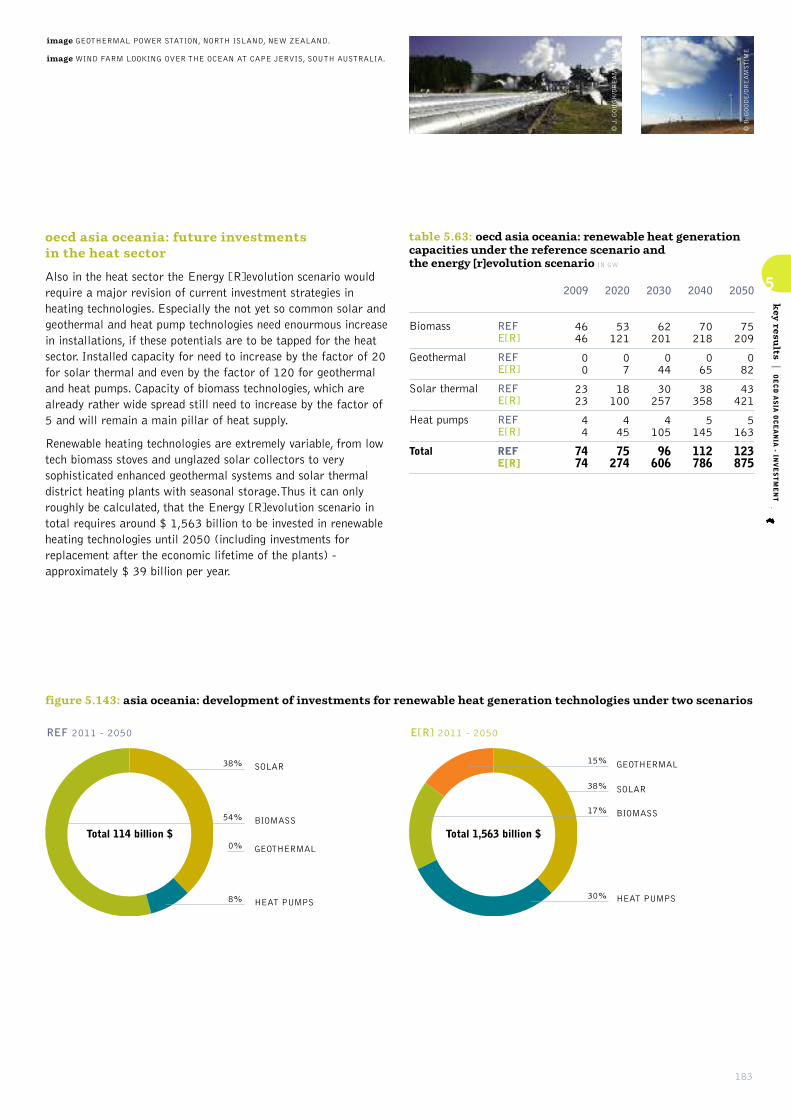
183
5
key resu
lts|OECD ASIA OCEANIA - IN
VESTMENT
oecd asia oceania: future investments in the heat sector
Also in the heat sector the Energy [R]evolution scenario wouldrequire a major revision of current investment strategies inheating technologies. Especially the not yet so common solar andgeothermal and heat pump technologies need enourmous increasein installations, if these potentials are to be tapped for the heatsector. Installed capacity for need to increase by the factor of 20for solar thermal and even by the factor of 120 for geothermaland heat pumps. Capacity of biomass technologies, which arealready rather wide spread still need to increase by the factor of5 and will remain a main pillar of heat supply.
Renewable heating technologies are extremely variable, from lowtech biomass stoves and unglazed solar collectors to verysophisticated enhanced geothermal systems and solar thermaldistrict heating plants with seasonal storage.Thus it can onlyroughly be calculated, that the Energy [R]evolution scenario intotal requires around $ 1,563 billion to be invested in renewableheating technologies until 2050 (including investments forreplacement after the economic lifetime of the plants) -approximately $ 39 billion per year.
table 5.63: oecd asia oceania: renewable heat generationcapacities under the reference scenario and the energy [r]evolution scenario IN GW
2020
53121
07
18100
445
75274
2040
70218
065
38358
5145
112786
2050
75209
082
43421
5163
123875
Biomass
Geothermal
Solar thermal
Heat pumps
Total
REFE[R]
REFE[R]
REFE[R]
REFE[R]
REFE[R]
2030
62201
044
30257
4105
96606
2009
4646
00
2323
44
7474
figure 5.143: asia oceania: development of investments for renewable heat generation technologies under two scenarios
REF 2011 - 2050
38% SOLAR
0% GEOTHERMAL
54% BIOMASS
8% HEAT PUMPS
Total 114 billion $
E[R] 2011 - 2050
38% SOLAR
30% HEAT PUMPS
17% BIOMASS
15% GEOTHERMAL
Total 1,563 billion $
© B. GOODE/DREAMSTIME
© J. GOUGH/DREAMSTIME
image GEOTHERMAL POWER STATION, NORTH ISLAND, NEW ZEALAND.
image WIND FARM LOOKING OVER THE OCEAN AT CAPE JERVIS, SOUTH AUSTRALIA.
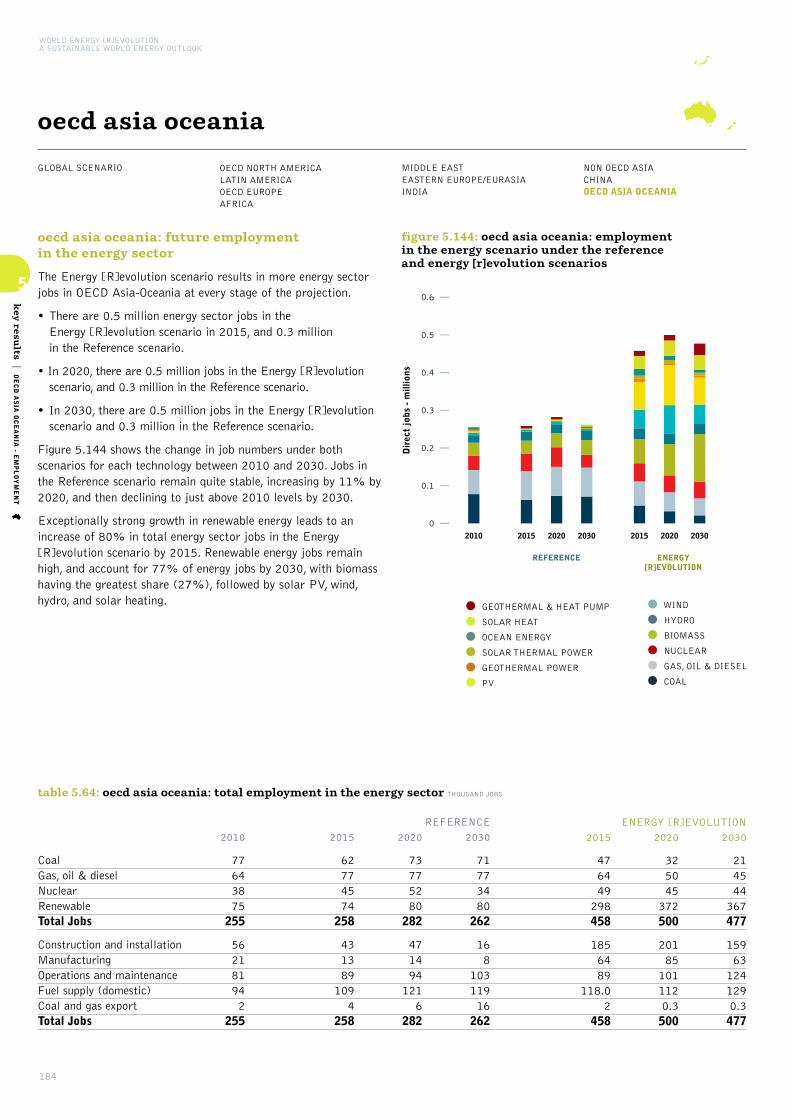
184
5
key resu
lts|OECD ASIA OCEANIA - E
MPLOYMENT
WORLD ENERGY [R]EVOLUTIONA SUSTAINABLE WORLD ENERGY OUTLOOK
GLOBAL SCENARIO OECD NORTH AMERICALATIN AMERICAOECD EUROPE AFRICA
MIDDLE EASTEASTERN EUROPE/EURASIAINDIA
NON OECD ASIACHINAOECD ASIA OCEANIA
oecd asia oceania
oecd asia oceania: future employment in the energy sector
The Energy [R]evolution scenario results in more energy sectorjobs in OECD Asia-Oceania at every stage of the projection.
• There are 0.5 million energy sector jobs in the Energy [R]evolution scenario in 2015, and 0.3 million in the Reference scenario.
• In 2020, there are 0.5 million jobs in the Energy [R]evolutionscenario, and 0.3 million in the Reference scenario.
• In 2030, there are 0.5 million jobs in the Energy [R]evolutionscenario and 0.3 million in the Reference scenario.
Figure 5.144 shows the change in job numbers under bothscenarios for each technology between 2010 and 2030. Jobs inthe Reference scenario remain quite stable, increasing by 11% by2020, and then declining to just above 2010 levels by 2030.
Exceptionally strong growth in renewable energy leads to anincrease of 80% in total energy sector jobs in the Energy[R]evolution scenario by 2015. Renewable energy jobs remainhigh, and account for 77% of energy jobs by 2030, with biomasshaving the greatest share (27%), followed by solar PV, wind,hydro, and solar heating.
REFERENCE ENERGY[R]EVOLUTION
2010 2015 2020 2030 2015 2020 2030
0
0.1
0.2
0.3
0.4
0.5
0.6
Dir
ect
jobs
- m
illio
ns
figure 5.144: oecd asia oceania: employment in the energy scenario under the reference and energy [r]evolution scenarios
•GEOTHERMAL & HEAT PUMP
• SOLAR HEAT
• OCEAN ENERGY
• SOLAR THERMAL POWER
• GEOTHERMAL POWER
• PV
•WIND
• HYDRO
• BIOMASS
• NUCLEAR
• GAS, OIL & DIESEL
• COAL
table 5.64: oecd asia oceania: total employment in the energy sector THOUSAND JOBS
CoalGas, oil & dieselNuclearRenewableTotal Jobs
Construction and installationManufacturingOperations and maintenanceFuel supply (domestic)Coal and gas exportTotal Jobs
2015
476449298458
1856489
118.02
458
2020
325045372500
201851011120.3500
2030
214544367477
159631241290.3477
ENERGY [R]EVOLUTION
2015
62774574258
4313891094
258
2010
77643875255
562181942
255
2020
73775280282
4714941216
282
2030
71773480262
168
10311916262
REFERENCE
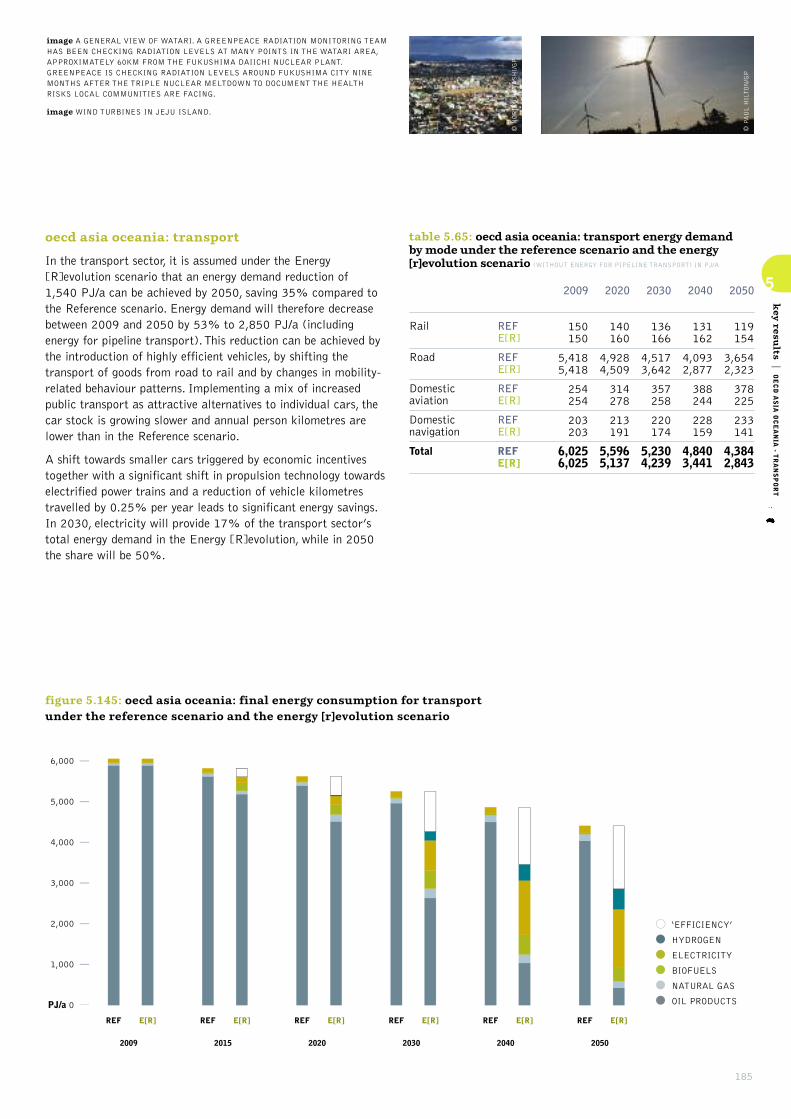
185
5
key resu
lts|OECD ASIA OCEANIA - T
RANSPORT
oecd asia oceania: transport
In the transport sector, it is assumed under the Energy[R]evolution scenario that an energy demand reduction of 1,540 PJ/a can be achieved by 2050, saving 35% compared tothe Reference scenario. Energy demand will therefore decreasebetween 2009 and 2050 by 53% to 2,850 PJ/a (includingenergy for pipeline transport). This reduction can be achieved bythe introduction of highly efficient vehicles, by shifting thetransport of goods from road to rail and by changes in mobility-related behaviour patterns. Implementing a mix of increasedpublic transport as attractive alternatives to individual cars, thecar stock is growing slower and annual person kilometres arelower than in the Reference scenario.
A shift towards smaller cars triggered by economic incentivestogether with a significant shift in propulsion technology towardselectrified power trains and a reduction of vehicle kilometrestravelled by 0.25% per year leads to significant energy savings.In 2030, electricity will provide 17% of the transport sector’stotal energy demand in the Energy [R]evolution, while in 2050the share will be 50%.
table 5.65: oecd asia oceania: transport energy demand by mode under the reference scenario and the energy[r]evolution scenario (WITHOUT ENERGY FOR PIPELINE TRANSPORT) IN PJ/A
2020
140160
4,9284,509
314278
213191
5,5965,137
2040
131162
4,0932,877
388244
228159
4,8403,441
2050
119154
3,6542,323
378225
233141
4,3842,843
Rail
Road
Domesticaviation
Domesticnavigation
Total
REFE[R]
REFE[R]
REFE[R]
REFE[R]
REFE[R]
2030
136166
4,5173,642
357258
220174
5,2304,239
2009
150150
5,4185,418
254254
203203
6,0256,025
figure 5.145: oecd asia oceania: final energy consumption for transport under the reference scenario and the energy [r]evolution scenario
REF REF REF REF REF REFE[R] E[R] E[R] E[R] E[R] E[R]
2009 2015 2020 2030 2040 2050
PJ/a 0
1,000
2,000
3,000
4,000
5,000
6,000
•‘EFFICIENCY’
• HYDROGEN
• ELECTRICITY
• BIOFUELS
• NATURAL GAS
• OIL PRODUCTS
•WIND
• HYDRO
• BIOMASS
• NUCLEAR
• GAS, OIL & DIESEL
• COAL
© NORIKO HAYASHI/GP
© PAUL HILTON/GP
image A GENERAL VIEW OF WATARI. A GREENPEACE RADIATION MONITORING TEAMHAS BEEN CHECKING RADIATION LEVELS AT MANY POINTS IN THE WATARI AREA,APPROXIMATELY 60KM FROM THE FUKUSHIMA DAIICHI NUCLEAR PLANT.GREENPEACE IS CHECKING RADIATION LEVELS AROUND FUKUSHIMA CITY NINEMONTHS AFTER THE TRIPLE NUCLEAR MELTDOWN TO DOCUMENT THE HEALTHRISKS LOCAL COMMUNITIES ARE FACING.
image WIND TURBINES IN JEJU ISLAND.
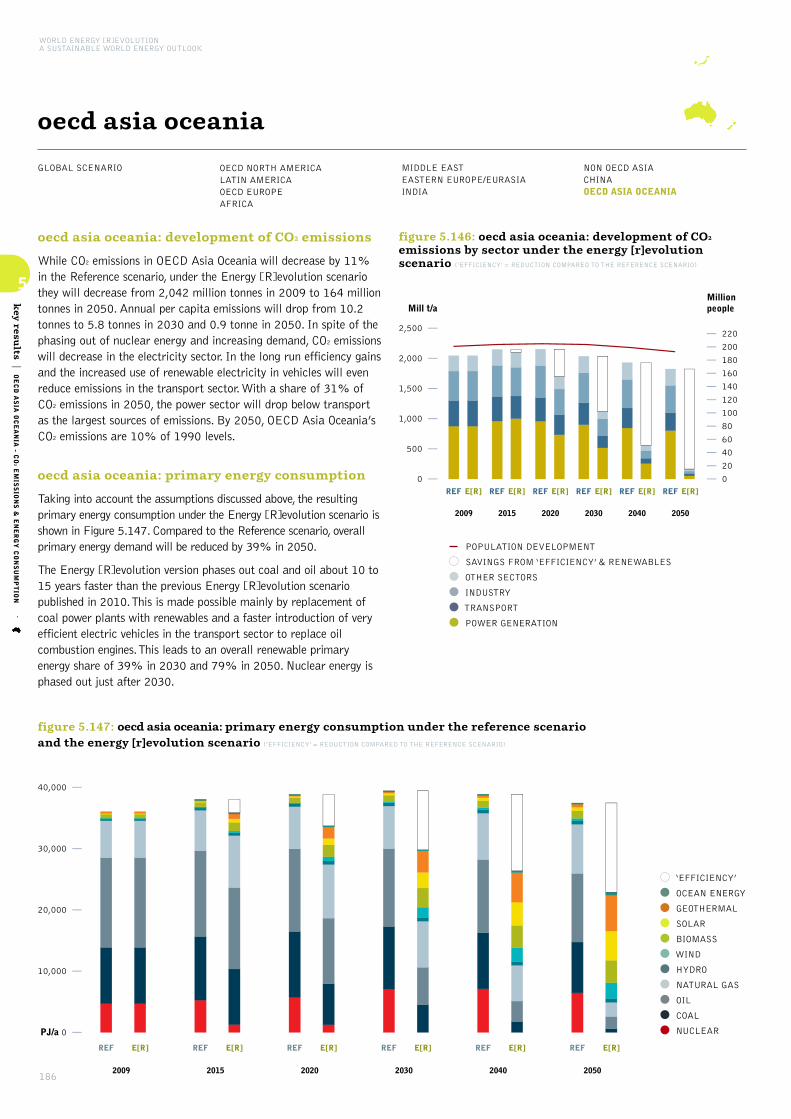
186
5
key resu
lts|OECD ASIA OCEANIA - C
O2EMISSIONS & ENERGY CONSUMPTION
WORLD ENERGY [R]EVOLUTIONA SUSTAINABLE WORLD ENERGY OUTLOOK
GLOBAL SCENARIO OECD NORTH AMERICALATIN AMERICAOECD EUROPE AFRICA
MIDDLE EASTEASTERN EUROPE/EURASIAINDIA
NON OECD ASIACHINAOECD ASIA OCEANIA
oecd asia oceania
oecd asia oceania: development of CO2 emissions
While CO2 emissions in OECD Asia Oceania will decrease by 11%in the Reference scenario, under the Energy [R]evolution scenariothey will decrease from 2,042 million tonnes in 2009 to 164 milliontonnes in 2050. Annual per capita emissions will drop from 10.2tonnes to 5.8 tonnes in 2030 and 0.9 tonne in 2050. In spite of thephasing out of nuclear energy and increasing demand, CO2 emissionswill decrease in the electricity sector. In the long run efficiency gainsand the increased use of renewable electricity in vehicles will evenreduce emissions in the transport sector. With a share of 31% ofCO2 emissions in 2050, the power sector will drop below transportas the largest sources of emissions. By 2050, OECD Asia Oceania’sCO2 emissions are 10% of 1990 levels.
oecd asia oceania: primary energy consumption
Taking into account the assumptions discussed above, the resultingprimary energy consumption under the Energy [R]evolution scenario isshown in Figure 5.147. Compared to the Reference scenario, overallprimary energy demand will be reduced by 39% in 2050.
The Energy [R]evolution version phases out coal and oil about 10 to15 years faster than the previous Energy [R]evolution scenariopublished in 2010. This is made possible mainly by replacement ofcoal power plants with renewables and a faster introduction of veryefficient electric vehicles in the transport sector to replace oilcombustion engines. This leads to an overall renewable primaryenergy share of 39% in 2030 and 79% in 2050. Nuclear energy isphased out just after 2030.
figure 5.146: oecd asia oceania: development of CO2
emissions by sector under the energy [r]evolutionscenario (‘EFFICIENCY’ = REDUCTION COMPARED TO THE REFERENCE SCENARIO)
REF REF REF REF REF REFE[R] E[R] E[R] E[R] E[R] E[R]
2009 2015 2020 2030 2040 2050
0
500
1,000
1,500
2,000
2,500
0 20 40 60 80 100 120 140 160 180
200 220
Mill t/aMillion people
POPULATION DEVELOPMENT
• SAVINGS FROM ‘EFFICIENCY’ & RENEWABLES
• OTHER SECTORS
• INDUSTRY
•TRANSPORT
• POWER GENERATION
figure 5.147: oecd asia oceania: primary energy consumption under the reference scenario and the energy [r]evolution scenario (‘EFFICIENCY’ = REDUCTION COMPARED TO THE REFERENCE SCENARIO)
PJ/a 0
10,000
20,000
30,000
40,000
REF REF REF REF REF REFE[R] E[R] E[R] E[R] E[R] E[R]
2009 2015 2020 2030 2040 2050
•‘EFFICIENCY’
• OCEAN ENERGY
• GEOTHERMAL
• SOLAR
• BIOMASS
•WIND
• HYDRO
• NATURAL GAS
• OIL
• COAL
• NUCLEAR
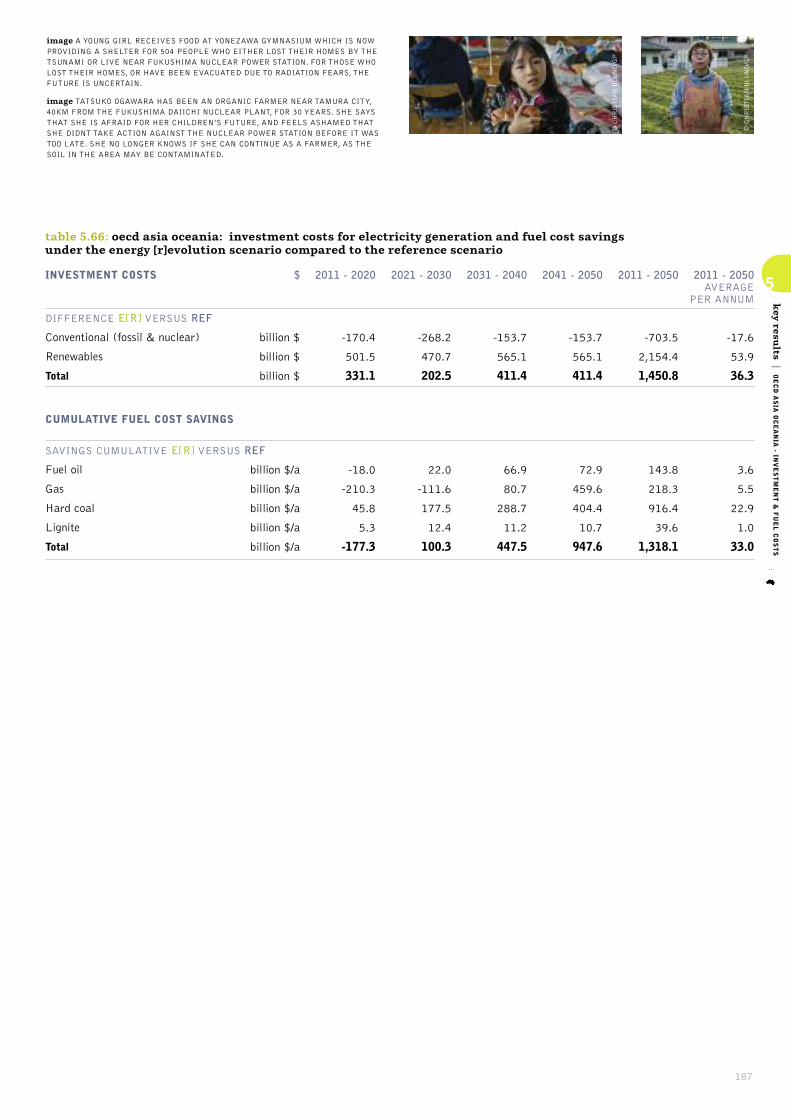
187
5
key resu
lts|OECD ASIA OCEANIA - IN
VESTMENT & FUEL COSTS
table 5.66: oecd asia oceania: investment costs for electricity generation and fuel cost savings under the energy [r]evolution scenario compared to the reference scenario
INVESTMENT COSTS
DIFFERENCE E[R] VERSUS REF
Conventional (fossil & nuclear)
Renewables
Total
CUMULATIVE FUEL COST SAVINGS
SAVINGS CUMULATIVE E[R] VERSUS REF
Fuel oil
Gas
Hard coal
Lignite
Total
$
billion $
billion $
billion $
billion $/a
billion $/a
billion $/a
billion $/a
billion $/a
2021 - 2030
-268.2
470.7
202.5
22.0
-111.6
177.5
12.4
100.3
2011 - 2020
-170.4
501.5
331.1
-18.0
-210.3
45.8
5.3
-177.3
2011 - 2050
-703.5
2,154.4
1,450.8
143.8
218.3
916.4
39.6
1,318.1
2011 - 2050 AVERAGE
PER ANNUM
-17.6
53.9
36.3
3.6
5.5
22.9
1.0
33.0
2041 - 2050
-153.7
565.1
411.4
72.9
459.6
404.4
10.7
947.6
2031 - 2040
-153.7
565.1
411.4
66.9
80.7
288.7
11.2
447.5
© CHRISTIAN ijLUND/GP
© CHRISTIAN ijLUND/GP
image A YOUNG GIRL RECEIVES FOOD AT YONEZAWA GYMNASIUM WHICH IS NOWPROVIDING A SHELTER FOR 504 PEOPLE WHO EITHER LOST THEIR HOMES BY THETSUNAMI OR LIVE NEAR FUKUSHIMA NUCLEAR POWER STATION. FOR THOSE WHOLOST THEIR HOMES, OR HAVE BEEN EVACUATED DUE TO RADIATION FEARS, THEFUTURE IS UNCERTAIN.
image TATSUKO OGAWARA HAS BEEN AN ORGANIC FARMER NEAR TAMURA CITY,40KM FROM THE FUKUSHIMA DAIICHI NUCLEAR PLANT, FOR 30 YEARS. SHE SAYSTHAT SHE IS AFRAID FOR HER CHILDREN’S FUTURE, AND FEELS ASHAMED THATSHE DIDNT TAKE ACTION AGAINST THE NUCLEAR POWER STATION BEFORE IT WASTOO LATE. SHE NO LONGER KNOWS IF SHE CAN CONTINUE AS A FARMER, AS THESOIL IN THE AREA MAY BE CONTAMINATED.

188
employment projections
METHODOLOGY AND ASSUMPTIONS
EMPLOYMENT FACTORS
REGIONAL ADJUSTMENTS FOSSIL FUELS AND NUCLEAR ENERGY
EMPLOYMENT IN RENEWABLEENERGY TECHNOLOGIES
66image SAND DUNES NEAR THE TOWN OF SAHMAH, OMAN.
economy andecology goes
hand in hand withnew employment.”“
© DIGITAL GLOBE

189
6.1 methodology and assumptions
The Institute for Sustainable Futures at the University ofTechnology, Sydney modelled the effects of the Referencescenario and Energy [R]evolution Scenario on jobs in the energysector. This section provides a simplified overview of how thecalculations were performed. A detailed methodology is alsoavailable.68 Chapters 2 and 3 contain all the data on how thescenarios were developed. The calculations were made usingconservative assumptions wherever possible. The main inputs tothe calculations are:
For each scenario, namely the Reference (business as usual) andEnergy [R]evolution scenario:
• The amount of electrical and heating capacity that will beinstalled each year for each technology,
• The primary energy demand for coal, gas, and biomass fuels inthe electricity and heating sectors.
• The amount of electricity generated per year from nuclear, oil,and diesel.
For each technology:
• ‘Employment factors’, or the number of jobs per unit ofcapacity, separated into manufacturing, construction, operationand maintenance, and per unit of primary energy for fuel supply.
• For the 2020 and 2030 calculations, a ‘decline factor’ for eachtechnology which reduces the employment factors by a certainpercentage per year. This reflects the fact that employment perunit falls as technology prices fall.
For each region:
• The percentage of local manufacturing and domestic fuelproduction in each region, in order to calculate the proportion ofmanufacturing and fuel production jobs which occur in the region.
• The percentage of world trade which originates in each region forcoal and gas fuels, and renewable energy traded components.
• A “regional job multiplier”, which indicates how labour-intensive economic activity is in that region compared to theOECD. This is used to adjust OECD employment factors wherelocal data is not available.
The electrical capacity increase and energy use figures from eachscenario are multiplied by the employment factors for each of thetechnologies, and then adjusted for regional labour intensity andthe proportion of fuel or manufacturing which occurs locally. Thecalculation is summarised in the Table 6.1.
A range of data sources are used for the model inputs, including theInternational Energy Agency, US Energy InformationAdministration, US National Renewable Energy Laboratory,International Labour Organisation, industry associations for wind,geothermal, solar, nuclear and gas, census data from Australia,Canada, and India, academic literature, and the ISF’s own research.
These calculations only take into account direct employment, forexample the construction team needed to build a new wind farm.They do not cover indirect employment, for example the extraservices provided in a town to accommodate construction teams.The calculations do not include jobs in energy efficiency, althoughthese are likely to be substantial, as the Energy [R]evolutionleads to a 40% drop in primary energy demand overall.
MW INSTALLED PER YEAR IN REGION
MW EXPORTEDPER YEAR
MW INSTALLED PER YEAR
CUMULATIVE CAPACITY
ELECTRICITY GENERATION
PRIMARY ENERGYDEMAND + EXPORTS
MW INSTALLEDPER YEAR
MANUFACTURING
EMPLOYMENT FACTOR ×TECHNOLOGY DECLINE FACTOR(NUMBER OF YEARS AFTER 2010)
MANUFACTURING (FOR LOCAL USE)
MANUFACTURING (FOR EXPORT)
CONSTRUCTION
OPERATION &MAINTENANCE
FUEL SUPPLY (NUCLEAR)
FUEL SUPPLY(COAL, GAS & BIOMASS)
HEAT SUPPLY
JOBS IN REGION
EMPLOYMENT FACTOR AT 2020 OR 2030
=
=
=
=
=
=
=
=
=
×
×
×
×
×
×
×
+
×
×
×
×
×
×
×
+
×
×
+
MANUFACTURINGEMPLOYMENT FACTOR
MANUFACTURINGEMPLOYMENT FACTOR
CONSTRUCTIONEMPLOYMENT FACTOR
O&M EMPLOYMENT FACTOR
FUEL EMPLOYMENTFACTOR
FUEL EMPLOYMENTFACTOR (ALWAYSREGIONAL FOR COAL)
EMPLOYMENT FACTORFOR HEAT
CONSTRUCTION
REGIONAL JOB MULTIPLIER
REGIONAL JOB MULTIPLIER
REGIONAL JOB MULTIPLIER
REGIONAL JOB MULTIPLIER
REGIONAL JOB MULTIPLIER
REGIONAL JOB MULTIPLIER
REGIONAL JOB MULTIPLIER
OPERATION &MAINTENANCE (O&M)
% OF LOCALMANUFACTURING
% OF LOCAL PRODUCTION
FUEL SUPPLY
table 6.1: methodology overview
reference68 JAY RUTOVITZ AND STEPHEN HARRIS. 2012.CALCULATING GLOBAL ENERGY SECTOR JOBS: 2012
METHODOLOGY.
6
futu
re emplo
ymen
t|METHODOLOGY AND ASSUMPTIONS
image THE DABANCHENG WIND POWER ALONG THEURUMQI-TURPAN HIGHWAY, XINJIANG PROVINCE,CHINA. HOME TO ONE OF ASIA’S BIGGEST WINDFARMS AND A PIONEER IN THE INDUSTRY XINJIANG’SDABANCHENG IS CURRENTLY ONE OF THE LARGESTWIND FARMS IN CHINA, WITH 100 MEGAWATTS OFINSTALLED POWER GENERATING CAPACITY.
© GP/SIMON LIM
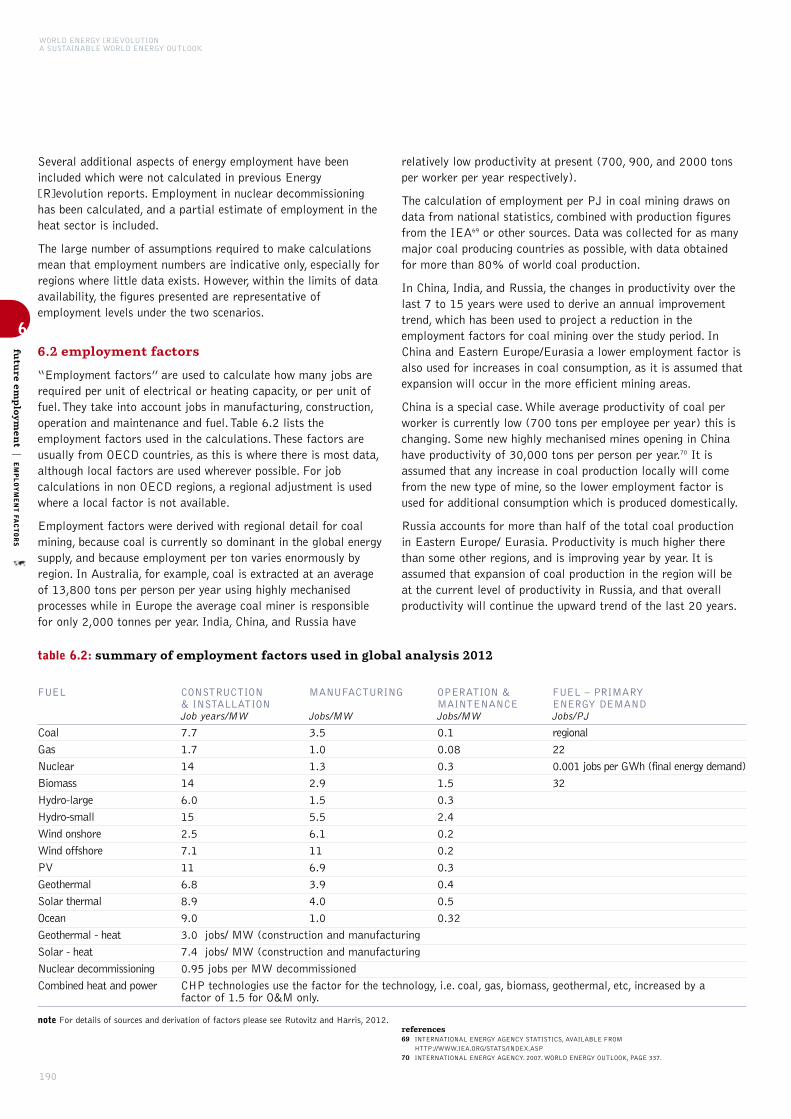
WORLD ENERGY [R]EVOLUTIONA SUSTAINABLE WORLD ENERGY OUTLOOK
6
futu
re emplo
ymen
t|EMPLOYMENT FA
CTORS
190
Several additional aspects of energy employment have beenincluded which were not calculated in previous Energy[R]evolution reports. Employment in nuclear decommissioninghas been calculated, and a partial estimate of employment in theheat sector is included.
The large number of assumptions required to make calculationsmean that employment numbers are indicative only, especially forregions where little data exists. However, within the limits of dataavailability, the figures presented are representative ofemployment levels under the two scenarios.
6.2 employment factors
“Employment factors” are used to calculate how many jobs arerequired per unit of electrical or heating capacity, or per unit offuel. They take into account jobs in manufacturing, construction,operation and maintenance and fuel. Table 6.2 lists theemployment factors used in the calculations. These factors areusually from OECD countries, as this is where there is most data,although local factors are used wherever possible. For jobcalculations in non OECD regions, a regional adjustment is usedwhere a local factor is not available.
Employment factors were derived with regional detail for coalmining, because coal is currently so dominant in the global energysupply, and because employment per ton varies enormously byregion. In Australia, for example, coal is extracted at an averageof 13,800 tons per person per year using highly mechanisedprocesses while in Europe the average coal miner is responsiblefor only 2,000 tonnes per year. India, China, and Russia have
relatively low productivity at present (700, 900, and 2000 tonsper worker per year respectively).
The calculation of employment per PJ in coal mining draws ondata from national statistics, combined with production figuresfrom the IEA69 or other sources. Data was collected for as manymajor coal producing countries as possible, with data obtainedfor more than 80% of world coal production.
In China, India, and Russia, the changes in productivity over thelast 7 to 15 years were used to derive an annual improvementtrend, which has been used to project a reduction in theemployment factors for coal mining over the study period. InChina and Eastern Europe/Eurasia a lower employment factor isalso used for increases in coal consumption, as it is assumed thatexpansion will occur in the more efficient mining areas.
China is a special case. While average productivity of coal perworker is currently low (700 tons per employee per year) this ischanging. Some new highly mechanised mines opening in Chinahave productivity of 30,000 tons per person per year.70 It isassumed that any increase in coal production locally will comefrom the new type of mine, so the lower employment factor isused for additional consumption which is produced domestically.
Russia accounts for more than half of the total coal productionin Eastern Europe/ Eurasia. Productivity is much higher therethan some other regions, and is improving year by year. It isassumed that expansion of coal production in the region will beat the current level of productivity in Russia, and that overallproductivity will continue the upward trend of the last 20 years.
references69 INTERNATIONAL ENERGY AGENCY STATISTICS, AVAILABLE FROM
HTTP://WWW.IEA.ORG/STATS/INDEX.ASP
70 INTERNATIONAL ENERGY AGENCY. 2007. WORLD ENERGY OUTLOOK, PAGE 337.
table 6.2: summary of employment factors used in global analysis 2012
CONSTRUCTION& INSTALLATIONJob years/MW
7.7
1.7
14
14
6.0
15
2.5
7.1
11
6.8
8.9
9.0
3.0 jobs/ MW (construction and manufacturing
7.4 jobs/ MW (construction and manufacturing
0.95 jobs per MW decommissioned
CHP technologies use the factor for the technology, i.e. coal, gas, biomass, geothermal, etc, increased by afactor of 1.5 for O&M only.
MANUFACTURING
Jobs/MW
3.5
1.0
1.3
2.9
1.5
5.5
6.1
11
6.9
3.9
4.0
1.0
OPERATION & MAINTENANCEJobs/MW
0.1
0.08
0.3
1.5
0.3
2.4
0.2
0.2
0.3
0.4
0.5
0.32
FUEL – PRIMARY ENERGY DEMANDJobs/PJ
regional
22
0.001 jobs per GWh (final energy demand)
32
FUEL
Coal
Gas
Nuclear
Biomass
Hydro-large
Hydro-small
Wind onshore
Wind offshore
PV
Geothermal
Solar thermal
Ocean
Geothermal - heat
Solar - heat
Nuclear decommissioning
Combined heat and power
note For details of sources and derivation of factors please see Rutovitz and Harris, 2012.
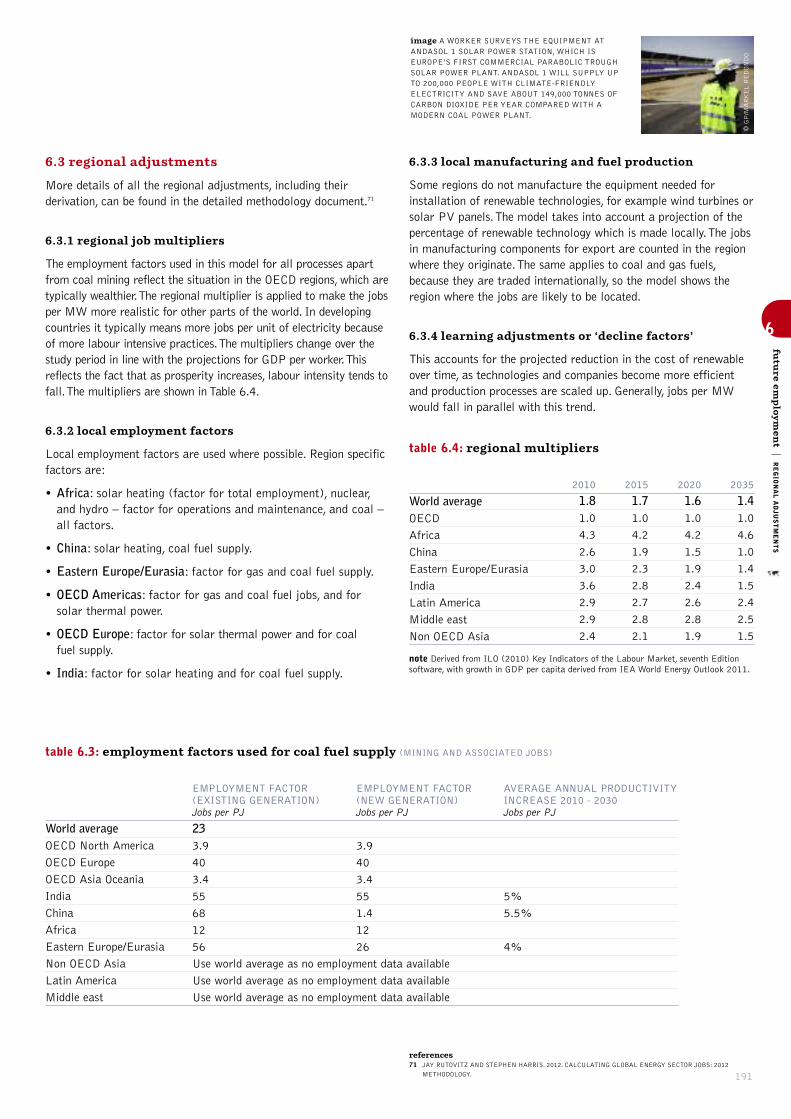
6
futu
re emplo
ymen
t|REGIONAL ADJUSTMENTS
191
6.3 regional adjustments
More details of all the regional adjustments, including theirderivation, can be found in the detailed methodology document.71
6.3.1 regional job multipliers
The employment factors used in this model for all processes apartfrom coal mining reflect the situation in the OECD regions, which aretypically wealthier. The regional multiplier is applied to make the jobsper MW more realistic for other parts of the world. In developingcountries it typically means more jobs per unit of electricity becauseof more labour intensive practices. The multipliers change over thestudy period in line with the projections for GDP per worker. Thisreflects the fact that as prosperity increases, labour intensity tends tofall. The multipliers are shown in Table 6.4.
6.3.2 local employment factors
Local employment factors are used where possible. Region specificfactors are:
• Africa: solar heating (factor for total employment), nuclear,and hydro – factor for operations and maintenance, and coal –all factors.
• China: solar heating, coal fuel supply.
• Eastern Europe/Eurasia: factor for gas and coal fuel supply.
• OECD Americas: factor for gas and coal fuel jobs, and forsolar thermal power.
• OECD Europe: factor for solar thermal power and for coal fuel supply.
• India: factor for solar heating and for coal fuel supply.
6.3.3 local manufacturing and fuel production
Some regions do not manufacture the equipment needed forinstallation of renewable technologies, for example wind turbines orsolar PV panels. The model takes into account a projection of thepercentage of renewable technology which is made locally. The jobsin manufacturing components for export are counted in the regionwhere they originate. The same applies to coal and gas fuels,because they are traded internationally, so the model shows theregion where the jobs are likely to be located.
6.3.4 learning adjustments or ‘decline factors’
This accounts for the projected reduction in the cost of renewableover time, as technologies and companies become more efficientand production processes are scaled up. Generally, jobs per MWwould fall in parallel with this trend.
table 6.3: employment factors used for coal fuel supply (MINING AND ASSOCIATED JOBS)
EMPLOYMENT FACTOR(EXISTING GENERATION)Jobs per PJ
233.9
40
3.4
55
68
12
56
Use world average as no employment data available
Use world average as no employment data available
Use world average as no employment data available
AVERAGE ANNUAL PRODUCTIVITYINCREASE 2010 - 2030Jobs per PJ
5%
5.5%
4%
EMPLOYMENT FACTOR (NEW GENERATION)Jobs per PJ
3.9
40
3.4
55
1.4
12
26
World averageOECD North America
OECD Europe
OECD Asia Oceania
India
China
Africa
Eastern Europe/Eurasia
Non OECD Asia
Latin America
Middle east
table 6.4: regional multipliers
2035
1.41.0
4.6
1.0
1.4
1.5
2.4
2.5
1.5
2020
1.61.0
4.2
1.5
1.9
2.4
2.6
2.8
1.9
2015
1.71.0
4.2
1.9
2.3
2.8
2.7
2.8
2.1
2010
1.81.0
4.3
2.6
3.0
3.6
2.9
2.9
2.4
World averageOECD
Africa
China
Eastern Europe/Eurasia
India
Latin America
Middle east
Non OECD Asia
note Derived from ILO (2010) Key Indicators of the Labour Market, seventh Editionsoftware, with growth in GDP per capita derived from IEA World Energy Outlook 2011.
references71 JAY RUTOVITZ AND STEPHEN HARRIS. 2012. CALCULATING GLOBAL ENERGY SECTOR JOBS: 2012
METHODOLOGY.
© GP/MARKEL REDONDO
image A WORKER SURVEYS THE EQUIPMENT ATANDASOL 1 SOLAR POWER STATION, WHICH ISEUROPE’S FIRST COMMERCIAL PARABOLIC TROUGHSOLAR POWER PLANT. ANDASOL 1 WILL SUPPLY UPTO 200,000 PEOPLE WITH CLIMATE-FRIENDLYELECTRICITY AND SAVE ABOUT 149,000 TONNES OFCARBON DIOXIDE PER YEAR COMPARED WITH AMODERN COAL POWER PLANT.
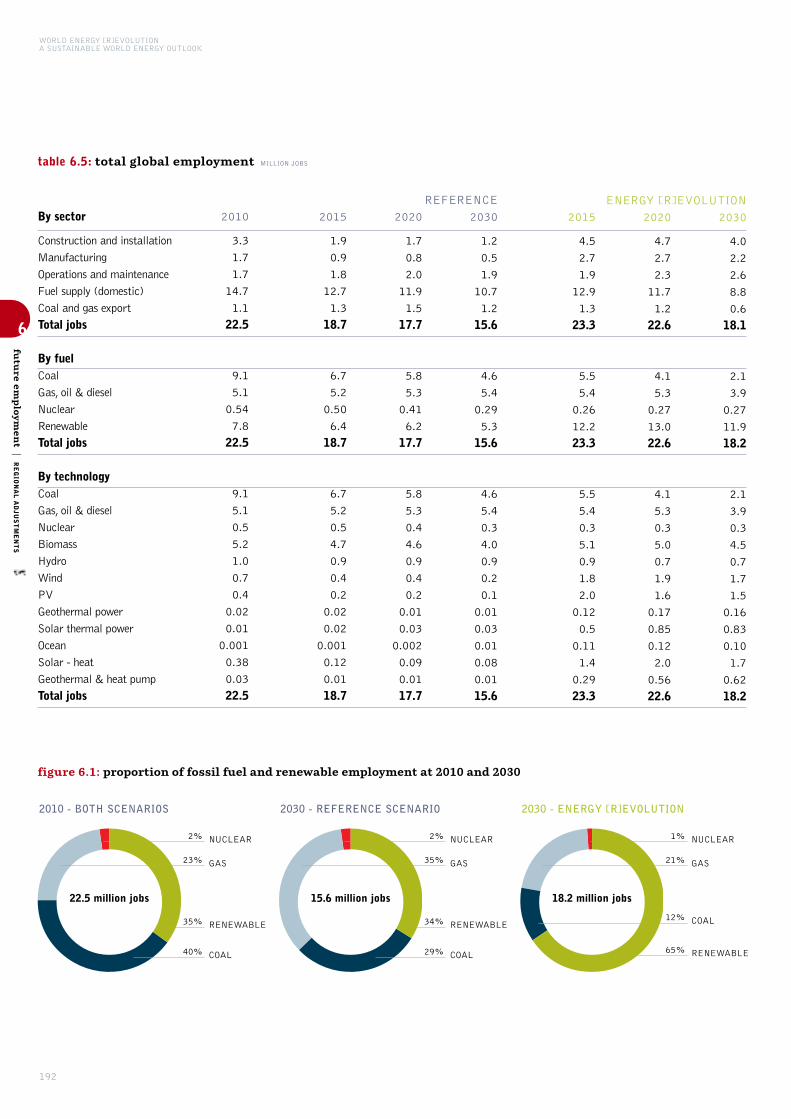
WORLD ENERGY [R]EVOLUTIONA SUSTAINABLE WORLD ENERGY OUTLOOK
192
6
futu
re emplo
ymen
t|REGIONAL ADJUSTMENTS
table 6.5: total global employment MILLION JOBS
ENERGY [R]EVOLUTION
2030
4.0
2.2
2.6
8.8
0.6
18.1
2.1
3.9
0.27
11.9
18.2
2.1
3.9
0.3
4.5
0.7
1.7
1.5
0.16
0.83
0.10
1.7
0.62
18.2
2020
4.7
2.7
2.3
11.7
1.2
22.6
4.1
5.3
0.27
13.0
22.6
4.1
5.3
0.3
5.0
0.7
1.9
1.6
0.17
0.85
0.12
2.0
0.56
22.6
2015
4.5
2.7
1.9
12.9
1.3
23.3
5.5
5.4
0.26
12.2
23.3
5.5
5.4
0.3
5.1
0.9
1.8
2.0
0.12
0.5
0.11
1.4
0.29
23.3
REFERENCE
2030
1.2
0.5
1.9
10.7
1.2
15.6
4.6
5.4
0.29
5.3
15.6
4.6
5.4
0.3
4.0
0.9
0.2
0.1
0.01
0.03
0.01
0.08
0.01
15.6
2020
1.7
0.8
2.0
11.9
1.5
17.7
5.8
5.3
0.41
6.2
17.7
5.8
5.3
0.4
4.6
0.9
0.4
0.2
0.01
0.03
0.002
0.09
0.01
17.7
2015
1.9
0.9
1.8
12.7
1.3
18.7
6.7
5.2
0.50
6.4
18.7
6.7
5.2
0.5
4.7
0.9
0.4
0.2
0.02
0.02
0.001
0.12
0.01
18.7
2010
3.3
1.7
1.7
14.7
1.1
22.5
9.1
5.1
0.54
7.8
22.5
9.1
5.1
0.5
5.2
1.0
0.7
0.4
0.02
0.01
0.001
0.38
0.03
22.5
By sector
Construction and installation
Manufacturing
Operations and maintenance
Fuel supply (domestic)
Coal and gas export
Total jobs
By fuelCoal
Gas, oil & diesel
Nuclear
Renewable
Total jobs
By technologyCoal
Gas, oil & diesel
Nuclear
Biomass
Hydro
Wind
PV
Geothermal power
Solar thermal power
Ocean
Solar - heat
Geothermal & heat pump
Total jobs
figure 6.1: proportion of fossil fuel and renewable employment at 2010 and 2030
2010 - BOTH SCENARIOS
40% COAL
35% RENEWABLE
23% GAS
2% NUCLEAR
22.5 million jobs
2030 - REFERENCE SCENARIO
29% COAL
34% RENEWABLE
35% GAS
2% NUCLEAR
15.6 million jobs
2030 - ENERGY [R]EVOLUTION
12% COAL
65% RENEWABLE
21% GAS
1% NUCLEAR
18.2 million jobs
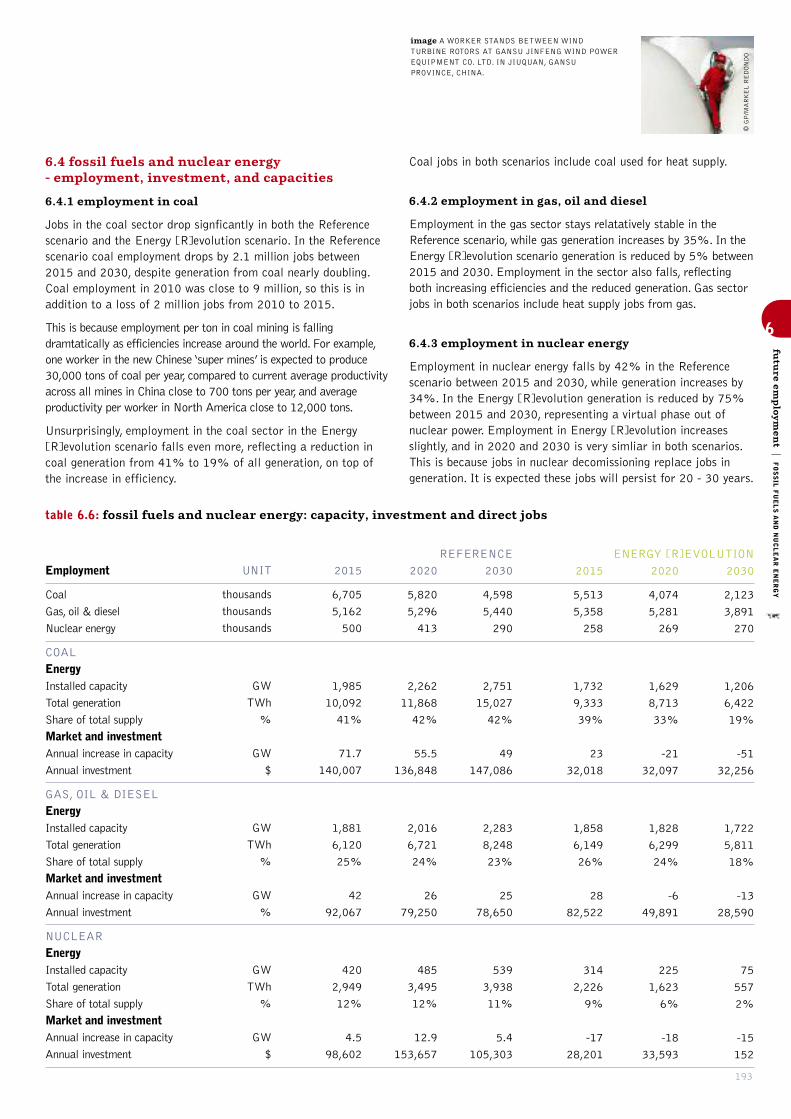
193
6.4 fossil fuels and nuclear energy - employment, investment, and capacities
6.4.1 employment in coal
Jobs in the coal sector drop signficantly in both the Referencescenario and the Energy [R]evolution scenario. In the Referencescenario coal employment drops by 2.1 million jobs between2015 and 2030, despite generation from coal nearly doubling.Coal employment in 2010 was close to 9 million, so this is inaddition to a loss of 2 million jobs from 2010 to 2015.
This is because employment per ton in coal mining is fallingdramtatically as efficiencies increase around the world. For example,one worker in the new Chinese ‘super mines’ is expected to produce30,000 tons of coal per year, compared to current average productivityacross all mines in China close to 700 tons per year, and averageproductivity per worker in North America close to 12,000 tons.
Unsurprisingly, employment in the coal sector in the Energy[R]evolution scenario falls even more, reflecting a reduction incoal generation from 41% to 19% of all generation, on top ofthe increase in efficiency.
Coal jobs in both scenarios include coal used for heat supply.
6.4.2 employment in gas, oil and diesel
Employment in the gas sector stays relatatively stable in theReference scenario, while gas generation increases by 35%. In theEnergy [R]evolution scenario generation is reduced by 5% between2015 and 2030. Employment in the sector also falls, reflectingboth increasing efficiencies and the reduced generation. Gas sectorjobs in both scenarios include heat supply jobs from gas.
6.4.3 employment in nuclear energy
Employment in nuclear energy falls by 42% in the Referencescenario between 2015 and 2030, while generation increases by34%. In the Energy [R]evolution generation is reduced by 75%between 2015 and 2030, representing a virtual phase out ofnuclear power. Employment in Energy [R]evolution increasesslightly, and in 2020 and 2030 is very simliar in both scenarios.This is because jobs in nuclear decomissioning replace jobs ingeneration. It is expected these jobs will persist for 20 - 30 years.
6
futu
re emplo
ymen
t|FOSSIL FUELS AND NUCLEAR ENERGY
table 6.6: fossil fuels and nuclear energy: capacity, investment and direct jobs
ENERGY [R]EVOLUTION
2030
2,123
3,891
270
1,206
6,422
19%
-51
32,256
1,722
5,811
18%
-13
28,590
75
557
2%
-15
152
2020
4,074
5,281
269
1,629
8,713
33%
-21
32,097
1,828
6,299
24%
-6
49,891
225
1,623
6%
-18
33,593
2015
5,513
5,358
258
1,732
9,333
39%
23
32,018
1,858
6,149
26%
28
82,522
314
2,226
9%
-17
28,201
2030
4,598
5,440
290
2,751
15,027
42%
49
147,086
2,283
8,248
23%
25
78,650
539
3,938
11%
5.4
105,303
2020
5,820
5,296
413
2,262
11,868
42%
55.5
136,848
2,016
6,721
24%
26
79,250
485
3,495
12%
12.9
153,657
2015
6,705
5,162
500
1,985
10,092
41%
71.7
140,007
1,881
6,120
25%
42
92,067
420
2,949
12%
4.5
98,602
UNIT
thousands
thousands
thousands
GW
TWh
%
GW
$
GW
TWh
%
GW
%
GW
TWh
%
GW
$
Employment
Coal
Gas, oil & diesel
Nuclear energy
COAL
EnergyInstalled capacity
Total generation
Share of total supply
Market and investmentAnnual increase in capacity
Annual investment
GAS, OIL & DIESEL
EnergyInstalled capacity
Total generation
Share of total supply
Market and investmentAnnual increase in capacity
Annual investment
NUCLEAR
EnergyInstalled capacity
Total generation
Share of total supply
Market and investmentAnnual increase in capacity
Annual investment
REFERENCE
image A WORKER STANDS BETWEEN WINDTURBINE ROTORS AT GANSU JINFENG WIND POWEREQUIPMENT CO. LTD. IN JIUQUAN, GANSUPROVINCE, CHINA.
© GP/MARKEL REDONDO

WORLD ENERGY [R]EVOLUTIONA SUSTAINABLE WORLD ENERGY OUTLOOK
194
6
futu
re emplo
ymen
t|EMPLOYMENT IN
RENEWABLE ENERGY TECHNOLOGIES
6.5 employment in renewable energy technologies
This report estimates direct jobs in renewable energy, includingconstruction, manufacturing, operations and maintentance, and fuelsupply wherever possible. It includes only direct jobs (such as thejob installing a wind turbine), and does not include indirect jobs(for example providing accomodation for construction workers).
The report does not include any estimate of jobs in energyefficiency, although this sector may create significant employment.The Energy [R]evolution scenario includes considerable increase inefficiencies in every sector compared to the Reference scenario,with a 21% decrease in primary energy use overall.
6.5.1 employment in wind energy
In the Energy [R]evolution scenario, wind energy would provide21% of total electricity generation by 2030, and would employ 1.7 million people. Growth is much more modest in the Referencescenario, with wind energy providing 5% of generation, andemploying only 0.2 million people.
6.5.2 employment in biomass
In the Energy [R]evolution scenario, biomass would provide4.6% of total electricity generation by 2030, and would employ4.5 million people. Growth is slightly lower in the Referencescenario, with biomass providing 2.6% of generation, andemploying 4 million people. Jobs in heating from biomass fuelsare included in this total.
table 6.7: wind energy: capacity, investment and direct jobs
ENERGY [R]EVOLUTION
2030
2,908
6,971
21%
165
340,428
1,723
2020
1,357
2,989
11%
14
221,470
1,865
2015
638
1,320
5%
89
154,645
1,842
REFERENCE
2030
754
1,710
5%
22
98,105
235
2020
525
1,127
4%
26
44,758
382
2015
397
806
3%
41
69,713
408
UNIT
GW
TWh
%
GW
$
thousands
Energy
Installed capacity
Total generation
Share of total supply
Market and investment
Annual increase in capacity
Annual investment
Employment in the energy sector
Direct jobs in construction, manufacturing, operation and maintenance
table 6.8: biomass: capacity, investment and direct jobs
ENERGY [R]EVOLUTION
2030
265
1,521
4.6%
12.2
39,776
4,549
2020
162
932
3.5%
12.2
27,467
4,995
2015
101
548
2.3%
9.3
31,237
5,077
REFERENCE
2030
155
937
2.6%
5.5
30,325
3,980
2020
98
574
2.0%
3.8
16,324
4,557
2015
79
433
1.8%
4.4
18,599
4,652
UNIT
GW
TWh
%
GW
$
thousands
Energy
Installed capacity
Total generation
Share of total supply
Market and investment
Annual increase in capacity
Annual investment
Employment in the energy sector
Direct jobs in construction, manufacturing, operation and maintenance
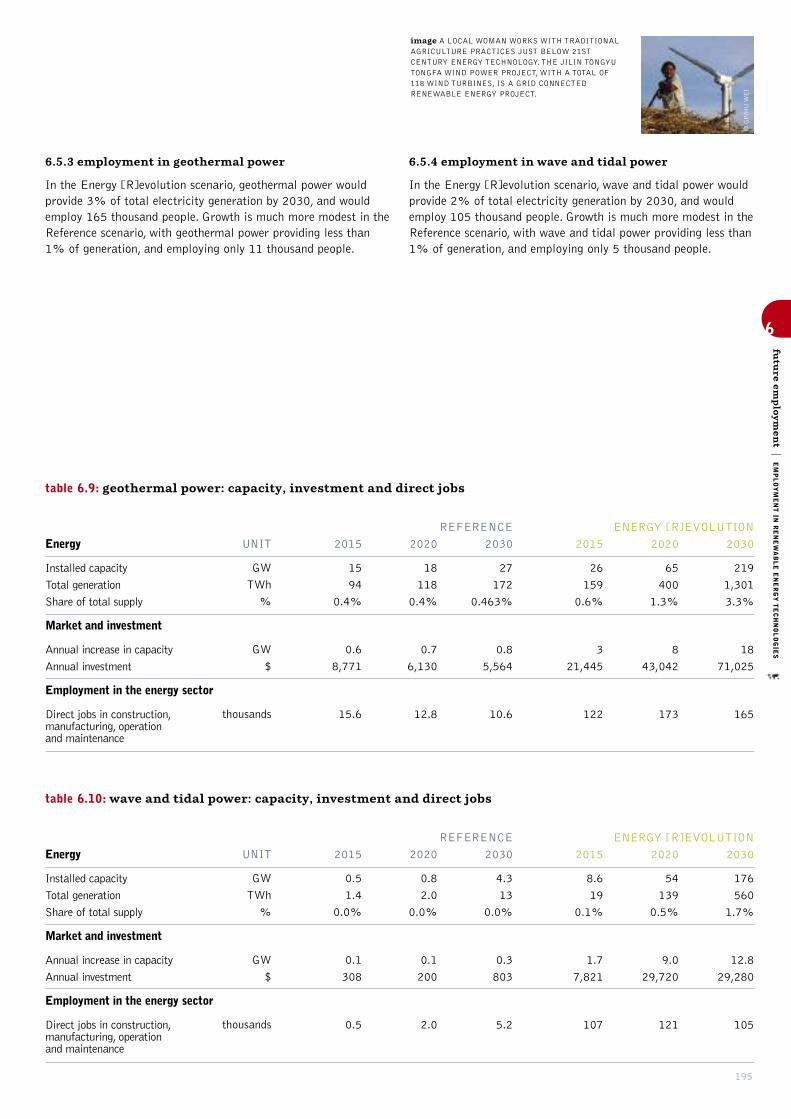
195
6.5.3 employment in geothermal power
In the Energy [R]evolution scenario, geothermal power wouldprovide 3% of total electricity generation by 2030, and wouldemploy 165 thousand people. Growth is much more modest in theReference scenario, with geothermal power providing less than1% of generation, and employing only 11 thousand people.
6.5.4 employment in wave and tidal power
In the Energy [R]evolution scenario, wave and tidal power wouldprovide 2% of total electricity generation by 2030, and wouldemploy 105 thousand people. Growth is much more modest in theReference scenario, with wave and tidal power providing less than1% of generation, and employing only 5 thousand people.
6
futu
re emplo
ymen
t|EMPLOYMENT IN
RENEWABLE ENERGY TECHNOLOGIES
table 6.9: geothermal power: capacity, investment and direct jobs
ENERGY [R]EVOLUTION
2030
219
1,301
3.3%
18
71,025
165
2020
65
400
1.3%
8
43,042
173
2015
26
159
0.6%
3
21,445
122
REFERENCE
2030
27
172
0.463%
0.8
5,564
10.6
2020
18
118
0.4%
0.7
6,130
12.8
2015
15
94
0.4%
0.6
8,771
15.6
UNIT
GW
TWh
%
GW
$
thousands
Energy
Installed capacity
Total generation
Share of total supply
Market and investment
Annual increase in capacity
Annual investment
Employment in the energy sector
Direct jobs in construction, manufacturing, operation and maintenance
table 6.10: wave and tidal power: capacity, investment and direct jobs
ENERGY [R]EVOLUTION
2030
176
560
1.7%
12.8
29,280
105
2020
54
139
0.5%
9.0
29,720
121
2015
8.6
19
0.1%
1.7
7,821
107
REFERENCE
2030
4.3
13
0.0%
0.3
803
5.2
2020
0.8
2.0
0.0%
0.1
200
2.0
2015
0.5
1.4
0.0%
0.1
308
0.5
UNIT
GW
TWh
%
GW
$
thousands
Energy
Installed capacity
Total generation
Share of total supply
Market and investment
Annual increase in capacity
Annual investment
Employment in the energy sector
Direct jobs in construction, manufacturing, operation and maintenance
© GP/HU WEI
image A LOCAL WOMAN WORKS WITH TRADITIONALAGRICULTURE PRACTICES JUST BELOW 21STCENTURY ENERGY TECHNOLOGY. THE JILIN TONGYUTONGFA WIND POWER PROJECT, WITH A TOTAL OF118 WIND TURBINES, IS A GRID CONNECTEDRENEWABLE ENERGY PROJECT.

WORLD ENERGY [R]EVOLUTIONA SUSTAINABLE WORLD ENERGY OUTLOOK
196
6
futu
re emplo
ymen
t|EMPLOYMENT IN
RENEWABLE ENERGY TECHNOLOGIES
6.5.5 employment in solar photovoltacis
In the Energy [R]evolution scenario, solar photovoltaics wouldprovide 8% of total electricity generation by 2030, and wouldemploy 1.5 million people. Growth is much more modest in theReference scenario, with solar photovoltaics providing less than1% of generation, and employing only 0.1 million people.
6.5.6 employment in solar thermal power
In the Energy [R]evolution scenario, solar thermal power wouldprovide 8.1% of total electricity generation by 2030, and wouldemploy 0.8 million people. Growth is much lower in the Referencescenario, with solar thermal power providing only 0.2% ofgeneration, and employing only 30 thousand people.
table 6.11: solar photovoltaics: capacity, investment and direct jobs
ENERGY [R]EVOLUTION
2030
1,764
2,634
8.0%
127
179,922
1,528
2020
674
878
3.3%
88
141,969
1,635
2015
234
289
1.2%
40
88,875
1,991
REFERENCE
2030
234
341
1.0%
10.9
35,104
124
2020
124
158
0.6%
7.1
11,617
210
2015
88
108
0.4%
10.5
23,920
182
UNIT
GW
TWh
%
GW
$
thousands
Energy
Installed capacity
Total generation
Share of total supply
Market and investment
Annual increase in capacity
Annual investment
Employment in the energy sector
Direct jobs in construction, manufacturing, operation and maintenance
table 6.12: solar thermal power: capacity, investment and direct jobs
ENERGY [R]EVOLUTION
2030
714
2,672
8.1%
55
826
2020
166
466
1.7%
26
855
2015
34
92
0.4%
6.5
504
REFERENCE
2030
24
81
0.2%
1.0
30
2020
11
35
0.1%
1.2
35
2015
5
0
0.0%
0.8
23
UNIT
GW
TWh
%
GW
thousands
Energy
Installed capacity
Total generation
Share of total supply
Market and investment
Annual increase in capacity
Employment in the energy sector
Direct jobs in construction, manufacturing, operation and maintenance
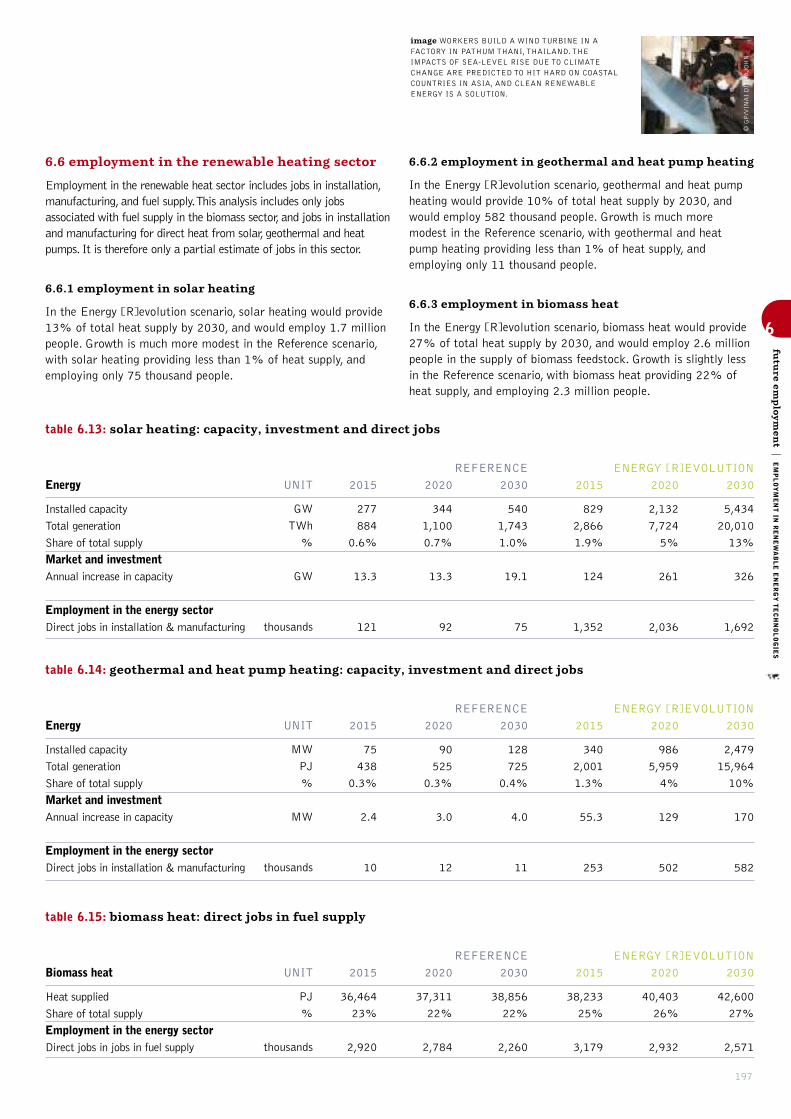
197
6.6 employment in the renewable heating sector
Employment in the renewable heat sector includes jobs in installation,manufacturing, and fuel supply. This analysis includes only jobsassociated with fuel supply in the biomass sector, and jobs in installationand manufacturing for direct heat from solar, geothermal and heatpumps. It is therefore only a partial estimate of jobs in this sector.
6.6.1 employment in solar heating
In the Energy [R]evolution scenario, solar heating would provide13% of total heat supply by 2030, and would employ 1.7 millionpeople. Growth is much more modest in the Reference scenario,with solar heating providing less than 1% of heat supply, andemploying only 75 thousand people.
6.6.2 employment in geothermal and heat pump heating
In the Energy [R]evolution scenario, geothermal and heat pumpheating would provide 10% of total heat supply by 2030, andwould employ 582 thousand people. Growth is much moremodest in the Reference scenario, with geothermal and heatpump heating providing less than 1% of heat supply, andemploying only 11 thousand people.
6.6.3 employment in biomass heat
In the Energy [R]evolution scenario, biomass heat would provide27% of total heat supply by 2030, and would employ 2.6 millionpeople in the supply of biomass feedstock. Growth is slightly lessin the Reference scenario, with biomass heat providing 22% ofheat supply, and employing 2.3 million people.
6
futu
re emplo
ymen
t|EMPLOYMENT IN
RENEWABLE ENERGY TECHNOLOGIES
table 6.13: solar heating: capacity, investment and direct jobs
ENERGY [R]EVOLUTION
2030
5,434
20,010
13%
326
1,692
2020
2,132
7,724
5%
261
2,036
2015
829
2,866
1.9%
124
1,352
REFERENCE
2030
540
1,743
1.0%
19.1
75
2020
344
1,100
0.7%
13.3
92
2015
277
884
0.6%
13.3
121
UNIT
GW
TWh
%
GW
thousands
Energy
Installed capacity
Total generation
Share of total supply
Market and investmentAnnual increase in capacity
Employment in the energy sectorDirect jobs in installation & manufacturing
table 6.14: geothermal and heat pump heating: capacity, investment and direct jobs
ENERGY [R]EVOLUTION
2030
2,479
15,964
10%
170
582
2020
986
5,959
4%
129
502
2015
340
2,001
1.3%
55.3
253
REFERENCE
2030
128
725
0.4%
4.0
11
2020
90
525
0.3%
3.0
12
2015
75
438
0.3%
2.4
10
UNIT
MW
PJ
%
MW
thousands
Energy
Installed capacity
Total generation
Share of total supply
Market and investmentAnnual increase in capacity
Employment in the energy sectorDirect jobs in installation & manufacturing
table 6.15: biomass heat: direct jobs in fuel supply
ENERGY [R]EVOLUTION
2030
42,600
27%
2,571
2020
40,403
26%
2,932
2015
38,233
25%
3,179
REFERENCE
2030
38,856
22%
2,260
2020
37,311
22%
2,784
2015
36,464
23%
2,920
UNIT
PJ
%
thousands
Biomass heat
Heat supplied
Share of total supply
Employment in the energy sectorDirect jobs in jobs in fuel supply
image WORKERS BUILD A WIND TURBINE IN AFACTORY IN PATHUM THANI, THAILAND. THEIMPACTS OF SEA-LEVEL RISE DUE TO CLIMATECHANGE ARE PREDICTED TO HIT HARD ON COASTALCOUNTRIES IN ASIA, AND CLEAN RENEWABLEENERGY IS A SOLUTION.
© GP/VINAI DITHAJOHN

198
the silent revolution – past and current market developments
POWER PLANT MARKETS GLOBAL MARKET SHARES IN THE POWER PLANT MARKET
77technology SOLAR PARKS PS10 AND PS20, SEVILLE, SPAIN. THESE ARE PART OF A LARGER PROJECT INTENDED TO MEET THE ENERGY NEEDS OF SOME 180,000 HOMES —ROUGHLY THE ENERGY NEEDS OF SEVILLE BY 2013, WITHOUT GREENHOUSE GAS EMISSIONS.
the brightfuture for
renewable energy is already underway.”“
© NASA/JESSE ALLEN

7
the silen
t revolu
tion
|POWER PLANT MARKETS
199
© TODD WARSHAW/GP
image THE SAN GORGONIO PASS WIND FARM ISLOCATED IN THE COACHELLA VALLEY NEAR PALMSPRINGS, ON THE EASTERN SLOPE OF THE PASS INRIVERSIDE COUNTY, JUST EAST OF WHITE WATER.DEVELOPMENT BEGUN IN THE 1980S, THE SANGORGONIO PASS IS ONE OF THE WINDIEST PLACES INSOUTHERN CALIFORNIA. THE PROJECT HAS MORETHAN 4,000 INDIVIDUAL TURBINES AND POWERS PALMSPRINGS AND THE REST OF THE DESERT VALLEY.
A new analysis of the global power plant market shows that sincethe late 1990s, wind and solar installations grew faster than anyother power plant technology across the world - about 430,000MW total installed capacities between 2000 and 2010. However,it is too early to claim the end of the fossil fuel based powergeneration, because more than 475,000 MW of new coal powerplants were built with embedded cumulative emissions of over 55billion tonnes CO2 over their technical lifetime.
The global market volume of renewable energies in 2010 was onaverage, equal the total global energy market volume each yearbetween 1970 and 2000. There is a window of opportunity for newrenewable energy installations to replace old plants in OECDcountries and for electrification in developing countries. However,the window will close within the next years without good renewableenergy policies and legally binding CO2 reduction targets.
Between 1970 and 1990, the OECD72 global power plant marketwas dominated by countries that electrified their economies mainlywith coal, gas and hydro power plants. The power sector was in thehands of state-owned utilities with regional or nationwide supplymonopolies. The nuclear industry had a relatively short period ofsteady growth between 1970 and the mid 1980s - with a peak in
1985, one year before the Chernobyl accident - and went intodecline in following years, with no recent signs of growth.
Between 1990 and 2000, the global power plant industry wentthrough a series of changes. While OECD countries began toliberalise their electricity markets, electricity demand did notmatch previous growth, so fewer new power plants were built.Capital-intensive projects with long payback times, such as coaland nuclear power plants, were unable to get sufficient financialsupport. The decade of gas power plants started.
The economies of developing countries, especially in Asia, startedgrowing during the 1990s, triggering a new wave of power plantprojects. Similarly to the US and Europe, most of the newmarkets in the ‘tiger states’ of Southeast Asia partly deregulatedtheir power sectors. A large number of new power plants in thisregion were built from Independent Power Producer (IPPs), whosell the electricity mainly to state-owned utilities. The majority ofnew power plant technology in liberalised power markets isfuelled by gas, except for in China which focused on building newcoal power plants. Excluding China, the rest of the global powerplant market has seen a phase-out of coal since the late 1990swith growing gas and renewable generation, particularly wind.
reference72 ORGANISATION FOR ECONOMIC CO-OPERATION AND DEVELOPMENT.
figure 7.1: global power plant market 1970-2010
•NUCLEAR
• COAL
• GAS (INCL. OIL)
• BIOMASS
• GEOTHERMAL
• HYDRO
•WIND
• CSP
• PV
1970
1972
1974
1976
1978
1980
1982
1984
1986
1988
1990
1992
1994
1996
1998
2000
2002
2004
2006
2008
2010
200,000
180,000
160,000
140,000
120,000
100,000
80,000
60,000
40,000
20,000
MW/a 0
sourcePlatts, IEA, Breyer, Teske.

WORLD ENERGY [R]EVOLUTIONA SUSTAINABLE WORLD ENERGY OUTLOOK
7
the silen
t revolu
tion
|POWER PLANT MARKETS IN
THE US, EUROPE AND CHINA
200
7.1 power plant markets in the us, europe and china
The graphs show how much electricity market liberalisationinfluences the choice of power plant technology. While the US andEuropean power sectors moved towards deregulated markets,which favour mainly gas power plants, China added a largeamount of coal until 2009, with the first signs for a change infavour of renewable energy in 2009 and 2010.
USA:Liberalisation of the US power sector started with the EnergyPolicy Act 1992, and became a game changer for the whole sector.While the US in 2010 is still far away from a fully liberalisedelectricity market, the effect has been a shift from coal and nucleartowards gas and wind. Since 2005 wind power plants have madeup an increasing share of the new installed capacities as a result ofmainly state-based renewable eneggy support programmes. Overthe past year, solar photovoltaic plays a growing role with a projectpipeline of 22,000 MW (Photon 4-2011, page 12).
figure 7.2: global power plant market 1970-2010, excluding china
•NUCLEAR
• COAL
• GAS (INCL. OIL)
• BIOMASS
• GEOTHERMAL
• HYDRO
•WIND
• CSP
• PV
1970
1972
1974
1976
1978
1980
1982
1984
1986
1988
1990
1992
1994
1996
1998
2000
2002
2004
2006
2008
2010
140,000
120,000
100,000
80,000
60,000
40,000
20,000
MW/a 0
sourcePlatts, IEA, Breyer, Teske.
figure 7.3: usa: power plant market 1970-2010
•NUCLEAR
• COAL
• GAS (INCL. OIL)
• BIOMASS
• GEOTHERMAL
• HYDRO
•WIND
• CSP
• PV
1970
1972
1974
1976
1978
1980
1982
1984
1986
1988
1990
1992
1994
1996
1998
2000
2002
2004
2006
2008
2010
70,000
60,000
50,000
40,000
30,000
20,000
10,000
MW/a 0
sourcePlatts, IEA, Breyer, Teske.
Policy act 1992 -deregulation of the US electricity market

201
© STEVE MORGAN/GP
image NESJAVELLIR GEOTHERMAL PLANT GENERATES ELECTRICITY AND HOT WATER BYUTILIZING GEOTHERMAL WATER AND STEAM. IT IS THE SECOND LARGEST GEOTHERMAL POWERSTATION IN ICELAND. THE STATION PRODUCES APPROXIMATELY 120MW OF ELECTRICAL POWER,AND DELIVERS AROUND 1,800 LITRES (480 US GAL) OF HOT WATER PER SECOND, SERVICING THEHOT WATER NEEDS OF THE GREATER REYKJAVIK AREA. THE FACILITY IS LOCATED 177 M (581 FT)ABOVE SEA LEVEL IN THE SOUTHWESTERN PART OF THE COUNTRY, NEAR THE HENGILL VOLCANO.
Europe: About five years after the US began deregulating thepower sector, the European Community started a similar processwith similar effect on the power plant market. Investors backedfewer new power plants and extended the lifetime of the existingones. New coal and nuclear power plants have seen a market shareof well below 10% since then. The growing share of renewables,
7
the silen
t revolu
tion
|POWER PLANT MARKETS IN
THE US, EUROPE AND CHINA
figure 7.4: europe (eu 27): power plant market 1970-2010
•NUCLEAR
• COAL
• GAS (INCL. OIL)
• BIOMASS
• GEOTHERMAL
• HYDRO
•WIND
• CSP
• PV
1970
1972
1974
1976
1978
1980
1982
1984
1986
1988
1990
1992
1994
1996
1998
2000
2002
2004
2006
2008
2010
60,000
50,000
40,000
30,000
20,000
10,000
MW/a 0
figure 7.5: china: power plant market 1970-2010
•NUCLEAR
• COAL
• GAS (INCL. OIL)
• BIOMASS
• GEOTHERMAL
• HYDRO
•WIND
• CSP
• PV
1970
1972
1974
1976
1978
1980
1982
1984
1986
1988
1990
1992
1994
1996
1998
2000
2002
2004
2006
2008
2010
120,000
100,000
80,000
60,000
40,000
20,000
MW/a 0
sourcePlatts, IEA, Breyer, Teske.
1997 - deregulationof the EU electricitymarket began
especially wind and solar photovoltaic, are due to a legally-bindingtarget and the associated feed-in laws which have been in force inseveral member states of the EU 27 since the late 1990s. Overall,new installed power plant capacity jumped to a record high be theaged power plant fleet in Europe needed re-powering.
WORLD ENERGY [R]EVOLUTIONA SUSTAINABLE WORLD ENERGY OUTLOOK
202
China:The steady economic growth in China since the late 1990s,and the growing power demand, led to an explosion of the coalpower plant market, especially after 2002. In 2006 the markethit the peak year for new coal power plants: 88% of the newlyinstalled coal power plants worldwide were built in China. At thesame time, China is trying to take its dirtiest plants offline,between 2006 and 2010, a total of 76,825MW of small coalpower plants were phased out under the “11th Five Year”programme. While coal still dominates the new added capacity,wind power is rapidly growing as well. Since 2003 the windmarket doubled each year and was over 18,000 MW73 by 2010,49% of the global wind market. However, coal still dominates thepower plant market with over 55 GW of new installed capacitiesin 2010 alone. The Chinese government aims to increaseinvestments into renewable energy capacity, and during 2009,about $ 25.1 billion (RMB162.7 billion) went to wind and hydropower plants which represents 44% of the overall investment innew power plants, for the first time larger than that of coal(RMB 149.2billion), and in 2010 the figure was US$26 billion(RMB168 billion) – 4.8% more in the total investment mixcompared with the previous year 2009.
7.2 the global market shares in the power plantmarket: renewables gaining ground
Since the year 2000, the wind power market gained a growingmarket share within the global power plant market. Initially onlya handful of countries, namely Germany, Denmark and Spain,dominated the wind market, but the wind industry now hasprojects in over 70 countries around the world. Following theexample of the wind industry, the solar photovoltaic industryexperienced an equal growth since 2005. Between 2000 and2010, 26% of all new power plants worldwide were renewable-powered – mainly wind – and 42% run on gas. So, two-thirds ofall new power plants installed globally are gas power plants andrenewable, with close to one-third as coal. Nuclear remainsirrelevant on a global scale with just 2% of the global marketshare. About 430,000 MW of new renewable energy capacityhas been installed over the last decade, while 475,000 MW ofnew coal, with embedded cumulative emissions of more than 55bn tonnes CO2 over their technical lifetime, came online – 78% or375,000 MW in China.
The energy revolution towards renewables and gas, away fromcoal and nuclear, has already started on a global level. This pictureis even clearer when we look into the global market sharesexcluding China, the only country with a massive expansion ofcoal. About 28% of all new power plants have been renewablesand 60% have been gas power plants (88% in total). Coal gaineda market share of only 10% globally, excluding China. Between2000 and 2010, China has added over 350,000 MW of new coalcapacity: twice as much as the entire coal capacity of the EU.However China has recently kick-started its wind market, andsolar photovoltaics is expected to follow in the years to come.
reference73 WHILE THE OFFICIAL STATISTIC OF THE GLOBAL AND CHINESE WIND INDUSTRY ASSOCIATIONS
(GWEC/CREIA) ADDS UP TO 18,900 MW FOR 2010, THE NATIONAL ENERGY BUREAU SPEAKS ABOUT 13,999
MW. DIFFERENCES BETWEEN SOURCES AS DUE TO THE TIME OF GRID CONNECTION, AS SOME TURBINES
HAVE BEEN INSTALLED IN THE LAST MONTHS OF 2010, BUT HAVE BEEN CONNECTED TO THE GRID IN 2011.
7
the silen
t revolu
tion
|THE GLOBAL MARKET SHARES IN
THE POWER PLANT MARKET

203
© MICHAEL LOEWA/GP
image WITNESSES FROM FUKUSHIMA, JAPAN,KANAKO NISHIKATA, HER TWO CHILDREN KAITOAND FUU AND TATSUKO OGAWARA VISIT A WINDFARM IN KLENNOW IN WENDLAND.
7
the silen
t revolu
tion
|THE GLOBAL MARKET SHARES IN
THE POWER PLANT MARKET
global power plant market shares 2000-2010
2% NUCLEAR POWER PLANTS
30% COAL POWER PLANTS
42% GAS POWER PLANTS
(INCL. OIL)
26% RENEWABLES
global power plant market shares 2000-2010 - excluding china
2% NUCLEAR POWER PLANTS
10% COAL POWER PLANTS
60% GAS POWER PLANTS
(INCL. OIL)
28% RENEWABLES
china: power plant market shares 2000-2010
2% NUCLEAR POWER PLANTS
69% COAL POWER PLANTS
5% GAS POWER PLANTS (INCL. OIL)
24% RENEWABLES
usa: power plant market shares 2000-2010
4% COAL POWER PLANTS
81% GAS POWER PLANTS
(INCL. OIL)
15% RENEWABLES
EU27: power plant market shares 2000-2010 - excluding china
3% NUCLEAR POWER PLANTS
6% COAL POWER PLANTS
46% GAS POWER PLANTS
(INCL. OIL)
45% RENEWABLES
source PLATTS, IEA, BREYER, TESKE, GWAC, EPIA.
figure 7.6: power plant market shares

WORLD ENERGY [R]EVOLUTIONA SUSTAINABLE WORLD ENERGY OUTLOOK
204
7
the silen
t revolu
tion
|THE GLOBAL MARKET SHARES IN
THE POWER PLANT MARKET
GLOBAL ANNUAL GAS POWER PLANT MARKET (INCL. OIL) 1970-2010
MW/a
1970
1972
1974
1976
1978
1980
1982
1984
1986
1988
1990
1992
1994
1996
1998
2000
2002
2004
2006
2008
2010
100,000
90,000
80,000
70,000
60,000
50,000
40,000
30,000
20,000
10,000
0
GLOBAL ANNUAL COAL POWER PLANT MARKET 1970-2010
MW/a
1970
1972
1974
1976
1978
1980
1982
1984
1986
1988
1990
1992
1994
1996
1998
2000
2002
2004
2006
2008
2010
90,000
80,000
70,000
60,000
50,000
40,000
30,000
20,000
10,000
0
•COAL POWER PLANTS IN CHINA
•COAL POWER PLANTS - ALL OTHER COUNTRIES
figure 7.7: historic developments of the global power plant market, by technology
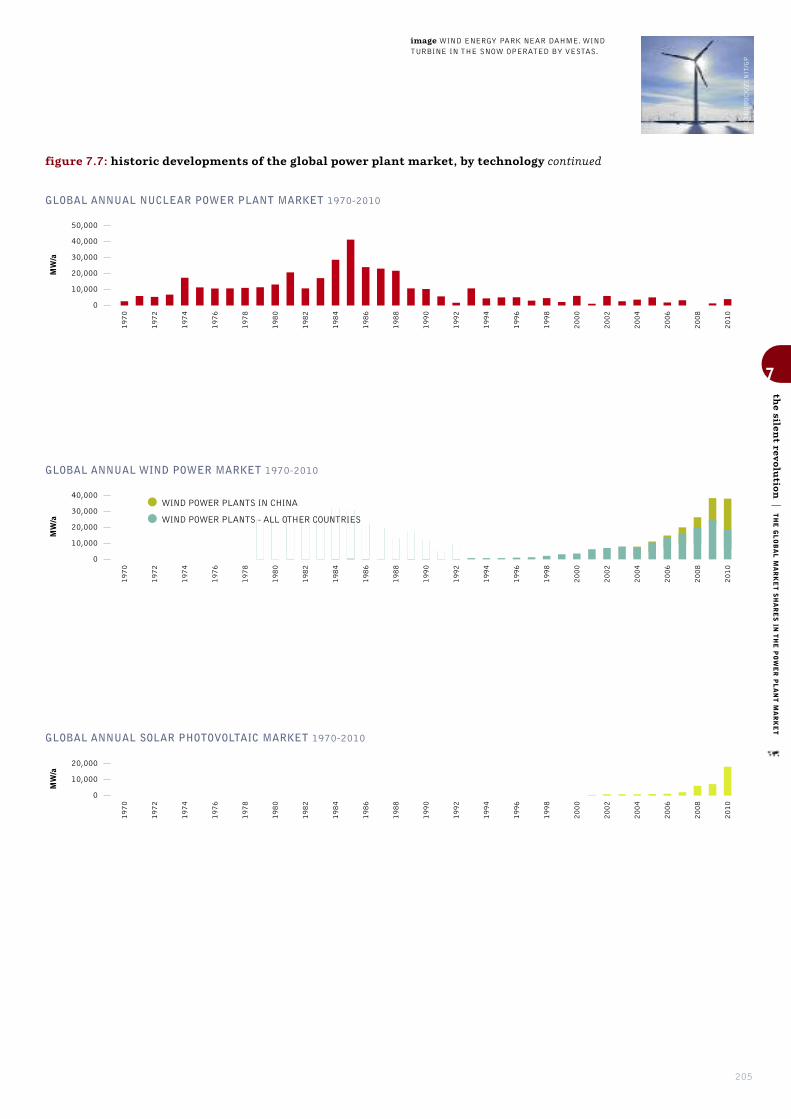
205
GLOBAL ANNUAL WIND POWER MARKET 1970-2010
MW/a
1970
1972
1974
1976
1978
1980
1982
1984
1986
1988
1990
1992
1994
1996
1998
2000
2002
2004
2006
2008
2010
40,000
30,000
20,000
10,000
0
GLOBAL ANNUAL NUCLEAR POWER PLANT MARKET 1970-2010
MW/a
1970
1972
1974
1976
1978
1980
1982
1984
1986
1988
1990
1992
1994
1996
1998
2000
2002
2004
2006
2008
2010
50,000
40,000
30,000
20,000
10,000
0
GLOBAL ANNUAL SOLAR PHOTOVOLTAIC MARKET 1970-2010
MW/a
1970
1972
1974
1976
1978
1980
1982
1984
1986
1988
1990
1992
1994
1996
1998
2000
2002
2004
2006
2008
2010
20,000
10,000
0
•WIND POWER PLANTS IN CHINA
•WIND POWER PLANTS - ALL OTHER COUNTRIES
figure 7.7: historic developments of the global power plant market, by technology continued
© LANGROCK/ZENIT/GP
image WIND ENERGY PARK NEAR DAHME. WINDTURBINE IN THE SNOW OPERATED BY VESTAS.
7
the silen
t revolu
tion
|THE GLOBAL MARKET SHARES IN
THE POWER PLANT MARKET

WORLD ENERGY [R]EVOLUTIONA SUSTAINABLE WORLD ENERGY OUTLOOK
206
7
the silen
t revolu
tion
|THE GLOBAL RENEWABLE ENERGY MARKET
7.3 the global renewable energy market
The renewable energy sector has been growing substantially overthe last 10 years. In 2011, the increases in the installation ratesof both wind and solar power were particularly impressive. Thetotal amount of renewable energy installed worldwide is reliablytracked by the Renewable Energy Policy Network for the 21stCentury (REN21). Its latest global status report (2012) showshow the technologies have grown. The following text has beentaken from the Renewables 2012 – Global Status Report–published in June 2012 with the permit of REN 21 and is ashortened version of the executive summary:
Renewable Energy Growth in All End-Use Sectors
Renewable energy sources have grown to supply an estimated16.7% of global final energy consumption in 2010. Of this total,modern renewable energy accounted for an estimated 8.2%, ashare that has increased in recent years, while the share fromtraditional biomass has declined slightly to an estimated 8.5%.During 2011, modern renewables continued to grow strongly inall end-use sectors: power, heating and cooling, and transport.
In the power sector, renewables accounted for almost half of theestimated 208 gigawatts (GW) of electric capacity addedglobally during 2011. Wind and solar photovoltaics (PV)accounted for almost 40% and 30% of new renewable capacity,respectively, followed by hydropower (nearly 25%). By the end of2011, total renewable power capacity worldwide exceeded 1,360GW, up 8% over 2010; renewables comprised more than 25% oftotal global power-generating capacity (estimated at 5,360 GWin 2011) and supplied an estimated 20.3% of global electricity.Non-hydropower renewables exceeded 390 GW, a 24% capacityincrease over 2010.
The heating and cooling sector offers an immense yet mostlyuntapped potential for renewable energy deployment. Heat frombiomass, solar, and geothermal sources already represents asignificant portion of the energy derived from renewables, and thesector is slowly evolving as countries (particularly in theEuropean Union) are starting to enact supporting policies and totrack the share of heat derived from renewable sources. Trends inthe heating (and cooling) sector include an increase in systemsize, expanding use of combined heat and power (CHP), thefeeding of renewable heating and cooling into district networks,and the use of renewable heat for industrial purposes.
Renewable energy is used in the transport sector in the form ofgaseous and liquid biofuels; liquid biofuels provided about 3% ofglobal road transport fuels in 2011, more than any otherrenewable energy source in the transport sector. Electricity powerstrains, subways, and a small but growing number of passengercars and motorised cycles, and there are limited but increasinginitiatives to link electric transport with renewable energy.
Solar PV grew the fastest of all renewable technologies duringthe period from end-2006 through 2011, with operating capacityincreasing by an average of 58% annually, followed byconcentrating solar thermal power (CSP), which increasedalmost 37% annually over this period from a small base, andwind power (26%). Demand is also growing rapidly for solarthermal heat systems, geothermal ground-source heat pumps, andsome solid biomass fuels, such as wood pellets. The developmentof liquid biofuels has been mixed in recent years, with biodieselproduction expanding in 2011 and ethanol production stable ordown slightly compared with 2010. Hydropower and geothermalpower are growing globally at rates averaging 2–3% per year. Inseveral countries, however, the growth in these and otherrenewable technologies far exceeds the global average.
A Dynamic Policy Landscape
At least 118 countries, more than half of which are developingcountries, had renewable energy targets in place by early 2012, upfrom 109 as of early 2010. Renewable energy targets and supportpolicies continued to be a driving force behind increasing marketsfor renewable energy, despite some setbacks resulting from a lackof long-term policy certainty and stability in many countries.
The number of official renewable energy targets and policies inplace to support investments in renewable energy continued toincrease in 2011 and early 2012, but at a slower adoption raterelative to previous years. Several countries undertook significantpolicy overhauls that have resulted in reduced support; somechanges were intended to improve existing instruments and achievemore targeted results as renewable energy technologies mature,while others were part of the trend towards austerity measures.
Renewable power generation policies remain the most commontype of support policy; at least 109 countries had some type ofrenewable power policy by early 2012, up from the 96 countriesreported in the GSR 2011. Feed-in-tariffs (FITs) and renewableportfolio standards (RPS) are the most commonly used policies inthis sector. FIT policies were in place in at least 65 countries and27 states by early 2012. While a number of new FITs wereenacted, most related policy activities involved revisions to existinglaws, at times under controversy and involving legal disputes.Quotas or Renewable Portfolio Standards (RPS) were in use in18 countries and at least 53 other jurisdictions, with two newcountries having enacted such policies in 2011 and early 2012.
Policies to promote renewable heating and cooling continue to beenacted less aggressively than those in other sectors, but their usehas expanded in recent years. By early 2012, at least 19countries had specific renewable heating/cooling targets in placeand at least 17 countries and states had obligations/mandates topromote renewable heat. Numerous local governments alsosupport renewable heating systems through building codes andother measures. The focus of this sector is still primarily inEurope, but interest is expanding to other regions.
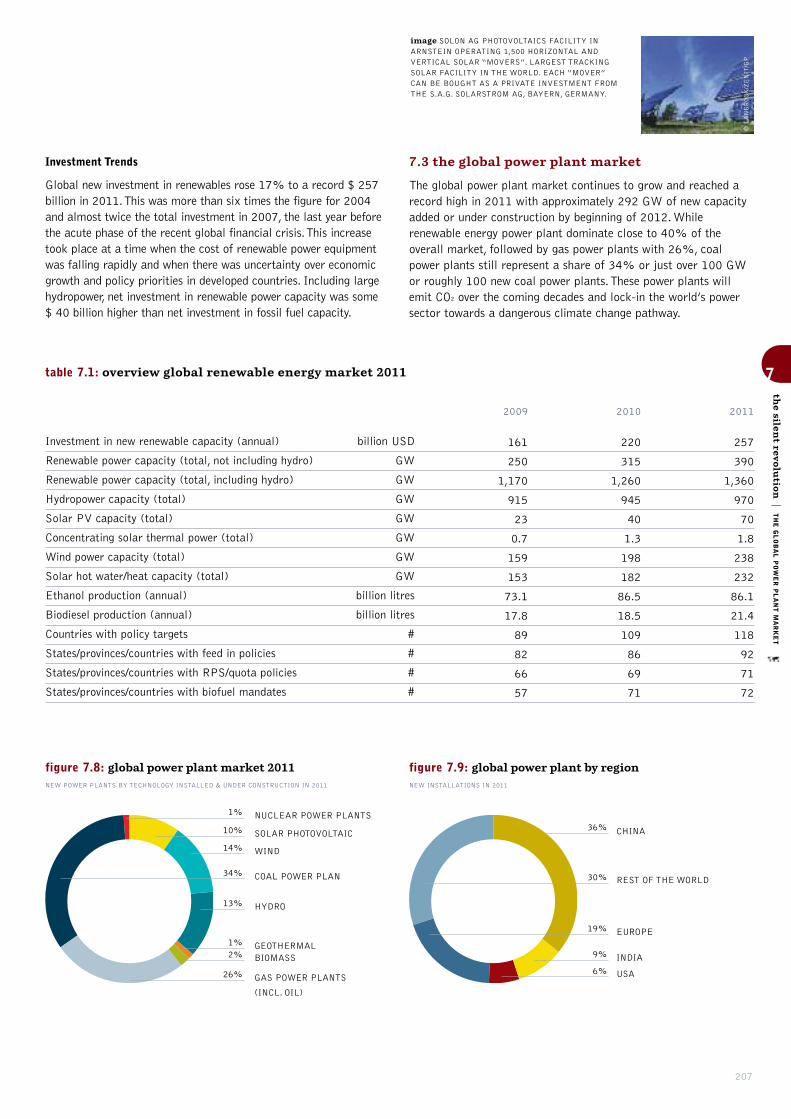
207
table 7.1: overview global renewable energy market 2011
Investment in new renewable capacity (annual)
Renewable power capacity (total, not including hydro)
Renewable power capacity (total, including hydro)
Hydropower capacity (total)
Solar PV capacity (total)
Concentrating solar thermal power (total)
Wind power capacity (total)
Solar hot water/heat capacity (total)
Ethanol production (annual)
Biodiesel production (annual)
Countries with policy targets
States/provinces/countries with feed in policies
States/provinces/countries with RPS/quota policies
States/provinces/countries with biofuel mandates
2011
257
390
1,360
970
70
1.8
238
232
86.1
21.4
118
92
71
72
2010
220
315
1,260
945
40
1.3
198
182
86.5
18.5
109
86
69
71
2009
161
250
1,170
915
23
0.7
159
153
73.1
17.8
89
82
66
57
billion USD
GW
GW
GW
GW
GW
GW
GW
billion litres
billion litres
#
#
#
#
Investment Trends
Global new investment in renewables rose 17% to a record $ 257billion in 2011. This was more than six times the figure for 2004and almost twice the total investment in 2007, the last year beforethe acute phase of the recent global financial crisis. This increasetook place at a time when the cost of renewable power equipmentwas falling rapidly and when there was uncertainty over economicgrowth and policy priorities in developed countries. Including largehydropower, net investment in renewable power capacity was some $ 40 billion higher than net investment in fossil fuel capacity.
7.3 the global power plant market
The global power plant market continues to grow and reached arecord high in 2011 with approximately 292 GW of new capacityadded or under construction by beginning of 2012. Whilerenewable energy power plant dominate close to 40% of theoverall market, followed by gas power plants with 26%, coalpower plants still represent a share of 34% or just over 100 GWor roughly 100 new coal power plants. These power plants willemit CO2 over the coming decades and lock-in the world’s powersector towards a dangerous climate change pathway.
7
the silen
t revolu
tion
|THE GLOBAL POWER PLANT MARKET
© LANGROCK/ZENIT/GP
image SOLON AG PHOTOVOLTAICS FACILITY INARNSTEIN OPERATING 1,500 HORIZONTAL ANDVERTICAL SOLAR “MOVERS”. LARGEST TRACKINGSOLAR FACILITY IN THE WORLD. EACH “MOVER”CAN BE BOUGHT AS A PRIVATE INVESTMENT FROMTHE S.A.G. SOLARSTROM AG, BAYERN, GERMANY.
figure 7.8: global power plant market 2011 NEW POWER PLANTS BY TECHNOLOGY INSTALLED & UNDER CONSTRUCTION IN 2011
figure 7.9: global power plant by regionNEW INSTALLATIONS IN 2011
1% NUCLEAR POWER PLANTS
13% HYDRO
14% WIND
10% SOLAR PHOTOVOLTAIC
34% COAL POWER PLAN
26% GAS POWER PLANTS
(INCL. OIL)
2% BIOMASS
1% GEOTHERMAL9% INDIA
19% EUROPE
6% USA
30% REST OF THE WORLD
36% CHINA

208
energy resources and security of supply
GLOBAL OIL
GAS
COAL
NUCLEAR
RENEWABLE ENERGY
88image THE HOTTEST SPOT ON EARTH IN THE LUT DESERT. THE SINGLE HIGHEST LST RECORDED IN ANY YEAR, IN ANY REGION, OCCURRED THERE IN 2005, WHEN MODISRECORDED A TEMPERATURE OF 70.7°C (159.3°F)—MORE THAN 12°C (22°F) WARMER THAN THE OFFICIAL AIR TEMPERATURE RECORD FROM LIBYA.
the issue ofsecurity of
supply is now at thetop of the energypolicy agenda.”“
© NASA/JESSE ALLEN, ROBERT SIM
MON

209
The issue of security of supply is at the top of the energy policyagenda. Concern is focused both on price security and thesecurity of physical supply for countries with none if their ownresources. At present around 80% of global energy demand ismet by fossil fuels. The world is currently experiencing anunrelenting increase in energy demand in the face of the finitenature of these resources. At the same time, the globaldistribution of oil and gas resources does not match thedistribution of demand. Some countries have to rely almostentirely on fossil fuel imports.
Table 8.1 shows estimated deposits and current use of fossil energysources. There is no shortage of fossil fuels; there might a shortageof conventional oil and gas. Reducing global fossil fuel consumptionfor reasons of resource scarcity alone is not mandatory, eventhough there may be substantial price fluctuations and regional orstructural shortages as we have seen in the past.
The presently known coal resources and reserves alone probablyamount to around 3,000 times the amount currently mined in ayear. Thus, in terms of resource potential, current-level demand couldbe met for many hundreds of years to come. Coal is also relativelyevenly spread across the globe; each continent holds considerabledeposits. However, the supply horizon is clearly much lower forconventional mineral oil and gas reserves at 40–50 years. If someresources or deposits currently still classified as ‘unconventional’ areincluded, the resource potentials exceed the current consumptionrate by far more than one hundred years. However, seriousecological damage is frequently associated with fossil energy mining,particularly of unconventional deposits in oil sands and oil shale.
Over the past few years, new commercial processes have beendeveloped in the natural gas extraction sector, allowing moreaffordable access to gas deposits previously considered‘unconventional’, many of which are more frequently found andevenly distributed globally than traditional gas fields. However,tight gas and shale gas extraction can potentially be accompaniedby seismic activities and the pollution of groundwater basins andinshore waters. It therefore needs special regulations. It isexpected that an effective gas market will develop using theexisting global distribution network for liquid gas via tankers andloading terminals. With greater competitiveness regards pricefixing, it is expected that the oil and gas prices will no longer belinked. Having more liquid gas in the energy mix (currentlyaround 10 % of overall gas consumption) significantly increasessupply security, e.g. reducing the risks of supply interruptionsassociated with international pipeline networks.
Gas hydrates are another type of gas deposit found in the form ofmethane aggregates both in the deep sea and underground inpermafrost. They are solid under high pressure and low temperatures.While there is the possibility of continued greenhouse gas emissionsfrom such deposits as a consequence of arctic permafrost soil thawor a thawing of the relatively flat Siberian continental shelf, there isalso potential for extraction of this energy source. Many states,including the USA, Japan, India, China and South Korea havelaunched relevant research programmes. Estimates of global depositsvary greatly; however, all are in the zettajoule range, for example70,000–700,000 EJ (Krey et al., 2009). The Global EnergyAssessment report estimates the theoretical potential to be2,650–2,450,000 EJ (GEA, 2011), i.e. possibly more than athousand times greater than the current annual total energyconsumption. Approximately a tenth (1,200–245,600 EJ) is rated aspotentially extractable. The WBGU advised against applied researchfor methane hydrate extraction, as mining bears considerable risksand methane hydrates do not represent a sustainable energy source(‘The Future Oceans’, WBGU, 2006).
PRODUCTIONIN 2008 (EJ)
170231181215047326-
HISTORICAL PRODUCTION UP TO 2008 (EJ)
6,500500
3,400160
7,10017,6601,300
-
FURTHER DEPOSITS (EJ)
-47,000
-490,000
-537,000
-2,600,000
RESOURCES(EJ)
4,96734,0008,04156,500440,000543,5077,4004,100
RESERVES(EJ)
6,3503,8006,00042,50021,00079,6502,400
-
table 8.1: global occurances of fossil and nuclear sources
THERE ARE HIGH UNCERTAINTIES ASSOCIATED WITH THE ASSESSMENT OF RESERVES AND RESOURCES.
FUEL
Conventional oilUnconventional oilConventional gasUnconventional gasCoalTotal fossil sourcesConventional uraniumUnconventional uranium
sourceThe representative figures shown here are WBGU estimates on the basis of the GEA, 2011.
8
energ
y resources a
nd secu
rity of su
pply
|FOSSIL FUELS
© PAUL LANGROCK/ZENIT/GPimage TEST WINDMILL N90 2500, BUILT BY THE
GERMAN COMPANY NORDEX, IN THE HARBOUR OFROSTOCK. THIS WINDMILL PRODUCES 2.5 MEGA WATTAND IS TESTED UNDER OFFSHORE CONDITIONS. TWOTECHNICIANS WORKING INSIDE THE TURBINE.

WORLD ENERGY [R]EVOLUTIONA SUSTAINABLE WORLD ENERGY OUTLOOK
210
8
energ
y resources a
nd secu
rity of su
pply
|FOSSIL FUELS
PRODUCTIONIN 2008(GT CO2)
132711436
HISTORICALPRODUCTION UP TO 2008
(GT CO2)
505391929
6661,411
FURTHER DEPOSITS(GT CO2)
-3,649
-27,724
-31,373
RESOURCES(GT CO2)
3862,640455
3,19741,27747,954
RESERVES(GT CO2)
493295339
2,4051,9705,502
table 8.2: overview of the resulting emissions if all fossil resources were burned
POTENTIAL EMISSIONS AS A CONSEQUENCE OF THE USE OF FOSSIL RESERVES AND RESOURCES. ALSO ILLUSTRATED IS THEIR POTENTIAL FOR
ENDANGERING THE 2ºC GUARD RAIL. THIS RISK IS EXPRESSED AS THE FACTOR BY WHICH, ASSUMING COMPLETE EXHAUSTION OF THE RESPECTIVE
RESERVES AND RESOURCES, THE RESULTANT CO2 EMISSIONS WOULD EXCEED THE 750 GT C02 BUDGET PERMISSIBLE FROM FOSSIL SOURCES UNTIL 2050.
FOSSIL FUEL
Conventional oilUnconventional oilConventional gasUnconventional gasCoalTotal fossil fuels
sourceGEA, 2011.
TOTALRESERVES,RESOURCES
AND FURTHEROCCURENCES
(GT CO2)
8796,584794
33,32543,24784,829
FACTOR BYWHICH THESEEMISSIONS
ALONE EXCEED THE
2ºC EMISSIONSBUDGET
1914458113
8.1 oil
Oil is the lifeblood of the modern global economy, as the effectsof the supply disruptions of the 1970s made clear. It is thenumber one source of energy, providing about one third of theworld’s needs and the fuel employed almost exclusively foressential uses such as transportation. However, a passionatedebate has developed over the ability of supply to meet increasingconsumption, a debate obscured by poor information and stirredby recent soaring prices.
8.1.1 the reserves chaos
Public information about oil and gas reserves is strikinglyinconsistent, and potentially unreliable for legal, commercial,historical and sometimes political reasons. The most widelyavailable and quoted figures, those from the industry journals Oiland Gas Journal and World Oil, have limited value as they reportthe reserve figures provided by companies and governments
without analysis or verification. Moreover, as there is no agreeddefinition of reserves or standard reporting practice, these figuresusually represent different physical and conceptual magnitudes.Confusing terminology - ‘proved’, ‘probable’, ‘possible’,‘recoverable’, ‘reasonable certainty’ - only adds to the problem.
Historically, private oil companies have consistentlyunderestimated their reserves to comply with conservative stockexchange rules and through natural commercial caution.Whenever a discovery was made, only a portion of the geologist’sestimate of recoverable resources was reported; subsequentrevisions would then increase the reserves from that same oilfield over time. National oil companies, mostly represented byOPEC (Organisation of Petroleum Exporting Countries), havetaken a very different approach. They are not subject to any sortof accountability and their reporting practices are even less clear.In the late 1980s, the OPEC countries blatantly overstated theirreserves while competing for production quotas, which wereallocated as a proportion of the reserves. Although some revisionwas needed after the companies were nationalised, between 1985and 1990, OPEC countries increased their apparent joint reservesby 82%. Not only were these dubious revisions never corrected,but many of these countries have reported untouched reserves foryears, even if no sizeable discoveries were made and productioncontinued at the same pace. Additionally, the Former SovietUnion’s oil and gas reserves have been overestimated by about30% because the original assessments were later misinterpreted.
Whilst private companies are now becoming more realistic aboutthe extent of their resources, the OPEC countries hold by far themajority of the reported reserves, and their information is asunsatisfactory as ever. Their conclusions should therefore betreated with considerable caution. To fairly estimate the world’soil resources would require a regional assessment of the meanbackdated (i.e. ‘technical’) discoveries.
box 8.1: the energy [r]evolution fossil fuel pathway
The Energy [R]evolution scenario will phase-out fossil fuel notsimply as they are depleted, but to achieve a greenhouse gasreduction pathway required to avoid dangerous climate change.Decisions new need to avoid a “lock-in” situation meaning thatinvestments in new oil production will make it more difficult tochange to a renewable energy pathway in the future. Scenariodevelopment shows that the Energy [R]evolution can be madewithout any new oil exploration and production investments inthe arctic or deep sea wells. Unconventional oil such asCanada’s tars and or Australia’s shale oil is not needed toguarantee the supply oil until it is phased out under the Energy[R]evolution scenario (see chapter 3).

211
8.1.2 non-conventional oil reserves
A large share of the world’s remaining oil resources is classified as‘non-conventional’. Potential fuel sources such as oil sands, extraheavy oil and oil shale are generally more costly to exploit andtheir recovery involves enormous environmental damage. Thereserves of oil sands and extra heavy oil in existence worldwide areestimated to amount to around 6 trillion barrels, of which between1 and 2 trillion barrels are believed to be recoverable if the oilprice is high enough and the environmental standards low enough.
One of the worst examples of environmental degradation resultingfrom the exploitation of unconventional oil reserves is the oilsands that lie beneath the Canadian province of Alberta and formthe world’s second-largest proven oil reserves after Saudi Arabia.
The ‘tar sands’ are a heavy mixture of bitumen, water, sand andclay found beneath more than 54,000 square miles74 of primeforest in northern Alberta, an area the size of England andWales. Producing crude oil from this resource generates up tofour times more carbon dioxide, the principal global warming gas,than conventional drilling. The booming oil sands industry willproduce 100 million tonnes of CO2 a year (equivalent to a fifth ofthe UK’s entire annual emissions) by 2012, ensuring that Canadawill miss its emission targets under the Kyoto treaty. The oil rushis also scarring a wilderness landscape: millions of tonnes of plantlife and top soil are scooped away in vast opencast mines andmillions of litres of water diverted from rivers. Up to five barrelsof water are needed to produce a single barrel of crude and theprocess requires huge amounts of natural gas. It takes two tonnesof the raw sands to produce a single barrel of oil.
8.2 gas
Natural gas has been the fastest growing fossil energy sourceover the last two decades, boosted by its increasing share in theelectricity generation mix. Gas is generally regarded as anabundant resource and there is lower public concern aboutdepletion than for oil, even though few in-depth studies addressthe subject. Gas resources are more concentrated and a fewmassive fields make up most of the reserves. The largest gas fieldin the world holds 15% of the Ultimate Recoverable Resources(URR), compared to 6% for oil. Unfortunately, information aboutgas resources suffers from the same bad practices as oil databecause gas mostly comes from the same geological formations,and the same stakeholders are involved.
Most reserves are initially understated and then gradually revisedupwards, giving an optimistic impression of growth. By contrast,Russia’s reserves, the largest in the world, are considered to havebeen overestimated by about 30%. Owing to geologicalsimilarities, gas follows the same depletion dynamic as oil, andthus the same discovery and production cycles. In fact, existingdata for gas is of worse quality than for oil, with ambiguitiesarising over the amount produced, partly because flared andvented gas is not always accounted for. As opposed to publishedreserves, the technical ones have been almost constant since1980 because discoveries have roughly matched production.
8.2.1 shale gas75
Natural gas production, especially in the United States, hasrecently involved a growing contribution from non-conventionalgas supplies such as shale gas. Conventional natural gas depositshave a well-defined geographical area, the reservoirs are porousand permeable, the gas is produced easily through a wellbore anddoes not generally require artificial stimulation.
Natural gas obtained from unconventional reserves (known as“shale gas” or “tight gas”) requires the reservoir rock to befractured using a process known as hydraulic fracturing or“fracking”. Fracking is associated with a range of environmentalimpacts some of which are not fully documented or understood.In addition, it appears that the greenhouse gas “footprint” ofshale gas production may be significantly greater than forconventional gas and is claimed to be even worse than for coal.
Research and investment in non-conventional gas resources hasincreased significantly in recent years due to the rising price ofconventional natural gas. In some areas the technologies foreconomic production have already been developed, in others it isstill at the research stage. Extracting shale gas, however, usuallygoes hand in hand with environmentally hazardous processes.Even so, it is expected to increase.
Greenpeace is opposed to the exploitation of unconventionalgas reserves and these resources are not needed to guaranteethe needed gas supply under the Energy [R]evolution scenario.
8.3 coal
Coal was the world’s largest source of primary energy until it wasovertaken by oil in the 1960s. Today, coal supplies almost onequarter of the world’s energy. Despite being the most abundant offossil fuels, coal’s development is currently threatened byenvironmental concerns; hence its future will unfold in the contextof both energy security and global warming.
Coal is abundant and more equally distributed throughout theworld than oil and gas. Global recoverable reserves are thelargest of all fossil fuels, and most countries have at least some.Moreover, existing and prospective big energy consumers like theUS, China and India are self-sufficient in coal and will be for theforeseeable future. Coal has been exploited on a large scale fortwo centuries, so both the product and the available resources arewell known; no substantial new deposits are expected to bediscovered. Extrapolating the demand forecast forward, the worldwill consume 20% of its current reserves by 2030 and 40% by2050. Hence, if current trends are maintained, coal would stilllast several hundred years.
8
energ
y resources a
nd secu
rity of su
pply
|FOSSIL FUELS, N
UCLEAR
references74 THE INDEPENDENT, 10 DECEMBER 2007.
75 INTERSTATE NATURAL GAS ASSOCIATION OF AMERICA (INGAA), “AVAILABILITY, ECONOMICS AND PRODUCTION
POTENTIAL OF NORTH AMERICAN UNCONVENTIONAL NATURAL GAS SUPPLIES”, NOVEMBER 2008.
© GP/LANGER
© N. BEHRING-CHISHOLM/GPimage PLATFORM/OIL RIG DUNLIN IN THE NORTH SEA SHOWING OIL POLLUTION.
image ON A LINFEN STREET, TWO MEN LOAD UP A CART WITH COAL THAT WILL BEUSED FOR COOKING. LINFEN, A CITY OF ABOUT 4.3 MILLION, IS ONE OF THE MOSTPOLLUTED CITIES IN THE WORLD. CHINA’S INCREASINGLY POLLUTEDENVIRONMENT IS LARGELY A RESULT OF THE COUNTRY’S RAPID DEVELOPMENTAND CONSEQUENTLY A LARGE INCREASE IN PRIMARY ENERGY CONSUMPTION,WHICH IS ALMOST ENTIRELY PRODUCED BY BURNING COAL.
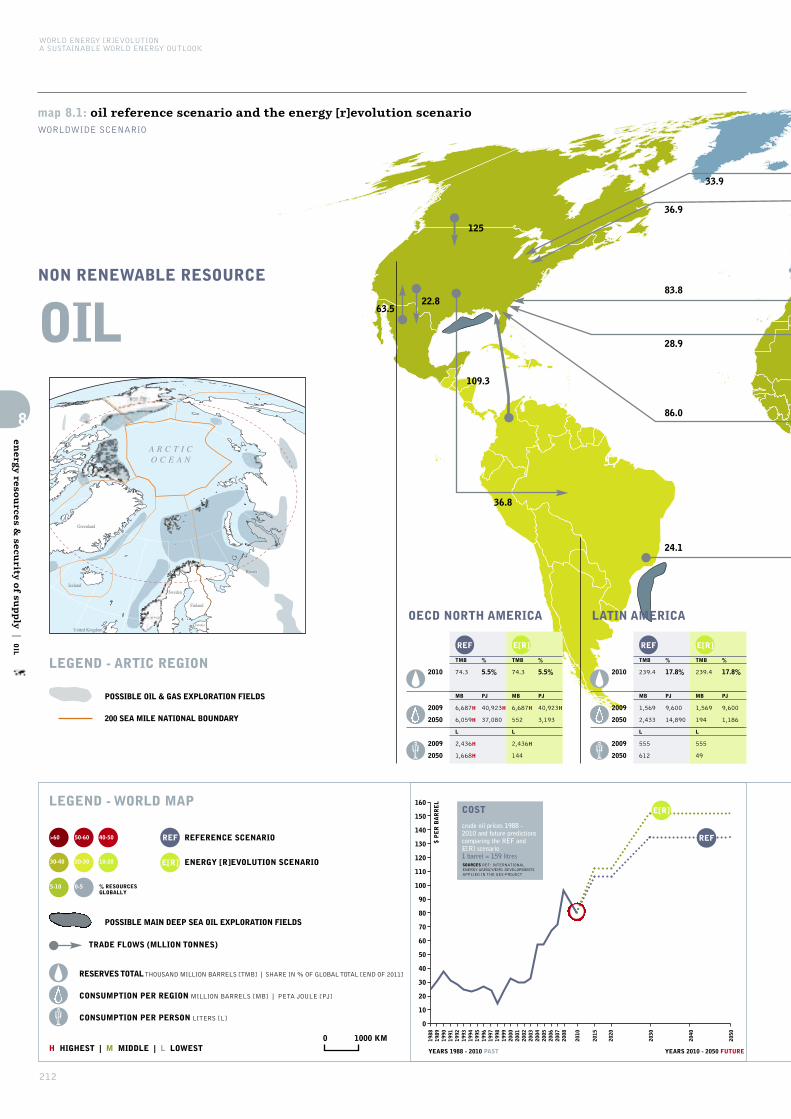
WORLD ENERGY [R]EVOLUTIONA SUSTAINABLE WORLD ENERGY OUTLOOK
212
8
energ
y resources &
security o
f supply
|OIL
NON RENEWABLE RESOURCE
LEGEND - WORLD MAP
REFERENCE SCENARIO
ENERGY [R]EVOLUTION SCENARIO
REF
E[R]
RESERVES TOTALTHOUSAND MILLION BARRELS [TMB] | SHARE IN % OF GLOBAL TOTAL [END OF 2011]
CONSUMPTION PER REGION MILLION BARRELS [MB] | PETA JOULE [PJ]
CONSUMPTION PER PERSON LITERS [L]
H HIGHEST | M MIDDLE | L LOWEST
POSSIBLE MAIN DEEP SEA OIL EXPLORATION FIELDS
0 1000 KM
OIL
TMB %
OECD NORTH AMERICA
2010 74.3 5.5%
2009
2050
6,687H
6,059H
40,923H
37,080
TMB %
74.3 5.5%
40,923H
3,193
6,687H
552
PJ PJMB MB
2009
2050
2,436H
1,668H
2,436H
144
L L
REF E[R]
TMB %
LATIN AMERICA
2010 239.4 17.8%
2009
2050
1,569
2,433
9,600
14,890
TMB %
239.4 17.8%
9,600
1,186
1,569
194
PJ PJMB MB
2009
2050
555
612
555
49
L L
REF E[R]
>60 50-60 40-50
30-40 20-30 10-20
5-10 0-5 % RESOURCESGLOBALLY
1988
1989
1990
1991
1992
1993
1994
1995
1996
1997
1998
1999
2000
2001
2002
2003
2004
2005
2006
2007
2008
2010
2020
2030
2040
2050
2015
160
150
140
130
120
110
100
90
80
70
60
50
40
30
20
10
0
$ PER BARREL
YEARS 1988 - 2010 PAST YEARS 2010 - 2050 FUTURE
COST
crude oil prices 1988 -2010 and future predictionscomparing the REF andE[R] scenario1 barrel = 159 litresSOURCES REF: INTERNATIONALENERGY AGENCY/E[R]: DEVELOPMENTSAPPLIED IN THE GES-PROJECT
E[R]
REF
map 8.1: oil reference scenario and the energy [r]evolution scenarioWORLDWIDE SCENARIO
36.9
33.9
83.8
28.9
86.0
36.8
109.3
125
63.522.8
24.1
Russia
Finland
Spain
Sweden
Norway
Germany
France
Portugal
Romania
Turkey
Denmark
Poland
Belarus
Ukraine
Greece
Cyprus
Neth.Ireland Lithuania
Latvia
Estonia
Greenland
Iceland
United States
Canada
Brazil
Kenya
Ethiopia
Eritrea
Sudan
Egypt
Niger
Mauritania
Mali
Nigeria
Somalia
Namibia
Libya
Chad
South Africa
TanzaniaDem. Rep.Of Congo
Angola
Algeria
Madagascar
Mozambique
Botswana
Zambia
Gabon
Central African Republic
TunisiaMorocco
Uganda
BurundiRwanda
Benin
GhanaCote
D'IvoireLiberia
Sierra Leone
GuineaBurkina Faso
Gambia
Cameroon
Sao Tome & Principe
Zimbabwe
Congo
Equatorial Guinea
Western Sahara
Senegal
Guinea Bissau
Canary IslandsJordanIsrael
Lebanon
AzerbaijanGeorgia
Kyrgyzstan
Tajikistan
Kuwait
U. A. E.
Yemen
SyriaIraq
Iran
Oman
Saudi Arabia
AfghanistanPakistan India
China
Kazakhstan
Turkmenistan
Uzbekistan
Myanmar
Nepal
Sri Lanka
Mongolia
United Kingdom
Italy
Cape Verde Islands
Azores Islands
Puerto Rico
Venezuela
Guyana
Suriname
French Guyana
Austria Hungary
Bulgaria
Czech Rep.Slovakia
Bel.
Serbia& Mont.
Albania
Mold.
Bosnia& Herz.
CroatiaSlovenia
Switz.
Mac.
Qatar
A T L A N T I C
I N D I A NO C E A N
O C E A N
A R C T I CO C E A N
Russia
LEGEND - ARTIC REGION
POSSIBLE OIL & GAS EXPLORATION FIELDS
200 SEA MILE NATIONAL BOUNDARY
TRADE FLOWS (MLLION TONNES)

213
8
energ
y resources &
security o
f supply
|OIL
TMB %
AFRICA
2010 132.1M 9.8%M
2009
2050
1,039
1,640L
6,359L
10,037L
TMB %
132.1M 9.8%M
6,359
3,398
1,039
555
PJ PJMB MB
2009
2050
179
131L
179
44L
L L
REF E[R]
TMB %
INDIA
2010 9.0 0.7%
2009
2050
1,040L
4,143
6,366
25,354
TMB %
9.0 0.7%
6,366L
3,024
1,040L
494
PJ PJMB MB
2009
2050
146L
397
146L
47
L L
REF E[R]
TMB %
NON-OECD ASIA
2010 16.0 1.2%
2009
2050
1,738
3,037
10,634
18,585
TMB %
16.0 1.2%
10,634
3,239
1,738
529
PJ PJMB MB
2009
2050
283
321
283
56
L L
REF E[R]
TMB %
OECD ASIA OCEANIA
2010 5.4L 0.4%L
2009
2050
2,394M
1,832
14,651M
11,209
TMB %
5.4L 0.4%L
14,651
1,990
2,394
325
PJ PJMB MB
2009
2050
1,902
1,635
1,902
290H
L L
REF E[R]
TMB %
GLOBAL
2010 1,344 100%
2009
2050
24,701
34,537
151,168
211,365
TMB %
1,344 100%
151,168
29,942
24,701
4,893
PJ PJMB MB
2009
2050
604
599
604
85
L L
REF E[R]
TMB %
EAST EUROPE/EURASIA
2010 85.6 6.4%
2009
2050
1,458
2,118
8,923
12,961
TMB %
85.6 6.4%
8,923
1,833L
1,458
299L
PJ PJMB MB
2009
2050
679M
1,146
679M
162
L L
REF E[R]
TMB %
CHINA
2010 14.8 1.1%
2009
2050
2,580
6,106
15,787
37,366H
TMB %
14.8 1.1%
15,787
7,283H
2,580
1,190H
PJ PJMB MB
2009
2050
311
684
311
133
L L
REF E[R]
TMB %
MIDDLE EAST
2010 752.5H 56.0%H
2009
2050
2,036
3,549M
12,463
21,720M
TMB %
752.5H 56.0%H
12,463
1,756
2,036
287
PJ PJMB MB
2009
2050
1,721
1,627
1,721
132M
L L
REF E[R]2009
2015
2020
2030
2040
2050
25
20
15
10
5
0
BILLION TONNES
YEARS 2009 - 2050
CO2 EMISSIONSFROM OIL
comparison between the REF and E[R]scenario 2009 - 2050billion tonnes
SOURCE GPI/EREC
E[R]
REF
1988
1989
1990
1991
1992
1993
1994
1995
1996
1997
1998
1999
2000
2001
2002
2003
2004
2005
2006
2007
2008
2010
2020
2030
2040
2050
1972
1973
1974
1975
1976
1977
1978
1979
1980
1981
1982
1983
1984
1985
1986
1987
1988
1989
1990
1991
1992
1993
1994
1995
1996
1997
1998
1999
2000
2001
2002
2003
2004
2005
2006
2009
2015
2020
2030
2040
2050
YEARS 1972 - 2009 PAST YEARS 2009 - 2050 FUTURE
RESERVES AND CONSUMPTION
oil reserves versus global demand, production and consumption. global consumption comparisonbetween the REF and E[R] scenario.
million barrels. 1 barrel = 159 litres
1,344BILLIONBARRELSPROVEN2010
SOURCE BP 2011
50,000
40,000
30,000
20,000
10,000
0
MILLION BARRELS
E[R]
REF
1,323BILLIONBARRELSUSED SINCE2009
691BILLIONBARRELSUSED SINCE2009
TMB %
OECD EUROPE
2010 14.8 1.1%M
2009
2050
4,160
3,621
25,462
22,163
TMB %
14.8 1.1%M
25,462
3,042M
4,160
497M
PJ PJMB MB
2009
2050
1,233
1,022M
1,233
140
L L
REF E[R]
REF global consumption
E[R] global consumption
DESIGN WWW.ONEHEMISPHERE.SE CONCEPT SVEN TESKE/GREENPEACE INTERNATIONAL.
83.0
45.7
21.3
116.7
227.1
129.6
28.6
20.0
39.5
37.6
28.8
45.4
179.9
118.4
227.1
295.2
43.7
15.9
2.2

WORLD ENERGY [R]EVOLUTIONA SUSTAINABLE WORLD ENERGY OUTLOOK
214
8
energ
y resources &
security o
f supply
|GAS
map 8.2: gas reference scenario and the energy [r]evolution scenarioWORLDWIDE SCENARIO
NON RENEWABLE RESOURCE
LEGEND
REFERENCE SCENARIO
ENERGY [R]EVOLUTION SCENARIO
REF
E[R]
0 1000 KM
RESERVES TOTAL TRILLION CUBIC METRES [tn m3] | SHARE IN % OF GLOBAL TOTAL [END OF 2011]
CONSUMPTION PER REGION BILLION CUBIC METRES [bn m3] | PETA JOULE [PJ]
CONSUMPTION PER PERSON CUBIC METRES [m3]
H HIGHEST | M MIDDLE | L LOWEST
PIPELINE GAS TRADE FLOWS (BILLION CUBIC METRES)
LNG TRADE FLOWS (BILLION CUBIC METRES)
GAS>50 40-50 30-40
20-30 10-20 5-10
0-5 % RESOURCESGLOBALLY
1988
1989
1990
1991
1992
1993
1994
1995
1996
1997
1998
1999
2000
2001
2002
2003
2004
2005
2006
2007
2008
2010
2020
2030
2040
2050
2015
3029282726252423222120191817161514131211109876543210
$ PER MILLION Btu
YEARS 1988 - 2010 PAST YEARS 2009 - 2050 FUTURE
COST
gas prices of LNG/natural gas 1984 - 2010and future predictionscomparing the REF and E[R] scenarios.SOURCE JAPAN CIF/EUROPEANUNION CIF/IEA 2010 - US IMPORTS/IEA 2010 - EUROPEAN IMPORTS
LNG
tn m3 %
OECD NORTH AMERICA
2010 9.9 5.2%
2009
2050
731H
890H
27,790H
33,814H
tn m3 %
9.9 5.2%
27,790H
2,559
731H
67
PJ PJbn m3 bn m3
2009
2050
1,598
1,496
1,598
113
m3 m3
REF E[R]
tn m3 %
LATIN AMERICA
2010 7.4 3.9%
2009
2050
119
301
4,539
11,441
tn m3 %
7.4 3.9%
4,539
2,373
119
62
PJ PJbn m3 bn m3
2009
2050
255
499
255
104
m3 m3
REF E[R]
E[R]
REF
92.4
9.4
20.9
9.8
5.4
6.2

215
8
energ
y resources &
security o
f supply
|GAS
1988
1989
1990
1991
1992
1993
1994
1995
1996
1997
1998
1999
2000
2001
2002
2003
2004
2005
2006
2007
2008
2010
2020
2030
2040
2050
2009
2015
2020
2030
2040
2050
25
20
15
10
5
0
BILLION TONNES
YEARS 2009 - 2050
CO2 EMISSIONSFROM GAS
comparison between the REF and E[R]scenario 2009 - 2050
billion tonnesSOURCE GPI/EREC
E[R]
1972
1973
1974
1975
1976
1977
1978
1979
1980
1981
1982
1983
1984
1985
1986
1987
1988
1989
1990
1991
1992
1993
1994
1995
1996
1997
1998
1999
2000
2001
2002
2003
2004
2005
2006
2007
2008
2009
2010
2020
2030
2040
2050
2015
YEARS 1972 - 2009 PAST YEARS 2009 - 2050 FUTURE
RESERVES AND CONSUMPTION
gas reserves versus global demand, production and consumption. global consumption comparisonbetween the REF and E[R] scenario.
billion cubic metres
REF global consumption
E[R] global consumption
191TRILLIONCUBIC METRESPROVEN 2010
SOURCE 1970-2011 BP, 2009-2050 GPI/EREC
5,000
4,000
3,000
2,000
1,000
0
BILLION m
3
E[R]
159TRILLIONCUBICMETRESUSED SINCE2009
111TRILLIONCUBICMETRESUSED SINCE2009
REF
tn m3 %
AFRICA
2010 14.7M 7.7%M
2009
2050
91
229
3,452
8,697
tn m3 %
14.7M 7.7%M
3,452
2,604
91
69
PJ PJbn m3 bn m3
2009
2050
91
104L
91
31L
m3 m3
REF E[R]
tn m3 %
INDIA
2010 1.5L 0.8%L
2009
2050
53L
254
2,005L
9,637
tn m3 %
1.5L 0.8%L
2,005L
3,700M
53L
97M
PJ PJbn m3 bn m3
2009
2050
44L
150
44L
58
m3 m3
REF E[R]
tn m3 %
NON-OECD ASIA
2010 8.7 4.5%
2009
2050
178
436M
6,757
16,561M
tn m3 %
8.7 4.5%
6,757
3,864
178
102
PJ PJbn m3 bn m3
2009
2050
170
302
170
70
m3 m3
REF E[R]
tn m3 %
OECD ASIA OCEANIA
2010 3.3 1.7%
2009
2050
158
211L
6,019
8,020L
tn m3 %
3.3 1.7%
6,019
2,302L
158
61L
PJ PJbn m3 bn m3
2009
2050
789M
1,095M
789M
314
m3 m3
REF E[R]
tn m3 %
GLOBAL
2010 191 100%
2009
2050
2,829
4,381
107,498
166,489
tn m3 %
191 100%
107,498
35,557
2,829
936
PJ PJbn m3 bn m3
2009
2050
415
478
415
101
m3 m3
REF E[R]
tn m3 %
EAST EUROPE/EURASIA
2010 53.3 27.9%
2009
2050
633
913
24,069
34,678
tn m3 %
53.3 27.9%
24,069
2,949
633
78
PJ PJbn m3 bn m3
2009
2050
1,870H
2,817H
1,870H
239
m3 m3
REF E[R]
tn m3 %
CHINA
2010 2.8 1.5%
2009
2050
73
530
2,783
20,135
tn m3 %
2.8 1.5%
2,783
7,586H
73
200H
PJ PJbn m3 bn m3
2009
2050
55
406
55
153
m3 m3
REF E[R]
tn m3 %
MIDDLE EAST
2010 75.8H 39.7%H
2009
2050
311M
724
11,836M
27,512
tn m3 %
75.8H 39.7%H
11,836
4,444
311
117
PJ PJbn m3 bn m3
2009
2050
1,532
2,022
1,532
327H
m3 m3
REF E[R]
tn m3 %
OECD EUROPE
2010 13.6 7.1%
2009
2050
480
666
18,249
25,308
tn m3 %
13.6 7.1%
18,249
3,176
480
84
PJ PJbn m3 bn m3
2009
2050
865
1,110
865
139M
m3 m3
REF E[R]
DESIGN WWW.ONEHEMISPHERE.SE CONCEPT SVEN TESKE/GREENPEACE INTERNATIONAL.
REF
16.0
113.9
55.9 32.0
6.5
12.1
16.6
17.310.9
21.018.8
8.2
17.7
5.8
7.0
8.8
6.3
14.9
5.2
43.3
44.1
36.5
5.5
4.1
20.1
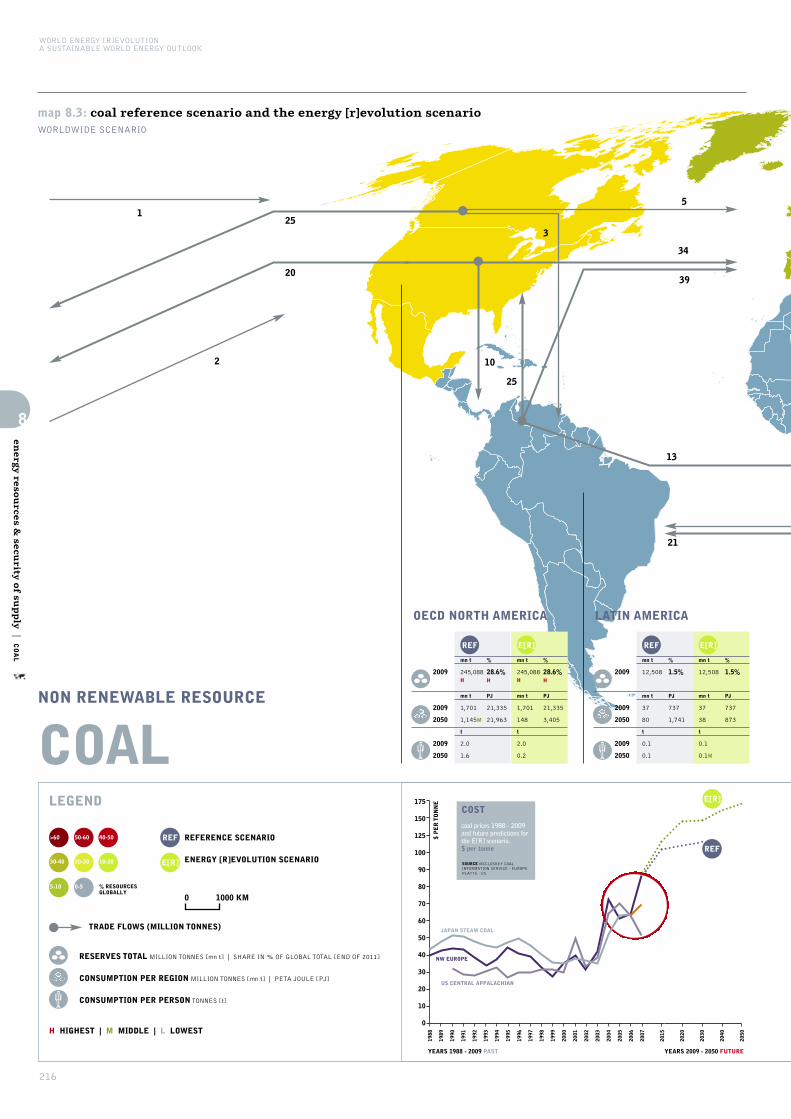
WORLD ENERGY [R]EVOLUTIONA SUSTAINABLE WORLD ENERGY OUTLOOK
216
8
energ
y resources &
security o
f supply
|COAL
map 8.3: coal reference scenario and the energy [r]evolution scenarioWORLDWIDE SCENARIO
NON RENEWABLE RESOURCE
LEGEND
REFERENCE SCENARIO
ENERGY [R]EVOLUTION SCENARIO
REF
E[R]
0 1000 KM
RESERVES TOTAL MILLION TONNES [mn t] | SHARE IN % OF GLOBAL TOTAL [END OF 2011]
CONSUMPTION PER REGION MILLION TONNES [mn t] | PETA JOULE [PJ]
CONSUMPTION PER PERSON TONNES [t]
H HIGHEST | M MIDDLE | L LOWEST
COAL>60 50-60 40-50
30-40 20-30 10-20
5-10 0-5 % RESOURCESGLOBALLY
1988
1989
1990
1991
1992
1993
1994
1995
1996
1997
1998
1999
2000
2001
2002
2003
2004
2005
2006
2007
2015
2020
2030
2040
2050
175
150
125
100
90
80
70
60
50
40
30
20
10
0
$ PER TONNE
YEARS 2009 - 2050 FUTURE
COST
coal prices 1988 - 2009and future predictions forthe E[R] scenario.$ per tonne
SOURCE MCCLOSKEY COALINFORMATION SERVICE - EUROPE.PLATTS - US.
NW EUROPE
US CENTRAL APPALACHIAN
JAPAN STEAM COAL
E[R]
mn t %
OECD NORTH AMERICA
2009 245,088H
28.6%H
2009
2050
1,701
1,145M
21,335
21,963
mn t %
245,088H
28.6%H
21,335
3,405
1,701
148
PJ PJmn t mn t
2009
2050
2.0
1.6
2.0
0.2
t t
REF E[R]
mn t %
LATIN AMERICA
2009 12,508 1.5%
2009
2050
37
80
737
1,741
mn t %
12,508 1.5%
737
873
37
38
PJ PJmn t mn t
2009
2050
0.1
0.1
0.1
0.1M
t t
REF E[R]
YEARS 1988 - 2009 PAST
REF
5
13
21
34
39
3
25
10
20
2
125
TRADE FLOWS (MILLION TONNES)
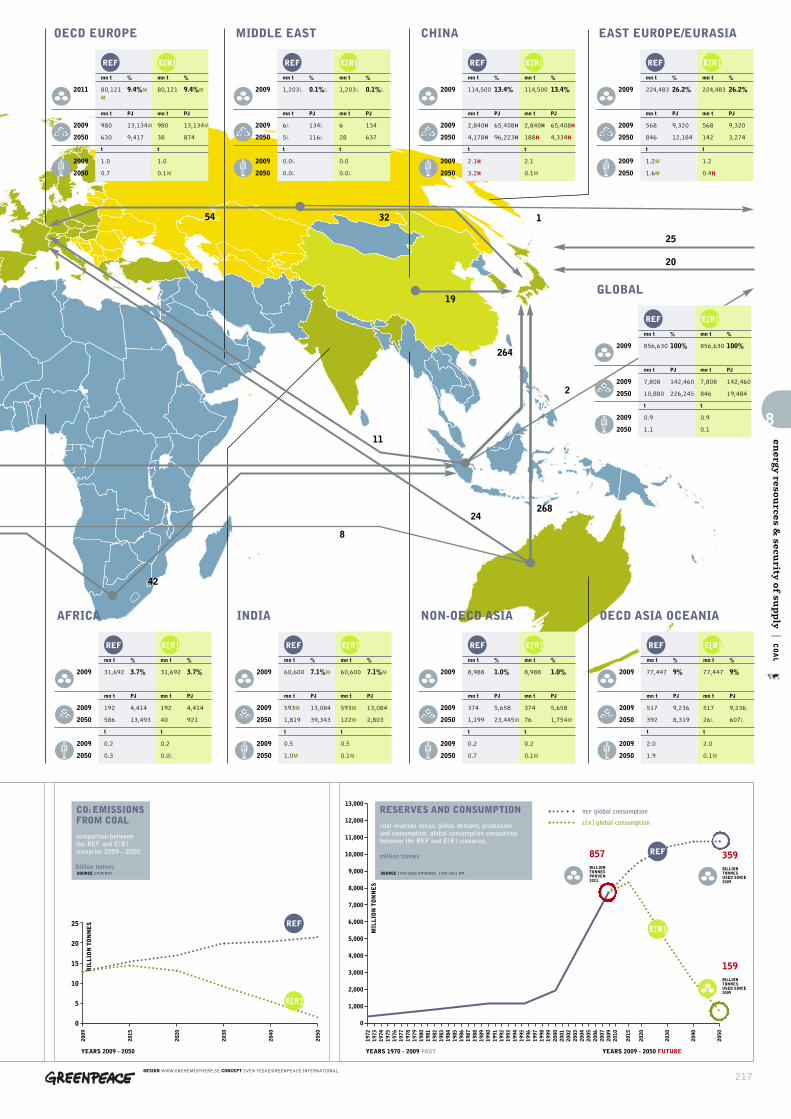
217
8
energ
y resources &
security o
f supply
|COAL
1988
1989
1990
1991
1992
1993
1994
1995
1996
1997
1998
1999
2000
2001
2002
2003
2004
2005
2006
2007
2015
2020
2030
2040
2050
2009
2015
2020
2030
2040
2050
25
20
15
10
5
0
BILLION TONNES
YEARS 2009 - 2050
CO2 EMISSIONSFROM COAL
comparison between the REF and E[R]scenarios 2009 - 2050
billion tonnesSOURCE GPI/EREC
REF
E[R]
1972
1973
1974
1975
1976
1977
1978
1979
1980
1981
1982
1983
1984
1985
1986
1987
1988
1989
1990
1991
1992
1993
1994
1995
1996
1997
1998
1999
2000
2001
2002
2003
2004
2005
2006
2007
2009
2010
2015
2020
2030
2040
2050
YEARS 1970 - 2009 PAST YEARS 2009 - 2050 FUTURE
RESERVES AND CONSUMPTION
coal reserves versus global demand, production and consumption. global consumption comparisonbetween the REF and E[R] scenarios.
million tonnes
REF global consumption
E[R] global consumption
857BILLIONTONNESPROVEN2011
SOURCE 1970-2050 GPI/EREC, 1970-2011 BP.
13,000
12,000
11,000
10,000
9,000
8,000
7,000
6,000
5,000
4,000
3,000
2,000
1,000
0
MILLION TONNES
E[R]
359BILLIONTONNESUSED SINCE2009
159BILLIONTONNESUSED SINCE2009
REF
mn t %
AFRICA
2009 31,692 3.7%
2009
2050
192
586
4,414
13,493
mn t %
31,692 3.7%
4,414
921
192
40
PJ PJmn t mn t
2009
2050
0.2
0.3
0.2
0.0L
t t
REF E[R]
mn t %
INDIA
2009 60,600 7.1%M
2009
2050
593M
1,819
13,084
39,343
mn t %
60,600 7.1%M
13,084
2,803
593M
122M
PJ PJmn t mn t
2009
2050
0.5
1.0M
0.5
0.1M
t t
REF E[R]
mn t %
NON-OECD ASIA
2009 8,988 1.0%
2009
2050
374
1,199
5,658
23,445M
mn t %
8,988 1.0%
5,658
1,754M
374
76
PJ PJmn t mn t
2009
2050
0.2
0.7
0.2
0.1M
t t
REF E[R]
mn t %
OECD ASIA OCEANIA
2009 77,447 9%
2009
2050
517
392
9,236
8,319
mn t %
77,447 9%
9,236
607L
517
26L
PJ PJmn t mn t
2009
2050
2.0
1.9
2.0
0.1M
t t
REF E[R]
mn t %
GLOBAL
2009 856,630 100%
2009
2050
7,808
10,880
142,460
226,245
mn t %
856,630 100%
142,460
19,484
7,808
846
PJ PJmn t mn t
2009
2050
0.9
1.1
0.9
0.1
t t
REF E[R]
mn t %
EAST EUROPE/EURASIA
2009 224,483 26.2%
2009
2050
568
846
9,320
12,184
mn t %
224,483 26.2%
9,320
3,274
568
142
PJ PJmn t mn t
2009
2050
1.2M
1.6M
1.2
0.4H
t t
REF E[R]
mn t %
CHINA
2009 114,500 13.4%
2009
2050
2,840H
4,178H
65,408H
96,223H
mn t %
114,500 13.4%
65,408H
4,334H
2,840H
188H
PJ PJmn t mn t
2009
2050
2.1H
3.2H
2.1
0.1M
t t
REF E[R]
mn t %
MIDDLE EAST
2009 1,203L 0.1%L
2009
2050
6L
5L
134L
116L
mn t %
1,203L 0.1%L
134
637
6
28
PJ PJmn t mn t
2009
2050
0.0L
0.0L
0.0
0.0L
t t
REF E[R]
mn t %
OECD EUROPE
2011 80,121M
9.4%M
2009
2050
980
630
13,134M
9,417
mn t %
80,121 9.4%M
13,134M
874
980
38
PJ PJmn t mn t
2009
2050
1.0
0.7
1.0
0.1M
t t
REF E[R]
DESIGN WWW.ONEHEMISPHERE.SE CONCEPT SVEN TESKE/GREENPEACE INTERNATIONAL.
42
8
24268
11
264
2
19
32 1
25
20
54
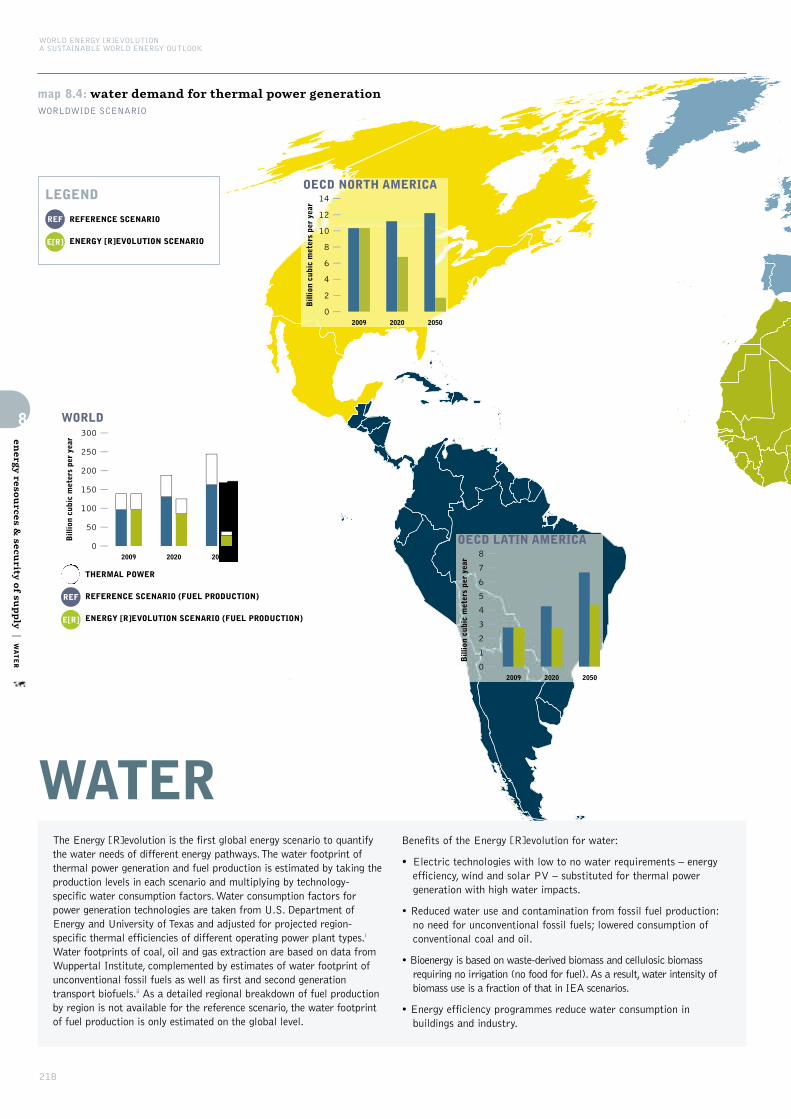
WORLD ENERGY [R]EVOLUTIONA SUSTAINABLE WORLD ENERGY OUTLOOK
218
8
energ
y resources &
security o
f supply
|WATER
WATER
map 8.4: water demand for thermal power generationWORLDWIDE SCENARIO
The Energy [R]evolution is the first global energy scenario to quantifythe water needs of different energy pathways. The water footprint ofthermal power generation and fuel production is estimated by taking theproduction levels in each scenario and multiplying by technology-specific water consumption factors. Water consumption factors forpower generation technologies are taken from U.S. Department ofEnergy and University of Texas and adjusted for projected region-specific thermal efficiencies of different operating power plant types.i
Water footprints of coal, oil and gas extraction are based on data fromWuppertal Institute, complemented by estimates of water footprint ofunconventional fossil fuels as well as first and second generationtransport biofuels.ii As a detailed regional breakdown of fuel productionby region is not available for the reference scenario, the water footprintof fuel production is only estimated on the global level.
Benefits of the Energy [R]evolution for water:
• Electric technologies with low to no water requirements – energyefficiency, wind and solar PV – substituted for thermal powergeneration with high water impacts.
• Reduced water use and contamination from fossil fuel production:no need for unconventional fossil fuels; lowered consumption ofconventional coal and oil.
• Bioenergy is based on waste-derived biomass and cellulosic biomassrequiring no irrigation (no food for fuel). As a result, water intensity ofbiomass use is a fraction of that in IEA scenarios.
• Energy efficiency programmes reduce water consumption inbuildings and industry.
2009 2020 2050
0
2
4
6
8
10
12
14
Bill
ion
cubi
c m
eter
s pe
r ye
ar
OECD NORTH AMERICA
2009 2020 2050
0
1
2
3
4
5
6
7
8
Bill
ion
cubi
c m
eter
s pe
r ye
ar
OECD LATIN AMERICA2009 2020 2050
0
50
100
150
200
250
300
Bill
ion
cubi
c m
eter
s pe
r ye
ar
WORLD
THERMAL POWER
REFERENCE SCENARIO (FUEL PRODUCTION)
ENERGY [R]EVOLUTION SCENARIO (FUEL PRODUCTION)
REF
E[R]
REFERENCE SCENARIO
ENERGY [R]EVOLUTION SCENARIO
REF
E[R]
LEGEND

219
8
energ
y resources &
security o
f supply
|WATER
• Rapid CO2 emission reductions protect water resources fromcatastrophic climate change.
Global water consumption for power generation and fuel production hasalmost doubled in the past two decades, and the trend is projected tocontinue. The OECD predicts that in a business-as-usual scenario, thepower sector would consume 25% of the world’s water in 2050 and beresponsible for more than half of additional demand.iii The Energy[R]evolution pathway would halt the rise in water demand for energy,mitigating the pressures and conflicts on the world’s already stressedwater resources. Approximately 90 billion cubic meters of water wouldbe saved in fuel production and thermal power generation by 2030,enough to satisfy the water needs of 1.3 billion urban dwellers, or toirrigate enough fields to produce 50 million tonnes of grain, equal to theaverage direct consumption of 300-500 million people.iv
references
i NATIONAL ENERGY TECHNOLOGY LABORATORY 2009: WATER REQUIREMENTS FOR EXISTING AND
EMERGING THERMOELECTRIC PLANT TECHNOLOGIES. US DEPARTMENT OF ENERGY. AUGUST 2008
(APRIL 2009 REVISION); U.S. DEPARTMENT OF ENERGY 2006: ENERGY DEMANDS ON WATER
RESOURCES. REPORT TO CONGRESS ON THE INTERDEPENDENCY OF ENERGY AND WATER.
UNIVERSITY OF TEXAS & ENVIRONMENTAL DEFENSE FUND 2009: ENERGY‐WATER NEXUS IN
TEXAS.
ii WUPPERTAL INSTITUT: MATERIAL INTENSITY OF MATERIALS, FUELS, TRANSPORT SERVICES,
FOOD. HTTP://WWW.WUPPERINST.ORG/UPLOADS/TX_WIBEITRAG/MIT_2011.PDF; WORLD
ECONOMIC FORUM 2009: ENERGY VISION UPDATE 2009. THIRSTY ENERGY; HARTO ET AL: LIFE
CYCLE WATER CONSUMPTION OF ALTERNATIVE, LOW-CARBON TRANSPORTATION ENERGY
SOURCES. FUNDED BY ARIZONA WATER INSTITUTE.
iii OECD ENVIRONMENTAL OUTLOOK TO 2050: THE CONSEQUENCES OF INACTION.
HTTP://WWW.OECD.ORG/DOCUMENT/11/0,3746,EN_2649_37465_49036555_1_1_1_37465,00.HTML
iv USING TYPICAL URBAN RESIDENTIAL WATER CONSUMPTION OF 200 LITERS/PERSON/DAY.
AVERAGE GRAIN CONSUMPTION RANGES FROM 8 KG/PERSON/MONTH (US) TO 14 (INDIA).
2009 2020 2050
0
1
2
3
4
5
6
7
8
Bill
ion
cubi
c m
eter
s pe
r ye
ar
OECD EUROPE
2009 2020 2050
0
1
2
3
4
5
6
Bill
ion
cubi
c m
eter
s pe
r ye
ar
EASTERN EUROPE EURASIA
2009 2020 2050
0
5
10
15
20
25
30
Bill
ion
cubi
c m
eter
s pe
r ye
ar
CHINA
2009 2020 2050
0
2
4
6
8
10
12
14
Bill
ion
cubi
c m
eter
s pe
r ye
ar
INDIA
2009 2020 2050
0
1
2
3
4
5
6
Bill
ion
cubi
c m
eter
s pe
r ye
ar
OECD ASIA OCEANIA
2009 2020 2050
0
1
2
3
4
5
6
Bill
ion
cubi
c m
eter
s pe
r ye
ar
MIDDLE EAST
2009 2020 2050
0
1
2
3
4
5
Bill
ion
cubi
c m
eter
s pe
r ye
ar
AFRICA
2009 2020 2050
0
1
2
3
4
5
6
7
8
Bill
ion
cubi
c m
eter
s pe
r ye
ar
NON OECD ASIA
DESIGN WWW.ONEHEMISPHERE.SE CONCEPT SVEN TESKE/GREENPEACE INTERNATIONAL.

WORLD ENERGY [R]EVOLUTIONA SUSTAINABLE WORLD ENERGY OUTLOOK
220
8.4 nuclear
Uranium, the fuel used in nuclear power plants, is a finiteresource whose economically available reserves are limited. Itsdistribution is almost as concentrated as oil and does not matchglobal consumption. Five countries - Canada, Australia,Kazakhstan, Russia and Niger - control three quarters of theworld’s supply. As a significant user of uranium, however, Russia’sreserves will be exhausted within ten years.
Secondary sources, such as old deposits, currently make up nearlyhalf of worldwide uranium reserves. However, these will soon beused up. Mining capacities will have to be nearly doubled in thenext few years to meet current needs.
A joint report by the OECD Nuclear Energy Agency and theInternational Atomic Energy Agency76 estimates that all existingnuclear power plants will have used up their nuclear fuel,employing current technology, within less than 70 years. Giventhe range of scenarios for the worldwide development of nuclearpower, it is likely that uranium supplies will be exhaustedsometime between 2026 and 2070. This forecast includes the useof mixed oxide fuel (MOX), a mixture of uranium and plutonium.
8
energ
y resources a
nd secu
rity of su
pply
|FOSSIL FUELS
reference76 ‘URANIUM 2003: RESOURCES, PRODUCTION AND DEMAND’.
2015
167,15927,314
151,99624,836
121,0673,186
120,8613,181
169,3308,957
154,9328,197
2009
151,16824,701
151,16824,701
107,4982,829
107,4982,829
142,4607,808
142,4607,808
2040
197,52232,275
53,0308,665
179,8784,734
73,4521,933
224,48710,879
58,7322,556
2050
211,36534,537
29,9424,893
195,8045,153
35,557936
226,24510,880
19,484846
2030
185,99330,391
95,16915,550
155,4124,090
106,2282,795
209,19510,349
105,2194,707
2020
173,23628,306
133,71221,848
131,6823,465
124,0693,265
186,7429,633
142,8337,119
table 8.3: assumptions on fossil fuel use in the energy [r]evolution scenario
FOSSIL FUEL
Oil
Reference (PJ/a)Reference (million barrels/a)
E[R] (PJ/a)E[R] (million barrels/a)
Gas
Reference (PJ/a)Reference (billion cubic metres = 10E9m/a)
E[R] (PJ/a)E[R] (billion cubic metres = 10E9m/a)
Coal
Reference (PJ/a)Reference (million tonnes)
E[R] (PJ/a)E[R] (million tonnes)

221
8
energ
y resources a
nd secu
rity of su
pply
|FOSSIL FUELS, N
UCLEAR
8.5 renewable energy
Nature offers a variety of freely available options for producingenergy. Their exploitation is mainly a question of how to convertsunlight, wind, biomass or water into electricity, heat or power asefficiently, sustainably and cost-effectively as possible.
On average, the energy in the sunshine that reaches the earth isabout one kilowatt per square metre worldwide. According to theIPCC Special Report Renewables (SRREN)78 solar power is arenewable energy source gushing out at 7,900 times more thanthe energy currently needed in the world. In one day, the sunlightwhich reaches the earth produces enough energy to satisfy theworld’s current energy requirements for twenty years, even beforeother renewable energy sources such as wind and ocean energyare taken into account. Even though only a percentage of thatpotential is technically accessible, this is still enough to provideup to ten times more energy than the world currently requires.
Before looking at the part renewable energies can play in therange of scenarios in this report, it is worth understanding theupper limits of their regional potential and by when this potentialcan be exploited.
The overall technical potential of renewable energy is huge andseveral times higher than current total energy demand. Technicalpotential is defined as the amount of renewable energy outputobtainable by full implementation of demonstrated technologiesor practices that are likely to develop. It takes into account theprimary resources, the socio-geographical constraints and thetechnical losses in the conversion process. Calculating renewableenergy potentials is highly complex because these technologiesare comparatively young and their exploitation involves changesto the way in which energy is both generated and distributed. Thetechnical potential is dependent on a number of uncertainties,e.g. a technology breakthrough, for example, could have adramatic impact, changing the technical potential assessmentwithin a very short time frame. Further, because of the speed oftechnology change, many existing studies are based on out of dateinformation. More recent data, e.g. significantly increasedaverage wind turbine capacity and output, would increase thetechnical potentials still further.
box 8.1: definition of types of energy resource potential77
Theoretical potential The physical upper limit of the energyavailable from a certain source. For solar energy, forexample, this would be the total solar radiation falling on aparticular surface.
Conversion potential This is derived from the annualefficiency of the respective conversion technology. It istherefore not a strictly defined value, since the efficiency ofa particular technology depends on technological progress.
Technical potential This takes into account additionalrestrictions regarding the area that is realistically availablefor energy generation. Technological, structural andecological restrictions, as well as legislative requirements,are accounted for.
Economic potential The proportion of the technical potentialthat can be utilised economically. For biomass, for example,those quantities are included that can be exploitedeconomically in competition with other products and land uses.
Sustainable potential This limits the potential of an energysource based on evaluation of ecological and socio-economic factors.
ANNUAL FLUX (EJ/a)
1,5483,900,000
1,400147
7,4006,000
TOTAL RESERVE
------
RATIO(ANNUAL ENERGY FLUX/
2008 PRIMARY ENERGY SUPPLY)
3.17,9002.80.31512
table 8.4: renewable energy theoretical potential
RE
Bio energySolar energyGeothermal energyHydro powerOcean energyWind energy
references77 WBGU (GERMAN ADVISORY COUNCIL ON GLOBAL CHANGE).
78 IPCC, 2011: IPCC SPECIAL REPORT ON RENEWABLE ENERGY SOURCES AND CLIMATE CHANGE
MITIGATION. PREPARED BY WORKING GROUP III OF THE INTERGOVERNMENTAL PANEL ON CLIMATE
CHANGE [O. EDENHOFER, R. PICHS-MADRUGA, Y. SOKONA, K. SEYBOTH, P. MATSCHOSS, S. KADNER, T.
ZWICKEL, P. EICKEMEIER, G. HANSEN, S. SCHLÖMER, C. VON STECHOW (EDS)]. CAMBRIDGE UNIVERSITY
PRESS, CAMBRIDGE, UNITED KINGDOM AND NEW YORK, NY, USA, 1075 PP.
image THE BIOENERGY VILLAGE OF JUEHNDE,WHICH IS THE FIRST COMMUNITY IN GERMANY THATPRODUCES ALL ITS ENERGY NEEDED FOR HEATINGAND ELECTRICITY WITH CO2 NEUTRAL BIOMASS.
© PAUL LANGROCK/ZENIT/GP

WORLD ENERGY [R]EVOLUTIONA SUSTAINABLE WORLD ENERGY OUTLOOK
222
8
energ
y resources &
security o
f supply
|SOLAR
RENEWABLE RESOURCE
LEGEND
Global Horizontal Irradiance
REF
E[R]
0 1000 KM
NEEDED SOLAR AREA TOSUPPORT ENTIRE REGION
95,555 KM2
NEEDED SOLAR AREA TOSUPPORT ENTIRE REGION
21,043 KM2
SOLAR% PJ
OECD NORTH AMERICA
2009
2050
0.07
1.49
78M
1,862H
2009
2050
48
896H
% PJ
36 26,543
12,395H
kWh kWh
REF E[R]
% PJ
LATIN AMERICA
2009
2050
0.08M
1.12M
17
456
2009
2050
10
211
% PJ
20 5,845
2,691
kWh kWh
REF E[R]
map 8.5: solar reference scenario and the energy [r]evolution scenarioWORLDWIDE SCENARIO
REFERENCE SCENARIO
ENERGY [R]EVOLUTION SCENARIO
PRODUCTION PER REGION% OF GLOBAL SHARE | PETA JOULE [PJ]
PRODUCTION PER PERSON KILOWATT HOUR [kWh]
H HIGHEST | M MIDDLE | L LOWEST
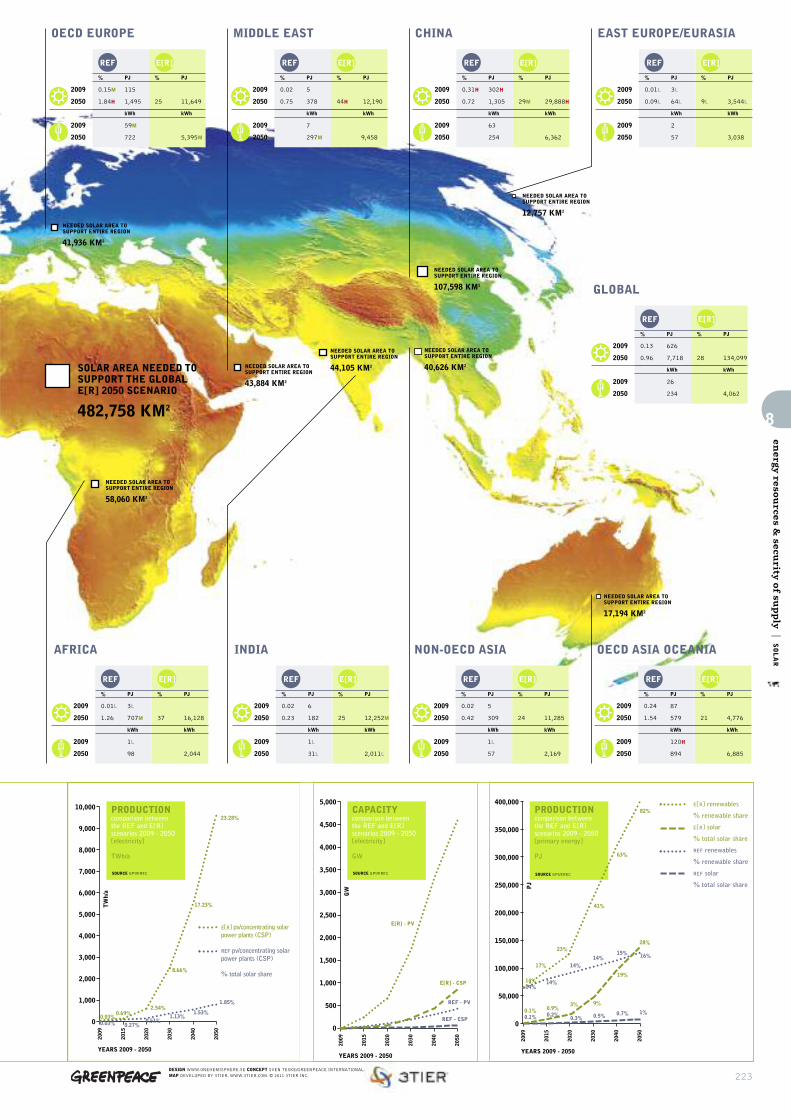
223DESIGN WWW.ONEHEMISPHERE.SE CONCEPT SVEN TESKE/GREENPEACE INTERNATIONAL.MAP DEVELOPED BY 3TIER. WWW.3TIER.COM. © 2011 3TIER INC.
8
energ
y resources &
security o
f supply
|SOLAR
NEEDED SOLAR AREA TOSUPPORT ENTIRE REGION
58,060 KM2
NEEDED SOLAR AREA TOSUPPORT ENTIRE REGION
43,884 KM2
NEEDED SOLAR AREA TOSUPPORT ENTIRE REGION
40,626 KM2
NEEDED SOLAR AREA TOSUPPORT ENTIRE REGION
17,194 KM2
NEEDED SOLAR AREA TOSUPPORT ENTIRE REGION
12,757 KM2
NEEDED SOLAR AREA TOSUPPORT ENTIRE REGION
107,598 KM2
NEEDED SOLAR AREA TOSUPPORT ENTIRE REGION
41,936 KM2
SOLAR AREA NEEDED TOSUPPORT THE GLOBALE[R] 2050 SCENARIO
482,758 KM2
NEEDED SOLAR AREA TOSUPPORT ENTIRE REGION
44,105 KM2
2009
2015
2020
2030
2040
2050
400,000
350,000
300,000
250,000
200,000
150,000
100,000
50,000
0
PJ
YEARS 2009 - 2050
PRODUCTIONcomparison between the REF and E[R]scenarios 2009 - 2050[primary energy]
PJ
SOURCE GPI/EREC
14%14%
17%
14%
14%14%
41%
15%
63%
16%
82%E[R] renewables
% renewable share
E[R] solar
% total solar share
REF renewables
% renewable share
REF solar
% total solar share
2009
2015
2020
2030
2040
2050
10,000
9,000
8,000
7,000
6,000
5,000
4,000
3,000
2,000
1,000
0
TWh/a
YEARS 2009 - 2050
PRODUCTIONcomparison between the REF and E[R]scenarios 2009 - 2050[electricity]
TWh/a
SOURCE GPI/EREC
2009
2015
2020
2030
2040
2050
5,000
4,500
4,000
3,500
3,000
2,500
2,000
1,500
1,000
500
0
GW
YEARS 2009 - 2050
CAPACITYcomparison between the REF and E[R]scenarios 2009 - 2050[electricity]
GW
SOURCE GPI/EREC
0.03%0.03% 0.27%
REF - PV
REF - CSP0.69%
2.54%
0.51%1.13%
8.66%
1.53%
17.23%
1.85%
23.28%
E[R] - PV
E[R] - CSP
% PJ
AFRICA
2009
2050
0.01L
1.26
3L
707M
2009
2050
1L
98
% PJ
37 16,128
2,044
kWh kWh
REF E[R]
% PJ
INDIA
2009
2050
0.02
0.23
6
182
2009
2050
1L
31L
% PJ
25 12,252M
2,011L
kWh kWh
REF E[R]
% PJ
NON-OECD ASIA
2009
2050
0.02
0.42
5
309
2009
2050
1L
57
% PJ
24 11,285
2,169
kWh kWh
REF E[R]
% PJ
OECD ASIA OCEANIA
2009
2050
0.24
1.54
87
579
2009
2050
120H
894
% PJ
21 4,776
6,885
kWh kWh
REF E[R]
% PJ
GLOBAL
2009
2050
0.13
0.96
626
7,718
2009
2050
26
234
% PJ
28 134,099
4,062
kWh kWh
REF E[R]
% PJ
EAST EUROPE/EURASIA
2009
2050
0.01L
0.09L
3L
64L
2009
2050
2
57
% PJ
9L 3,544L
3,038
kWh kWh
REF E[R]
% PJ
CHINA
2009
2050
0.31H
0.72
302H
1,305
2009
2050
63
254
% PJ
29M 29,888H
6,362
kWh kWh
REF E[R]
% PJ
MIDDLE EAST
2009
2050
0.02
0.75
5
378
2009
2050
7
297M
% PJ
44H 12,190
9,458
kWh kWh
REF E[R]
% PJ
OECD EUROPE
2009
2050
0.15M
1.84H
115
1,495
2009
2050
59M
722
% PJ
25 11,649
5,395M
kWh kWh
REF E[R]
E[R] pv/concentrating solar power plants (CSP)
REF pv/concentrating solar power plants (CSP)
% total solar share
0.1%0.1%
0.9%0.2%
3%
0.3% 0.5%
9%
0.7%
19%
1%
28%23%
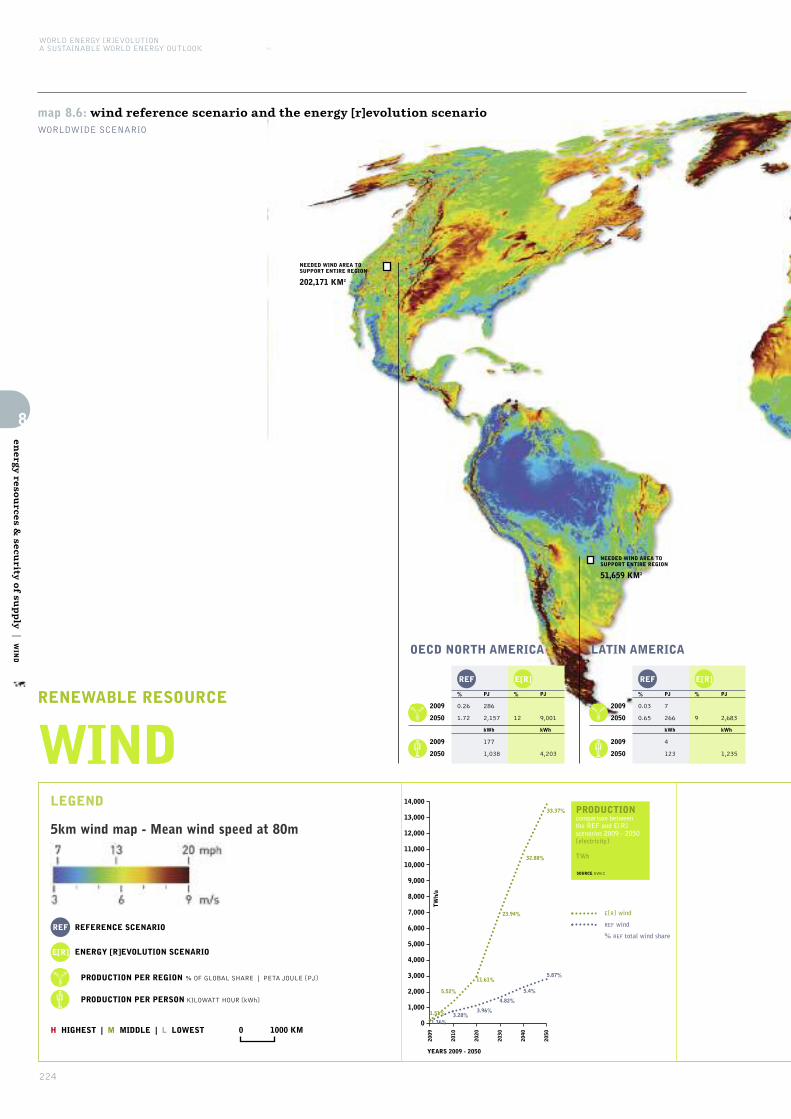
WORLD ENERGY [R]EVOLUTIONA SUSTAINABLE WORLD ENERGY OUTLOOK
224
8
energ
y resources &
security o
f supply
|WIND
map 8.6: wind reference scenario and the energy [r]evolution scenarioWORLDWIDE SCENARIO
RENEWABLE RESOURCE
LEGEND
REF
E[R]
0 1000 KM
WIND
NEEDED WIND AREA TOSUPPORT ENTIRE REGION
202,171 KM2
NEEDED WIND AREA TOSUPPORT ENTIRE REGION
51,659 KM2
% PJ
OECD NORTH AMERICA
2009
2050
0.26
1.72
286
2,157
2009
2050
177
1,038
% PJ
12 9,001
4,203
kWh kWh
REF E[R]
% PJ
LATIN AMERICA
2009
2050
0.03
0.65
7
266
2009
2050
4
123
% PJ
9 2,683
1,235
kWh kWh
REF E[R]
REFERENCE SCENARIO
ENERGY [R]EVOLUTION SCENARIO
PRODUCTION PER REGION % OF GLOBAL SHARE | PETA JOULE [PJ]
PRODUCTION PER PERSON KILOWATT HOUR [kWh]
H HIGHEST | M MIDDLE | L LOWEST
2009
2010
2020
2030
2040
2050
14,000
13,000
12,000
11,000
10,000
9,000
8,000
7,000
6,000
5,000
4,000
3,000
2,000
1,000
0
TWh/a
YEARS 2009 - 2050
PRODUCTIONcomparison between the REF and E[R]scenarios 2009 - 2050[electricity]
TWh
SOURCE GWEC
1.36%
1.51%
11.61%
3.96%
4.82%
23.94%
5.4%
32.88%
5.87%
33.37%
5.52%
3.28%
E[R] wind
REF wind
% REF total wind share
5km wind map - Mean wind speed at 80m

225DESIGN WWW.ONEHEMISPHERE.SE CONCEPT SVEN TESKE/GREENPEACE INTERNATIONAL.MAP DEVELOPED BY 3TIER. WWW.3TIER.COM. © 2011 3TIER INC.
8
energ
y resources &
security o
f supply
|WIND
NEEDED WIND AREA TOSUPPORT ENTIRE REGION
39,910 KM2
NEEDED WIND AREA TOSUPPORT ENTIRE REGION
56,680 KM2
NEEDED WIND AREA TOSUPPORT ENTIRE REGION
95,576 KM2
NEEDED WIND AREA TOSUPPORT ENTIRE REGION
47,857 KM2
NEEDED WIND AREA TOSUPPORT ENTIRE REGION
155,284 KM2
NEEDED WIND AREA TOSUPPORT ENTIRE REGION
227,780 KM2
NEEDED WIND AREA TOSUPPORT ENTIRE REGION
103,215 KM2
WIND AREA NEEDED TOSUPPORT THE GLOBALE[R] 2050 SCENARIO
1,047,209 KM2
NEEDED WIND AREA TOSUPPORT ENTIRE REGION
67,076 KM2
% PJ
AFRICA
2009
2050
0.02
0.32
6
181
2009
2050
2
25L
% PJ
5L 2,207L
280L
kWh kWh
REF E[R]
% PJ
INDIA
2009
2050
0.22
0.55
65
493
2009
2050
15
85
% PJ
7 3,300
542
kWh kWh
REF E[R]
% PJ
NON-OECD ASIA
2009
2050
0.01
0.79
3
583M
2009
2050
1L
107
% PJ
10M 4,590M
882
kWh kWh
REF E[R]
% PJ
OECD ASIA OCEANIA
2009
2050
0.09
1.06M
32
396
2009
2050
45M
612
% PJ
11 2,556
3,686
kWh kWh
REF E[R]
% PJ
GLOBAL
2009
2050
0.20
1.27
983
10,219
2009
2050
42
310
% PJ
10 49,571
1,502
kWh kWh
REF E[R]
% PJ
EAST EUROPE/EURASIA
2009
2050
0.00
0.52
2
360
2009
2050
2
322
% PJ
16H 5,884
5,044H
kWh kWh
REF E[R]
% PJ
CHINA
2009
2050
0.10M
1.52
97M
2,756
2009
2050
20
537M
% PJ
11 11,284H
2,402M
kWh kWh
REF E[R]
% PJ
MIDDLE EAST
2009
2050
0.00L
0.26L
1L
133L
2009
2050
1L
105
% PJ
10M 2,718
2,109
kWh kWh
REF E[R]
% PJ
OECD EUROPE
2009
2050
0.65H
3.57H
485H
2,894H
2009
2050
250H
1,399H
% PJ
12 5,347
2,476
kWh kWh
REF E[R]
E[R] wind
REF wind
2009
2010
2020
2030
2040
2050
5,500
5,000
4,500
4,000
3,500
3,000
2,500
2,000
1,500
1,000
500
0
GW
YEARS 2009 - 2050
CAPACITYcomparison between the REF and E[R]scenarios 2009 - 2050[electricity]
GW
SOURCE GPI/GWEC
2009
2015
2020
2030
2040
2050
400,000
350,000
300,000
250,000
200,000
150,000
100,000
50,000
0
PJ
YEARS 2009 - 2050
PRODUCTIONcomparison between the REF and E[R]scenarios 2009 - 2050[primary energy]
PJ
SOURCE GPI/GWEC
14%14%
17%
14%
14%14%
41%
15%
63%
16%
82%E[R] renewables
% renewable share
E[R] wind
% total wind share
REF renewables
% renewable share
REF wind
% total wind share
0.2%0.2%
0.9%0.5%
2%
0.7% 0.9%
4.8%
1.1%
7.7%
1.3%
10.3%
23%
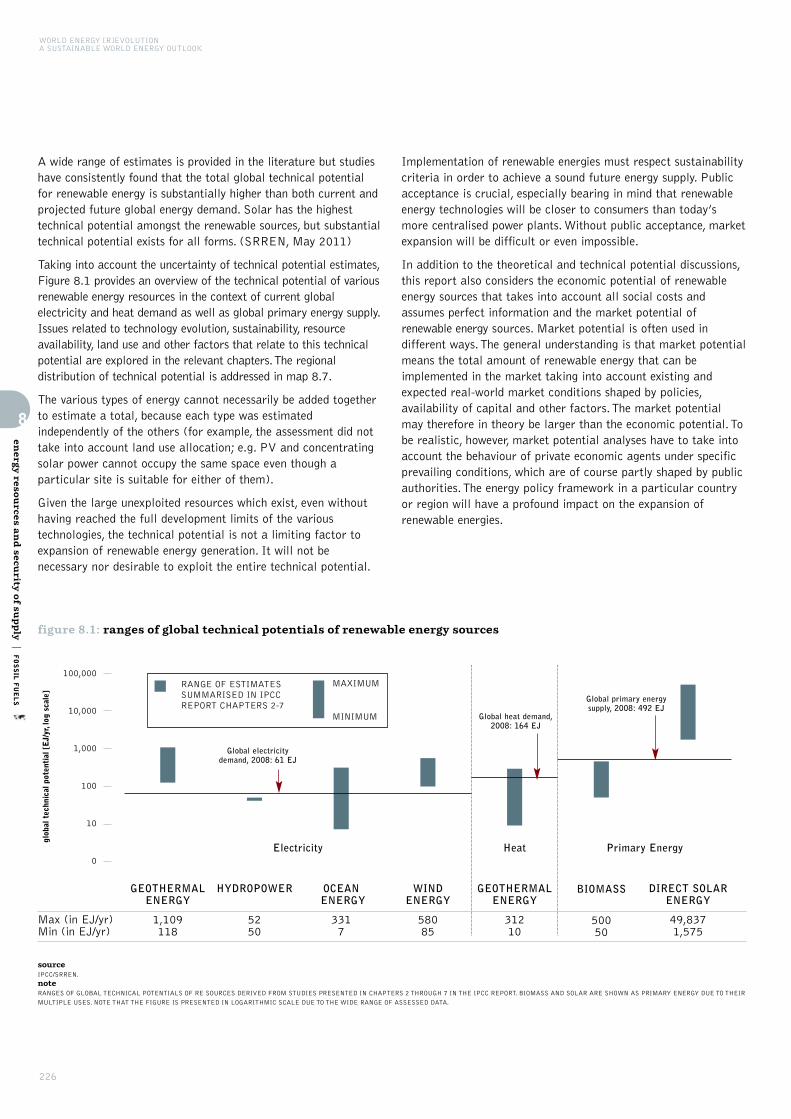
WORLD ENERGY [R]EVOLUTIONA SUSTAINABLE WORLD ENERGY OUTLOOK
226
8
energ
y resources a
nd secu
rity of su
pply
|FOSSIL FUELS
A wide range of estimates is provided in the literature but studieshave consistently found that the total global technical potentialfor renewable energy is substantially higher than both current andprojected future global energy demand. Solar has the highesttechnical potential amongst the renewable sources, but substantialtechnical potential exists for all forms. (SRREN, May 2011)
Taking into account the uncertainty of technical potential estimates,Figure 8.1 provides an overview of the technical potential of variousrenewable energy resources in the context of current globalelectricity and heat demand as well as global primary energy supply.Issues related to technology evolution, sustainability, resourceavailability, land use and other factors that relate to this technicalpotential are explored in the relevant chapters. The regionaldistribution of technical potential is addressed in map 8.7.
The various types of energy cannot necessarily be added togetherto estimate a total, because each type was estimatedindependently of the others (for example, the assessment did nottake into account land use allocation; e.g. PV and concentratingsolar power cannot occupy the same space even though aparticular site is suitable for either of them).
Given the large unexploited resources which exist, even withouthaving reached the full development limits of the varioustechnologies, the technical potential is not a limiting factor toexpansion of renewable energy generation. It will not benecessary nor desirable to exploit the entire technical potential.
Implementation of renewable energies must respect sustainabilitycriteria in order to achieve a sound future energy supply. Publicacceptance is crucial, especially bearing in mind that renewableenergy technologies will be closer to consumers than today’smore centralised power plants. Without public acceptance, marketexpansion will be difficult or even impossible.
In addition to the theoretical and technical potential discussions,this report also considers the economic potential of renewableenergy sources that takes into account all social costs andassumes perfect information and the market potential ofrenewable energy sources. Market potential is often used indifferent ways. The general understanding is that market potentialmeans the total amount of renewable energy that can beimplemented in the market taking into account existing andexpected real-world market conditions shaped by policies,availability of capital and other factors. The market potentialmay therefore in theory be larger than the economic potential. Tobe realistic, however, market potential analyses have to take intoaccount the behaviour of private economic agents under specificprevailing conditions, which are of course partly shaped by publicauthorities. The energy policy framework in a particular countryor region will have a profound impact on the expansion ofrenewable energies.
figure 8.1: ranges of global technical potentials of renewable energy sources
sourceIPCC/SRREN.
noteRANGES OF GLOBAL TECHNICAL POTENTIALS OF RE SOURCES DERIVED FROM STUDIES PRESENTED IN CHAPTERS 2 THROUGH 7 IN THE IPCC REPORT. BIOMASS AND SOLAR ARE SHOWN AS PRIMARY ENERGY DUE TO THEIR
MULTIPLE USES. NOTE THAT THE FIGURE IS PRESENTED IN LOGARITHMIC SCALE DUE TO THE WIDE RANGE OF ASSESSED DATA.
global technical potential [EJ/yr, log scale]
100,000
10,000
1,000
100
10
0
RANGE OF ESTIMATESSUMMARISED IN IPCCREPORT CHAPTERS 2-7
Global electricitydemand, 2008: 61 EJ
Global primary energysupply, 2008: 492 EJ
Global heat demand,2008: 164 EJ
MAXIMUM
MINIMUM
Max (in EJ/yr)Min (in EJ/yr)
GEOTHERMALENERGY
1,109118
HYDROPOWER
5250
OCEANENERGY
3317
WIND ENERGY
58085
GEOTHERMALENERGY
31210
Heat Primary EnergyElectricity
BIOMASS
50050
DIRECT SOLARENERGY
49,8371,575

227
8
energ
y resources a
nd secu
rity of su
pply
|FOSSIL FUELS, N
UCLEAR
map 8
.7:reg
ional ren
ewable en
ergy p
oten
tial
source
IPCC/SRREN. RE POTENTIAL ANALYSIS: TECHNICAL RE POTENTIALS REPORTED HERE REPRESENT TOTA
L WORLDWIDE AND REGIONAL POTENTIALS BASED ON A REVIEW OF ST
UDIES PUBLISHED BEFORE 2009 B
Y KREWITT ET AL. (2009). T
HEY DO NOT DEDUCT ANY POTENTIAL THAT
IS ALREADY BEING UTILIZED FOR ENERGY PRODUCTION. DUE TO METHODOLOGICAL DIFFERENCES AND ACCOUNTING METHODS AMONG ST
UDIES, ST
RICT COMPARABILITY OF THESE ESTIMATES ACROSS TECHNOLOGIES AND REGIONS, AS WELL AS TO PRIMARY ENERGY DEMAND, IS
NOT POSSIBLE. TECHNICAL RE POTENTIAL ANALYSES PUBLISHED AFTER 2009 S
HOW HIGHER RESULTS IN
SOME CASES BUT ARE NOT IN
CLUDED IN
THIS FIGURE. HOWEVER, SOME RE TECHNOLOGIES MAY COMPETE FOR LAND WHICH COULD LOWER THE OVERALL RE POTENTIAL.
SCENARIO DATA: IE
A WEO 2009 R
EFERENCE SCENARIO (IN
TERNATIONAL ENERGY AGENCY (IE
A), 2009; T
ESKE ET AL., 2010), R
EMIND-RECIPE 450P
PM STA
BILIZATION SCENARIO (LUDERER ET AL., 2009), M
INICAM EMF22 1ST-B
EST 2.6 W
/2 OVERSHOOT SCENARIO (CALVIN ET AL.,
2009), ADVANCED ENERGY [R
]EVOLUTION 2010 (T
ESKE ET AL., 2010.
0-2
.52
.6-5
.05
.1-7
.57
.6-1
01
0-1
2.5
12
.6-1
51
5.1
-17
.51
7.6
-20
20
.1-2
2.5
22
.6-2
52
5-5
0over 5
0
Map: Technical R
E
Potential can supply
the 2007 primary energy
demand by a factor of:
761 EJ/y
5,360 EJ/y
1,335 EJ/y
193 EJ/y
306 EJ/y464 E
J/y
193 EJ/y
571 EJ/y
864 EJ/y
1,911 EJ/y
World 11,941 E
J/y
Total Technical RE
Potential
in EJ/y for 2050 by
renewable energy source:
Solar
Wind
Geotherm
al
Hydro
Ocean
Bio energy
X E
J/y
WORLD ENERGY [R]EVOLUTIONA SUSTAINABLE WORLD ENERGY OUTLOOK
228
8
energ
y resources a
nd secu
rity of su
pply
|BIOMASS IN
THE 2012 ENERGY [R
]EVOLUTION
8.6 biomass in the 2012 energy [r]evolution (4th edition)
The 2012 Energy [R]evolution (4th edn.) is an energy scenariowhich shows a possible pathway for the global energy system tomove from fossil fuels dominated supply towards energy efficiencyand sustainable renewable energy use. The aim is to only usesustainable bio energy and reduce the use of unsustainable bioenergy in developing countries which is currently in the range of30 to 40 EJ/a. The fourth edition of the Energy [R]evolutionagain decreases the amount of bio energy used significantly dueto sustainability reasons, and the lack of global environmentaland social standards. The amount of bio energy used in thisreport is based on bio energy potential surveys which are drawnfrom existing studies, but not necessarily reflecting all theecological assumptions that Greenpeace would use. It is intendedas a coarse-scale, “order-of-magnitude” example of what theenergy mix would look like in the future (2050) with largelyphased-out fossil fuels. The rationale underpinning the use ofbiomass in the 2012 Energy [R]evolution is explained here butnote the amount of bio energy used in the Energy [R]evolutiondoes not mean that Greenpeace per se agrees to the amountwithout strict criteria.
The Energy [R]evolution takes a precautionary approach to thefuture use of bioenergy. This reflects growing concerns about thegreenhouse gas balance of many biofuel sources, and also the risksposed by expanded bio fuels crop production to biodiversity(forests, wetlands and grasslands) and food security. It should bestressed, however, that this conservative approach is based on anassessment of today’s technologies and their associated risks. Thedevelopment of advanced forms of bio energies which do notinvolve significant land take, are demonstrably sustainable in termsof their impacts on the wider environment, and have cleargreenhouse gas benefits, should be an objective of public policy, andwould provide additional flexibility in the renewable energy mix.
All energy production has some impact on the environment. Whatis important is to minimize the impact on the environment,through reduction in energy usage, increased efficiency andcareful choice of renewable energy sources. Different sources ofenergy have different impacts and these impacts can varyenormously with scale. Hence, a range of energy sources areneeded, each with its own limits of what is sustainable.
Biomass is part of the mix of a wide variety of sustainable energiesthat, together, provide a practical and possible means to eliminateour dependency on fossil fuels. Thereby we can minimize greenhousegas emissions, especially from fossil carbon, from energy production.Concerns have also been raised about how countries account for theemissions associated with biofuels production and combustion. Thelifecycle emissions of different biofuels can vary enormously. Toensure that biofuels are produced and used in ways which maximizeits greenhouse gas saving potential, these accounting problems willneed to be resolved in future. The Energy [R]evolution prioritisesnon-combustion resources (wind, solar etc.). Greenpeace does notconsider biomass as carbon, or greenhouse gas, neutral because ofthe time biomass takes to regrow and because of emissions arisingfrom direct and indirect land use changes. The Energy [R]evolutionscenario is an energy scenario, therefore only energy related CO2
emissions are calculated and no other GHG emissions can becovered, e.g. from agricultural practices. However, the Energy[R]evolution summarizes the entire amount of bio energy used inthe energy model and indicates possible additional emissionsconnected to the use of biofuels. As there are many scientificpublications about the GHG emission effects of bio energy whichvary between carbon neutral to higher CO2 emissions than fossilfuels a range is given in the Energy [R]evolution.
Bioenergy in the Energy [R]evolution scenario is largely limitedto that which can be gained from wood processing andagricultural (crop harvest and processing) residues as well asfrom discarded wood products. The amounts are based on existingstudies, some of which apply sustainability criteria but do notnecessarily reflect all Greenpeace’s sustainability criteria. Large-scale biomass from forests would not be sustainable.79 The Energy[R]evolution recognises that there are competing uses forbiomass, e.g. maintaining soil fertility, use of straw as animal feedand bedding, use of woodchip in furniture and does not use thefull potential. Importantly, the use of biomass in the 2012 Energy[R]evolution has been developed within the context ofGreenpeace’s broader Bioenergy Position to minimize and avoidthe growth of bio energy and in order to prevent use ofunsustainable bio energy. The Energy [R]evolution uses the latestavailable bio energy technologies for power and heat generation,as well as transport systems. These technologies can use differenttypes of fuel and bio gas is preferred due to higher conversionefficiencies. Therefore the primary source for bio mass is not fixedand can be changed over time. Of course, any individual bioenergyproject developed in reality needs to be thoroughly researched toensure our sustainability criteria are met.
Greenpeace supports the most efficient use of biomass in stationaryapplications. For example, the use of agricultural and woodprocessing residues in, preferably regional and efficient cogenerationpower plants, such as CHP (combined heat and power plants).
reference79 SCHULZE, E-D., KÖRNER, C., LAW, B.E .HABERL, H. & LUYSSAERT, S. 2012. LARGE-SCALE BIOENERGY
FROM ADDITIONAL HARVEST OF FOREST BIOMASS IS NEITHER SUSTAINABLE NOR GREENHOUSE GAS
NEUTRAL. GLOBAL CHANGE BIOLOGY BIOENERGY DOI: 10.1111/J.1757-1707.2012.01169.X.
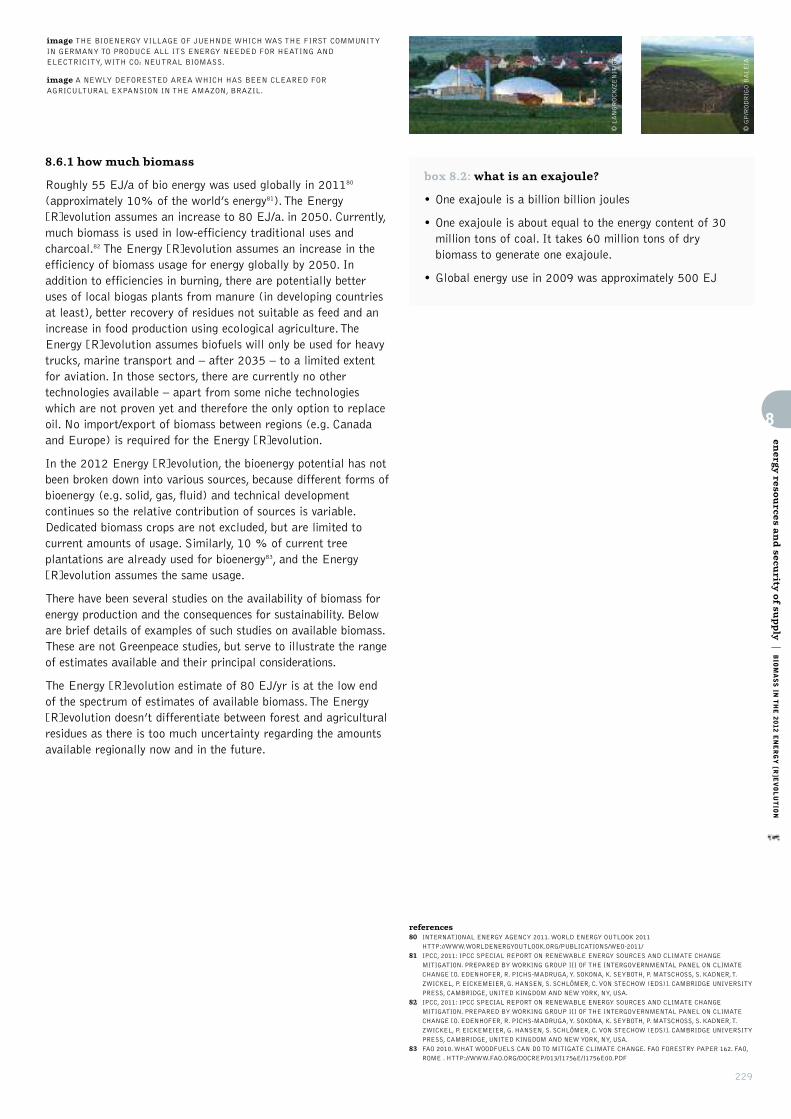
229
8
energ
y resources a
nd secu
rity of su
pply
|BIOMASS IN
THE 2012 ENERGY [R
]EVOLUTION
8.6.1 how much biomass
Roughly 55 EJ/a of bio energy was used globally in 201180
(approximately 10% of the world’s energy81). The Energy[R]evolution assumes an increase to 80 EJ/a. in 2050. Currently,much biomass is used in low-efficiency traditional uses andcharcoal.82 The Energy [R]evolution assumes an increase in theefficiency of biomass usage for energy globally by 2050. Inaddition to efficiencies in burning, there are potentially betteruses of local biogas plants from manure (in developing countriesat least), better recovery of residues not suitable as feed and anincrease in food production using ecological agriculture. TheEnergy [R]evolution assumes biofuels will only be used for heavytrucks, marine transport and – after 2035 – to a limited extentfor aviation. In those sectors, there are currently no othertechnologies available – apart from some niche technologieswhich are not proven yet and therefore the only option to replaceoil. No import/export of biomass between regions (e.g. Canadaand Europe) is required for the Energy [R]evolution.
In the 2012 Energy [R]evolution, the bioenergy potential has notbeen broken down into various sources, because different forms ofbioenergy (e.g. solid, gas, fluid) and technical developmentcontinues so the relative contribution of sources is variable.Dedicated biomass crops are not excluded, but are limited tocurrent amounts of usage. Similarly, 10 % of current treeplantations are already used for bioenergy83, and the Energy[R]evolution assumes the same usage.
There have been several studies on the availability of biomass forenergy production and the consequences for sustainability. Beloware brief details of examples of such studies on available biomass.These are not Greenpeace studies, but serve to illustrate the rangeof estimates available and their principal considerations.
The Energy [R]evolution estimate of 80 EJ/yr is at the low endof the spectrum of estimates of available biomass. The Energy[R]evolution doesn’t differentiate between forest and agriculturalresidues as there is too much uncertainty regarding the amountsavailable regionally now and in the future.
box 8.2: what is an exajoule?
• One exajoule is a billion billion joules
• One exajoule is about equal to the energy content of 30million tons of coal. It takes 60 million tons of drybiomass to generate one exajoule.
• Global energy use in 2009 was approximately 500 EJ
references80 INTERNATIONAL ENERGY AGENCY 2011. WORLD ENERGY OUTLOOK 2011
HTTP://WWW.WORLDENERGYOUTLOOK.ORG/PUBLICATIONS/WEO-2011/
81 IPCC, 2011: IPCC SPECIAL REPORT ON RENEWABLE ENERGY SOURCES AND CLIMATE CHANGE
MITIGATION. PREPARED BY WORKING GROUP III OF THE INTERGOVERNMENTAL PANEL ON CLIMATE
CHANGE [O. EDENHOFER, R. PICHS-MADRUGA, Y. SOKONA, K. SEYBOTH, P. MATSCHOSS, S. KADNER, T.
ZWICKEL, P. EICKEMEIER, G. HANSEN, S. SCHLÖMER, C. VON STECHOW (EDS)]. CAMBRIDGE UNIVERSITY
PRESS, CAMBRIDGE, UNITED KINGDOM AND NEW YORK, NY, USA.
82 IPCC, 2011: IPCC SPECIAL REPORT ON RENEWABLE ENERGY SOURCES AND CLIMATE CHANGE
MITIGATION. PREPARED BY WORKING GROUP III OF THE INTERGOVERNMENTAL PANEL ON CLIMATE
CHANGE [O. EDENHOFER, R. PICHS-MADRUGA, Y. SOKONA, K. SEYBOTH, P. MATSCHOSS, S. KADNER, T.
ZWICKEL, P. EICKEMEIER, G. HANSEN, S. SCHLÖMER, C. VON STECHOW (EDS)]. CAMBRIDGE UNIVERSITY
PRESS, CAMBRIDGE, UNITED KINGDOM AND NEW YORK, NY, USA.
83 FAO 2010. WHAT WOODFUELS CAN DO TO MITIGATE CLIMATE CHANGE. FAO FORESTRY PAPER 162. FAO,
ROME . HTTP://WWW.FAO.ORG/DOCREP/013/I1756E/I1756E00.PDF
© GP/RODRIGO BALÉIA
image THE BIOENERGY VILLAGE OF JUEHNDE WHICH WAS THE FIRST COMMUNITYIN GERMANY TO PRODUCE ALL ITS ENERGY NEEDED FOR HEATING ANDELECTRICITY, WITH CO2 NEUTRAL BIOMASS.
image A NEWLY DEFORESTED AREA WHICH HAS BEEN CLEARED FORAGRICULTURAL EXPANSION IN THE AMAZON, BRAZIL.
© LANGROCK/ZENIT/GP
WORLD ENERGY [R]EVOLUTIONA SUSTAINABLE WORLD ENERGY OUTLOOK
230
8
energ
y resources a
nd secu
rity of su
pply
|BIOMASS IN
THE 2012 ENERGY [R
]EVOLUTION
Current studies estimating the amount of biomass give the following ranges:
• IPCC (2011) pg. 223. Estimates “From the expert review ofavailable scientific literature, potential deployment levels ofbiomass for energy by 2050 could be in the range of 100 to300 EJ. However, there are large uncertainties in this potentialsuch as market and policy conditions, and it strongly dependson the rate of improvement in the production of food andfodder as well as wood and pulp products.”
• WWF (2011) Ecofys Energy Scenario (for WWF) found a2050 total potential of 209 EJ per year with a share ofwaste/residue-based bioenergy of 101 EJ per year (for 2050),a quarter of which is agricultural residues like cereal straw.Other major sources include wet waste/residues like sugar beet/potato, oil palm, sugar cane/cassava processing residues ormanure (35 EJ), wood processing residues and wood waste (20EJ) and non-recyclable renewable dry municipal solid waste(11 EJ).84 However, it’s not always clear how some of thenumbers were calculated.
• Beringer et al. (2011) estimate a global bioenergy potential of130-270 EJ per year in 2050 of which 100 EJ per year iswaste/residue based.85
• WBGU (2009) estimate a global bioenergy potential of 80-170 EJ per year in 2050 of which 50 EJ per year iswaste/residue based.86
• Deutsches Biomasse Forschungs Zentrum (DBFZ), 2008 did asurvey for Greenpeace International where the sustainable bioenergy potentials for residuals have been estimated at 87.6EJ/a and energy crops at a level of 10 to 15 EJ/a (dependingon the assumptions for food production). The DBFZ technicaland sustainable potential for growing energy crops has beencalculated on the assumption that demand for food takespriority. As a first step the demand for arable and grassland forfood production has been calculated for each of 133 countriesin different scenarios. These scenarios are:
Business as usual (BAU) scenario: Present agriculturalactivity continues for the foreseeable future
Basic scenario: No forest clearing; reduced use of fallowareas for agriculture
Sub-scenario 1: Basic scenario plus expanded ecologicalprotection areas and reduced crop yields
Sub-scenario 2: Basic scenario plus food consumptionreduced in industrialised countries
Sub-scenario 3: Combination of sub-scenarios 1 and 2.
In a next step the surpluses of agricultural areas were classifiedeither as arable land or grassland. On grassland, hay and grasssilage are produced, on arable land fodder silage and ShortRotation Coppice (such as fast-growing willow or poplar) arecultivated. Silage of green fodder and grass are assumed to beused for biogas production, wood from SRC and hay fromgrasslands for the production of heat, electricity and syntheticfuels. Country specific yield variations were taken intoconsideration. The result is that the global biomass potential fromenergy crops in 2050 falls within a range from 6 EJ in Sub-scenario 1 up to 97 EJ in the BAU scenario.
Greenpeace’s vision of ecological agriculture means that lowinput agriculture is not an option, but a pre-requisite. This meansstrongly reduced dependence on capital intensive inputs. The shiftto eco-ag increases the importance of agricultural residues assynthetic fertilisers are phased out and animal feed productionand water use (irrigation and other) are reduced. We will needoptimal use of residues as fertilizer, animal feed, and to increasesoil organic carbon and the water retention function of the soilsetc. to make agriculture more resilient to climate impacts(droughts, floods) and to help mitigate climate change.
references84 WWF 2011. WWF ENERGY REPORT 2011. PRODUCED IN COLLABORATION WITH ECOFYS AND OMA.
HTTP://WWF.PANDA.ORG/WHAT_WE_DO/FOOTPRINT/CLIMATE_CARBON_ENERGY/ENERGY_SOLUTIONS/RE
NEWABLE_ENERGY/SUSTAINABLE_ENERGY_REPORT/. SOURCES FOR BIOENERGY ARE ON PGS. 183-18.
85 BERINGER, T. ET AL. 2011. BIOENERGY PRODUCTION POTENTIAL OF GLOBAL BIOMASS PLANTATIONS
UNDER ENVIRONMENTAL AND AGRICULTURAL CONSTRAINTS. GCB BIOENERGY, 3:299–312.
DOI:10.1111/J.1757-1707.2010.01088.X
86 WBGU 2009. FUTURE BIOENERGY AND SUSTAINABLE LAND USE. EARTHSCAN, LONDON AND STERLING, VA

231
GLOBAL SCENARIO FOSSIL FUEL TECHNOLOGIES NUCLEAR TECHNOLOGIES RENEWABLE ENERGYTECHNOLOGIES
energy technologies
99image THE GREAT BARRIER REEF CAN BE SEEN FROM OUTER SPACE AND IS THE WORLD’S BIGGEST SINGLE STRUCTURE MADE BY LIVING ORGANISMS. THIS REEF STRUCTURE ISCOMPOSED OF AND BUILT BY BILLIONS OF TINY ORGANISMS, KNOWN AS CORAL POLYPS. IT SUPPORTS A WIDE DIVERSITY OF LIFE AND WAS SELECTED AS A WORLD HERITAGE SITE IN 1981.
thetechnology is here, all we need is political will.”
“
© DIGITAL GLOBE

WORLD ENERGY [R]EVOLUTIONA SUSTAINABLE WORLD ENERGY OUTLOOK
9
energ
y technolo
gies
|FOSSIL FUEL TECHNOLOGIES
232
This chapter describes the range of technologies available nowand in the future to satisfy the world’s energy demand. TheEnergy [R]evolution scenario is focused on the potential forenergy savings and renewable sources, primarily in the electricityand heat generating sectors.
9.1 fossil fuel technologies
The most commonly used fossil fuels for power generation aroundthe world are coal and gas. Oil is still used where other fuels arenot readily available, for example islands or remote sites, orwhere there is an indigenous resource. Together, coal and gascurrently account for over half of global electricity supply.
9.1.1 coal combustion technologies
In a conventional coal-fired power station, pulverised or powderedcoal is blown into a combustion chamber where it is burned athigh temperature. The resulting heat is used to convert waterflowing through pipes lining the boiler into steam. This drives asteam turbine and generates electricity. Over 90% of global coal-fired capacity uses this system. Coal power stations can vary incapacity from a few hundred megawatts up to several thousand.
A number of technologies have been introduced to improve theenvironmental performance of conventional coal combustion.These include coal cleaning (to reduce the ash content) andvarious ‘bolt-on’ or ‘end-of-pipe’ technologies to reduce emissionsof particulates, sulphur dioxide and nitrogen oxide, the mainpollutants resulting from coal firing apart from carbon dioxide.Flue gas desulphurisation (FGD), for example, most commonlyinvolves ‘scrubbing’ the flue gases using an alkaline sorbentslurry, which is predominantly lime or limestone based.
More fundamental changes have been made to the way coal isburned both to improve its efficiency and further reduceemissions of pollutants. These include:
• Integrated Gasification Combined Cycle: Coal is not burneddirectly but reacted with oxygen and steam to form a syntheticgas composed mainly of hydrogen and carbon monoxide. This iscleaned and then burned in a gas turbine to generate electricityand produce steam to drive a steam turbine. IGCC improves theefficiency of coal combustion from 38-40% up to 50%.
• Supercritical and Ultrasupercritical: These power plants operateat higher temperatures than conventional combustion, againincreasing efficiency towards 50%.
• Fluidised Bed Combustion: Coal is burned in a reactorcomprised of a bed through which gas is fed to keep the fuel ina turbulent state. This improves combustion, heat transfer andthe recovery of waste products. By elevating pressures within abed, a high-pressure gas stream can be used to drive a gasturbine, generating electricity. Emissions of both sulphur dioxideand nitrogen oxide can be reduced substantially.
• Pressurised Pulverised Coal Combustion: Mainly beingdeveloped in Germany, this is based on the combustion of afinely ground cloud of coal particles creating high pressure,
high temperature steam for power generation. The hot fluegases are used to generate electricity in a similar way to thecombined cycle system.
Other potential future technologies involve the increased use ofcoal gasification. Underground Coal Gasification, for example,involves converting deep underground unworked coal into acombustible gas which can be used for industrial heating, powergeneration or the manufacture of hydrogen, synthetic natural gasor other chemicals. The gas can be processed to remove CO2
before it is passed on to end users. Demonstration projects areunderway in Australia, Europe, China and Japan.
9.1.2 gas combustion technologies
Natural gas can be used for electricity generation through the useof either gas or steam turbines. For the equivalent amount ofheat, gas produces about 45% less carbon dioxide during itscombustion than coal.
Gas turbine plants use the heat from gases to directly operate theturbine. Natural gas fuelled turbines can start rapidly, and aretherefore often used to supply energy during periods of peakdemand, although at higher cost than baseload plants.
Particularly high efficiencies can be achieved through combininggas turbines with a steam turbine in combined cycle mode. In acombined cycle gas turbine (CCGT) plant, a gas turbinegenerator produces electricity and the exhaust gases from theturbine are then used to make steam to generate additionalelectricity. The efficiency of modern CCGT power stations can bemore than 50%. Most new gas power plants built since the1990s have been of this type.
At least until the recent increase in global gas prices, CCGTpower stations have been the cheapest option for electricitygeneration in many countries. Capital costs have beensubstantially lower than for coal and nuclear plants andconstruction time shorter.
9.1.3 carbon reduction technologies
Whenever a fossil fuel is burned, carbon dioxide (CO2) isproduced. Depending on the type of power plant, a large quantityof the gas will dissipate into the atmosphere and contribute toclimate change. A hard coal power plant discharges roughly 720grammes of carbon dioxide per kilowatt hour, a modern gas-firedplant about 370g CO2/kWh. One method, currently underdevelopment, to mitigate the CO2 impact of fossil fuel combustionis called carbon capture and storage (CCS). It involves capturingCO2 from power plant smokestacks, compressing the captured gasfor transport via pipeline or ship and pumping it intounderground geological formations for permanent storage.
While frequently touted as the solution to the carbon probleminherent in fossil fuel combustion, CCS for coal-fired powerstations is unlikely to be ready for at least another decade.Despite the ‘proof of concept’ experiments currently in progress,the technology remains unproven as a fully integrated process in

energ
y technolo
gies
|FOSSIL FUEL TECHNOLOGIES
233
relation to all of its operational components. Suitable andeffective capture technology has not been developed and isunlikely to be commercially available any time soon; effective andsafe long-term storage on the scale necessary has not beendemonstrated; and serious concerns attach to the safety aspectsof transport and injection of CO2 into designated formations,while long term retention cannot reliably be assured.
Deploying the technology on coal power plants is likely to doubleconstruction costs, increase fuel consumption by 10-40%, consumemore water, generate more pollutants and ultimately require thepublic sector to ensure that the CO2 stays where it has been buried.In a similar way to the disposal of nuclear waste, CCS envisagescreating a scheme whereby future generations monitor inperpetuity the climate pollution produced by their predecessors.
9.1.4 carbon dioxide storage
In order to benefit the climate, captured CO2 has to be storedsomewhere permanently. Current thinking is that it can bepumped under the earth’s surface at a depth of over 3,000 feetinto geological formations, such as saline aquifers. However, thevolume of CO2 that would need to be captured and stored isenormous - a single coal-fired power plant can produce 7 milliontonnes of CO2 annually. It is estimated that a single ‘stabilisationwedge’ of CCS (enough to reduce carbon emissions by 1 billionmetric tons per year by 2050) would require a flow of CO2 intothe ground equal to the current flow out of the ground - and inaddition to the associated infrastructure to compress, transportand pump it underground. It is still not clear that it will betechnically feasible to capture and bury this much carbon, both interms of the number of storage sites and whether they will belocated close enough to power plants.
Even if it is feasible to bury hundreds of thousands of megatonsof CO2 there is no way to guarantee that storage locations will beappropriately designed and managed over the timescalesrequired. The world has limited experience of storing CO2
underground; the longest running storage project at Sleipner inthe Norweigian North Sea began operation only in 1996. This isparticularly concerning because as long as CO2 is present ingeological sites, there is a risk of leakage. Although leakages areunlikely to occur in well managed and monitored sites, permanentstorage stability cannot be guaranteed since tectonic activity andnatural leakage over long timeframes are impossible to predict.
Sudden leakage of CO2 can be fatal. Carbon dioxide is not itselfpoisonous, and is contained (approx. 0.04 %) in the air webreathe. But as concentrations increase it displaces the vitaloxygen in the air. Air with concentrations of 7 to 8% CO2 byvolume causes death by suffocation after 30 to 60 minutes.
There are also health hazards when large amounts of CO2 areexplosively released. Although the gas normally disperses quicklyafter leaking, it can accumulate in depressions in the landscapeor closed buildings, since carbon dioxide is heavier than air. It isequally dangerous when it escapes more slowly and without beingnoticed in residential areas, for example in cellars below houses.
The dangers from such leaks are known from natural volcanicCO2 degassing. Gas escaping at the Lake Nyos crater lake inCameroon, Africa in 1986 killed over 1,700 people. At least tenpeople have died in the Lazio region of Italy in the last 20 yearsas a result of CO2 being released.
9.1.5 carbon storage and climate change targets
Can carbon storage contribute to climate change reductiontargets? In order to avoid dangerous climate change, globalgreenhouse gas emissions need to peak by between 2015 and2020 and fall dramatically thereafter. However, power plantscapable of capturing and storing CO2 are still being developedand won’t become a reality for at least another decade, if ever.This means that even if CCS works, the technology would notmake any substantial contribution towards protecting the climatebefore 2020.
Power plant CO2 storage will also not be of any great help inattaining the goal of at least an 80% greenhouse gas reductionby 2050 in OECD countries. Even if CCS were to be available in2020, most of the world’s new power plants will have justfinished being modernised. All that could then be done would befor existing power plants to be retrofitted and CO2 captured fromthe waste gas flow. Retrofitting power plants would be anextremely expensive exercise. ‘Capture ready’ power plants areequally unlikely to increase the likelihood of retrofitting existingfleets with capture technology.
The conclusion reached in the Energy [R]evolution scenario isthat renewable energy sources are already available, in manycases cheaper, and lack the negative environmental impactsassociated with fossil fuel exploitation, transport and processing.It is renewable energy together with energy efficiency and energyconservation – and not carbon capture and storage – that has toincrease worldwide so that the primary cause of climate change –the burning of fossil fuels like coal, oil and gas – is stopped.
Greenpeace opposes any CCS efforts which lead to:
• public financial support to CCS at the expense of fundingrenewable energy development and investment in energy efficiency.
• stagnation of renewable energy, energy efficiency and energyconservation improvements.
• inclusion of CCS in the Kyoto Protocol’s Clean DevelopmentMechanism (CDM) as it would divert funds away from thestated intention of the mechanism, and cannot be consideredclean development under any coherent definition of this term.
• promotion of this possible future technology as the only majorsolution to climate change, thereby leading to new fossil fueldevelopments – especially lignite and black coal-fired powerplants, and an increase in emissions in the short to medium term.
© ARNOLD/VISUM/GP
image BROWN COAL SURFACE MINING IN HAMBACH,GERMANY. GIANT COAL EXCAVATOR AND SPOIL PILE.
9

WORLD ENERGY [R]EVOLUTIONA SUSTAINABLE WORLD ENERGY OUTLOOK
234
9.2 nuclear technologies
Generating electricity from nuclear power involves transferringthe heat produced by a controlled nuclear fission reaction into aconventional steam turbine generator. The nuclear reaction takesplace inside a core and surrounded by a containment vessel ofvarying design and structure. Heat is removed from the core by acoolant (gas or water) and the reaction controlled by amoderating element or “moderator”.
Across the world over the last two decades there has been ageneral slowdown in building new nuclear power stations. This hasbeen caused by a variety of factors: fear of a nuclear accident,following the events at Three Mile Island, Chernobyl, Monju andFukushima, increased scrutiny of economics and environmentalfactors, such as waste management and radioactive discharges.
9.2.1 nuclear reactor designs: evolution and safety issues
At the beginning of 2005 there were 441 nuclear power reactorsoperating in 31 countries around the world. Although there aredozens of different reactor designs and sizes, there are threebroad categories either currently deployed or under development.These are:
Generation I: Prototype commercial reactors developed in the1950s and 1960s as modified or enlarged military reactors,originally either for submarine propulsion or plutonium production.
Generation II: Mainstream reactor designs in commercialoperation worldwide.
Generation III: New generation reactors now being built.
Generation III reactors include the so-called Advanced Reactors,three of which are already in operation in Japan, with moreunder construction or planned. About 20 different designs arereported to be under development,87 most of them ‘evolutionary’designs developed from Generation II reactor types with somemodifications, but without introducing drastic changes. Some ofthem represent more innovative approaches. According to theWorld Nuclear Association, reactors of Generation III arecharacterised by the following:
• a standardised design for each type to expedite licensing,reduce capital cost and construction time
• a simpler and more rugged design, making them easier tooperate and less vulnerable to operational upsets
• higher availability and longer operating life, typically 60 years
• reduced possibility of core melt accidents
• minimal effect on the environment
• higher burn-up to reduce fuel use and the amount of waste
• burnable absorbers (‘poisons’) to extend fuel life
To what extent these goals address issues of higher safetystandards, as opposed to improved economics, remains unclear. Of the new reactor types, the European Pressurised WaterReactor (EPR) has been developed from the most recentGeneration II designs to start operation in France and Germany.88
Its stated goals are to improve safety levels - in particular toreduce the probability of a severe accident by a factor of ten,achieve mitigation from severe accidents by restricting theirconsequences to the plant itself, and reduce costs. Compared toits predecessors, however, the EPR displays several modificationswhich constitute a reduction of safety margins, including:
• The volume of the reactor building has been reduced bysimplifying the layout of the emergency core cooling system,and by using the results of new calculations which predict lesshydrogen development during an accident.
• The thermal output of the plant has been increased by 15%relative to existing French reactors by increasing core outlettemperature, letting the main coolant pumps run at highercapacity and modifying the steam generators.
• The EPR has fewer redundant pathways in its safety systemsthan a German Generation II reactor.
Several other modifications are hailed as substantial safetyimprovements, including a ‘core catcher’ system to control ameltdown accident. Nonetheless, in spite of the changes beingenvisaged, there is no guarantee that the safety level of the EPRactually represents a significant improvement. In particular,reduction of the expected core melt probability by a factor of tenis not proven. Furthermore, there are serious doubts as towhether the mitigation and control of a core melt accident withthe core catcher concept will actually work.
Finally, Generation IV reactors are currently being developedwith the aim of commercialisation in 20-30 years.
9
energ
y technolo
gies
|NUCLEAR TECHNOLOGIES
references87 IAEA 2004; WNO 2004A.
88 HAINZ 2004.

235
9.3 renewable energy technologies
Renewable energy covers a range of natural sources which areconstantly renewed and therefore, unlike fossil fuels and uranium,will never be exhausted. Most of them derive from the effect ofthe sun and moon on the earth’s weather patterns. They alsoproduce none of the harmful emissions and pollution associatedwith ‘conventional’ fuels. Although hydroelectric power has beenused on an industrial scale since the middle of the last century,the serious exploitation of other renewable sources has a morerecent history.
9.3.1 solar power (photovoltaics)
There is more than enough solar radiation available all over theworld to satisfy a vastly increased demand for solar powersystems. The sunlight which reaches the earth’s surface is enoughto provide 7,900 times as much energy as we can currently use.On a global average, each square metre of land is exposed toenough sunlight to produce 1,700 kWh of power every year. Theaverage irradiation in Europe is about 1,000 kWh per squaremetre and 1,800 kWh in the Middle East.
Photovoltaic (PV) technology is the generation of electricityfrom light. Photovoltaic systems contain cells that convertsunlight into electricity. Inside each cell there are layers of asemi-conducting material. Light falling on the cell creates anelectric field across the layers, causing electricity to flow. Theintensity of the light determines the amount of electrical powereach cell generates. A photovoltaic system does not need directsunlight in order to operate. It can also generate electricity oncloudy and rainy days but with lower output.
Solar PV is different from a solar thermal collecting system (seebelow) where the sun’s rays are used to generate heat, usually for hotwater in a house, swimming pool, or other domestic applications.
The most important parts of a PV system are the cells whichform the basic building blocks, the modules which bring togetherlarge numbers of cells into a unit, and, in some situations, theinverters used to convert the electricity generated into a formsuitable for everyday use. When a PV installation is described ashaving a capacity of 3 kWp (peak), this refers to the output ofthe system under standard testing conditions, allowingcomparison between different modules. In central Europe a 3kWp rated solar electricity system, with a surface area ofapproximately 27 square metres, would produce enough power tomeet the electricity demand of an energy conscious household.
9
energ
y technolo
gies
|RENEWABLE ENERGY TECHNOLOGIES
box 9.1: definition of renewable energy by the ipcc
“Renewable energy is any form of energy from solar,geophysical or biological sources that is replenished bynatural processes at a rate that equals or exceeds its rateof use. RE is obtained from the continuing or repetitiveflows of energy occurring in the natural environment andincludes resources such as biomass, solar energy,geothermal heat, hydropower, tide and waves and oceanthermal energy, and wind energy. However, it is possible toutilise biomass at a greater rate than it can grow, or todraw heat from a geothermal field at a faster rate thanheat flows can replenish it. On the other hand, the rate ofutilisation of direct solar energy has no bearing on the rateat which it reaches the Earth. Fossil fuels (coal, oil, naturalgas) do not fall under this definition, as they are notreplenished within a time frame that is short relative totheir rate of utilisation.”
sourceIPCC, SPECIAL REPORT RENEWABLE ENERGY /SRREN RENEWABLES FOR POWER GENERATION.
sourceEPIA.
figure 9.2: photovoltaic technology
1. LIGHT (PHOTONS)2. FRONT CONTACT GRID3. ANTI-REFLECTION COATING4. N-TYPE SEMICONDUCTOR5. BOARDER LAYOUT6. P-TYPE SEMICONDUCTOR7. BACK CONTACT
figure 9.1: example of the photovoltaic effect
++
–– N-TYPE SILICON
P-TYPE SILICON
‘HOLE’ FLOW
ELECTRON FLOWPHOTONS
CURRENT
LOAD
JUNCTION
1
+
–
– –
2
3
4
5
6
7
© GP/SOLNESS
image SOLAR PROJECT IN PHITSANULOK, THAILAND. SOLAR FACILITY OF THEINTERNATIONAL INSTITUTE AND SCHOOL FOR RENEWABLE ENERGY.
image SOLAR PANELS ON CONISTON STATION, NORTH WEST OF ALICE SPRINGS,NORTHERN TERRITORY.
© CHRISTIAN KAISER/GP
WORLD ENERGY [R]EVOLUTIONA SUSTAINABLE WORLD ENERGY OUTLOOK
236
There are several different PV technologies and types of installedsystem. PV systems can provide clean power for small or largeapplications. They are already installed and generating energyaround the world on individual homes, housing developments,offices and public buildings.
Today, fully functioning solar PV installations operate in bothbuilt environments and remote areas where it is difficult toconnect to the grid or where there is no energy infrastructure. PVinstallations that operate in isolated locations are known asstand-alone systems. In built areas, PV systems can be mountedon top of roofs (known as Building Adapted PV systems – orBAPV) or can be integrated into the roof or building facade(known as Building Integrated PV systems – or BIPV).
Modern PV systems are not restricted to square and flat panelarrays. They can be curved, flexible and shaped to the building’sdesign. Innovative architects and engineers are constantly findingnew ways to integrate PV into their designs, creating buildingsthat are dynamic, beautiful and provide free, clean energythroughout their life.
Technologies
Crystalline silicon technology: Crystalline silicon cells are madefrom thin slices cut from a single crystal of silicon (monocrystalline) or from a block of silicon crystals (polycrystalline ormulti crystalline). This is the most common technology,representing about 80% of the market today. In addition, thistechnology also exists in the form of ribbon sheets.
Thin film technology: Thin film modules are constructed bydepositing extremely thin layers of photosensitive materials ontoa substrate such as glass, stainless steel or flexible plastic. Thelatter opens up a range of applications, especially for buildingintegration (roof tiles) and end-consumer purposes. Four types ofthin film modules are commercially available at the moment:Amorphous Silicon, Cadmium Telluride, Copper Indium/GalliumDiselenide/Disulphide and multi-junction cells.
Other emerging cell technologies (at the development or earlycommercial stage): These include Concentrated Photovoltaic,consisting of cells built into concentrating collectors that use alens to focus the concentrated sunlight onto the cells, and OrganicSolar Cells, whereby the active material consists at least partiallyof organic dye, small, volatile organic molecules or polymer.
Systems
Industrial and utility-scale power plants: Large industrial PVsystems can produce enormous quantities of electricity at a singlepoint. These types of electricity generation plants can producefrom many hundreds of kilowatts (kW) to several megawatts(MW).The solar panels for industrial systems are usuallymounted on frames on the ground. However, they can also beinstalled on large industrial buildings such as warehouses, airportterminals or railways stations. The system can make double-use ofan urban space and put electricity into the grid where energy-intensive consumers are located.
Residential and commercial systems: Grid Connected Gridconnected are the most popular type of solar PV systems forhomes and businesses in the developed world. Connection to thelocal electricity network, allows any excess power produced to besold to the utility. When solar energy is not available, electricitycan be drawn from the grid. An inverter converts the DC powerproduced by the system to AC power for running normalelectrical equipment. This type of PV system is referred to asbeing ‘on-grid.’ A ‘grid support’ system can be connected to thelocal electricity network as well as a back-up battery. Any excesssolar electricity produced after the battery has been charged isthen sold to the network. This system is ideal for use in areas ofunreliable power supply.
Stand-alone, off-grid systems Off-grid PV systems have noconnection to an electricity grid. An off-grid system usually hasbatteries, so power can still be used at night or after several daysof low sun. An inverter is needed to convert the DC powergenerated into AC power for use in appliances. Typical off-gridapplications are:
• Off-grid systems for rural electrification: Typical off-gridinstallations bring electricity to remote areas or developingcountries. They can be small home systems which cover ahousehold’s basic electricity needs, or larger solar mini-gridswhich provide enough power for several homes, a community orsmall business use.
• Off-grid industrial applications: Off-grid industrial systems areused in remote areas to power repeater stations for mobiletelephones (enabling communications), traffic signals, marinenavigational aids, remote lighting, highway signs and watertreatment plants among others. Both full PV and hybridsystems are used. Hybrid systems are powered by the sun when
9
energ
y technolo
gies
|RENEWABLE ENERGY TECHNOLOGIES
RESIDENTIAL< 10 kWp
-
••
UTILITY-SCALE> 1 MWp
•
COMMERCIAL10 kWp - 100 kWp
-
••
table 9.1: typical type and size of applications per market segment
MARKET SEGMENTTYPE OF APPLICATION
Ground-mountedRoof-topIntegrated to facade/roof
INDUSTRIAL100 kWp - 1 MWp
••-
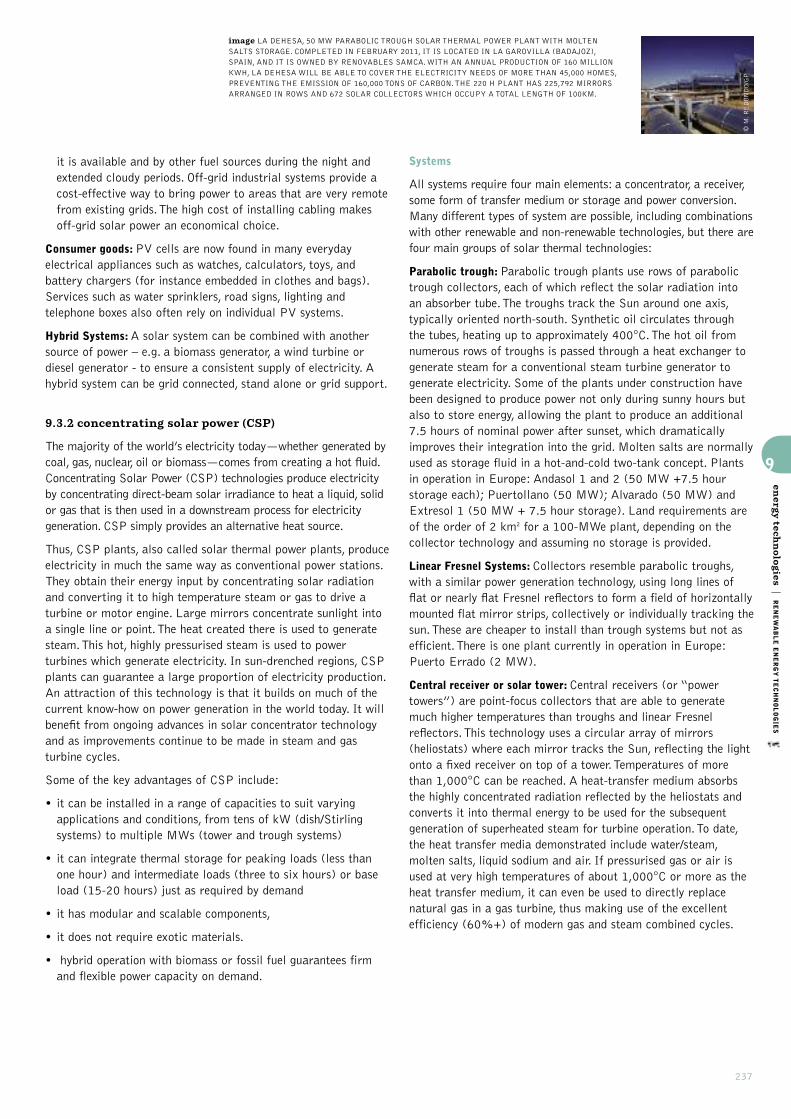
237
it is available and by other fuel sources during the night andextended cloudy periods. Off-grid industrial systems provide acost-effective way to bring power to areas that are very remotefrom existing grids. The high cost of installing cabling makesoff-grid solar power an economical choice.
Consumer goods: PV cells are now found in many everydayelectrical appliances such as watches, calculators, toys, andbattery chargers (for instance embedded in clothes and bags).Services such as water sprinklers, road signs, lighting andtelephone boxes also often rely on individual PV systems.
Hybrid Systems: A solar system can be combined with anothersource of power – e.g. a biomass generator, a wind turbine ordiesel generator - to ensure a consistent supply of electricity. Ahybrid system can be grid connected, stand alone or grid support.
9.3.2 concentrating solar power (CSP)
The majority of the world’s electricity today—whether generated bycoal, gas, nuclear, oil or biomass—comes from creating a hot fluid.Concentrating Solar Power (CSP) technologies produce electricityby concentrating direct-beam solar irradiance to heat a liquid, solidor gas that is then used in a downstream process for electricitygeneration. CSP simply provides an alternative heat source.
Thus, CSP plants, also called solar thermal power plants, produceelectricity in much the same way as conventional power stations.They obtain their energy input by concentrating solar radiationand converting it to high temperature steam or gas to drive aturbine or motor engine. Large mirrors concentrate sunlight intoa single line or point. The heat created there is used to generatesteam. This hot, highly pressurised steam is used to powerturbines which generate electricity. In sun-drenched regions, CSPplants can guarantee a large proportion of electricity production.An attraction of this technology is that it builds on much of thecurrent know-how on power generation in the world today. It willbenefit from ongoing advances in solar concentrator technologyand as improvements continue to be made in steam and gasturbine cycles.
Some of the key advantages of CSP include:
• it can be installed in a range of capacities to suit varyingapplications and conditions, from tens of kW (dish/Stirlingsystems) to multiple MWs (tower and trough systems)
• it can integrate thermal storage for peaking loads (less thanone hour) and intermediate loads (three to six hours) or baseload (15-20 hours) just as required by demand
• it has modular and scalable components,
• it does not require exotic materials.
• hybrid operation with biomass or fossil fuel guarantees firmand flexible power capacity on demand.
Systems
All systems require four main elements: a concentrator, a receiver,some form of transfer medium or storage and power conversion.Many different types of system are possible, including combinationswith other renewable and non-renewable technologies, but there arefour main groups of solar thermal technologies:
Parabolic trough: Parabolic trough plants use rows of parabolictrough collectors, each of which reflect the solar radiation intoan absorber tube. The troughs track the Sun around one axis,typically oriented north-south. Synthetic oil circulates throughthe tubes, heating up to approximately 400°C. The hot oil fromnumerous rows of troughs is passed through a heat exchanger togenerate steam for a conventional steam turbine generator togenerate electricity. Some of the plants under construction havebeen designed to produce power not only during sunny hours butalso to store energy, allowing the plant to produce an additional7.5 hours of nominal power after sunset, which dramaticallyimproves their integration into the grid. Molten salts are normallyused as storage fluid in a hot-and-cold two-tank concept. Plantsin operation in Europe: Andasol 1 and 2 (50 MW +7.5 hourstorage each); Puertollano (50 MW); Alvarado (50 MW) andExtresol 1 (50 MW + 7.5 hour storage). Land requirements areof the order of 2 km2 for a 100-MWe plant, depending on thecollector technology and assuming no storage is provided.
Linear Fresnel Systems: Collectors resemble parabolic troughs,with a similar power generation technology, using long lines offlat or nearly flat Fresnel reflectors to form a field of horizontallymounted flat mirror strips, collectively or individually tracking thesun. These are cheaper to install than trough systems but not asefficient. There is one plant currently in operation in Europe:Puerto Errado (2 MW).
Central receiver or solar tower: Central receivers (or “powertowers”) are point-focus collectors that are able to generatemuch higher temperatures than troughs and linear Fresnelreflectors. This technology uses a circular array of mirrors(heliostats) where each mirror tracks the Sun, reflecting the lightonto a fixed receiver on top of a tower. Temperatures of morethan 1,000°C can be reached. A heat-transfer medium absorbsthe highly concentrated radiation reflected by the heliostats andconverts it into thermal energy to be used for the subsequentgeneration of superheated steam for turbine operation. To date,the heat transfer media demonstrated include water/steam,molten salts, liquid sodium and air. If pressurised gas or air isused at very high temperatures of about 1,000°C or more as theheat transfer medium, it can even be used to directly replacenatural gas in a gas turbine, thus making use of the excellentefficiency (60%+) of modern gas and steam combined cycles.
9
energ
y technolo
gies
|RENEWABLE ENERGY TECHNOLOGIES
© M. REDONDO/GP
image LA DEHESA, 50 MW PARABOLIC TROUGH SOLAR THERMAL POWER PLANT WITH MOLTENSALTS STORAGE. COMPLETED IN FEBRUARY 2011, IT IS LOCATED IN LA GAROVILLA (BADAJOZ),SPAIN, AND IT IS OWNED BY RENOVABLES SAMCA. WITH AN ANNUAL PRODUCTION OF 160 MILLIONKWH, LA DEHESA WILL BE ABLE TO COVER THE ELECTRICITY NEEDS OF MORE THAN 45,000 HOMES,PREVENTING THE EMISSION OF 160,000 TONS OF CARBON. THE 220 H PLANT HAS 225,792 MIRRORSARRANGED IN ROWS AND 672 SOLAR COLLECTORS WHICH OCCUPY A TOTAL LENGTH OF 100KM.

WORLD ENERGY [R]EVOLUTIONA SUSTAINABLE WORLD ENERGY OUTLOOK
238
After an intermediate scaling up to 30 MW capacity, solar towerdevelopers now feel confident that grid-connected tower powerplants can be built up to a capacity of 200 MWe solar-only units.Use of heat storage will increase their flexibility. Although solartower plants are considered to be further from commercialisationthan parabolic trough systems, they have good longer-termprospects for high conversion efficiencies. Projects are beingdeveloped in Spain, South Africa and Australia.
Parabolic dish: A dish-shaped reflector is used to concentratesunlight on to a receiver located at its focal point. The receivermoves with the dish. The concentrated beam radiation is absorbedinto the receiver to heat a fluid or gas to approximately 750°C.This is then used to generate electricity in a small piston, Stirlingengine or micro turbine attached to the receiver. Dishes have beenused to power Stirling engines up to 900°C, and also for steamgeneration. The largest solar dishes have a 485-m2 aperture andare in research facilities or demonstration plants. Currently thecapacity of each Stirling engine is small — in the order of 10 to25 kWelectric. There is now significant operational experience withdish/Stirling engine systems and the technology has been underdevelopment for many years, with advances in dish structures,high-temperature receivers, use of hydrogen as the circulatingworking fluid, as well as some experiments with liquid metals andimprovements in Stirling engines — all bringing the technologycloser to commercial deployment. Although the individual unit sizemay only be of the order of tens of kWe, power stations of up to800 MWe have been proposed by aggregating many modules.Because each dish represents a stand-alone electricity generator,there is great flexibility in the capacity and rate at which units areinstalled to the grid. However, the dish technology is less likely tointegrate thermal storage. The potential of parabolic dishes liesprimarily for decentralised power supply and remote, stand-alonepower systems. Projects are currently planned in the UnitedStates, Australia and Europe.
Thermal Storage: Thermal energy storage integrated into a systemis an important attribute of CSP. Until recently, this has beenprimarily for operational purposes, providing 30 minutes to onehour of full-load storage. This eases the impact of thermaltransients such as clouds on the plant, assists start-up and shut-down, and provides benefits to the grid. Trough plants are nowdesigned for 6 to 7.5 hours of storage, which is enough to allowoperation well into the evening when peak demand can occur andtariffs are high.
In thermal storage, the heat from the solar field is stored beforereaching the turbine. The solar field needs to be oversized so thatenough heat can be supplied to both operate the turbine duringthe day and, charge the thermal storage. Thermal storage forCSP systems needs to be generally between 400°C and 600°C,higher than the temperature of the working fluid. Temperaturesare also dictated by the limits of the media available. Examplesof storage media include molten salt (presently comprisingseparate hot and cold tanks), steam accumulators (for short-termstorage only), solid ceramic particles, high-temperature phase-change materials, graphite, and high-temperature concrete. Theheat can then be drawn from the storage to generate steam for aturbine, when needed. Another type of storage associated withhigh-temperature CSP is thermochemical storage, where solarenergy is stored chemically. Trough plants in Spain are nowoperating with molten-salt storage. In the USA, Abengoa Solar’s280-MW Solana trough project, planned to be operational by2013, intends to integrate six hours of thermal storage. Towers,with their higher temperatures, can charge and store molten saltmore efficiently. Gemasolar, a 19-MWe solar tower projectoperating in Spain, is designed for 15 hours of storage, giving a75% annual capacity factor (Arce et al., 2011).
9
energ
y technolo
gies
|RENEWABLE ENERGY TECHNOLOGIES
PARABOLICTROUGH
PARABOLIC DISH
CENTRAL RECEIVER
HELIOSTATS
REFLECTOR
CENTRAL RECEIVER
RECEIVER/ENGINE
figures 9.3: csp technologies: parabolic trough, central receiver/solar tower and parabolic dish
SOLAR FIELD PIPING
REFLECTOR
ABSORBER TUBE
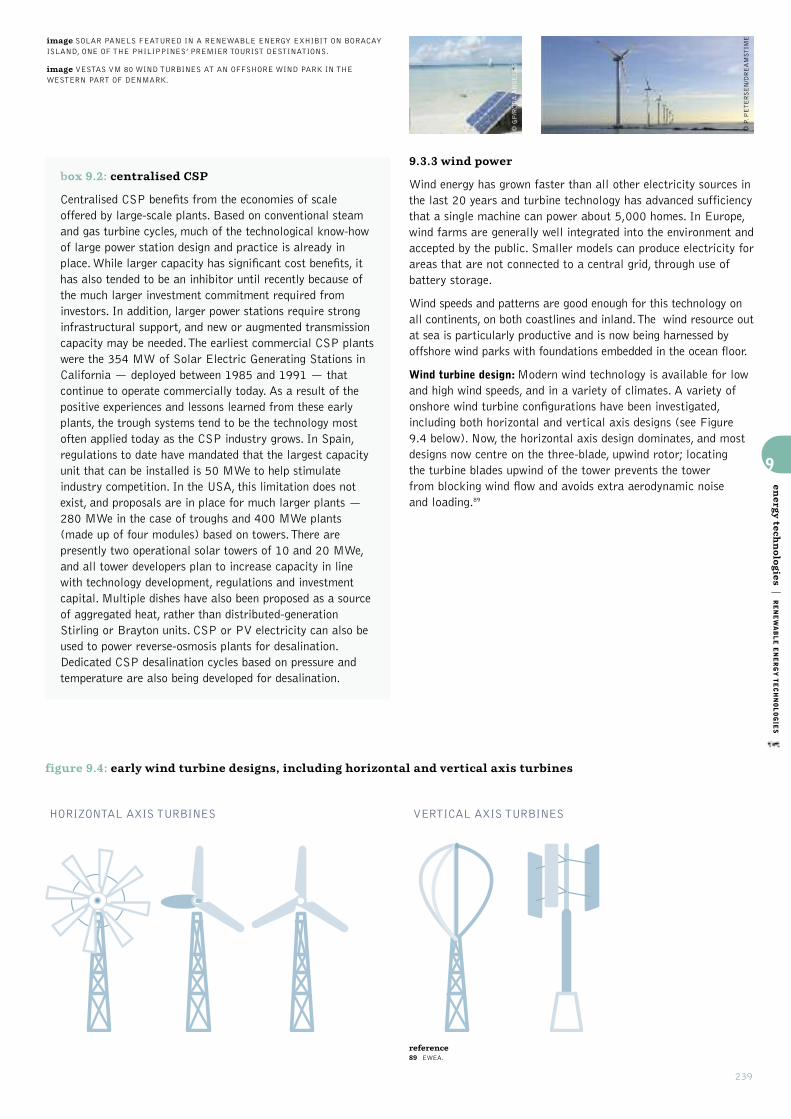
239
9.3.3 wind power
Wind energy has grown faster than all other electricity sources inthe last 20 years and turbine technology has advanced sufficiencythat a single machine can power about 5,000 homes. In Europe,wind farms are generally well integrated into the environment andaccepted by the public. Smaller models can produce electricity forareas that are not connected to a central grid, through use ofbattery storage.
Wind speeds and patterns are good enough for this technology onall continents, on both coastlines and inland. The wind resource outat sea is particularly productive and is now being harnessed byoffshore wind parks with foundations embedded in the ocean floor.
Wind turbine design: Modern wind technology is available for lowand high wind speeds, and in a variety of climates. A variety ofonshore wind turbine configurations have been investigated,including both horizontal and vertical axis designs (see Figure9.4 below). Now, the horizontal axis design dominates, and mostdesigns now centre on the three-blade, upwind rotor; locating the turbine blades upwind of the tower prevents the tower from blocking wind flow and avoids extra aerodynamic noise and loading.89
box 9.2: centralised CSP
Centralised CSP benefits from the economies of scaleoffered by large-scale plants. Based on conventional steamand gas turbine cycles, much of the technological know-howof large power station design and practice is already inplace. While larger capacity has significant cost benefits, ithas also tended to be an inhibitor until recently because ofthe much larger investment commitment required frominvestors. In addition, larger power stations require stronginfrastructural support, and new or augmented transmissioncapacity may be needed. The earliest commercial CSP plantswere the 354 MW of Solar Electric Generating Stations inCalifornia — deployed between 1985 and 1991 — thatcontinue to operate commercially today. As a result of thepositive experiences and lessons learned from these earlyplants, the trough systems tend to be the technology mostoften applied today as the CSP industry grows. In Spain,regulations to date have mandated that the largest capacityunit that can be installed is 50 MWe to help stimulateindustry competition. In the USA, this limitation does notexist, and proposals are in place for much larger plants —280 MWe in the case of troughs and 400 MWe plants(made up of four modules) based on towers. There arepresently two operational solar towers of 10 and 20 MWe,and all tower developers plan to increase capacity in linewith technology development, regulations and investmentcapital. Multiple dishes have also been proposed as a sourceof aggregated heat, rather than distributed-generationStirling or Brayton units. CSP or PV electricity can also beused to power reverse-osmosis plants for desalination.Dedicated CSP desalination cycles based on pressure andtemperature are also being developed for desalination.
9
energ
y technolo
gies
|RENEWABLE ENERGY TECHNOLOGIES
reference89 EWEA.
figure 9.4: early wind turbine designs, including horizontal and vertical axis turbines
HORIZONTAL AXIS TURBINES VERTICAL AXIS TURBINES
© GP/RODA ANGELES
© P. PETERSEN/DREAMSTIMEimage SOLAR PANELS FEATURED IN A RENEWABLE ENERGY EXHIBIT ON BORACAY
ISLAND, ONE OF THE PHILIPPINES’ PREMIER TOURIST DESTINATIONS.
image VESTAS VM 80 WIND TURBINES AT AN OFFSHORE WIND PARK IN THEWESTERN PART OF DENMARK.

WORLD ENERGY [R]EVOLUTIONA SUSTAINABLE WORLD ENERGY OUTLOOK
240
The blades are attached to a hub and main shaft, which transferspower to a generator, sometimes via a gearbox, depending ondesign, to a generator. The electricity output is channelled downthe tower to a transformer and eventually into the local gridnetwork. The main shaft and main bearings, gearbox, generatorand control system are contained within a housing called thenacelle (Figure 9.5).
Turbine size has increased over time and the turbine output iscontrolled by pitching (i.e., rotating) the blades along their longaxis.90 Reduced cost of power electronics allows variable speedwind turbine operation which helps maintain production in variableand gusty winds and also keep large wind power plants generatingduring electrical faults, and providing reactive power.
Modern wind turbines typically operate at variable speeds usingfull-span blade pitch control. Over the past 30 years, averagewind turbine size has grown significantly (Figure 9.6), with thelargest fraction of onshore wind turbines installed globally in2011 having a rated capacity of 3.5 to 7.5 MW; the average sizeof turbines installed in 2011 was around 2–2.5 MW.
As of 2010, wind turbines used on land typically have 50 to 100 m high towers, with rotors between 50 to 100 m in diameter.Some commercial machines have diameters and tower heightsabove 125 m, and even larger models are being developed.Modern turbines spin at 12 to 20 revolutions per minute (RPM),which is much slower than the models from the 1980s modelswhich spun at 60 RPM. Later rotors are slower, less visuallydisruptive and less noisy.
Onshore wind turbines are typically grouped together into windpower plants, with between 5-300 MW generating capacity, andare sometimes also called wind farms. Turbines have been gettinglarger to help reduce the cost of generation (reach better qualitywind), reduce investment per unit of capacity and reduceoperation and maintenance costs.91
For turbines on land, there will be engineering and logisticalconstraints to size because the components have to travel by road.
Modern wind turbines have nearly reached their theoreticalmaximum of aerodynamic efficiency, measured by the coefficient ofperformance (0.44 in the 1980s to about 0.50 by the mid 2000s). 9
energ
y technolo
gies
|RENEWABLE ENERGY TECHNOLOGIES
references90 EWEA.
91 EWEA.
figure 9.5: basic components of a modern, horizontal axis wind turbine with a gearbox
figure 9.6: growth in size of typical commercial wind turbines
19
80
-90
H:
20
m/D
: 1
7m
75kW
19
95
-00
H:
50
m/D
: 5
0m
750kW
20
05
-10
H:
80
m/D
: 8
0m
20
10
-?H
: 1
25
m/D
: 1
25
m
Fu
ture
H:
18
0m
/D:
25
0m
1,800kW
5,000kW
20,000kW
SWEPT AREA OF BLADES
ROTOR DIAMETER
TRANSFORMER
HU
B H
EIG
HT
H: HUB HEIGHTD: DIAMETER OF THE ROTOR
sourceIPCC 2012: SPECIAL REPORT ON RENEWABLE ENERGY SOURCES AND CLIMATE CHANGE MITIGATION.
PREPARED BY WORKING GROUP III OF THE INTERGOVERNMENTAL PANEL ON CLIMATE CHANGE,
FIGURE(S).... CAMBRIDGE UNIVERSITY PRESS.
1. ROTOR BLADE2. BLADE ADJUSTMENT3. NACELL4. ROTOR SHAFT5. ANEMOMETOR6. GENERATOR7. SYSTEM CONTROL8. LIFT INSIDE THE TOWER
1
8
4
5
2 6
7
PITCH
3

241
Offshore wind energy technology: The existing offshore marketmakes up just 1.3% of the world’s land-based installed windcapacity, however, the potential at sea is driving the latestdevelopments in wind technology, size in particular.
The first offshore wind power plant was built in 1991 inDenmark, consisting of eleven 450 kW wind turbines. By the endof 2009, global installed wind power capacity 2,100 MW.92
By going offshore, wind energy can use stronger winds andprovide clean energy to countries where there is less technicalpotential for land-based wind energy development or where itwould be in conflict with other land uses. Offshore wind energyalso makes use lower ‘shear’ near hub height and greatereconomies of scale from large turbines that can be transportedby ship. Offshore wind farms also reduce the need for new, long-distance, land-based transmission infrastructure that wind farmson land can require.93
There is considerable interest in offshore wind energy technologyin the EU and, increasingly in other regions, despite the typicallyhigher costs relative to onshore wind energy.
Offshore wind turbines built between 2007 and 2009 typicallyhave nameplate capacity ratings of 2 to 5 MW and largerturbines are under development. Offshore wind power plantsinstalled from 2007 to 2009 were typically 20 to 120 MW insize, and often installed in water between 10 and 20 m deep.Distance to shore is mostly less than 20 km, but average distancehas increased over time.94 Offshore wind is likely to be installed atgreater depths, and with larger turbines (5 to 10 MW or larger)as experience is gained and for greater economies of scale.
Offshore wind turbine technology has been very similar toonshore designs, with some structural modifications and withspecial foundations.95 Other design features include marinenavigational equipment and monitoring and infrastructure tominimise expensive servicing.
9.3.4 biomass energy
Biomass is a broad term used to describe material of recentbiological origin that can be used as a source of energy. Thisincludes wood, crops, algae and other plants as well asagricultural and forest residues. Biomass can be used for avariety of end uses: heating, electricity generation or as fuel fortransportation. The term ‘bio energy’ is used for biomass energysystems that produce heat and/or electricity and ‘biofuels’ forliquid fuels used in transport. Biodiesel manufactured fromvarious crops has become increasingly used as vehicle fuel,especially as the cost of oil has risen.
Biological power sources are renewable, easily stored and, ifsustainably harvested, CO2 neutral. This is because the gasemitted during their transfer into useful energy is balanced by thecarbon dioxide absorbed when they were growing plants.
Electricity generating biomass power plants work just like naturalgas or coal power stations, except that the fuel must be processedbefore it can be burned. These power plants are generally not aslarge as coal power stations because their fuel supply needs togrow as near as possible to the plant. Heat generation frombiomass power plants can result either from utilising a CombinedHeat and Power (CHP) system, piping the heat to nearby homesor industry, or through dedicated heating systems. Small heatingsystems using specially produced pellets made from waste wood,for example, can be used to heat single family homes instead ofnatural gas or oil.
Biomass technology
A number of processes can be used to convert energy frombiomass. These divide into thermochemical processes (directcombustion of solids, liquids or a gas via pyrolysis orgasification), and biological systems, (decomposition of solidbiomass to liquid or gaseous fuels by processes such as anaerobicdigestion and fermentation).
Thermochemical processes: Direct combustion Direct biomasscombustion is the most common way of converting biomass intoenergy for both heat and electricity, accounting for over 90% ofbiomass generation. Combustion processes are well understood, inessence when carbon and hydrogen in the fuel react with excessoxygen to form CO2 and water and release heat. In rural areas,many forms are biomass are burned for cooking. Wood andcharcoal are also used as a fuel in industry. A wide range ofexisting commercial technologies are tailored to thecharacteristics of the biomass and the scale of their applications.
Technologies types are fixed bed, fluidised bed or entrained flowcombustion. In fixed bed combustion, such as a grate furnace, airfirst passes through a fixed bed for drying, gasification andcharcoal combustion. The combustible gases produced are burnedafter the addition of secondary air, usually in a zone separatedfrom the fuel bed. In fluidised bed combustion, the primarycombustion air is injected from the bottom of the furnace withsuch high velocity that the material inside the furnace becomes aseething mass of particles and bubbles. Entrained flowcombustion is suitable for fuels available as small particles, suchas sawdust or fine shavings, which are pneumatically injected intothe furnace.
9
energ
y technolo
gies
|RENEWABLE ENERGY TECHNOLOGIES
references92 GWEC, 2010A.
93 CARBON TRUST, 2008B; SNYDER AND KAISER, 2009B; TWIDELL AND GAUDIOSI, 2009.
94 (EWEA, 2010A).
95 MUSIAL, 2007; CARBON TRUST, 2008B.
© GP/ZENIT/LANGROCK
image FOREST CREEK WIND FARM PRODUCING 2.3MW WITH WIND TURBINES MADE BY SIEMENS.WORKERS WORKING ON TOP OF WIND TURBINE.
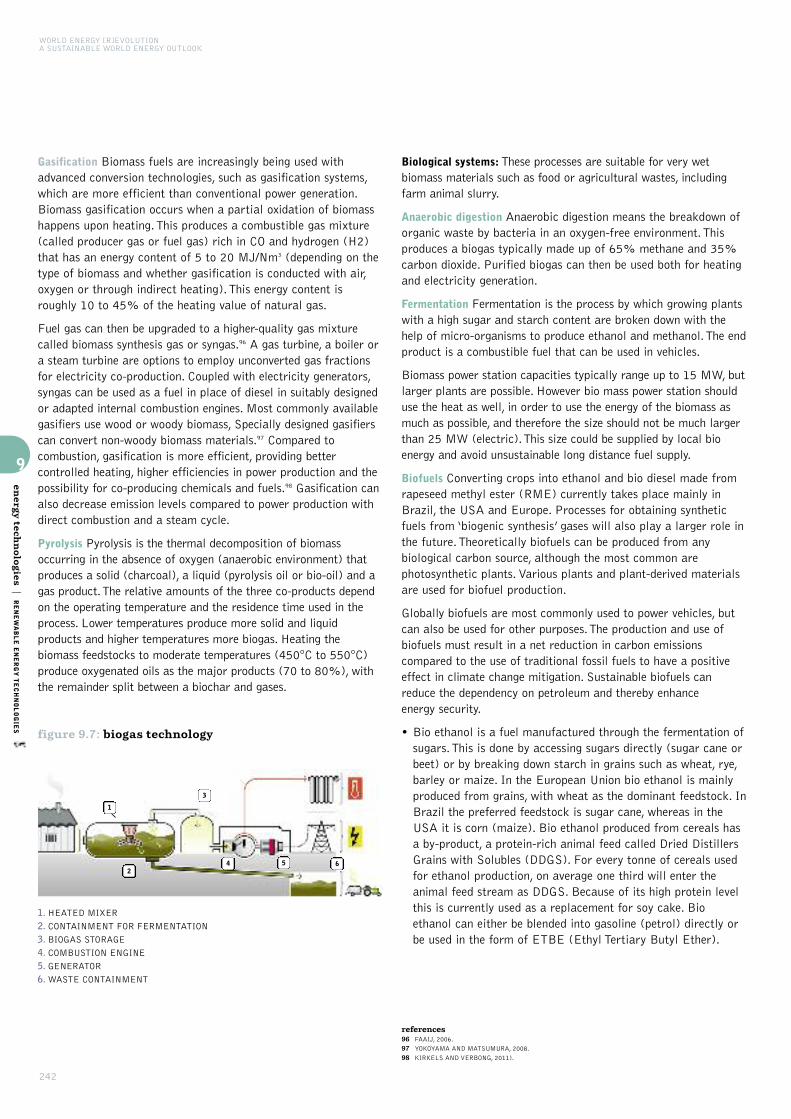
WORLD ENERGY [R]EVOLUTIONA SUSTAINABLE WORLD ENERGY OUTLOOK
242
Gasification Biomass fuels are increasingly being used withadvanced conversion technologies, such as gasification systems,which are more efficient than conventional power generation.Biomass gasification occurs when a partial oxidation of biomasshappens upon heating. This produces a combustible gas mixture(called producer gas or fuel gas) rich in CO and hydrogen (H2)that has an energy content of 5 to 20 MJ/Nm3 (depending on thetype of biomass and whether gasification is conducted with air,oxygen or through indirect heating). This energy content isroughly 10 to 45% of the heating value of natural gas.
Fuel gas can then be upgraded to a higher-quality gas mixturecalled biomass synthesis gas or syngas.96 A gas turbine, a boiler ora steam turbine are options to employ unconverted gas fractionsfor electricity co-production. Coupled with electricity generators,syngas can be used as a fuel in place of diesel in suitably designedor adapted internal combustion engines. Most commonly availablegasifiers use wood or woody biomass, Specially designed gasifierscan convert non-woody biomass materials.97 Compared tocombustion, gasification is more efficient, providing bettercontrolled heating, higher efficiencies in power production and thepossibility for co-producing chemicals and fuels.98 Gasification canalso decrease emission levels compared to power production withdirect combustion and a steam cycle.
Pyrolysis Pyrolysis is the thermal decomposition of biomassoccurring in the absence of oxygen (anaerobic environment) thatproduces a solid (charcoal), a liquid (pyrolysis oil or bio-oil) and agas product. The relative amounts of the three co-products dependon the operating temperature and the residence time used in theprocess. Lower temperatures produce more solid and liquidproducts and higher temperatures more biogas. Heating thebiomass feedstocks to moderate temperatures (450°C to 550°C)produce oxygenated oils as the major products (70 to 80%), withthe remainder split between a biochar and gases.
Biological systems: These processes are suitable for very wetbiomass materials such as food or agricultural wastes, includingfarm animal slurry.
Anaerobic digestion Anaerobic digestion means the breakdown oforganic waste by bacteria in an oxygen-free environment. Thisproduces a biogas typically made up of 65% methane and 35%carbon dioxide. Purified biogas can then be used both for heatingand electricity generation.
Fermentation Fermentation is the process by which growing plantswith a high sugar and starch content are broken down with thehelp of micro-organisms to produce ethanol and methanol. The endproduct is a combustible fuel that can be used in vehicles.
Biomass power station capacities typically range up to 15 MW, butlarger plants are possible. However bio mass power station shoulduse the heat as well, in order to use the energy of the biomass asmuch as possible, and therefore the size should not be much largerthan 25 MW (electric). This size could be supplied by local bioenergy and avoid unsustainable long distance fuel supply.
Biofuels Converting crops into ethanol and bio diesel made fromrapeseed methyl ester (RME) currently takes place mainly inBrazil, the USA and Europe. Processes for obtaining syntheticfuels from ‘biogenic synthesis’ gases will also play a larger role inthe future. Theoretically biofuels can be produced from anybiological carbon source, although the most common arephotosynthetic plants. Various plants and plant-derived materialsare used for biofuel production.
Globally biofuels are most commonly used to power vehicles, butcan also be used for other purposes. The production and use ofbiofuels must result in a net reduction in carbon emissionscompared to the use of traditional fossil fuels to have a positiveeffect in climate change mitigation. Sustainable biofuels canreduce the dependency on petroleum and thereby enhance energy security.
• Bio ethanol is a fuel manufactured through the fermentation ofsugars. This is done by accessing sugars directly (sugar cane orbeet) or by breaking down starch in grains such as wheat, rye,barley or maize. In the European Union bio ethanol is mainlyproduced from grains, with wheat as the dominant feedstock. InBrazil the preferred feedstock is sugar cane, whereas in theUSA it is corn (maize). Bio ethanol produced from cereals hasa by-product, a protein-rich animal feed called Dried DistillersGrains with Solubles (DDGS). For every tonne of cereals usedfor ethanol production, on average one third will enter theanimal feed stream as DDGS. Because of its high protein levelthis is currently used as a replacement for soy cake. Bioethanol can either be blended into gasoline (petrol) directly orbe used in the form of ETBE (Ethyl Tertiary Butyl Ether).
9
energ
y technolo
gies
|RENEWABLE ENERGY TECHNOLOGIES
references96 FAAIJ, 2006.
97 YOKOYAMA AND MATSUMURA, 2008.
98 KIRKELS AND VERBONG, 2011).
figure 9.7: biogas technology
1. HEATED MIXER2. CONTAINMENT FOR FERMENTATION3. BIOGAS STORAGE4. COMBUSTION ENGINE5. GENERATOR6.WASTE CONTAINMENT
3
24 5 6
1

243
• Bio diesel is a fuel produced from vegetable oil sourced fromrapeseed, sunflower seeds or soybeans as well as used cookingoils or animal fats. If used vegetable oils are recycled asfeedstock for bio diesel production this can reduce pollutionfrom discarded oil and provides a new way of transforming awaste product into transport energy. Blends of bio diesel andconventional hydrocarbon-based diesel are the most commonproducts distributed in the retail transport fuel market.
• Most countries use a labelling system to explain the proportionof bio diesel in any fuel mix. Fuel containing 20% biodiesel islabelled B20, while pure bio diesel is referred to as B100.Blends of 20 % bio diesel with 80 % petroleum diesel (B20)can generally be used in unmodified diesel engines. Used in itspure form (B100) an engine may require certain modifications.Bio diesel can also be used as a heating fuel in domestic andcommercial boilers. Older furnaces may contain rubber partsthat would be affected by bio diesel’s solvent properties, butcan otherwise burn it without any conversion.
The amount of bio energy used in this report is based on bio energypotential surveys which are drawn from existing studies, but notnecessarily reflecting all the ecological assumptions thatGreenpeace would use. For more details see Chapter 8, page 212.
9.3.5 geothermal energy
Geothermal energy is heat derived from underneath the earth’scrust. In most areas, this heat is generated a long way down andhas mostly dissipated by the time it reaches the surface, but insome places the geothermal resources are relatively close to thesurface and can be used as non-polluting sources of energy. These“hotspots” include the western part of the USA, west and centralEastern Europe, Iceland, Asia and New Zealand.
The uses of geothermal energy depend on the temperatures. Lowand moderate areas temperature areas at (less than 90°C orbetween 90°C and 150°C) can be used for their heat directly andthe highest temperature resources (above 150°C) is suitable onlyfor electric power generation. Today’s total global geothermalgeneration is approximately 10,700 MW, with nearly one-third inUSA (over 3,000 MW), and the next biggest share in Philippines(1,900 MW) and Indonesia (1,200 MW).
Technology and applications
Geothermal energy is currently extracted using wells or othermeans that produce hot fluids from either hydrothermalreservoirs with naturally high permeability; or reservoirs that areengineered and fractured to extract heat. See below for moreinformation on these “enhanced geothermal systems”. Productionwells discharge hot water and/or steam.
In high-temperature hydrothermal reservoirs, water occursnaturally underground under pressure in liquid from. As it isextracted the pressure drops and the water is converted to steamwhich is piped to a turbine to generate electricity. Remaining hotwater may go through the process again to obtain more steam.The remaining salty water is sent back to the reservoir through
injection wells, sometimes via another system to use the remainingheat. A few reservoirs, such as The Geysers in the USA, Larderelloin Italy, Matsukawa in Japan, and some Indonesian fields, producesteam vapour naturally that can be used in a turbine. Hot waterproduced from intermediate-temperature hydrothermal orEnhanced Geothermal Systems (EGS) reservoirs can also be usedin heat exchangers to generate power in a binary cycle, or in directuse applications. Recovered fluids are also injected back into thereservoir.99 Key technologies are:
Exploration and drilling includes estimating where the resource is,its size and depth with geophysical methods and then drillingexploration wells to test the resource. Today, geothermal wells aredrilled over a range of depths down to 5 km using methodssimilar to those used for oil and gas. Advances in exploration anddrilling can technology can be expected. For example if severalwells are drilled from the same pad, it can access more heatresources and minimise the surface impact.100
Reservoir engineering is focused on determining the volume ofgeothermal resource and the optimal plant size. The optimum hasto consider sustainable use of the resources and safe and efficientoperation. The modern method of estimating reserves and sizingpower plants through ‘reservoir simulation’ – a process that startswith a conceptual model followed by a calibrated, numericalrepresentation.101 Then future behaviour is forecast under selectedload conditions using an algorithm (e.g., TOUGH2) to select theplant size. Injection management looks after the production zones and uses data to make sure the hot reservoir rock is re-charged sufficiently.
9
energ
y technolo
gies
|RENEWABLE ENERGY TECHNOLOGIES
figure 9.8: geothermal energy
1. PUMP2. HEAT EXCHANGER3. GAS TURBINE & GENERATOR4. DRILLING HOLE FOR COLD WATER INJECTION5. DRILLING HOLE FOR WARM WATER EXTRACTION
13
2
4 5
references99 ARMSTEAD AND TESTER, 1987; DICKSON AND FANELLI, 2003; DIPIPPO, 2008.
100 IPCC, SRREN 2011.
101 GRANT ET AL., 1982.
© GP/EX-PRESS/M. FORTE
image THROUGH BURNING OF WOOD CHIPS THE POWER PLANT GENERATESELECTRICITY, ENERGY OR HEAT. HERE WE SEE THE STOCK OF WOOD CHIPS WITH ACAPACITY OF 1000 M3 ON WHICH THE PLANT CAN RUN, UNMANNED, FOR ABOUT FOURDAYS. LELYSTAD, THE NETHERLANDS.
image FOOD WASTE FOR THE BIOGAS PLANT. THE FARMER PETER WYSS PRODUCESON HIS FARM WITH A BIOGAS PLANT GREEN ELECTRICITY WITH DUNG FROM COWS,LIQUID MANURE AND WASTE FROM THE FOOD PRODUCTION.
© GP/BAS BEENTJES
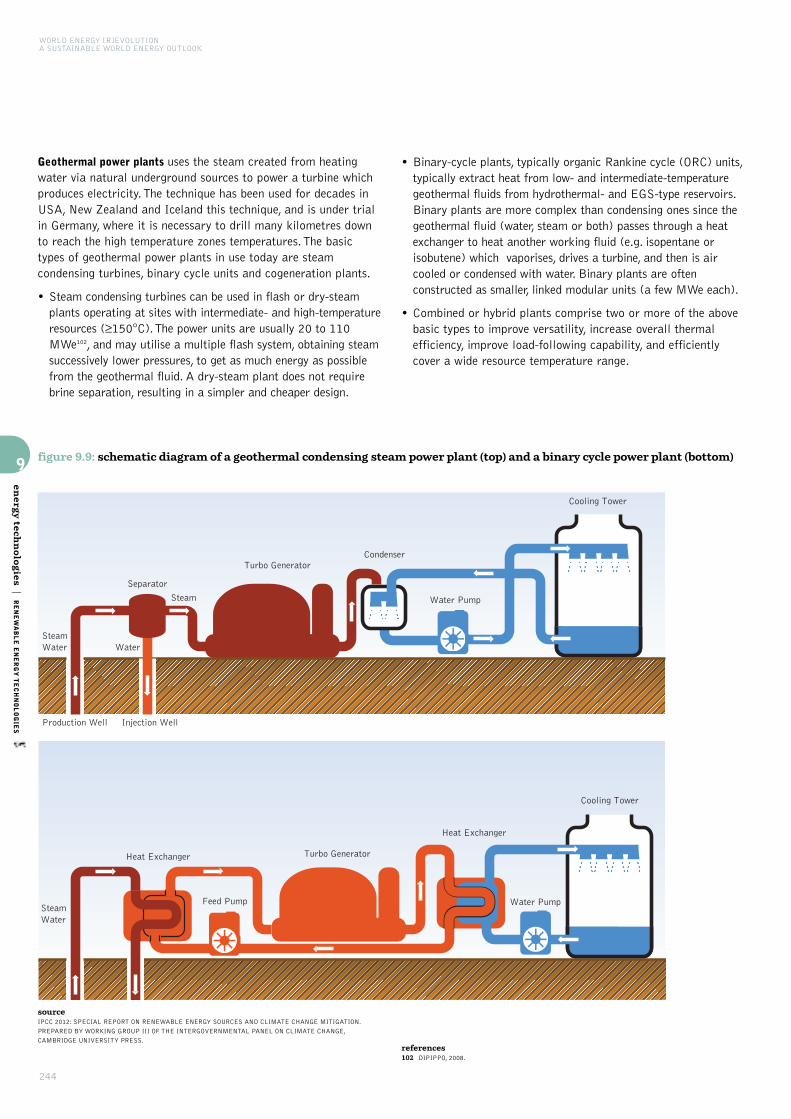
WORLD ENERGY [R]EVOLUTIONA SUSTAINABLE WORLD ENERGY OUTLOOK
244
Geothermal power plants uses the steam created from heatingwater via natural underground sources to power a turbine whichproduces electricity. The technique has been used for decades inUSA, New Zealand and Iceland this technique, and is under trialin Germany, where it is necessary to drill many kilometres downto reach the high temperature zones temperatures. The basictypes of geothermal power plants in use today are steamcondensing turbines, binary cycle units and cogeneration plants.
• Steam condensing turbines can be used in flash or dry-steamplants operating at sites with intermediate- and high-temperatureresources (≥150°C). The power units are usually 20 to 110MWe102, and may utilise a multiple flash system, obtaining steamsuccessively lower pressures, to get as much energy as possiblefrom the geothermal fluid. A dry-steam plant does not requirebrine separation, resulting in a simpler and cheaper design.
• Binary-cycle plants, typically organic Rankine cycle (ORC) units,typically extract heat from low- and intermediate-temperaturegeothermal fluids from hydrothermal- and EGS-type reservoirs.Binary plants are more complex than condensing ones since thegeothermal fluid (water, steam or both) passes through a heatexchanger to heat another working fluid (e.g. isopentane orisobutene) which vaporises, drives a turbine, and then is aircooled or condensed with water. Binary plants are oftenconstructed as smaller, linked modular units (a few MWe each).
• Combined or hybrid plants comprise two or more of the abovebasic types to improve versatility, increase overall thermalefficiency, improve load-following capability, and efficientlycover a wide resource temperature range.
9
energ
y technolo
gies
|RENEWABLE ENERGY TECHNOLOGIES
figure 9.9: schematic diagram of a geothermal condensing steam power plant (top) and a binary cycle power plant (bottom)
Separator
Steam Water
Steam Water
Cooling Tower
Cooling Tower
Heat Exchanger
Heat Exchanger Turbo Generator
Turbo GeneratorCondenser
Water Pump
Water PumpFeed Pump
Injection WellProduction Well
Injection WellProduction Well
Steam
Water
sourceIPCC 2012: SPECIAL REPORT ON RENEWABLE ENERGY SOURCES AND CLIMATE CHANGE MITIGATION.
PREPARED BY WORKING GROUP III OF THE INTERGOVERNMENTAL PANEL ON CLIMATE CHANGE,
CAMBRIDGE UNIVERSITY PRESS.references102 DIPIPPO, 2008.
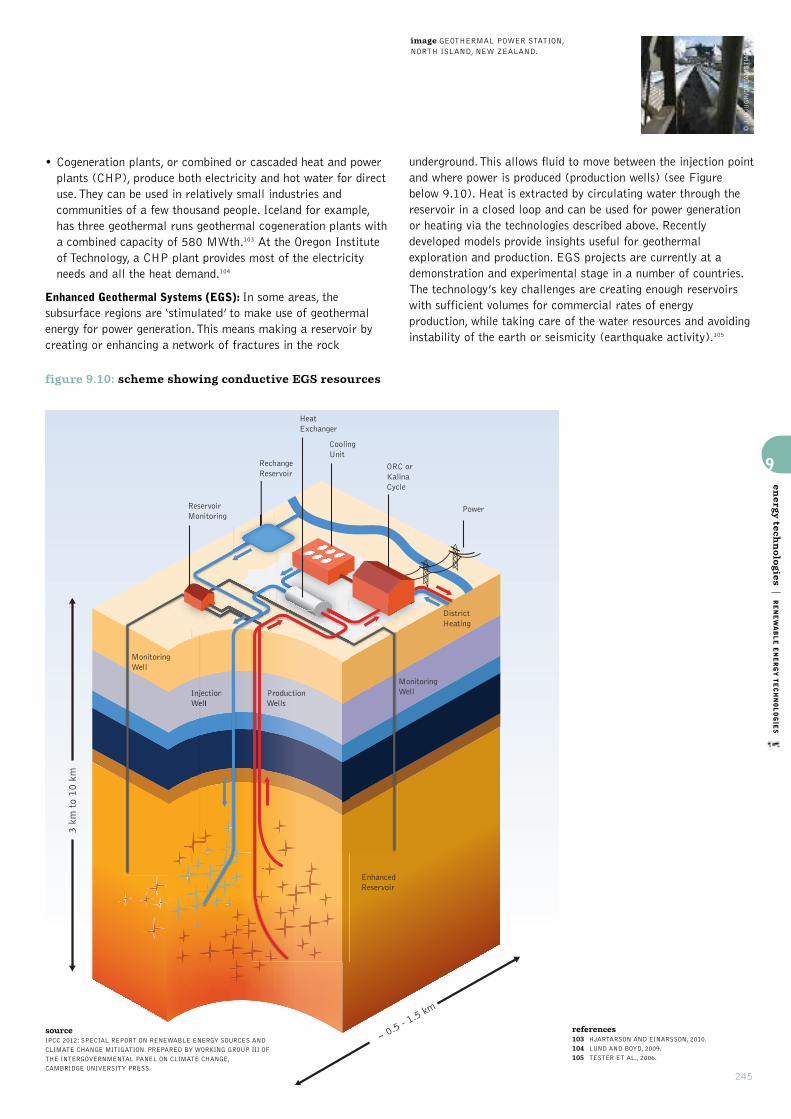
245
• Cogeneration plants, or combined or cascaded heat and powerplants (CHP), produce both electricity and hot water for directuse. They can be used in relatively small industries andcommunities of a few thousand people. Iceland for example,has three geothermal runs geothermal cogeneration plants witha combined capacity of 580 MWth.103 At the Oregon Instituteof Technology, a CHP plant provides most of the electricityneeds and all the heat demand.104
Enhanced Geothermal Systems (EGS): In some areas, thesubsurface regions are ‘stimulated’ to make use of geothermalenergy for power generation. This means making a reservoir bycreating or enhancing a network of fractures in the rock
underground. This allows fluid to move between the injection pointand where power is produced (production wells) (see Figurebelow 9.10). Heat is extracted by circulating water through thereservoir in a closed loop and can be used for power generationor heating via the technologies described above. Recentlydeveloped models provide insights useful for geothermalexploration and production. EGS projects are currently at ademonstration and experimental stage in a number of countries.The technology’s key challenges are creating enough reservoirswith sufficient volumes for commercial rates of energyproduction, while taking care of the water resources and avoidinginstability of the earth or seismicity (earthquake activity).105
9
energ
y technolo
gies
|RENEWABLE ENERGY TECHNOLOGIES
figure 9.10: scheme showing conductive EGS resources
ReservoirMonitoring
RechangeReservoir
ORC orKalinaCycle
DistrictHeating
Power
CoolingUnit
MonitoringWell
MonitoringWell
InjectionWell
ProductionWells
EnhancedReservoir
3 km
to
10 k
m
~ 0.5 - 1.5 km
InjInjectionWelWell
ProducducductionWells
HeatExchanger
sourceIPCC 2012: SPECIAL REPORT ON RENEWABLE ENERGY SOURCES AND
CLIMATE CHANGE MITIGATION. PREPARED BY WORKING GROUP III OF
THE INTERGOVERNMENTAL PANEL ON CLIMATE CHANGE,
CAMBRIDGE UNIVERSITY PRESS.
references103 HJARTARSON AND EINARSSON, 2010.
104 LUND AND BOYD, 2009.
105 TESTER ET AL., 2006.
© J. GOUGH/DREAMSTIME
image GEOTHERMAL POWER STATION, NORTH ISLAND, NEW ZEALAND.

WORLD ENERGY [R]EVOLUTIONA SUSTAINABLE WORLD ENERGY OUTLOOK
246
9.3.6 hydro power
Water has been used to produce electricity for about a centuryand even today it is used to generate around one fifth of theworld’s electricity. The main requirement for hydro power is tocreate an artificial head of water, that when it is diverted into achannel or pipe it has sufficient energy to power a turbine.
Classification by head and size
The ‘head’ in hydro power refers to the difference between theupstream and the downstream water levels, determining the waterpressure on the turbines which, along with discharge, decide whattype of hydraulic turbine is used. The classification of ‘high head’and ‘low head’ varies from country to country, and there is nogenerally accepted scale.
Broadly, Pelton impulse turbines are used for high heads (where ajet of water hits a turbine and reverses direction), Francis reactionturbines are used to exploit medium heads (which run full of waterand in effect generate hydrodynamic ‘lift’ to propel the turbineblades) and for low heads, Kaplan and Bulb turbines are applied.
Classification according to refers to installed capacity measuredin MW. Small-scale hydropower plants are more likely to be run-of-river facilities than are larger hydropower plants, but reservoir(storage) hydropower stations of all sizes use the same basiccomponents and technologies. It typically takes less time andeffort to construct and integrate small hydropower schemes intolocal environments106 so their deployment is increasing in manyparts of the world. Small schemes are often considered in remoteareas where other energy sources are not viable or are noteconomically attractive.
Greenpeace supports the sustainability criteria developed bythe International Rivers Network (www.internationalrivers.org)
Classification by facility type
Hydropower plants are also classified in the following categoriesaccording to operation and type of flow:
• run-of-river
• storage (reservoir)
• pumped storage, and
• in-stream technology, which is a young and less-developed technology.
Run-of-River: These plants draw the energy for electricity mainlyfrom the available flow of the river and do not collect significantamounts of stored water. They may include some short-termstorage (hourly, daily), but the generation profile will generally bedictated by local river flow conditions. Because generationdepends on rainfall it may have substantial daily, monthly orseasonal variations, especially when located in small rivers orstreams that with widely varying flows. In a typical plant, aportion of the river water might be diverted to a channel orpipeline (penstock) to convey the water to a hydraulic turbine,which is connected to an electricity generator (see Figure 9.11).RoR projects may form cascades along a river valley, often with areservoir-type hydro power plants in the upper reaches of thevalley. Run-of-river installation is relatively inexpensive andfacilities typically have fewer environmental impacts than similar-sized storage hydropower plants.
9
energ
y technolo
gies
|RENEWABLE ENERGY TECHNOLOGIES
figure 9.11: run-of-river hydropower plant
Headrace
DesiltingTank
Forebay
Powerhouse
Stream
Intake
Diversion Weir
Tailrace
Penstock
sourceIPCC 2012: SPECIAL REPORT ON RENEWABLE ENERGY SOURCES AND CLIMATE CHANGE MITIGATION.
PREPARED BY WORKING GROUP III OF THE INTERGOVERNMENTAL PANEL ON CLIMATE CHANGE,
CAMBRIDGE UNIVERSITY PRESS.
sourceIPCC 2012: SPECIAL REPORT ON RENEWABLE ENERGY SOURCES AND CLIMATE CHANGE MITIGATION.
PREPARED BY WORKING GROUP III OF THE INTERGOVERNMENTAL PANEL ON CLIMATE CHANGE,
CAMBRIDGE UNIVERSITY PRESS.
figure 9.12: typical hydropower plant with resevoir
Powerhouse
Dam
Penstock
Tailrace
Switch Yard
reference106 EGRE AND MILEWSKI, 2002
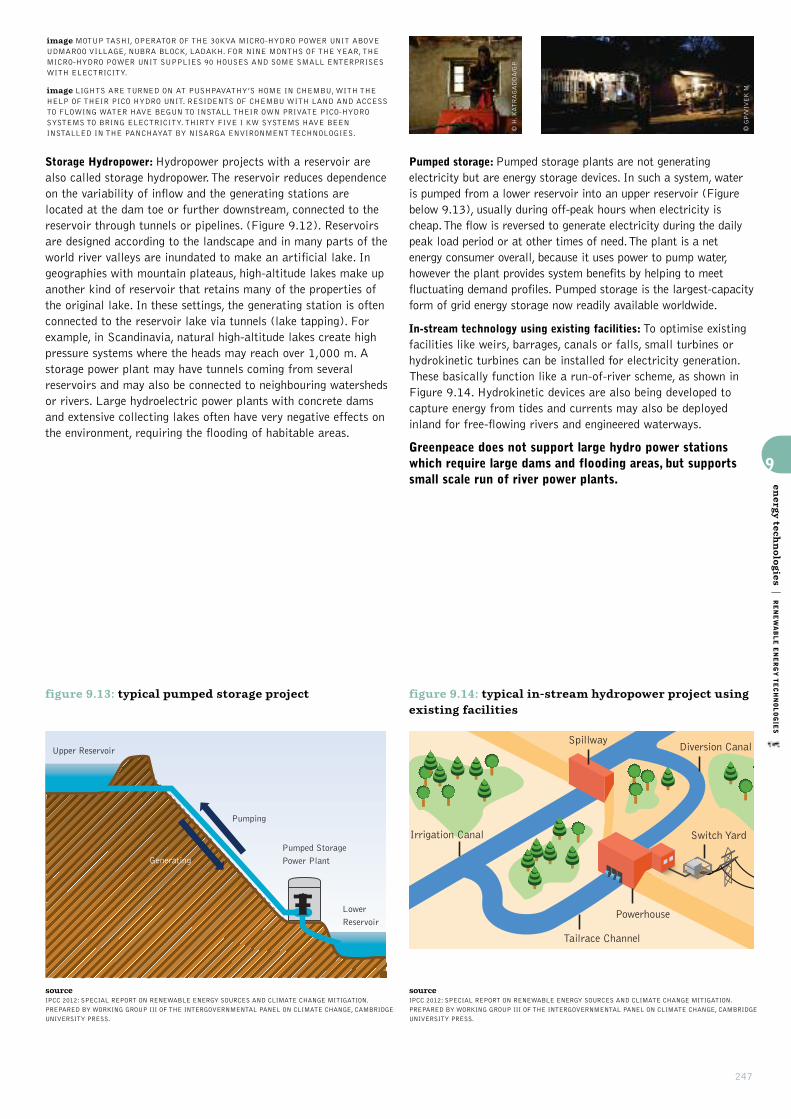
247
Storage Hydropower: Hydropower projects with a reservoir arealso called storage hydropower. The reservoir reduces dependenceon the variability of inflow and the generating stations arelocated at the dam toe or further downstream, connected to thereservoir through tunnels or pipelines. (Figure 9.12). Reservoirsare designed according to the landscape and in many parts of theworld river valleys are inundated to make an artificial lake. Ingeographies with mountain plateaus, high-altitude lakes make upanother kind of reservoir that retains many of the properties ofthe original lake. In these settings, the generating station is oftenconnected to the reservoir lake via tunnels (lake tapping). Forexample, in Scandinavia, natural high-altitude lakes create highpressure systems where the heads may reach over 1,000 m. Astorage power plant may have tunnels coming from severalreservoirs and may also be connected to neighbouring watershedsor rivers. Large hydroelectric power plants with concrete damsand extensive collecting lakes often have very negative effects onthe environment, requiring the flooding of habitable areas.
Pumped storage: Pumped storage plants are not generatingelectricity but are energy storage devices. In such a system, wateris pumped from a lower reservoir into an upper reservoir (Figurebelow 9.13), usually during off-peak hours when electricity ischeap. The flow is reversed to generate electricity during the dailypeak load period or at other times of need. The plant is a netenergy consumer overall, because it uses power to pump water,however the plant provides system benefits by helping to meetfluctuating demand profiles. Pumped storage is the largest-capacityform of grid energy storage now readily available worldwide.
In-stream technology using existing facilities: To optimise existingfacilities like weirs, barrages, canals or falls, small turbines orhydrokinetic turbines can be installed for electricity generation.These basically function like a run-of-river scheme, as shown inFigure 9.14. Hydrokinetic devices are also being developed tocapture energy from tides and currents may also be deployedinland for free-flowing rivers and engineered waterways.
Greenpeace does not support large hydro power stationswhich require large dams and flooding areas, but supportssmall scale run of river power plants.
9
energ
y technolo
gies
|RENEWABLE ENERGY TECHNOLOGIES
figure 9.13: typical pumped storage project
Upper Reservoir
Lower
Reservoir
Generating
Pumping
Pumped Storage
Power Plant
sourceIPCC 2012: SPECIAL REPORT ON RENEWABLE ENERGY SOURCES AND CLIMATE CHANGE MITIGATION.
PREPARED BY WORKING GROUP III OF THE INTERGOVERNMENTAL PANEL ON CLIMATE CHANGE, CAMBRIDGE
UNIVERSITY PRESS.
figure 9.14: typical in-stream hydropower project usingexisting facilities
Irrigation Canal
Spillway
Powerhouse
Diversion Canal
Tailrace Channel
Switch Yard
sourceIPCC 2012: SPECIAL REPORT ON RENEWABLE ENERGY SOURCES AND CLIMATE CHANGE MITIGATION.
PREPARED BY WORKING GROUP III OF THE INTERGOVERNMENTAL PANEL ON CLIMATE CHANGE, CAMBRIDGE
UNIVERSITY PRESS.
© H. KATRAGADDA/GP
© GP/VIVEK M
image MOTUP TASHI, OPERATOR OF THE 30KVA MICRO-HYDRO POWER UNIT ABOVEUDMAROO VILLAGE, NUBRA BLOCK, LADAKH. FOR NINE MONTHS OF THE YEAR, THEMICRO-HYDRO POWER UNIT SUPPLIES 90 HOUSES AND SOME SMALL ENTERPRISESWITH ELECTRICITY.
image LIGHTS ARE TURNED ON AT PUSHPAVATHY’S HOME IN CHEMBU, WITH THEHELP OF THEIR PICO HYDRO UNIT. RESIDENTS OF CHEMBU WITH LAND AND ACCESSTO FLOWING WATER HAVE BEGUN TO INSTALL THEIR OWN PRIVATE PICO-HYDROSYSTEMS TO BRING ELECTRICITY. THIRTY FIVE I KW SYSTEMS HAVE BEENINSTALLED IN THE PANCHAYAT BY NISARGA ENVIRONMENT TECHNOLOGIES.
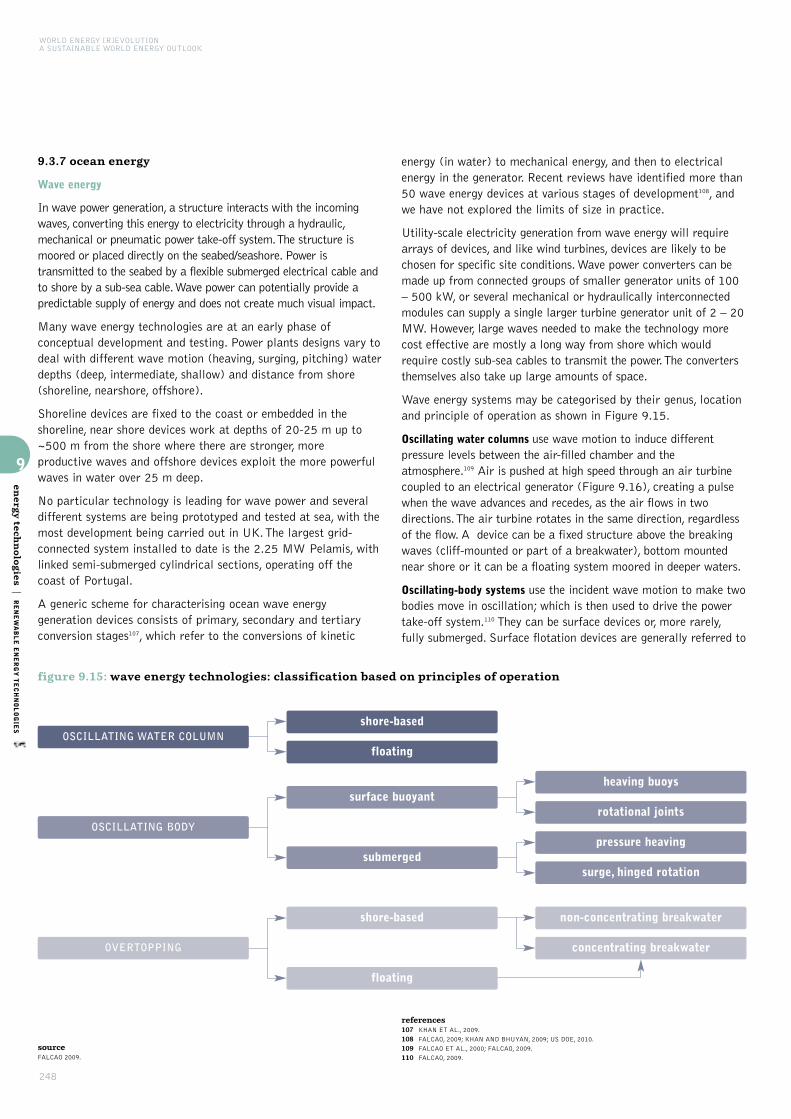
WORLD ENERGY [R]EVOLUTIONA SUSTAINABLE WORLD ENERGY OUTLOOK
248
9.3.7 ocean energy
Wave energy
In wave power generation, a structure interacts with the incomingwaves, converting this energy to electricity through a hydraulic,mechanical or pneumatic power take-off system. The structure ismoored or placed directly on the seabed/seashore. Power istransmitted to the seabed by a flexible submerged electrical cable andto shore by a sub-sea cable. Wave power can potentially provide apredictable supply of energy and does not create much visual impact.
Many wave energy technologies are at an early phase ofconceptual development and testing. Power plants designs vary todeal with different wave motion (heaving, surging, pitching) waterdepths (deep, intermediate, shallow) and distance from shore(shoreline, nearshore, offshore).
Shoreline devices are fixed to the coast or embedded in theshoreline, near shore devices work at depths of 20-25 m up to~500 m from the shore where there are stronger, moreproductive waves and offshore devices exploit the more powerfulwaves in water over 25 m deep.
No particular technology is leading for wave power and severaldifferent systems are being prototyped and tested at sea, with themost development being carried out in UK. The largest grid-connected system installed to date is the 2.25 MW Pelamis, withlinked semi-submerged cylindrical sections, operating off thecoast of Portugal.
A generic scheme for characterising ocean wave energygeneration devices consists of primary, secondary and tertiaryconversion stages107, which refer to the conversions of kinetic
energy (in water) to mechanical energy, and then to electricalenergy in the generator. Recent reviews have identified more than50 wave energy devices at various stages of development108, andwe have not explored the limits of size in practice.
Utility-scale electricity generation from wave energy will requirearrays of devices, and like wind turbines, devices are likely to bechosen for specific site conditions. Wave power converters can bemade up from connected groups of smaller generator units of 100– 500 kW, or several mechanical or hydraulically interconnectedmodules can supply a single larger turbine generator unit of 2 – 20MW. However, large waves needed to make the technology morecost effective are mostly a long way from shore which wouldrequire costly sub-sea cables to transmit the power. The convertersthemselves also take up large amounts of space.
Wave energy systems may be categorised by their genus, locationand principle of operation as shown in Figure 9.15.
Oscillating water columns use wave motion to induce differentpressure levels between the air-filled chamber and theatmosphere.109 Air is pushed at high speed through an air turbinecoupled to an electrical generator (Figure 9.16), creating a pulsewhen the wave advances and recedes, as the air flows in twodirections. The air turbine rotates in the same direction, regardlessof the flow. A device can be a fixed structure above the breakingwaves (cliff-mounted or part of a breakwater), bottom mountednear shore or it can be a floating system moored in deeper waters.
Oscillating-body systems use the incident wave motion to make twobodies move in oscillation; which is then used to drive the powertake-off system.110 They can be surface devices or, more rarely,fully submerged. Surface flotation devices are generally referred to
9
energ
y technolo
gies
|RENEWABLE ENERGY TECHNOLOGIES
sourceFALCAO 2009.
references107 KHAN ET AL., 2009.
108 FALCAO, 2009; KHAN AND BHUYAN, 2009; US DOE, 2010.
109 FALCAO ET AL., 2000; FALCAO, 2009.
110 FALCAO, 2009.
figure 9.15: wave energy technologies: classification based on principles of operation
OSCILLATING WATER COLUMN
OSCILLATING BODY
OVERTOPPING
shore-based
floating
surface buoyant
submerged
shore-based
floating
heaving buoys
rotational joints
pressure heaving
surge, hinged rotation
non-concentrating breakwater
concentrating breakwater
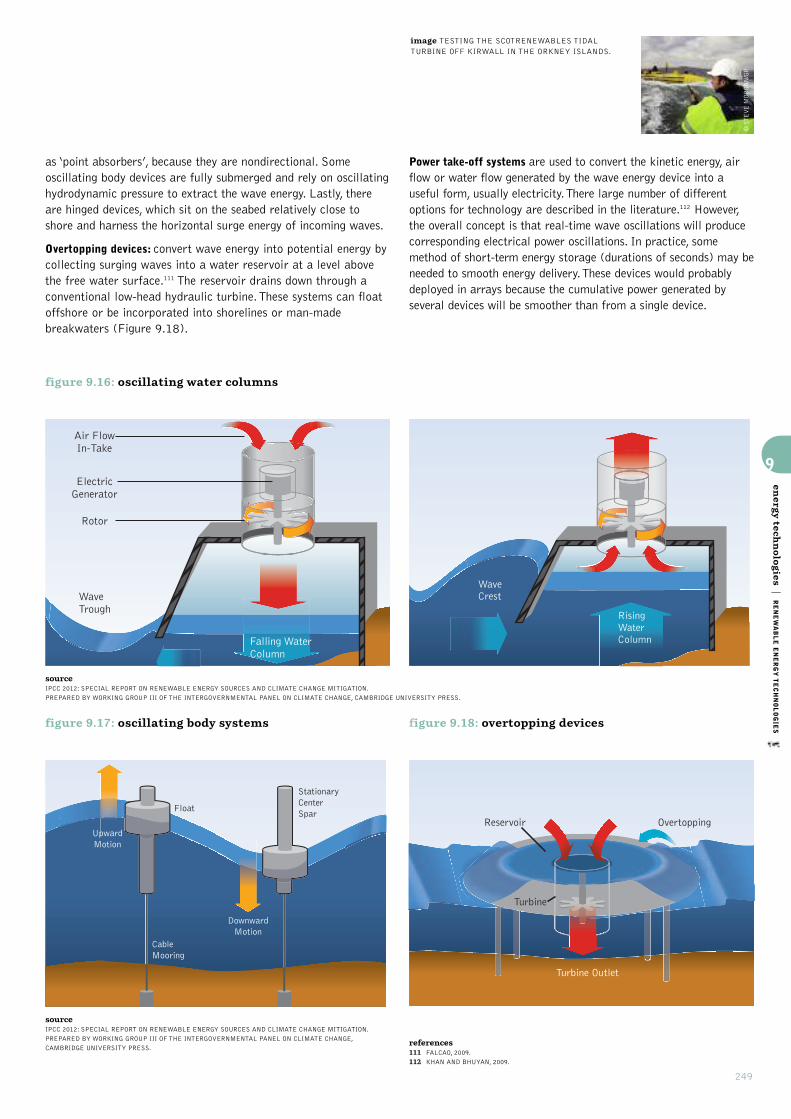
249
as ‘point absorbers’, because they are nondirectional. Someoscillating body devices are fully submerged and rely on oscillatinghydrodynamic pressure to extract the wave energy. Lastly, thereare hinged devices, which sit on the seabed relatively close toshore and harness the horizontal surge energy of incoming waves.
Overtopping devices: convert wave energy into potential energy bycollecting surging waves into a water reservoir at a level abovethe free water surface.111 The reservoir drains down through aconventional low-head hydraulic turbine. These systems can floatoffshore or be incorporated into shorelines or man-madebreakwaters (Figure 9.18).
Power take-off systems are used to convert the kinetic energy, airflow or water flow generated by the wave energy device into auseful form, usually electricity. There large number of differentoptions for technology are described in the literature.112 However,the overall concept is that real-time wave oscillations will producecorresponding electrical power oscillations. In practice, somemethod of short-term energy storage (durations of seconds) may beneeded to smooth energy delivery. These devices would probablydeployed in arrays because the cumulative power generated byseveral devices will be smoother than from a single device.
9
energ
y technolo
gies
|RENEWABLE ENERGY TECHNOLOGIESfigure 9.17: oscillating body systems
CableMooring
StationaryCenterSpar
Float
UpwardMotion
DownwardMotion
sourceIPCC 2012: SPECIAL REPORT ON RENEWABLE ENERGY SOURCES AND CLIMATE CHANGE MITIGATION.
PREPARED BY WORKING GROUP III OF THE INTERGOVERNMENTAL PANEL ON CLIMATE CHANGE,
CAMBRIDGE UNIVERSITY PRESS.
figure 9.18: overtopping devices
Turbine Outlet
OvertoppingReservoir
Turbine
WaveCrest
Rising WaterColumnFalling Water
Column
Rotor
WaveTrough
ElectricGenerator
Air FlowIn-Take
figure 9.16: oscillating water columns
WaveCrest
Rising WaterColumnFalling Water
Column
Rotor
WaveTrough
ElectricGenerator
Air FlowIn-Take
sourceIPCC 2012: SPECIAL REPORT ON RENEWABLE ENERGY SOURCES AND CLIMATE CHANGE MITIGATION.
PREPARED BY WORKING GROUP III OF THE INTERGOVERNMENTAL PANEL ON CLIMATE CHANGE, CAMBRIDGE UNIVERSITY PRESS.
references111 FALCAO, 2009.
112 KHAN AND BHUYAN, 2009.
© STEVE MORGAN/GP
image TESTING THE SCOTRENEWABLES TIDALTURBINE OFF KIRWALL IN THE ORKNEY ISLANDS.
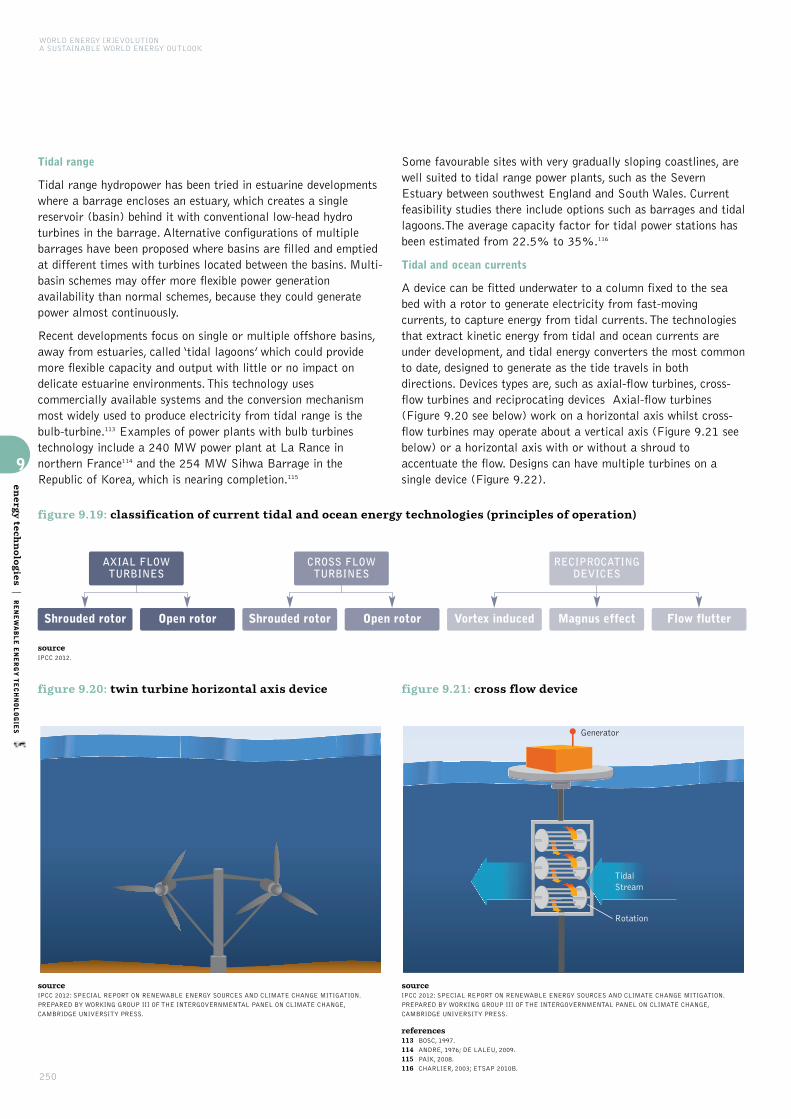
WORLD ENERGY [R]EVOLUTIONA SUSTAINABLE WORLD ENERGY OUTLOOK
250
Tidal range
Tidal range hydropower has been tried in estuarine developmentswhere a barrage encloses an estuary, which creates a singlereservoir (basin) behind it with conventional low-head hydroturbines in the barrage. Alternative configurations of multiplebarrages have been proposed where basins are filled and emptiedat different times with turbines located between the basins. Multi-basin schemes may offer more flexible power generationavailability than normal schemes, because they could generatepower almost continuously.
Recent developments focus on single or multiple offshore basins,away from estuaries, called ‘tidal lagoons’ which could providemore flexible capacity and output with little or no impact ondelicate estuarine environments. This technology usescommercially available systems and the conversion mechanismmost widely used to produce electricity from tidal range is thebulb-turbine.113 Examples of power plants with bulb turbinestechnology include a 240 MW power plant at La Rance innorthern France114 and the 254 MW Sihwa Barrage in theRepublic of Korea, which is nearing completion.115
Some favourable sites with very gradually sloping coastlines, arewell suited to tidal range power plants, such as the SevernEstuary between southwest England and South Wales. Currentfeasibility studies there include options such as barrages and tidallagoons.The average capacity factor for tidal power stations hasbeen estimated from 22.5% to 35%.116
Tidal and ocean currents
A device can be fitted underwater to a column fixed to the seabed with a rotor to generate electricity from fast-movingcurrents, to capture energy from tidal currents. The technologiesthat extract kinetic energy from tidal and ocean currents areunder development, and tidal energy converters the most commonto date, designed to generate as the tide travels in bothdirections. Devices types are, such as axial-flow turbines, cross-flow turbines and reciprocating devices Axial-flow turbines(Figure 9.20 see below) work on a horizontal axis whilst cross-flow turbines may operate about a vertical axis (Figure 9.21 seebelow) or a horizontal axis with or without a shroud toaccentuate the flow. Designs can have multiple turbines on asingle device (Figure 9.22).
9
energ
y technolo
gies
|RENEWABLE ENERGY TECHNOLOGIES
figure 9.20: twin turbine horizontal axis device
sourceIPCC 2012: SPECIAL REPORT ON RENEWABLE ENERGY SOURCES AND CLIMATE CHANGE MITIGATION.
PREPARED BY WORKING GROUP III OF THE INTERGOVERNMENTAL PANEL ON CLIMATE CHANGE,
CAMBRIDGE UNIVERSITY PRESS.
sourceIPCC 2012.
figure 9.21: cross flow device
Rotation
Generator
TidalStream
sourceIPCC 2012: SPECIAL REPORT ON RENEWABLE ENERGY SOURCES AND CLIMATE CHANGE MITIGATION.
PREPARED BY WORKING GROUP III OF THE INTERGOVERNMENTAL PANEL ON CLIMATE CHANGE,
CAMBRIDGE UNIVERSITY PRESS.
references113 BOSC, 1997.
114 ANDRE, 1976; DE LALEU, 2009.
115 PAIK, 2008.
116 CHARLIER, 2003; ETSAP 2010B.
figure 9.19: classification of current tidal and ocean energy technologies (principles of operation)
Shrouded rotor Open rotor Shrouded rotor Open rotor Vortex induced Magnus effect Flow flutter
AXIAL FLOWTURBINES
CROSS FLOWTURBINES
RECIPROCATINGDEVICES

251
Marine turbine designs look somewhat like wind turbines but theymust contend with reversing flows, cavitation and harsh underwatermarine conditions (e.g. salt water corrosion, debris, fouling, etc).Axial flow turbines must be able to respond to reversing flowdirections, while cross-flow turbines continue to operate regardlessof current flow direction. Rotor shrouds (also known as cowlings orducts) can enhance hydrodynamic performance by increasing thespeed of water through the rotor and reducing losses at the tips.Some technologies in the conceptual stage of development arebased on reciprocating devices incorporating hydrofoils or tidalsails. Two prototype oscillating devices have been trialled at opensea locations in the UK.117
The development of the tidal current resource will requiremultiple machines deployed in a similar fashion to a wind farm,and siting will need to take into account wake effects.118
Capturing the energy of open-ocean current systems is likely torequire the same basic technology as for tidal flows but withsome different infrastructure. Deep-water applications mayrequre neutrally buoyant turbine/generator modules with mooringlines and anchor systems or they could be attached to otherstructures, such as offshore platforms.119 These modules will alsohave hydrodynamic lifting designs to allow optimal and flexiblevertical positioning.120 Systems to capture energy from openocean current systems may have larger rotors, as there is norestriction based on the channel size.
9.3.8 renewable heating and cooling technologies
Renewable heating and cooling has a long tradition in humanculture. Heat can come from the sun (solar thermal), the earth(geothermal), ambient heat and plant matter (biomass). Usingsolar heat for drying processes and or wood stoves for cookinghave been done for so long that they labeled “traditional”, buttoday’s technologies are far from old-fashioned. Over the lastdecade there have been improvements to a range of traditionalapplications many of which are already economical competitivewith fossil-fuel based technologies or starting to be.
This chapter presents the current range of renewable heating andcooling technologies and gives a short outlook of the mostsophisticated technologies, integrating multiple suppliers andusers in heat networks or even across various renewable energysources in integrated heating and cooling systems. Some of theemerging areas for this technology are building heating andcooling and industrial process heat.
Solar Thermal Technologies
Solar thermal energy has been used for the production of heat forcenturies but has become more popular and developedcommercially for the last thirty years. Solar thermal collectingsystems are based on a centuries-old principle: the sun heats upwater contained in a dark vessel.
The technologies on the market now are efficient and highlyreliable, providing energy for a wide range of applications indomestic and commercial buildings, swimming pools, forindustrial process heat, in cooling and the desalination fordrinking water.
Although mature products exist to provide domestic hot waterand space heating using solar energy, in most countries they arenot yet the norm. A big step towards an Energy [R]evolution isintegrating solar thermal technologies into buildings at the designstage or when the heating (and cooling) system is being replaced,lowering the installation cost.
Swimming pool heating: Pools can make simple use of freeheating, using unglazed water collectors. They are mostly made ofplastic, have no insulation and reach temperatures just a fewdegrees above ambient temperature. Collectors used for heatingswimming pools and are either installed on the ground or on anearby rooftop and they word by pumping swimming pool waterthrough the collector directly. The size of such a system dependson the size of the pool as well as the seasons in which the pool isused. The collector area needed is about 50 % to 70 % of thepool surface. The average size of an unglazed water collectorsystem installed in Europe is about 200 m2.121
Domestic hot water systems: The major application of solar thermalheating so far is for domestic hot water systems. Depending on theconditions and the system’s configuration, most of a building’s hotwater requirements can be provided by solar energy. Largersystems can additionally cover a substantial part of the energyneeded for space heating. Two major collector types are:
9
energ
y technolo
gies
|RENEWABLE ENERGY TECHNOLOGIES
figure 9.22: vertical axis device
sourceIPCC 2012: SPECIAL REPORT ON RENEWABLE ENERGY SOURCES AND CLIMATE CHANGE MITIGATION.
PREPARED BY WORKING GROUP III OF THE INTERGOVERNMENTAL PANEL ON CLIMATE CHANGE,
CAMBRIDGE UNIVERSITY PRESS.
references117 ENGINEERING BUSINESS, 2003; TSB, 2010.
118 PEYRARD ET AL. 2006.
119 VANZWIETEN ET AL., 2005.
120 VENEZIA AND HOLT, 1995; RAYE, 2001; VANZWIETEN ET AL., 2005.
121 WEISS ET AL. 2011.
© MCDONNELL/ISTOCK
image THE PELAMIS WAVE POWER MACHINE IN ORKNEY - ALONGSIDE IN LYNESS -THE MACHINE IS THE P2 . THE PELAMIS ABSORBS THE ENERGY OF OCEAN WAVESAND CONVERTS IT INTO ELECTRICITY. ALL GENERATION SYSTEMS ARE SEALED ANDDRY INSIDE THE MACHINES AND POWER IS TRANSMITTED TO SHORE USINGSTANDARD SUBSEA CABLES AND EQUIPMENT.
image OCEAN ENERGY.
© STEVE MORGAN/GP
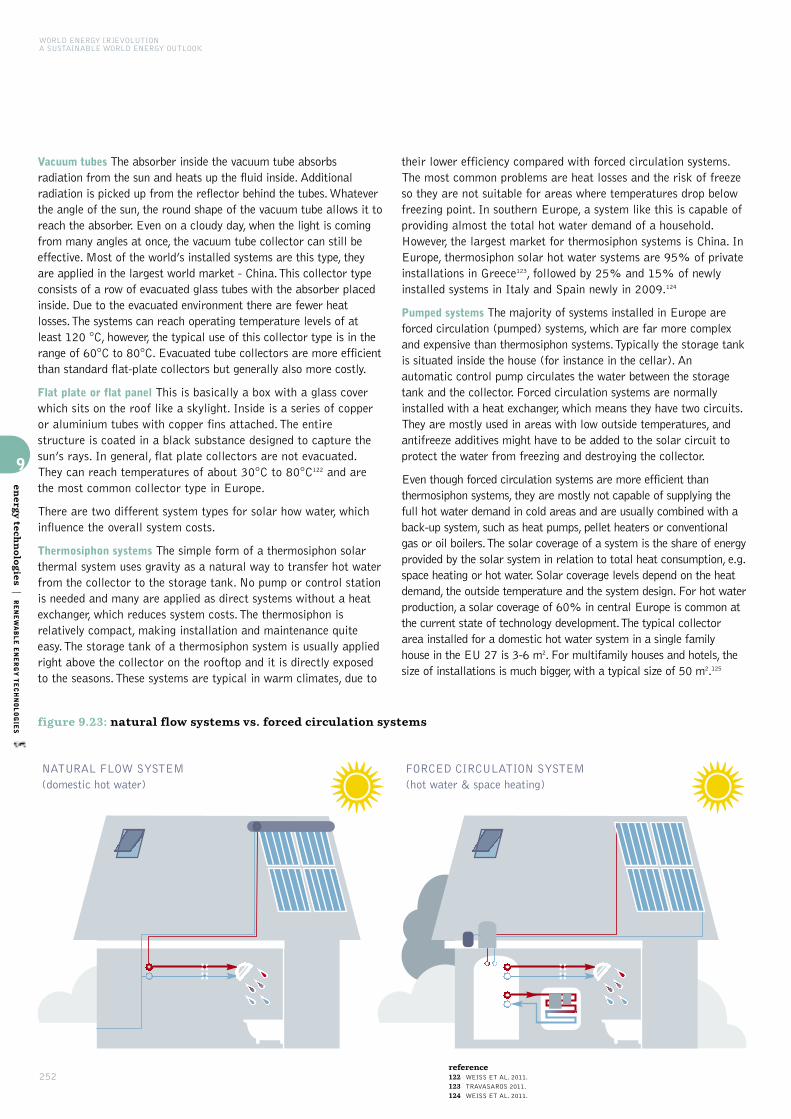
WORLD ENERGY [R]EVOLUTIONA SUSTAINABLE WORLD ENERGY OUTLOOK
252
Vacuum tubes The absorber inside the vacuum tube absorbsradiation from the sun and heats up the fluid inside. Additionalradiation is picked up from the reflector behind the tubes. Whateverthe angle of the sun, the round shape of the vacuum tube allows it toreach the absorber. Even on a cloudy day, when the light is comingfrom many angles at once, the vacuum tube collector can still beeffective. Most of the world’s installed systems are this type, theyare applied in the largest world market - China. This collector typeconsists of a row of evacuated glass tubes with the absorber placedinside. Due to the evacuated environment there are fewer heatlosses. The systems can reach operating temperature levels of atleast 120 °C, however, the typical use of this collector type is in therange of 60°C to 80°C. Evacuated tube collectors are more efficientthan standard flat-plate collectors but generally also more costly.
Flat plate or flat panel This is basically a box with a glass coverwhich sits on the roof like a skylight. Inside is a series of copperor aluminium tubes with copper fins attached. The entirestructure is coated in a black substance designed to capture thesun’s rays. In general, flat plate collectors are not evacuated.They can reach temperatures of about 30°C to 80°C122 and arethe most common collector type in Europe.
There are two different system types for solar how water, whichinfluence the overall system costs.
Thermosiphon systems The simple form of a thermosiphon solarthermal system uses gravity as a natural way to transfer hot waterfrom the collector to the storage tank. No pump or control stationis needed and many are applied as direct systems without a heatexchanger, which reduces system costs. The thermosiphon isrelatively compact, making installation and maintenance quiteeasy. The storage tank of a thermosiphon system is usually appliedright above the collector on the rooftop and it is directly exposedto the seasons. These systems are typical in warm climates, due to
their lower efficiency compared with forced circulation systems.The most common problems are heat losses and the risk of freezeso they are not suitable for areas where temperatures drop belowfreezing point. In southern Europe, a system like this is capable ofproviding almost the total hot water demand of a household.However, the largest market for thermosiphon systems is China. InEurope, thermosiphon solar hot water systems are 95% of privateinstallations in Greece123, followed by 25% and 15% of newlyinstalled systems in Italy and Spain newly in 2009.124
Pumped systems The majority of systems installed in Europe areforced circulation (pumped) systems, which are far more complexand expensive than thermosiphon systems. Typically the storage tankis situated inside the house (for instance in the cellar). Anautomatic control pump circulates the water between the storagetank and the collector. Forced circulation systems are normallyinstalled with a heat exchanger, which means they have two circuits.They are mostly used in areas with low outside temperatures, andantifreeze additives might have to be added to the solar circuit toprotect the water from freezing and destroying the collector.
Even though forced circulation systems are more efficient thanthermosiphon systems, they are mostly not capable of supplying thefull hot water demand in cold areas and are usually combined with aback-up system, such as heat pumps, pellet heaters or conventionalgas or oil boilers. The solar coverage of a system is the share of energyprovided by the solar system in relation to total heat consumption, e.g.space heating or hot water. Solar coverage levels depend on the heatdemand, the outside temperature and the system design. For hot waterproduction, a solar coverage of 60% in central Europe is common atthe current state of technology development. The typical collectorarea installed for a domestic hot water system in a single familyhouse in the EU 27 is 3-6 m2. For multifamily houses and hotels, thesize of installations is much bigger, with a typical size of 50 m2.125
9
energ
y technolo
gies
|RENEWABLE ENERGY TECHNOLOGIES figure 9.23: natural flow systems vs. forced circulation systems
NATURAL FLOW SYSTEM (domestic hot water)
FORCED CIRCULATION SYSTEM (hot water & space heating)
reference122 WEISS ET AL. 2011.
123 TRAVASAROS 2011.
124 WEISS ET AL. 2011.

253
Domestic heat systems: Besides domestic hot water systems, solarthermal energy for space heating systems is becoming increasinglyrelevant in European countries. In fact, the EU 27 is the largestmarket for this application at the moment, with Germany andAustria as the main driving forces. The collectors used for thisarea of operation are the same as for domestic hot water systems,however, for solar space heating purposes, only pumped systemsare applicable. Effectively most systems used are so called combi-systems that provide space as well as water heating.
So far the majority of installations are applied to single-familyhouses with a typical system size between 6 and 16 m2 and atypical annual solar coverage of 25 % in central Europe.126
Solar combi-systems for multiple family houses are not yet usedvery frequently. These systems are about 50 m2, cost approximately470-550 €/m2 and an have annual solar coverage of 25% incentral Europe.127 Large scale solar thermal applications that areconnected to a local or district heating grid with a collector areaabove 500 m2 are not so common. However, since 1985, systeminstallation rates have increased in the EU with a typical annualsolar coverage of 15% in central Europe.128 To get a significantsolar share a large storage needs to be applied. The typical solarcoverage of such a system including storage is around 50% today.With seasonal storage the coverage may be increased to about80%.129 Another option for domestic heating systems is aircollector systems which are not explicitly described here. Thelargest market for air collectors are in North America and Asia,and have a very small penetration to the European market thoughit has been increasing in recent years.
Process heat: Solar thermal use for industrial process heat isreceiving some attention for development, although it is hardly inuse today. Standardised systems are not available becauseindustrial processes are often individually designed. Also solarthermal applications are mostly not capable of providing 100% ofthe heat required over a year, so another non-solar heat sourcewould be necessary for commercial use.
Depending on the temperature level needed, different collectorshave been developed to serve the requirements for process heat.Flat plates or evacuated tube collectors provide a temperaturerange up to 80 °C a and a large number are available on themarket. For temperatures between 80°C and 120°C advanced flat-plate collectors are available e.g. with multiple glassing,antireflective coating, evacuated or using an inert gas filling. Otheroptions are flat-plate and evacuated tube collectors withcompound parabolic concentrators. These collectors can bestationary and are generally constructed to concentrate solarradiation by a factor of 1 to 2. They can use most of the diffuseradiation which makes them especially attractive for areas withlow direct solar radiation.
There are a few conceptual designs to reach higher temperaturesbetween 80°C and 180°C, primarily using a parabolic trough orlinear concentrating Fresnel collectors.130 These collector typeshave a higher concentration factor than CPC collectors, are onlycapable of using direct solar radiation and have to be combinedwith sun tracking systems. The collectors especially designed forheat use are most suitable for a temperature range between150°C and 250°C.131 Air collector systems for process heat arelimited to lower temperatures, being mostly used for to dryingpurposes (e.g. hay) and are not discussed here.
Cooling: Solar chillers use thermal energy to produce coolingand/or dehumidify the air in a similar way to a refrigerator orconventional air-conditioning. This application is well-suited tosolar thermal energy, as the demand for cooling is often greatestwhen there is most sunshine. Solar cooling has been successfullydemonstrated and large-scale use can be expected in the future,but is still not widely used.
The option to use solar heat this way makes sense because hotregions require more cooling for comfort. Solar thermal cooling ismostly designed as a closed-loop sorption system (see box 9.3).The most common application, however, is a solar absorptioncooling unit. The system requires temperatures above 80°C whichrequires evacuated tube collectors, advanced flat-plate collectorsand compound parabolic concentrators. The solar field requiredfor a cooling unit is about 4 m2 per kW of cooling capacity.
9
energ
y technolo
gies
|RENEWABLE ENERGY TECHNOLOGIES
reference125 WEISS ET AL. 2011; NITSCH ET AL. 2010; JAGER ET AL. 2011.
126 WEISS ET AL. 2011; NITSCH ET AL. 2010; JAGER ET AL. 2011.
127 WEISS ET AL. 2011; NITSCH ET AL. 2010; JAGER ET AL. 2011.
128 WEISS ET AL. 2011; NITSCH ET AL. 2010; JAGER ET AL. 2011.
129 NITSCH ET AL. 2010.
130 THESE COLLECTOR TYPES ARE PRIMARILY USED IN SOLAR THERMAL POWER PLANTS AND REACH
TEMPERATURE LEVELS AROUND 400°C. FOR THE SEGMENT OF PROCESS HEAT THESE COLLECTOR
TYPES WHERE DEVELOPED FURTHER TO MEET THE SPECIFIC REQUIREMENTS OF THIS SEGMENT
WITH TEMPERATURE LEVELS UP TO 250°C.
131 WEISS ET AL. 2011; NITSCH ET AL. 2010; JAGER ET AL. 2011.
reference122 WEISS ET AL. 2011.
123 TRAVASAROS 2011.
124 WEISS ET AL. 2011.
© GP/S. M
ALHOTRA
image THE SOLAR THERMAL PLANT SET UP BY TRANS SOLAR TECHNOLOGIES, INCOLLABORATION WITH THE HOLY FAMILY HOSPITAL, NEW DELHI. A PERFECT EXAMPLE OF ASMALL SCALE, DECENTRALIZED-RENEWABLE ENERGY PROJECT, THE PLANT SUPPLIES 22,000LITRES OF HOT WATER EVERYDAY TO THE HOSPITAL FOR ITS VARIOUS NEEDS. SUNNY GEORGE,THE HOSPITAL’S MAINTENANCE OFFICER IS ON THE ROOF.

WORLD ENERGY [R]EVOLUTIONA SUSTAINABLE WORLD ENERGY OUTLOOK
254
9.3.9 geothermal, hydrothermal and aerothermal energy
The three categories of environmental heat are geothermal,hydrothermal and aerothermal energy. Geothermal energy is theenergy stored in the Earth’s crust, i.e. in rock and subsurfacefluids. The main source of geothermal energy is the internal heatflow from the Earth’s mantle and core into the crust, which itselfis replenished mainly by heat from the decay of radioactiveisotopes. At depths of a few meters, the soil is also warmed bythe atmosphere. Geothermal energy is available all year round, 24 hours a day and is independent from climatic conditions.Hydrothermal energy is the energy stored in surface waters -rivers, lakes, and the sea. Hydrothermal energy is availablepermanently at temperature level similar to that of shallowgeothermal energy. Aerothermal energy is the thermal energystored in the Earth’s atmosphere, which originally comes fromthe sun, but has been buffered by the atmosphere. Aerothermalenergy is available uninterruptedly, albeit with variations inenergy content due to climatic and regional differences.
Deep geothermal energy (geothermal reservoirs)
On average, the crust’s temperature increases by 25-30°C perkm, reaching around 100°C at 3 km depth in most regions of theworld. High temperature fields with that reach over 180°C can befound at this depth in areas with volcanic activity. “Deepgeothermal reservoirs” generally refer to geothermal reservoirsmore than 400m depth, where reservoir temperatures typicallyexceed 50°C. Depending on reservoir temperature, deepgeothermal energy is used to generate electricity and/or to supplyhot water for various thermal applications, e.g. for district heat,balneology etc. Temperatures in geothermal reservoirs less that400m deep are typically below 30°C which is too low for mostdirect use applications or electricity production. In these shallow
fields, heat pumps are applied to increase the temperature levelof the heat extracted from shallow geothermal reservoirs.
The use of geothermal energy for heating purposes or for thegeneration of electricity depends on the availability of steam orhot water as a heat transfer medium. In hydrothermal systems, hotwater or water vapour can be tapped directly from the reservoir.Technologies to exploit hydrothermal systems are already wellestablished and are in operation in many parts of the world.However, the there is limited availability of aquifers with sufficienttemperature and water production rate at favourable depth. InEurope, high temperature (above 180°C) hydrothermal reservoirs,generally containing steam, are found in Iceland and Italy.
Hydrothermal systems with aquifer lowers temperatures (below180°C) can also be used to produce electricity and heat in otherregions. They contain warm water or a water-steam mixture. Incontrast to hydrothermal systems, EGS systems do not require ahot aquifer; the heat carrier is the rock itself. They can thusvirtually found everywhere. The natural permeability of thesereservoirs generally does not allow a sufficient water flow fromthe injection to the production well, so energy projects require theartificial injection of water into the reservoir, which they do byfracturing rock underground. Water is injected from the surfaceinto the reservoir, where the surrounding rock acts as a heatexchanger. The heated water is pumped back to the surface tosupply a power plant or a heating network. While enhancedgeothermal systems promise large potentials both for electricitygeneration and direct use, they are still in the pre-commercialisation phase.
Direct use of geothermal energy
(Deep) geothermal heat from aquifers or deep reservoirs can beused directly in hydrothermal heating plants to supply heatdemand nearby or in a district heating network. Networks providespace heat, hot water in households and health facilities or lowtemperature process heat (industry, agriculture and services). Inthe surface unit, hot water from the production well is eitherdirectly fed into a heat distribution network (“open loopsystem”). Alternatively, heat is transferred from the geothermalfluid to a secondary heat distribution network via heatexchangers (“closed loop system”). Heating networktemperatures are typically in the range 60-100°C. However,higher temperatures are possible if wet or dry steam reservoirsare exploited or if heat pumps are switched into the heatdistribution circuit. In these cases, geothermal energy may alsosupply process heat applications which require temperaturesabove 100°C.
Alternatively, deep borehole heat exchangers can exploit therelatively high temperature at depths between 300 and 3,000m(20 – 110°C) by circulating a working fluid in a borehole in aheat exchanger between the surface and the depth. Heat pumpscan be used to increase the temperature of the useful heat, ifrequired. The overall efficiency of geothermal heat use can beraised if several thermal direct-use applications with successivelower temperature levels are connected in series (concept of
9
energ
y technolo
gies
|RENEWABLE ENERGY TECHNOLOGIES
box 9.3: sorption cooling units
A thermo-chemical refrigerant cycle (sorption) providescold by either ab- or adsorption cooling. Absorption occurswhen a gaseous or liquid substance is taken up by anothersubstance, e.g. the solution of a gas in a liquid. Adsorptiontakes place when a liquid or gaseous substance is bound tothe surface of a solid material.
The absorption cooling circle can be described as follows: Aliquid refrigerant with a very low boiling point is vaporisedat low pressure withdrawing heat from its environment andtherefore providing the desired cool. The gaseous refrigerantis then absorbed by a liquid solvent, mostly water. Therefrigerant and solvent are separated again by adding(renewable) heat to the system, making use of the differentboiling points. The gaseous refrigerant is now condensed,released and returned to the beginning of the process. Theheat, which is needed in the process, can be provided e.g. byfiring natural gas, combined heat and power plants or solarthermal collectors.
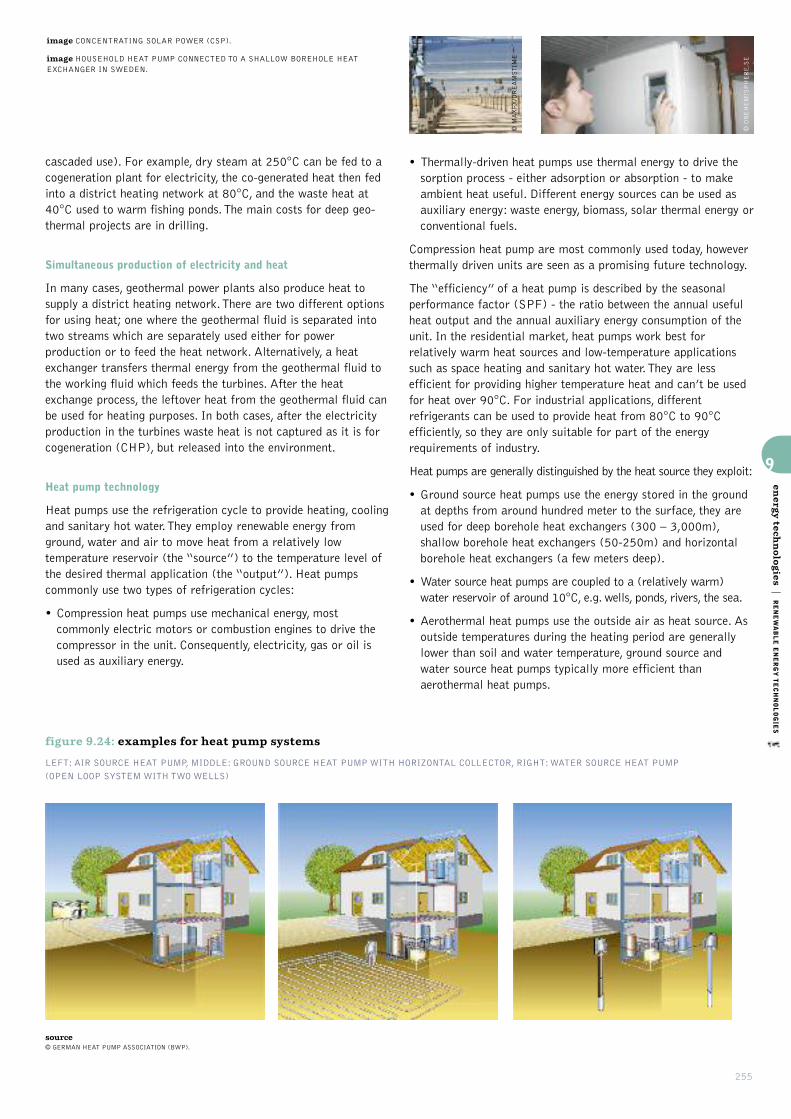
255
cascaded use). For example, dry steam at 250°C can be fed to acogeneration plant for electricity, the co-generated heat then fedinto a district heating network at 80°C, and the waste heat at40°C used to warm fishing ponds. The main costs for deep geo-thermal projects are in drilling.
Simultaneous production of electricity and heat
In many cases, geothermal power plants also produce heat tosupply a district heating network. There are two different optionsfor using heat; one where the geothermal fluid is separated intotwo streams which are separately used either for powerproduction or to feed the heat network. Alternatively, a heatexchanger transfers thermal energy from the geothermal fluid tothe working fluid which feeds the turbines. After the heatexchange process, the leftover heat from the geothermal fluid canbe used for heating purposes. In both cases, after the electricityproduction in the turbines waste heat is not captured as it is forcogeneration (CHP), but released into the environment.
Heat pump technology
Heat pumps use the refrigeration cycle to provide heating, coolingand sanitary hot water. They employ renewable energy fromground, water and air to move heat from a relatively lowtemperature reservoir (the “source”) to the temperature level ofthe desired thermal application (the “output”). Heat pumpscommonly use two types of refrigeration cycles:
• Compression heat pumps use mechanical energy, mostcommonly electric motors or combustion engines to drive thecompressor in the unit. Consequently, electricity, gas or oil isused as auxiliary energy.
• Thermally-driven heat pumps use thermal energy to drive thesorption process - either adsorption or absorption - to makeambient heat useful. Different energy sources can be used asauxiliary energy: waste energy, biomass, solar thermal energy orconventional fuels.
Compression heat pump are most commonly used today, howeverthermally driven units are seen as a promising future technology.
The “efficiency” of a heat pump is described by the seasonalperformance factor (SPF) - the ratio between the annual usefulheat output and the annual auxiliary energy consumption of theunit. In the residential market, heat pumps work best forrelatively warm heat sources and low-temperature applicationssuch as space heating and sanitary hot water. They are lessefficient for providing higher temperature heat and can’t be usedfor heat over 90°C. For industrial applications, differentrefrigerants can be used to provide heat from 80°C to 90°Cefficiently, so they are only suitable for part of the energyrequirements of industry.
Heat pumps are generally distinguished by the heat source they exploit:
• Ground source heat pumps use the energy stored in the groundat depths from around hundred meter to the surface, they areused for deep borehole heat exchangers (300 – 3,000m),shallow borehole heat exchangers (50-250m) and horizontalborehole heat exchangers (a few meters deep).
• Water source heat pumps are coupled to a (relatively warm)water reservoir of around 10°C, e.g. wells, ponds, rivers, the sea.
• Aerothermal heat pumps use the outside air as heat source. Asoutside temperatures during the heating period are generallylower than soil and water temperature, ground source andwater source heat pumps typically more efficient thanaerothermal heat pumps.
9
energ
y technolo
gies
|RENEWABLE ENERGY TECHNOLOGIES
figure 9.24: examples for heat pump systems
LEFT: AIR SOURCE HEAT PUMP, MIDDLE: GROUND SOURCE HEAT PUMP WITH HORIZONTAL COLLECTOR, RIGHT: WATER SOURCE HEAT PUMP
(OPEN LOOP SYSTEM WITH TWO WELLS)
source© GERMAN HEAT PUMP ASSOCIATION (BWP).
© MAXFX/DREAMSTIME
© ONEHEMISPHERE.SE
image CONCENTRATING SOLAR POWER (CSP).
image HOUSEHOLD HEAT PUMP CONNECTED TO A SHALLOW BOREHOLE HEATEXCHANGER IN SWEDEN.

WORLD ENERGY [R]EVOLUTIONA SUSTAINABLE WORLD ENERGY OUTLOOK
256
Heat pumps require additional energy apart from theenvironmental heat extracted from the heat source, so theirenvironmental benefit depends on both their efficiency and theemissions related to the production of the working energy. Wherethe heat pump technology has low SPF and a high share ofelectricity from coal power plants, for example, carbon dioxideemissions relative to useful heat production might higher thanconventional gas condensing boilers. On the other hand, efficientheat pumps powered with “green” electricity are 100% emission-free solutions that contribute significantly to the reduction ofgreenhouse gas emissions when used in place of fossil-fuel firedheating systems.
Aerothermal heat pumps do not require drilling whichsignificantly reduces system costs compared to other types.
If waste heat from fossil fuel fired processes is used as heatsource for this technology, the heat provided cannot be classifiedas “renewable” - it becomes merely an efficient way of makingbetter use of energy otherwise wasted.
Heat pumps for cooling
Reversible heat pumps can be operated both in heating and in coolingmode. When running in cooling mode in summer, heat is extractedfrom the building and “pumped” into the underground reservoir whichis then heated. In this way, the temperature of the warm reservoir inthe ground is restored after its exploitation in winter.
Alternatively, renewable cooling could be provided by circulating acooling fluid through the relatively cool ground before beingdistributed in a building’s heating/cooling system (“free cooling”).However this cooling fluid must not be based on chemicals thatare damaging to the upper atmosphere such as HFC’s ( a stronggreenhouse gas) or CFC’s (ozone-depleting gas).
In principle, high enthalpy geothermal heat might provide theenergy needed to drive an absorption chiller (see Box 9.3:Sorption cooling units). However, only a very limited number ofgeothermal absorption chillers are in operation world-wide.
9
energ
y technolo
gies
|RENEWABLE ENERGY TECHNOLOGIES
box 9.4: typical heat pump specifications
Usually provide hot water or space heat at lowertemperatures, around 35°C
Example uses: underfloor/wall heating
Typical size for space heating a single family housepurposes: approx 5-10 kWth
Typical size for space heating a large office building: >100 kWth.
box 9.5: district heat networks
Heat networks are preferably used in populated areas suchas large cities. Their advantages include reduction of localemissions, higher efficiency (in particular withcogeneration), or a lesser need for infrastructures that goalong with individual heating solutions. Generally heat fromall sources can be used in heat networks. However, there aresome applications like cogeneration technologies that havea special need for a secure heat demand provided by heatnetworks to be able to operate economically.
Managing the variations in heat supply and demand is vitalfor high shares of renewables, which is more challenging forspace heat and hot water than for electricity. Heat networkshelp even out peaks in demand by connecting a largenumber of clients, and supply can be adjusted by tappingvarious renewable sources and relatively cheap storageoptions. The use of an existing heat network for renewableheat depends on the competitiveness of the new heatapplications or plants. The development of new gridshowever is not an easy task.
The relevant factors to assess whether a new heat networkis economically competitive compared to other heating orcooling options are:
• Heat density (heat demand per area) of buildinginfrastructure, depending on housing density and thespecific heat demand of the buildings
• Obligation to connect to the network (leads to highereffective heat density)
• Existing buildings’ infrastructure or newly developedareas, where grid installation can be integrated inbuilding site preparation
• Existence of competing infrastructures such as gas grids
• Size of the heat network and distance to the remotest client
The combination and interdependence of these factorsmean the costs of a heat network are highly variable andproject-specific so no general indication of investment costcan be made. A German example in 2009 was thedevelopment of heat networks under the market incentiveprogram which had average investment costs (includingbuilding connection) in the range of 350 to 460 €/kW.
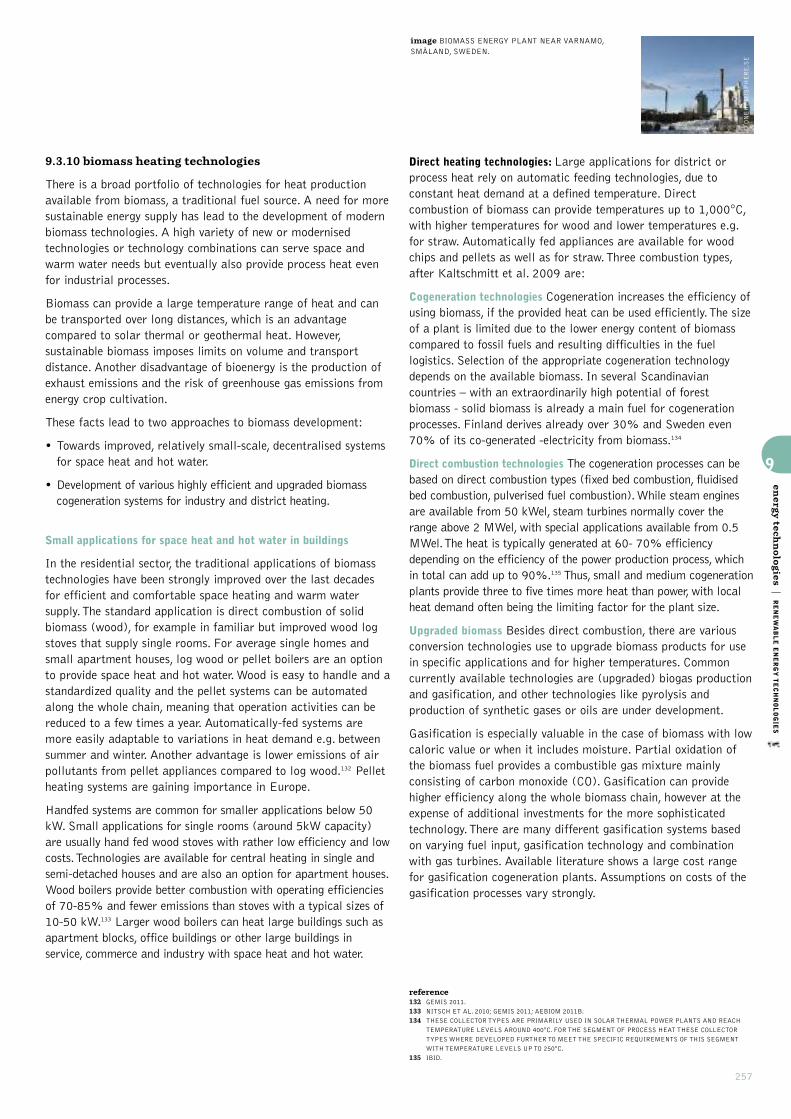
257
9.3.10 biomass heating technologies
There is a broad portfolio of technologies for heat productionavailable from biomass, a traditional fuel source. A need for moresustainable energy supply has lead to the development of modernbiomass technologies. A high variety of new or modernisedtechnologies or technology combinations can serve space andwarm water needs but eventually also provide process heat evenfor industrial processes.
Biomass can provide a large temperature range of heat and canbe transported over long distances, which is an advantagecompared to solar thermal or geothermal heat. However,sustainable biomass imposes limits on volume and transportdistance. Another disadvantage of bioenergy is the production ofexhaust emissions and the risk of greenhouse gas emissions fromenergy crop cultivation.
These facts lead to two approaches to biomass development:
• Towards improved, relatively small-scale, decentralised systemsfor space heat and hot water.
• Development of various highly efficient and upgraded biomasscogeneration systems for industry and district heating.
Small applications for space heat and hot water in buildings
In the residential sector, the traditional applications of biomasstechnologies have been strongly improved over the last decadesfor efficient and comfortable space heating and warm watersupply. The standard application is direct combustion of solidbiomass (wood), for example in familiar but improved wood logstoves that supply single rooms. For average single homes andsmall apartment houses, log wood or pellet boilers are an optionto provide space heat and hot water. Wood is easy to handle and astandardized quality and the pellet systems can be automatedalong the whole chain, meaning that operation activities can bereduced to a few times a year. Automatically-fed systems aremore easily adaptable to variations in heat demand e.g. betweensummer and winter. Another advantage is lower emissions of airpollutants from pellet appliances compared to log wood.132 Pelletheating systems are gaining importance in Europe.
Handfed systems are common for smaller applications below 50kW. Small applications for single rooms (around 5kW capacity)are usually hand fed wood stoves with rather low efficiency and lowcosts. Technologies are available for central heating in single andsemi-detached houses and are also an option for apartment houses.Wood boilers provide better combustion with operating efficienciesof 70-85% and fewer emissions than stoves with a typical sizes of10-50 kW.133 Larger wood boilers can heat large buildings such asapartment blocks, office buildings or other large buildings inservice, commerce and industry with space heat and hot water.
Direct heating technologies: Large applications for district orprocess heat rely on automatic feeding technologies, due toconstant heat demand at a defined temperature. Directcombustion of biomass can provide temperatures up to 1,000°C,with higher temperatures for wood and lower temperatures e.g.for straw. Automatically fed appliances are available for woodchips and pellets as well as for straw. Three combustion types,after Kaltschmitt et al. 2009 are:
Cogeneration technologies Cogeneration increases the efficiency ofusing biomass, if the provided heat can be used efficiently. The sizeof a plant is limited due to the lower energy content of biomasscompared to fossil fuels and resulting difficulties in the fuellogistics. Selection of the appropriate cogeneration technologydepends on the available biomass. In several Scandinaviancountries – with an extraordinarily high potential of forestbiomass - solid biomass is already a main fuel for cogenerationprocesses. Finland derives already over 30% and Sweden even70% of its co-generated -electricity from biomass.134
Direct combustion technologies The cogeneration processes can bebased on direct combustion types (fixed bed combustion, fluidisedbed combustion, pulverised fuel combustion). While steam enginesare available from 50 kWel, steam turbines normally cover therange above 2 MWel, with special applications available from 0.5MWel. The heat is typically generated at 60- 70% efficiencydepending on the efficiency of the power production process, whichin total can add up to 90%.135 Thus, small and medium cogenerationplants provide three to five times more heat than power, with localheat demand often being the limiting factor for the plant size.
Upgraded biomass Besides direct combustion, there are variousconversion technologies use to upgrade biomass products for usein specific applications and for higher temperatures. Commoncurrently available technologies are (upgraded) biogas productionand gasification, and other technologies like pyrolysis andproduction of synthetic gases or oils are under development.
Gasification is especially valuable in the case of biomass with lowcaloric value or when it includes moisture. Partial oxidation ofthe biomass fuel provides a combustible gas mixture mainlyconsisting of carbon monoxide (CO). Gasification can providehigher efficiency along the whole biomass chain, however at theexpense of additional investments for the more sophisticatedtechnology. There are many different gasification systems basedon varying fuel input, gasification technology and combinationwith gas turbines. Available literature shows a large cost rangefor gasification cogeneration plants. Assumptions on costs of thegasification processes vary strongly.
9
energ
y technolo
gies
|RENEWABLE ENERGY TECHNOLOGIES
reference132 GEMIS 2011.
133 NITSCH ET AL. 2010; GEMIS 2011; AEBIOM 2011B.
134 THESE COLLECTOR TYPES ARE PRIMARILY USED IN SOLAR THERMAL POWER PLANTS AND REACH
TEMPERATURE LEVELS AROUND 400°C. FOR THE SEGMENT OF PROCESS HEAT THESE COLLECTOR
TYPES WHERE DEVELOPED FURTHER TO MEET THE SPECIFIC REQUIREMENTS OF THIS SEGMENT
WITH TEMPERATURE LEVELS UP TO 250°C.
135 IBID.
© ONEHEMISPHERE.SE
image BIOMASS ENERGY PLANT NEAR VARNAMO,SMÅLAND, SWEDEN.

WORLD ENERGY [R]EVOLUTIONA SUSTAINABLE WORLD ENERGY OUTLOOK
258
Other upgrading processes are biogas upgrading for feed-in to thenatural gas grid or the production of liquid biomass, such asplant oil, ethanol or second generation fuels. Those technologiescan be easily exchangeable with fossil fuels, but the low efficiencyof the overall process and energy input needed to produce energycrops are disadvantages for sustainability.
Biogas
Biogas plants use anaerobic digestion of bacteria for conversionof various biomass substrates into biogas. This gas mainlyconsists of methane, a gas of high caloric value, CO2 and water.Anaerobic digestion can be used to upgrade organic matter withlow energy density, such as organic waste and manure. Thesesubstrates usually contain large water contents and appear liquid.“Dry” substrates need additional water.
Liquid residues like wastes and excrements would be energeticallyunused and biogas taps into their calorific potential. The residueof the digestion process is used as a fertiliser, which has higheravailability of nitrogen and is more valuable than the input substrates.139
Methane is a strong greenhouse gas, so biogas plants need airtightcovers for the digestate, to maintain low emissions.137 Residues andwastes are preferable for biogas compared with energy crops suchas corn silage which require energy and fertilizer inputs whilegrowing which themselves create greenhouse gas emissions.
Biogas plants usually consist of a digester for biogas productionand a cogeneration plant. Planst are range of sizes and arenormally fed by a mixture of substrates for example manuremixed with maize silage, grass silage, other energy crops and/ororganic wastes.138
Normally biogas is normally used in cogeneration. In Germany, thefeed-in tariff means biogas production currently is mostly forpower and the majority of biogas plants are on farms in ruralareas. Small biogas plants often use the produced heat for localspace heating or to provide process heat e.g. for drying processes.Larger biogas plants need access to a heat network to make gooduse of all the available heat. However, network access is often notavailable in rural areas so there is still untapped potential of heatconsumption from biogas. Monitoring of German biogas plantsshowed that 50% of available heat was actually wasted.139 Theconditioning and enriching of biogas and subsequent feed in intothe gas grid has been promoted lately and should become anoption to use biogas directly at the location of heat demand.
Upgrading technologies for biomass do bear the risk of additionalmethane emissions so tight emission standards are necessary toachieve real reductions in greenhouse gas emissions.140
9.3.11 storage technologies
As the share of electricity provided by renewable sourcesincreases around the world the technologies and policies requiredto handle their variability is also advancing. Along with the grid-related and forecasting solutions discussed in Chapter 3, energystorage is a key part of the Energy [R]evolution.
Once the share of electricity from variable renewable sourcesexceeds 30-35%, energy storage is necessary in order tocompensate for generation shortages or to store possible surpluselectricity generated during windy and sunny periods. Todaystorage technology is available for different stages ofdevelopment, scales of projects, and for meeting both short- andlong-term energy storage needs. Short-term storage technologiescan compensate for output fluctuations that last only a fewhours, whereas longer term or seasonal storage technologies canbridge the gap over several weeks.
Short-term options include batteries, flywheels, compressed airpower plants and pump storage power stations with highefficiency factors. The later is also used for long term storage.Perhaps the most promising of these options is electric vehicles(EVs) with Vehicle-to-Grid (V2G) capability, which can increaseflexibility of the power system by charging when there is surplusrenewable generation and discharging while parked to take uppeaking capacity or ancillary services to the power system.Vehicles are often parked close to main load centres during peaktimes (e.g., outside factories) so there would be no networkissues. However battery costs are currently very high andsignificant logistical challenges remain.
Seasonal storage technologies include hydro pumped storage andthe production of hydrogen or renewable methane. While thelatter two options are currently in the development with severaldemonstration projects mainly in Germany, pumped storage hasbeen in use around the world for more than a century.
9
energ
y technolo
gies
|RENEWABLE ENERGY TECHNOLOGIES
reference136 KALTSCHMITT ET AL. 2009.
137 PEHNT ET AL. 2007.
138 IEA 2007; NITSCH ET AL. 2010.
139 DBFZ 2010.
140 GÄRTNER ET AL. 2008.
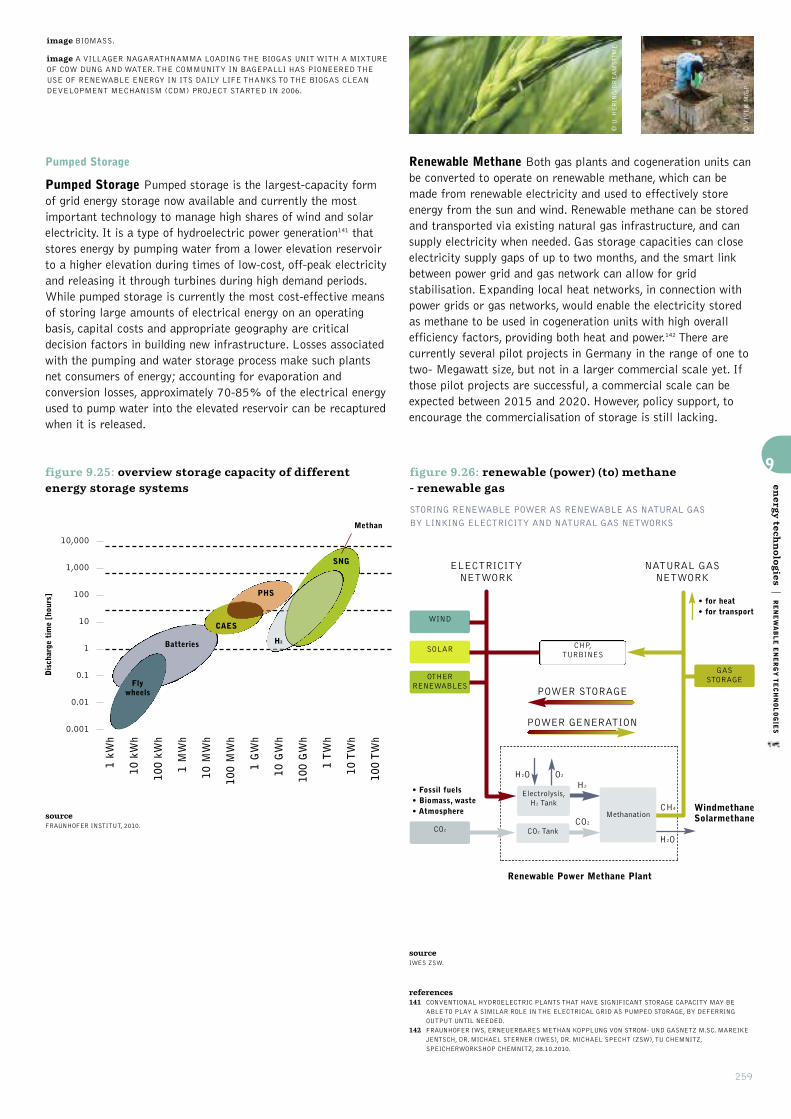
259
Pumped Storage
Pumped Storage Pumped storage is the largest-capacity formof grid energy storage now available and currently the mostimportant technology to manage high shares of wind and solarelectricity. It is a type of hydroelectric power generation141 thatstores energy by pumping water from a lower elevation reservoirto a higher elevation during times of low-cost, off-peak electricityand releasing it through turbines during high demand periods.While pumped storage is currently the most cost-effective meansof storing large amounts of electrical energy on an operatingbasis, capital costs and appropriate geography are criticaldecision factors in building new infrastructure. Losses associatedwith the pumping and water storage process make such plantsnet consumers of energy; accounting for evaporation andconversion losses, approximately 70-85% of the electrical energyused to pump water into the elevated reservoir can be recapturedwhen it is released.
Renewable Methane Both gas plants and cogeneration units canbe converted to operate on renewable methane, which can bemade from renewable electricity and used to effectively storeenergy from the sun and wind. Renewable methane can be storedand transported via existing natural gas infrastructure, and cansupply electricity when needed. Gas storage capacities can closeelectricity supply gaps of up to two months, and the smart linkbetween power grid and gas network can allow for gridstabilisation. Expanding local heat networks, in connection withpower grids or gas networks, would enable the electricity storedas methane to be used in cogeneration units with high overallefficiency factors, providing both heat and power.142 There arecurrently several pilot projects in Germany in the range of one totwo- Megawatt size, but not in a larger commercial scale yet. Ifthose pilot projects are successful, a commercial scale can beexpected between 2015 and 2020. However, policy support, toencourage the commercialisation of storage is still lacking.
9
energ
y technolo
gies
|RENEWABLE ENERGY TECHNOLOGIES
sourceFRAUNHOFER INSTITUT, 2010.
sourceIWES ZSW.
references141 CONVENTIONAL HYDROELECTRIC PLANTS THAT HAVE SIGNIFICANT STORAGE CAPACITY MAY BE
ABLE TO PLAY A SIMILAR ROLE IN THE ELECTRICAL GRID AS PUMPED STORAGE, BY DEFERRING
OUTPUT UNTIL NEEDED.
142 FRAUNHOFER IWS, ERNEUERBARES METHAN KOPPLUNG VON STROM- UND GASNETZ M.SC. MAREIKE
JENTSCH, DR. MICHAEL STERNER (IWES), DR. MICHAEL SPECHT (ZSW), TU CHEMNITZ,
SPEICHERWORKSHOP CHEMNITZ, 28.10.2010.
figure 9.25: overview storage capacity of differentenergy storage systems
Discharge time [hours]
10,000
1,000
100
10
1
0.1
0.01
0.001
1 kW
h
10 kWh
100 kW
h
1 MWh
10 MWh
100 MWh
1 GWh
10 GWh
100 GWh
1 TWh
10 TWh
100 TWh
Fly wheels
Batteries
PHS
H2
SNG
Methan
CAES
figure 9.26: renewable (power) (to) methane - renewable gas
STORING RENEWABLE POWER AS RENEWABLE AS NATURAL GAS
BY LINKING ELECTRICITY AND NATURAL GAS NETWORKS
• Fossil fuels• Biomass, waste• Atmosphere
• for heat• for transport
WindmethaneSolarmethane
Renewable Power Methane Plant
ELECTRICITYNETWORK
POWER GENERATION
POWER STORAGE
WIND
SOLAR
CO2
H2O
CO2
O2
H2
CH4
H2O
OTHER RENEWABLES
GAS STORAGE
NATURAL GASNETWORK
CHP, TURBINES
CO2 Tank
Electrolysis,H2 Tank
Methanation
© VIVEK M/GP
image BIOMASS.
image A VILLAGER NAGARATHNAMMA LOADING THE BIOGAS UNIT WITH A MIXTUREOF COW DUNG AND WATER. THE COMMUNITY IN BAGEPALLI HAS PIONEERED THEUSE OF RENEWABLE ENERGY IN ITS DAILY LIFE THANKS TO THE BIOGAS CLEANDEVELOPMENT MECHANISM (CDM) PROJECT STARTED IN 2006.
© U. HERING/DREAMSTIME
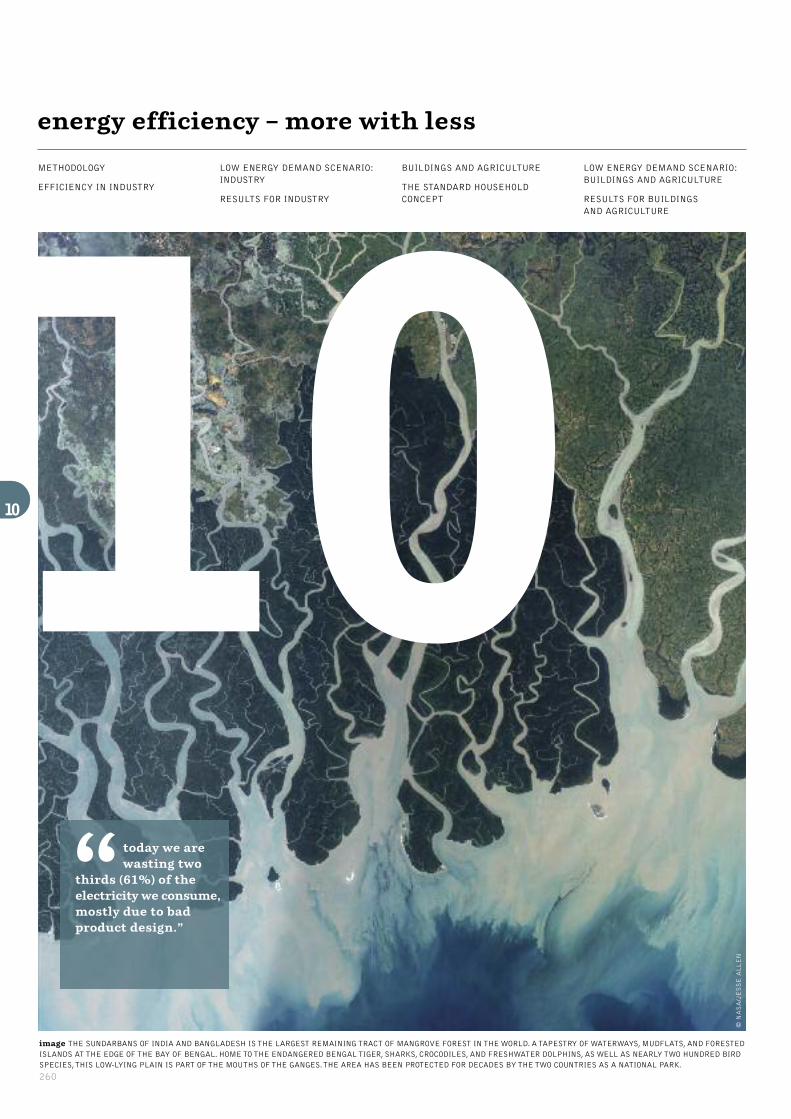
260
energy efficiency – more with less
METHODOLOGY
EFFICIENCY IN INDUSTRY
LOW ENERGY DEMAND SCENARIO:INDUSTRY
RESULTS FOR INDUSTRY
BUILDINGS AND AGRICULTURE
THE STANDARD HOUSEHOLDCONCEPT
LOW ENERGY DEMAND SCENARIO:BUILDINGS AND AGRICULTURE
RESULTS FOR BUILDINGS AND AGRICULTURE
1010image THE SUNDARBANS OF INDIA AND BANGLADESH IS THE LARGEST REMAINING TRACT OF MANGROVE FOREST IN THE WORLD. A TAPESTRY OF WATERWAYS, MUDFLATS, AND FORESTEDISLANDS AT THE EDGE OF THE BAY OF BENGAL. HOME TO THE ENDANGERED BENGAL TIGER, SHARKS, CROCODILES, AND FRESHWATER DOLPHINS, AS WELL AS NEARLY TWO HUNDRED BIRDSPECIES, THIS LOW-LYING PLAIN IS PART OF THE MOUTHS OF THE GANGES. THE AREA HAS BEEN PROTECTED FOR DECADES BY THE TWO COUNTRIES AS A NATIONAL PARK.
today we arewasting two
thirds (61%) of theelectricity we consume,mostly due to badproduct design.”
“
© NASA/JESSE ALLEN

10
energ
y efficiency
|METHODOLOGY FOR THE ENERGY DEMAND PROJECTIONS
261
Using energy efficiently is cheaper than producing new energy fromscratch and often has many other benefits. An efficient clotheswashing machine or dishwasher, for example, uses less power andsaves water too. Efficiency in buildings doesn’t mean going without– it should provide a higher level of comfort. A well-insulatedhouse, will feel warmer in the winter, cooler in the summer and behealthier to live in. An efficient refrigerator is quieter, has no frostinside, no condensation outside and will probably last longer.Efficient lighting offers more light where you need it. Efficiency isthus really better described as ‘more with less’.
There are very simple steps to efficiency both at home and inbusiness, through updating or replacing separate systems orappliances, that will save both money and energy. But the biggestsavings don’t come from incremental steps but from rethinkingthe whole concept - ‘the whole house’, ‘the whole car’ or even ‘thewhole transport system’. In this way, energy needs can often becut back by four to ten times.
In order to find out the global and regional energy efficiencypotential, the Dutch institute Ecofys developed energy demandscenarios for the Greenpeace Energy [R]evolution analysis in2008, which have now been updated by the Utrecht University forthe 2012 model. These scenarios cover energy demand over theperiod 2009-2050 for ten world regions. In contrast to theReference scenario, based on the IEA World Energy Outlook 2011(WEO 2011), a low energy demand scenario for energy efficiencyimprovements has been defined. In this edition, the transport sectorhas been separated from the stationary energy research. Theefficiency scenario is based on the best technical energy efficiencypotentials and takes into account into account implementationconstraints including costs and other barriers. This scenario iscalled ‘ER’ and has been compared to the IEA’s 450ppm scenario– published in the WEO 2011. The main results of the study aresummarised below.
10.1 methodology for the energy demand projections
This section explains the methodology for developing the energydemand projections. The approach includes two steps:
1.Definition of reference energy demand
2.Development of low energy demand scenarios includingpotentials for energy-efficiency improvement
Step 1: definition of reference scenario
In order to estimate potentials for energy-efficiency improvement in2050 a detailed reference scenario is required that projects thedevelopment of energy demand when current trends continue. In theReference scenario – the World Energy Outlook 2011 “Currentpolicy”143 only currently adopted energy and climate change policiesare implemented. Technological change including efficiencyimprovement is slow but substantial and mainly triggered byincreased energy prices.144 The Reference scenario covers energydemand development in the period 2009-2050 for ten world regionsand three sectors:
• Transport
• Industry
• Other (also referred to as “buildings and agriculture”).
Within the energy industry and other sectors a distinction ismade between electricity demand and fuel and heat demand.Heat demand mainly consists of district heating from heat plantsand from combined heat and power plants. Fuel and heat demandis referred to as ‘fuel demand’ in the figures that follow. Theenergy demand scenario focuses only on energy-related fuel,power and heat use. This means that feedstock consumption inindustries is excluded from the analysis. Total final consumptiondata in WEO includes non-energy use. By assuming that the shareof non-energy use remains the same as in the base year 2009 wedetermine the energy-related fuel use beyond 2009.
Transport efficiencies were calculated by the DLR Institute ofVehicle Concepts and are documented in chapter 11.
Figure 10.1 shows the Reference scenario for final energydemand for the world per sector.
Worldwide final energy demand is expected to grow by 75%,from 304 ExaJoule (EJ) in 2009 to 523 EJ in 2050. Thetransport sector has the largest relative growth, with energydemand expected to grow from 82 EJ in 2009 to 151 EJ in2050. Fuel demand in others sectors is expected to grow slowestfrom 91 EJ in 2009 to 119 EJ in 2050.
references143 IEA WEO 2011, NOV 2011, PARIS/FRANCE.
144 IEA WEO 2011, NOV 2011, PARIS/FRANCE.
figure 10.1: final energy demand (PJ) in reference scenario per sector worldwide
PJ/a 0
100,000
200,000
300,000
400,000
500,000
600,000
2009 2015 2020 2025 2030 2035 2040 2045 2050
•OTHER - ELECTRICITY
• OTHER - FUELS
• INDUSTRY - ELECTRICITY
• INDUSTRY - FUELS (EXCLUDING FEEDSTOCKS)
•TRANSPORT
© DREAMSTIME
© K. STOZEK/DREAMSTIME
image STANDBY.
image WORK TEAM APPLYING STYROFOAM WALL INSULATION TO A NEWLYCONSTRUCTED BUILDING.
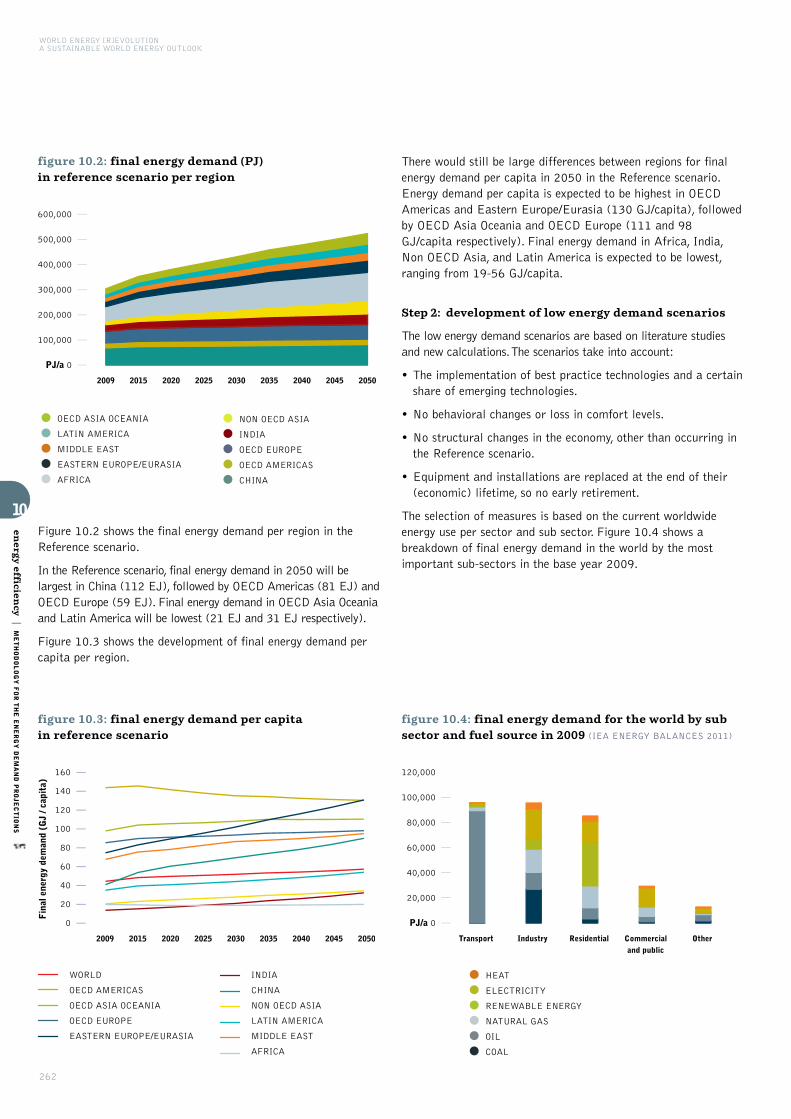
WORLD ENERGY [R]EVOLUTIONA SUSTAINABLE WORLD ENERGY OUTLOOK
10
energ
y efficiency
|METHODOLOGY FOR THE ENERGY DEMAND PROJECTIONS
262
Figure 10.2 shows the final energy demand per region in theReference scenario.
In the Reference scenario, final energy demand in 2050 will belargest in China (112 EJ), followed by OECD Americas (81 EJ) andOECD Europe (59 EJ). Final energy demand in OECD Asia Oceaniaand Latin America will be lowest (21 EJ and 31 EJ respectively).
Figure 10.3 shows the development of final energy demand percapita per region.
There would still be large differences between regions for finalenergy demand per capita in 2050 in the Reference scenario.Energy demand per capita is expected to be highest in OECDAmericas and Eastern Europe/Eurasia (130 GJ/capita), followedby OECD Asia Oceania and OECD Europe (111 and 98GJ/capita respectively). Final energy demand in Africa, India,Non OECD Asia, and Latin America is expected to be lowest,ranging from 19-56 GJ/capita.
Step 2: development of low energy demand scenarios
The low energy demand scenarios are based on literature studiesand new calculations. The scenarios take into account:
• The implementation of best practice technologies and a certainshare of emerging technologies.
• No behavioral changes or loss in comfort levels.
• No structural changes in the economy, other than occurring inthe Reference scenario.
• Equipment and installations are replaced at the end of their(economic) lifetime, so no early retirement.
The selection of measures is based on the current worldwideenergy use per sector and sub sector. Figure 10.4 shows abreakdown of final energy demand in the world by the mostimportant sub-sectors in the base year 2009.
figure 10.2: final energy demand (PJ) in reference scenario per region
•OECD ASIA OCEANIA
• LATIN AMERICA
•MIDDLE EAST
• EASTERN EUROPE/EURASIA
• AFRICA
• NON OECD ASIA
• INDIA
• OECD EUROPE
• OECD AMERICAS
• CHINA
figure 10.4: final energy demand for the world by subsector and fuel source in 2009 (IEA ENERGY BALANCES 2011)
Transport Industry Residential Commercial and public services
Other
PJ/a 0
20,000
40,000
60,000
80,000
100,000
120,000
•HEAT
• ELECTRICITY
• RENEWABLE ENERGY
• NATURAL GAS
• OIL
• COAL
figure 10.3: final energy demand per capita in reference scenario
Fin
al e
nerg
y de
man
d (G
J / c
apit
a)
2009 2015 2020 2025 2030 2035 2040 2045 2050
0
20
40
60
80
100
120
140
160
WORLD
OECD AMERICAS
OECD ASIA OCEANIA
OECD EUROPE
EASTERN EUROPE/EURASIA
INDIA
CHINA
NON OECD ASIA
LATIN AMERICA
MIDDLE EAST
AFRICA
PJ/a 0
100,000
200,000
300,000
400,000
500,000
600,000
2009 2015 2020 2025 2030 2035 2040 2045 2050

263
10.2 efficiency in industry
10.2.1 energy demand reference scenario: industry
Figure 10.5 gives the reference scenario for final energy demandin industries in the period 2009-2050. As can be seen, the energydemand in Chinese industries is expected to be huge in 2050 andamount to 54 EJ. The energy demand in all other regionstogether is expected to be 118 EJ, meaning that China accountsfor 31% of worldwide energy demand in industries in 2050.
Figure 10.6 shows the share of industrial energy use in total energydemand per region for the years 2009 and 2050. Worldwide,industry consumers about 30% of total final energy demand onaverage, both in 2009 as in 2050. The share in Africa is lowest with20% in 2050. The share in China is highest with 48% in 2050.
For all sectors we look at implementing best practicetechnologies, increased recycling and increased materialefficiency. Where possible the potentials are based on specificenergy consumption data in physical units (MJ/tonne steel,MJ/tonne aluminium etc.).
Figure 10.7 shows a breakdown of final energy demand by subsector in industry worldwide for the base year 2009. The largestenergy consuming sectors in industry are chemical andpetrochemical industry, iron and steel and non-metallic minerals.Together the sectors consume about 50% of industrial energydemand. Since these three sectors are relatively large we look atthem in detail. Also we look at aluminium production in detail,which is in the category of non-ferrous metals. This is because theshare of aluminium production makes up nearly 11% of totalindustrial energy demand in 2009.
figure 10.7: breakdown of final energy consumption in2009 by sub sector for industry (IEA ENERGY BALANCES 2011)
figure 10.6: share of industry in total final energy demand per region in 2009 and 2050
10
energ
y efficiency
|EFFICIENCY IN
INDUSTRY
figure 10.5: projection of industrial energy demand in period 2009-2050 per region
PJ/a 0
10,000
20,000
30,000
40,000
50,000
60,000
2009 2015 2020 2025 2030 2035 2040 2045 2050
0%
5%
10%
15%
20%
25%
30%
35%
40%
45%
50%
55%
WORLD
OECD AM
ERICAS
OECD ASIA
OCEANIA
OECD EUROPE
EASTERN EUROPE/E
URASIAIN
DIA
CHINA
OTHER NON-O
ECD ASIA
LATIN A
MERIC
AS
MID
DLE EAST
AFRICA
2009
0 %
10 %
20 %
30 %
40 %
50 %
60 %
70 %
80 %
90 %
100 %
OECD AMERICAS
OECD ASIA OCEANIA
OECD EUROPE
EASTERN EUROPE/EURASIA
INDIA
CHINA
NON OECD ASIA
LATIN AMERICA
MIDDLE EAST
AFRICA
• NON-SPECIFIED (INDUSTRY)
•WOOD & WOOD PRODUCTS
•TRANSPORT EQUIPMENT
• CONSTRUCTION
•TEXTILE & LEATHER
•MINING & QUARRYING
• NON-FERROUS METALS
•MACHINERY
• PAPER, PULP & PRINTING
• FOOD & TOBACCO
• NON-METALLIC MINERALS
• CHEMICAL & PETROCHEMICAL
• IRON & STEEL
•2009
•2050
© KELPFISH/DREAMSTIME
© INDYKB/DREAMSTIME
image A ROOM AT A NEWLY CONSTRUCTED HOME IS SPRAYED WITH LIQUIDINSULATING FOAM BEFORE THE DRYWALL IS ADDED.
image FUTURISTIC SOLAR HEATED HOME MADE FROM CEMENT AND PARTIALLYCOVERED IN THE EARTH.

10.3 low energy demand scenario: industry
The overall technical potential is estimated after identifying themost significant energy-efficiency improvements. In the Referencescenario, some of these energy-efficiency improvements havealready been implemented (autonomous and policy induced energy-efficiency improvement). However, the level of energy-efficiencyimprovement in the Reference scenario is unknown, we thereforeassume that it is equal to 1% per year for all regions, based on
WORLD ENERGY [R]EVOLUTIONA SUSTAINABLE WORLD ENERGY OUTLOOK
10
energ
y efficiency
|LOW ENERGY DEMAN SCENARIO: IN
DUSTRY
264
historical developments of energy-efficiency.145 Therefore, thetechnical potential in the low energy demand scenarios is thetechnical potential identified that has not already beenimplemented in the Reference scenario.
Table 10.1 shows the resulting savings potential for industrycompared to the Reference scenario per region in 2050. These arebased on the technical potentials with the subtraction of the energy-efficiency improvement already included in the Reference scenario.
reference145 ECOFYS (2005), BLOK (2005), ODYSSEE (2005), IEA (2011C).
Industryfuels45%64%51%69%79%70%52%79%63%33%66%
Industryelectricity45%64%51%69%79%70%52%79%63%33%66%
IRON & STEEL
Industryfuels40%40%40%40%40%40%0%40%40%40%40%
Industryelectricity38%38%38%38%38%38%38%38%38%38%38%
ALUMINIUMPRODUCTION
Industryfuels32%32%32%32%32%32%32%32%32%32%32%
Industryelectricity7%7%7%7%7%7%7%7%7%7%7%
CHEMICALINDUSTRY
Industryfuels0.6%0.6%0.6%0.6%0.6%0.6%0.6%0.6%0.6%0.6%0.6%
Industryelectricity0.6%0.6%0.6%0.6%0.6%0.6%0.6%0.6%0.6%0.6%0.6%
NON-METALLICMINERALS
Industryfuels10%10%10%10%10%10%10%10%10%10%10%
Industryelectricity10%10%10%10%10%10%10%10%10%10%10%
PULP & PAPER
Industryfuels48%48%48%48%48%48%48%48%48%48%48%
Industryelectricity48%48%48%48%48%48%48%48%48%48%48%
OTHERINDUSTRIES
table 10.1: reduction of energy use in comparison to the reference scenario per sector in 2050
OECD EuropeOECD North AmericaOECD Asia OceaniaChinaLatin AmericaAfricaMiddle EastEastern Europe/EurasiaIndiaNon OECD AsiaWorld
2009
90%90%85%95%80%85%95%90%70%70%80%
80%70%80%80%70%70%70%70%80%70%80%
2015
90%90%85%95%80%85%95%90%70%70%80%
80%70%80%80%70%70%70%70%80%70%80%
2020
90%90%85%95%80%85%95%90%70%70%80%
80%70%80%80%70%70%70%70%80%70%80%
2025
90%90%85%95%80%85%95%90%70%70%80%
80%70%80%80%70%70%70%70%80%70%80%
2030
90%90%85%95%80%85%95%90%70%70%80%
80%70%80%80%70%70%70%70%80%70%80%
2035
90%90%85%95%80%85%95%90%70%70%80%
80%70%80%80%70%70%70%70%80%70%80%
2040
90%90%85%95%80%85%95%90%70%70%80%
80%70%80%80%70%70%70%70%80%70%80%
2045
90%90%85%95%80%85%95%90%70%70%80%
80%70%80%80%70%70%70%70%80%70%80%
2050
90%90%85%95%80%85%95%90%70%70%80%
80%70%80%80%70%70%70%70%80%70%80%
table 10.2: share of technical potentials implemented in the energy [r]evolution scenario
INDUSTRY - FUELS
OECD North AmericaOECD Asia OceaniaOECD EuropeEastern Europe/EurasiaIndiaChinaNon OECD AsiaLatin AmericaMiddle EastAfricaWorld
INDUSTRY ELECTRICITY
OECD North AmericaOECD Asia OceaniaOECD EuropeEastern Europe/EurasiaIndiaChinaNon OECD AsiaLatin AmericaMiddle EastAfricaWorld
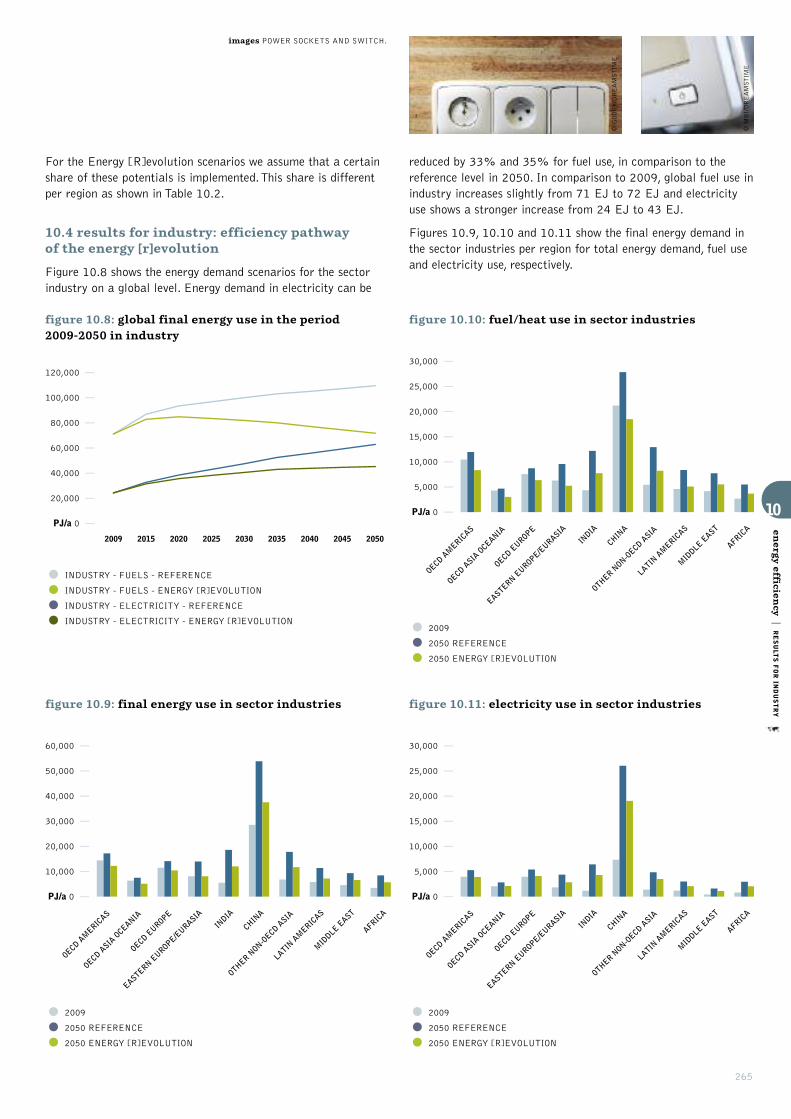
265
For the Energy [R]evolution scenarios we assume that a certainshare of these potentials is implemented. This share is differentper region as shown in Table 10.2.
10.4 results for industry: efficiency pathway of the energy [r]evolution
Figure 10.8 shows the energy demand scenarios for the sectorindustry on a global level. Energy demand in electricity can be
reduced by 33% and 35% for fuel use, in comparison to thereference level in 2050. In comparison to 2009, global fuel use inindustry increases slightly from 71 EJ to 72 EJ and electricityuse shows a stronger increase from 24 EJ to 43 EJ.
Figures 10.9, 10.10 and 10.11 show the final energy demand inthe sector industries per region for total energy demand, fuel useand electricity use, respectively.
figure 10.8: global final energy use in the period 2009-2050 in industry
figure 10.9: final energy use in sector industries
10
energ
y efficiency
|RESULTS FOR IN
DUSTRY
PJ/a 0
20,000
40,000
60,000
80,000
100,000
120,000
2009 2015 2020 2025 2030 2035 2040 2045 2050
OECD AM
ERICAS
OECD ASIA
OCEANIA
OECD EUROPE
EASTERN EUROPE/E
URASIAIN
DIA
CHINA
OTHER NON-O
ECD ASIA
LATIN A
MERIC
AS
MID
DLE EAST
AFRICA
PJ/a 0
10,000
20,000
30,000
40,000
50,000
60,000
•INDUSTRY - FUELS - REFERENCE
• INDUSTRY - FUELS - ENERGY [R]EVOLUTION
• INDUSTRY - ELECTRICITY - REFERENCE
• INDUSTRY - ELECTRICITY - ENERGY [R]EVOLUTION
• 2009
• 2050 REFERENCE
• 2050 ENERGY [R]EVOLUTION
figure 10.11: electricity use in sector industries
OECD AM
ERICAS
OECD ASIA
OCEANIA
OECD EUROPE
EASTERN EUROPE/E
URASIAIN
DIA
CHINA
OTHER NON-O
ECD ASIA
LATIN A
MERIC
AS
MID
DLE EAST
AFRICA
PJ/a 0
5,000
10,000
15,000
20,000
25,000
30,000
•2009
• 2050 REFERENCE
• 2050 ENERGY [R]EVOLUTION
figure 10.10: fuel/heat use in sector industries
OECD AM
ERICAS
OECD ASIA
OCEANIA
OECD EUROPE
EASTERN EUROPE/E
URASIAIN
DIA
CHINA
OTHER NON-O
ECD ASIA
LATIN A
MERIC
AS
MID
DLE EAST
AFRICA
PJ/a 0
5,000
10,000
15,000
20,000
25,000
30,000
•2009
• 2050 REFERENCE
• 2050 ENERGY [R]EVOLUTION
© MBI/DREAMSTIME
images POWER SOCKETS AND SWITCH.
© GOORY/DREAMSTIME
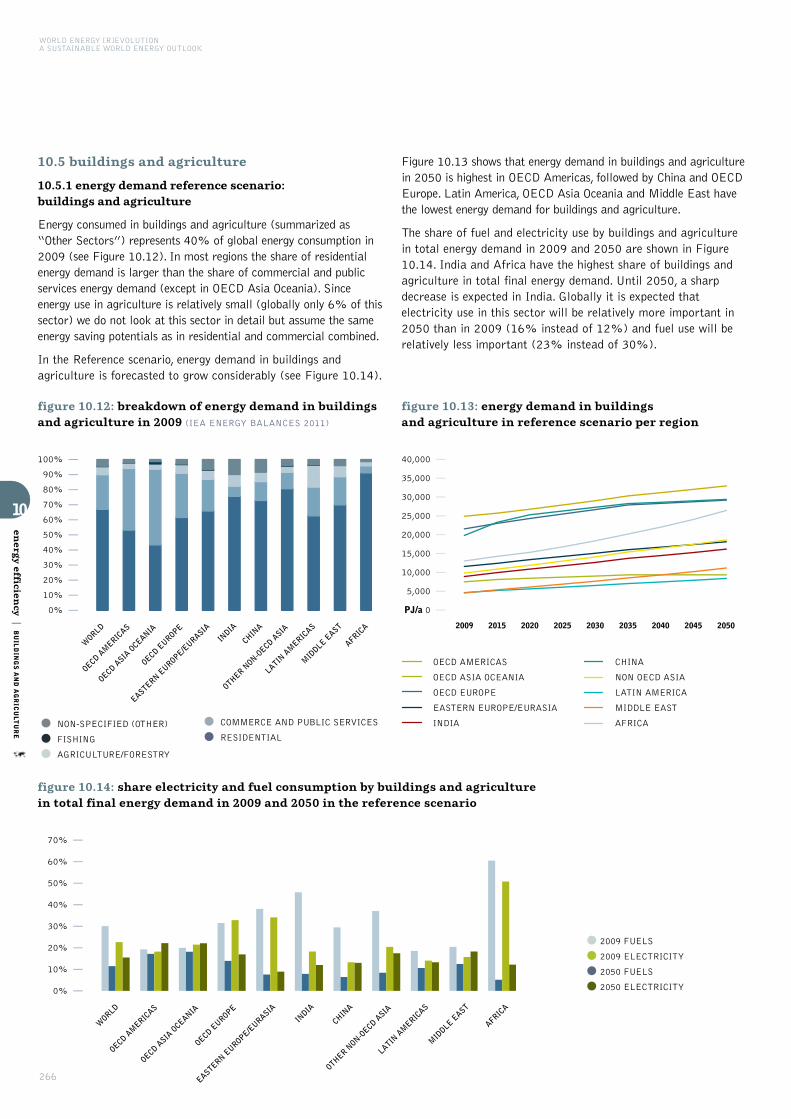
WORLD ENERGY [R]EVOLUTIONA SUSTAINABLE WORLD ENERGY OUTLOOK
10
energ
y efficiency
|BUILDINGS AND AGRICULTURE
266
10.5 buildings and agriculture
10.5.1 energy demand reference scenario: buildings and agriculture
Energy consumed in buildings and agriculture (summarized as“Other Sectors”) represents 40% of global energy consumption in2009 (see Figure 10.12). In most regions the share of residentialenergy demand is larger than the share of commercial and publicservices energy demand (except in OECD Asia Oceania). Sinceenergy use in agriculture is relatively small (globally only 6% of thissector) we do not look at this sector in detail but assume the sameenergy saving potentials as in residential and commercial combined.
In the Reference scenario, energy demand in buildings andagriculture is forecasted to grow considerably (see Figure 10.14).
Figure 10.13 shows that energy demand in buildings and agriculturein 2050 is highest in OECD Americas, followed by China and OECDEurope. Latin America, OECD Asia Oceania and Middle East havethe lowest energy demand for buildings and agriculture.
The share of fuel and electricity use by buildings and agriculturein total energy demand in 2009 and 2050 are shown in Figure10.14. India and Africa have the highest share of buildings andagriculture in total final energy demand. Until 2050, a sharpdecrease is expected in India. Globally it is expected thatelectricity use in this sector will be relatively more important in2050 than in 2009 (16% instead of 12%) and fuel use will berelatively less important (23% instead of 30%).
figure 10.14: share electricity and fuel consumption by buildings and agriculture in total final energy demand in 2009 and 2050 in the reference scenario
figure 10.12: breakdown of energy demand in buildingsand agriculture in 2009 (IEA ENERGY BALANCES 2011)
WORLD
OECD AM
ERICAS
OECD ASIA
OCEANIA
OECD EUROPE
EASTERN EUROPE/E
URASIAIN
DIA
CHINA
OTHER NON-O
ECD ASIA
LATIN A
MERIC
AS
MID
DLE EAST
AFRICA
0%
10%
20%
30%
40%
50%
60%
70%
80%
90%
100%
•NON-SPECIFIED (OTHER)
• FISHING
• AGRICULTURE/FORESTRY
• COMMERCE AND PUBLIC SERVICES
• RESIDENTIAL
0%
10%
20%
30%
40%
50%
60%
70%
WORLD
OECD AM
ERICAS
OECD ASIA
OCEANIA
OECD EUROPE
EASTERN EUROPE/E
URASIAIN
DIA
CHINA
OTHER NON-O
ECD ASIA
LATIN A
MERIC
AS
MID
DLE EAST
AFRICA
•2009 FUELS
•2009 ELECTRICITY
•2050 FUELS
•2050 ELECTRICITY
figure 10.13: energy demand in buildings and agriculture in reference scenario per region
PJ/a 0
5,000
10,000
15,000
20,000
25,000
30,000
35,000
40,000
2009 2015 2020 2025 2030 2035 2040 2045 2050
OECD AMERICAS
OECD ASIA OCEANIA
OECD EUROPE
EASTERN EUROPE/EURASIA
INDIA
CHINA
NON OECD ASIA
LATIN AMERICA
MIDDLE EAST
AFRICA
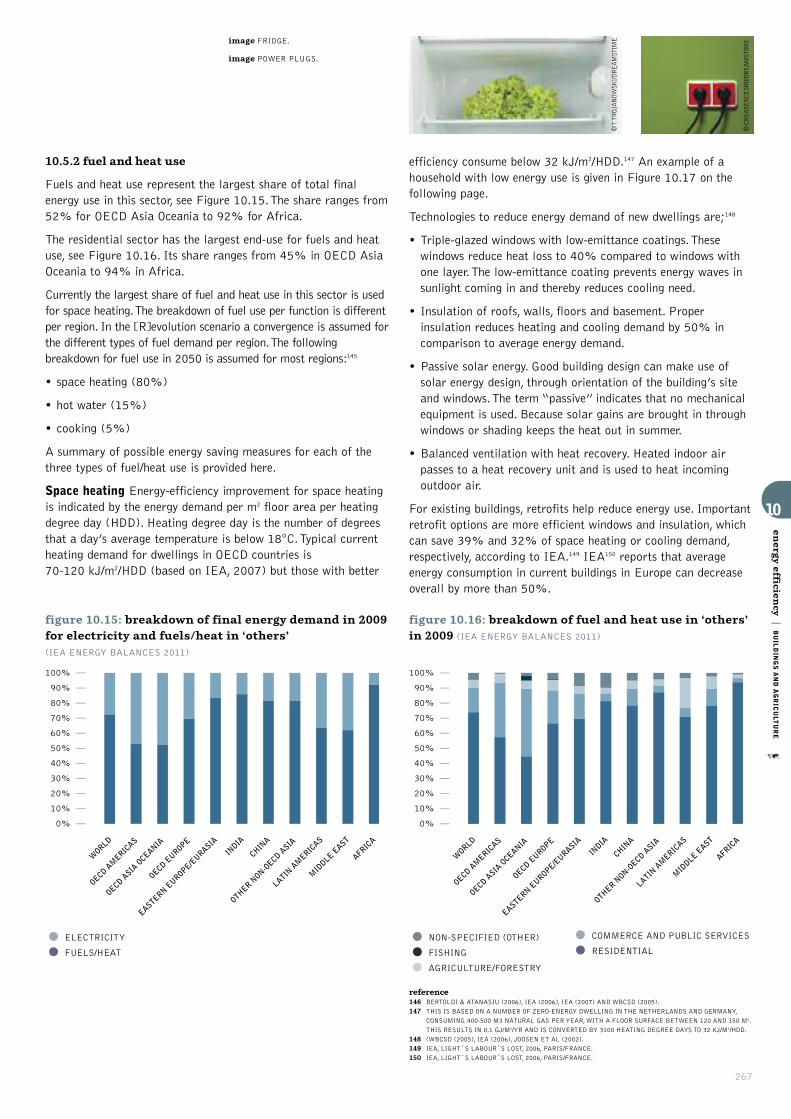
267
10.5.2 fuel and heat use
Fuels and heat use represent the largest share of total finalenergy use in this sector, see Figure 10.15. The share ranges from52% for OECD Asia Oceania to 92% for Africa.
The residential sector has the largest end-use for fuels and heatuse, see Figure 10.16. Its share ranges from 45% in OECD AsiaOceania to 94% in Africa.
Currently the largest share of fuel and heat use in this sector is usedfor space heating. The breakdown of fuel use per function is differentper region. In the [R]evolution scenario a convergence is assumed forthe different types of fuel demand per region. The followingbreakdown for fuel use in 2050 is assumed for most regions:145
• space heating (80%)
• hot water (15%)
• cooking (5%)
A summary of possible energy saving measures for each of thethree types of fuel/heat use is provided here.
Space heating Energy-efficiency improvement for space heatingis indicated by the energy demand per m2 floor area per heatingdegree day (HDD). Heating degree day is the number of degreesthat a day’s average temperature is below 18°C. Typical currentheating demand for dwellings in OECD countries is 70-120 kJ/m2/HDD (based on IEA, 2007) but those with better
efficiency consume below 32 kJ/m2/HDD.147 An example of ahousehold with low energy use is given in Figure 10.17 on thefollowing page.
Technologies to reduce energy demand of new dwellings are;148
• Triple-glazed windows with low-emittance coatings. Thesewindows reduce heat loss to 40% compared to windows withone layer. The low-emittance coating prevents energy waves insunlight coming in and thereby reduces cooling need.
• Insulation of roofs, walls, floors and basement. Properinsulation reduces heating and cooling demand by 50% incomparison to average energy demand.
• Passive solar energy. Good building design can make use ofsolar energy design, through orientation of the building’s siteand windows. The term “passive” indicates that no mechanicalequipment is used. Because solar gains are brought in throughwindows or shading keeps the heat out in summer.
• Balanced ventilation with heat recovery. Heated indoor airpasses to a heat recovery unit and is used to heat incomingoutdoor air.
For existing buildings, retrofits help reduce energy use. Importantretrofit options are more efficient windows and insulation, whichcan save 39% and 32% of space heating or cooling demand,respectively, according to IEA.149 IEA150 reports that averageenergy consumption in current buildings in Europe can decreaseoverall by more than 50%.
10
energ
y efficiency
|BUILDINGS AND AGRICULTURE
reference146 BERTOLDI & ATANASIU (2006), IEA (2006), IEA (2007) AND WBCSD (2005).
147 THIS IS BASED ON A NUMBER OF ZERO-ENERGY DWELLING IN THE NETHERLANDS AND GERMANY,
CONSUMING 400-500 M3 NATURAL GAS PER YEAR, WITH A FLOOR SURFACE BETWEEN 120 AND 150 M2.
THIS RESULTS IN 0.1 GJ/M2/YR AND IS CONVERTED BY 3100 HEATING DEGREE DAYS TO 32 KJ/M2/HDD.
148 (WBCSD (2005), IEA (2006), JOOSEN ET AL (2002).
149 IEA, LIGHT´S LABOUR´S LOST, 2006, PARIS/FRANCE.
150 IEA, LIGHT´S LABOUR´S LOST, 2006, PARIS/FRANCE.
figure 10.15: breakdown of final energy demand in 2009for electricity and fuels/heat in ‘others’ (IEA ENERGY BALANCES 2011)
WORLD
OECD AM
ERICAS
OECD ASIA
OCEANIA
OECD EUROPE
EASTERN EUROPE/E
URASIAIN
DIA
CHINA
OTHER NON-O
ECD ASIA
LATIN A
MERIC
AS
MID
DLE EAST
AFRICA
0%
10%
20%
30%
40%
50%
60%
70%
80%
90%
100%
•ELECTRICITY
• FUELS/HEAT
figure 10.16: breakdown of fuel and heat use in ‘others’in 2009 (IEA ENERGY BALANCES 2011)
WORLD
OECD AM
ERICAS
OECD ASIA
OCEANIA
OECD EUROPE
EASTERN EUROPE/E
URASIAIN
DIA
CHINA
OTHER NON-O
ECD ASIA
LATIN A
MERIC
AS
MID
DLE EAST
AFRICA
0%
10%
20%
30%
40%
50%
60%
70%
80%
90%
100%
•NON-SPECIFIED (OTHER)
• FISHING
• AGRICULTURE/FORESTRY
• COMMERCE AND PUBLIC SERVICES
• RESIDENTIAL
© CREASENCESRO/DREAMSTIMEimage FRIDGE.
image POWER PLUGS.
© T. TROJANOW
SKI/DREAMSTIME

WORLD ENERGY [R]EVOLUTIONA SUSTAINABLE WORLD ENERGY OUTLOOK
10
energ
y efficiency
|BUILDINGS AND AGRICULTURE
268
To improve the efficiency of existing heating systems, an option isto install new thermostatic valves which can save 15% of energyrequired for heating. On average, this option is installed in anestimated 40% of systems in Europe.151
Besides reducing the demand for heating, another option is toimprove the conversion of efficiency of heat supply. A number ofoptions are available such as high efficiency boilers that canachieve efficiencies of 107%, based on lower heating value.Another option is the use of heat pumps (see section 3.1.2).
Space heating Energy savings options for hot water include pipeinsulation and high efficiency boilers. Another option is heatrecovery units that capture the waste heat from water going downthe drain and use it to preheat cold water before it enters thehousehold water heater. A heat recovery system can recover as muchas 70% of this heat and recycle it back for immediate use.152
Furthermore, water saving shower heads and flow inhibitors can beimplemented. The typical saving rate (in terms of energy) for showerheads is 12,5% and 25% for flow inhibitors.153 In developingregions, improved coke stoves can be an important energy-efficiencyoption, which consume less energy than conventional ones.154
10.5.2 electricity use
While residential buildings use a bigger share of fuel and heat, forelectricity, the consumption is more evenly spread over the sub-sector“commerce and public services” and residential. Globally, 49% ofelectricity is used in residential buildings and 41% in commerce andpublic services (also referred to as services). The use of electricity in
the services sector strongly depends on the region and ranges from17% in India to 56% in OECD Asia Oceania, see Figure 10.18.
The breakdown of electricity use per type of appliance is differentper region. In the Energy [R]evolution scenario a convergence isassumed for the different types of electricity demand per regionin 2050. Based on data in the literature155, the overall breakdownof electricity use per type is:
• Space heating 10%
• Hot water 10%
• Lighting 20%
• ICT and home entertainment (HE) 12%
• Other appliances 30%
• Air conditioning 18%
Electricity savings option per application are discussed in the following.
Space heating and hot water Measures to reduce electricity use forspace heating and hot water are similar to measures for heating byfuels (see section 3.1.1). Changing the building shell can reduce theneed for heat, and the other approach is to improve the conversionefficiency of heat supply. This can be done for example with heatpumps to provide both cooling and space and water heating, and arediscussed extensively in Chapter 9 – Energy Technologies.
references151 BETTGENHÄUSER ET AL. 2009.
152 ENVIROHARVEST, 2008.
153 BETTGENHÄUSER ET AL. 2009.
154 REEEP, 2009.
155 IEA (2009), IEA (2007) AND IPCC (2007A).
figure 10.17: elements of new building design that can substantially reduce energy use (WBCSD, 2005)
2
1
1. HEAT PUMP SYSTEMS THAT UTILISE THE STABLE TEMPERATURE IN THE GROUND TO SUPPORT AIR CONDITIONING IN SUMMER AND HEATING OR HOT WATER SUPPLY IN WINTER.
2. TREES TO PROVIDE SHADE AND COOLING IN SUMMER, AND SHIELD AGAINST COLD WIND IN WINTER.3. NEW BATTERY TECHNOLOGY FOR THE STORAGE OF THE ELECTRICITY PRODUCED BY SOLAR PANELS.4. TRANSPARENT DESIGN TO REDUCE THE NEED FOR LIGHTING. “LOW-E” GLASS COATING TO REDUCE THE AMOUNT OF HEAT ABSORBED
FROM SUNLIGHT THROUGH THE WINDOWS (WINDOWS WITH THE REVERSE EFFECT CAN BE INSTALLED IN COLDER CLIMATES).5. EFFICIENT LIGHT BULBS.6. SOLAR PHOTOVOLTAIC PANELS FOR ELECTRICITY PRODUCTION AND SOLAR THERMAL PANELS FOR WATER HEATING.7. ROOMS THAT ARE NOT NORMALLY HEATED (E.G. A GARAGE) SERVING AS ADDITIONAL INSULATION.8. VENTILATED DOUBLE SKIN FAÇADES TO REDUCE HEATING AND COOLING REQUIREMENTS.9. WOOD AS A BUILDING MATERIAL WITH ADVANTAGEOUS INSULATION PROPERTIES, WHICH ALSO STORES CARBON
AND IS OFTEN PRODUCED WITH BIOMASS ENERGY.
5
6
7
8
3
4
9

269
Technologies Typically, heat pumps can produce from 2.5 to 4 timesas much useful heat as the amount of high-grade energy input, withvariations due to seasonal performance. The sales of heat pumps in anumber of major European markets experienced strong growth inrecent years. Total annual sales in Austria, Finland, France, Germany,Italy, Norway, Sweden and Switzerland reached 576,000 in 2008,almost 50% more than in 2005.156 Data suggests that heat pumpsmay be beginning to achieve a critical mass for space and waterheating in a number of European countries.
Lighting Incandescent bulbs have been the most common lamps fora more than 100 years but also the most inefficient type since up to95% of the electricity is lost as heat.157 Incandescent lamps have arelatively short life-span (average value approximately 1,000 hours),but have a low initial cost and attractive light colour. CompactFluorescent Light Bulbs (CFLs) are more expensive thanincandescent, but they use about a quarter of the energy and lastabout 10 times longer.158 In recent years many policies have beenimplemented that reduce or ban the use of incandescent light bulbsin various countries.
It is important to realise however that lighting energy savings are notjust a question of using more efficient lamps, but also involve otherapproaches: reducing light absorption of luminaries (the fixture inwhich the lamp is housed), optimise lighting levels (which commonlyexceed values recommended by IEA),159 use of automatic controls likemovement and daylight sensors, and retrofitting buildings to makebetter use of daylight. Buildings designed to optimize daylight canreceive up to 70% of their annual illumination needs from daylightwhile a typical building will only get 20 to 25%.160
The IEA publication Light’s Labour’s Lost (2006) projects atleast 38% of lighting electricity consumption could be cut incost-effective ways, disregarding newer and promisingtechnologies such as light emitted diodes (LEDs).
ICT and home entertainment equipment Information andcommunication technologies (ICT) and home entertainment consistof a growing number of appliances in both residential andcommercial buildings, such as computers, (smart) phones, televisions,set-top boxes, games consoles, printers, copiers and servers. ICT andconsumer electronics account for about 15% of residentialelectricity consumption now.161 Globally a rise of 3 times is expectedfor ICT and consumer electronics, from 776 TWh in 2010 to 1,700TWh in 2030. One of the main options for reducing energy use inICT and home entertainment is using best available technology. IEA(2009b) estimates that a reduction is possible from 1,700 TWh to775 TWh in 2030 by applying best available technology and to1,220 TWh by least life-cycle costs measures, which do not imposeadditional costs on consumers. Below we discuss other energy savingsoptions for ICT and home entertainment.
Other appliances Other appliances include cold appliances(freezers and refrigerators), washing machines, dryers, dish washers,ovens and other kitchen equipment. Electricity use for coldappliances depends on average per household storage capacities, theratio of frozen to fresh food storage capacity, ambient temperaturesand humidity, and food storage temperatures and control.162
European and Japanese households typically have one combinedrefrigerator-freezer in the kitchen or they have a refrigerator and aseparate freezer, due to having less space in the home. In OECDNorth America and Australia where houses are larger, almost allhouseholds have a refrigerator-freezer and many also have aseparate freezer and occasionally a separate refrigerator.163 It isestimated that by improving the energy-efficiency of cold applianceson average 45% of electricity use could be saved for EU-27.164 For“wet appliances” they estimate a potential of 40-60% savings byimplementing best practice technology (see Table 10.3).
10
energ
y efficiency
|BUILDINGS AND AGRICULTURE
references156 IEA, 2010.
157 HENDEL-BLACKFORD ET AL., 2007.
158 ENERGY STAR, 2008.
159 IEA, LIGHT´S LABOUR´S LOST, 2006, PARIS/FRANCE.
160 IEA, LIGHT´S LABOUR´S LOST, 2006, PARIS/FRANCE.
161 IEA, 2009B
162 IEA , COOL APPLIANCES, 2003, PARIS/FRANCE.
163 IEA , COOL APPLIANCES, 2003, PARIS/FRANCE.
164 BETTGENHAUSER ET AL. (2009).
23111650
440210-140
60
305209-163
40
table 10.3: reference and best practice electricity use by “wet appliances”
Washing machine*Reference (kWh/dwelling/yr)Best practice (kWh/dwelling/yr)Improvement (%)
Dryer*Reference (kWh/dwelling/yr)Best practice (kWh/dwelling/yr)Improvement (%)
Dish washers*, **Reference (kWh/dwelling/yr)Best practice (kWh/dwelling/yr)Improvement (%)
notes* WWW.MILIEUCENTRAAL.NL
** ESTIMATE OF 163 DERIVED FROM VHK, 2005.
figure 10.18: breakdown of electricity use by sub sectorin sector ‘others’ in 2009 (IEA ENERGY BALANCES 2011)
WORLD
OECD AM
ERICAS
OECD ASIA
OCEANIA
OECD EUROPE
EASTERN EUROPE/E
URASIAIN
DIA
CHINA
OTHER NON-O
ECD ASIA
LATIN A
MERIC
AS
MID
DLE EAST
AFRICA
0%
10%
20%
30%
40%
50%
60%
70%
80%
90%
100%
•NON-SPECIFIED (OTHER)
• FISHING
• AGRICULTURE/FORESTRY
• COMMERCE AND PUBLIC SERVICES
• RESIDENTIAL
© PXLAR8/DREAMSTIME
© AGENCYBY/DREAMSTIME
image COMPACT FLUORESCENT LAMP LIGHT BULB.
image WASHING MACHINE.

WORLD ENERGY [R]EVOLUTIONA SUSTAINABLE WORLD ENERGY OUTLOOK
10
energ
y efficiency
|THE STANDARD HOUSEHOLD C
ONCEPT
270
Air conditioning There are several options for technological savingsfrom air conditioning equipment; one is using a different refrigerant.Tests with the refrigerant Ikon B show possible energy consumptionreductions of 20-25% compared to regularly used refrigerants.165
Also geothermal cooling is an important option which isexplained in Chapter 9 - Renewable Heating and Cooling. Ofseveral technical concepts available, the highest energy savingscan be achieved with two storage reservoirs in aquifers where insummer time cold water is used from the cold reservoir. The hotreservoir can be used with a heat pump for heating in winter.
Solar energy can also be used for heating and cooling, the differenttypes are also discussed in the previous chapter. Heat pumps andair conditioners that can be powered by solar photovoltaicsystems166 for example uses only 0.05 kW of electricity is insteadof 0.35 kW for regular air conditioning.167
As well as using efficient air conditioning equipment, it is asimportant to reduce the need for air conditioning. The ways toreduce cooling demand are to use insulation to prevent heat fromentering the building, reduce the amount of inefficient appliancespresent in the house (such as incandescent lamps, old refrigerators,etc.) that give off heat, use cool exterior finishes (such as cool rooftechnology168 or light-coloured paint on the walls) to reduce thepeak cooling demand as much as 10-15%169, improve windows anduse vegetation to reduce the amount of heat that comes into thehouse, and use ventilation instead of air conditioning units.
10.6 the standard household concept
In order to enable a specific level of energy demand as a basic“right” for all people in the world, we have developed the model ofan efficient Standard Household. A fully equipped OECD household(including fridge, oven, TV, radio, music centre, computer, lightsetc.) currently consumes between 1,500 and 3,400 kWh per yearper person. With an average of two to four people per householdthe total consumption is therefore between 3,000 and 12,000kWh/a. This demand could be reduced to about 550 kWh/year perperson just by using the most efficient appliances available on themarket today, without any significant lifestyle changes.
Based on this assumption, the ‘over-consumption’ of allhouseholds in OECD countries totals more than 2,100 billionkilowatt-hours. Comparing this figure with the current per capitaconsumption in developing countries, they would have the ‘right’to use about 1,350 billion kilowatt-hours more. The current‘oversupply’ to OECD households could therefore fill the gap inenergy supply to developing countries one and a half times over.
By implementing a strict technical standard for all electricalappliances, in order to achieve a level of 550 kWh/a per capitaconsumption, it would be possible to switch off more than 340coal power plants in OECD countries.
figure 10.19: efficiency in households - electricity demand per capita IN TWH/A
reference165 US DOE EERE, 2008.
166 DARLING, 2005.
167 AUSTRIAN ENERGY AGENCY, 2006 - NOTE THAT SOLAR COOLING AND GEOTHERMAL COOLING MAY
REDUCE THE NEED FOR HIGH GRADE ENERGY SUCH AS NATURAL GAS AND ELECTRICITY. ON THE
OTHER HAND THEY INCREASE THE USE OF RENEWABLE ENERGY. THE ENERGY SAVINGS ACHIEVED BY
REDUCING THE NEED OF HIGH GRADE ENERGY WILL BE PARTLY COMPENSATED BY AN INCREASE OF
RENEWABLE ENERGY.
168 US EPA, 2007.
169 ACEEE (2007).
FULLY EQUIPPED BEST PRACTICE
HOUSEHOLD DEMAND - PER CAPITA:
550 kWh/a
IMPROVING EFFICIENCY IN HOUSEHOLDS
MEANS EQUITY:
LATIN AMERICA
AFRICA
CHINA
INDIA
OTHER NON-OECD ASIA
GLOBAL PER CAPITA AVERAGE
EASTERN EUROPE/EURASIA
MIDDLE EAST
OECD ASIA OCEANIA
OECD EUROPE
OECD NORTH AMERICA
0 500 1,000 1,500 2,000 2,500 3,000 3,500 TWh/a
UNDERSUPPLY OF HOUSEHOLDS IN DEVELOPING COUNTRIES
IN 2005 - COMPARED TO “BEST PRACTICE HOUSEHOLD”:
1,373 TWh/a
OVER CONSUMPTION IN OECD COUNTRIES IN 2005 -
COMPARED TO “BEST PRACTICE HOUSEHOLD”:
2,169 TWh/a
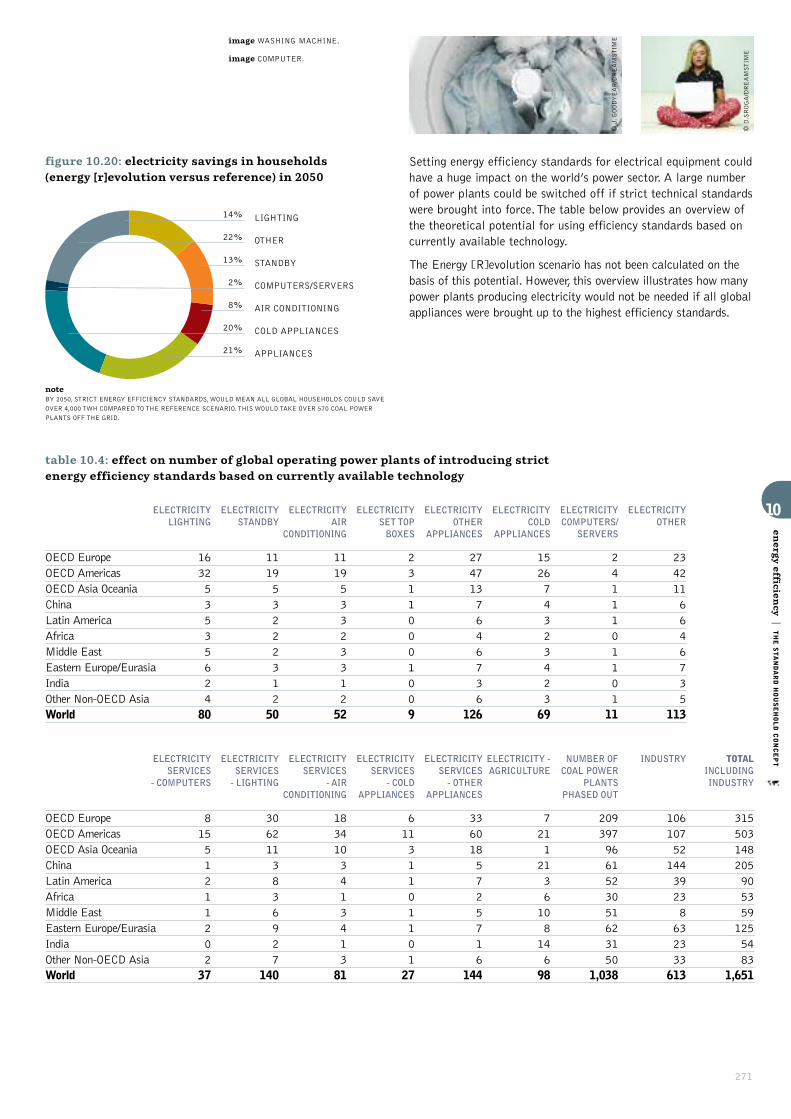
271
Setting energy efficiency standards for electrical equipment couldhave a huge impact on the world’s power sector. A large numberof power plants could be switched off if strict technical standardswere brought into force. The table below provides an overview ofthe theoretical potential for using efficiency standards based oncurrently available technology.
The Energy [R]evolution scenario has not been calculated on thebasis of this potential. However, this overview illustrates how manypower plants producing electricity would not be needed if all globalappliances were brought up to the highest efficiency standards.
figure 10.20: electricity savings in households (energy [r]evolution versus reference) in 2050
10
energ
y efficiency
|THE STANDARD HOUSEHOLD CONCEPT
ELECTRICITYLIGHTING
16325353562480
ELECTRICITYSERVICES
- COMPUTERS
8155121120237
ELECTRICITYSTANDBY
11195322231250
ELECTRICITYSERVICES- LIGHTING
3062113836927
140
ELECTRICITYAIR
CONDITIONING
11195332331252
ELECTRICITYSERVICES
- AIRCONDITIONING
183410341341381
ELECTRICITYSET TOP BOXES
23110001009
ELECTRICITYSERVICES
- COLDAPPLIANCES
6113110110127
ELECTRICITYOTHER
APPLIANCES
2747137646736
126
ELECTRICITYSERVICES - OTHER
APPLIANCES
3360185725716
144
ELECTRICITYCOLD
APPLIANCES
15267432342369
ELECTRICITY -AGRICULTURE
7211213610814698
ELECTRICITYCOMPUTERS/
SERVERS
241110110111
NUMBER OFCOAL POWER
PLANTSPHASED OUT
2093979661523051623150
1,038
ELECTRICITYOTHER
2342116646735
113
INDUSTRY
1061075214439238632333613
TOTALINCLUDINGINDUSTRY
3155031482059053591255483
1,651
table 10.4: effect on number of global operating power plants of introducing strict energy efficiency standards based on currently available technology
OECD EuropeOECD AmericasOECD Asia OceaniaChinaLatin AmericaAfricaMiddle EastEastern Europe/EurasiaIndiaOther Non-OECD AsiaWorld
OECD EuropeOECD AmericasOECD Asia OceaniaChinaLatin AmericaAfricaMiddle EastEastern Europe/EurasiaIndiaOther Non-OECD AsiaWorld
8% AIR CONDITIONING
20% COLD APPLIANCES
21% APPLIANCES
14% LIGHTING
22% OTHER
13% STANDBY
2% COMPUTERS/SERVERS
noteBY 2050, STRICT ENERGY EFFICIENCY STANDARDS, WOULD MEAN ALL GLOBAL HOUSEHOLDS COULD SAVE
OVER 4,000 TWH COMPARED TO THE REFERENCE SCENARIO. THIS WOULD TAKE OVER 570 COAL POWER
PLANTS OFF THE GRID.
© D.SROGA/DREAMSTIME
image WASHING MACHINE.
image COMPUTER.
© J. GOODYEAR/DREAMSTIME

10.7 low energy demand scenario: buildings and agriculture
The level of energy savings and the percentage reduction belowthe baseline vary significantly between regions. The largestpercentage reductions occur in China (38%), the economies intransition (38%) and OECD Europe (37%).
China’s reduction in 2050 comes from both improved efficiency andswitching away from the inefficient use of traditional biomass inbuildings to modern bioenergy (biofuels, biogas and bio-dimethylether) and commercial fuels. The smallest percentage reduction belowthe baseline occurs in India and is due to a rebound effect in whichsome increased consumption is triggered by some of the energyefficiency measures in the period to 2050. The largest absolutereductions occur in China, OECD Europe and OECD North America.Figure 10.21 shows which types of energy use have the highest sharein the savings in the baseline (IEA BLUE Map scenario).
WORLD ENERGY [R]EVOLUTIONA SUSTAINABLE WORLD ENERGY OUTLOOK
10
energ
y efficiency
|LOW ENERGY DEMAND SCENARIO & RESULTS FOR BUILDINGS AND AGRICULTURE
272
10.8 results for buildings and agriculture: the efficiency pathway for the energy [r]evolution
The Energy [R]evolution scenario for the agriculture andbuildings sector (“other”) is based on a combination of the IEA450 ppm scenario, the Blue map scenario and other assumptions.We assume that policies to improve energy-efficiency in thissector are implemented in 2013 and will lead to energy savingsfrom 2014 onwards. Table 10.5 shows the annual reductions ofenergy demand compared to the Reference scenario. Forelectricity use in OECD countries we use savings potentials ascalculated in the SERPEC-CC study for EU-27 (Bettgenhäuseret al. 2009). In this study, potentials have been calculated forenergy savings from all types of energy-efficiency improvementoptions. This bottom-up study estimated a savings potential of2.5% per year for electricity use in buildings in comparison tofrozen technology levels, for a 25 year period.
figure 10.21: breakdown of energy savings in BLUE Map scenario for sector ‘others’ (IEA, 2010)
references170 IN COMPARISON TO REFERENCE SCENARIO (EXTRAPOLATED WEO CURRENT POLICIES SCENARIO)
171 IN COMPARISON TO WEO CURRENT POLICIES SCENARIO.
172 IN COMPARISON TO BLUE MAP REFERENCE SCENARIO.
25% RESIDENTIAL SPACE HEATING
11% RESIDENTIAL WATER HEATING
5% RESIDENTIAL COOLING AND VENTILATION
3% RESIDENTIAL LIGHTING10% RESIDENTIAL COOKING
14%SERVICES LIGHTING AND OTHER
7%SERVICES COOLING AND VENTILATION
5%SERVICES WATER HEATING
10%SERVICES SPACE HEATING
10%RESIDENTIAL APPLIANCES AND OTHER
Fuel/heat
0.4%0.8%1.6%1.6%0.6%0.4%0.4%0.8%0.9%1.0%0.9%
Electricity
1.5%1.5%1.5%0.9%0.6%1.1%1.0%1.0%1.0%0.5%1.3%
ENERGY [R]EVOLUTION – ENERGY SAVINGS IN %/YR PERIOD 2013-2050170
Fuel/heat
0.1%0.3%0.6%1.1%0.6%0.3%0.2%0.3%0.9%0.2%0.3%
Electricity
0.7%1.0%0.8%1.4%1.4%2.2%1.0%1.0%1.2%0.8%1.3%
450 PPM SCENARIO %/YR171
Fuel/heat
0.9%0.7%1.6%1.6%0.5%1.4%0.4%0.8%1.6%1.4%1.3%
Electricity
1.1%0.8%1.1%0.9%1.0%1.4%0.9%0.6%1.0%0.5%1.0%
BLUE MAP - ENERGY SAVINGS IN %/YR172
table 10.5: annual reduction of energy demand in ‘others’ sector in energy [r]evolution scenario in comparison to the corresponding reference scenario
OECD AmericasOECD Asia OceaniaOECD EuropeEastern Europe/EurasiaIndiaChinaNon OECD AsiaLatin AmericaMiddle EastAfricaWorld

273
We assume that this annual efficiency improvement rate can beachieved in OECD countries for the period 2013-2050. Asmentioned in chapter 4, we assume that autonomous energy-efficiency improvement in the Reference scenario equals 1% peryear. This means that electricity savings of 1.5% per year in OECDcountries can be made on top of the references scenario. Thispotential for electricity use in OECD countries is within thetechnical potentials for electricity savings as calculated by Grauset al.173, which gives a technical potential of 3% saving per yearfor electricity use in buildings against frozen technology level.
Table 10.6 shows the final energy consumption in absolute valuesfor the Energy [R]evolution scenario, the BLUE Map scenarioand 450 ppm scenarios as comparison. Table 10.6 shows theunderlying Reference scenarios for all three scenarios.
It should be noted that the BLUE Map scenario for buildingscovers a lower share of the energy demand than the sectorbuildings and agriculture sector in the Energy [R]evolutionscenario and in the IEA WEO scenario; about 90% of energydemand. Still it becomes clear that the Energy [R]evolutionscenario for this sector is slightly below the 450 ppm scenarioand reasonably in line with the IEA BLUE Map scenario, interms of the level of energy demand.
In order to achieve the Energy [R]evolution low energydemand scenario the following measure needs to be achieved:
• Tighter building standards and codes for new residential andcommercial buildings. Regulatory standards for new residentialbuildings in cold climates are tightened to between 15 and 30kWh/m2/year for heating purposes, with little or no increase incooling load. In hot climates, cooling loads are reduced by aroundone-third. For commercial buildings, standards are introduced whichhalve the consumption for heating and cooling compared to 2007.This will mean less heating and cooling equipment is required.
• Large-scale refurbishment of residential buildings in theOECD. Around 60% of residential dwellings in the OECDwhich will still be standing in 2050 will need to be refurbishedto a low-energy standard (approximately 50 kWh/m2/ year),which also means they require less heating equipment. Thisrepresents the refurbishment of around 210 million residentialdwellings in the OECD between 2010 and 2050.
• Highly efficient heating, cooling and ventilation systems.These systems need to be both efficient and cost-effective. Thecoefficient of performance (COP) of installed cooling systemsdoubles from today’s level.
• Improved lighting efficiency. Notwithstanding recentimprovements, many driven by policy changes, there remainsconsiderable potential to reduce lighting demand worldwidethrough the use of the most efficient options.
• Improved appliance efficiency. Appliance standards areassumed to shift rapidly to least life-cycle cost levels, and tothe current BAT levels by 2030.
• The deployment of heat pumps for space and waterheating. This occurs predominantly in OECD countries, anddepends on the relative economics of different abatementoptions. And the deployment of micro- and mini-cogenerationfor space and water heating, and electricity generation.
Results: Energy efficiency pathway of the Energy[R]evolution scenario in the building and agricultural sector
10
energ
y efficiency
|RESULTS FOR BUILDINGS AND AGRICULTURE
Heat/fuels
91.476.697.7
Electricity
48.442.049.8
Total
139.8118.6147.5
2030
Heat/fuels
84.473.2
-
Electricity
54.652.4
-
Total
138.9125.4
-
2050
table 10.6: global final energy consumption for sector ‘others’ (EJ) in 2030 and 2050
Energy [R]evolutionIEA Blue mapIEA WEO - 450 ppm scenario
Heat/fuels
106.596.1108.0
Electricity
59.553.259.0
Total
166.0149.3167.0
2030
Heat/fuels
116.6107.6
-
Electricity
82.976.9
-
Total
199.5184.5
-
2050
table 10.7: global final energy consumption for sector ‘others’ (EJ) in 2030 and 2050 in underlying baseline scenarios
Reference scenario - Energy [R]evolution Reference scenario - BLUE Map IEA WEO – current policies scenario
© STEVE MORGAN/GP
image OFFICE BUILDINGS AT NIGHT IN LEEDS. MOST OF AN OFFICE BUILDINGS ENERGYCONSUMPTION OVER ITS LIFETIME IS IN LIGHTING, LIFTS, HEATING, COOLING AND COMPUTER USAGE.LIGHTING IS RESPONSIBLE FOR ONE-FOURTH OF ALL ELECTRICITY CONSUMPTION WORLDWIDE.BUILDINGS CAN BE MADE MORE SUSTAINABLE BY ARCHITECTURE THAT RESPONDS TO THECONDITIONS OF A SITE WITH INTEGRATED STRUCTURE AND BUILDING SERVICES. EFFECTIVE USE OFPASSIVE SOLAR HEAT AND THE THERMAL MASS OF THE BUILDING, HIGH INSULATION LEVELS,NATURAL DAYLIGHTING AND WIND POWER CAN ALL HELP TO MINIMIZE FOSSIL ENERGY USE.
references173 ENERGY DEMAND PROJECTIONS FOR ENERGY [R]EVOLUTION 2012,WINA GRAUS, KATERINA KERMELI,
UTRECHT UNIVERSITY, MARCH 2012.
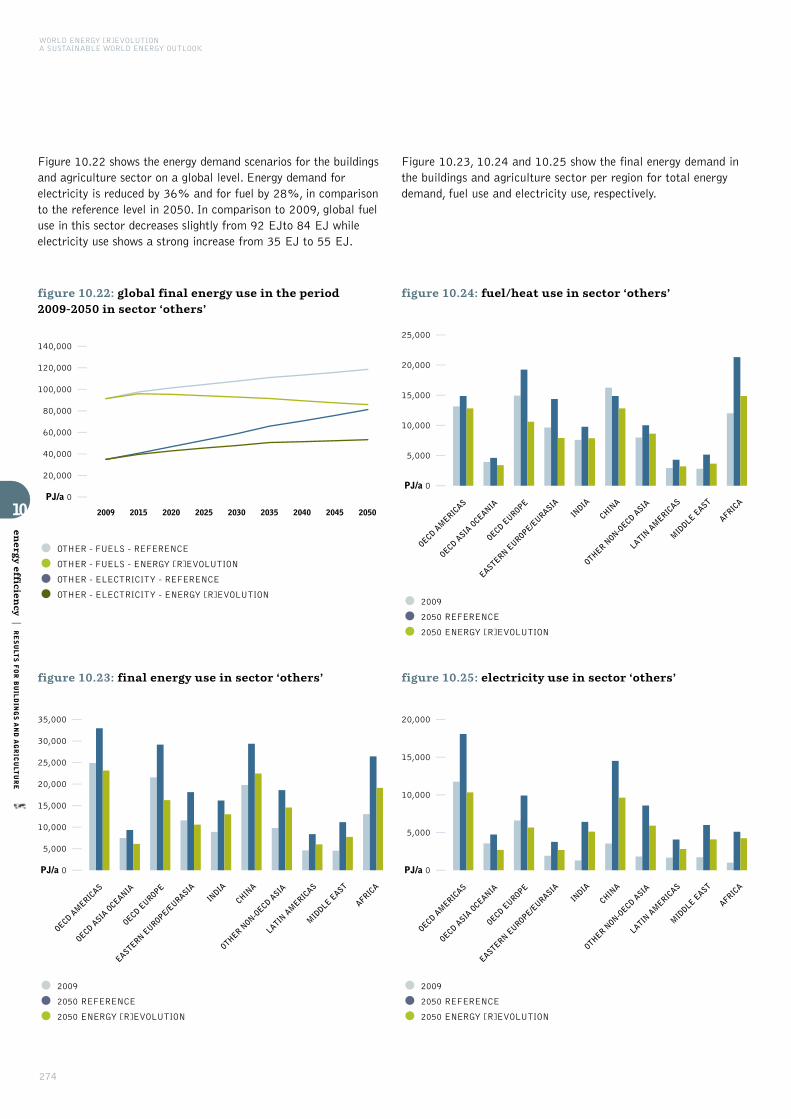
274
Figure 10.22 shows the energy demand scenarios for the buildingsand agriculture sector on a global level. Energy demand forelectricity is reduced by 36% and for fuel by 28%, in comparisonto the reference level in 2050. In comparison to 2009, global fueluse in this sector decreases slightly from 92 EJto 84 EJ whileelectricity use shows a strong increase from 35 EJ to 55 EJ.
WORLD ENERGY [R]EVOLUTIONA SUSTAINABLE WORLD ENERGY OUTLOOK
10
energ
y efficiency
|RESULTS FOR BUILDINGS AND AGRICULTURE
Figure 10.23, 10.24 and 10.25 show the final energy demand inthe buildings and agriculture sector per region for total energydemand, fuel use and electricity use, respectively.
figure 10.22: global final energy use in the period 2009-2050 in sector ‘others’
figure 10.23: final energy use in sector ‘others’
PJ/a 0
20,000
40,000
60,000
80,000
100,000
120,000
140,000
2009 2015 2020 2025 2030 2035 2040 2045 2050
OECD AM
ERICAS
OECD ASIA
OCEANIA
OECD EUROPE
EASTERN EUROPE/E
URASIAIN
DIA
CHINA
OTHER NON-O
ECD ASIA
LATIN A
MERIC
AS
MID
DLE EAST
AFRICA
PJ/a 0
5,000
10,000
15,000
20,000
25,000
30,000
35,000
•OTHER - FUELS - REFERENCE
• OTHER - FUELS - ENERGY [R]EVOLUTION
• OTHER - ELECTRICITY - REFERENCE
• OTHER - ELECTRICITY - ENERGY [R]EVOLUTION
• 2009
• 2050 REFERENCE
• 2050 ENERGY [R]EVOLUTION
figure 10.25: electricity use in sector ‘others’
OECD AM
ERICAS
OECD ASIA
OCEANIA
OECD EUROPE
EASTERN EUROPE/E
URASIAIN
DIA
CHINA
OTHER NON-O
ECD ASIA
LATIN A
MERIC
AS
MID
DLE EAST
AFRICA
PJ/a 0
5,000
10,000
15,000
20,000
•2009
• 2050 REFERENCE
• 2050 ENERGY [R]EVOLUTION
figure 10.24: fuel/heat use in sector ‘others’
OECD AM
ERICAS
OECD ASIA
OCEANIA
OECD EUROPE
EASTERN EUROPE/E
URASIAIN
DIA
CHINA
OTHER NON-O
ECD ASIA
LATIN A
MERIC
AS
MID
DLE EAST
AFRICA
PJ/a 0
5,000
10,000
15,000
20,000
25,000
•2009
• 2050 REFERENCE
• 2050 ENERGY [R]EVOLUTION

275
THE FUTURE OF THE TRANSPORTSECTOR IN THE E[R] SCENARIO
TECHNICAL AND BEHAVIOURAL MEASURES
PROJECTION OF THE FUTURELDV VECHICAL MARKET
CONCLUSION
transport
1111image THE PENINSULAR, NORTHEASTERN ARM OF ARGENTINA IS HOME TO SOME OF THE LAST REMAINING REMNANTS OF A SOUTH AMERICAN ECOSYSTEM KNOWN ASATLANTIC RAINFOREST, WHICH USED TO RUN ALL ALONG BRAZIL’S COAST FROM THE STATE OF RIO GRANDE DO NORTE THOUSANDS OF MILES SOUTH TO RIO GRANDE DO SUL.
a mix of lifestylechanges and newtechnologies.”
“
© JACQUES DESCLOITRES/NASA/GSFC
WORLD ENERGY [R]EVOLUTIONA SUSTAINABLE WORLD ENERGY OUTLOOK
11
transp
ort
|THE FUTURE OF TRANSPORT
276
Sustainable transport is needed to reduce the level of greenhousegases in the atmosphere, just as much as a shift to renewableelectricity and heat production. Today, nearly a third (27%) ofcurrent energy use comes from the transport sector, includingroad and rail, aviation and sea transport. In order to assess thepresent status of global transport, including its carbon footprint,a special study was undertaken for the 2012 Energy [R]evolutionreport by the German Aerospace Centre (DLR) Institute ofVehicle Concepts.
The demand projections for the Reference and this Energy[R]evolution scenario have been based on this analysis, althoughthe reference year has been updated on the basis of IEA WEO2011 (to 2009 figures).
This chapter provides an overview of the selected measuresrequired to develop a more energy efficient and sustainabletransport system in the future, with a focus on:
• reducing transport demand,
• shifting transport ‘modes’ (from high to low energy intensity),and
• energy efficiency improvements from technology development.
The section provides assumptions for the transport sector energydemand calculations used in the Reference and the Energy[R]evolution scenarios including projections for the passengervehicle market (Light Duty Vehicles).
Overall, some technologies will have to be adapted for greaterenergy efficiency. In other situations, a simple modification willnot be enough. The transport of people in megacities and urbanareas will have to be almost entirely reorganised and individualtransport must be complemented or even substituted by publictransport systems. Car sharing and public transport on demandare only the beginning of the transition needed for a system thatcarries more people more quickly and conveniently to theirdestination while using less energy.
For the 2012 Energy [R]evolution scenario, the German DLRInstitute of Vehicle Concepts undertook analyses of the entireglobal transport sector, broken down to the ten IEA regions. Thisreport outlines the key findings of the analysis’ calculations.
11.1 the future of the transport sector in the energy [r]evolution scenario
As for electricity projections, a detailed Reference scenario isrequired for transport. The scenario constructed includes detailedshares and energy intensity data per mode of transport and perregion up to 2050 (sources: WBSCD, EU studies). Based on theReference scenario, deviating transport performance andtechnical parameters are applied to create the ambitious Energy[R]evolution scenario for reducing energy consumption. Trafficperformance is assumed to decline for the high energy intensitymodes and further energy reduction potentials were assumedfrom further efficiency gains, alternative power trains and fuels.
International shipping has been left out whilst calculating thebaseline figures, because it spreads across all regions of theworld. The total is therefore made up of Light Duty Vehicles(LDVs), Heavy and Medium Duty Freight Trucks, rail, air, andnational marine transport (Inland Navigation). Although energyuse from international marine bunkers (international shipping fuelsuppliers) is not included in these calculations, it is still estimatedto account for 9% of today’s worldwide transport final energydemand and 7% by 2050. A recent UN report concluded thatcarbon dioxide emissions from shipping are much greater thaninitially thought and increasing at an alarming rate. It istherefore very important to improve the energy efficiency ofinternational shipping. Possible options are examined later in thischapter.
The definitions of the transport modes for the scenarios174 are:
• Light duty vehicles (LDV) are four-wheel vehicles usedprimarily for personal passenger road travel. These are typicallycars, Sports Utility Vehicles (SUVs), small passenger vans (upto eight seats) and personal pickup trucks. Light Duty Vehiclesare also simply called ‘cars’ within this chapter.
• Heavy Duty Vehicles (HDV) are as long haul trucks operatingalmost exclusively on diesel fuel. These trucks carry large loadswith lower energy intensity (energy use per tonne-kilometre ofhaulage) than Medium Duty Vehicles such as delivery trucks.
• Medium Duty Vehicles (MDV) include medium haul trucks anddelivery vehicles.
• Aviation in each region denotes domestic air travel (intraregionaland international air travel is provided as one figure).
• Inland Navigation denotes freight shipping with vesselsoperating on rivers and canals or in coastal areas for domestictransport purposes.
reference174 FULTON & EADS (2004).
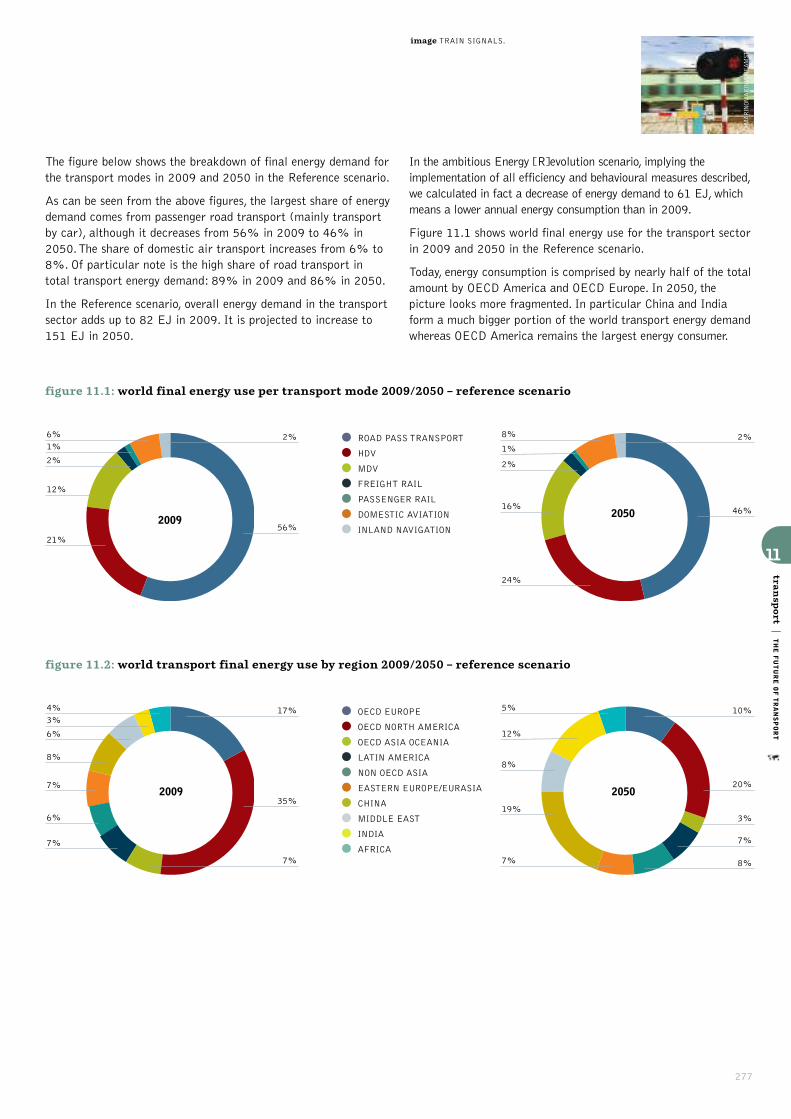
11
transp
ort
|THE FUTURE OF TRANSPORT
277
The figure below shows the breakdown of final energy demand forthe transport modes in 2009 and 2050 in the Reference scenario.
As can be seen from the above figures, the largest share of energydemand comes from passenger road transport (mainly transportby car), although it decreases from 56% in 2009 to 46% in2050. The share of domestic air transport increases from 6% to8%. Of particular note is the high share of road transport intotal transport energy demand: 89% in 2009 and 86% in 2050.
In the Reference scenario, overall energy demand in the transportsector adds up to 82 EJ in 2009. It is projected to increase to151 EJ in 2050.
In the ambitious Energy [R]evolution scenario, implying theimplementation of all efficiency and behavioural measures described,we calculated in fact a decrease of energy demand to 61 EJ, whichmeans a lower annual energy consumption than in 2009.
Figure 11.1 shows world final energy use for the transport sectorin 2009 and 2050 in the Reference scenario.
Today, energy consumption is comprised by nearly half of the totalamount by OECD America and OECD Europe. In 2050, thepicture looks more fragmented. In particular China and Indiaform a much bigger portion of the world transport energy demandwhereas OECD America remains the largest energy consumer.
figure 11.1: world final energy use per transport mode 2009/2050 – reference scenario
2%
56%
6%1%
2%
12%
21%
2%
46%
8%
1%
2%
16%
24%
• ROAD PASS TRANSPORT
• HDV
•MDV
• FREIGHT RAIL
• PASSENGER RAIL
• DOMESTIC AVIATION
• INLAND NAVIGATION
figure 11.2: world transport final energy use by region 2009/2050 – reference scenario
17%
35%
7%
4%3%
6%
8%
7%
6%
7%
10%
3%
7%
8%
20%
5%
12%
8%
19%
7%
• OECD EUROPE
• OECD NORTH AMERICA
• OECD ASIA OCEANIA
• LATIN AMERICA
• NON OECD ASIA
• EASTERN EUROPE/EURASIA
• CHINA
•MIDDLE EAST
• INDIA
• AFRICA
© MARINOMARINI/DREAMSTIMEimage TRAIN SIGNALS.
2050
20502009
2009

WORLD ENERGY [R]EVOLUTIONA SUSTAINABLE WORLD ENERGY OUTLOOK
278
11.2 technical and behavioural measures toreduce transport energy consumption
The following section describes how the transport modescontribute to total and relative energy demand. Then, a selectionof measures for reducing total and specific energy transportconsumption are put forward for each mode. Measures aregrouped as either behavioural or technical.
The three ways to decrease energy demand in the transportsector examined are:
• reduction of transport demand of high energy intensity modes
• modal shift from high energy intensive transport to low energyintensity modes
• energy efficiency improvements.
Table 11.1 summarises these options and the indicators used to quantify them.
11.2.1 step 1: reduction of transport demand
To use less transport overall means reducing the amount of‘passenger-km (p-km)’ travelled per capita and reducing freighttransport demand. The amount of freight transport is to a largeextent linked to GDP development and therefore difficult toinfluence. However, by improved logistics, for example optimal loadprofiles for trucks or a shift to regionally-produced and shippedgoods, demand can be limited.
Passenger transport The study focussed on the change inpassenger-km per capita of high-energy intensity air transport andpersonal vehicles modes. Passenger transport by Light duty vehicles(LDV), for example, is energy demanding both in absolute andrelative terms. Policy measures that enforce a reduction of passenger-km travelled by individual transport modes are an effective means toreduce transport energy demand.
Policy measures for reducing passenger transport demand in generalcould include:
• charge and tax policies that increase transport costs forindividual transport
• price incentives for using public transport modes
• installation or upgrading of public transport systems
• incentives for working from home
• stimulating the use of video conferencing in business
• improved cycle paths in cities.
Table 11.2 shows the p-km for light duty vehicle transport in 2009against the assumed p-km in the Reference scenario and in theEnergy [R]evolution scenario in 2050, broken down for all regions.
11
transp
ort
|TECHNICAL AND BEHAVIOURAL MEASURES TO REDUCE TRANSPORT
table 11.1: selection of measures and indicators
MEASURE
Reduction of transport demand
Modal shift
Energy efficiencyimprovements
INDICATOR
Passenger-km/capita
Ton-km/unit of GDP
MJ/tonne-km
MJ/Passenger-km
MJ/Passenger-km,|MJ/Ton-km
MJ/Passenger-km,MJ/Ton-km
MJ/Passenger-km,MJ/Ton-km
REDUCTION OPTION
Reduction in volume of passenger transport in comparison to the Reference scenario
Reduction in volume of freight transport in comparison to the Reference scenario
Modal shift from trucks to rail
Modal shift from cars to public transport
Shift to energy efficient passenger car drive trains (battery electric vehicles, hybrid and fuel cellhydrogen cars) and trucks (fuel cell hydrogen, battery electric, catenary or inductive supplied)
Shift to powertrain modes that may be fuelled by renewable energy (electric, fuel cell hydrogen)
Autonomous efficiency improvements of LDV, HDV, trains, airplanes over time
table 11.2: LDV passenger-km per capita
REGION
OECD Europe
OECD North America
OECD Asia Oceania
Latin America
Non OECD Asia
Eastern Europe/Eurasia
China
Middle East
India
Africa
2050 E[R]
7,390
8,211
10,893
5,468
2,673
10,361
3,364
8,358
5,011
834
2050 REF
10,518
11,940
11,861
6,235
3,708
13,074
5,462
14,383
6,196
1,346
2009
9,061
9,401
9,924
3,045
1,289
4,385
1,051
4,749
335
726
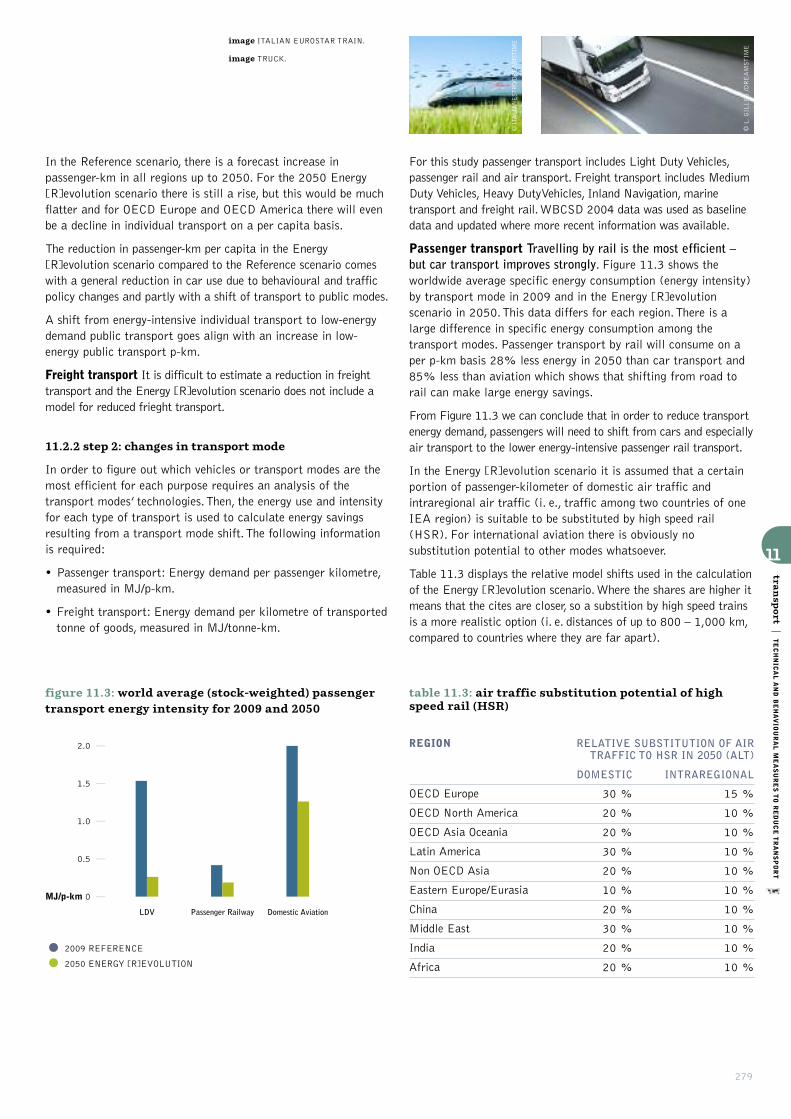
279
In the Reference scenario, there is a forecast increase inpassenger-km in all regions up to 2050. For the 2050 Energy[R]evolution scenario there is still a rise, but this would be muchflatter and for OECD Europe and OECD America there will evenbe a decline in individual transport on a per capita basis.
The reduction in passenger-km per capita in the Energy[R]evolution scenario compared to the Reference scenario comeswith a general reduction in car use due to behavioural and trafficpolicy changes and partly with a shift of transport to public modes.
A shift from energy-intensive individual transport to low-energydemand public transport goes align with an increase in low-energy public transport p-km.
Freight transport It is difficult to estimate a reduction in freighttransport and the Energy [R]evolution scenario does not include amodel for reduced frieght transport.
11.2.2 step 2: changes in transport mode
In order to figure out which vehicles or transport modes are themost efficient for each purpose requires an analysis of thetransport modes’ technologies. Then, the energy use and intensityfor each type of transport is used to calculate energy savingsresulting from a transport mode shift. The following informationis required:
• Passenger transport: Energy demand per passenger kilometre,measured in MJ/p-km.
• Freight transport: Energy demand per kilometre of transportedtonne of goods, measured in MJ/tonne-km.
For this study passenger transport includes Light Duty Vehicles,passenger rail and air transport. Freight transport includes MediumDuty Vehicles, Heavy DutyVehicles, Inland Navigation, marinetransport and freight rail. WBCSD 2004 data was used as baselinedata and updated where more recent information was available.
Passenger transport Travelling by rail is the most efficient –but car transport improves strongly. Figure 11.3 shows theworldwide average specific energy consumption (energy intensity)by transport mode in 2009 and in the Energy [R]evolutionscenario in 2050. This data differs for each region. There is alarge difference in specific energy consumption among thetransport modes. Passenger transport by rail will consume on aper p-km basis 28% less energy in 2050 than car transport and85% less than aviation which shows that shifting from road torail can make large energy savings.
From Figure 11.3 we can conclude that in order to reduce transportenergy demand, passengers will need to shift from cars and especiallyair transport to the lower energy-intensive passenger rail transport.
In the Energy [R]evolution scenario it is assumed that a certainportion of passenger-kilometer of domestic air traffic andintraregional air traffic (i. e., traffic among two countries of oneIEA region) is suitable to be substituted by high speed rail(HSR). For international aviation there is obviously nosubstitution potential to other modes whatsoever.
Table 11.3 displays the relative model shifts used in the calculationof the Energy [R]evolution scenario. Where the shares are higher itmeans that the cites are closer, so a substition by high speed trainsis a more realistic option (i. e. distances of up to 800 – 1,000 km,compared to countries where they are far apart).
11
transp
ort
|TECHNICAL AND BEHAVIOURAL MEASURES TO REDUCE TRANSPORT
table 11.3: air traffic substitution potential of highspeed rail (HSR)
REGION
OECD Europe
OECD North America
OECD Asia Oceania
Latin America
Non OECD Asia
Eastern Europe/Eurasia
China
Middle East
India
Africa
INTRAREGIONAL
15 %
10 %
10 %
10 %
10 %
10 %
10 %
10 %
10 %
10 %
DOMESTIC
30 %
20 %
20 %
30 %
20 %
10 %
20 %
30 %
20 %
20 %
RELATIVE SUBSTITUTION OF AIRTRAFFIC TO HSR IN 2050 (ALT)
figure 11.3: world average (stock-weighted) passengertransport energy intensity for 2009 and 2050
MJ/p-km 0
0.5
1.0
1.5
2.0
LDV Passenger Railway Domestic Aviation
•2009 REFERENCE
• 2050 ENERGY [R]EVOLUTION
© ITALIANESTRO/DREAMSTIME
© L. GILLES /DREAMSTIME
image ITALIAN EUROSTAR TRAIN.
image TRUCK.
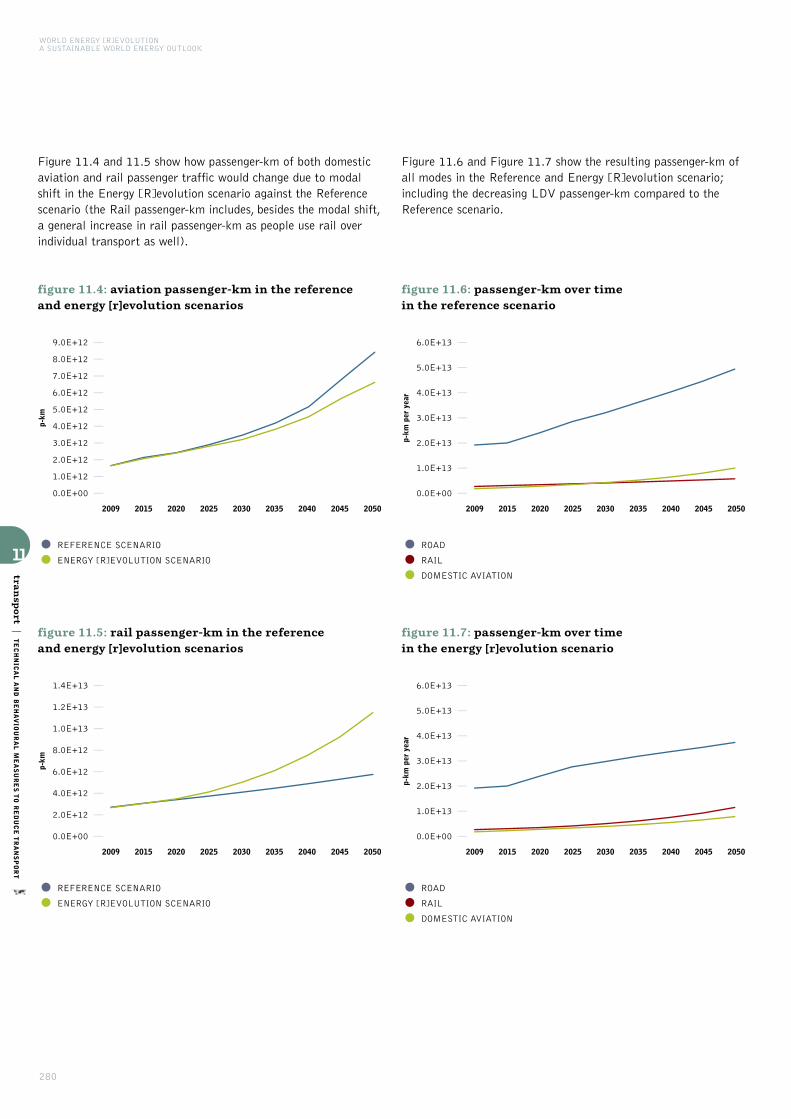
WORLD ENERGY [R]EVOLUTIONA SUSTAINABLE WORLD ENERGY OUTLOOK
280
Figure 11.4 and 11.5 show how passenger-km of both domesticaviation and rail passenger traffic would change due to modalshift in the Energy [R]evolution scenario against the Referencescenario (the Rail passenger-km includes, besides the modal shift,a general increase in rail passenger-km as people use rail overindividual transport as well).
Figure 11.6 and Figure 11.7 show the resulting passenger-km ofall modes in the Reference and Energy [R]evolution scenario;including the decreasing LDV passenger-km compared to theReference scenario.
11
transp
ort
|TECHNICAL AND BEHAVIOURAL MEASURES TO REDUCE TRANSPORT
figure 11.4: aviation passenger-km in the reference and energy [r]evolution scenarios
2009
p-km
2015 2020 2025 2030 2035 2040 2045 2050
0.0E+00
1.0E+12
2.0E+12
3.0E+12
4.0E+12
5.0E+12
6.0E+12
7.0E+12
8.0E+12
9.0E+12
•REFERENCE SCENARIO
• ENERGY [R]EVOLUTION SCENARIO
figure 11.5: rail passenger-km in the reference and energy [r]evolution scenarios
2009
p-km
2015 2020 2025 2030 2035 2040 2045 2050
0.0E+00
2.0E+12
4.0E+12
6.0E+12
8.0E+12
1.0E+13
1.2E+13
1.4E+13
•REFERENCE SCENARIO
• ENERGY [R]EVOLUTION SCENARIO
figure 11.6: passenger-km over time in the reference scenario
2009
p-km
per
yea
r
2015 2020 2025 2030 2035 2040 2045 2050
0.0E+00
1.0E+13
2.0E+13
3.0E+13
4.0E+13
5.0E+13
6.0E+13
•ROAD
• RAIL
• DOMESTIC AVIATION
figure 11.7: passenger-km over time in the energy [r]evolution scenario
2009 2015 2020 2025 2030 2035 2040 2045 2050
p-km
per
yea
r
0.0E+00
1.0E+13
2.0E+13
3.0E+13
4.0E+13
5.0E+13
6.0E+13
•ROAD
• RAIL
• DOMESTIC AVIATION

281
Freight transport Similar to Figure 11.3 which showed averagespecific energy consumption for passenger transport modes,Figure 11.8 shows the respective energy consumption for variousfreight transport modes in 2009 and in the Energy [R]evolutionscenario 2050, the values are weighted according to stock-and-traffic performance.
Energy intensity for all modes of transport is expected to decreaseby 2050. In absolute terms, road transport has the largestefficiency gains whereas transport on rail and on water remain themodes with the lowest relative energy demand per tonne-km. Railfreight transport will consume 89% less energy per tonne-km in2050 than long haul HDV. This means that large energy savingscan be made following a shift from road to rail.
Modal shifts for transporting goods in the Energy[R]evolution scenario The figures above indicate that as muchroad freight as possible should be shifted from road freighttransport to less energy intensive freight rail, to gain maximumenergy savings from modal shifts.
Since the use of ships largely depends on the geography of thecountry, a modal shift is not proposed for national ships but insteada shift towards freight rail. As the goods transported by mediumduty vehicles are mainly going to regional destinations (and aretherefore not suitable for the long distance nature of freight railtransport), no modal shift to rail is assumed for this transport type.
For long-haul heavy duty vehicles transport, however, especially lowvalue density, heavy goods that are transported on a long range aresuitable for a modal shift to railways.175 We assumed the followingrelative modal shifts in the Energy [R]evolution scenario:
Figure 11.9 and Figure 11.10 show the resulting tonne-km of themodes in the Reference scenario and Energy [R]evolutionscenario. In the Energy [R]evolution scenario freight transportedby rail is larger in absolute numbers than freight transported byheavy duty vehicles.
11
transp
ort
|TECHNICAL AND BEHAVIOURAL MEASURES TO REDUCE TRANSPORT
figure 11.9: tonne-km over time in the referencescenario
2009
tonn
e-km
per
yea
r
2015 2020 2025 2030 2035 2040 2045 2050
0.0E+00
0.5E+12
1.0E+12
1.5E+12
2.0E+12
2.5E+13
3.0E+13
3.5E+13
•HEAVY DUTY VEHICLES
•MEDIUM DUTY VEHICLES
• RAIL FREIGHT
• INLAND NAVIGATION
figure 11.10: tonne-km over time in the energy[r]evolution scenario
2009
tonn
e-km
per
yea
r
2015 2020 2025 2030 2035 2040 2045 2050
0.0E+00
0.5E+12
1.0E+12
1.5E+12
2.0E+12
2.5E+13
3.0E+13
3.5E+13
•HEAVY DUTY VEHICLES
•MEDIUM DUTY VEHICLES
• RAIL FREIGHT
• INLAND NAVIGATION
figure 11.8: world average (stock-weighted) freighttransport energy intensities for 2005 and 2050
Railway Inland navigation HDV MDV
MJ/t-km 0
1
2
3
4
5
•2009 REFERENCE
• 2050 ENERGY [R]EVOLUTION
table 11.4: modal shift of HDV tonne-km to freight railin 2050
REGION
OECD Europe
OECD North America
All other regions
25 %
23 %
30 %
MODAL SHIFT TO FREIGHT RAIL IN2050 ENERGY [R]EVOLUTION
reference175 TAVASSZY AND VAN MEIJEREN 2011.
© PN_PHOTO/DREAMSTIME
image TRANSPORT POLLUTION.
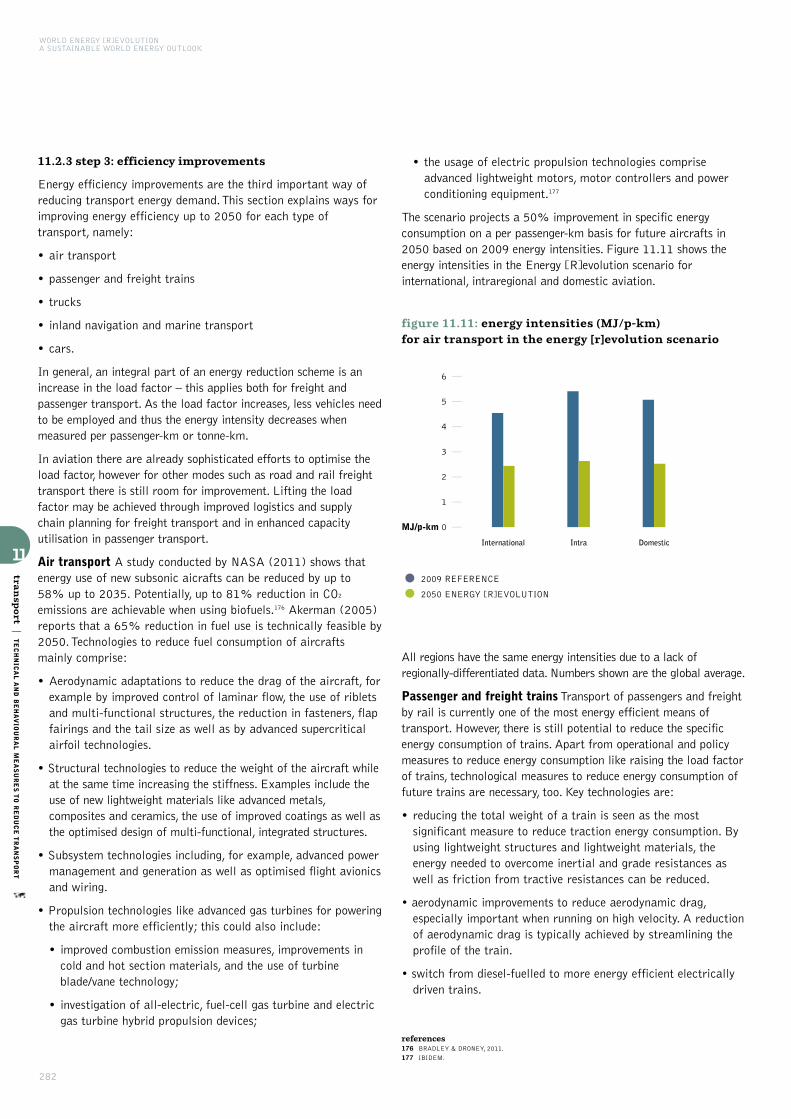
All regions have the same energy intensities due to a lack ofregionally-differentiated data. Numbers shown are the global average.
Passenger and freight trainsTransport of passengers and freightby rail is currently one of the most energy efficient means oftransport. However, there is still potential to reduce the specificenergy consumption of trains. Apart from operational and policymeasures to reduce energy consumption like raising the load factorof trains, technological measures to reduce energy consumption offuture trains are necessary, too. Key technologies are:
• reducing the total weight of a train is seen as the mostsignificant measure to reduce traction energy consumption. Byusing lightweight structures and lightweight materials, theenergy needed to overcome inertial and grade resistances aswell as friction from tractive resistances can be reduced.
• aerodynamic improvements to reduce aerodynamic drag,especially important when running on high velocity. A reductionof aerodynamic drag is typically achieved by streamlining theprofile of the train.
• switch from diesel-fuelled to more energy efficient electricallydriven trains.
WORLD ENERGY [R]EVOLUTIONA SUSTAINABLE WORLD ENERGY OUTLOOK
282
11.2.3 step 3: efficiency improvements
Energy efficiency improvements are the third important way ofreducing transport energy demand. This section explains ways forimproving energy efficiency up to 2050 for each type oftransport, namely:
• air transport
• passenger and freight trains
• trucks
• inland navigation and marine transport
• cars.
In general, an integral part of an energy reduction scheme is anincrease in the load factor – this applies both for freight andpassenger transport. As the load factor increases, less vehicles needto be employed and thus the energy intensity decreases whenmeasured per passenger-km or tonne-km.
In aviation there are already sophisticated efforts to optimise theload factor, however for other modes such as road and rail freighttransport there is still room for improvement. Lifting the loadfactor may be achieved through improved logistics and supplychain planning for freight transport and in enhanced capacityutilisation in passenger transport.
Air transport A study conducted by NASA (2011) shows thatenergy use of new subsonic aicrafts can be reduced by up to 58% up to 2035. Potentially, up to 81% reduction in CO2
emissions are achievable when using biofuels.176 Akerman (2005)reports that a 65% reduction in fuel use is technically feasible by2050. Technologies to reduce fuel consumption of aircraftsmainly comprise:
• Aerodynamic adaptations to reduce the drag of the aircraft, forexample by improved control of laminar flow, the use of ribletsand multi-functional structures, the reduction in fasteners, flapfairings and the tail size as well as by advanced supercriticalairfoil technologies.
• Structural technologies to reduce the weight of the aircraft whileat the same time increasing the stiffness. Examples include theuse of new lightweight materials like advanced metals,composites and ceramics, the use of improved coatings as well asthe optimised design of multi-functional, integrated structures.
• Subsystem technologies including, for example, advanced powermanagement and generation as well as optimised flight avionicsand wiring.
• Propulsion technologies like advanced gas turbines for poweringthe aircraft more efficiently; this could also include:
• improved combustion emission measures, improvements incold and hot section materials, and the use of turbineblade/vane technology;
• investigation of all-electric, fuel-cell gas turbine and electricgas turbine hybrid propulsion devices;
• the usage of electric propulsion technologies compriseadvanced lightweight motors, motor controllers and powerconditioning equipment.177
The scenario projects a 50% improvement in specific energyconsumption on a per passenger-km basis for future aircrafts in2050 based on 2009 energy intensities. Figure 11.11 shows theenergy intensities in the Energy [R]evolution scenario forinternational, intraregional and domestic aviation.
11
transp
ort
|TECHNICAL AND BEHAVIOURAL MEASURES TO REDUCE TRANSPORT
references176 BRADLEY & DRONEY, 2011.
177 IBIDEM.
figure 11.11: energy intensities (MJ/p-km) for air transport in the energy [r]evolution scenario
International Intra Domestic
MJ/p-km 0
1
2
3
4
5
6
•2009 REFERENCE
• 2050 ENERGY [R]EVOLUTION
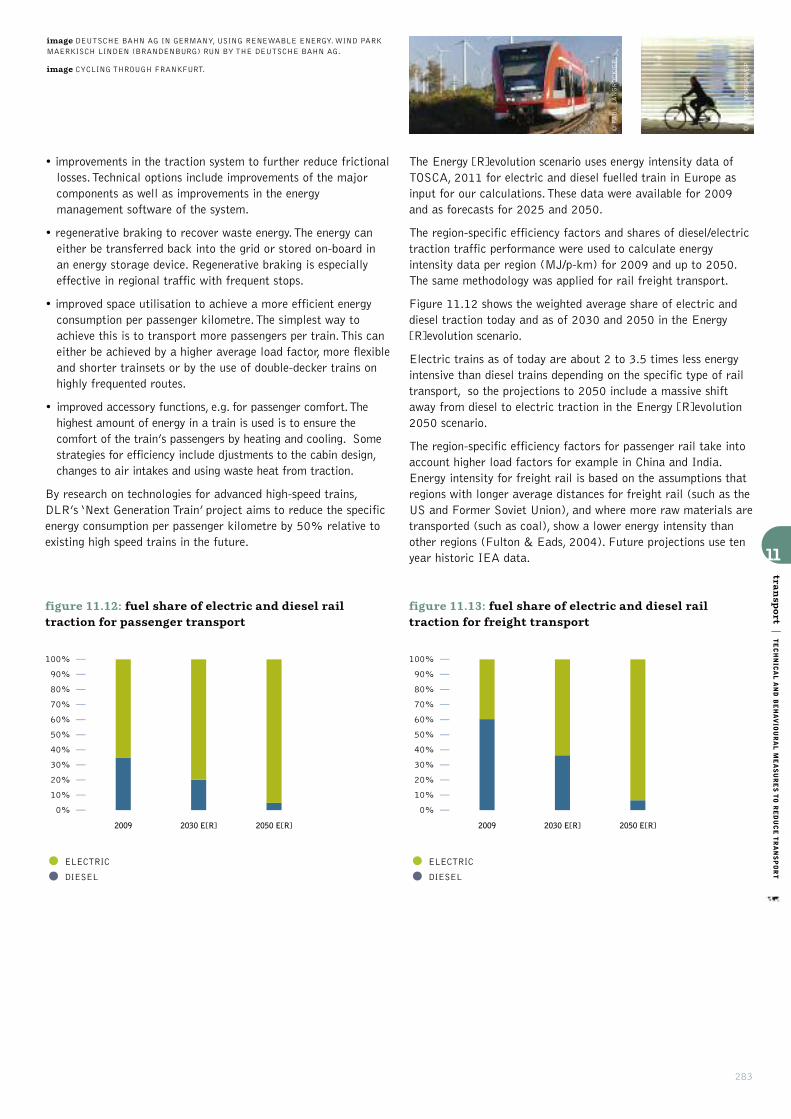
283
The Energy [R]evolution scenario uses energy intensity data ofTOSCA, 2011 for electric and diesel fuelled train in Europe asinput for our calculations. These data were available for 2009and as forecasts for 2025 and 2050.
The region-specific efficiency factors and shares of diesel/electrictraction traffic performance were used to calculate energyintensity data per region (MJ/p-km) for 2009 and up to 2050.The same methodology was applied for rail freight transport.
Figure 11.12 shows the weighted average share of electric anddiesel traction today and as of 2030 and 2050 in the Energy[R]evolution scenario.
Electric trains as of today are about 2 to 3.5 times less energyintensive than diesel trains depending on the specific type of railtransport, so the projections to 2050 include a massive shiftaway from diesel to electric traction in the Energy [R]evolution2050 scenario.
The region-specific efficiency factors for passenger rail take intoaccount higher load factors for example in China and India.Energy intensity for freight rail is based on the assumptions thatregions with longer average distances for freight rail (such as theUS and Former Soviet Union), and where more raw materials aretransported (such as coal), show a lower energy intensity thanother regions (Fulton & Eads, 2004). Future projections use tenyear historic IEA data.
• improvements in the traction system to further reduce frictionallosses. Technical options include improvements of the majorcomponents as well as improvements in the energymanagement software of the system.
• regenerative braking to recover waste energy. The energy caneither be transferred back into the grid or stored on-board inan energy storage device. Regenerative braking is especiallyeffective in regional traffic with frequent stops.
• improved space utilisation to achieve a more efficient energyconsumption per passenger kilometre. The simplest way toachieve this is to transport more passengers per train. This caneither be achieved by a higher average load factor, more flexibleand shorter trainsets or by the use of double-decker trains onhighly frequented routes.
• improved accessory functions, e.g. for passenger comfort. Thehighest amount of energy in a train is used is to ensure thecomfort of the train’s passengers by heating and cooling. Somestrategies for efficiency include djustments to the cabin design,changes to air intakes and using waste heat from traction.
By research on technologies for advanced high-speed trains,DLR’s ‘Next Generation Train’ project aims to reduce the specificenergy consumption per passenger kilometre by 50% relative toexisting high speed trains in the future.
11
transp
ort
|TECHNICAL AND BEHAVIOURAL MEASURES TO REDUCE TRANSPORT
figure 11.12: fuel share of electric and diesel railtraction for passenger transport
figure 11.13: fuel share of electric and diesel railtraction for freight transport
2009 2030 E[R] 2050 E[R]
0%
10%
20%
30%
40%
50%
60%
70%
80%
90%
100%
•ELECTRIC
• DIESEL
2009 2030 E[R] 2050 E[R]
0%
10%
20%
30%
40%
50%
60%
70%
80%
90%
100%
•ELECTRIC
• DIESEL
© STEVE MORGAN/GP
image DEUTSCHE BAHN AG IN GERMANY, USING RENEWABLE ENERGY. WIND PARKMAERKISCH LINDEN (BRANDENBURG) RUN BY THE DEUTSCHE BAHN AG.
image CYCLING THROUGH FRANKFURT.
© PAUL LANGROCK/GP
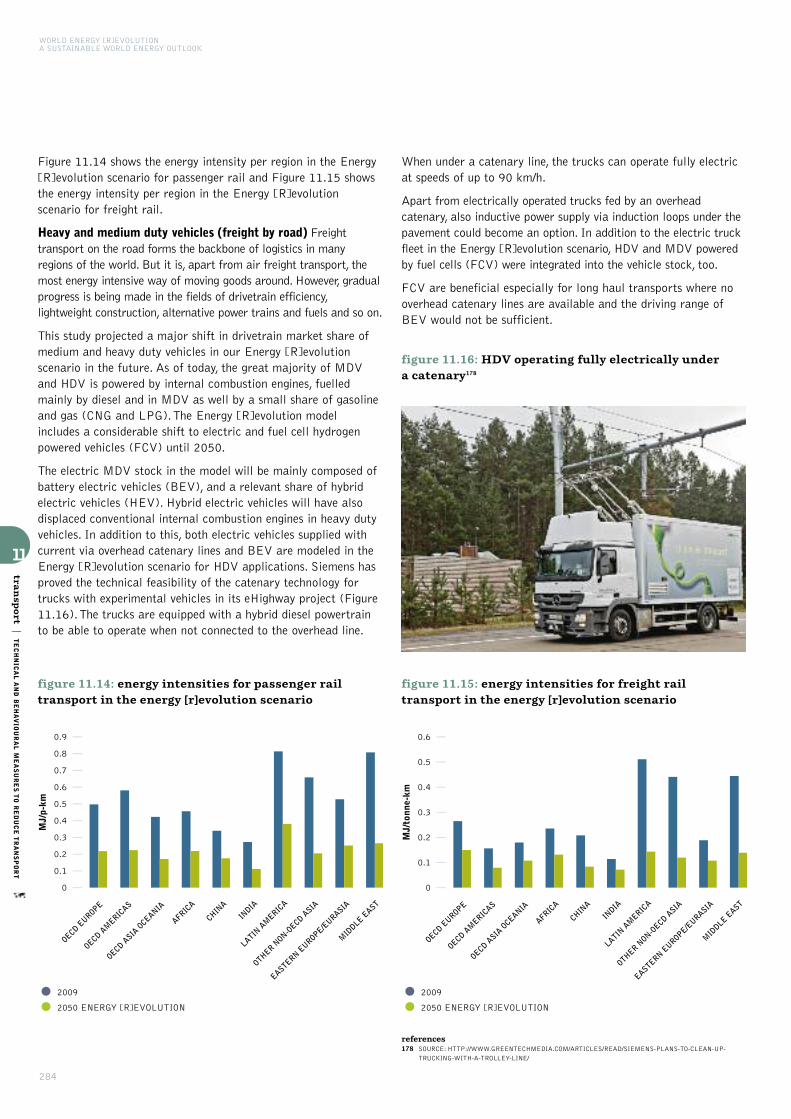
WORLD ENERGY [R]EVOLUTIONA SUSTAINABLE WORLD ENERGY OUTLOOK
284
Figure 11.14 shows the energy intensity per region in the Energy[R]evolution scenario for passenger rail and Figure 11.15 showsthe energy intensity per region in the Energy [R]evolutionscenario for freight rail.
Heavy and medium duty vehicles (freight by road) Freighttransport on the road forms the backbone of logistics in manyregions of the world. But it is, apart from air freight transport, themost energy intensive way of moving goods around. However, gradualprogress is being made in the fields of drivetrain efficiency,lightweight construction, alternative power trains and fuels and so on.
This study projected a major shift in drivetrain market share ofmedium and heavy duty vehicles in our Energy [R]evolutionscenario in the future. As of today, the great majority of MDVand HDV is powered by internal combustion engines, fuelledmainly by diesel and in MDV as well by a small share of gasolineand gas (CNG and LPG). The Energy [R]evolution modelincludes a considerable shift to electric and fuel cell hydrogenpowered vehicles (FCV) until 2050.
The electric MDV stock in the model will be mainly composed ofbattery electric vehicles (BEV), and a relevant share of hybridelectric vehicles (HEV). Hybrid electric vehicles will have alsodisplaced conventional internal combustion engines in heavy dutyvehicles. In addition to this, both electric vehicles supplied withcurrent via overhead catenary lines and BEV are modeled in theEnergy [R]evolution scenario for HDV applications. Siemens hasproved the technical feasibility of the catenary technology fortrucks with experimental vehicles in its eHighway project (Figure11.16). The trucks are equipped with a hybrid diesel powertrainto be able to operate when not connected to the overhead line.
When under a catenary line, the trucks can operate fully electricat speeds of up to 90 km/h.
Apart from electrically operated trucks fed by an overheadcatenary, also inductive power supply via induction loops under thepavement could become an option. In addition to the electric truckfleet in the Energy [R]evolution scenario, HDV and MDV poweredby fuel cells (FCV) were integrated into the vehicle stock, too.
FCV are beneficial especially for long haul transports where nooverhead catenary lines are available and the driving range ofBEV would not be sufficient.
11
transp
ort
|TECHNICAL AND BEHAVIOURAL MEASURES TO REDUCE TRANSPORT
references178 SOURCE: HTTP://WWW.GREENTECHMEDIA.COM/ARTICLES/READ/SIEMENS-PLANS-TO-CLEAN-UP-
TRUCKING-WITH-A-TROLLEY-LINE/
figure 11.14: energy intensities for passenger railtransport in the energy [r]evolution scenario
OECD AM
ERICAS
OECD ASIA
OCEANIA
OECD EUROPE
EASTERN EUROPE/E
URASIAIN
DIA
CHINA
OTHER NON-O
ECD ASIA
LATIN A
MERIC
A
MID
DLE EAST
AFRICA
0
0.1
0.2
0.3
0.4
0.5
0.6
0.7
0.8
0.9
MJ/
p-km
•2009
• 2050 ENERGY [R]EVOLUTION
figure 11.15: energy intensities for freight railtransport in the energy [r]evolution scenario
figure 11.16: HDV operating fully electrically undera catenary178
OECD AM
ERICAS
OECD ASIA
OCEANIA
OECD EUROPE
EASTERN EUROPE/E
URASIAIN
DIA
CHINA
OTHER NON-O
ECD ASIA
LATIN A
MERIC
A
MID
DLE EAST
AFRICA
0
0.1
0.2
0.3
0.4
0.5
0.6
MJ/
tonn
e-km
•2009
• 2050 ENERGY [R]EVOLUTION
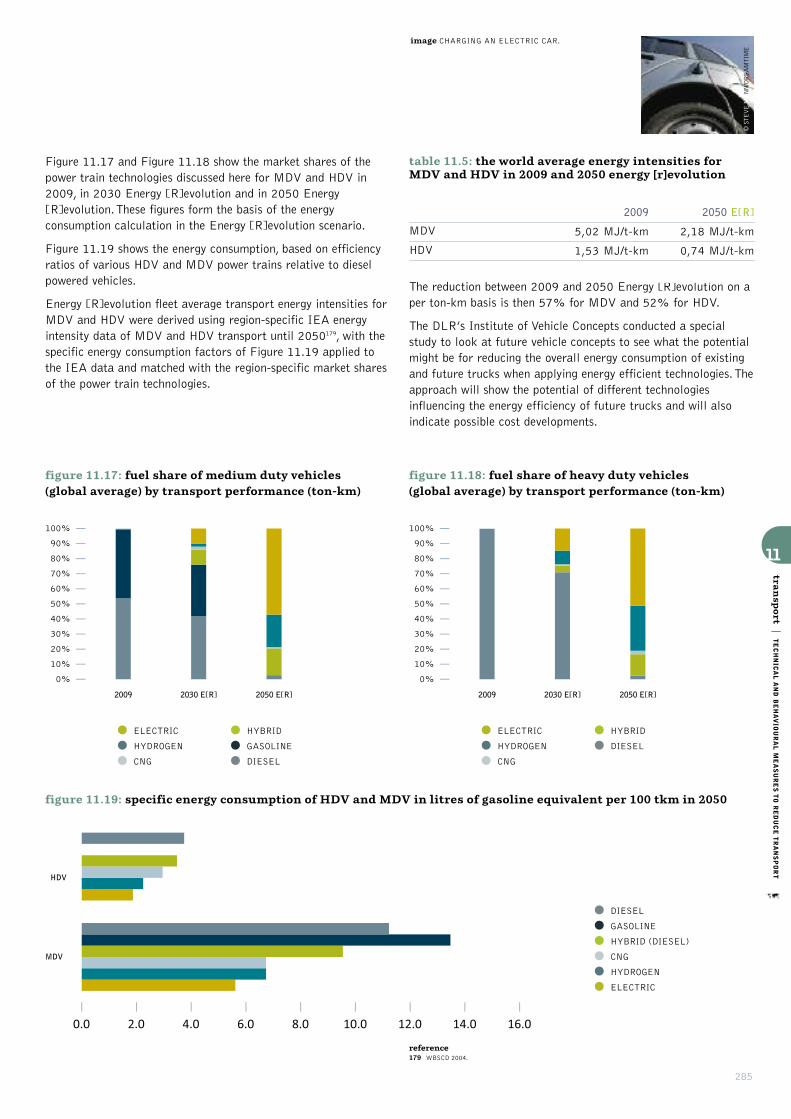
0.0 2.0 4.0 6.0 8.0 10.0 12.0 14.0 16.0
HDV
MDV
285
Figure 11.17 and Figure 11.18 show the market shares of thepower train technologies discussed here for MDV and HDV in2009, in 2030 Energy [R]evolution and in 2050 Energy[R]evolution. These figures form the basis of the energyconsumption calculation in the Energy [R]evolution scenario.
Figure 11.19 shows the energy consumption, based on efficiencyratios of various HDV and MDV power trains relative to dieselpowered vehicles.
Energy [R]evolution fleet average transport energy intensities forMDV and HDV were derived using region-specific IEA energyintensity data of MDV and HDV transport until 2050179, with thespecific energy consumption factors of Figure 11.19 applied tothe IEA data and matched with the region-specific market sharesof the power train technologies.
The reduction between 2009 and 2050 Energy [R]evolution on aper ton-km basis is then 57% for MDV and 52% for HDV.
The DLR’s Institute of Vehicle Concepts conducted a specialstudy to look at future vehicle concepts to see what the potentialmight be for reducing the overall energy consumption of existingand future trucks when applying energy efficient technologies. Theapproach will show the potential of different technologiesinfluencing the energy efficiency of future trucks and will alsoindicate possible cost developments.
11
transp
ort
|TECHNICAL AND BEHAVIOURAL MEASURES TO REDUCE TRANSPORT
reference179 WBSCD 2004.
figure 11.17: fuel share of medium duty vehicles (global average) by transport performance (ton-km)
figure 11.18: fuel share of heavy duty vehicles (global average) by transport performance (ton-km)
2009 2030 E[R] 2050 E[R]
0%
10%
20%
30%
40%
50%
60%
70%
80%
90%
100%
•ELECTRIC
• HYDROGEN
• CNG
• HYBRID
• GASOLINE
• DIESEL
• DIESEL
• GASOLINE
• HYBRID (DIESEL)
• CNG
• HYDROGEN
• ELECTRIC
2009 2030 E[R] 2050 E[R]
0%
10%
20%
30%
40%
50%
60%
70%
80%
90%
100%
•ELECTRIC
• HYDROGEN
• CNG
• HYBRID
• DIESEL
figure 11.19: specific energy consumption of HDV and MDV in litres of gasoline equivalent per 100 tkm in 2050
table 11.5: the world average energy intensities forMDV and HDV in 2009 and 2050 energy [r]evolution
MDV
HDV
2050 E[R]
2,18 MJ/t-km
0,74 MJ/t-km
2009
5,02 MJ/t-km
1,53 MJ/t-km
© STEVE MANN/DREAMTIME
image CHARGING AN ELECTRIC CAR.
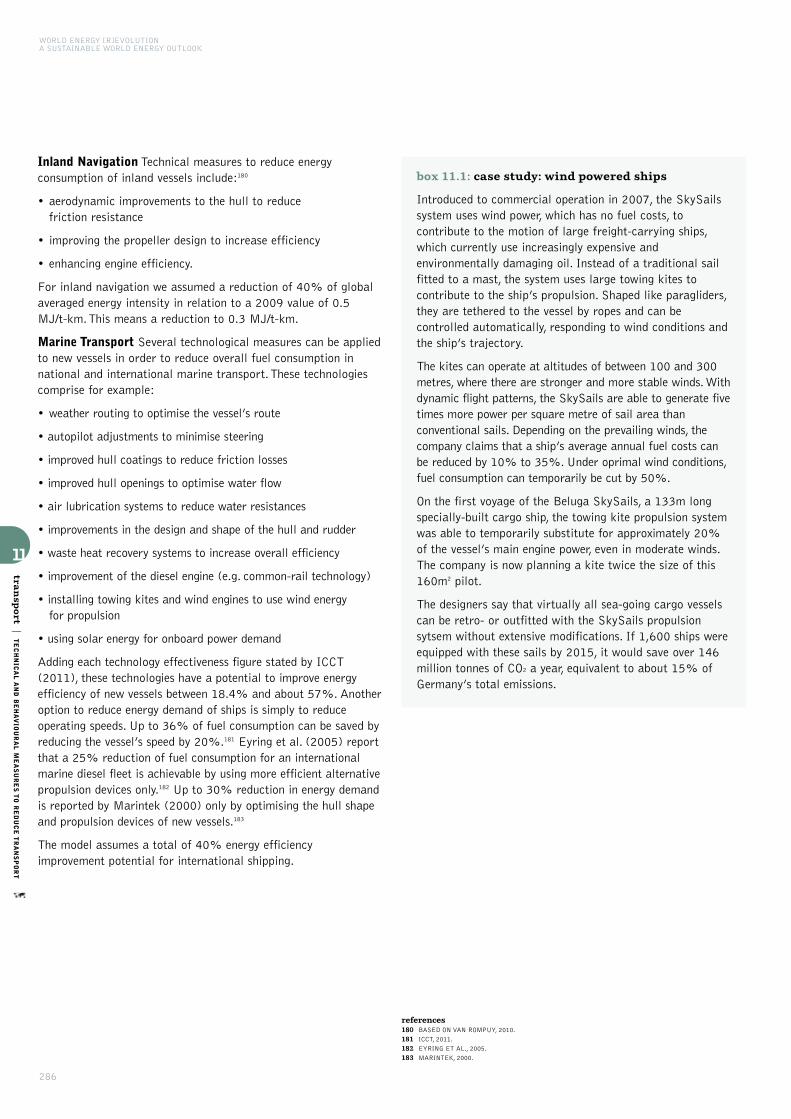
WORLD ENERGY [R]EVOLUTIONA SUSTAINABLE WORLD ENERGY OUTLOOK
286
Inland Navigation Technical measures to reduce energyconsumption of inland vessels include:180
• aerodynamic improvements to the hull to reduce friction resistance
• improving the propeller design to increase efficiency
• enhancing engine efficiency.
For inland navigation we assumed a reduction of 40% of globalaveraged energy intensity in relation to a 2009 value of 0.5MJ/t-km. This means a reduction to 0.3 MJ/t-km.
Marine Transport Several technological measures can be appliedto new vessels in order to reduce overall fuel consumption innational and international marine transport. These technologiescomprise for example:
• weather routing to optimise the vessel’s route
• autopilot adjustments to minimise steering
• improved hull coatings to reduce friction losses
• improved hull openings to optimise water flow
• air lubrication systems to reduce water resistances
• improvements in the design and shape of the hull and rudder
• waste heat recovery systems to increase overall efficiency
• improvement of the diesel engine (e.g. common-rail technology)
• installing towing kites and wind engines to use wind energy for propulsion
• using solar energy for onboard power demand
Adding each technology effectiveness figure stated by ICCT(2011), these technologies have a potential to improve energyefficiency of new vessels between 18.4% and about 57%. Anotheroption to reduce energy demand of ships is simply to reduceoperating speeds. Up to 36% of fuel consumption can be saved byreducing the vessel’s speed by 20%.181 Eyring et al. (2005) reportthat a 25% reduction of fuel consumption for an internationalmarine diesel fleet is achievable by using more efficient alternativepropulsion devices only.182 Up to 30% reduction in energy demandis reported by Marintek (2000) only by optimising the hull shapeand propulsion devices of new vessels.183
The model assumes a total of 40% energy efficiencyimprovement potential for international shipping.
11
transp
ort
|TECHNICAL AND BEHAVIOURAL MEASURES TO REDUCE TRANSPORT
box 11.1: case study: wind powered ships
Introduced to commercial operation in 2007, the SkySailssystem uses wind power, which has no fuel costs, tocontribute to the motion of large freight-carrying ships,which currently use increasingly expensive andenvironmentally damaging oil. Instead of a traditional sailfitted to a mast, the system uses large towing kites tocontribute to the ship’s propulsion. Shaped like paragliders,they are tethered to the vessel by ropes and can becontrolled automatically, responding to wind conditions andthe ship’s trajectory.
The kites can operate at altitudes of between 100 and 300metres, where there are stronger and more stable winds. Withdynamic flight patterns, the SkySails are able to generate fivetimes more power per square metre of sail area thanconventional sails. Depending on the prevailing winds, thecompany claims that a ship’s average annual fuel costs canbe reduced by 10% to 35%. Under oprimal wind conditions,fuel consumption can temporarily be cut by 50%.
On the first voyage of the Beluga SkySails, a 133m longspecially-built cargo ship, the towing kite propulsion systemwas able to temporarily substitute for approximately 20%of the vessel’s main engine power, even in moderate winds.The company is now planning a kite twice the size of this160m2 pilot.
The designers say that virtually all sea-going cargo vesselscan be retro- or outfitted with the SkySails propulsionsytsem without extensive modifications. If 1,600 ships wereequipped with these sails by 2015, it would save over 146million tonnes of CO2 a year, equivalent to about 15% ofGermany’s total emissions.
references180 BASED ON VAN ROMPUY, 2010.
181 ICCT, 2011.
182 EYRING ET AL., 2005.
183 MARINTEK, 2000.

287
Passenger cars This section draws on the future vehicletechnologies study conducted by the DLR’s Institute of VehicleConcepts. The approach shows the potential of differenttechnologies influencing the energy efficiency of future cars.
Many technologies can be used to improve the fuel efficiency ofpassenger cars. Examples include improvements in engines,weight reduction as well as friction and drag reduction.184
The impact of the various measures on fuel efficiency can besubstantial. Hybrid vehicles, combining a conventionalcombustion engine with an electric engine, have relatively low fuelconsumption. The most well-known is the Toyota Prius, whichoriginally had a fuel efficiency of about 5 litres of gasoline-equivalent per 100 km (litre ge/100 km). Toyota has recentlypresented an improved version with a lower fuel consumption of4.3 litres ge/100 km. Applying new lightweight materials, incombination with new propulsion technologies, can bring fuelconsumption levels down to 1 litre ge/100 km.
The figure below gives the energy intensities calculated usingpower train market shares and efficiency improvements for LDV inthe Reference scenario and in the Energy [R]evolution scenario.
The energy intensities for car passenger transport are currentlyhighest in OECD North America and lowest in OECD Europe. TheReference scenario shows a decrease in energy intensities in allregions, but the division between highest and lowest will remainthe same, although there will be some convergence. We haveassumed that the occupancy rate for cars remains nearly the sameas in 2009, as shown in the figure below.
Table 11.6 summarises the energy efficiency improvement forpassenger transport in the Energy [R]evolution 2050 scenario andTable 11.7 shows the energy efficiency improvement for freighttransport in the Energy [R]evolution 2050 scenario.
11
transp
ort
|TECHNICAL AND BEHAVIOURAL MEASURES TO REDUCE TRANSPORT
references184 DECICCO ET AL., 2001.
table 11.6: technical efficiency potential for worldpassenger transport
MJ/P-KM
LDV
Air (Domestic)
Buses
Mini-buses
Two wheels
Three wheels
Passenger rail
2050 E[R]
0.3
1.2
0.3
0.3
0.3
0.5
0.2
2009
1.5
2.5
0.5
0.5
0.5
0.7
0.4
table 11.7: technical efficiency potential for worldfreight transport
MJ/T-KM
MDV
HDV
Freight rail
Inland Navigation
2050 E[R]
2.7
0.8
0.1
0.3
2009
4.8
1.6
0.2
0.5
figure 11.20: energy intensities for freight railtransport in the energy [r]evolution scenario
OECD AM
ERICAS
OECD ASIA
OCEANIA
OECD EUROPE
EASTERN EUROPE/E
URASIAIN
DIA
CHINA
OTHER NON-O
ECD ASIA
LATIN A
MERIC
A
MID
DLE EAST
AFRICA
litre
s ge
/v-k
m
0
2
4
6
8
10
12
•2009
• 2050 REFERENCE
• 2050 ENERGY [R]EVOLUTION
figure 11.21: LDV occupancy rates in 2009 and in the energy [r]evolution 2050
OECD AM
ERICAS
OECD ASIA
OCEANIA
OECD EUROPE
EASTERN EUROPE/E
URASIAIN
DIA
CHINA
OTHER NON-O
ECD ASIA
LATIN A
MERIC
A
MID
DLE EAST
AFRICA
0.0
0.2
0.4
0.6
0.8
1.0
1.2
1.4
1.6
1.8
2.0
•2009
• 2050 ENERGY [R]EVOLUTION
© STEVE MORGAN/GP
image A SIGN PROMOTES A HYDROGEN REFUELING STATION IN REYKJAVIK. THESESTATIONS ARE PART OF A PLAN TO TRY AND MAKE ICELAND A ‘HYDROGEN ECONOMY.’
image PARKING SPACE FOR HYBRIDS ONLY.
© TARAN55/DREAMSTIME

WORLD ENERGY [R]EVOLUTIONA SUSTAINABLE WORLD ENERGY OUTLOOK
288
11.3 projection of the future LDV market
11.3.1 projection of the future technology mix
To achieve the substantial CO2-reduction targets in the Energy[R]evolution scenario would require a radical shift in fuels forcars and other light duty vehicles. It would mean thatconventional fossil fueled cars are no longer used in 2050 inalmost all world regions except for Africa. For viable, fullelectrification based on renewable energy sources, the modelassumes that petrol and diesel fuelled autonomous hybrids andplug-in hybrids that we have today are phased out already by2050. That is, two generations of hybrid technologies will pavethe way for the complete transformation to light duty vehicleswith full battery electric or hydrogen fuel cell powertrains. This isthe only way that is efficient enough for the use of renewableenergy to reach the CO2-targets in the LDV sector.
In the future it may not be possible to power LDVs for allpurposes by rechargeable batteries only. Therefore, hydrogen isrequired as a renewable fuel especially for larger LDVs includinglight commercial vehicles. Biofuels and remaining oil will be usedin other applications where a substitution is even harder than forLDVs. Figure 11.22 shows the share of fuel cell vehicles(autonomous hybrids) and full battery electric vehicles (grid-connectable) in 2050 in the new vehicle market.
11.3.2 projection of the future vehicle segment split
For future vehicle segment split the scenario is constructed todisaggregate the light-duty vehicle sales into three segments:small, medium and large vehicles. In this way, the model showsthe effect of ‘driving small urban cars’, to see if they are suitablefor megacities of the future. The size and CO2 emissions of the
vehicles are particularly interesting in the light of the enormousgrowth predicted in the LDV stock. For our purposes we coulddivide up the numerous car types as follows:
• The very small car bracket includes city, supermini,minicompact cars as well as one and two seaters.
• The small sized bracket includes compact and subcompactcars, micro and subcompact vans and small SUVs.
• The medium sized bracket includes car derived vans and smallstation wagons, upper medium class, midsize cars and stationwagons, executive class, compact passenger vans, car derivedpickups, medium SUVs, 2WD and 4WD.
• The large car bracket includes all kinds of luxury class, luxurymulti purpose vehicles, medium and heavy vans, compact andfull-size pickup trucks (2WD, 4WD), standard and luxurySUVs. In addition, we looked at light duty trucks in NorthAmerica and light commercial vehicles in China separately.
In examining the segment split, we have focused most strongly onthe two world regions which will be the largest emitters of CO2
from cars in 2050: North America and China. In North Americatoday the small vehicle segment is almost non-existant. We foundit necessary to introduce here small cars substantially up to asales share of 50% in 2050, triggered by rising fuel prices andpossibly vehicle taxes. For China, we have anticipated a similarshare of the mature car market as for Europe and projected thatthe small segment will grow by 3% per year at the expenses ofthe larger segments in the light of rising mass mobility. Thesegment split is shown in Figure 11.23.
11
transp
ort
|PROJECTION OF THE FUTURE LDV MARKET
figure 11.22: sales share of conventional ICE,autonomous hybrid and grid-connectable vehicles in 2050
OECD AM
ERICAS
OECD ASIA
OCEANIA
OECD EUROPE
EASTERN EUROPE/E
URASIAIN
DIA
CHINA
OTHER NON-O
ECD ASIA
LATIN A
MERIC
A
MID
DLE EAST
AFRICA
0%
10%
20%
30%
40%
50%
60%
70%
80%
90%
100%
•CONVENTIONAL
• GRID CONNECTABLE
• AUTONOMOUS HYBRIDS
figure 11.23: vehicle sales by segment in 2009 and 2050 in the energy [r]evolution scenario
OECD AM
ERICAS
OECD ASIA
OCEANIA
OECD EUROPE
EASTERN EUROPE/E
URASIAIN
DIA
CHINA
OTHER NON-O
ECD ASIA
LATIN A
MERIC
A
MID
DLE EAST
AFRICA
0%
10%
20%
30%
40%
50%
60%
70%
80%
90%
100%
2005
2005
2005
2005
2005
2005
2005
2005
2005
2005
2050
2050
2050
2050
2050
2050
2050
2050
2050
2050
•LARGE
•MEDIUM
•SMALL

289
11.3.3 projection of the future switch to alternative fuels
A switch to renewable fuels in the car fleet is one of thecornerstones of the low CO2 car scenario, with the mostprominent element the direct use of renewable electricity in cars.The different types of electric and hybrid cars, such as batteryelectric and plug-in hybrid, are summarised as ‘plug-in electric’.Their introduction will start in industrialised countries in 2015,
following an s-curve pattern, and are projected to reach about40% of total LDV sales in the EU, North America and thePacific OECD by 2050. Due to the higher costs of the technologyand renewable electricity availability, we have slightly delayedprogress in other countries. More cautious targets are applied forAfrica. The sales split in vehicles by fuel is presented in Figure11.24 for 2005 and 2050.
11.3.4 projection of the global vehicle stock development
There are huge differences in forecasts for the growth of vehiclesales in developing countries. In general, the increase in sales andthus vehicle stock and ownersip is linked to the forecast of GDPgrowth, which is a well established correlation in the sciencecommunity. However, this scenario analysis found that technologyshift in LDVs alone – although linked to enormous efficiencygains and fuel switch - is not enough to fulfil the ambitiousEnergy [R]evolution CO2 targets. A slow down of vehicle salesgrowth and a limitation or even reduction in vehicle ownershipper capita compared to the reference scenario was thus required.
Global urbanisation, the on-going rise of megacities, where spacefor parking is scarce, and the trend starting today that ownershipof cars might not be seen as desirable as in the past supports,draws a different scenario of the future compared to thereference case. Going against the global pattern of a century, thisdevelopment would have to be supported by massive policyintervention to promote modal shift and alternative forms of carusage. The development of the global car market is shown inFigure 11.25 and 11.26.
11
transp
ort
|PROJECTION OF THE FUTURE LDV MARKET
figure 11.24: fuel split in vehicle sales for 2050 energy [r]evolution by world region
OECD AM
ERICAS
OECD ASIA
OCEANIA
OECD EUROPE
EASTERN EUROPE/E
URASIAIN
DIA
CHINA
OTHER NON-O
ECD ASIA
LATIN A
MERIC
A
MID
DLE EAST
AFRICA
0%
10%
20%
30%
40%
50%
60%
70%
80%
90%
100%
•PETROL (ONLY)
• DIESEL (ONLY)
• CNG/LPG
• HYDROGEN
• PLUGIN ELECTRIC
figure 11.25: development of the global LDV stockunder the reference scenario
2000
2005
2010
2015
2020
2025
2030
2035
2040
2045
2050
LD
V s
tock
(m
illio
ns)
0
500
1,000
1,500
2,000
2,500
3,000
3,500
figure 11.26: development of the global LDV stockunder the energy [r]evolution scenario
2000
2005
2010
2015
2020
2025
2030
2035
2040
2045
2050
LD
V s
tock
(m
illio
ns)
0
500
1,000
1,500
2,000
2,500
3,000
3,500
•AFRICA
• INDIA
•MIDDLE EAST
• CHINA
• EASTERN EUROPE/EURASIA
• NON OECD ASIA
• LATIN AMERICA
• OECD ASIA OCEANIA
• OECD NORTH AMERICA
• OECD EUROPE
• AFRICA
• INDIA
•MIDDLE EAST
• CHINA
• EASTERN EUROPE/EURASIA
• NON OECD ASIA
• LATIN AMERICA
• OECD ASIA OCEANIA
• OECD NORTH AMERICA
• OECD EUROPE
© STEVE MORGAN/GP
image CARS ON THE ROAD NEAR MANCHESTER.ROAD TRANSPORT IS ONE OF THE BIGGEST SOURCESOF POLLUTION IN THE UK, CONTRIBUTING TO POORAIR QUALITY, CLIMATE CHANGE, CONGESTION ANDNOISE DISTURBANCE. OF THE 33 MILLIONVEHICLES ON OUR ROADS, 27 MILLION ARE CARS.
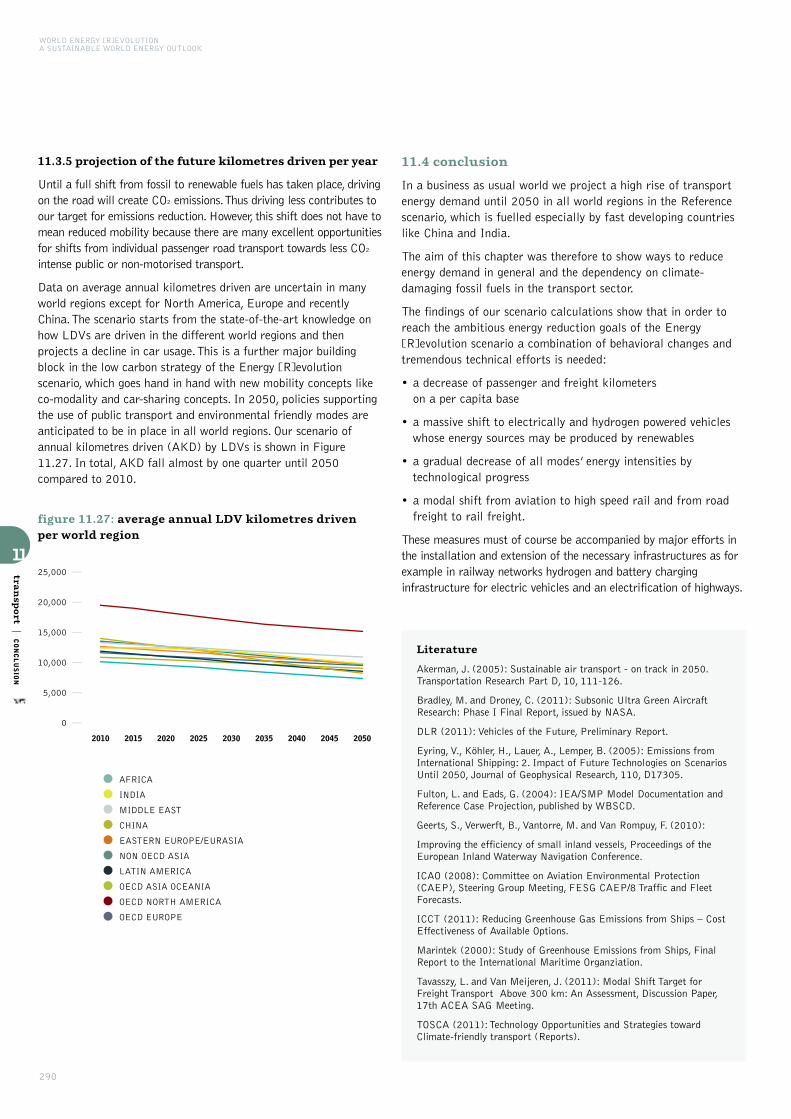
WORLD ENERGY [R]EVOLUTIONA SUSTAINABLE WORLD ENERGY OUTLOOK
290
11.3.5 projection of the future kilometres driven per year
Until a full shift from fossil to renewable fuels has taken place, drivingon the road will create CO2 emissions. Thus driving less contributes toour target for emissions reduction. However, this shift does not have tomean reduced mobility because there are many excellent opportunitiesfor shifts from individual passenger road transport towards less CO2
intense public or non-motorised transport.
Data on average annual kilometres driven are uncertain in manyworld regions except for North America, Europe and recentlyChina. The scenario starts from the state-of-the-art knowledge onhow LDVs are driven in the different world regions and thenprojects a decline in car usage. This is a further major buildingblock in the low carbon strategy of the Energy [R]evolutionscenario, which goes hand in hand with new mobility concepts likeco-modality and car-sharing concepts. In 2050, policies supportingthe use of public transport and environmental friendly modes areanticipated to be in place in all world regions. Our scenario ofannual kilometres driven (AKD) by LDVs is shown in Figure11.27. In total, AKD fall almost by one quarter until 2050compared to 2010.
11.4 conclusion
In a business as usual world we project a high rise of transportenergy demand until 2050 in all world regions in the Referencescenario, which is fuelled especially by fast developing countrieslike China and India.
The aim of this chapter was therefore to show ways to reduceenergy demand in general and the dependency on climate-damaging fossil fuels in the transport sector.
The findings of our scenario calculations show that in order toreach the ambitious energy reduction goals of the Energy[R]evolution scenario a combination of behavioral changes andtremendous technical efforts is needed:
• a decrease of passenger and freight kilometers on a per capita base
• a massive shift to electrically and hydrogen powered vehicleswhose energy sources may be produced by renewables
• a gradual decrease of all modes’ energy intensities bytechnological progress
• a modal shift from aviation to high speed rail and from roadfreight to rail freight.
These measures must of course be accompanied by major efforts inthe installation and extension of the necessary infrastructures as forexample in railway networks hydrogen and battery charginginfrastructure for electric vehicles and an electrification of highways.
11
transp
ort
|CONCLUSION
figure 11.27: average annual LDV kilometres driven per world region
2010 2015 2020 2025 2030 2035 2040 2045 2050
0
5,000
10,000
15,000
20,000
25,000
•AFRICA
• INDIA
•MIDDLE EAST
• CHINA
• EASTERN EUROPE/EURASIA
• NON OECD ASIA
• LATIN AMERICA
• OECD ASIA OCEANIA
• OECD NORTH AMERICA
• OECD EUROPE
Literature
Akerman, J. (2005): Sustainable air transport - on track in 2050.Transportation Research Part D, 10, 111-126.
Bradley, M. and Droney, C. (2011): Subsonic Ultra Green AircraftResearch: Phase I Final Report, issued by NASA.
DLR (2011): Vehicles of the Future, Preliminary Report.
Eyring, V., Köhler, H., Lauer, A., Lemper, B. (2005): Emissions fromInternational Shipping: 2. Impact of Future Technologies on ScenariosUntil 2050, Journal of Geophysical Research, 110, D17305.
Fulton, L. and Eads, G. (2004): IEA/SMP Model Documentation andReference Case Projection, published by WBSCD.
Geerts, S., Verwerft, B., Vantorre, M. and Van Rompuy, F. (2010):
Improving the efficiency of small inland vessels, Proceedings of theEuropean Inland Waterway Navigation Conference.
ICAO (2008): Committee on Aviation Environmental Protection(CAEP), Steering Group Meeting, FESG CAEP/8 Traffic and FleetForecasts.
ICCT (2011): Reducing Greenhouse Gas Emissions from Ships – CostEffectiveness of Available Options.
Marintek (2000): Study of Greenhouse Emissions from Ships, FinalReport to the International Maritime Organziation.
Tavasszy, L. and Van Meijeren, J. (2011): Modal Shift Target forFreight Transport Above 300 km: An Assessment, Discussion Paper,17th ACEA SAG Meeting.
TOSCA (2011): Technology Opportunities and Strategies towardClimate-friendly transport (Reports).

291
12
GLOSSARY OF COMMONLY USEDTERMS AND ABBREVIATIONS
DEFINITION OF SECTORS
glossary & appendix
12image ICEBERGS FLOATING IN MACKENZIE BAY ON THE THE NORTHEASTERN EDGE OF ANTARCTICA’S AMERY ICE SHELF, EARLY FEBRUARY 2012.
because we usesuch inefficient
lighting, 80 coal firedpower plants arerunning day andnight to producethe energy that is wasted.”
“
© NASA/JESSE ALLEN, ROBERT SIM
MON

WORLD ENERGY [R]EVOLUTIONA SUSTAINABLE WORLD ENERGY OUTLOOK
292
12.1 glossary of commonly used terms and abbreviations
CHP Combined Heat and Power CO2 Carbon dioxide, the main greenhouse gasGDP Gross Domestic Product
(means of assessing a country’s wealth)PPP Purchasing Power Parity (adjustment to GDP assessment
to reflect comparable standard of living)IEA International Energy Agency
J Joule, a measure of energy: kJ (Kilojoule) = 1,000 JoulesMJ (Megajoule) = 1 million JoulesGJ (Gigajoule) = 1 billion JoulesPJ (Petajoule) = 1015 JoulesEJ (Exajoule) = 1018 Joules
W Watt, measure of electrical capacity: kW (Kilowatt) = 1,000 wattsMW (Megawatt) = 1 million wattsGW (Gigawatt) = 1 billion wattsTW (Terawatt) = 112 watts
kWh Kilowatt-hour, measure of electrical output: kWh (Kilowatt-hour) = 1,000 watt-hours TWh (Terawatt-hour) = 1012 watt-hours
t Tonnes, measure of weight: t = 1 tonneGt = 1 billion tonnes
12.2 definition of sectors
The definition of different sectors follows the sectorial breakdown of the IEA World Energy Outlook series.
All definitions below are from the IEA Key World Energy Statistics.
Industry sector: Consumption in the industry sector includes thefollowing subsectors (energy used for transport by industry isnot included -> see under “Transport”)
• Iron and steel industry
• Chemical industry
• Non-metallic mineral products e.g. glass, ceramic, cement etc.
• Transport equipment
• Machinery
• Mining
• Food and tobacco
• Paper, pulp and print
• Wood and wood products (other than pulp and paper)
• Construction
• Textile and Leather
Transport sector: The Transport sector includes all fuels fromtransport such as road, railway, aviation, domestic navigation. Fuel used for ocean, coastal and inland fishing is included in “Other Sectors”.
Other sectors: “Other Sectors” covers agriculture, forestry, fishing,residential, commercial and public services.
Non-energy use: Covers use of other petroleum products such asparaffin waxes, lubricants, bitumen etc.
table 12.1: conversion factors - fossil fuels
MJ/kg
MJ/kg
GJ/barrel
kJ/m3
1 cubic
1 barrel
1 US gallon
1 UK gallon
0.0283 m3
159 liter
3.785 liter
4.546 liter
FUEL
Coal
Lignite
Oil
Gas
23.03
8.45
6.12
38000.00
table 12.2: conversion factors - different energy units
Gcal
238.8
1
107
0.252
860
Mbtu
947.8
3.968
3968 x 107
1
3412
GWh
0.2778
1.163 x 10⁻³
11630
2.931 x 10⁻⁴
1
FROM
TJ
Gcal
Mtoe
Mbtu
GWh
Mtoe
2.388 x 10⁻⁵
10(-7)
1
2.52 x 10⁻⁸
8.6 x 10⁻⁵
TO: TJMULTIPLY BY
1
4.1868 x 10⁻³
4.1868 x 10⁴
1.0551 x 10⁻³
3.6
12
glo
ssary &
appen
dix
|GLOSSARY

293
global: scenario results data
12
glo
ssary &
appen
dix
|APPENDIX - G
LOBAL
image THE EARTH ON JULY 11, 2005 AS SEEN BY NASA’S EARTH OBSERVING SYSTEM, A COORDINATED SERIES OF SATELLITES THAT MONITOR HOW EARTH IS CHANGING.THEY DOCUMENT EARTH’S BIOSPHERE, CARBON MONOXIDE, AEROSOLS, ELEVATION, AND NET RADIATION.
© NASA/MARIT JENTOFT-NILSEN, ROBERT SIM
MON

294
WORLD ENERGY [R]EVOLUTIONA SUSTAINABLE WORLD ENERGY OUTLOOK
global: reference scenario
12
glo
ssary &
appen
dix
|APPENDIX - G
LOBAL
Condensation power plantsCoalLigniteGasOilDiesel
Combined heat & power productionCoalLigniteGasOil
CO2 emissions power generation (incl. CHP public)CoalLigniteGasOil & diesel
CO2 emissions by sector% of 1990 emissionsIndustry1)Other sectors1)TransportPower generation2)District heating & other conversion
Population (Mill.)CO2 emissions per capita (t/capita)
1) including CHP autoproducers. 2) including CHP public
District heatingFossil fuelsBiomassSolar collectorsGeothermal
Heat from CHP Fossil fuelsBiomassGeothermalHydrogen
Direct heating1)Fossil fuelsBiomassSolar collectorsGeothermal2)
Total heat supply1)Fossil fuelsBiomassSolar collectorsGeothermal2)Hydrogen
RES share (including RES electricity)
1) heat from electricity (direct) not included; 2) including heat pumps.
2015
386,456351,44594,46286,1003,6143,4721,2762720
4.0%
119,10732,5636,9515,200293
31,53514,60025,707
49,481
160
14.1%
137,87540,8398,7176,338328
5,75019,33328,914
87935,552
27033.2%
66,23418.8%
35,01226,1097,0181,885
2020
416,436379,485100,18190,8213,8364,0701,4553180
4.4%
131,61338,3488,3955,674366
35,22015,02927,405
79,913
170
14.2%
147,69047,05810,3026,794407
5,45320,00431,0501,09235,908
33032.5%
71,12518.7%
36,95227,3547,5812,017
2030
469,241429,613116,457103,9494,9735,6121,9204383
5.2%
147,13447,33010,7955,857446
36,11115,18531,513
1111,108
190
15.2%
166,02259,47413,5647,392513
4,86719,97835,7241,73236,358
49731.7%
81,09318.9%
39,62728,9768,4992,152
2040
517,946476,674132,881116,6506,5977,1292,5005875
5.8%
160,37955,62013,0596,073492
35,67715,20235,342
2212,421
220
16.2%
183,41571,69716,8347,952554
3,69019,50339,8752,52037,320
85831.7%
91,82119.3%
41,27129,8349,2262,211
2050
564,280521,892150,478131,3667,9848,0183,1027469
5.8%
171,87462,63515,0676,565550
34,75815,50838,732
6413,582
310
17.0%
199,54082,91919,9468,642571
2,49219,00343,2403,19138,9591,09432.0%
101,82119.5%
42,38830,4639,7252,201
Total (incl. non-energy use)Total (energy use)TransportOil productsNatural gasBiofuelsElectricity
RES electricityHydrogenRES share Transport
IndustryElectricity
RES electricityDistrict heat
RES district heatCoalOil productsGasSolarBiomass and wasteGeothermal/ambient heatHydrogenRES share Industry
Other SectorsElectricity
RES electricityDistrict heat
RES district heatCoalOil productsGasSolarBiomass and wasteGeothermal/ambient heatRES share Other Sectors
Total RESRES share
Non energy useOilGasCoal
2009
335,013303,80081,57775,5292,9232,1589671870
2.9%
95,20224,1314,6584,607110
22,02613,29023,403
07,731
150
13.1%
127,02135,0496,7665,974126
5,99518,07026,030
54535,151
20733.7%
57,65319.0%
31,21323,9795,6921,542
table 12.3: global: electricity generationTWh/a
table 12.6: global: installed capacity GW
table 12.7: global: primary energy demand PJ/a
table 12.5: global: co2 emissionsMILL t/a
table 12.4: global: heat supplyPJ/a
2015
22,3527,8021,7064,02766991
2,949296
3,7918069
10891151
2,237584180
1,2607213740
1,566672
24,58916,3928,3861,8865,28774191
2,9490
5,2493,7918069
10843394151
1,8631,974
020,744
9153.7%21.3%
2020
26,0719,5431,6504,64160183
3,495401
4,2231,127
51158113352
2,420675170
1,3366017350
1,623797
28,49018,75910,2181,8205,97766183
3,4950
6,2374,2231,127
51158574118352
2,1232,232
024,128
1,2864.5%21.9%
2030
32,64612,7961,4166,10747973
3,938696
4,8341,7102143411638113
2,815815161
1,5424724190
1,7761,039
35,46123,43613,6111,5767,64952673
3,9380
8,0884,8341,7102143419371728113
2,5782,671
130,201
2,0645.8%22.8%
2040
39,04515,7311,2437,94340471
4,0581,0125,3252,29839254822514343
3,181939152
1,72445307140
1,9131,268
42,22628,25316,6701,3959,66744971
4,0580
9,9155,3252,298392548
1,31923814343
3,0613,083
236,060
2,8896.8%23.5%
2050
44,80417,8981,1479,92336068
4,1831,2975,7802,83855974628322258
3,5121,060146
1,86740378200
2,0281,484
48,31632,51118,9591,29411,790
40168
4,1830
11,6235,7802,838559746
1,67530322258
3,5153,481
341,293
3,6437.5%24.1%
Power plantsCoalLigniteGasOilDieselNuclearBiomassHydroWind
of which wind offshorePVGeothermalSolar thermal power plantsOcean energy
Combined heat & power plantsCoalLigniteGasOilBiomassGeothermalHydrogenCHP by producerMain activity producersAutoproducers
Total generationFossilCoalLigniteGasOilDiesel
NuclearHydrogenRenewablesHydroWindof which wind offshore
PVBiomassGeothermalSolar thermalOcean energy
Distribution lossesOwn consumption electricityElectricity for hydrogen productionFinal energy consumption (electricity)
Fluctuating RES (PV, Wind, Ocean)Share of fluctuating RESRES share (domestic generation)
2009
18,0645,6981,7123,280825107
2,676180
3,2262730206511
1,992488185
1,1318310420
1,451542
20,05613,5096,1861,8974,410908107
2,6760
3,8723,2262730202846711
1,6821,692
016,707
2941.5%19.3%
2015
5,5431,559292
1,2382825442057
1,1373973881451
55313435308532210
397156
6,0963,9541,693327
1,545335544200
1,7211,137397388791551
485.68.0%28.2%
2020
6,2941,826287
1,4002474948571
1,2505251712418111
57814932328402710
400178
6,8724,3591,975318
1,729288494850
2,0281,250525171249818111
649.79.5%29.5%
2030
7,6352,350232
1,69818746539117
1,4257546823425244
63316927372253810
404229
8,2685,1062,519259
2,070212465390
2,6221,4257546823415527244
99212.0%31.7%
2040
8,9912,798196
2,11715945549167
1,564959116351354013
69819024409244920
421278
9,6905,9622,988220
2,526183455490
3,1791,564959116351215374013
132213.6%32.8%
2050
10,2673,124182
2,58413342565211
1,6951,135160471446218
76121723434236030
443317
11,0286,7633,342205
3,018156425650
3,6991,6951,135160471272476218
162414.7%33.5%
Power plantsCoalLigniteGasOilDieselNuclearBiomassHydroWind
of which wind offshorePVGeothermalSolar thermal power plantsOcean energy
Combined heat & power productionCoalLigniteGasOilBiomassGeothermalHydrogenCHP by producerMain activity producersAutoproducers
Total generationFossilCoalLigniteGasOilDiesel
NuclearHydrogenRenewablesHydroWindof which wind offshore
PVBiomassGeothermalSolar thermalOcean energy
Fluctuating RES (PV, Wind, Ocean)Share of fluctuating RESRES share (domestic generation)
2009
4,3871,13829798731946395349951470191100
52112540286521800
399122
4,9083,2901,263338
1,273372463950
1,224995147019511100
165.83.4%24.9%
2015
568,874457,556147,91221,418121,067167,159
32,16979,14913,6502,9021,39758,0993,095
513.9%
2020
615,685491,659166,39920,343131,682173,236
38,12585,90015,2054,0571,96061,0773,593
713.9%
2030
693,951550,601192,30416,891155,412185,993
42,958100,39317,4036,1553,61468,4434,728
4814.4%
2040
760,603601,888209,39115,096179,878197,522
44,275114,44019,1738,2755,62975,2485,961155
15.0%
2050
805,253633,413212,15114,094195,804211,365
45,636126,20420,81110,2197,71880,5036,744209
15.6%
TotalFossilHard coalLigniteNatural gasCrude oil
NuclearRenewablesHydroWindSolarBiomassGeothermal/ambient heatOcean energyRES share
2009
498,243401,126120,81121,649107,498151,168
29,21567,90211,617
983626
52,0402,634
213.6%
2015
12,0737,8651,7521,85054066
1,78467020283478
13,8568,5351,9542,684684
31,951153%5,8733,6176299
13,4012,7617,2844.4
2020
13,5689,2731,6632,08249060
1,78170317583569
15,3499,9751,8372,917619
34,751166%6,3933,7616673
14,8353,0897,6684.5
2030
16,17711,7121,3192,71437952
1,85176016687155
18,02812,4721,4843,585487
39,192187%6,7743,9677716
17,4303,3068,3724.7
2040
18,50713,5071,1633,47531251
1,94682015692445
20,45414,3271,3204,399408
42,968205%6,9974,0558733
19,7823,4018,9784.8
2050
19,34314,0291,0803,92226349
2,04588115397635
21,38814,9101,2334,897347
45,267216%7,1854,0979847
20,6503,4879,4694.8
2009
10,1176,0901,7571,52965982
1,77959124685192
11,8966,6812,0022,379833
27,925133%4,6743,3805516
11,5262,8296,8184.1
2015
6,9466,56837404
7,0746,661390230
142,878105,88335,699
883411
156,898119,11236,464
8844380
24.1%
2020
7,4176,93747504
7,6767,174471310
151,410113,45736,3651,099489
166,502127,56737,3111,1005250
23.4%
2030
7,4986,89459815
8,4637,834582470
162,652122,56137,6751,742673
178,613137,28938,8561,7437250
23.1%
2040
7,7167,11060015
9,1248,338712750
172,640129,02440,0442,5421,030
189,480144,47241,3562,5431,110
0
23.8%
2050
8,1707,59157405
10,0369,0468711190
181,464133,99742,9353,2551,277
199,670150,63444,3803,2551,400
0
24.6%
2009
6,5986,33126503
6,3035,938355100
124,37390,03333,465
545329
137,274102,30234,085
5463420
25.5%
table 12.8: global: final energy demandPJ/a

Condensation power plantsCoalLigniteGasOilDiesel
Combined heat & power productionCoalLigniteGasOil
CO2 emissions power generation (incl. CHP public)CoalLigniteGasOil & diesel
CO2 emissions by sector% of 1990 emissionsIndustry1)Other sectors1)TransportPower generation2)District heating & other conversion
Population (Mill.)CO2 emissions per capita (t/capita)‘Efficiency’ savings (compared to Ref.)
1) including CHP autoproducers. 2) including CHP public
District heatingFossil fuelsBiomassSolar collectorsGeothermal
Heat from CHP Fossil fuelsBiomassGeothermalHydrogen
Direct heating1)Fossil fuelsBiomassSolar collectorsGeothermal2)Hydrogen
Total heat supply1)Fossil fuelsBiomassSolar collectorsGeothermal1)Hydrogen
RES share (including RES electricity)‘Efficiency’ savings (compared to Ref.)
1) heat from electricity (direct) not included; geothermal includes heat pumps
295
global: energy [r]evolution scenario
12
glo
ssary &
appen
dix
|APPENDIX - G
LOBAL
2015
371,184337,32586,81279,1063,2143,1251,3623514
4.0%
113,92431,3278,0817,317989
26,31412,44725,999
7909,1835470
17.2%
136,58940,46810,4387,115920
5,62817,15326,7041,91836,684
91737.2%
73,94421.9%
33,85924,3106,9702,580
2020
378,684344,15886,75876,3583,2974,5212,3218682626.3%
120,11235,47013,2669,8532,79025,3979,30225,7802,0309,9881,652640
24.9%
137,28843,07816,1128,7122,4295,06812,48224,9104,87435,5492,61544.9%
97,03128.2%
34,52522,5007,8494,177
2030
375,580340,07078,01457,1773,1236,4219,1105,5702,18317.1%
122,22240,37224,68314,4287,00317,7014,81022,5995,22910,6484,3542,08043.5%
139,83448,43229,61111,9215,8323,4087,08617,51012,29833,0406,13962.2%
153,43445.1%
35,51019,3678,2827,861
2040
362,042326,09565,02527,6722,8317,11620,02216,0037,38544.6%
120,71943,61734,86318,93113,4985,6332,46714,89011,10210,6429,5653,87268.6%
140,35152,32641,82414,60710,7311,1193,5129,65219,29329,49210,35079.6%
223,47568.5%
35,94716,6368,10511,206
2050
350,884316,15760,52912,4362,6366,73026,45424,94912,27371.5%
116,67945,00142,44122,26719,400
685864
5,07514,0869,38413,8495,46889.4%
138,94954,55851,45416,90815,378
76708
3,88624,03224,16614,61593.3%
277,21487.7%
34,72714,8947,29412,539
Total (incl. non-energy use)Total (energy use)TransportOil productsNatural gasBiofuelsElectricity
RES electricityHydrogenRES share Transport
IndustryElectricity
RES electricityDistrict heat
RES district heatCoalOil productsGasSolarBiomass and wasteGeothermal/ambient heatHydrogenRES share Industry
Other SectorsElectricity
RES electricityDistrict heat
RES district heatCoalOil productsGasSolarBiomass and wasteGeothermal/ambient heatRES share Other Sectors
Total RESRES share
Non energy useOilGasCoal
2009
335,013303,80081,57775,5292,9232,1589671870
2.9%
95,20224,1314,6584,607110
22,02613,29023,403
07,731
150
13.1%
127,02135,0496,7665,974126
5,99518,07026,030
54535,151
20733.7%
57,65319.0%
31,21323,9795,6921,542
table 12.9: global: electricity generationTWh/a
table 12.12: global: installed capacity GW
table 12.13: global: primary energy demand PJ/a
table 12.11: global: co2 emissionsMILL t/a
table 12.10: global: heat supplyPJ/a
2015
21,6487,1351,6693,98464877
2,226274
3,7711,320
452891449219
2,379528121
1,37863274140
1,609770
24,02815,6047,6641,7915,36271177
2,2260
6,1983,7711,320
452895481599219
1,8341,864
220,321
1,6286.8%25.8%446
2020
23,7667,1541,0424,25431859
1,623310
4,1922,989190878342466139
2,95951887
1,63137621587
1,8521,107
26,72515,0997,6711,1295,88535559
1,6237
9,9964,1922,989190878932400466139
1,8991,928477
22,387
4,00615.0%37.4%1,905
2030
29,0825,731130
3,7409531557359
4,5426,9711,2432,6341,0622,672560
3,95956220
1,93510
1,16223931
2,2101,749
33,04112,2536,292149
5,6751053155731
20,2014,5426,9711,2432,6341,5211,3012,672560
2,0371,9502,11426,892
10,16630.8%61.1%5,000
2040
36,1313,218
82,429
2217182371
4,81810,8222,3455,2421,9235,9881,089
4,8253460
1,8904
1,823658104
2,4362,389
40,9557,9343,564
84,318
2717182104
32,7354,81810,8222,3455,2422,1942,5815,9881,089
2,0751,8645,23631,756
17,15441.9%79.9%8,715
2050
41,2581520
6724100
3555,00913,7673,1607,2902,5999,3482,053
5,315770
1,4842
2,3361,167249
2,4292,885
46,5732,4012290
2,1566100
24943,9235,00913,7673,1607,2902,6913,7659,3482,053
2,1131,7917,92334,749
23,10949.6%94.3%12,776
Power plantsCoalLigniteGasOilDieselNuclearBiomassHydroWind
of which wind offshorePVGeothermalSolar thermal power plantsOcean energy
Combined heat & power plantsCoalLigniteGasOilBiomassGeothermalHydrogenCHP by producerMain activity producersAutoproducers
Total generationFossilCoalLigniteGasOilDiesel
NuclearHydrogenRenewablesHydroWindof which wind offshore
PVBiomassGeothermalSolar thermalOcean energy
Distribution lossesOwn consumption electricityElectricity for hydrogen productionFinal energy consumption (electricity)
Fluctuating RES (PV, Wind, Ocean)Share of fluctuating RESRES share (domestic generation)‘Efficiency’ savings (compared to Ref.)
2009
18,0645,6981,7123,280825107
2,676180
3,2262730206511
1,992488185
1,1318310420
1,451542
20,05613,5096,1861,8974,410908107
2,6760
3,8723,2262730202846711
1,6821,692
016,707
2941.5%19.3%
0
2015
5,5191,327283
1,1802543831453
1,1326381423424349
58512226340474830
408177
6,1043,6171,449309
1,520300383140
2,1741,1326381423410126349
88014.4%35.6%
2020
6,7411,335180
1,2341312922556
1,2461,357
616745416654
6851131841124106111
450234
7,4263,4751,448199
1,645154292251
3,7241,2461,357
616741626516654
2,08528.1%50.2%
2030
9,5131,069
221,139
45167562
1,3472,908391
1,764174714176
8931144
5182
203457
522371
10,4062,9311,184
261,657
4816757
7,3921,3472,908391
1,764265219714176
4,84746.6%71.0%
2040
12,6446491
80110102465
1,4284,287688
3,335325
1,362345
1,044710
5061
32512121
543501
13,6882,0497201
1,30611102421
11,5941,4284,287688
3,335390446
1,362345
7,96858.2%84.7%
2050
14,803340
30935065
1,4845,236892
4,548456
2,054610
1,104250
3940
42521049
508596
15,907770600
70335049
15,0871,4845,236892
4,548490666
2,054610
10,39465.3%94.8%
Power plantsCoalLigniteGasOilDieselNuclearBiomassHydroWind
of which wind offshorePVGeothermalSolar thermal power plantsOcean energy
Combined heat & power productionCoalLigniteGasOilBiomassGeothermalHydrogenCHP by producerMain activity producersAutoproducers
Total generationFossilCoalLigniteGasOilDiesel
NuclearHydrogenRenewablesHydroWindof which wind offshore
PVBiomassGeothermalSolar thermalOcean energy
Fluctuating RES (PV, Wind, Ocean)Share of fluctuating RESRES share (domestic generation)
2009
4,3871,13829798731946395349951470191100
52112540286521800
399122
4,9083,2901,263338
1,273372463950
1,224995147019511100
165.83.4%24.9%
2015
542,460427,789135,31019,621120,861151,996
24,28990,38313,5784,7514,60461,0546,326
7016.6%26,543
2020
544,209400,614130,59912,234124,069133,712
17,714125,88015,09210,76314,32268,82716,376
50023.1%72,106
2030
526,958306,616103,3761,843
106,22895,169
6,079214,26216,35225,10247,49875,35247,9432,01640.6%
167,666
2040
504,731185,21458,655
7773,45253,030
1,984317,53317,34738,96894,22176,96786,1103,92062.9%
256,332
2050
481,03984,98419,484
035,55729,942
0396,05518,03649,571134,09971,590115,3697,38982.3%
324,507
TotalFossilHard coalLigniteNatural gasCrude oil
NuclearRenewablesHydroWindSolarBiomassGeothermal/ambient heatOcean energyRES share‘Efficiency’ savings (compared to Ref.)
2009
498,243401,126120,81121,649107,498151,168
29,21567,90211,617
983626
52,0402,634
213.6%
0
2015
11,1977,1181,6991,81451056
1,79160814797462
12,9887,7261,8452,788628
29,659142%5,2953,3355,79412,4642,7717,2844.1
2,292
2020
10,1166,9171,0311,87524944
1,749550101
1,06533
11,8657,4681,1322,940326
27,337131%5,0072,8535,63011,2732,5757,6683.6
7,413
2030
7,0775,278129
1,5767223
1,66852523
1,11010
8,7465,803152
2,686105
20,00796%3,8271,9124,2748,0821,9118,3722.4
19,185
2040
3,8252,787
71,001
1613
1,2482770
9674
5,0733,064
71,968
34
10,48250%2,0191,0032,1244,491845
8,9781.2
32,486
2050
3931240
25848
736520
6813
1,1291750
93914
3,07615%742352
1,015721247
9,4690.3
42,191
2009
10,1176,0901,7571,52965982
1,77959124685192
11,8966,6812,0022,379833
27,925133%4,6743,3805516
11,5262,8296,8184.10
2015
7,8826,798725158200
9,0057,7981,0851220
136,90296,09436,4212,7071,680
0
153,788110,69038,2322,8652,001
0
28.0%
3,110
2020
9,7346,7161,524820674
11,6108,5462,59444426
135,43286,84636,2796,9044,824579
156,775102,10840,3977,7245,942604
34.6%
9,727
2030
12,0285,1582,4282,4761,966
17,1149,8585,1631,912180
128,26161,81834,98117,52712,0601,874
157,40276,83442,57320,00415,9382,054
50.7%
21,211
2040
14,1842,3683,0134,8513,952
22,2378,2198,0365,388595
120,32831,15432,55630,38522,6833,550
156,75041,74143,60535,23632,0234,145
72.8%
32,730
2050
16,611270
3,3366,9746,031
25,2995,3719,5129,1481,268
111,2898,26727,52038,11832,3095,075
153,20013,90840,36845,09247,4886,343
90.7%
46,470
2009
6,5986,33126503
6,3035,938355100
124,37390,03333,465
5453290
137,274102,30234,085
5463420
25.5%
0
table 12.14: global: final energy demandPJ/a
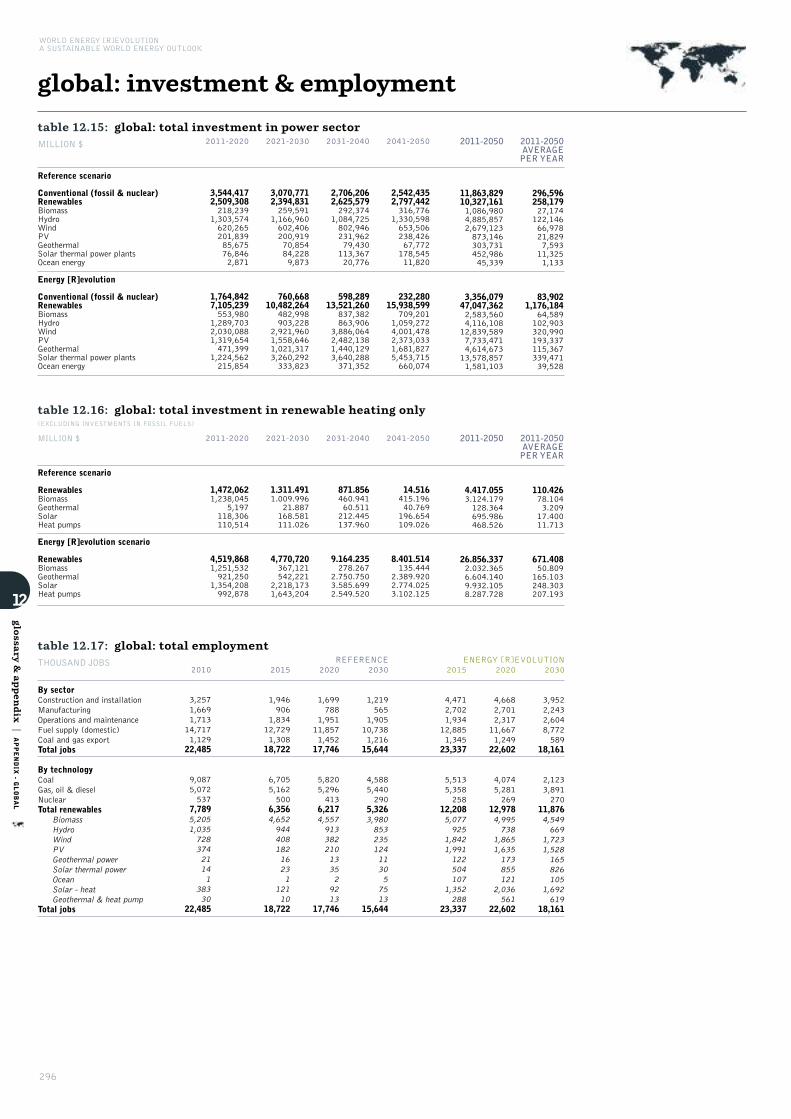
296
WORLD ENERGY [R]EVOLUTIONA SUSTAINABLE WORLD ENERGY OUTLOOK
global: investment & employment
12
glo
ssary &
appen
dix
|APPENDIX - G
LOBAL
table 12.15: global: total investment in power sectorMILLION $ 2041-2050
2,542,4352,797,442316,776
1,330,598653,506238,42667,772178,54511,820
232,28015,938,599
709,2011,059,2724,001,4782,373,0331,681,8275,453,715660,074
2011-2050
11,863,82910,327,1611,086,9804,885,8572,679,123873,146303,731452,98645,339
3,356,07947,047,3622,583,5604,116,10812,839,5897,733,4714,614,67313,578,8571,581,103
2011-2050AVERAGEPER YEAR
296,596258,17927,174122,14666,97821,8297,59311,3251,133
83,9021,176,184
64,589102,903320,990193,337115,367339,47139,528
2031-2040
2,706,2062,625,579292,374
1,084,725802,946231,96279,430113,36720,776
598,28913,521,260
837,382863,906
3,886,0642,482,1381,440,1293,640,288371,352
2021-2030
3,070,7712,394,831259,591
1,166,960602,406200,91970,85484,2289,873
760,66810,482,264
482,998903,228
2,921,9601,558,6461,021,3173,260,292333,823
2011-2020
3,544,4172,509,308218,239
1,303,574620,265201,83985,67576,8462,871
1,764,8427,105,239553,980
1,289,7032,030,0881,319,654471,399
1,224,562215,854
Reference scenario
Conventional (fossil & nuclear)RenewablesBiomassHydroWindPVGeothermalSolar thermal power plantsOcean energy
Energy [R]evolution
Conventional (fossil & nuclear)RenewablesBiomassHydroWindPVGeothermalSolar thermal power plantsOcean energy
table 12.16: global: total investment in renewable heating only (EXCLUDING INVESTMENTS IN FOSSIL FUELS)
2041-2050
14.516415.19640.769196.654109.026
8.401.514135.444
2.389.9202.774.0253.102.125
2011-2050
4.417.0553.124.179128.364695.986468.526
26.856.3372.032.3656.604.1409.932.1058.287.728
2011-2050AVERAGEPER YEAR
110.42678.1043.20917.40011.713
671.40850.809165.103248.303207.193
2031-2040
871.856460.94160.511212.445137.960
9.164.235278.267
2.750.7503.585.6992.549.520
2021-2030
1.311.4911.009.996
21.887168.581111.026
4,770,720367,121542,221
2,218,1731,643,204
2011-2020
1,472,0621,238,045
5,197118,306110,514
4,519,8681,251,532921,250
1,354,208992,878
MILLION $
Reference scenario
RenewablesBiomassGeothermalSolarHeat pumps
Energy [R]evolution scenario
RenewablesBiomassGeothermalSolarHeat pumps
table 12.17: global: total employmentTHOUSAND JOBS
2010
3,2571,6691,71314,7171,12922,485
9,0875,072537
7,7895,2051,03572837421141
38330
22,485
2015
1,946906
1,83412,7291,30818,722
6,7055,162500
6,3564,65294440818216231
12110
18,722
2020
1,699788
1,95111,8571,45217,746
5,8205,296413
6,2174,55791338221013352
9213
17,746
REFERENCE ENERGY [R]EVOLUTION2030
1,219565
1,90510,7381,21615,644
4,5885,440290
5,3263,98085323512411305
7513
15,644
2015
4,4712,7021,93412,8851,34523,337
5,5135,358258
12,2085,077925
1,8421,991122504107
1,352288
23,337
2020
4,6682,7012,31711,6671,24922,602
4,0745,281269
12,9784,995738
1,8651,635173855121
2,036561
22,602
2030
3,9522,2432,6048,772589
18,161
2,1233,891270
11,8764,549669
1,7231,528165826105
1,692619
18,161
By sectorConstruction and installationManufacturingOperations and maintenanceFuel supply (domestic)Coal and gas exportTotal jobs
By technologyCoalGas, oil & dieselNuclearTotal renewables
BiomassHydroWindPVGeothermal powerSolar thermal powerOceanSolar - heatGeothermal & heat pump
Total jobs

297
oecd north america: scenario results data
12
glo
ssary &
appen
dix
|APPENDIX - O
ECD NORTH AMERICA
image BLOOMING PHYTOPLANKTON AND COASTAL FORESTS IN THE PACIFIC NORTHWEST, AUGUST 9, 2001. SHOWING PORTIONS OF WASHINGTON STATE, OREGON, AND THECANADIAN PROVINCE OF BRITISH COLUMBIA. VANCOUVER ISLAND IS LOCATED IN THE UPPER CENTER OF THE IMAGE. THE CASCADE RANGE BLOCKS MOISTURE COMING INFROM THE PACIFIC OCEAN, CREATING THE ARID CONDITIONS OF THE COLUMBIA PLATEAU TO THE EAST.
© NASA

298
WORLD ENERGY [R]EVOLUTIONA SUSTAINABLE WORLD ENERGY OUTLOOK
oecd north america: reference scenario
12
glo
ssary &
appen
dix
|APPENDIX - O
ECD NORTH AMERICA
Condensation power plantsCoalLigniteGasOilDiesel
Combined heat & power productionCoalLigniteGasOil
CO2 emissions power generation (incl. CHP public)CoalLigniteGasOil & diesel
CO2 emissions by sector% of 1990 emissionsIndustry1)Other sectors1)TransportPower generation2)District heating & other conversion
Population (Mill.)CO2 emissions per capita (t/capita)
1) including CHP autoproducers. 2) including CHP public
District heatingFossil fuelsBiomassSolar collectorsGeothermal
Heat from CHP Fossil fuelsBiomassGeothermalHydrogen
Direct heating1)Fossil fuelsBiomassSolar collectorsGeothermal2)
Total heat supply1)Fossil fuelsBiomassSolar collectorsGeothermal2)Hydrogen
RES share (including RES electricity)
1) heat from electricity (direct) not included; 2) including heat pumps.
2015
79,22872,08130,26928,004
7641,438
63120
4.8%
16,3804,59787727136
1,2371,7046,559
12,007
50
17.9%
25,43112,4732,380
58568
3,0278,77610092010
13.4%
7,79110.8%
7,1476,34279016
2020
80,29573,04429,94727,352
8041,722
69140
5.8%
16,6434,78596926945
1,2451,6876,591
12,061
50
18.5%
26,45413,3792,709
51771
2,8698,92815398715
14.6%
8,68711.9%
7,2516,43080516
2030
81,88474,60929,34025,944
9232,388
85190
8.2%
16,6184,9221,11324650
1,1631,5886,478
12,215
50
20.4%
28,65115,2433,447
33566
2,5379,208329
1,16965
17.5%
10,80714.5%
7,2756,44681217
2040
84,18977,29930,10225,6821,2743,028118290
10.2%
16,4524,9741,23523651
1,1161,4366,368
22,314
60
21.9%
30,74416,7294,155
24359
2,3549,393618
1,350217
20.6%
13,01016.8%
6,8906,09278017
2050
86,71779,90530,76025,3701,8333,395162440
11.2%
16,6725,0531,37423053
1,1021,3876,506
132,367
150
22.9%
32,47317,9084,868
22249
2,3049,621783
1,495292
22.9%
14,69918.4%
6,8116,01777718
Total (incl. non-energy use)Total (energy use)TransportOil productsNatural gasBiofuelsElectricity
RES electricityHydrogenRES share Transport
IndustryElectricity
RES electricityDistrict heat
RES district heatCoalOil productsGasSolarBiomass and wasteGeothermal/ambient heatHydrogenRES share Industry
Other SectorsElectricity
RES electricityDistrict heat
RES district heatCoalOil productsGasSolarBiomass and wasteGeothermal/ambient heatRES share Other Sectors
Total RESRES share
Non energy useOilGasCoal
2009
73,97267,35228,61526,883
7269614580
3.4%
14,1023,84065225110972
1,5905,868
01,577
40
15.9%
24,63411,6721,980
62168
3,1188,762
648855
11.9%
6,1479.1%
6,6216,0265859
table 12.18: oecd north america: electricity generationTWh/a
table 12.21: oecd north america: installed capacity GW
table 12.22: oecd north america: primary energy demand PJ/a
table 12.20: oecd north america: co2 emissionsMILL t/a
table 12.19: oecd north america: heat supplyPJ/a
2015
5,1541,0771,0141,019
4110998517011870193070
359585
222185510
205155
5,5143,4641,1351,0191,241
59109980
1,0527011870191063170
3913540
4,759
2073.8%19.1%
2020
5,4791,258946
1,082289
1,0377471424823238120
372633
223176420
212160
5,8513,6291,321949
1,306459
1,0370
1,18571424823213841120
4093680
5,065
2804.8%20.2%
2030
6,0211,617724
1,216136
1,074139734358206051273
435802
249168540
264171
6,4563,9221,697726
1,465296
1,0740
1,460734358206022455273
4333880
5,625
4206.5%22.6%
2040
6,4611,932476
1,32375
1,099208747474548059465
484950
2691410150
299186
6,9454,1212,027476
1,592215
1,0990
1,725747474548030964465
4634110
6,061
5598.0%24.8%
2050
6,8332,087296
1,44404
1,1252567675999287728710
5271060
2861111770
329198
7,3604,2352,193296
1,730124
1,1250
2,0017675999287372798710
4954330
6,423
6959.4%27.2%
Power plantsCoalLigniteGasOilDieselNuclearBiomassHydroWind
of which wind offshorePVGeothermalSolar thermal power plantsOcean energy
Combined heat & power plantsCoalLigniteGasOilBiomassGeothermalHydrogenCHP by producerMain activity producersAutoproducers
Total generationFossilCoalLigniteGasOilDiesel
NuclearHydrogenRenewablesHydroWindof which wind offshore
PVBiomassGeothermalSolar thermalOcean energy
Distribution lossesOwn consumption electricityElectricity for hydrogen productionFinal energy consumption (electricity)
Fluctuating RES (PV, Wind, Ocean)Share of fluctuating RESRES share (domestic generation)
2009
4,719914
1,052917809
9314466679022410
314427
212163800
174140
5,0323,247956
1,0581,129
959
9310
8546667902822410
3513590
4,321
811.6%17.0%
2015
1,24218417139839131281019385014520
1041117012900
7627
1,34589919517246951131280
3181938501418520
997.4%23.6%
2020
1,306222165407181013313197109122630
10213169101000
7428
1,40891423516547628101330
36119710912223630
1329.3%25.7%
2030
1,40927111943875
13823204150739871
11715078101310
8632
1,526943286120516175
1380
44520415073936971
18912.4%29.1%
2040
1,5053037447344
1413320819218519121
12917086101610
9435
1,63497032074558144
1410
52320819218514910121
24515.0%32.0%
2050
1,6133274650603
14441214241315511222
14019090111810
10237
1,7531,00334646597113
1440
60621424131555912222
29917.0%34.6%
Power plantsCoalLigniteGasOilDieselNuclearBiomassHydroWind
of which wind offshorePVGeothermalSolar thermal power plantsOcean energy
Combined heat & power productionCoalLigniteGasOilBiomassGeothermalHydrogenCHP by producerMain activity producersAutoproducers
Total generationFossilCoalLigniteGasOilDiesel
NuclearHydrogenRenewablesHydroWindof which wind offshore
PVBiomassGeothermalSolar thermalOcean energy
Fluctuating RES (PV, Wind, Ocean)Share of fluctuating RESRES share (domestic generation)
2009
1,14716118337458101218
1873902400
97816911700
7225
1,24487516918444369101210
247187390215400
413.3%19.9%
2015
116,01494,71412,7829,80628,89543,230
10,86510,4352,523675235
6,2987040
9.0%
2020
117,67594,67514,2288,87429,52842,045
11,29411,7062,571892377
6,9938730
9.9%
2030
119,85293,58216,9276,46330,72839,464
11,69414,5762,6421,288776
8,6871,174
1012.1%
2040
122,51792,97618,8484,11731,98238,030
11,96417,5762,6901,7071,30110,3931,467
1814.3%
2050
125,32192,85719,4052,55833,81437,080
12,24920,2162,7632,1571,86211,6701,730
3416.1%
TotalFossilHard coalLigniteNatural gasCrude oil
NuclearRenewablesHydroWindSolarBiomassGeothermal/ambient heatOcean energyRES share
2009
108,44990,04710,99810,33727,79040,923
10,1608,2422,39928678
4,8945850
7.6%
2015
2,332968907418317
1615249114
2,4931,02191150952
6,356125%63873220682,431488
483.713.1
2020
2,3801,093820439217
1605539112
2,5411,14882353040
6,373126%63972920382,478487
504.412.6
2030
2,4291,33259748794
178661
10011
2,6071,39859858625
6,323125%61472019702,546474
541.211.7
2040
2,4161,49538153254
194760
10810
2,6101,57138164018
6,297124%58571319752,547476
571.111.0
2050
2,3631,54223758003
207850
1158
2,5701,62723769511
6,256123%58671619532,508494
594.910.5
2009
2,247834954389637
171445
10912
2,41887895949982
6,119121%56773119802,353487
457.613.4
2015
156149600
4133446450
21,89819,1802,59810119
22,46719,6732,668101240
12.4%
2020
143135800
3953137570
22,12919,2462,70615424
22,66719,6942,788154310
13.1%
2030
137126911
3012217360
22,52419,1313,01133053
22,96119,4783,093330600
15.2%
2040
123116601
2421696850
23,02719,0133,257620137
23,39219,2983,3316201430
17.5%
2050
106103200
2051356550
23,84319,4163,443795188
24,15319,6543,5117961930
18.6%
2009
8579600
4634234000
19,46017,3762,006
6414
20,00817,8782,052
64140
10.6%
table 12.23: oecd north america: final energy demandPJ/a

Condensation power plantsCoalLigniteGasOilDiesel
Combined heat & power productionCoalLigniteGasOil
CO2 emissions power generation (incl. CHP public)CoalLigniteGasOil & diesel
CO2 emissions by sector% of 1990 emissionsIndustry1)Other sectors1)TransportPower generation2)District heating & other conversion
Population (Mill.)CO2 emissions per capita (t/capita)‘Efficiency’ savings (compared to Ref.)
1) including CHP autoproducers. 2) including CHP public
District heatingFossil fuelsBiomassSolar collectorsGeothermal
Heat from CHP Fossil fuelsBiomassGeothermalHydrogen
Direct heating1)Fossil fuelsBiomassSolar collectorsGeothermal2)Hydrogen
Total heat supply1)Fossil fuelsBiomassSolar collectorsGeothermal1)Hydrogen
RES share (including RES electricity)‘Efficiency’ savings (compared to Ref.)
1) heat from electricity (direct) not included; geothermal includes heat pumps
299
oecd north america: energy [r]evolution scenario
12
glo
ssary &
appen
dix
|APPENDIX - O
ECD NORTH AMERICA
2015
76,76069,88928,71326,842
7281,108
3590
3.9%
15,7454,4361,087547171
1,4771,5095,866181
1,693350
20.1%
25,43112,4733,05752616259
2,8528,277162940143
17.6%
8,74812.5%
6,8715,890766214
2020
73,00966,35426,23724,063
6901,2771616746
5.2%
15,3674,4541,8571,152544
1,4221,0394,977375
1,438248261
29.7%
24,75012,0365,01998748158
2,5367,029633978493
30.7%
13,53920.4%
6,6565,243747666
2030
62,79956,73718,30014,534
5971,724960720486
15.3%
14,1234,2563,1942,1101,496508503
3,448850
1,162534751
55.2%
24,31411,7898,8482,5401,847
01,3653,9612,359810
1,49063.1%
25,96345.8%
6,0623,706624
1,732
2040
53,62547,88511,3614,865554
1,8552,4802,2561,60649.1%
12,8223,9863,6262,5162,140
0211
1,6841,124901
1,0481,35278.5%
23,70211,12410,1203,6303,105
0597
1,3233,938644
2,44585.4%
35,89475.0%
5,7402,436511
2,792
2050
49,87444,2109,554934517
1,9893,1813,1012,93283.2%
11,8623,7443,6492,3922,290
055224
1,445611
1,7281,66495.6%
22,79510,2379,9803,9113,777
098206
4,642229
3,47196.9%
41,39393.6%
5,6642,003423
3,238
Total (incl. non-energy use)Total (energy use)TransportOil productsNatural gasBiofuelsElectricity
RES electricityHydrogenRES share Transport
IndustryElectricity
RES electricityDistrict heat
RES district heatCoalOil productsGasSolarBiomass and wasteGeothermal/ambient heatHydrogenRES share Industry
Other SectorsElectricity
RES electricityDistrict heat
RES district heatCoalOil productsGasSolarBiomass and wasteGeothermal/ambient heatRES share Other Sectors
Total RESRES share
Non energy useOilGasCoal
2009
73,97267,35228,61526,883
7269614580
3.4%
14,1023,84065225110972
1,5905,868
01,577
40
15.9%
24,63411,6721,980
62168
3,1188,762
648855
11.9%
6,1479.1%
6,6216,0265859
table 12.24: oecd north america: electricity generationTWh/a
table 12.27: oecd north america: installed capacity GW
table 12.28: oecd north america: primary energy demand PJ/a
table 12.26: oecd north america: co2 emissionsMILL t/a
table 12.25: oecd north america: heat supplyPJ/a
2015
5,056953
1,060909617
79233725355052574311
399460
274165920
224175
5,4553,326999
1,0601,183
767
7920
1,33772535505292594311
3863520
4,707
4187.7%24.5%
45
2020
5,065878673847274
410257848781618812715669
509420
3481388116
276233
5,5732,833921673
1,195404
4106
2,3247848781618811213815669
412374232
4,546
1,13520.4%41.7%465
2030
5,58835727692425310816
1,826107583308696216
576340
3406
1333925
287289
6,1641,46039027
1,0311025325
4,626816
1,826107583143347696216
442399910
4,404
2,62542.6%75.1%1,144
2040
6,513250
2943103
8182,382283857419
1,334376
58100
2654
1729248
286295
7,093592250
56061048
6,453818
2,382283857176511
1,334376
457415
1,9234,288
3,61451.0%91.0%1,831
2050
7,0240042001
8192,500305989392
1,857460
53500
1261
19415857
271264
7,55913300
13040057
7,369819
2,500305989195550
1,857460
446405
2,6164,082
3,94852.2%97.5%2,495
Power plantsCoalLigniteGasOilDieselNuclearBiomassHydroWind
of which wind offshorePVGeothermalSolar thermal power plantsOcean energy
Combined heat & power plantsCoalLigniteGasOilBiomassGeothermalHydrogenCHP by producerMain activity producersAutoproducers
Total generationFossilCoalLigniteGasOilDiesel
NuclearHydrogenRenewablesHydroWindof which wind offshore
PVBiomassGeothermalSolar thermalOcean energy
Distribution lossesOwn consumption electricityElectricity for hydrogen productionFinal energy consumption (electricity)
Fluctuating RES (PV, Wind, Ocean)Share of fluctuating RESRES share (domestic generation)‘Efficiency’ savings (compared to Ref.)
2009
4,719914
1,052917809
9314466679022410
314427
212163800
174140
5,0323,247956
1,0581,129
959
9310
8546667902822410
3513590
4,321
811.6%17.0%
0
2015
1,30216217936946101016
20116204010133
1169086111010
8630
1,41987217117945557101010
4452011620401610133
20514.5%31.4%
2020
1,523155117349186524
2173866
132214620
14180
10771521
9843
1,664768164117456256521
8432173866
13220234620
53832.3%50.7%
2030
2,086594
3232272
224759353845221851
15370
10812485
9261
2,240507664
4303275
1,72122475935384265921851
1,19453.3%76.8%
2040
2,53740
1621101
224961905527546789
15200901331810
8666
2,68925940
25121010
2,42022496190552349346789
1,60159.6%90.0%
2050
2,7130011000
2241,011
9863977651108
12000390403011
6060
2,83341004010011
2,780224
1,0119863940107651108
1,75862.1%98.1%
Power plantsCoalLigniteGasOilDieselNuclearBiomassHydroWind
of which wind offshorePVGeothermalSolar thermal power plantsOcean energy
Combined heat & power productionCoalLigniteGasOilBiomassGeothermalHydrogenCHP by producerMain activity producersAutoproducers
Total generationFossilCoalLigniteGasOilDiesel
NuclearHydrogenRenewablesHydroWindof which wind offshore
PVBiomassGeothermalSolar thermalOcean energy
Fluctuating RES (PV, Wind, Ocean)Share of fluctuating RESRES share (domestic generation)
2009
1,14716118337458101218
1873902400
97816911700
7225
1,24487516918444369101210
247187390215400
413.3%19.9%
2015
110,74690,30411,91310,10227,04541,245
8,62311,8192,6101,278916
5,4791,497
3910.7%5,298
2020
101,83778,30411,4516,23724,54836,068
4,46419,0692,8223,1603,2275,6983,914248
18.7%15,833
2030
85,42345,9886,511237
17,59321,647
57738,8582,9386,57312,1116,07510,384
77845.5%34,438
2040
76,81421,0903,596
08,8898,604
055,7242,9458,57620,7136,11716,0201,35472.5%45,731
2050
73,0299,1583,405
02,5593,193
063,8712,9479,00126,5435,77517,9491,65687.5%52,342
TotalFossilHard coalLigniteNatural gasCrude oil
NuclearRenewablesHydroWindSolarBiomassGeothermal/ambient heatOcean energyRES share‘Efficiency’ savings (compared to Ref.)
2009
108,44990,04710,99810,33727,79040,923
10,1608,2422,39928678
4,8945850
7.6%0
2015
2,227855948373466
166420
11312
2,39389794848663
6,180122%595696
1,9822,329578
48412.8176
2020
1,713762583344213
188370
1419
1,90079958348533
5,174102%504615
1,7921,824439
50410.31,198
2030
5962932227731
168280
1364
764321224138
2,72454%302362
1,106689266
5415.0
3,599
2040
140200
11821
10900
1073
249200
2255
97719%131149382200116
5711.7
5,320
2050
300220
5200511
5500523
2044%2737872628
5950.3
6,052
2009
2,247834954389637
171445
10912
2,41887895949982
6,119121%56773119802,353487
457.613.4
0
2015
3561011405363
1,024849154210
20,81317,8942,3263422510
22,19418,8432,6203953350
15.1%
273
2020
993242242264245
1,5551,1093378722
19,45915,1802,1261,008895249
22,00716,5312,7051,2721,227271
24.2%
660
2030
2,754397401
1,094863
2,3981,201693354150
16,9048,7041,7423,2092,526723
22,05610,3022,8374,3033,742873
52.3%
905
2040
3,917316496
1,6991,407
2,855822903843288
15,3173,3061,3655,0524,2781,317
22,0904,4432,7646,7516,5271,605
79.2%
1,302
2050
3,77017522
1,7871,444
3,179390
1,0131,438339
14,921317754
6,0876,1261,637
21,870724
2,2887,8749,0071,976
96.5%
2,283
2009
8579600
4634234000
19,46017,3762,006
64140
20,00817,8782,052
64140
10.6%
0
table 12.29: oecd north america: final energy demandPJ/a

300
WORLD ENERGY [R]EVOLUTIONA SUSTAINABLE WORLD ENERGY OUTLOOK
oecd north america: investment & employment
12
glo
ssary &
appen
dix
|APPENDIX - O
ECD NORTH AMERICA
table 12.30: oecd north america: total investment in power sectorMILLION $ 2041-2050
367,632426,30765,309123,197146,05019,6444,53865,0432,527
15,1162,613,842
39,706106,172674,808311,96449,535
1,341,30590,353
2011-2050
2,329,2491,598,772231,541529,565560,559111,77020,220138,5396,577
682,3919,117,666179,155564,939
2,770,2311,163,305196,833
3,903,948339,257
2011-2050AVERAGEPER YEAR
58,23139,9695,78913,23914,0142,794506
3,463164
17,060227,9424,47914,12369,25629,0834,92197,5998,481
2031-2040
517,372431,11158,849134,397166,97730,2732,55435,9012,159
136,6252,784,348
48,043117,774850,543296,89950,520
1,336,10784,463
2021-2030
658,974366,52355,022134,497124,03825,6465,55019,9401,830
162,2802,219,690
39,674136,642646,938321,04755,224934,88485,281
2011-2020
785,271374,83152,362137,475123,49436,2077,57917,655
61
368,3711,499,785
51,732204,351597,942233,39541,554291,65279,160
Reference scenario
Conventional (fossil & nuclear)RenewablesBiomassHydroWindPVGeothermalSolar thermal power plantsOcean energy
Energy [R]evolution
Conventional (fossil & nuclear)RenewablesBiomassHydroWindPVGeothermalSolar thermal power plantsOcean energy
table 12.31: oecd north america: total investment in renewable heating only (EXCLUDING INVESTMENTS IN FOSSIL FUELS)
2041-2050
183,25257,06339,36883,0833,738
1,939,3636,971
296,956782,241853,195
2011-2050
866,214441,584120,114286,85317,663
6,298,936140,064
1,146,0792,693,4562,319,337
2011-2050AVERAGEPER YEAR
21,65511,0403,0037,171442
157,4733,50228,65267,33657,983
2031-2040
236,69970,88358,563101,2266,026
2,091,63421,965553,689821,653694,328
2021-2030
234,915147,67019,47864,2223,545
1,340,32611,60676,614752,325499,781
2011-2020
211,347165,9682,70538,3224,353
927,61299,522218,819337,238272,033
MILLION $
Reference scenario
RenewablesBiomassGeothermalSolarHeat pumps
Energy [R]evolution scenario
RenewablesBiomassGeothermalSolarHeat pumps
table 12.32: oecd north america: total employmentTHOUSAND JOBS
2010
130642269534.4
1,377
181761603752056254302.82.2
0.005190.3
1,377
2015
124652439867.4
1,425
228755563862376446233.52.3
0.002100.6
1,425
2020
101602599789.5
1,408
193736544242626652232.53.00.35150.7
1,408
REFERENCE ENERGY [R]EVOLUTION2030
734027798210
1,383
171733534262827238131.53.2
0.49133.4
1,383
2015
4643322549344.1
1,987
13174054
1,06220984
3052382447269535
1,987
2020
5454072928510.5
2,095
10266574
1,25520777
324240307419
19094
2,095
2030
503299355626
-1,782
3447779
1,19320675
25014521
13716
212130
1,782
By sectorConstruction and installationManufacturingOperations and maintenanceFuel supply (domestic)Coal and gas exportTotal jobs
By technologyCoalGas, oil & dieselNuclearTotal renewables
BiomassHydroWindPVGeothermal powerSolar thermal powerOceanSolar - heatGeothermal & heat pump
Total jobs
301
latin america: scenario results data
12
glo
ssary &
appen
dix
|APPENDIX - L
ATIN AMERICA
image SURROUNDED BY DARKER, DEEPER OCEAN WATERS, CORAL ATOLLS OFTEN GLOW IN VIBRANT HUES OF TURQUOISE, TEAL, PEACOCK BLUE, OR AQUAMARINE. BELIZE’SLIGHTHOUSE REEF ATOLL FITS THIS DESCRIPTION, WITH ITS SHALLOW WATERS COVERING LIGHT-COLORED CORAL: THE COMBINATION OF WATER AND PALE CORALS CREATESVARYING SHADES OF BLUE-GREEN. WITHIN THIS SMALL SEA OF LIGHT COLORS, HOWEVER, LIES A GIANT CIRCLE OF DEEP BLUE. ROUGHLY 300 METERS (1,000 FEET) ACROSSAND 125 METERS (400 FEET) DEEP, THE FEATURE IS KNOWN AS THE GREAT BLUE HOLE.
© NASA/JESSE ALLEN
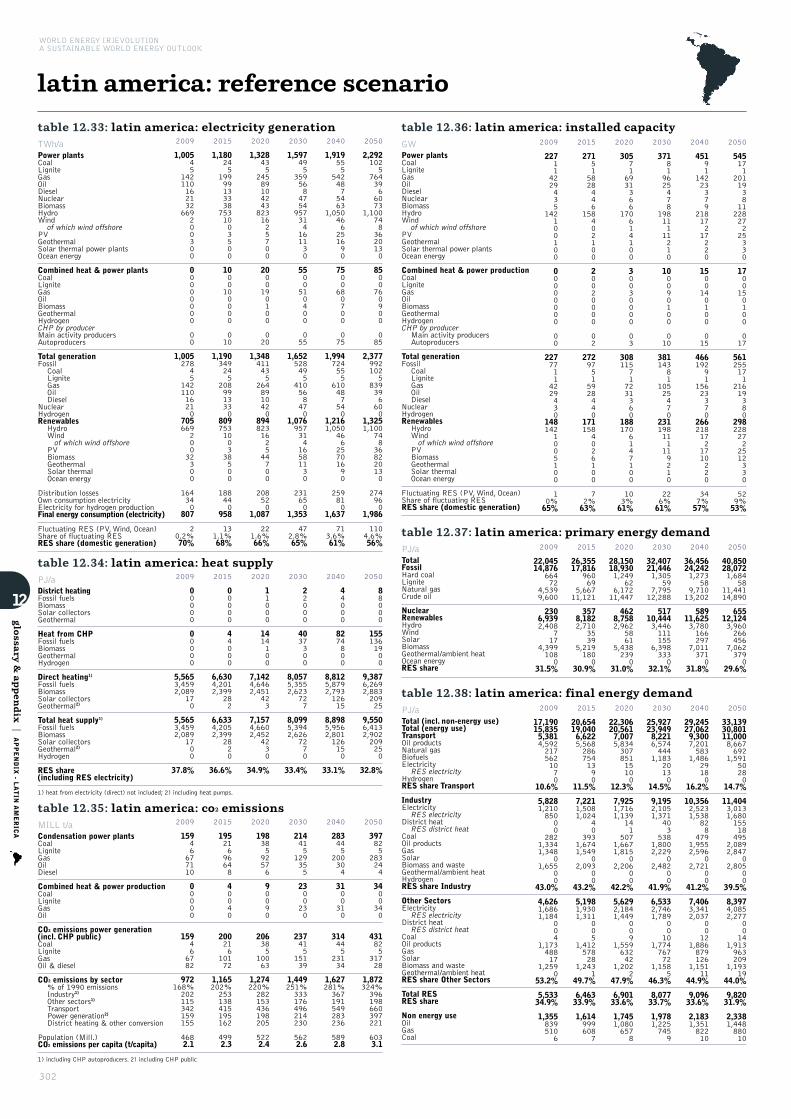
302
WORLD ENERGY [R]EVOLUTIONA SUSTAINABLE WORLD ENERGY OUTLOOK
latin america: reference scenario
12
glo
ssary &
appen
dix
|APPENDIX - L
ATIN AMERICA
Condensation power plantsCoalLigniteGasOilDiesel
Combined heat & power productionCoalLigniteGasOil
CO2 emissions power generation (incl. CHP public)CoalLigniteGasOil & diesel
CO2 emissions by sector% of 1990 emissionsIndustry1)Other sectors1)TransportPower generation2)District heating & other conversion
Population (Mill.)CO2 emissions per capita (t/capita)
1) including CHP autoproducers. 2) including CHP public
District heatingFossil fuelsBiomassSolar collectorsGeothermal
Heat from CHP Fossil fuelsBiomassGeothermalHydrogen
Direct heating1)Fossil fuelsBiomassSolar collectorsGeothermal2)
Total heat supply1)Fossil fuelsBiomassSolar collectorsGeothermal2)Hydrogen
RES share (including RES electricity)
1) heat from electricity (direct) not included; 2) including heat pumps.
2015
20,65419,0406,6225,5682867541390
11.5%
7,2211,5081,024
40
3931,6741,549
02,093
00
43.2%
5,1981,9301,311
005
1,41257828
1,2431
49.7%
6,46333.9%
1,6149996087
2020
22,30620,5617,0075,83430785115100
12.3%
7,9251,7161,139
141
5071,6671,815
02,206
00
42.2%
5,6292,1841,449
009
1,55963242
1,2022
47.9%
6,90133.6%
1,7451,0806578
2030
25,92723,9498,2216,574444
1,18320130
14.5%
9,1952,1051,371
403
5381,8002,229
02,482
00
41.9%
6,5332,7461,789
0010
1,77476772
1,1585
46.3%
8,07733.7%
1,9781,2257459
2040
29,24527,0629,3007,201583
1,48629180
16.2%
10,3562,5231,538
828
4791,9552,596
02,721
00
41.2%
7,4063,3412,037
0012
1,886879126
1,15111
44.9%
9,09633.6%
2,1831,35182210
2050
33,13930,80111,0008,667692
1,59150280
14.7%
11,4043,0131,68015518495
2,0892,847
02,805
00
39.5%
8,3974,0852,277
0014
1,913963209
1,19319
44.0%
9,82031.9%
2,3381,44888010
Total (incl. non-energy use)Total (energy use)TransportOil productsNatural gasBiofuelsElectricity
RES electricityHydrogenRES share Transport
IndustryElectricity
RES electricityDistrict heat
RES district heatCoalOil productsGasSolarBiomass and wasteGeothermal/ambient heatHydrogenRES share Industry
Other SectorsElectricity
RES electricityDistrict heat
RES district heatCoalOil productsGasSolarBiomass and wasteGeothermal/ambient heatRES share Other Sectors
Total RESRES share
Non energy useOilGasCoal
2009
17,19015,8355,3814,5922175621070
10.6%
5,8281,21085000
2821,3341,348
01,655
00
43.0%
4,6261,6861,184
004
1,17348817
1,2590
53.2%
5,53334.9%
1,3558395106
table 12.33: latin america: electricity generationTWh/a
table 12.36: latin america: installed capacity GW
table 12.37: latin america: primary energy demand PJ/a
table 12.35: latin america: co2 emissionsMILL t/a
table 12.34: latin america: heat supplyPJ/a
2015
1,180245
199991333387531003500
1000100000
010
1,190349245
2089913330
809753100338500
188440
958
131.1%68%
2020
1,328435
245891042438231625700
2000190100
020
1,348411435
2648910420
894823162544700
208520
1,087
221.6%66%
2030
1,597495
3595684754957314161130
5500510400
055
1,652528495
410568470
1,07695731416581130
231650
1,353
472.8%65%
2040
1,919555
5424875463
1,050466251690
7500680700
075
1,994724555
610487540
1,2161,050
46625701690
259810
1,637
713.6%61%
2050
2,2921025
7643966073
1,1007483620130
8500760900
085
2,3779921025
839396600
1,3251,100
748368220130
274960
1,986
1104.6%56%
Power plantsCoalLigniteGasOilDieselNuclearBiomassHydroWind
of which wind offshorePVGeothermalSolar thermal power plantsOcean energy
Combined heat & power plantsCoalLigniteGasOilBiomassGeothermalHydrogenCHP by producerMain activity producersAutoproducers
Total generationFossilCoalLigniteGasOilDiesel
NuclearHydrogenRenewablesHydroWindof which wind offshore
PVBiomassGeothermalSolar thermalOcean energy
Distribution lossesOwn consumption electricityElectricity for hydrogen productionFinal energy consumption (electricity)
Fluctuating RES (PV, Wind, Ocean)Share of fluctuating RESRES share (domestic generation)
2009
1,00545
142110162132669200300
00000000
00
1,00527845
14211016210
70566920032300
164340
807
20.2%70%
2015
271515828446
158402100
20020000
02
27297515928440
1711584026100
72%63%
2020
305716931366
170614100
30030000
03
308115717231360
1881706147100
103%61%
2030
371819625478
19811111210
100090100
010
38114381
10525470
231198111119210
226%61%
2040
45191
14223379
21817217220
1500140100
015
46619291
15623370
2662181721710220
347%57%
2050
545171
20119381122827225330
1700150100
017
561255171
21619380
2982282722512330
529%53%
Power plantsCoalLigniteGasOilDieselNuclearBiomassHydroWind
of which wind offshorePVGeothermalSolar thermal power plantsOcean energy
Combined heat & power productionCoalLigniteGasOilBiomassGeothermalHydrogenCHP by producerMain activity producersAutoproducers
Total generationFossilCoalLigniteGasOilDiesel
NuclearHydrogenRenewablesHydroWindof which wind offshore
PVBiomassGeothermalSolar thermalOcean energy
Fluctuating RES (PV, Wind, Ocean)Share of fluctuating RESRES share (domestic generation)
2009
227114229435
142100100
00000000
00
22777114229430
1481421005100
10%65%
2015
26,35517,816
96069
5,66711,121
3578,1822,710
3539
5,2191800
30.9%
2020
28,15018,9301,249
626,17211,447
4628,7582,962
5861
5,4382390
31.0%
2030
32,40721,4461,305
597,79512,288
51710,4443,446111155
6,3983330
32.1%
2040
36,45624,2421,273
589,71013,202
58911,6253,780166297
7,0113710
31.8%
2050
40,85028,0721,684
5811,44114,890
65512,1243,960266456
7,0623790
29.6%
TotalFossilHard coalLigniteNatural gasCrude oil
NuclearRenewablesHydroWindSolarBiomassGeothermal/ambient heatOcean energyRES share
2009
22,04514,876
66472
4,5399,600
2306,9392,408
717
4,3991080
31.5%
2015
19521696648
40040
200216
10172
1,165202%253138415195162
4992.3
2020
19838592576
90090
206385
10063
1,274220%282153436198205
5222.4
2030
214415
129355
2300230
237415
15139
1,449251%333176496214230
5622.6
2040
283445
200304
3100310
314445
23134
1,627281%367191549283236
5892.8
2050
397825
283244
3400340
431825
31728
1,872324%396198660397221
6033.1
2009
15946677110
00000
159466782
972168%202115342159155
4682.1
2015
00000
44000
6,6304,2012,399
282
6,6334,2052,399
2820
36.6%
2020
11000
1414100
7,1424,6462,451
423
7,1574,6602,452
4230
34.9%
2030
22000
4037300
8,0575,3552,623
727
8,0995,3942,626
7270
33.4%
2040
44000
8274800
8,8125,8792,79312615
8,8985,9562,801126150
33.1%
2050
88000
1551361900
9,3876,2692,88320925
9,5506,4132,902209250
32.8%
2009
00000
00000
5,5653,4592,089
170
5,5653,4592,089
1700
37.8%
table 12.38: latin america: final energy demandPJ/a
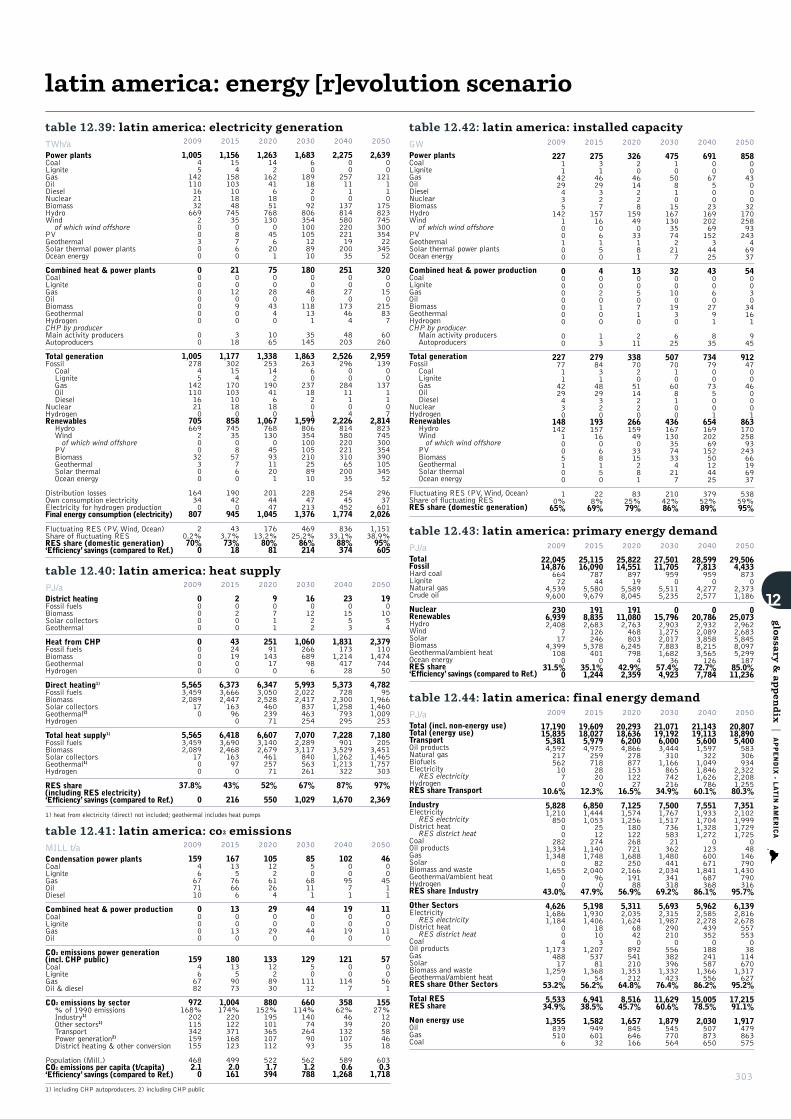
Condensation power plantsCoalLigniteGasOilDiesel
Combined heat & power productionCoalLigniteGasOil
CO2 emissions power generation (incl. CHP public)CoalLigniteGasOil & diesel
CO2 emissions by sector% of 1990 emissionsIndustry1)Other sectors1)TransportPower generation2)District heating & other conversion
Population (Mill.)CO2 emissions per capita (t/capita)‘Efficiency’ savings (compared to Ref.)
1) including CHP autoproducers. 2) including CHP public
District heatingFossil fuelsBiomassSolar collectorsGeothermal
Heat from CHP Fossil fuelsBiomassGeothermalHydrogen
Direct heating1)Fossil fuelsBiomassSolar collectorsGeothermal2)Hydrogen
Total heat supply1)Fossil fuelsBiomassSolar collectorsGeothermal1)Hydrogen
RES share (including RES electricity)‘Efficiency’ savings (compared to Ref.)
1) heat from electricity (direct) not included; geothermal includes heat pumps
303
latin america: energy [r]evolution scenario
12
glo
ssary &
appen
dix
|APPENDIX - L
ATIN AMERICA
2015
19,60918,0275,9794,97525971828200
12.3%
6,8501,4441,053
2512274
1,1401,748
822,040
960
47.9%
5,1981,9301,406
18103
1,20753781
1,36854
56.2%
6,94138.5%
1,58294960132
2020
20,29318,6366,2004,86627887715312227
16.5%
7,1251,5741,256180122268721
1,688250
2,16619188
56.9%
5,3112,0351,624
68420
892541210
1,353212
64.8%
8,51645.7%
1,657845646166
2030
21,07119,1926,0003,444310
1,166865742216
34.9%
7,5001,7671,51773658321362
1,480441
2,034341318
69.2%
5,6932,3151,9872902100
556382396
1,332423
76.4%
11,62960.6%
1,879545770564
2040
21,14319,1135,6001,597322
1,0491,8461,626786
60.1%
7,5511,9331,7041,3281,272
0123600671
1,841687368
86.1%
5,9622,5852,2784393520
188241587
1,366556
86.2%
15,00578.5%
2,030507873650
2050
20,80718,8905,400583306934
2,3222,2081,25580.3%
7,3512,1021,9991,7291,725
048146790
1,430790316
95.7%
6,1392,8162,678557553038114670
1,317627
95.2%
17,21591.1%
1,917479863575
Total (incl. non-energy use)Total (energy use)TransportOil productsNatural gasBiofuelsElectricity
RES electricityHydrogenRES share Transport
IndustryElectricity
RES electricityDistrict heat
RES district heatCoalOil productsGasSolarBiomass and wasteGeothermal/ambient heatHydrogenRES share Industry
Other SectorsElectricity
RES electricityDistrict heat
RES district heatCoalOil productsGasSolarBiomass and wasteGeothermal/ambient heatRES share Other Sectors
Total RESRES share
Non energy useOilGasCoal
2009
17,19015,8355,3814,5922175621070
10.6%
5,8281,21085000
2821,3341,348
01,655
00
43.0%
4,6261,6861,184
004
1,17348817
1,2590
53.2%
5,53334.9%
1,3558395106
table 12.39: latin america: electricity generationTWh/a
table 12.42: latin america: installed capacity GW
table 12.43: latin america: primary energy demand PJ/a
table 12.41: latin america: co2 emissionsMILL t/a
table 12.40: latin america: heat supplyPJ/a
2015
1,156154
1581031018487453508760
2100120900
318
1,177302154
17010310180
858745350857760
190420
945
433.7%73%18
2020
1,263142
16241618517681300456201
75002804340
1065
1,338253142
190416180
1,0677681300459311201
2014447
1,045
17613.2%80%81
2030
1,68360
189182092806354100105128910
18000480
118131
35145
1,86326360
23718201
1,599806354100105210258910
22847213
1,376
46925.2%86%214
2040
2,27500
2571110
1378145802202211920035
25100270
173464
48203
2,52629600
28411104
2,2268145802202213106520035
25445452
1,774
83633.1%88%374
2050
2,63900
121110
1758237453003542234552
32000150
215837
60260
2,95913900
1371107
2,81482374530035439010534552
29637601
2,026
1,15138.9%95%605
Power plantsCoalLigniteGasOilDieselNuclearBiomassHydroWind
of which wind offshorePVGeothermalSolar thermal power plantsOcean energy
Combined heat & power plantsCoalLigniteGasOilBiomassGeothermalHydrogenCHP by producerMain activity producersAutoproducers
Total generationFossilCoalLigniteGasOilDiesel
NuclearHydrogenRenewablesHydroWindof which wind offshore
PVBiomassGeothermalSolar thermalOcean energy
Distribution lossesOwn consumption electricityElectricity for hydrogen productionFinal energy consumption (electricity)
Fluctuating RES (PV, Wind, Ocean)Share of fluctuating RESRES share (domestic generation)‘Efficiency’ savings (compared to Ref.)
2009
1,00545
142110162132669200300
00000000
00
1,00527845
14211016210
70566920032300
164340
807
20.2%70%
0
2015
275314629327
1571606150
40020100
13
27984314829320
19315716068150
228%69%
2020
326204614228
15949033181
130050710
211
33870205114220
2661594903315281
8325%79%
2030
47510508101516713035742217
32001001930
625
5077010608100
4361671303574334217
21042%86%
2040
6910067500231692026915234425
4300602791
835
7347900735001
6541692026915250124425
37952%89%
2050
8580043000321702589324346937
54003034161
945
9124700460001
8631702589324366196937
53859%95%
Power plantsCoalLigniteGasOilDieselNuclearBiomassHydroWind
of which wind offshorePVGeothermalSolar thermal power plantsOcean energy
Combined heat & power productionCoalLigniteGasOilBiomassGeothermalHydrogenCHP by producerMain activity producersAutoproducers
Total generationFossilCoalLigniteGasOilDiesel
NuclearHydrogenRenewablesHydroWindof which wind offshore
PVBiomassGeothermalSolar thermalOcean energy
Fluctuating RES (PV, Wind, Ocean)Share of fluctuating RESRES share (domestic generation)
2009
227114229435
142100100
00000000
00
22777114229430
1481421005100
10%65%
2015
25,11516,090
78744
5,5809,679
1918,8352,683126246
5,3784010
35.1%1,244
2020
25,82214,551
89719
5,5898,045
19111,0802,763468803
6,2457984
42.9%2,359
2030
27,50111,705
9590
5,5115,235
015,7962,9031,2752,0177,8831,682
3657.4%4,923
2040
28,5997,8139590
4,2772,577
020,7862,9322,0893,8588,2153,565126
72.7%7,784
2050
29,5064,4338730
2,3731,186
025,0732,9622,6835,8458,0975,299187
85.0%11,236
TotalFossilHard coalLigniteNatural gasCrude oil
NuclearRenewablesHydroWindSolarBiomassGeothermal/ambient heatOcean energyRES share‘Efficiency’ savings (compared to Ref.)
2009
22,04514,876
66472
4,5399,600
2306,9392,408
717
4,3991080
31.5%0
2015
16713576666
1300130
1801359073
1,004174%220122371168123
4992.0161
2020
10512261264
2900290
1331228930
880152%195101365107112
5221.7394
2030
855068111
4400440
12950
11112
660114%140742649093
5621.2788
2040
102009571
1900190
12100
1147
35862%463913210735
5890.6
1,268
2050
46004511
1100110
5700561
15527%1220584618
6030.3
1,718
2009
15946677110
00000
159466782
972168%202115342159155
4682.10
2015
20200
43241900
6,3733,6662,447163960
6,4183,6902,468163970
43%
216
2020
90711
25191143170
6,3473,0502,52846023971
6,6073,1402,67946125771
52%
550
2030
1601222
1,060266689986
5,9932,0222,417837463254
7,0702,2893,117840563261
67%
1,029
2040
2301553
1,831173
1,21441728
5,373728
2,3001,258793295
7,228901
3,5291,2621,213322
87%
1,670
2050
1901054
2,379110
1,47474450
4,78295
1,9661,4601,009253
7,180205
3,4511,4651,757303
97%
2,369
2009
00000
00000
5,5653,4592,089
170
5,5653,4592,089
1700
37.8%
0
table 12.44: latin america: final energy demandPJ/a
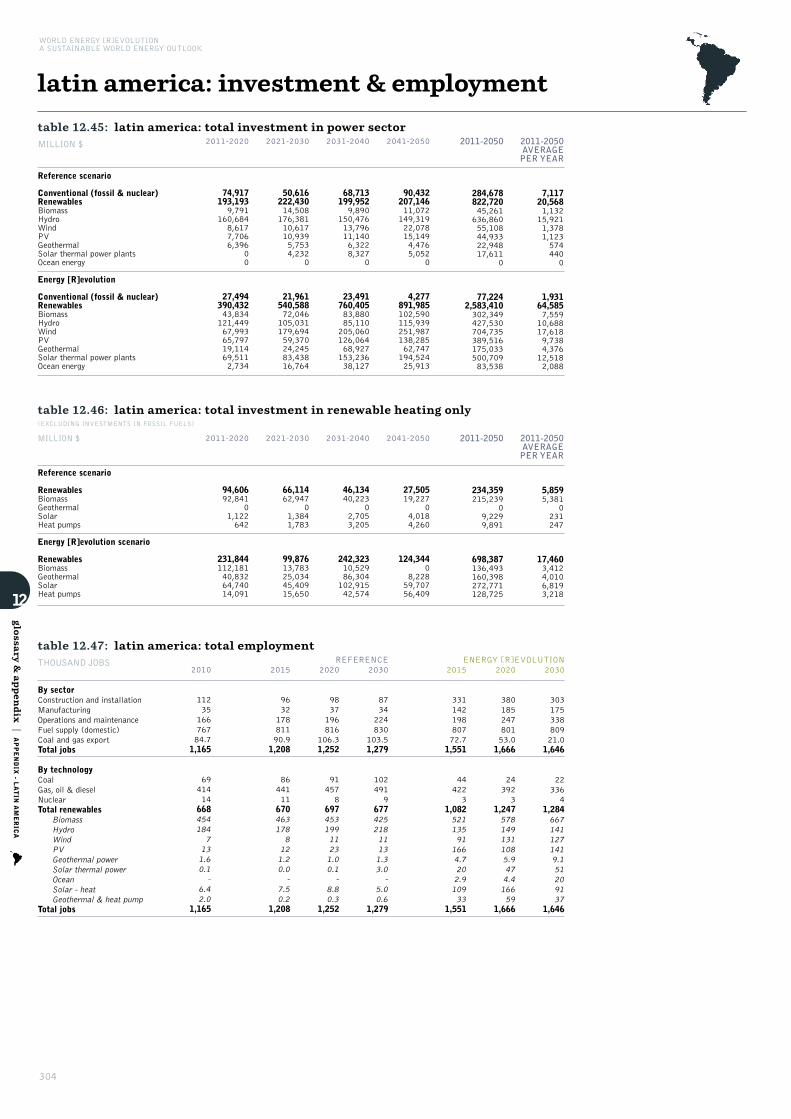
304
WORLD ENERGY [R]EVOLUTIONA SUSTAINABLE WORLD ENERGY OUTLOOK
latin america: investment & employment
12
glo
ssary &
appen
dix
|APPENDIX - L
ATIN AMERICA
table 12.45: latin america: total investment in power sectorMILLION $ 2041-2050
90,432207,14611,072149,31922,07815,1494,4765,052
0
4,277891,985102,590115,939251,987138,28562,747194,52425,913
2011-2050
284,678822,72045,261636,86055,10844,93322,94817,611
0
77,2242,583,410302,349427,530704,735389,516175,033500,70983,538
2011-2050AVERAGEPER YEAR
7,11720,5681,13215,9211,3781,1235744400
1,93164,5857,55910,68817,6189,7384,37612,5182,088
2031-2040
68,713199,9529,890
150,47613,79611,1406,3228,327
0
23,491760,40583,88085,110205,060126,06468,927153,23638,127
2021-2030
50,616222,43014,508176,38110,61710,9395,7534,232
0
21,961540,58872,046105,031179,69459,37024,24583,43816,764
2011-2020
74,917193,1939,791
160,6848,6177,7066,396
00
27,494390,43243,834121,44967,99365,79719,11469,5112,734
Reference scenario
Conventional (fossil & nuclear)RenewablesBiomassHydroWindPVGeothermalSolar thermal power plantsOcean energy
Energy [R]evolution
Conventional (fossil & nuclear)RenewablesBiomassHydroWindPVGeothermalSolar thermal power plantsOcean energy
table 12.46: latin america: total investment in renewable heating only (EXCLUDING INVESTMENTS IN FOSSIL FUELS)
2041-2050
27,50519,227
04,0184,260
124,3440
8,22859,70756,409
2011-2050
234,359215,239
09,2299,891
698,387136,493160,398272,771128,725
2011-2050AVERAGEPER YEAR
5,8595,381
0231247
17,4603,4124,0106,8193,218
2031-2040
46,13440,223
02,7053,205
242,32310,52986,304102,91542,574
2021-2030
66,11462,947
01,3841,783
99,87613,78325,03445,40915,650
2011-2020
94,60692,841
01,122642
231,844112,18140,83264,74014,091
MILLION $
Reference scenario
RenewablesBiomassGeothermalSolarHeat pumps
Energy [R]evolution scenario
RenewablesBiomassGeothermalSolarHeat pumps
table 12.47: latin america: total employmentTHOUSAND JOBS
2010
1123516676784.71,165
6941414668454184
7131.60.1
-6.42.0
1,165
2015
963217881190.91,208
8644111670463178
8121.20.0
-7.50.2
1,208
2020
9837196816
106.31,252
914578
69745319911231.00.1
-8.80.3
1,252
REFERENCE ENERGY [R]EVOLUTION2030
8734224830
103.51,279
1024919
67742521811131.33.0
-5.00.6
1,279
2015
33114219880772.71,551
444223
1,08252113591
1664.7202.910933
1,551
2020
38018524780153.01,666
243923
1,2475781491311085.9474.416659
1,666
2030
30317533880921.01,646
223364
1,2846671411271419.151209137
1,646
By sectorConstruction and installationManufacturingOperations and maintenanceFuel supply (domestic)Coal and gas exportTotal jobs
By technologyCoalGas, oil & dieselNuclearTotal renewables
BiomassHydroWindPVGeothermal powerSolar thermal powerOceanSolar - heatGeothermal & heat pump
Total jobs
305
oecd europe: scenario results data
12
glo
ssary &
appen
dix
|APPENDIX - O
ECD EUROPE
image CAPPED WITH SILVERY WHITE SNOW, THE ALPS ARC GRACEFULLY ACROSS NORTHERN ITALY, SWITZERLAND, AUSTRIA, AND SOUTHERN GERMANY AND FRANCE, 2006.
© JEFF SCHMALTZ, M
ODIS RAPID RESPONSE TEAM, NASA/GSFC

306
WORLD ENERGY [R]EVOLUTIONA SUSTAINABLE WORLD ENERGY OUTLOOK
oecd europe: reference scenario
12
glo
ssary &
appen
dix
|APPENDIX - O
ECD EUROPE
Condensation power plantsCoalLigniteGasOilDiesel
Combined heat & power productionCoalLigniteGasOil
CO2 emissions power generation (incl. CHP public)CoalLigniteGasOil & diesel
CO2 emissions by sector% of 1990 emissionsIndustry1)Other sectors1)TransportPower generation2)District heating & other conversion
Population (Mill.)CO2 emissions per capita (t/capita)
1) including CHP autoproducers. 2) including CHP public
District heatingFossil fuelsBiomassSolar collectorsGeothermal
Heat from CHP Fossil fuelsBiomassGeothermalHydrogen
Direct heating1)Fossil fuelsBiomassSolar collectorsGeothermal2)
Total heat supply1)Fossil fuelsBiomassSolar collectorsGeothermal2)Hydrogen
RES share (including RES electricity)
1) heat from electricity (direct) not included; 2) including heat pumps.
2015
55,54251,01314,70013,354
125916305830
6.8%
13,3084,6381,269705131
1,2751,5523,963
21,172
20
19.3%
23,0057,0471,9271,469265834
3,6827,966138
1,725143
18.3%
7,77415.2%
4,5293,98549846
2020
57,44852,86914,83313,355
1311,0053421060
7.5%
13,7304,8421,494721143
1,4701,4314,039
31,222
20
20.8%
24,3067,6092,3471,607298768
3,6458,444201
1,866167
20.1%
8,85216.7%
4,5794,02950446
2030
60,03155,49614,83513,108
1751,1404111420
8.6%
13,9975,1371,777731143
1,3521,2584,081
51,430
30
24.0%
26,6648,7593,0301,870330662
3,4529,142327
2,229224
23.0%
10,78019.4%
4,5353,99049946
2040
61,86057,41215,13813,195
2221,2304911890
9.4%
13,9545,3022,038760145
1,0521,0414,061
81,727
30
28.1%
28,3209,5213,6602,140362569
3,1829,596451
2,532330
25.9%
12,67422.1%
4,4483,91448945
2050
62,88558,60415,28713,241
2271,2425762400
9.7%
14,1365,4082,252811149928868
4,04111
2,06530
31.7%
29,1819,9064,1252,324360572
2,9009,833575
2,664407
27.9%
14,09324.0%
4,2813,76747143
Total (incl. non-energy use)Total (energy use)TransportOil productsNatural gasBiofuelsElectricity
RES electricityHydrogenRES share Transport
IndustryElectricity
RES electricityDistrict heat
RES district heatCoalOil productsGasSolarBiomass and wasteGeothermal/ambient heatHydrogenRES share Industry
Other SectorsElectricity
RES electricityDistrict heat
RES district heatCoalOil productsGasSolarBiomass and wasteGeothermal/ambient heatRES share Other Sectors
Total RESRES share
Non energy useOilGasCoal
2009
51,37446,88114,10713,260
89497260600
4.0%
11,4753,93691363962964
1,5943,411
092910
16.6%
21,3006,4841,5041,303125797
3,6797,300
641,557116
15.8%
5,82812.4%
4,4933,98446247
table 12.48: oecd europe: electricity generationTWh/a
table 12.51: oecd europe: installed capacity GW
table 12.52: oecd europe: primary energy demand PJ/a
table 12.50: oecd europe: co2 emissionsMILL t/a
table 12.49: oecd europe: heat supplyPJ/a
2015
3,153414305578317
847895432843401221
67114785335287420
470201
3,8231,931562390913597
8470
1,0465432843401631321
2142950
3,330
3258.5%27.4%
2020
3,360458270628206
8249957640922481482
69114982346199420
485206
4,0511,977607352974396
8240
1,25057640922481921682
2162980
3,554
45811.3%30.8%
2030
3,759569250762165
727121606568859320158
732145783761112120
515217
4,4912,211713328
1,138265
7270
1,554606568859324221158
2253110
3,974
67014.9%34.6%
2040
4,005495240881144
671151626706145140242031
773138764111113520
545228
4,7782,270633316
1,292254
6710
1,837626706145140287262031
2293160
4,254
87718.4%38.4%
2050
4,156382231982103
635183647804210185292737
798128764351014820
560238
4,9542,256509307
1,417203
6350
2,063647804210185332312737
2363260
4,414
1,02620.7%41.6%
Power plantsCoalLigniteGasOilDieselNuclearBiomassHydroWind
of which wind offshorePVGeothermalSolar thermal power plantsOcean energy
Combined heat & power plantsCoalLigniteGasOilBiomassGeothermalHydrogenCHP by producerMain activity producersAutoproducers
Total generationFossilCoalLigniteGasOilDiesel
NuclearHydrogenRenewablesHydroWindof which wind offshore
PVBiomassGeothermalSolar thermalOcean energy
Distribution lossesOwn consumption electricityElectricity for hydrogen productionFinal energy consumption (electricity)
Fluctuating RES (PV, Wind, Ocean)Share of fluctuating RESRES share (domestic generation)
2009
2,814275342529479
87466515135014900
64314984311366120
450193
3,4571,781424426840839
8740
8025151350141271100
2182850
2,967
1494.3%23.2%
2015
87211141153323
12814201147138210
175361289261200
11262
1,04650314753242573
1280
41520114713826210
18617.7%39.7%
2020
95211736178263
12115210195745220
177361198181400
11760
1,12952315347276443
1210
48621019574530320
24121.3%43.0%
2030
1,06511432212182
105192202562679342
172301010491900
11656
1,23753114442316262
1050
602220256267937342
33727.2%48.6%
2040
1,1589630243162942322729540115459
176281010892100
11956
1,33454112440351252940
6992272954011543459
41931.4%52.4%
2050
1,22678292711218926234313551525611
174271010782300
11955
1,40054110538377191890
77023431355152495611
47634.0%55.0%
Power plantsCoalLigniteGasOilDieselNuclearBiomassHydroWind
of which wind offshorePVGeothermalSolar thermal power plantsOcean energy
Combined heat & power productionCoalLigniteGasOilBiomassGeothermalHydrogenCHP by producerMain activity producersAutoproducers
Total generationFossilCoalLigniteGasOilDiesel
NuclearHydrogenRenewablesHydroWindof which wind offshore
PVBiomassGeothermalSolar thermalOcean energy
Fluctuating RES (PV, Wind, Ocean)Share of fluctuating RESRES share (domestic generation)
2009
7307948129384
1361119376014200
165411277251000
11154
89545211960206634
1360
3061937601421200
9010.1%34.2%
2015
79,25559,2739,0294,81320,02525,405
9,23810,7441,9551,023300
6,8336294
13.2%
2020
80,53959,4149,0344,28521,18524,910
8,99012,1362,0731,471449
7,4017375
14.6%
2030
82,16259,7459,3003,29123,35123,802
7,92714,4892,1822,046802
8,49793330
17.1%
2040
82,36458,6717,8523,09024,69423,034
7,32116,3722,2552,5421,1439,332986113
19.3%
2050
81,16956,8896,4662,95225,30822,163
6,92917,3512,3292,8941,4959,4931,006134
20.7%
TotalFossilHard coalLigniteNatural gasCrude oil
NuclearRenewablesHydroWindSolarBiomassGeothermal/ambient heatOcean energyRES share
2009
74,70756,8447,6665,46818,24925,462
9,5368,3271,854485115
5,3824902
10.8%
2015
1,080391406251275
3841457714320
1,46553648339451
3,881100%530806965
1,391188
5706.8
2020
1,069413360275184
3421206214812
1,41253342242234
3,874100%534824965
1,348203
5796.7
2030
1,078480244337133
339110651577
1,41759130949423
3,905101%505840950
1,360251
5936.6
2040
993385223370123
356114661697
1,34950028954021
3,77197%461836958
1,291225
5996.3
2050
88028420538182
361104691816
1,24138827456217
3,62193%435828961
1,184213
6006.0
2009
1,005274456228406
43815410514732
1,44242856137579
3,77897%485765957
1,357214
5556.8
2015
68951716903
1,8311,536280140
20,15717,1992,607140211
22,67619,2513,0571402290
15.1%
2020
77257919004
1,9261,587324150
21,00217,7782,778204243
23,70019,9443,2912042610
15.8%
2030
82762020304
2,1871,801369160
21,93417,9923,293332317
24,94720,4143,8653323360
18.2%
2040
85464121004
2,5082,077414170
22,46517,7203,832459454
25,82720,4374,4564594750
20.9%
2050
84063020604
2,7952,333444170
22,81117,4224,256586547
26,44620,3864,9075865680
22.9%
2009
55741813503
1,6941,396288100
17,10414,8781,989
64173
19,35516,6932,413
641860
13.8%
table 12.53: oecd europe: final energy demandPJ/a

Condensation power plantsCoalLigniteGasOilDiesel
Combined heat & power productionCoalLigniteGasOil
CO2 emissions power generation (incl. CHP public)CoalLigniteGasOil & diesel
CO2 emissions by sector% of 1990 emissionsIndustry1)Other sectors1)TransportPower generation2)District heating & other conversion
Population (Mill.)CO2 emissions per capita (t/capita)‘Efficiency’ savings (compared to Ref.)
1) including CHP autoproducers. 2) including CHP public
District heatingFossil fuelsBiomassSolar collectorsGeothermal
Heat from CHP Fossil fuelsBiomassGeothermalHydrogen
Direct heating1)Fossil fuelsBiomassSolar collectorsGeothermal2)Hydrogen
Total heat supply1)Fossil fuelsBiomassSolar collectorsGeothermal1)Hydrogen
RES share (including RES electricity)‘Efficiency’ savings (compared to Ref.)
1) heat from electricity (direct) not included; geothermal includes heat pumps
307
oecd europe: energy [r]evolution scenario
12
glo
ssary &
appen
dix
|APPENDIX - O
ECD EUROPE
2015
53,59449,07213,88812,820
1086303291110
5.3%
12,9814,4781,5101,412356854
1,3993,622
701,066
800
23.7%
22,2036,7472,2751,563468725
3,4327,319226
1,948243
23.2%
8,98418.3%
4,5223,898507117
2020
50,61746,22112,19610,993
11263342420634
7.0%
12,7664,5112,1881,750727522718
3,643241
1,0793030
35.5%
21,2596,8453,3202,1551,036388
1,8856,844536
1,956651
35.3%
12,89227.9%
4,3963,680515202
2030
45,37341,2449,2897,094129502
1,162826402
17.4%
12,0714,4503,1621,9211,091112288
3,080544
1,0965790
53.6%
19,8846,7744,8142,6701,641
01,1644,6861,6211,8011,16855.5%
19,13146.4%
4,1293,203533392
2040
40,17636,2146,7922,382146500
2,3162,0161,44855.6%
11,1304,2623,7112,2361,817
42104
1,641943820
1,04833
75.2%
18,2926,3315,5123,2232,755
0402
2,7092,2091,5501,86876.0%
26,03871.9%
3,9612,776551634
2050
36,22632,4825,815519152498
2,6552,5451,99185.2%
10,3934,0253,8592,4632,277
028321
1,327766
1,348115
93.2%
16,2755,6635,4303,3163,110
057825
2,5291,1712,71391.9%
29,59291.1%
3,7442,399596749
Total (incl. non-energy use)Total (energy use)TransportOil productsNatural gasBiofuelsElectricity
RES electricityHydrogenRES share Transport
IndustryElectricity
RES electricityDistrict heat
RES district heatCoalOil productsGasSolarBiomass and wasteGeothermal/ambient heatHydrogenRES share Industry
Other SectorsElectricity
RES electricityDistrict heat
RES district heatCoalOil productsGasSolarBiomass and wasteGeothermal/ambient heatRES share Other Sectors
Total RESRES share
Non energy useOilGasCoal
2009
51,37446,88114,10713,260
89497260600
4.0%
11,4753,93691363962964
1,5943,411
092910
16.6%
21,3006,4841,5041,303125797
3,6797,300
641,557116
15.8%
5,82812.4%
4,4933,98446247
table 12.54: oecd europe: electricity generationTWh/a
table 12.57: oecd europe: installed capacity GW
table 12.58: oecd europe: primary energy demand PJ/a
table 12.56: oecd europe: co2 emissionsMILL t/a
table 12.55: oecd europe: heat supplyPJ/a
2015
2,98026730653497
7557154337043971371
699148343492913540
485214
3,6791,683415340883387
7550
1,24154337043972061771
2162740
3,209
46812.7%33.7%128
2020
2,94622716353755
46071566609122210374610
765912138814240110
520245
3,7111,451318184925195
4600
1,800566609122210312484610
21225914
3,272
82922.3%48.5%304
2030
3,0409625477237855591
1,04548431914414363
810513
3790
337390
540270
3,8501,0361472885623780
2,736591
1,04548431939218314363
208217158
3,441
1,42737.1%71.1%742
2040
3,430440
24801041602
1,356682597166265110
79000
2510
4291082
515275
4,220544440
4990102
3,674602
1,356682597470274265110
203173567
3,589
2,06348.9%87.1%1,175
2050
3,515004900021605
1,485755632172411140
71000
1010
43514925
460250
4,22514900
14900025
4,051605
1,485755632456322411140
201134817
3,470
2,25753.4%95.9%1,563
Power plantsCoalLigniteGasOilDieselNuclearBiomassHydroWind
of which wind offshorePVGeothermalSolar thermal power plantsOcean energy
Combined heat & power plantsCoalLigniteGasOilBiomassGeothermalHydrogenCHP by producerMain activity producersAutoproducers
Total generationFossilCoalLigniteGasOilDiesel
NuclearHydrogenRenewablesHydroWindof which wind offshore
PVBiomassGeothermalSolar thermalOcean energy
Distribution lossesOwn consumption electricityElectricity for hydrogen productionFinal energy consumption (electricity)
Fluctuating RES (PV, Wind, Ocean)Share of fluctuating RESRES share (domestic generation)‘Efficiency’ savings (compared to Ref.)
2009
2,814275342529479
87466515135014900
64314984311366120
450193
3,4571,781424426840839
8740
8025151350141271100
2182850
2,967
1494.3%23.2%
0
2015
8726942138123
114112011831394220
18136592262110
11665
1,05342310646230383
1140
516201183139432320
27726.4%49.0%
2020
1,0196522145726811207276381976123
184223
108133720
11866
1,2043868725253202680
75020727638197488123
47639.5%62.3%
2030
1,169273
14421118
215414147270233218
174110
10405270
11362
1,343294384
24921110
1,03821541414727060303218
70252.2%77.3%
2040
1,411130750006
218496189489265531
1460061066190
9551
1,556149130
1360000
1,40721849618948972455531
1,01765.3%90.4%
2050
1,44600400003
219516199518278240
1270029066265
8244
1,5737000700005
1,49821951619951870538240
1,07468.3%95.2%
Power plantsCoalLigniteGasOilDieselNuclearBiomassHydroWind
of which wind offshorePVGeothermalSolar thermal power plantsOcean energy
Combined heat & power productionCoalLigniteGasOilBiomassGeothermalHydrogenCHP by producerMain activity producersAutoproducers
Total generationFossilCoalLigniteGasOilDiesel
NuclearHydrogenRenewablesHydroWindof which wind offshore
PVBiomassGeothermalSolar thermalOcean energy
Fluctuating RES (PV, Wind, Ocean)Share of fluctuating RESRES share (domestic generation)
2009
7307948129384
1361119376014200
165411277251000
11154
89545211960206634
1360
3061937601421200
9010.1%34.2%
2015
75,31855,2457,2434,16719,85323,982
8,23811,8361,9551,332731
6,8539594
15.2%3,828
2020
68,82646,4675,0262,28120,25818,903
5,01917,3402,0372,1932,1248,1052,844
3625.3%12,159
2030
60,44131,9292,424252
16,70912,545
85127,6612,1283,7635,1338,0048,407227
46.1%21,743
2040
52,24816,6691,322
09,4555,891
035,5802,1674,8828,9767,68011,479
39668.5%29,732
2050
46,3167,0918740
3,1763,042
039,2242,1775,34711,6496,58212,965
50485.0%34,284
TotalFossilHard coalLigniteNatural gasCrude oil
NuclearRenewablesHydroWindSolarBiomassGeothermal/ambient heatOcean energyRES share‘Efficiency’ savings (compared to Ref.)
2009
74,70756,8447,6665,46818,24925,462
9,5368,3271,854485115
5,3824902
10.8%0
2015
90425140823285
4011463120420
1,30539743943633
3,53991%510742926
1,178184
5706.2342
2020
66420521723543
32074162229
98427823345716
2,81472%425568795861166
5794.9
1,061
2030
320812421112
237392
1960
557120274074
1,74445%292354515464119
5932.9
2,161
2040
139350
10401
11500
1150
255350
2201
76520%15818617819547
5991.3
3,006
2050
19001900
4300430
6200620
1925%3854454115
6000.3
3,429
2009
1,005274456228406
43815410514732
1,44242856137579
3,77897%485765957
1,357214
5556.80
2015
7635341912315
2,5261,925562390
18,87515,4612,7122964050
22,16417,9193,4663194600
19.2%
512
2020
1,47971350017889
2,8551,822938950
17,30412,6352,731777
1,1610
21,63915,1704,170954
1,3450
29.9%
2,062
2030
2,087657574532324
2,9651,5311,0843501
15,2858,4062,6072,1652,107
0
20,33810,5944,2652,6972,781
1
47.9%
4,609
2040
2,743263576
1,289615
3,183856
1,3529696
13,0554,3112,1333,1523,428
31
18,9815,4304,0614,4415,012
37
71.4%
6,846
2050
3,135125533
1,818658
3,085351
1,3041,335
94
11,306849
1,7433,8564,748110
17,5251,3263,5805,6756,741204
92.4%
8,921
2009
55741813503
1,6941,396288100
17,10414,8781,989
641730
19,35516,6932,413
641860
13.8%
0
table 12.59: oecd europe: final energy demandPJ/a
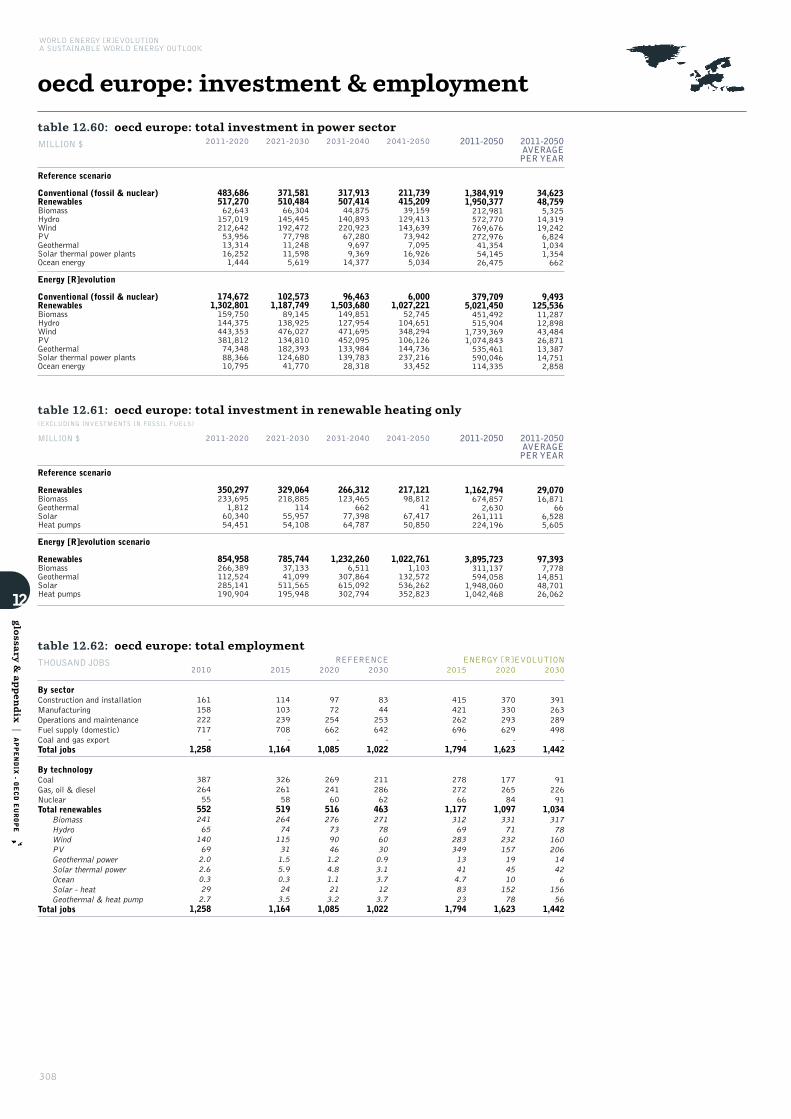
308
WORLD ENERGY [R]EVOLUTIONA SUSTAINABLE WORLD ENERGY OUTLOOK
oecd europe: investment & employment
12
glo
ssary &
appen
dix
|APPENDIX - O
ECD EUROPE
table 12.60: oecd europe: total investment in power sectorMILLION $ 2041-2050
211,739415,20939,159129,413143,63973,9427,09516,9265,034
6,0001,027,221
52,745104,651348,294106,126144,736237,21633,452
2011-2050
1,384,9191,950,377212,981572,770769,676272,97641,35454,14526,475
379,7095,021,450451,492515,904
1,739,3691,074,843535,461590,046114,335
2011-2050AVERAGEPER YEAR
34,62348,7595,32514,31919,2426,8241,0341,354662
9,493125,53611,28712,89843,48426,87113,38714,7512,858
2031-2040
317,913507,41444,875140,893220,92367,2809,6979,36914,377
96,4631,503,680149,851127,954471,695452,095133,984139,78328,318
2021-2030
371,581510,48466,304145,445192,47277,79811,24811,5985,619
102,5731,187,749
89,145138,925476,027134,810182,393124,68041,770
2011-2020
483,686517,27062,643157,019212,64253,95613,31416,2521,444
174,6721,302,801159,750144,375443,353381,81274,34888,36610,795
Reference scenario
Conventional (fossil & nuclear)RenewablesBiomassHydroWindPVGeothermalSolar thermal power plantsOcean energy
Energy [R]evolution
Conventional (fossil & nuclear)RenewablesBiomassHydroWindPVGeothermalSolar thermal power plantsOcean energy
table 12.61: oecd europe: total investment in renewable heating only (EXCLUDING INVESTMENTS IN FOSSIL FUELS)
2041-2050
217,12198,812
4167,41750,850
1,022,7611,103
132,572536,262352,823
2011-2050
1,162,794674,8572,630
261,111224,196
3,895,723311,137594,058
1,948,0601,042,468
2011-2050AVERAGEPER YEAR
29,07016,871
666,5285,605
97,3937,77814,85148,70126,062
2031-2040
266,312123,465
66277,39864,787
1,232,2606,511
307,864615,092302,794
2021-2030
329,064218,885
11455,95754,108
785,74437,13341,099511,565195,948
2011-2020
350,297233,6951,81260,34054,451
854,958266,389112,524285,141190,904
MILLION $
Reference scenario
RenewablesBiomassGeothermalSolarHeat pumps
Energy [R]evolution scenario
RenewablesBiomassGeothermalSolarHeat pumps
table 12.62: oecd europe: total employmentTHOUSAND JOBS
2010
161158222717
-1,258
3872645555224165
140692.02.60.3292.7
1,258
2015
114103239708
-1,164
3262615851926474
115311.55.90.3243.5
1,164
2020
9772254662
-1,085
269241605162767390461.24.81.1213.2
1,085
REFERENCE ENERGY [R]EVOLUTION2030
8344253642
-1,022
211286624632717860300.93.13.7123.7
1,022
2015
415421262696
-1,794
27827266
1,17731269
28334913414.78323
1,794
2020
370330293629
-1,623
17726584
1,09733171
232157194510
15278
1,623
2030
391263289498
-1,442
9122691
1,03431778
16020614426
15656
1,442
By sectorConstruction and installationManufacturingOperations and maintenanceFuel supply (domestic)Coal and gas exportTotal jobs
By technologyCoalGas, oil & dieselNuclearTotal renewables
BiomassHydroWindPVGeothermal powerSolar thermal powerOceanSolar - heatGeothermal & heat pump
Total jobs
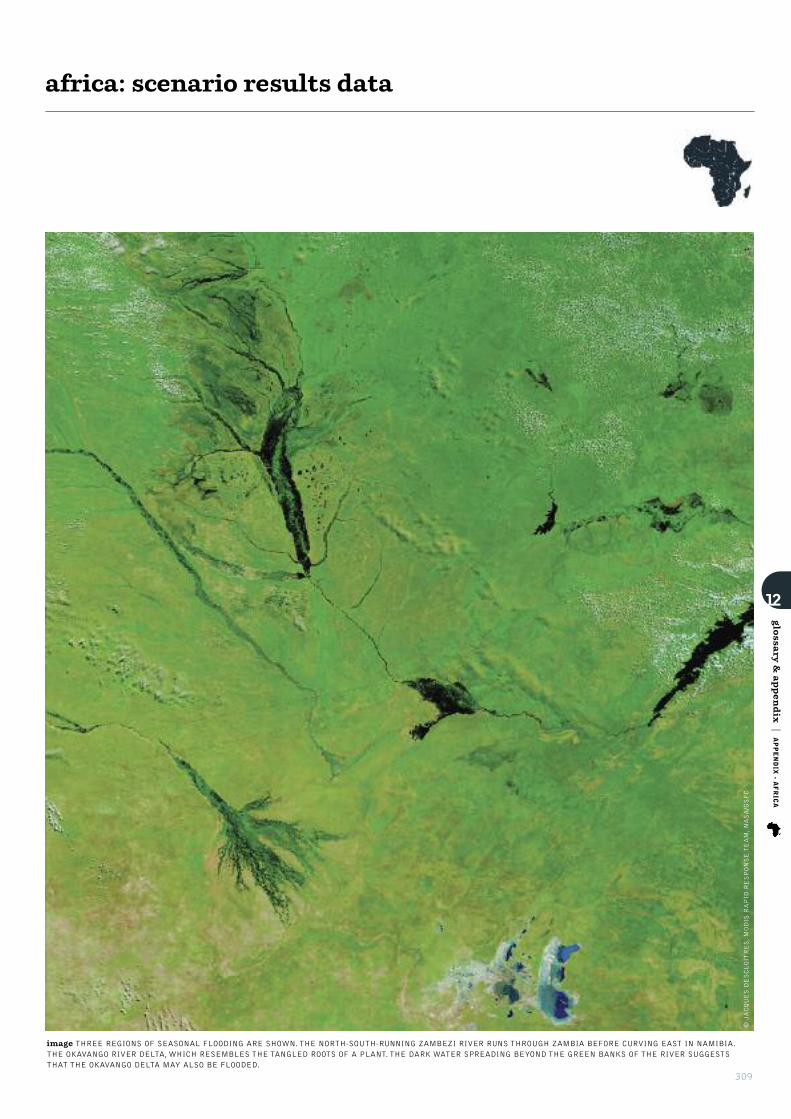
309
africa: scenario results data
12
glo
ssary &
appen
dix
|APPENDIX - A
FRICA
image THREE REGIONS OF SEASONAL FLOODING ARE SHOWN. THE NORTH-SOUTH-RUNNING ZAMBEZI RIVER RUNS THROUGH ZAMBIA BEFORE CURVING EAST IN NAMIBIA.THE OKAVANGO RIVER DELTA, WHICH RESEMBLES THE TANGLED ROOTS OF A PLANT. THE DARK WATER SPREADING BEYOND THE GREEN BANKS OF THE RIVER SUGGESTSTHAT THE OKAVANGO DELTA MAY ALSO BE FLOODED.
© JACQUES DESCLOITRES, M
ODIS RAPID RESPONSE TEAM, NASA/GSFC

WORLD ENERGY [R]EVOLUTIONA SUSTAINABLE WORLD ENERGY OUTLOOK
africa: reference scenario
12
glo
ssary &
appen
dix
|APPENDIX - A
FRICA
Condensation power plantsCoalLigniteGasOilDiesel
Combined heat & power productionCoalLigniteGasOil
CO2 emissions power generation (incl. CHP public)CoalLigniteGasOil & diesel
CO2 emissions by sector% of 1990 emissionsIndustry1)Other sectors1)TransportPower generation2)District heating & other conversion
Population (Mill.)CO2 emissions per capita (t/capita)
1) including CHP autoproducers. 2) including CHP public
District heatingFossil fuelsBiomassSolar collectorsGeothermal
Heat from CHP Fossil fuelsBiomassGeothermalHydrogen
Direct heating1)Fossil fuelsBiomassSolar collectorsGeothermal2)
Total heat supply1)Fossil fuelsBiomassSolar collectorsGeothermal2)Hydrogen
RES share (including RES electricity)
1) heat from electricity (direct) not included; 2) including heat pumps.
2015
23,04122,2813,9053,824
5442340
0.2%
4,12797518040
5385596920
1,35900
37.3%
14,2501,27523600
3311,1402746
11,2240
80.5%
13,01358.4%
76041829250
2020
24,74623,9144,1494,060
5582650
0.3%
4,4521,119215130
5595926880
1,48100
38.1%
15,3131,59330600
3461,3012888
11,7780
79.0%
13,80157.7%
83245832054
2030
29,85428,9184,9914,623327132860
0.4%
5,5371,564361592
7316248780
1,68200
36.9%
18,3902,37854900
5021,49060957
13,3503
75.9%
16,02455.4%
93751536061
2040
35,86034,8445,9475,3115711845120
0.5%
6,8562,165552853
891644
1,1320
1,93800
36.4%
22,0413,53390100
6521,591868111
15,2806
73.9%
18,82154.0%
1,01755939166
2050
43,09542,0197,0446,2816542288210
0.6%
8,4862,9797191295
1,225583
1,3830
2,18800
34.3%
26,4885,2201,260
00
1,0251,6941,127166
17,2489
70.5%
21,63851.5%
1,07759241470
Total (incl. non-energy use)Total (energy use)TransportOil productsNatural gasBiofuelsElectricity
RES electricityHydrogenRES share Transport
IndustryElectricity
RES electricityDistrict heat
RES district heatCoalOil productsGasSolarBiomass and wasteGeothermal/ambient heatHydrogenRES share Industry
Other SectorsElectricity
RES electricityDistrict heat
RES district heatCoalOil productsGasSolarBiomass and wasteGeothermal/ambient heatRES share Other Sectors
Total RESRES share
Non energy useOilGasCoal
2009
20,86420,1433,3013,230
5201930
0.1%
3,51882313300
3205156960
1,16300
36.8%
13,3241,02216600
3239742573
10,7450
81.9%
12,21260.6%
72039627747
table 12.63: africa: electricity generationTWh/a
table 12.66: africa: installed capacity GW
table 12.67: africa: primary energy demand PJ/a
table 12.65: africa: co2 emissionsMILL t/a
table 12.64: africa: heat supplyPJ/a
2015
7692820
2576113136
122605300
11000000
01
7706142830
2576113130
1421226056300
89530
631
121.6%19%
2020
9133380
316561413101421019410
32010000
03
9167273400
3175614130
176142101910410
101600
761
192.1%19%
2030
1,2734800
4173116323020621328850
1610050000
016
1,2899604900
4223216320
2982062132830850
121720
1,103
493.8%23%
2040
1,8137200
547221837582833556715100
2919080100
029
1,8421,3367390
5562318370
470283355675915100
160950
1,595
1025.5%26%
2050
2,6161,224
067714204286361507
10023200
42290110200
042
2,6581,9751,253
06891420420
642361507
1008723200
2301360
2,302
1515.7%24%
Power plantsCoalLigniteGasOilDieselNuclearBiomassHydroWind
of which wind offshorePVGeothermalSolar thermal power plantsOcean energy
Combined heat & power plantsCoalLigniteGasOilBiomassGeothermalHydrogenCHP by producerMain activity producersAutoproducers
Total generationFossilCoalLigniteGasOilDiesel
NuclearHydrogenRenewablesHydroWindof which wind offshore
PVBiomassGeothermalSolar thermalOcean energy
Distribution lossesOwn consumption electricityElectricity for hydrogen productionFinal energy consumption (electricity)
Fluctuating RES (PV, Wind, Ocean)Share of fluctuating RESRES share (domestic generation)
2009
6302500
186681113198200100
00000000
00
6305152500
1866811130
102982001100
76450
518
20.3%16%
2015
179480632162131303000
00000000
00
179139480642162039313031000
63%22%
2020
215580772172237504110
10000000
01
216165590782172049375042110
94%23%
2030
2807209913845539111140
42010000
04
284196740
10014840845391115140
207%29%
2040
3801050
122995107315122380
74020000
07
3872511080
12410950
131731512210380
3710%34%
2050
5291780
15161061493212334140
96030000
09
5383531840
15461060
1799321233154140
5410%33%
Power plantsCoalLigniteGasOilDieselNuclearBiomassHydroWind
of which wind offshorePVGeothermalSolar thermal power plantsOcean energy
Combined heat & power productionCoalLigniteGasOilBiomassGeothermalHydrogenCHP by producerMain activity producersAutoproducers
Total generationFossilCoalLigniteGasOilDiesel
NuclearHydrogenRenewablesHydroWindof which wind offshore
PVBiomassGeothermalSolar thermalOcean energy
Fluctuating RES (PV, Wind, Ocean)Share of fluctuating RESRES share (domestic generation)
2009
142410472162025100000
00000000
00
142114410472162026251000000
11%18%
2015
29,72415,3864,142
04,0577,187
14014,198
4392325
13,616940
47.6%
2020
32,09616,8804,761
04,4797,641
14515,070
5103850
14,3411330
46.7%
2030
37,56719,6435,639
05,7148,290
34617,578
74175203
16,3072520
46.5%
2040
46,71425,8189,054
07,6639,101
40020,4961,021128441
18,5363710
43.6%
2050
56,33032,22813,493
08,69710,037
45323,6491,300181707
21,0434190
41.8%
TotalFossilHard coalLigniteNatural gasCrude oil
NuclearRenewablesHydroWindSolarBiomassGeothermal/ambient heatOcean energyRES share
2009
27,55314,2254,413
03,4526,359
14013,189
35363
12,778490
47.6%
2015
4542770
121489
11000
4562780
12256
1,058194%13213227645464
1,1450.9
2020
5173250
139449
32010
5203270
14153
1,165214%13814629351771
1,2780.9
2030
5573520
1702510
128030
5693600
17435
1,350248%17619234855777
1,5620.9
2040
8906260
2351712
1914040
9096400
24029
1,834336%21322841189092
1,8701.0
2050
1,2569640
2681113
2419050
1,2799830
27324
2,383437%259285484
1,256100
2,1921.1
2009
407251095538
00000
40725109561
928170%10711723340763
9990.9
2015
00000
44000
12,5332,8759,653
60
12,5372,8789,653
600
77.0%
2020
00000
1313000
13,2483,07010,169
80
13,2613,08310,169
800
76.8%
2030
00000
5957200
15,5243,94811,515
574
15,5834,00511,517
5740
74.3%
2040
00000
8582300
18,0374,72513,193
1119
18,1234,80713,196
11190
73.5%
2050
00000
129124500
20,8385,76614,894
16612
20,9675,89014,900
166120
71.9%
2009
00000
00000
11,6372,4879,148
30
11,6372,4879,148
300
78.6%
table 12.68: africa: final energy demandPJ/a
310

Condensation power plantsCoalLigniteGasOilDiesel
Combined heat & power productionCoalLigniteGasOil
CO2 emissions power generation (incl. CHP public)CoalLigniteGasOil & diesel
CO2 emissions by sector% of 1990 emissionsIndustry1)Other sectors1)TransportPower generation2)District heating & other conversion
Population (Mill.)CO2 emissions per capita (t/capita)‘Efficiency’ savings (compared to Ref.)
1) including CHP autoproducers. 2) including CHP public
District heatingFossil fuelsBiomassSolar collectorsGeothermal
Heat from CHP Fossil fuelsBiomassGeothermalHydrogen
Direct heating1)Fossil fuelsBiomassSolar collectorsGeothermal2)Hydrogen
Total heat supply1)Fossil fuelsBiomassSolar collectorsGeothermal1)Hydrogen
RES share (including RES electricity)‘Efficiency’ savings (compared to Ref.)
1) heat from electricity (direct) not included; geothermal includes heat pumps
africa: energy [r]evolution scenario
12
glo
ssary &
appen
dix
|APPENDIX - A
FRICA
2015
22,37821,6183,4443,362
5412464
0.2%
3,924932210152
41550081025
1,22520
37.3%
14,2501,27528700
383936431290
10,9350
80.8%
12,98460.1%
76041029257
2020
23,16622,3333,9523,807
5623511715
1.1%
4,0281,023345753641333683273
1,242330
42.9%
14,3541,53851900
375568701719
10,4540
81.5%
13,46660.3%
83244132071
2030
25,48224,5464,2513,821
758517610895
5.9%
4,5441,308807349154200163825321
1,2351420
58.5%
15,7512,1841,348
00
270270719
1,82210,251
23486.7%
16,56567.5%
93747836099
2040
27,81026,7934,3693,189109126540435405
20.3%
5,1111,6561,33353824412877788558
1,05529616
68.4%
17,3133,0862,483
00
19754498
2,74810,123
60692.2%
20,34675.9%
1,017498391127
2050
30,44529,3694,4412,637126130897829651
35.1%
5,7612,0861,9296243241925448
1,007787539227
83.2%
19,1674,3364,009
007528487
3,9979,340904
95.2%
24,60583.8%
1,077506414156
Total (incl. non-energy use)Total (energy use)TransportOil productsNatural gasBiofuelsElectricity
RES electricityHydrogenRES share Transport
IndustryElectricity
RES electricityDistrict heat
RES district heatCoalOil productsGasSolarBiomass and wasteGeothermal/ambient heatHydrogenRES share Industry
Other SectorsElectricity
RES electricityDistrict heat
RES district heatCoalOil productsGasSolarBiomass and wasteGeothermal/ambient heatRES share Other Sectors
Total RESRES share
Non energy useOilGasCoal
2009
20,86420,1433,3013,230
5201930
0.1%
3,51882313300
3205156960
1,16300
36.8%
13,3241,02216600
3239742573
10,7450
81.9%
12,21260.6%
72039627747
table 12.69: africa: electricity generationTWh/a
table 12.72: africa: installed capacity GW
table 12.73: africa: primary energy demand PJ/a
table 12.71: africa: co2 emissionsMILL t/a
table 12.70: africa: heat supplyPJ/a
2015
7562570
256527135
1282606410
42010100
04
7605762600
257527130
17112826066410
89532
620
334.3%22.5%
12
2020
8932500
2884358101505432917327
205060900
020
9135972550
29443580
308150543291917327
98586
726
909.9%33.7%
42
2030
1,2501890
246214010175224851256616724
981204403740
098
1,3485162010
29021400
83217522485125477016724
1226137
1,019
37327.7%61.7%125
2040
1,9301290
1777409
19036218427212560651
14523065044121
0145
2,0754041520
2427401
1,6701903621842725213760651
16173163
1,469
68533.0%80.5%265
2050
2,763350820306
195613283473208
1,047102
17020077051175
0170
2,933216550
1580305
2,71219561328347357225
1,047102
22383332
2,039
1,18840.5%92.4%493
Power plantsCoalLigniteGasOilDieselNuclearBiomassHydroWind
of which wind offshorePVGeothermalSolar thermal power plantsOcean energy
Combined heat & power plantsCoalLigniteGasOilBiomassGeothermalHydrogenCHP by producerMain activity producersAutoproducers
Total generationFossilCoalLigniteGasOilDiesel
NuclearHydrogenRenewablesHydroWindof which wind offshore
PVBiomassGeothermalSolar thermalOcean energy
Distribution lossesOwn consumption electricityElectricity for hydrogen productionFinal energy consumption (electricity)
Fluctuating RES (PV, Wind, Ocean)Share of fluctuating RESRES share (domestic generation)‘Efficiency’ savings (compared to Ref.)
2009
6302500
186681113198200100
00000000
00
6305152500
1866811130
102982001100
76450
518
20.3%16%
0
2015
1804306318321331303110
11000000
01
1821294406418320513313031110
169%28%
2020
226430681621239251123132
51020200
05
231133440691721097392511243132
3917%42%
2030
3402805892024589254911426
2220120710
022
362112310709200
25045892549812426
14340%69%
2040
4762904232014912551902110113
3250170820
032
50897330593200
41049125519092310113
22845%81%
2050
67210033010150200721553516126
3970190931
039
71070170520101
6395020072155103816126
38054%90%
Power plantsCoalLigniteGasOilDieselNuclearBiomassHydroWind
of which wind offshorePVGeothermalSolar thermal power plantsOcean energy
Combined heat & power productionCoalLigniteGasOilBiomassGeothermalHydrogenCHP by producerMain activity producersAutoproducers
Total generationFossilCoalLigniteGasOilDiesel
NuclearHydrogenRenewablesHydroWindof which wind offshore
PVBiomassGeothermalSolar thermalOcean energy
Fluctuating RES (PV, Wind, Ocean)Share of fluctuating RESRES share (domestic generation)
2009
142410472162025100000
00000000
00
142114410472162026251000000
11%18%
2015
28,86414,4653,840
04,3906,235
14014,259
46195345
13,2241321
49.5%939
2020
30,37114,7873,756
04,9826,049
8715,497
540194
1,18412,909
64525
51.0%1,942
2030
33,64212,4582,454
04,6675,337
021,184
630807
4,09612,8932,672
8662.8%4,522
2040
38,71910,1932,087
03,9324,174
028,526
6841,3039,73912,3354,281184
73.4%8,982
2050
43,2706,9239210
2,6043,398
036,347
7022,20716,12811,2465,697367
83.8%14,191
TotalFossilHard coalLigniteNatural gasCrude oil
NuclearRenewablesHydroWindSolarBiomassGeothermal/ambient heatOcean energyRES share‘Efficiency’ savings (compared to Ref.)
2009
27,55314,2254,413
03,4526,359
14013,189
35363
12,778490
47.6%0
2015
4182520
121405
43010
4222550
12245
980180%12513024341864
1,1450.978
2020
4042400
127333
115060
4152450
13337
983180%12111627540466
1,2780.8182
2030
2581390
100163
41100300
2981490
13119
790145%1178527725853
1,5620.5560
2040
19511207652
50170330
2461290
1107
621114%1125023419531
1,8700.3
1,213
2050
622803202
44130310
106410632
38170%72361966215
2,1920.2
2,002
2009
407251095538
00000
40725109561
928170%10711723340763
9990.90
2015
00000
1512200
12,4632,8259,32131520
12,4782,8379,32331520
77%
59
2020
00000
75403510
12,4052,6148,963791360
12,4802,6538,999791370
79%
781
2030
00000
349195127260
13,3701,9478,7912,1434900
13,7192,1428,9182,1435170
84%
1,864
2040
00000
538293146945
14,3901,3398,5523,3061,180
13
14,9271,6318,6983,3061,274
18
89%
3,196
2050
00000
62429815715316
15,523771
7,7365,0041,819193
16,1461,0697,8935,0041,972208
93%
4,821
2009
00000
00000
11,6372,4879,148
300
11,6372,4879,148
300
78.6%
0
table 12.74: africa: final energy demandPJ/a
311
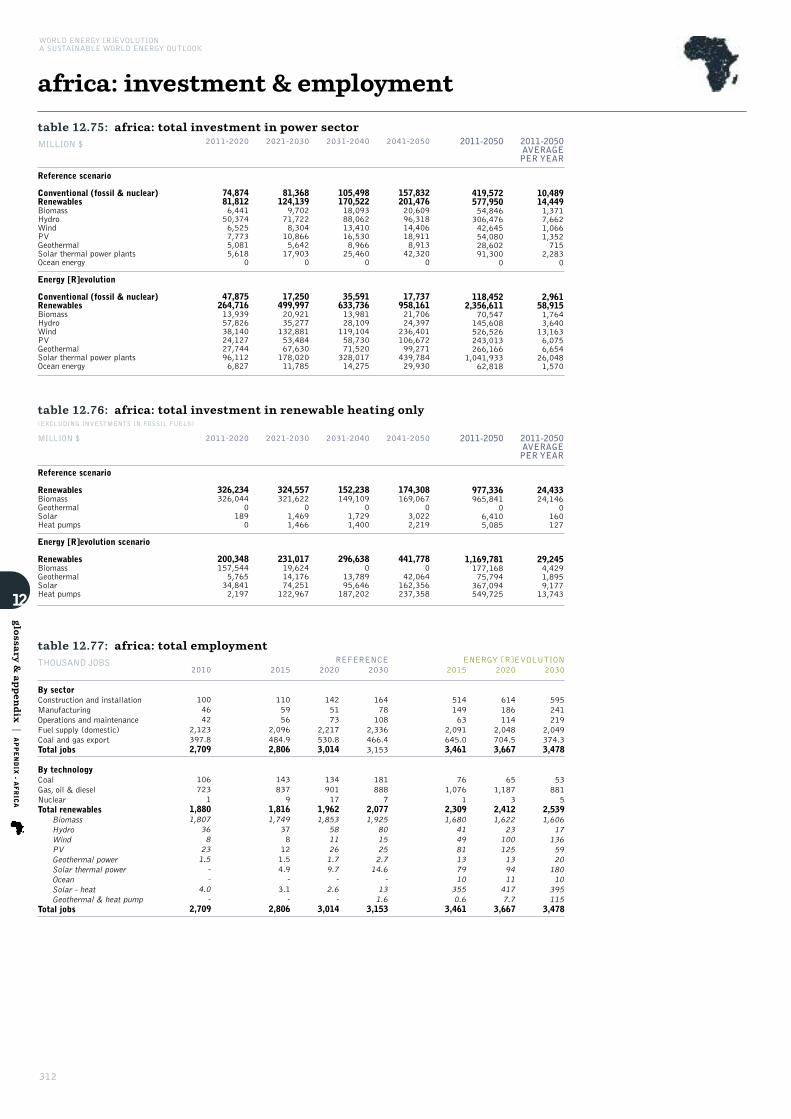
312
WORLD ENERGY [R]EVOLUTIONA SUSTAINABLE WORLD ENERGY OUTLOOK
africa: investment & employment
12
glo
ssary &
appen
dix
|APPENDIX - A
FRICA
table 12.75: africa: total investment in power sectorMILLION $ 2041-2050
157,832201,47620,60996,31814,40618,9118,91342,320
0
17,737958,16121,70624,397236,401106,67299,271439,78429,930
2011-2050
419,572577,95054,846306,47642,64554,08028,60291,300
0
118,4522,356,611
70,547145,608526,526243,013266,166
1,041,93362,818
2011-2050AVERAGEPER YEAR
10,48914,4491,3717,6621,0661,352715
2,2830
2,96158,9151,7643,64013,1636,0756,65426,0481,570
2031-2040
105,498170,52218,09388,06213,41016,5308,96625,460
0
35,591633,73613,98128,109119,10458,73071,520328,01714,275
2021-2030
81,368124,1399,70271,7228,30410,8665,64217,903
0
17,250499,99720,92135,277132,88153,48467,630178,02011,785
2011-2020
74,87481,8126,44150,3746,5257,7735,0815,618
0
47,875264,71613,93957,82638,14024,12727,74496,1126,827
Reference scenario
Conventional (fossil & nuclear)RenewablesBiomassHydroWindPVGeothermalSolar thermal power plantsOcean energy
Energy [R]evolution
Conventional (fossil & nuclear)RenewablesBiomassHydroWindPVGeothermalSolar thermal power plantsOcean energy
table 12.76: africa: total investment in renewable heating only (EXCLUDING INVESTMENTS IN FOSSIL FUELS)
2041-2050
174,308169,067
03,0222,219
441,7780
42,064162,356237,358
2011-2050
977,336965,841
06,4105,085
1,169,781177,16875,794367,094549,725
2011-2050AVERAGEPER YEAR
24,43324,146
0160127
29,2454,4291,8959,17713,743
2031-2040
152,238149,109
01,7291,400
296,6380
13,78995,646187,202
2021-2030
324,557321,622
01,4691,466
231,01719,62414,17674,251122,967
2011-2020
326,234326,044
01890
200,348157,5445,76534,8412,197
MILLION $
Reference scenario
RenewablesBiomassGeothermalSolarHeat pumps
Energy [R]evolution scenario
RenewablesBiomassGeothermalSolarHeat pumps
table 12.77: africa: total employmentTHOUSAND JOBS
2010
1004642
2,123397.82,709
1067231
1,8801,807
368
231.5
--
4.0-
2,709
2015
1105956
2,096484.92,806
1438379
1,8161,749
378121.54.9-
3.1-
2,806
2020
1425173
2,217530.83,014
13490117
1,9621,853
5811261.79.7
-2.6
-3,014
REFERENCE ENERGY [R]EVOLUTION2030
16478108
2,336466.43,153
1818887
2,0771,925
8015252.7
14.6-
131.6
3,153
2015
51414963
2,091645.03,461
761,076
12,3091,680
414981137910
3550.6
3,461
2020
614186114
2,048704.53,667
651,187
32,4121,622
23100125139411
4177.7
3,667
2030
595241219
2,049374.33,478
538815
2,5391,606
171365920
18010
395115
3,478
By sectorConstruction and installationManufacturingOperations and maintenanceFuel supply (domestic)Coal and gas exportTotal jobs
By technologyCoalGas, oil & dieselNuclearTotal renewables
BiomassHydroWindPVGeothermal powerSolar thermal powerOceanSolar - heatGeothermal & heat pump
Total jobs
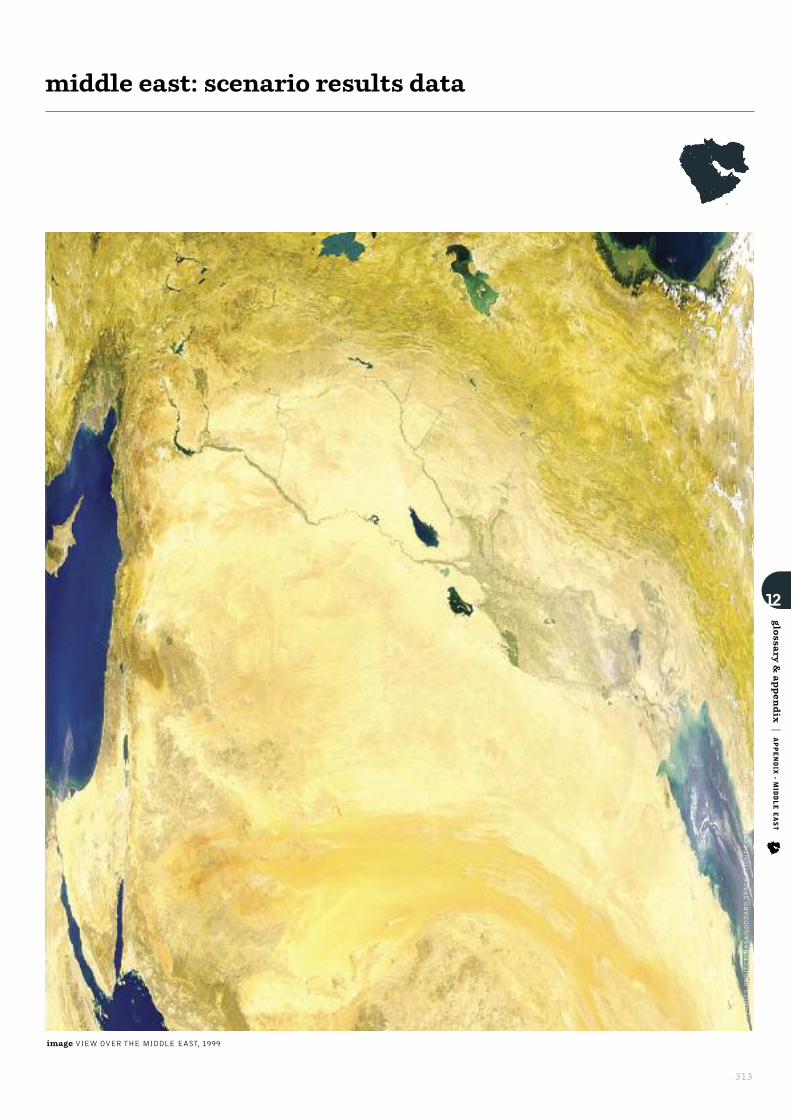
313
middle east: scenario results data
12
glo
ssary &
appen
dix
|APPENDIX - M
IDDLE EAST
image VIEW OVER THE MIDDLE EAST, 1999
© SEAWIFS PROJECT, NASA/GODDARD SPACE FLIGHT CENTER, AND ORBIM
AGE

314
WORLD ENERGY [R]EVOLUTIONA SUSTAINABLE WORLD ENERGY OUTLOOK
middle east: reference scenario
12
glo
ssary &
appen
dix
|APPENDIX - M
IDDLE EAST
Condensation power plantsCoalLigniteGasOilDiesel
Combined heat & power productionCoalLigniteGasOil
CO2 emissions power generation (incl. CHP public)CoalLigniteGasOil & diesel
CO2 emissions by sector% of 1990 emissionsIndustry1)Other sectors1)TransportPower generation2)District heating & other conversion
Population (Mill.)CO2 emissions per capita (t/capita)
1) including CHP autoproducers. 2) including CHP public
District heatingFossil fuelsBiomassSolar collectorsGeothermal
Heat from CHP Fossil fuelsBiomassGeothermalHydrogen
Direct heating1)Fossil fuelsBiomassSolar collectorsGeothermal2)
Total heat supply1)Fossil fuelsBiomassSolar collectorsGeothermal2)Hydrogen
RES share (including RES electricity)
1) heat from electricity (direct) not included; 2) including heat pumps.
2015
20,68117,3286,3956,2261680100
0.0%
5,553562230019
2,0292,932
01100
0.6%
5,3802,201
89000
1,2431,860
52221
3.1%
1991.1%
3,3531,7801,573
0
2020
23,32919,5947,2647,0781850100
0.0%
6,220681330022
2,2213,283
01200
0.7%
6,1092,648128000
1,2962,074
61282
3.6%
2651.4%
3,7361,9831,753
0
2030
29,39325,06310,1169,8742400100
0.0%
7,289951610028
2,3753,922
01300
1.0%
7,6573,689236000
1,3042,522
90475
4.9%
4531.8%
4,3302,2982,032
0
2040
33,65528,86511,22210,923
2962100
0.0%
8,3121,260
870022
2,5944,422
01400
1.2%
9,3314,835334000
1,2913,0121137010
5.7%
6312.2%
4,7892,5422,247
0
2050
37,87432,86212,29311,941
33417100
0.1%
9,3681,622113005
2,9834,744
01400
1.4%
11,2026,173430000
1,2913,4791517829
6.1%
8322.5%
5,0122,6602,351
0
Total (incl. non-energy use)Total (energy use)TransportOil productsNatural gasBiofuelsElectricity
RES electricityHydrogenRES share Transport
IndustryElectricity
RES electricityDistrict heat
RES district heatCoalOil productsGasSolarBiomass and wasteGeothermal/ambient heatHydrogenRES share Industry
Other SectorsElectricity
RES electricityDistrict heat
RES district heatCoalOil productsGasSolarBiomass and wasteGeothermal/ambient heatRES share Other Sectors
Total RESRES share
Non energy useOilGasCoal
2009
16,47513,8124,6764,5391360100
0.0%
4,59543780013
1,7482,388
0900
0.4%
4,5411,720
31000
1,1061,693
5161
1.2%
700.5%
2,6631,6491,014
0
table 12.78: middle east: electricity generationTWh/a
table 12.81: middle east: installed capacity GW
table 12.82: middle east: primary energy demand PJ/a
table 12.80: middle east: co2 emissionsMILL t/a
table 12.79: middle east: heat supplyPJ/a
2015
94940
599286157232301010
30012000
03
95290540
599287157039323012010
101860
768
30.4%4.1%
2020
1,13840
7632891018338604030
70033100
07
1,1451,072
40
7662921018055386044030
1151090
925
100.9%4.8%
2030
1,56940
1,141278541750154140140
151085200
015
1,5841,441
50
1,1492835410
101501541490140
1461560
1,289
291.8%6.4%
2040
1,98550
1,5892394121052276200270
2510139300
025
2,0101,859
60
16022484120
1395227620130270
1461800
1,693
472.3%6.9%
2050
2,49770
2,0632383141359378300330
30101510400
030
2,5272,337
80
2,0782483140
1765937830170330
1602120
2,165
672.7%7.0%
Power plantsCoalLigniteGasOilDieselNuclearBiomassHydroWind
of which wind offshorePVGeothermalSolar thermal power plantsOcean energy
Combined heat & power plantsCoalLigniteGasOilBiomassGeothermalHydrogenCHP by producerMain activity producersAutoproducers
Total generationFossilCoalLigniteGasOilDiesel
NuclearHydrogenRenewablesHydroWindof which wind offshore
PVBiomassGeothermalSolar thermalOcean energy
Distribution lossesOwn consumption electricityElectricity for hydrogen productionFinal energy consumption (electricity)
Fluctuating RES (PV, Wind, Ocean)Share of fluctuating RESRES share (domestic generation)
2009
74310
4282762500130.200000
00000000
00
74373010
428276250013130.2000000
112550
599
00.0%1.8%
2015
28910
1977141013100010
10000000
01
29027420
1977241015131000010
10.5%5.2%
2020
32510
2167832118202010
10001000
01
32729910
2177932025182021010
51.4%7.6%
2030
38010
2587116124518030
30011000
03
38333410
2597216043245181030
133.5%11.3%
2040
46210
344601222510211040
50032000
05
46641010
346621205425102112040
214.6%11.7%
2050
57910
447601222814316060
60032100
06
58551310
450621207028143163060
315.2%11.9%
Power plantsCoalLigniteGasOilDieselNuclearBiomassHydroWind
of which wind offshorePVGeothermalSolar thermal power plantsOcean energy
Combined heat & power productionCoalLigniteGasOilBiomassGeothermalHydrogenCHP by producerMain activity producersAutoproducers
Total generationFossilCoalLigniteGasOilDiesel
NuclearHydrogenRenewablesHydroWindof which wind offshore
PVBiomassGeothermalSolar thermalOcean energy
Fluctuating RES (PV, Wind, Ocean)Share of fluctuating RESRES share (domestic generation)
2009
19810
126605006
0.100000
00000000
00
19819210
1266050066
0.1000000
00.0%3.1%
2015
29,55429,223
1060
13,87815,239
8224911410596520
0.9%
2020
33,37732,840
1090
16,27016,461
19634213721899320
1.0%
2030
41,07540,027
1120
20,52719,389
4495991795219217050
1.5%
2040
46,08945,151
1190
24,69720,335
13180618797282229110
1.8%
2050
50,52749,348
1160
27,51221,720
1531,026212133378273290
2.1%
TotalFossilHard coalLigniteNatural gasCrude oil
NuclearRenewablesHydroWindSolarBiomassGeothermal/ambient heatOcean energyRES share
2009
24,51624,432
1340
11,83612,463
08447153010
0.4%
2015
53640
28723312
20001
53850
288246
1,778319%320197457536268
2297.8
2020
59040
3462328
40022
59440
347242
1,992358%356213519590315
2508.0
2030
71640
4962134
81034
72440
499220
2,452440%408238723716367
2898.5
2040
86450
6821743
131056
87660
687184
2,779499%457265801864393
3268.5
2050
1,00160
8321612
151078
1,01670
838170
3,081553%504291876
1,001409
3588.6
2009
49210
24622520
00000
49210
246245
1,510271%266177334492241
2037.4
2015
00000
00000
6,6456,564
26522
6,6456,564
265220
1.2
2020
00000
00000
7,3047,208
32623
7,3047,208
326230
1.3
2030
00000
00000
8,3388,192
48907
8,3388,192
489070
1.7
2040
00000
00000
9,3589,161
6911314
9,3589,161
69113140
2.1
2050
00000
00000
10,36510,098
7715139
10,36510,098
77151390
2.6
2009
00000
00000
5,8345,807
2051
5,8345,807
20510
0.5
table 12.83: middle east: final energy demandPJ/a

Condensation power plantsCoalLigniteGasOilDiesel
Combined heat & power productionCoalLigniteGasOil
CO2 emissions power generation (incl. CHP public)CoalLigniteGasOil & diesel
CO2 emissions by sector% of 1990 emissionsIndustry1)Other sectors1)TransportPower generation2)District heating & other conversion
Population (Mill.)CO2 emissions per capita (t/capita)‘Efficiency’ savings (compared to Ref.)
1) including CHP autoproducers. 2) including CHP public
District heatingFossil fuelsBiomassSolar collectorsGeothermal
Heat from CHP Fossil fuelsBiomassGeothermalHydrogen
Direct heating1)Fossil fuelsBiomassSolar collectorsGeothermal2)Hydrogen
Total heat supply1)Fossil fuelsBiomassSolar collectorsGeothermal1)Hydrogen
RES share (including RES electricity)‘Efficiency’ savings (compared to Ref.)
1) heat from electricity (direct) not included; geothermal includes heat pumps
315
middle east: energy [r]evolution scenario
12
glo
ssary &
appen
dix
|APPENDIX - M
IDDLE EAST
2015
19,65116,3995,6925,450146563940
1.1%
5,328538545416
1,7492,749119251270
6.2%
5,3802,201221000
1,1541,835127539
7.6%
7994.9%
3,2521,6971,526
29
2020
21,00817,4596,0295,485159247792160
4.7%
5,72462616620174
1,0983,26025559232171
13.5%
5,7052,463653000
8841,9373075955
18.8%
2,13212.2%
3,5491,6001,878
71
2030
22,20918,0955,4514,103174373479296322
15.9%
6,1648014951581390
6652,724705110413589
36.1%
6,4803,0931,912
21210
4911,95068569171
44.1%
5,95232.9%
4,1141,4022,300411
2040
22,46918,1584,5601,902190354
1,128971986
47.6%
6,4479698345184700
2701,6691,398164594864
65.2%
7,1523,6543,144
40400
3291,3111,437
89292
69.9%
11,37862.7%
4,3101,2102,540560
2050
22,56618,5574,137521213298
1,6851,6451,42080.5%
6,6501,1371,110796726069271
2,029220
1,153975
93.1%
7,7704,2064,107
83830
121688
2,199125349
88.3%
16,38288.3%
4,0091,0022,406601
Total (incl. non-energy use)Total (energy use)TransportOil productsNatural gasBiofuelsElectricity
RES electricityHydrogenRES share Transport
IndustryElectricity
RES electricityDistrict heat
RES district heatCoalOil productsGasSolarBiomass and wasteGeothermal/ambient heatHydrogenRES share Industry
Other SectorsElectricity
RES electricityDistrict heat
RES district heatCoalOil productsGasSolarBiomass and wasteGeothermal/ambient heatRES share Other Sectors
Total RESRES share
Non energy useOilGasCoal
2009
16,47513,8124,6764,5391360100
0.0%
4,59543780013
1,7482,388
0900
0.4%
4,5411,720
31000
1,1061,693
5161
1.2%
700.5%
2,6631,6491,014
0
table 12.84: middle east: electricity generationTWh/a
table 12.87: middle east: installed capacity GW
table 12.88: middle east: primary energy demand PJ/a
table 12.86: middle east: co2 emissionsMILL t/a
table 12.85: middle east: heat supplyPJ/a
2015
94510
581255143132260200120
70011410
07
95285310
582256143096322602051120
99840
772
464.8%10%
6
2020
1,16610
730118103538780838856
150031730
015
1,18186410
7331201030
31338780831211856
969095880
16714.1%27%67
2030
1,82400
67915431450280702901546014
3000511491
030
1,85470400
68416431
1,1465028070290282446014
95102361
1,215
58431.5%62%207
2040
2,58200
35323015524801606196794843
55007023223
055
2,63736500
3612303
2,26952480160619388994843
95117715
1,600
1,14243.3%86%409
2050
3,1790055110185975528086372
1,29461
85
0011027389
085
3,2646900671109
3,1875975528086345111
1,29461
103137922
1,958
1,67951.4%98%681
Power plantsCoalLigniteGasOilDieselNuclearBiomassHydroWind
of which wind offshorePVGeothermalSolar thermal power plantsOcean energy
Combined heat & power plantsCoalLigniteGasOilBiomassGeothermalHydrogenCHP by producerMain activity producersAutoproducers
Total generationFossilCoalLigniteGasOilDiesel
NuclearHydrogenRenewablesHydroWindof which wind offshore
PVBiomassGeothermalSolar thermalOcean energy
Distribution lossesOwn consumption electricityElectricity for hydrogen productionFinal energy consumption (electricity)
Fluctuating RES (PV, Wind, Ocean)Share of fluctuating RESRES share (domestic generation)‘Efficiency’ savings (compared to Ref.)
2009
74310
4282762500130.200000
00000000
00
74373010
428276250013130.2000000
112550
599
00.0%1.8%
0
2015
29800
191644001310011040
10000100
01
29925900
191644003913100111040
217%13%
2020
35800
1973030118310471254
30000110
03
36123100
19830300
130183104722254
8223%36%
2030
56700
153410224106251623
1029
50010220
05
57216000
1544100
412241062516244
1029
27748%72%
2040
85300
118110325181573401114629
100010341
010
86312100
1191101
742251815734061614629
55064%86%
2050
1,12100431004282831004741223541
160020482
016
1,1364600451002
1,0892828310047482023541
79870%96%
Power plantsCoalLigniteGasOilDieselNuclearBiomassHydroWind
of which wind offshorePVGeothermalSolar thermal power plantsOcean energy
Combined heat & power productionCoalLigniteGasOilBiomassGeothermalHydrogenCHP by producerMain activity producersAutoproducers
Total generationFossilCoalLigniteGasOilDiesel
NuclearHydrogenRenewablesHydroWindof which wind offshore
PVBiomassGeothermalSolar thermalOcean energy
Fluctuating RES (PV, Wind, Ocean)Share of fluctuating RESRES share (domestic generation)
2009
19810
126605006
0.100000
00000000
00
19819210
1266050066
0.1000000
00.0%3.1%
2015
28,08927,078
990
13,39413,585
33979114943632371710
3.5%1,462
2020
29,83926,921
1260
15,91710,879
332,885137281
1,17766860022
9.5%3,668
2030
29,26421,456
4500
13,9417,065
337,776179
1,0084,1491,1221,268
5026.0%12,208
2040
28,57713,651
5970
9,2173,836
014,926
1871,7288,5961,1963,064155
51.7%18,007
2050
27,6476,8376370
4,4441,756
020,810
2122,71812,1901,2104,259220
74.9%23,498
TotalFossilHard coalLigniteNatural gasCrude oil
NuclearRenewablesHydroWindSolarBiomassGeothermal/ambient heatOcean energyRES share‘Efficiency’ savings (compared to Ref.)
2009
24,51624,432
1340
11,83612,463
08447153010
0.4%0
2015
49910
27920811
30021
50210
280220
1,633293%289189400499257
2297.1145
2020
43510
331958
50041
44010
335104
1,580284%270174403435297
2506.3413
2030
28100
266123
70061
2880.10
27315
1,150207%209146304281210
2894.0
1,302
2040
14000
13722
90090
14900
1463
571102%1229814714063
3261.8
2,209
2050
22002111
1400140
3600351
17331%3448492220
3580.5
2,908
2009
49210
24622520
00000
49210
246245
1,510271%266177334492241
2037.40
2015
20020
31200
6,4766,084
62246840
6,4816,085
63248850
6%
164
2020
100091
123630
6,8545,840
94562212145
6,8755,843100571216145
13%
429
2030
6600607
1222157414
7,2404,713146
1,389491500
7,4284,734203
1,449538504
34%
909
2040
13100
11813
4545118519820
7,4392,845209
2,836815734
8,0242,897394
2,9541,026754
63%
1,334
2050
21900
19722
7038021834461
7,504815290
4,2281,342829
8,426895508
4,4261,708890
89%
1,939
2009
00000
00000
5,8345,807
20510
5,8345,807
20510
0
0
table 12.89: middle east: final energy demandPJ/a

316
WORLD ENERGY [R]EVOLUTIONA SUSTAINABLE WORLD ENERGY OUTLOOK
middle east: investment & employment
12
glo
ssary &
appen
dix
|APPENDIX - M
IDDLE EAST
table 12.90: middle east: total investment in power sectorMILLION $ 2041-2050
109,07568,8833,95319,09811,89511,571
022,366
0
1,1471,542,690
12,06419,098314,384260,12043,084857,20536,735
2011-2050
481,203235,14811,865104,64131,88329,883
1556,862
0
151,8013,688,626
40,056104,641691,852778,892163,058
1,801,067109,060
2011-2050AVERAGEPER YEAR
12,0305,879297
2,6167977470
1,4220
3,79592,2161,0012,61617,29619,4724,07645,0272,726
2031-2040
145,21240,6983,46812,7809,5516,071
158,814
0
59,679851,72211,55512,780185,382260,19576,486263,80141,523
2021-2030
90,38563,9162,67228,4267,7957,795
017,229
0
5,271864,9049,00928,426148,390160,93021,433481,22615,490
2011-2020
136,53161,6511,77344,3382,6414,446
08,454
0
85,704429,3107,42844,33843,69597,64722,055198,83515,311
Reference scenario
Conventional (fossil & nuclear)RenewablesBiomassHydroWindPVGeothermalSolar thermal power plantsOcean energy
Energy [R]evolution
Conventional (fossil & nuclear)RenewablesBiomassHydroWindPVGeothermalSolar thermal power plantsOcean energy
table 12.91: middle east: total investment in renewable heating only (EXCLUDING INVESTMENTS IN FOSSIL FUELS)
2041-2050
14,5433,932
01,8208,791
333,63012,15889,063111,994120,415
2011-2050
37,54717,143
06,24314,161
950,84345,342235,845352,561317,095
2011-2050AVERAGEPER YEAR
9394290
156354
23,7711,1345,8968,8147,927
2031-2040
10,2185,345
01,9552,917
305,45715,24062,093127,816100,310
2021-2030
7,0874,471
01,0681,548
159,5096,11232,84357,39263,162
2011-2020
5,7003,396
01,399905
152,24811,83351,84655,36033,209
MILLION $
Reference scenario
RenewablesBiomassGeothermalSolarHeat pumps
Energy [R]evolution scenario
RenewablesBiomassGeothermalSolarHeat pumps
table 12.92: middle east: total employment THOUSAND JOBS
2010
1235051900
192.81,317
71,228
9737
272.01.00.03.1
-33-
1,317
2015
902770960
196.31,344
21,241
148710363.0120.02.6
-240.2
1,344
2020
632179
1,057203.41,422
11,340
156613285.33.60.0
10.8-
5.00.3
1,422
REFERENCE ENERGY [R]EVOLUTION2030
452189
1,182142.91,479
11,409
56419245.76.70.03.9
-3.70.6
1,479
2015
45211986935
206.71,798
11,184
0613343646
2117.09617
14324
1,798
2020
485126127
1,029212.91,980
11,237
0742692784
1514.621414
14335
1,980
2030
40010919682187.21,613
18630
7499225
11326710
113227730
1,613
By sectorConstruction and installationManufacturingOperations and maintenanceFuel supply (domestic)Coal and gas exportTotal jobs
By technologyCoalGas, oil & dieselNuclearTotal renewables
BiomassHydroWindPVGeothermal powerSolar thermal powerOceanSolar - heatGeothermal & heat pump
Total jobs

317
eastern europe/eurasia: scenario results data
12
glo
ssary &
appen
dix
|APPENDIX - E
ASTERN EUROPE/EURASIA
image LOCATED JUST 600 MILES (970 KILOMETERS) FROM THE NORTH POLE, FRANZ JOSEF LAND, RUSSIA, IS PERPETUALLY COATED WITH ICE. GLACIERS COVER ROUGHLY 85 PERCENT OF THE ARCHIPELAGO’S LAND MASSES, AND SEA ICE FLOATS IN THE CHANNELS BETWEEN ISLANDS EVEN IN THE SUMMERTIME.
© NASA/JESSE ALLEN

318
WORLD ENERGY [R]EVOLUTIONA SUSTAINABLE WORLD ENERGY OUTLOOK
eastern europe/eurasia: reference scenario
12
glo
ssary &
appen
dix
|APPENDIX - E
ASTERN EUROPE/EURASIA
Condensation power plantsCoalLigniteGasOilDiesel
Combined heat & power productionCoalLigniteGasOil
CO2 emissions power generation (incl. CHP public)CoalLigniteGasOil & diesel
CO2 emissions by sector% of 1990 emissionsIndustry1)Other sectors1)TransportPower generation2)District heating & other conversion
Population (Mill.)CO2 emissions per capita (t/capita)
1) including CHP autoproducers. 2) including CHP public
District heatingFossil fuelsBiomassSolar collectorsGeothermal
Heat from CHP Fossil fuelsBiomassGeothermalHydrogen
Direct heating1)Fossil fuelsBiomassSolar collectorsGeothermal2)
Total heat supply1)Fossil fuelsBiomassSolar collectorsGeothermal2)Hydrogen
RES share (including RES electricity)
1) heat from electricity (direct) not included; 2) including heat pumps.
2015
31,28828,2846,6784,3791,780
53466810
2.0%
9,2022,324406
2,10039
1,229906
2,56008200
5.7%
12,4042,097366
3,77459369
1,2454,456
64545
7.2%
1,5505.5%
3,0031,3991,512
92
2020
33,71230,4937,0844,7171,834
51482810
1.9%
10,0222,640447
2,12243
1,304950
2,91708800
5.8%
13,3872,413408
3,97865399
1,2654,843
54787
7.2%
1,6735.5%
3,2201,4991,621
99
2030
38,03634,3718,0275,4211,972
59572983
2.0%
11,2693,181546
2,24950
1,3641,0533,311
011100
6.3%
15,0752,968509
4,24473431
1,2515,618
105439
7.6%
2,0115.8%
3,6651,7061,845113
2040
42,38738,3559,0076,1552,078
667031334
2.2%
12,6233,765711
2,47063
1,3221,1503,764
015200
7.3%
16,7253,517664
4,54788389
1,2696,339
1461139
8.5%
2,5426.6%
4,0321,8782,030124
2050
46,40142,1629,9596,9502,120
748081557
2.3%
13,9724,388840
2,88983
1,1391,1544,218
018400
7.9%
18,2304,080781
5,000111207
1,2886,908
1868345
9.0%
2,9767.1%
4,2391,9742,135131
Total (incl. non-energy use)Total (energy use)TransportOil productsNatural gasBiofuelsElectricity
RES electricityHydrogenRES share Transport
IndustryElectricity
RES electricityDistrict heat
RES district heatCoalOil productsGasSolarBiomass and wasteGeothermal/ambient heatHydrogenRES share Industry
Other SectorsElectricity
RES electricityDistrict heat
RES district heatCoalOil productsGasSolarBiomass and wasteGeothermal/ambient heatRES share Other Sectors
Total RESRES share
Non energy useOilGasCoal
2009
28,21325,3205,5983,8231,375
28372680
1.7%
8,1441,858343
2,09817525887
2,71905700
5.1%
11,5771,923355
3,69925368967
4,1753
4365
7.1%
1,3375.3%
2,8941,3841,439
70
table 12.93: eastern europe/eurasia: electricity generationTWh/a
table 12.96: eastern europe/eurasia: installed capacity GW
table 12.97: eastern europe/eurasia: primary energy demandPJ/a
table 12.95: eastern europe/eurasia: co2 emissionsMILL t/a
table 12.94: eastern europe/eurasia: heat supplyPJ/a
2015
9679410313290
3093
3041011300
8901647962616500
82565
1,8571,224258182759260
3090
32430410117300
1872870
1,357
110.6%17.4%
2020
1,1699912621780
3766
3161522500
9011647364314600
83071
2,0691,344263199860220
3760
350316152212500
2003070
1,537
170.8%16.9%
2030
1,55011016742730
426213523043900
916163706688800
83581
2,4661,616273237
1,095110
4260
423352304329900
2263471
1,867
331.4%17.2%
2040
1,91513523457740
4383539672691500
9321586769341010
84092
2,8471,871292301
1,27080
4380
5373967269451600
2393662
2,218
812.8%18.9%
2050
2,30515827979141
463464311008131900
9471526171921220
845102
3,2522,166310340
1,51061
4630
623431100813582100
2573942
2,577
1133.5%19.2%
Power plantsCoalLigniteGasOilDieselNuclearBiomassHydroWind
of which wind offshorePVGeothermalSolar thermal power plantsOcean energy
Combined heat & power plantsCoalLigniteGasOilBiomassGeothermalHydrogenCHP by producerMain activity producersAutoproducers
Total generationFossilCoalLigniteGasOilDiesel
NuclearHydrogenRenewablesHydroWindof which wind offshore
PVBiomassGeothermalSolar thermalOcean energy
Distribution lossesOwn consumption electricityElectricity for hydrogen productionFinal energy consumption (electricity)
Fluctuating RES (PV, Wind, Ocean)Share of fluctuating RESRES share (domestic generation)
2009
758636348123
2760
292100000
8501668457324300
79753
1,6081,035229147621363
2760
2962921003000
1832480
1,154
10.0%18.4%
2015
2302225298045194501000
204391913312100
19311
4342876243161210450
102945011000
61.4%23.5%
2020
2652228476053197811100
199371613510100
18712
4633015944182160530
109978112100
92.0%23.6%
2030
33022338520594
1071423200
18333141324100
16815
513324544721760590
13010714235200
173.3%25.4%
2040
409254311030606
1193427300
17729121321100
15918
586356545624240600
17011934278300
417.0%29.0%
2050
496295115030638
13047310300
18029111370200
15920
675412586328730630
2001304731010300
578.5%29.7%
Power plantsCoalLigniteGasOilDieselNuclearBiomassHydroWind
of which wind offshorePVGeothermalSolar thermal power plantsOcean energy
Combined heat & power productionCoalLigniteGasOilBiomassGeothermalHydrogenCHP by producerMain activity producersAutoproducers
Total generationFossilCoalLigniteGasOilDiesel
NuclearHydrogenRenewablesHydroWindof which wind offshore
PVBiomassGeothermalSolar thermalOcean energy
Fluctuating RES (PV, Wind, Ocean)Share of fluctuating RESRES share (domestic generation)
2009
1881717118242090000000
218462313414100
2099
406273634014622242091900001000
00.1%22.4%
2015
51,60745,9987,9412,72625,5159,817
3,3872,2221,093
359
1,003820
4.3%
2020
55,03448,4828,0862,80727,25810,331
4,1182,4341,140
5511
1,0881400
4.4%
2030
61,44453,7648,4173,08331,13211,132
4,6653,0151,26810921
1,3902270
4.9%
2040
66,94858,3558,3223,76134,19412,078
4,7943,7991,42525945
1,6913780
5.7%
2050
69,23959,8237,9594,22534,67812,961
5,0684,3471,55336064
1,9474240
6.3%
TotalFossilHard coalLigniteNatural gasCrude oil
NuclearRenewablesHydroWindSolarBiomassGeothermal/ambient heatOcean energyRES share
2009
47,31542,3137,1382,18224,0698,923
3,0311,9721,053
23
893220
4.1%
2015
403127138117201
91822110655636
1,32234724467357
2,67166%361375296
1,259380
3407.9
2020
489128164177191
8712149552636
1,36034225970356
2,81270%392403324
1,296396
3418.2
2030
673138210313121
8072058748826
1,48034329780140
3,11377%430449392
1,412429
3379.2
2040
826136286388152
7801938149115
1,60732936787932
3,41585%463490456
1,533473
33110.3
2050
802124340319172
775185755096
1,57831041582825
3,55788%478512515
1,502550
32411.0
2009
233906948214
97923712058240
1,21232718963066
2,48362%318346262
1,158399
3397.3
2015
3,3083,20710100
3,9743,938
3600
10,0539,59844565
17,33516,742
582650
3.4%
2020
3,5493,44110900
4,0113,966
4500
10,92610,432
48157
18,48617,839
635670
3.5%
2030
3,9893,86712200
4,0594,001
5800
12,27011,673
5761010
20,31819,541
75610100
3.8%
2040
4,5914,45014000
4,1084,027
7380
13,53412,799
6721450
22,23321,276
88614580
4.3%
2050
5,6215,44917200
4,1594,049
90200
14,32113,484
7631857
24,10222,9821,025
18770
4.6%
2009
3,3203,225
9500
3,8663,843
2300
9,1028,68840437
16,28815,755
523370
3.3%
table 12.98: eastern europe/eurasia: final energy demandPJ/a

Condensation power plantsCoalLigniteGasOilDiesel
Combined heat & power productionCoalLigniteGasOil
CO2 emissions power generation (incl. CHP public)CoalLigniteGasOil & diesel
CO2 emissions by sector% of 1990 emissionsIndustry1)Other sectors1)TransportPower generation2)District heating & other conversion
Population (Mill.)CO2 emissions per capita (t/capita)‘Efficiency’ savings (compared to Ref.)
1) including CHP autoproducers. 2) including CHP public
District heatingFossil fuelsBiomassSolar collectorsGeothermal
Heat from CHP Fossil fuelsBiomassGeothermalHydrogen
Direct heating1)Fossil fuelsBiomassSolar collectorsGeothermal2)Hydrogen
Total heat supply1)Fossil fuelsBiomassSolar collectorsGeothermal1)Hydrogen
RES share (including RES electricity)‘Efficiency’ savings (compared to Ref.)
1) heat from electricity (direct) not included; geothermal includes heat pumps
319
eastern europe/eurasia: energy [r]evolution scenario
12
glo
ssary &
appen
dix
|APPENDIX - E
ASTERN EUROPE/EURASIA
2015
29,60526,6916,0313,9601,5051084581040
3.5%
8,6682,217505
2,122122641692
2,69939199600
10.7%
11,9922,097478
3,753210348689
4,229140562175
13.0%
2,70110.1%
2,9131,1651,602146
2020
30,00427,0426,0983,7711,41332057718717
8.4%
8,8772,398779
2,235339580410
2,268116615136119
22.8%
12,0672,264735
3,751556289453
3,652465767427
24.4%
5,48620.3%
2,962889
1,777296
2030
28,77525,8445,3282,5331,084491
1,119638101
22.3%
8,7702,6101,4892,33180236691
1,531293998218333
45.5%
11,7462,5421,4503,6451,267135268
2,137945
1,0231,05048.8%
10,91142.2%
2,932879
1,466586
2040
27,28124,3784,5401,207720552
1,7021,396360
49.4%
8,5422,7742,2762,3791,512
079815430978434652
72.2%
11,2962,7512,2573,5132,318
32122926
1,210982
1,75875.5%
16,93769.5%
2,903697
1,0451,161
2050
25,58822,8324,012559464439
1,8451,730705
70.5%
8,1162,8802,7002,2411,932
035117450842648902
91.4%
10,7052,9142,7313,2862,978
016232
1,250870
2,13793.1%
20,21588.5%
2,7551,102551
1,102
Total (incl. non-energy use)Total (energy use)TransportOil productsNatural gasBiofuelsElectricity
RES electricityHydrogenRES share Transport
IndustryElectricity
RES electricityDistrict heat
RES district heatCoalOil productsGasSolarBiomass and wasteGeothermal/ambient heatHydrogenRES share Industry
Other SectorsElectricity
RES electricityDistrict heat
RES district heatCoalOil productsGasSolarBiomass and wasteGeothermal/ambient heatRES share Other Sectors
Total RESRES share
Non energy useOilGasCoal
2009
28,21325,3205,5983,8231,375
28372680
1.7%
8,1441,858343
2,09817525887
2,71905700
5.1%
11,5771,923355
3,69925368967
4,1753
4365
7.1%
1,3375.3%
2,8941,3841,439
70
table 12.99: eastern europe/eurasia: electricity generationTWh/a
table 12.102: eastern europe/eurasia: installed capacity GW
table 12.103: eastern europe/eurasia: primary energy demandPJ/a
table 12.101: eastern europe/eurasia: co2 emissionsMILL t/a
table 12.100: eastern europe/eurasia: heat supplyPJ/a
2015
954817310390
285163354601302
89115677629111440
82566
1,8451,139237150732200
2850
421335460130702
1952990
1,325
492.6%22.8%
30
2020
1,143756413730
26925350188188115
89115259611352140
82071
2,0341,10522812374860
2690
661350188187722115
19630256
1,455
21110.4%32.5%109
2030
1,590611814520
1504636067377128532
847131155241
127480
76483
2,4378961913366930
1500
1,39036067377117376532
197303170
1,742
77631.9%57.1%277
2040
2,1583407400046375
1,30316198602442
747460
3660
2121230
65394
2,905521800
4401000
2,383375
1,303161982581832442
193297385
2,007
1,54353.1%82.1%488
2050
2,594001901020380
1,634253271333644
62000
1810
2741650
520100
3,21420100
2001100
3,013380
1,634253272942973644
187288595
2,122
2,00562.4%93.7%743
Power plantsCoalLigniteGasOilDieselNuclearBiomassHydroWind
of which wind offshorePVGeothermalSolar thermal power plantsOcean energy
Combined heat & power plantsCoalLigniteGasOilBiomassGeothermalHydrogenCHP by producerMain activity producersAutoproducers
Total generationFossilCoalLigniteGasOilDiesel
NuclearHydrogenRenewablesHydroWindof which wind offshore
PVBiomassGeothermalSolar thermalOcean energy
Distribution lossesOwn consumption electricityElectricity for hydrogen productionFinal energy consumption (electricity)
Fluctuating RES (PV, Wind, Ocean)Share of fluctuating RESRES share (domestic generation)‘Efficiency’ savings (compared to Ref.)
2009
758636348123
2760
292100000
8501668457324300
79753
1,6081,035229147621363
2760
2962921003000
1832480
1,154
10.0%18.4%
0
2015
24218182280424
1042501001
20037181338310
18911
4422625536155160420
13810425017101
276.0%31.3%
2020
32717143020385
1089817106
194341313321120
18212
521245512716340380
238108981716406
11021.2%45.6%
2030
5981243610219
1093283605212
194263
12902780
17618
792211387
16510210
5601093283603613212
40150.6%70.7%
2040
96660190009
1136196
16311816
1708093048210
14723
1,137128150
1120000
1,0091136196
1635732816
79970.3%88.8%
2050
1,2270050004
11477610270271217
1360046062280
11224
1,3645200510000
1,3121147761027066561217
1,06478.0%96.2%
Power plantsCoalLigniteGasOilDieselNuclearBiomassHydroWind
of which wind offshorePVGeothermalSolar thermal power plantsOcean energy
Combined heat & power productionCoalLigniteGasOilBiomassGeothermalHydrogenCHP by producerMain activity producersAutoproducers
Total generationFossilCoalLigniteGasOilDiesel
NuclearHydrogenRenewablesHydroWindof which wind offshore
PVBiomassGeothermalSolar thermalOcean energy
Fluctuating RES (PV, Wind, Ocean)Share of fluctuating RESRES share (domestic generation)
2009
1881717118242090000000
218462313414100
2099
406273634014622242091900001000
00.1%22.4%
2015
48,93441,4206,6892,14024,7077,884
3,1254,3881,206166213
2,1606367
8.9%2,668
2020
48,53936,9706,5231,60922,5396,298
2,9478,6221,260677708
4,2371,686
5417.7%6,393
2030
44,39726,6545,701421
16,3134,219
1,64216,1011,2962,4251,7246,4904,051115
36.2%16,918
2040
40,40215,6544,261
09,0732,319
024,7491,3504,6922,7607,7028,093151
61.2%26,423
2050
37,3218,0553,274
02,9491,833
029,2651,3685,8843,5447,63010,681
15878.4%31,773
TotalFossilHard coalLigniteNatural gasCrude oil
NuclearRenewablesHydroWindSolarBiomassGeothermal/ambient heatOcean energyRES share‘Efficiency’ savings (compared to Ref.)
2009
47,31542,3137,1382,18224,0698,923
3,0311,9721,053
23
893220
4.1%0
2015
279699991191
89621010355924
1,17527920265044
2,35358%308324272
1,115334
3406.9319
2020
258648410271
782198765008
1,04026216060215
2,06251%253270266988284
3416.0750
2030
16850228861
569164193833
7382144147210
1,39234%165156195691185
3374.1
1,721
2040
692803812
317560
2592
386840
2985
69517%93689934293
3312.1
2,720
2050
1100912
13000
1282
14100
1375
2436%44174810430
3240.7
3,314
2009
233906948214
97923712058240
1,21232718963066
2,48362%318346262
1,158399
3397.30
2015
3,2262,9361613297
3,9683,845
85380
9,4858,3796341792940
16,68015,160
8802114280
9%
655
2020
3,2282,55032397258
4,0413,6163021230
9,4096,8841,174581656113
16,67813,0501,799678
1,038113
21%
1,808
2030
3,0291,727606212485
4,1082,9597144350
8,9164,0431,7791,2381,540316
16,0538,7293,0981,4502,460316
45%
4,265
2040
2,913816757320
1,019
4,0041,7201,1761,108
0
8,4011,7311,7251,6412,684620
15,3184,2673,6591,9614,811620
71%
6,915
2050
2,557128614537
1,279
3,768763
1,5231,482
0
7,748283
1,5071,7003,402857
14,0741,1743,6432,2376,162857
91%
10,028
2009
3,3203,225
9500
3,8663,843
2300
9,1028,688404370
16,28815,755
523370
3.3%
0
table 12.104: eastern europe/eurasia: final energy demandPJ/a
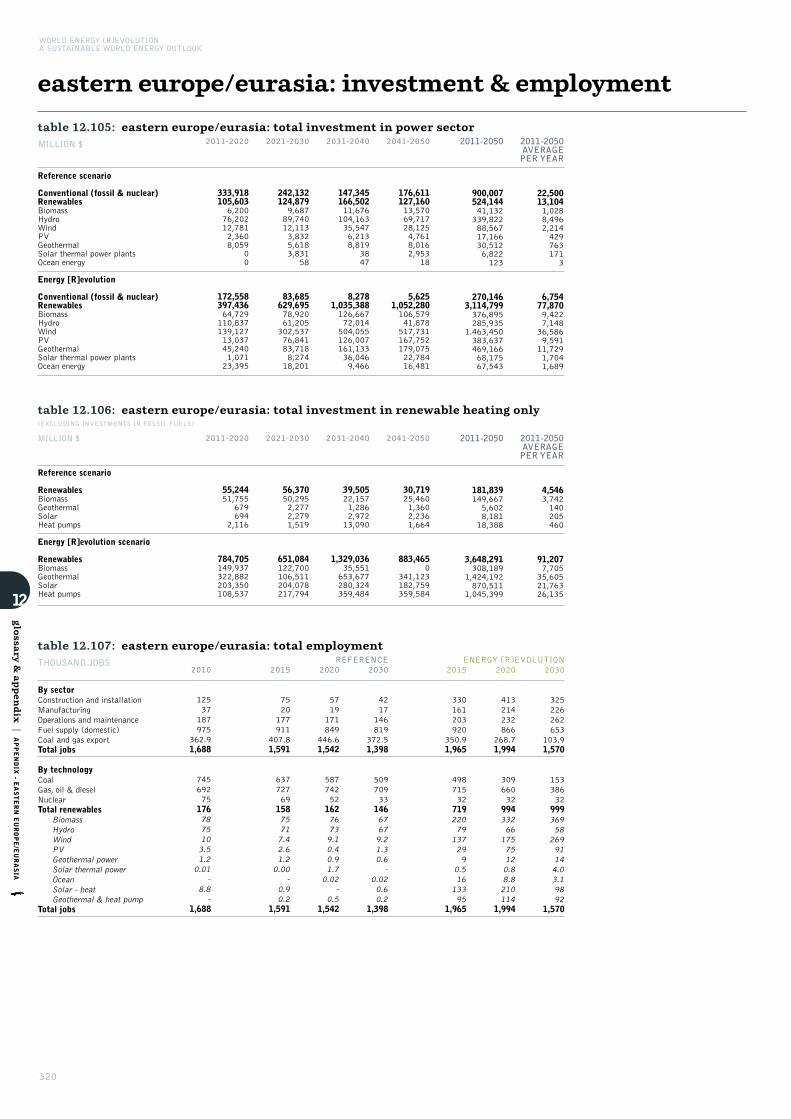
320
WORLD ENERGY [R]EVOLUTIONA SUSTAINABLE WORLD ENERGY OUTLOOK
eastern europe/eurasia: investment & employment
12
glo
ssary &
appen
dix
|APPENDIX - E
ASTERN EUROPE/EURASIA
table 12.105: eastern europe/eurasia: total investment in power sectorMILLION $ 2041-2050
176,611127,16013,57069,71728,1254,7618,0162,953
18
5,6251,052,280106,57941,878517,731167,752179,07522,78416,481
2011-2050
900,007524,14441,132339,82288,56717,16630,5126,822123
270,1463,114,799376,895285,935
1.463,450383,637469,16668,17567,543
2011-2050AVERAGEPER YEAR
22,50013,1041,0288,4962,2144297631713
6,75477,8709,4227,14836,5869,59111,7291,7041,689
2031-2040
147,345166,50211,676104,16335,5476,2138,819
3847
8,2781,035,388126,66772,014504,055126,007161,13336,0469,466
2021-2030
242,132124,8799,68789,74012,1133,8325,6183,831
58
83,685629,69578,92061,205302,53776,84183,7188,27418,201
2011-2020
333,918105,6036,20076,20212,7812,3608,059
00
172,558397,43664,729110,837139,12713,03745,2401,07123,395
Reference scenario
Conventional (fossil & nuclear)RenewablesBiomassHydroWindPVGeothermalSolar thermal power plantsOcean energy
Energy [R]evolution
Conventional (fossil & nuclear)RenewablesBiomassHydroWindPVGeothermalSolar thermal power plantsOcean energy
table 12.106: eastern europe/eurasia: total investment in renewable heating only (EXCLUDING INVESTMENTS IN FOSSIL FUELS)
2041-2050
30,71925,4601,3602,2361,664
883,4650
341,123182,759359,584
2011-2050
181,839149,6675,6028,18118,388
3,648,291308,189
1,424,192870,511
1,045,399
2011-2050AVERAGEPER YEAR
4,5463,742140205460
91,2077,70535,60521,76326,135
2031-2040
39,50522,1571,2862,97213,090
1,329,03635,551653,677280,324359,484
2021-2030
56,37050,2952,2772,2791,519
651,084122,700106,511204,078217,794
2011-2020
55,24451,755
679694
2,116
784,705149,937322,882203,350108,537
MILLION $
Reference scenario
RenewablesBiomassGeothermalSolarHeat pumps
Energy [R]evolution scenario
RenewablesBiomassGeothermalSolarHeat pumps
table 12.107: eastern europe/eurasia: total employment THOUSAND JOBS
2010
12537187975
362.91,688
745692751767875103.51.2
0.01-
8.8-
1,688
2015
7520177911
407.81,591
6377276915875717.42.61.2
0.00-
0.90.2
1,591
2020
5719171849
446.61,542
5877425216276739.10.40.91.7
0.02-
0.51,542
REFERENCE ENERGY [R]EVOLUTION2030
4217146819
372.51,398
5097093314667679.21.30.6
-0.020.60.2
1,398
2015
330161203920
350.91,965
4987153271922079
137299
0.516
13395
1,965
2020
413214232866
268.71,994
3096603299433266
17575120.88.8210114
1,994
2030
325226262653
103.91,570
1533863299936958
26991144.03.19892
1,570
By sectorConstruction and installationManufacturingOperations and maintenanceFuel supply (domestic)Coal and gas exportTotal jobs
By technologyCoalGas, oil & dieselNuclearTotal renewables
BiomassHydroWindPVGeothermal powerSolar thermal powerOceanSolar - heatGeothermal & heat pump
Total jobs
321
india: scenario results data
12
glo
ssary &
appen
dix
|APPENDIX - IN
DIA
image HIGH SEASONAL WATERS ALONG THE INDIA-NEPAL BORDER, 2009.
© NASA

322
WORLD ENERGY [R]EVOLUTIONA SUSTAINABLE WORLD ENERGY OUTLOOK
india: reference scenario
12
glo
ssary &
appen
dix
|APPENDIX - IN
DIA
Condensation power plantsCoalLigniteGasOilDiesel
Combined heat & power productionCoalLigniteGasOil
CO2 emissions power generation (incl. CHP public)CoalLigniteGasOil & diesel
CO2 emissions by sector% of 1990 emissionsIndustry1)Other sectors1)TransportPower generation2)District heating & other conversion
Population (Mill.)CO2 emissions per capita (t/capita)
1) including CHP autoproducers. 2) including CHP public
District heatingFossil fuelsBiomassSolar collectorsGeothermal
Heat from CHP Fossil fuelsBiomassGeothermalHydrogen
Direct heating1)Fossil fuelsBiomassSolar collectorsGeothermal2)
Total heat supply1)Fossil fuelsBiomassSolar collectorsGeothermal2)Hydrogen
RES share (including RES electricity)
1) heat from electricity (direct) not included; 2) including heat pumps.
2015
22,11119,9622,3712,152
995565100
2.7%
7,6511,77627720
3,0221,1803580
1,31300
20.8%
9,9401,83628600
6911,474
2423
5,8912
62.4%
7,85639.4%
2,1491,4566930
2020
25,99723,5283,3723,0891228377110
2.8%
9,2862,35234170
3,8971,2724800
1,27900
17.4%
10,8702,40234800
7061,688
5528
5,9873
58.6%
8,08034.3%
2,4691,6737960
2030
34,88531,8206,8466,27627719598150
3.1%
12,3333,575535240
5,2991,4096750
1,35000
15.3%
12,6413,87758000
6571,97216647
5,90716
51.8%
8,64427.2%
3,0652,0779880
2040
45,96142,26112,34511,095
680440131190
3.7%
15,4174,933725530
6,6171,5259006
1,38300
13.7%
14,4995,60682400
5222,17332284
5,75736
46.2%
9,27321.9%
3,7002,5071,193
0
2050
57,87753,54218,54416,6631,009670201300
3.8%
18,6156,425952930
7,7261,7751,122
331,442
00
13.0%
16,3837,3521,090
00
3082,410523126
5,61055
42.0%
10,00718.7%
4,3352,9381,397
0
Total (incl. non-energy use)Total (energy use)TransportOil productsNatural gasBiofuelsElectricity
RES electricityHydrogenRES share Transport
IndustryElectricity
RES electricityDistrict heat
RES district heatCoalOil productsGasSolarBiomass and wasteGeothermal/ambient heatHydrogenRES share Industry
Other SectorsElectricity
RES electricityDistrict heat
RES district heatCoalOil productsGasSolarBiomass and wasteGeothermal/ambient heatRES share Other Sectors
Total RESRES share
Non energy useOilGasCoal
2009
18,81017,1832,1562,021
8374560
0.6%
5,6951,17515400
1,8749824690
1,19500
23.7%
9,3321,30917100
1,0351,294
711
5,6760
62.8%
7,22042.0%
1,6271,1035250
table 12.108: india: electricity generationTWh/a
table 12.111: india: installed capacity GW
table 12.112: india: primary energy demand PJ/a
table 12.110: india: co2 emissionsMILL t/a
table 12.109: india: heat supplyPJ/a
2015
1,29884931146240447
14741110000
2119020000
021
1,3191,07086831148240440
206147411107000
240680
1,021
523.9%16%
2020
1,7241,146
42187250671516858215000
4541050000
045
1,7691,4461,187
42192250670
2561685821515000
3371010
1,342
734.1%14%
2030
2,7121,736
66343230
1265623587440100
8476080000
084
2,7962,2521,812
66351230
1260
4182358744056100
5321770
2,097
1264.5%15%
2040
3,9002,439107556200
186108299112669111
1231110120000
0123
4,0223,2452,549107569200
1860
591299112669108111
7812890
2,964
1824.5%15%
2050
5,0703,096164770180
2461593641378
109132
1621450160000
0162
5,2314,2093,242164786180
2460
7753641378
109159132
9663950
3,883
2484.7%15%
Power plantsCoalLigniteGasOilDieselNuclearBiomassHydroWind
of which wind offshorePVGeothermalSolar thermal power plantsOcean energy
Combined heat & power plantsCoalLigniteGasOilBiomassGeothermalHydrogenCHP by producerMain activity producersAutoproducers
Total generationFossilCoalLigniteGasOilDiesel
NuclearHydrogenRenewablesHydroWindof which wind offshore
PVBiomassGeothermalSolar thermalOcean energy
Distribution lossesOwn consumption electricityElectricity for hydrogen productionFinal energy consumption (electricity)
Fluctuating RES (PV, Wind, Ocean)Share of fluctuating RESRES share (domestic generation)
2009
97066620112260192
1071800000
00000000
00
97082466620112260190
12710718002000
220580
702
181.9%13%
2015
2991646338073492307000
55000000
05
3042161696348070814923073000
3010%27%
2020
354186744801045530110000
1110010000
011
365256196745801009955301104000
4011%27%
2030
55928911788019107742126000
2019020000
020
580406308117980190
155774212610000
6812%27%
2040
796408181237027189851244000
3027020000
030
8265864351812670270
213985124418000
9612%26%
2050
1,0345182717160362711960268010
4036030000
040
1,0747625542717460360
2761196026827010
12812%26%
Power plantsCoalLigniteGasOilDieselNuclearBiomassHydroWind
of which wind offshorePVGeothermalSolar thermal power plantsOcean energy
Combined heat & power productionCoalLigniteGasOilBiomassGeothermalHydrogenCHP by producerMain activity producersAutoproducers
Total generationFossilCoalLigniteGasOilDiesel
NuclearHydrogenRenewablesHydroWindof which wind offshore
PVBiomassGeothermalSolar thermalOcean energy
Fluctuating RES (PV, Wind, Ocean)Share of fluctuating RESRES share (domestic generation)
2009
186993207052391100000
00000000
00
186130993207050523911002000
116%28%
2015
32,80324,17314,195
4462,3277,206
4838,14652814961
7,40170
24.8%
2020
40,50931,26018,964
5662,9418,789
7268,52360620882
7,614130
21.0%
2030
55,45844,39825,905
7394,78512,969
1,3779,684847312191
8,299341
17.4%
2040
73,30860,29633,1921,0787,30418,723
2,03310,9791,078402344
9,094574
15.0%
2050
88,95074,33437,8691,4749,63725,354
2,68911,9281,309493563
9,481767
13.4%
TotalFossilHard coalLigniteNatural gasCrude oil
NuclearRenewablesHydroWindSolarBiomassGeothermal/ambient heatOcean energyRES share
2009
29,04921,45612,758
3262,0056,366
2037,3913856511
6,93000
25.4%
2015
1,0359083365290
2120010
1,056928336629
1,924324%408174164
1,035143
1,3081.5
2020
1,3981,241
4680310
4644020
1,4441,285
468231
2,523425%527193235
1,398170
1,3871.8
2030
1,9551,725
66138270
7975040
2,0341,800
6614227
3,579604%711215478
1,955219
1,5232.3
2040
2,5972,258
99219210
112107050
2,7102,365
9922421
4,854819%887226856
2,597287
1,6273.0
2050
3,0252,580136292160
148141070
3,1722,72013629916
5,9811009%1,056235
1,2853,025380
1,6923.5
2009
9628482555330
00000
962848255533
1,704287%272192154962125
1,2081.4
2015
00000
22000
11,1755,3865,763
232
11,1775,3885,763
2320
51.8%
2020
00000
77000
12,3736,5285,813
285
12,3796,5345,813
2850
47.2%
2030
00000
2424000
14,2438,3425,833
4722
14,2688,3665,833
47220
41.4%
2040
00000
5353000
16,04510,0375,868
9049
16,09810,0905,868
90490
37.3%
2050
00000
9393000
17,95611,7305,99415973
18,04911,8235,994159730
34.5%
2009
00000
00000
9,9404,4315,497
110
9,9404,4315,497
1100
55.4%
table 12.113: india: final energy demandPJ/a
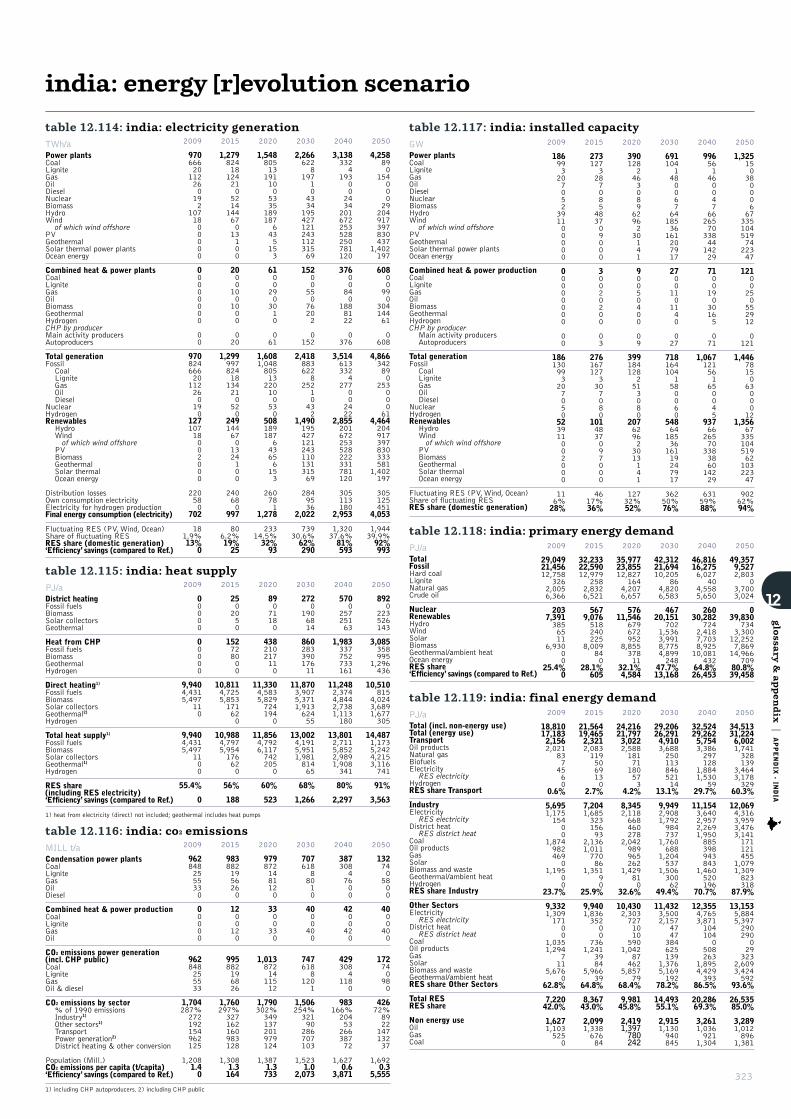
Condensation power plantsCoalLigniteGasOilDiesel
Combined heat & power productionCoalLigniteGasOil
CO2 emissions power generation (incl. CHP public)CoalLigniteGasOil & diesel
CO2 emissions by sector% of 1990 emissionsIndustry1)Other sectors1)TransportPower generation2)District heating & other conversion
Population (Mill.)CO2 emissions per capita (t/capita)‘Efficiency’ savings (compared to Ref.)
1) including CHP autoproducers. 2) including CHP public
District heatingFossil fuelsBiomassSolar collectorsGeothermal
Heat from CHP Fossil fuelsBiomassGeothermalHydrogen
Direct heating1)Fossil fuelsBiomassSolar collectorsGeothermal2)Hydrogen
Total heat supply1)Fossil fuelsBiomassSolar collectorsGeothermal1)Hydrogen
RES share (including RES electricity)‘Efficiency’ savings (compared to Ref.)
1) heat from electricity (direct) not included; geothermal includes heat pumps
323
india: energy [r]evolution scenario
12
glo
ssary &
appen
dix
|APPENDIX - IN
DIA
2015
21,56419,4652,3212,0831195069130
2.7%
7,2041,68532315693
2,1361,01177086
1,35190
25.9%
9,9401,83635200
7361,241
3984
5,96639
64.8%
8,36743.0%
2,0991,33867684
2020
24,21621,7973,0222,58818171180573
4.2%
8,3452,118668460278
2,042989965262
1,429810
32.6%
10,4302,3037271010590
1,04287462
5,85779
68.4%
9,98145.8%
2,4191,397780242
2030
29,20626,2914,9103,68825011384652114
13.1%
9,9492,9081,792984737
1,760688
1,204537
1,50630062
49.4%
11,4323,5002,157
4747384625139
1,3765,169192
78.2%
14,49355.1%
2,9151,130940845
2040
32,52429,2625,7543,386297128
1,8841,530
5929.7%
11,1543,6402,9572,2691,950885398943843
1,460520196
70.7%
12,3554,7653,8711041040
508263
1,8954,429393
86.5%
20,28669.3%
3,2611,036921
1,304
2050
34,51331,2246,0021,741328139
3,4643,178329
60.3%
12,0694,3163,9593,4763,141171121455
1,0791,309823318
87.9%
13,1535,8845,397290290029323
2,6093,424592
93.6%
26,53585.0%
3,2891,012896
1,381
Total (incl. non-energy use)Total (energy use)TransportOil productsNatural gasBiofuelsElectricity
RES electricityHydrogenRES share Transport
IndustryElectricity
RES electricityDistrict heat
RES district heatCoalOil productsGasSolarBiomass and wasteGeothermal/ambient heatHydrogenRES share Industry
Other SectorsElectricity
RES electricityDistrict heat
RES district heatCoalOil productsGasSolarBiomass and wasteGeothermal/ambient heatRES share Other Sectors
Total RESRES share
Non energy useOilGasCoal
2009
18,81017,1832,1562,021
8374560
0.6%
5,6951,17515400
1,8749824690
1,19500
23.7%
9,3321,30917100
1,0351,294
711
5,6760
62.8%
7,22042.0%
1,6271,1035250
table 12.114: india: electricity generationTWh/a
table 12.117: india: installed capacity GW
table 12.118: india: primary energy demand PJ/a
table 12.116: india: co2 emissionsMILL t/a
table 12.115: india: heat supplyPJ/a
2015
1,27982418124210521414467013100
20001001000
020
1,29999782418134210520
2491446701324100
240680
997
806.2%19%25
2020
1,5488051319110053351891876435153
61002903010
061
1,6081,04880513220100530
508189187643656153
260781
1,278
23314.5%32%93
2030
2,2666228
19710433419542712124311231569
1520055076202
0152
2,4188836228
25210432
1,49019542712124311013131569
2849536
2,022
73930.6%62%290
2040
3,1383324
193002434201672253528250781120
37600840
1888122
0376
3,5146133324
277002422
2,855201672253528222331781120
305113180
2,953
1,32037.6%81%593
2050
4,258890
15400029204917397830437
1,402197
60800990
30414461
0608
4,866342890
25300061
4,464204917397830333581
1,402197
305125451
4,053
1,94439.9%92%993
Power plantsCoalLigniteGasOilDieselNuclearBiomassHydroWind
of which wind offshorePVGeothermalSolar thermal power plantsOcean energy
Combined heat & power plantsCoalLigniteGasOilBiomassGeothermalHydrogenCHP by producerMain activity producersAutoproducers
Total generationFossilCoalLigniteGasOilDiesel
NuclearHydrogenRenewablesHydroWindof which wind offshore
PVBiomassGeothermalSolar thermalOcean energy
Distribution lossesOwn consumption electricityElectricity for hydrogen productionFinal energy consumption (electricity)
Fluctuating RES (PV, Wind, Ocean)Share of fluctuating RESRES share (domestic generation)‘Efficiency’ savings (compared to Ref.)
2009
97066620112260192
1071800000
00000000
00
97082466620112260190
12710718002000
220580
702
181.9%13%
0
2015
2731273287085483709000
30020200
03
2761671273307080
1014837097000
4617%36%
2020
39012824630896296230141
90050400
09
3991841282513080
207629623013141
12732%52%
2030
69110414800676418536161207917
27001101140
027
7181641041580060
548641853616119247917
36250%76%
2040
99656146004766265703384414229
710019030165
071
1,067121561650045
9376626570338386014229
63159%88%
2050
1,325150380006673351045197422347
12100250552912
0121
1,446781506300012
1,356673351045196210322347
90262%94%
Power plantsCoalLigniteGasOilDieselNuclearBiomassHydroWind
of which wind offshorePVGeothermalSolar thermal power plantsOcean energy
Combined heat & power productionCoalLigniteGasOilBiomassGeothermalHydrogenCHP by producerMain activity producersAutoproducers
Total generationFossilCoalLigniteGasOilDiesel
NuclearHydrogenRenewablesHydroWindof which wind offshore
PVBiomassGeothermalSolar thermalOcean energy
Fluctuating RES (PV, Wind, Ocean)Share of fluctuating RESRES share (domestic generation)
2009
186993207052391100000
00000000
00
186130993207050523911002000
116%28%
2015
32,23322,59012,979
2582,8326,521
5679,076518240225
8,009840
28.1%605
2020
35,97723,85512,827
1644,2076,657
57611,546
679672952
8,85537811
32.1%4,584
2030
42,31221,69410,205
864,8206,583
46720,151
7021,5363,9918,7754,899248
47.7%13,168
2040
46,81616,2756,027
404,5585,650
26030,282
7242,4187,7038,92510,081
43264.8%26,453
2050
49,3579,5272,803
03,7003,024
039,830
7343,30012,2527,86914,966
70980.8%39,458
TotalFossilHard coalLigniteNatural gasCrude oil
NuclearRenewablesHydroWindSolarBiomassGeothermal/ambient heatOcean energyRES share‘Efficiency’ savings (compared to Ref.)
2009
29,04921,45612,758
3262,0056,366
2037,3913856511
6,93000
25.4%0
2015
9838821956260
1200120
995882196826
1,760297%327162160983128
1,3081.3164
2020
9798721481120
3300330
1,0138721411512
1,790302%349137201979124
1,3871.3733
2030
70761888010
4000400
7476188
1201
1,506254%32190286707103
1,5231.0
2,073
2040
38730847600
4200420
4293084
1180
983166%2045326638772
1,6270.6
3,871
2050
1327405800
4000400
172740980
42672%892214713237
1,6920.3
5,555
2009
9628482555330
00000
962848255533
1,704287%272192154962125
1,2081.40
2015
2502050
152728000
10,8114,7255,853171620
10,9884,7975,954176620
56%
188
2020
89071180
438210217110
11,3304,5835,8297241940
11,8564,7926,1177422050
60%
523
2030
2720
1906814
86028339017611
11,8703,9075,3711,91362455
13,0024,1915,9511,98181465
68%
1,266
2040
5700
25725163
1,983337752733161
11,2482,3744,8442,7381,113180
13,8012,7115,8522,9891,908341
80%
2,297
2050
8920
223526143
3,085358995
1,296436
10,510815
4,0243,6891,677305
14,4871,1735,2424,2153,116741
91%
3,563
2009
00000
00000
9,9404,4315,497
110
9,9404,4315,497
1100
55.4%
0
table 12.119: india: final energy demandPJ/a

WORLD ENERGY [R]EVOLUTIONA SUSTAINABLE WORLD ENERGY OUTLOOK
india: investment & employment
12
glo
ssary &
appen
dix
|APPENDIX - IN
DIA
table 12.120: india: total investment in power sectorMILLION $ 2041-2050
399,127222,81740,348108,38128,40341,661
4823,118423
41,7441,747,500109,80946,703290,619327,627301,348621,62149,773
2011-2050
1,174,620730,10595,457382,307124,537119,6041,8785,3001,021
172,6284,503,008287,219201,317881,766811,991737,135
1,461,389122,190
2011-2050AVERAGEPER YEAR
29,36518,2532,3869,5583,1132,990
4713326
4,316112,5757,1805,03322,04420,30018,42836,5353,055
2031-2040
334,311199,06627,261102,26335,93131,512
4581,213429
23,8061,254,043104,12831,039266,757235,120241,948349,74125,309
2021-2030
261,422174,10919,99299,71829,34924,099
395389168
14,3561,124,349
28,51928,391196,461187,397181,149458,10744,324
2011-2020
179,759134,1127,85771,94630,85322,333
5445800
92,723377,11644,76395,184127,92961,84712,69031,9202,783
Reference scenario
Conventional (fossil & nuclear)RenewablesBiomassHydroWindPVGeothermalSolar thermal power plantsOcean energy
Energy [R]evolution
Conventional (fossil & nuclear)RenewablesBiomassHydroWindPVGeothermalSolar thermal power plantsOcean energy
table 12.121: india: total investment in renewable heating only (EXCLUDING INVESTMENTS IN FOSSIL FUELS)
2041-2050
18,6365,938
02,7769,921
329,78115,89457,992160,50095,396
2011-2050
444,401413,410
05,81725,175
1,292,801366,307108,039489,086329,368
2011-2050AVERAGEPER YEAR
11,11010,335
0145629
32,3209,1582,70112,2278,234
2031-2040
212,883203,736
01,5207,627
481,510175,20725,024164,293116,986
2021-2030
43,53536,244
0838
6,454
232,93244,14713,62790,29084,868
2011-2020
169,347167,492
0682
1,173
248,578131,06011,39774,00332,118
MILLION $
Reference scenario
RenewablesBiomassGeothermalSolarHeat pumps
Energy [R]evolution scenario
RenewablesBiomassGeothermalSolarHeat pumps
table 12.122: india: total employment THOUSAND JOBS
2010
494246135
1,530-
2,405
1,14216533
1,0648258567770.91.3
0.015.53.1
2,405
2015
221111152
1,233-
1,716
735134398096547045290.51.0
0.017.50.3
1,716
2020
327155154
1,159-
1,794
880138397385668240450.31.1
0.082.60.6
1,794
REFERENCE ENERGY [R]EVOLUTION2030
22799147987
-1,460
842156294323326417140.10.30.13.90.8
1,460
2015
404428161
1,310-
2,304
5821568
1,558754103316210
8373.910917
2,304
2020
591496200
1,125-
2,412
4671317
1,80865448
28029234
16124.429223
2,412
2030
393274190632
-1,488
2081203
1,15740034
14518726
1026.923323
1,488
By sectorConstruction and installationManufacturingOperations and maintenanceFuel supply (domestic)Coal and gas exportTotal jobs
By technologyCoalGas, oil & dieselNuclearTotal renewables
BiomassHydroWindPVGeothermal powerSolar thermal powerOceanSolar - heatGeothermal & heat pump
Total jobs
324
© NASA/ROBERT SIMMON
image THE IRRAWADDY DELTA, BURMA.
glo
ssary &
appen
dix
|APPENDIX - N
ON-OECD ASIA
non oecd asia: scenario results data
325
12
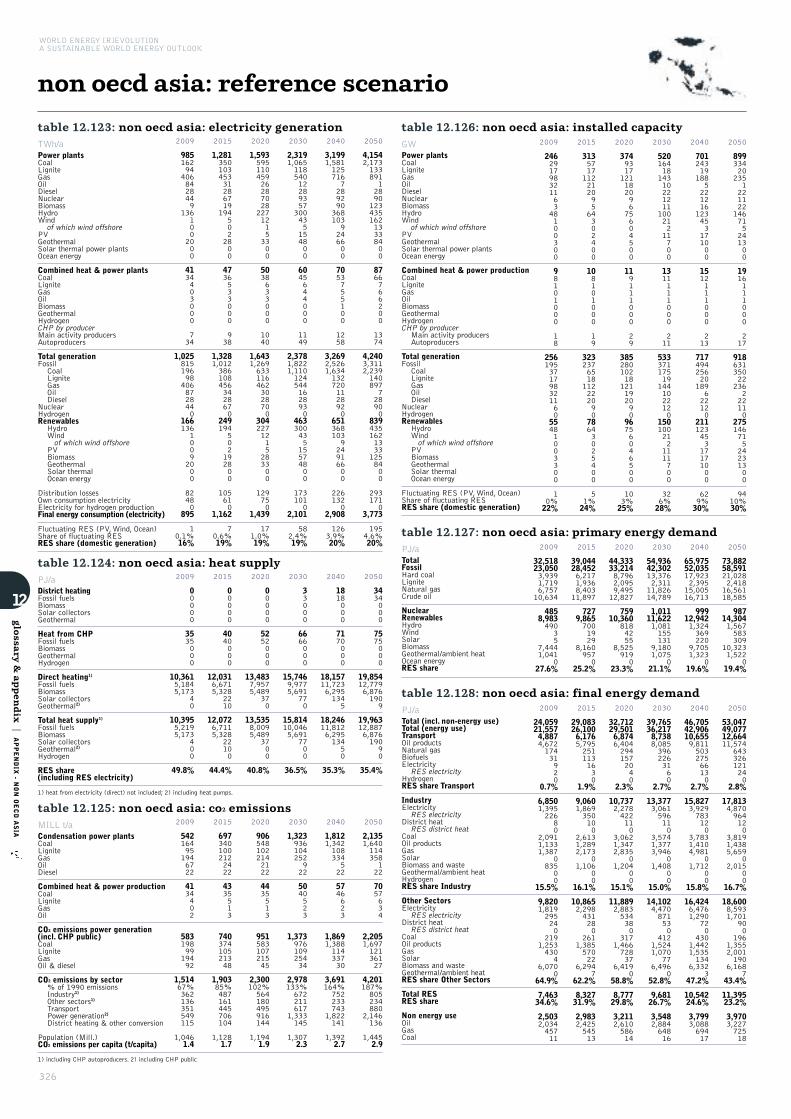
326
WORLD ENERGY [R]EVOLUTIONA SUSTAINABLE WORLD ENERGY OUTLOOK
non oecd asia: reference scenario
12
glo
ssary &
appen
dix
|APPENDIX - N
ON OECD ASIA
Condensation power plantsCoalLigniteGasOilDiesel
Combined heat & power productionCoalLigniteGasOil
CO2 emissions power generation (incl. CHP public)CoalLigniteGasOil & diesel
CO2 emissions by sector% of 1990 emissionsIndustry1)Other sectors1)TransportPower generation2)District heating & other conversion
Population (Mill.)CO2 emissions per capita (t/capita)
1) including CHP autoproducers. 2) including CHP public
District heatingFossil fuelsBiomassSolar collectorsGeothermal
Heat from CHP Fossil fuelsBiomassGeothermalHydrogen
Direct heating1)Fossil fuelsBiomassSolar collectorsGeothermal2)
Total heat supply1)Fossil fuelsBiomassSolar collectorsGeothermal2)Hydrogen
RES share (including RES electricity)
1) heat from electricity (direct) not included; 2) including heat pumps.
2015
29,08326,1006,1765,7952511131630
1.9%
9,0601,869350100
2,6131,2892,173
01,106
00
16.1%
10,8652,298431280
2611,38557022
6,2947
62.2%
8,32731.9%
2,9832,42554513
2020
32,71229,5016,8746,4042941572040
2.3%
10,7372,278422110
3,0621,3472,835
01,204
00
15.1%
11,8892,883534380
3171,46672837
6,4190
58.8%
8,77729.8%
3,2112,61058614
2030
39,76536,2178,7388,0853962263160
2.7%
13,3773,061596110
3,5741,3773,946
01,408
00
15.0%
14,1024,470871530
4121,5241,070
776,496
052.8%
9,68126.7%
3,5482,88464816
2040
46,70542,90610,6559,81150327566130
2.7%
15,8273,929783120
3,7831,4104,981
01,712
00
15.8%
16,4246,4761,290
720
4301,4421,535134
6,3323
47.2%
10,54224.6%
3,7993,08869417
2050
53,04749,07712,66411,574
643326121240
2.8%
17,8134,870964120
3,8191,4385,659
02,015
00
16.7%
18,6008,5931,701
900
1961,3552,001190
6,1687
43.4%
11,39523.2%
3,9703,22772518
Total (incl. non-energy use)Total (energy use)TransportOil productsNatural gasBiofuelsElectricity
RES electricityHydrogenRES share Transport
IndustryElectricity
RES electricityDistrict heat
RES district heatCoalOil productsGasSolarBiomass and wasteGeothermal/ambient heatHydrogenRES share Industry
Other SectorsElectricity
RES electricityDistrict heat
RES district heatCoalOil productsGasSolarBiomass and wasteGeothermal/ambient heatRES share Other Sectors
Total RESRES share
Non energy useOilGasCoal
2009
24,05921,5574,8874,67217431920
0.7%
6,8501,39522680
2,0911,1331,387
083500
15.5%
9,8201,819295240
2191,2534304
6,0700
64.9%
7,46334.6%
2,5032,03445711
table 12.123: non oecd asia: electricity generationTWh/a
table 12.126: non oecd asia: installed capacity GW
table 12.127: non oecd asia: primary energy demand PJ/a
table 12.125: non oecd asia: co2 emissionsMILL t/a
table 12.124: non oecd asia: heat supplyPJ/a
2015
1,281350103453312867191945022800
4736533000
938
1,3281,0123861084563428670
249194502192800
105610
1,162
70.6%19%
2020
1,5935951104592628702822712153300
5038633000
1040
1,6431,2696331164623028700
3042271215283300
129750
1,439
171.0%19%
2030
2,3191,06511854012289357300435154800
6045644000
1149
2,3781,8221,1101245441628930
46330043515574800
1731010
2,101
582.4%19%
2040
3,1991,58112571672892903681039246600
7053755100
1258
3,2692,5261,6341327201128920
651368103924916600
2261320
2,908
1263.9%20%
2050
4,1542,1731338911289012343516213338400
8766766200
1374
4,2403,3112,239140897728900
83943516213331258400
2931710
3,773
1954.6%20%
Power plantsCoalLigniteGasOilDieselNuclearBiomassHydroWind
of which wind offshorePVGeothermalSolar thermal power plantsOcean energy
Combined heat & power plantsCoalLigniteGasOilBiomassGeothermalHydrogenCHP by producerMain activity producersAutoproducers
Total generationFossilCoalLigniteGasOilDiesel
NuclearHydrogenRenewablesHydroWindof which wind offshore
PVBiomassGeothermalSolar thermalOcean energy
Distribution lossesOwn consumption electricityElectricity for hydrogen productionFinal energy consumption (electricity)
Fluctuating RES (PV, Wind, Ocean)Share of fluctuating RESRES share (domestic generation)
2009
985162944068428449
1361002000
4134403000
734
1,025815196984068728440
16613610092000
82480
895
10.1%16%
2015
313571711221209564302400
108101000
19
323237651811222209078643025400
51%24%
2020
374931712118209675604500
119111000
29
3852801021812119209096756046500
103%25%
2030
520164181431022121110021211700
1311111000
211
533371175191441022120
1501002121111700
326%28%
2040
701243191885221216123453171000
1512111000
213
71749425620189622120
21112345317171000
629%30%
2050
899334202351221122146715241300
1916111000
217
91863135022236222110
27514671524231300
9410%30%
Power plantsCoalLigniteGasOilDieselNuclearBiomassHydroWind
of which wind offshorePVGeothermalSolar thermal power plantsOcean energy
Combined heat & power productionCoalLigniteGasOilBiomassGeothermalHydrogenCHP by producerMain activity producersAutoproducers
Total generationFossilCoalLigniteGasOilDiesel
NuclearHydrogenRenewablesHydroWindof which wind offshore
PVBiomassGeothermalSolar thermalOcean energy
Fluctuating RES (PV, Wind, Ocean)Share of fluctuating RESRES share (domestic generation)
2009
24629179832116348100300
98101000
18
25619537179832116055481003300
10%22%
2015
39,04428,4526,2171,9368,40311,897
7279,8657001929
8,1609570
25.2%
2020
44,33333,2148,7962,0959,49512,827
75910,360
8184255
8,5259190
23.3%
2030
54,93642,30213,3762,31111,82614,789
1,01111,6221,081155131
9,1801,075
021.1%
2040
65,97552,03517,9232,39515,00516,713
99912,9421,324369220
9,7051,323
019.6%
2050
73,88258,59121,0282,41816,56118,585
98714,3041,567583309
10,3231,522
019.4%
TotalFossilHard coalLigniteNatural gasCrude oil
NuclearRenewablesHydroWindSolarBiomassGeothermal/ambient heatOcean energyRES share
2009
32,51823,0503,9391,7196,75710,634
4858,98349035
7,4441,041
027.6%
2015
6973401002122422
4335513
74037410521348
1,90385%487161445706104
1,1281.7
2020
9065481022142122
4435513
95158310721545
2,300102%564180495916144
1,1941.9
2030
1,323936104252922
5040523
1,37397610925434
2,978133%672211617
1,333145
1,3072.3
2040
1,8121,342108334522
5746623
1,8691,38811433730
3,691164%752233743
1,822141
1,3922.7
2050
2,1351,640114358122
7057634
2,2051,69712136127
4,201187%805234880
2,146136
1,4452.9
2009
542164951946722
4134402
5831989919492
1,51467%362136351549115
1,0461.4
2015
00000
4040000
12,0316,6715,328
2210
12,0726,7115,328
22100
44.4%
2020
00000
5252000
13,4837,9575,489
370
13,5358,0095,489
3700
40.8%
2030
33000
6666000
15,7469,9775,691
770
15,81410,0465,691
7700
36.5%
2040
1818000
7170000
18,15711,7236,2951345
18,24611,8126,29513450
35.3%
2050
3434000
7575000
19,85412,7796,8761909
19,96312,8876,87619090
35.4%
2009
00000
3535000
10,3615,1845,173
40
10,3955,2195,173
400
49.8%
table 12.128: non oecd asia: final energy demandPJ/a
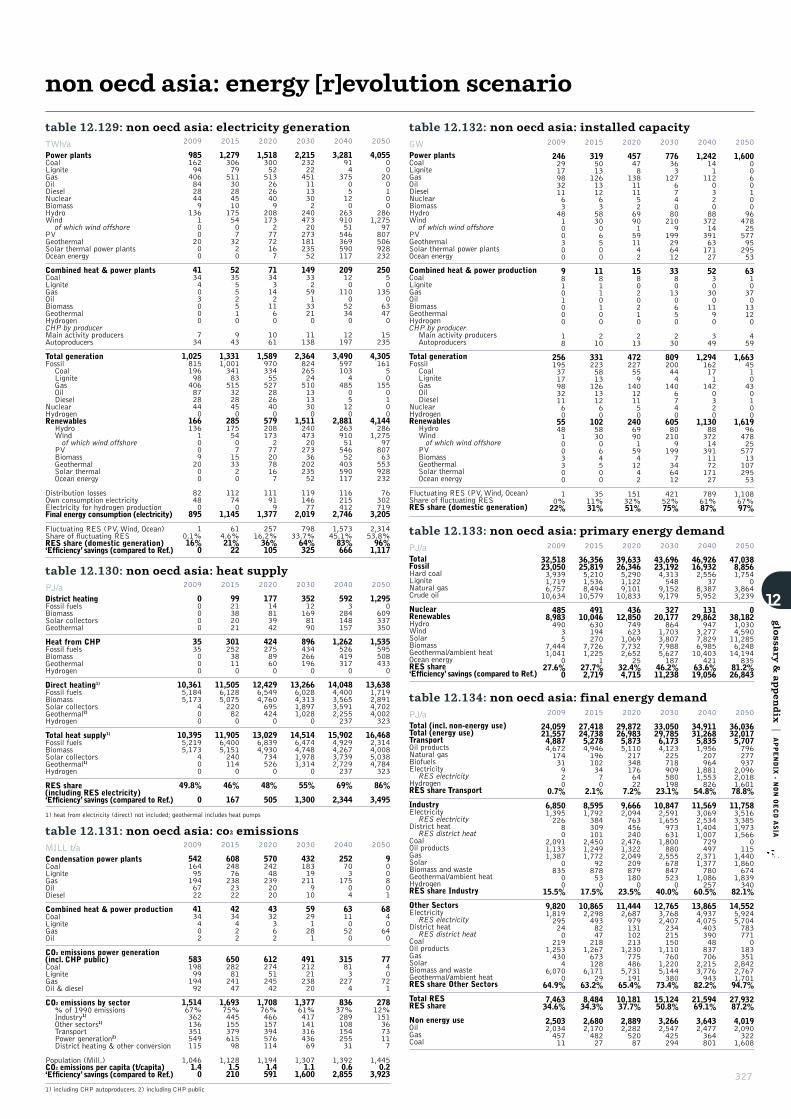
Condensation power plantsCoalLigniteGasOilDiesel
Combined heat & power productionCoalLigniteGasOil
CO2 emissions power generation (incl. CHP public)CoalLigniteGasOil & diesel
CO2 emissions by sector% of 1990 emissionsIndustry1)Other sectors1)TransportPower generation2)District heating & other conversion
Population (Mill.)CO2 emissions per capita (t/capita)‘Efficiency’ savings (compared to Ref.)
1) including CHP autoproducers. 2) including CHP public
District heatingFossil fuelsBiomassSolar collectorsGeothermal
Heat from CHP Fossil fuelsBiomassGeothermalHydrogen
Direct heating1)Fossil fuelsBiomassSolar collectorsGeothermal2)Hydrogen
Total heat supply1)Fossil fuelsBiomassSolar collectorsGeothermal1)Hydrogen
RES share (including RES electricity)‘Efficiency’ savings (compared to Ref.)
1) heat from electricity (direct) not included; geothermal includes heat pumps
327
non oecd asia: energy [r]evolution scenario
12
glo
ssary &
appen
dix
|APPENDIX - N
ON OECD ASIA
2015
27,41824,7385,2784,9461961023470
2.1%
8,5951,792384309101
2,4501,2491,772
92878530
17.5%
10,8652,2984938247218
1,267673128
6,17129
63.2%
8,48434.3%
2,6802,17048227
2020
29,87226,9835,8735,1102173481766422
7.2%
9,6662,094763456240
2,4761,3222,0492098791800
23.5%
11,4442,687979131102213
1,230775486
5,731191
65.4%
10,18137.7%
2,8892,28252087
2030
33,05029,7856,1734,123225718909580198
23.1%
10,8472,5911,655973631
1,800880
2,5556788475230
40.0%
12,7653,7682,407234215150
1,110760
1,2205,144380
73.4%
15,12450.8%
3,2662,547425294
2040
34,91131,2685,8351,956207964
1,8811,553826
54.8%
11,5693,0692,5341,4041,007729497
2,3711,377780
1,086257
60.5%
13,8654,9374,07540339048837706
2,2153,776943
82.2%
21,59469.1%
3,6432,477364801
2050
36,03632,0175,707796277937
2,0962,0181,60178.8%
11,7583,5163,3851,9731,566
0115
1,4401,860674
1,839340
82.1%
14,5525,9245,7047837710
183351
2,8422,7671,70194.7%
27,93287.2%
4,0192,090322
1,608
Total (incl. non-energy use)Total (energy use)TransportOil productsNatural gasBiofuelsElectricity
RES electricityHydrogenRES share Transport
IndustryElectricity
RES electricityDistrict heat
RES district heatCoalOil productsGasSolarBiomass and wasteGeothermal/ambient heatHydrogenRES share Industry
Other SectorsElectricity
RES electricityDistrict heat
RES district heatCoalOil productsGasSolarBiomass and wasteGeothermal/ambient heatRES share Other Sectors
Total RESRES share
Non energy useOilGasCoal
2009
24,05921,5574,8874,67217431920
0.7%
6,8501,39522680
2,0911,1331,387
083500
15.5%
9,8201,819295240
2191,2534304
6,0700
64.9%
7,46334.6%
2,5032,03445711
table 12.129: non oecd asia: electricity generationTWh/a
table 12.132: non oecd asia: installed capacity GW
table 12.133: non oecd asia: primary energy demand PJ/a
table 12.131: non oecd asia: co2 emissionsMILL t/a
table 12.130: non oecd asia: heat supplyPJ/a
2015
1,279306795113028451017554073220
5235552510
943
1,3311,001341835153228450
2851755407153320
112740
1,145
614.6%21%22
2020
1,518300525132626409
20817327772167
713431421160
1061
1,589970334555272826400
5792081732772078167
111919
1,377
25716.2%36%105
2030
2,215232224511113302
2404732027318123552
14933259133210
11138
2,364824265245101313300
1,511240473202733620223552
11914677
2,019
79833.7%64%325
2040
3,281914
37505120
26391051546369590117
209120
110052340
12197
3,4905971034
48505120
2,8812639105154652403590117
116215412
2,746
1,57345.1%83%666
2050
4,05500200100
2861,275
97807506928232
25050
135063470
15235
4,30516150
1550100
4,144286
1,2759780763553928232
76302719
3,205
2,31453.8%96%1,117
Power plantsCoalLigniteGasOilDieselNuclearBiomassHydroWind
of which wind offshorePVGeothermalSolar thermal power plantsOcean energy
Combined heat & power plantsCoalLigniteGasOilBiomassGeothermalHydrogenCHP by producerMain activity producersAutoproducers
Total generationFossilCoalLigniteGasOilDiesel
NuclearHydrogenRenewablesHydroWindof which wind offshore
PVBiomassGeothermalSolar thermalOcean energy
Distribution lossesOwn consumption electricityElectricity for hydrogen productionFinal energy consumption (electricity)
Fluctuating RES (PV, Wind, Ocean)Share of fluctuating RESRES share (domestic generation)‘Efficiency’ savings (compared to Ref.)
2009
985162944068428449
1361002000
4134403000
734
1,025815196984068728440
16613610092000
82480
895
10.1%16%
0
2015
3195013126131263583006500
118110100
210
3312235813126131260
1025830064500
3511%31%
2020
457478
13811115269901591142
158020210
213
472227559
140121150
240699015941242
15132%51%
2030
776363
1276740802109
199296412
3380130650
230
809200444
1406740
605802109
1997346412
42152%75%
2040
1,242141
112032088372143916317127
52303001190
349
1,294162171
1420320
1,1308837214391117217127
78961%87%
2050
1,600006010096478255779529553
631037013120
459
1,6634510430100
1,61996478255771310729553
1,10867%97%
Power plantsCoalLigniteGasOilDieselNuclearBiomassHydroWind
of which wind offshorePVGeothermalSolar thermal power plantsOcean energy
Combined heat & power productionCoalLigniteGasOilBiomassGeothermalHydrogenCHP by producerMain activity producersAutoproducers
Total generationFossilCoalLigniteGasOilDiesel
NuclearHydrogenRenewablesHydroWindof which wind offshore
PVBiomassGeothermalSolar thermalOcean energy
Fluctuating RES (PV, Wind, Ocean)Share of fluctuating RESRES share (domestic generation)
2009
24629179832116348100300
98101000
18
25619537179832116055481003300
10%22%
2015
36,35625,8195,2101,5368,49410,579
49110,046
630194270
7,7261,225
127.7%2,719
2020
39,63326,3465,2901,1229,10110,833
43612,850
749623
1,0697,7322,652
2532.4%4,715
2030
43,69623,1924,313548
9,1529,179
32720,177
8641,7033,8077,9885,627187
46.2%11,238
2040
46,92616,9322,556
378,3875,952
13129,862
9473,2777,8296,98510,403
42163.6%19,056
2050
47,0388,8561,754
03,8643,239
038,1821,0304,59011,2856,24814,194
83581.2%26,843
TotalFossilHard coalLigniteNatural gasCrude oil
NuclearRenewablesHydroWindSolarBiomassGeothermal/ambient heatOcean energyRES share‘Efficiency’ savings (compared to Ref.)
2009
32,51823,0503,9391,7196,75710,634
4858,98349035
7,4441,041
027.6%
0
2015
608248762382322
4234422
6502828124147
1,69375%44515537961598
1,1281.5210
2020
570242482392020
4332362
6122745124542
1,70876%466157394576114
1,1941.4591
2030
43218319211910
59291281
4912122123820
1,37761%41714131643669
1,3071.1
1,600
2040
252703
17504
63110520
315813
2274
83637%28910815425531
1,3920.6
2,855
2050
900801
6840640
7740721
27812%1513673117
1,4450.2
3,923
2009
542164951946722
4134402
5831989919492
1,51467%362136351549115
1,0461.40
2015
9921382021
30125238110
11,5056,1285,075220820
11,9056,4005,1512401140
46%
167
2020
17714813942
42427589600
12,4296,5494,7606954240
13,0296,8394,9307345260
48%
505
2030
352121698190
8964342661960
13,2666,0284,3131,8971,028
0
14,5146,4744,7481,9781,314
0
55%
1,300
2040
5923
284148157
1,2625264193170
14,0484,4003,5653,5912,255237
15,9024,9294,2673,7392,729237
69%
2,344
2050
1,2950
609337350
1,5355955084330
13,6381,7192,8914,7024,002323
16,4682,3144,0085,0384,784323
86%
3,495
2009
00000
3535000
10,3615,1845,173
400
10,3955,2195,173
400
49.8%
0
table 12.134: non oecd asia: final energy demandPJ/a

WORLD ENERGY [R]EVOLUTIONA SUSTAINABLE WORLD ENERGY OUTLOOK
non oecd asia: investment & employment
12
glo
ssary &
appen
dix
|APPENDIX - N
ON OECD ASIA
table 12.135: non oecd asia: total investment in power sectorMILLION $ 2041-2050
228,801258,52928,344136,61457,65914,09921,813
00
32,0721,834,484
21,69479,028318,849342,188281,908732,28858,529
2011-2050
815,230829,32883,183469,041129,71543,916103,472
00
224,3174,925,440
70,791284,910953,053948,236830,115
1,714,743123,593
2011-2050AVERAGEPER YEAR
20,38120,7332,08011,7263,2431,0982,587
00
5,608123,1361,7707,12323,82623,70620,75342,8693,090
2031-2040
185,460211,59824,186111,63839,56911,38524,820
00
38,8651,565,466
22,92955,696332,084284,932250,600588,40030,827
2021-2030
204,588192,00017,109115,06323,91510,25625,656
00
46,1241,030,461
17,25865,821171,115204,167183,902360,10228,098
2011-2020
196,382167,20113,544105,7268,5728,17631,183
00
107,256495,0288,91084,366131,005116,950113,70533,9526,139
Reference scenario
Conventional (fossil & nuclear)RenewablesBiomassHydroWindPVGeothermalSolar thermal power plantsOcean energy
Energy [R]evolution
Conventional (fossil & nuclear)RenewablesBiomassHydroWindPVGeothermalSolar thermal power plantsOcean energy
table 12.136: non oecd asia: total investment in renewable heating only (EXCLUDING INVESTMENTS IN FOSSIL FUELS)
2041-2050
31,27525,844
04,0631,368
981,79823,854382,479273,206302,259
2011-2050
379,704360,392
010,9188,394
2,458,905117,357937,486797,952606,110
2011-2050AVERAGEPER YEAR
9,4939,010
0273210
61,4732,93423,43719,94915,153
2031-2040
40,89334,037
03,6163,240
817,62112,101361,002284,996159,523
2021-2030
139,237136,660
01,901677
327,4055,72186,766153,64781,271
2011-2020
168,299163,851
01,3383,110
332,08175,681107,24086,10363,057
MILLION $
Reference scenario
RenewablesBiomassGeothermalSolarHeat pumps
Energy [R]evolution scenario
RenewablesBiomassGeothermalSolarHeat pumps
table 12.137: non oecd asia: total employment THOUSAND JOBS
2010
23082125
1,33983.81,860
404537199007531015.3117.8
-0.1192.8
1,860
2015
20683125
1,184115.91,714
51446613721600848.0114.5
-0.0122.1
1,714
2020
19680132
1,156149.61,713
582451156645358717133.9
-0.08.7
-1,713
REFERENCE ENERGY [R]EVOLUTION2030
14165129
1,006114.71,455
6153865.944834674165.72.6
--
4.60.0
1,455
2015
492184125
1,11763.51,982
2384794.8
1,26055080
12826227155.317122
1,982
2020
5552271569788.5
1,925
1734314.2
1,31745754
124276334811
24766
1,925
2030
3852031736682.0
1,431
1132953.4
1,01931047
15916422
1066.817132
1,431
By sectorConstruction and installationManufacturingOperations and maintenanceFuel supply (domestic)Coal and gas exportTotal jobs
By technologyCoalGas, oil & dieselNuclearTotal renewables
BiomassHydroWindPVGeothermal powerSolar thermal powerOceanSolar - heatGeothermal & heat pump
Total jobs
328

© JACQUES DESCLOITRES, M
ODIS LAND RAPID RESPONSE TEAM, NASA/GSFC
image YANGTZE RIVER, CENTRAL CHINA.
glo
ssary &
appen
dix
|APPENDIX - C
HINA
china: scenario results data
329
12
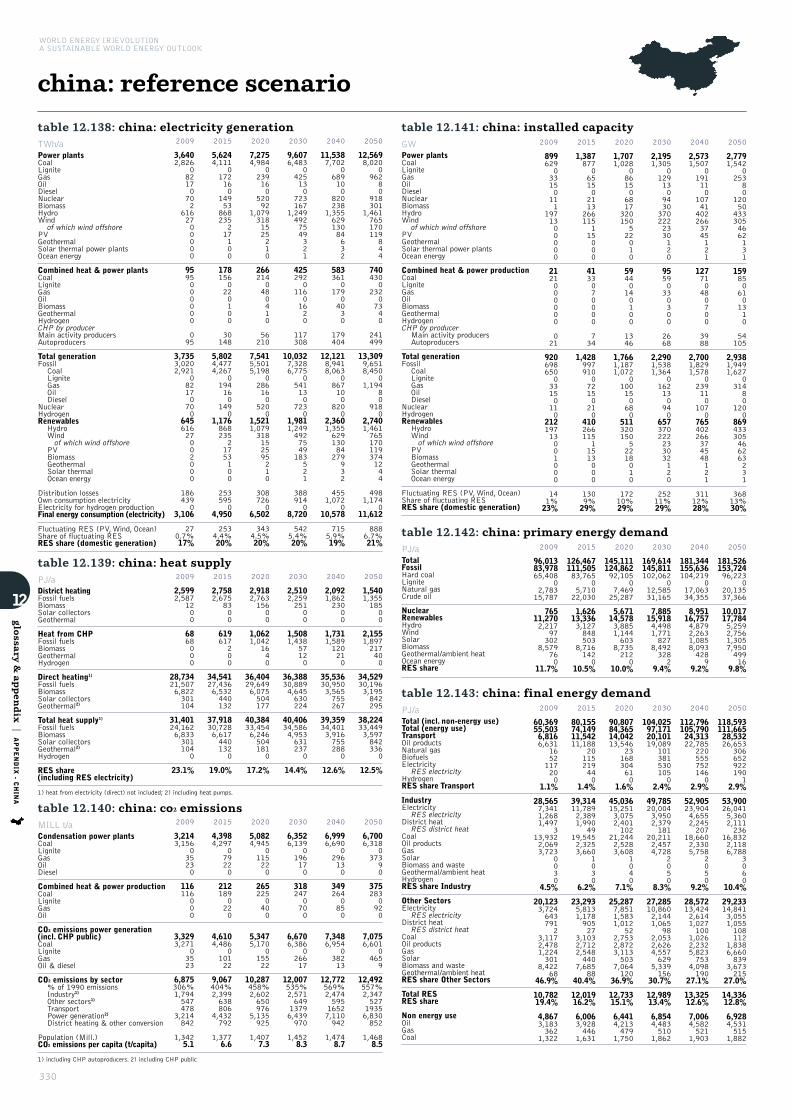
330
WORLD ENERGY [R]EVOLUTIONA SUSTAINABLE WORLD ENERGY OUTLOOK
china: reference scenario
12
glo
ssary &
appen
dix
|APPENDIX - C
HINA
Condensation power plantsCoalLigniteGasOilDiesel
Combined heat & power productionCoalLigniteGasOil
CO2 emissions power generation (incl. CHP public)CoalLigniteGasOil & diesel
CO2 emissions by sector% of 1990 emissionsIndustry1)Other sectors1)TransportPower generation2)District heating & other conversion
Population (Mill.)CO2 emissions per capita (t/capita)
1) including CHP autoproducers. 2) including CHP public
District heatingFossil fuelsBiomassSolar collectorsGeothermal
Heat from CHP Fossil fuelsBiomassGeothermalHydrogen
Direct heating1)Fossil fuelsBiomassSolar collectorsGeothermal2)
Total heat supply1)Fossil fuelsBiomassSolar collectorsGeothermal2)Hydrogen
RES share (including RES electricity)
1) heat from electricity (direct) not included; 2) including heat pumps.
2015
80,15574,14911,54211,188
20115219440
1.4%
39,31411,7892,3891,990
4919,5452,3253,660
1030
6.2%
23,2935,8131,17890527
3,1032,7122,548440
7,68588
40.4%
12,01916.2%
6,0063,928446
1,631
2020
90,80784,36514,04213,546
23168304610
1.6%
45,03615,2513,0752,401102
21,2442,5283,608
1040
7.1%
25,2877,8511,5831,012
522,7532,8723,113503
7,064120
36.9%
12,73315.1%
6,4414,213479
1,750
2030
104,02597,17120,10119,089
1013815301050
2.4%
49,78520,0043,9502,379181
20,2112,4574,728
2050
8.3%
27,28510,8602,1441,065
982,0532,6264,557629
5,339156
30.7%
12,98913.4%
6,8544,483510
1,862
2040
112,796105,79024,31322,785
2205557521460
2.9%
52,90523,9044,6552,245207
18,6602,3305,758
2050
9.2%
28,57213,4242,6141,027100
1,0262,2325,823753
4,098190
27.1%
13,32512.6%
7,0064,582521
1,903
2050
118,593111,66528,53226,653
3066529221901
2.9%
53,90026,0415,3602,111236
16,8322,1186,788
3060
10.4%
29,23314,8413,0551,055108112
1,8386,660839
3,673215
27.0%
14,33612.8%
6,9284,531515
1,882
Total (incl. non-energy use)Total (energy use)TransportOil productsNatural gasBiofuelsElectricity
RES electricityHydrogenRES share Transport
IndustryElectricity
RES electricityDistrict heat
RES district heatCoalOil productsGasSolarBiomass and wasteGeothermal/ambient heatHydrogenRES share Industry
Other SectorsElectricity
RES electricityDistrict heat
RES district heatCoalOil productsGasSolarBiomass and wasteGeothermal/ambient heatRES share Other Sectors
Total RESRES share
Non energy useOilGasCoal
2009
60,36955,5036,8166,631
1652117200
1.1%
28,5657,3411,2681,497
313,9322,0693,723
0030
4.5%
20,1233,7246437912
3,1172,4781,224301
8,42268
46.9%
10,78219.4%
4,8673,183362
1,322
table 12.138: china: electricity generationTWh/a
table 12.141: china: installed capacity GW
table 12.142: china: primary energy demand PJ/a
table 12.140: china: co2 emissionsMILL t/a
table 12.139: china: heat supplyPJ/a
2015
5,6244,111
0172160
14953868235217100
1781560220100
30148
5,8024,4774,267
0194160
1490
1,17686823521753100
2535950
4,950
2534.4%20%
2020
7,2754,984
0239160
52092
1,0793181525210
2662140480410
56210
7,5415,5015,198
0286160
5200
1,5211,079318152595210
3087260
6,502
3434.5%20%
2030
9,6076,483
0425130
723167
1,2494927549321
4252920
11601620
117308
10,0327,3286,775
0541130
7230
1,9811,2494927549183521
3889140
8,720
5425.4%20%
2040
11,5387,702
0689100
820238
1,35562913084632
5833610
17904030
179404
12,1218,9418,063
0867100
8200
2,3601,35562913084279932
4551,072
010,578
7155.9%19%
2050
12,5698,020
096280
918301
1,461765170119844
7404300
23207340
241499
13,3099,6518,450
01,194
80
9180
2,7401,4617651701193741244
4981,174
011,612
8886.7%21%
Power plantsCoalLigniteGasOilDieselNuclearBiomassHydroWind
of which wind offshorePVGeothermalSolar thermal power plantsOcean energy
Combined heat & power plantsCoalLigniteGasOilBiomassGeothermalHydrogenCHP by producerMain activity producersAutoproducers
Total generationFossilCoalLigniteGasOilDiesel
NuclearHydrogenRenewablesHydroWindof which wind offshore
PVBiomassGeothermalSolar thermalOcean energy
Distribution lossesOwn consumption electricityElectricity for hydrogen productionFinal energy consumption (electricity)
Fluctuating RES (PV, Wind, Ocean)Share of fluctuating RESRES share (domestic generation)
2009
3,6402,826
082170702
6162700000
9595000000
095
3,7353,0202,921
082170700
64561627002000
1864390
3,106
270.7%17%
2015
1,3878770651502113266115115000
4133070000
734
1,428997910072150210
41026611511513000
1309%29%
2020
1,7071,028
0861506817320150522010
59440140100
1346
1,7661,1871,072
0100150680
51132015052218010
17210%29%
2030
2,1951,305
012913094303702222330120
95590330300
2668
2,2901,5381,364
0162130940
657370222233032120
25211%29%
2040
2,5731,507
0191110
107414022663745121
127710480700
3988
2,7001,8291,578
0239110
1070
765402266374548121
31112%28%
2050
2,7791,542
025380
120504333054662131
1598506101310
54105
2,9381,9491,627
031480
1200
869433305466263231
36813%30%
Power plantsCoalLigniteGasOilDieselNuclearBiomassHydroWind
of which wind offshorePVGeothermalSolar thermal power plantsOcean energy
Combined heat & power productionCoalLigniteGasOilBiomassGeothermalHydrogenCHP by producerMain activity producersAutoproducers
Total generationFossilCoalLigniteGasOilDiesel
NuclearHydrogenRenewablesHydroWindof which wind offshore
PVBiomassGeothermalSolar thermalOcean energy
Fluctuating RES (PV, Wind, Ocean)Share of fluctuating RESRES share (domestic generation)
2009
899629033150111
1971300000
2121000000
021
920698650033150110
21219713001000
141%23%
2015
126,467111,50583,765
05,71022,030
1,62613,3363,127848503
8,7161420
10.5%
2020
145,111124,86292,105
07,46925,287
5,67114,5783,8851,144603
8,7352120
10.0%
2030
169,614145,811102,062
012,58531,165
7,88515,9184,4981,771827
8,4923282
9.4%
2040
181,344155,636104,219
017,06334,355
8,95116,7574,8792,2631,0858,0934289
9.2%
2050
181,526153,72496,223
020,13537,366
10,01717,7845,2592,7561,3057,95049916
9.8%
TotalFossilHard coalLigniteNatural gasCrude oil
NuclearRenewablesHydroWindSolarBiomassGeothermal/ambient heatOcean energyRES share
2009
96,01383,97865,408
02,78315,787
76511,2702,217
97302
8,579760
11.7%
2015
4,3984,297
079220
2121890220
4,6104,486
010122
9,067404%2,399638806
4,432792
1,3776.6
2020
5,0824,945
0115220
2652250400
5,3475,170
015522
10,287458%2,602650976
5,135925
1,4077.3
2030
6,3526,139
0196170
3182470700
6,6706,386
026617
12,007535%2,57164913796,439970
1,4528.3
2040
6,9996,690
0296130
3492640850
7,3486,954
038213
12,772569%2,47459516527,110942
1,4748.7
2050
6,7006,318
037390
3752830920
7,0756,601
04659
12,492557%2,34752719356,830852
1,4688.5
2009
3,2143,156
035230
116116000
3,3293,271
03523
6,875306%1,794547478
3,214842
1,3425.1
2015
2,7582,675
8300
619617200
34,54127,4366,532440132
37,91830,7286,6174401320
19.0%
2020
2,9182,76315600
1,0621,042
1640
36,40429,6496,075504177
40,38433,4546,2465041810
17.2%
2030
2,5102,25925100
1,5081,438
57120
36,38830,8894,645630224
40,40634,5864,9536312370
14.4%
2040
2,0921,86223000
1,7311,589120210
35,53630,9503,565755267
39,35934,4013,9167552880
12.6%
2050
1,5401,35518500
2,1551,897217400
34,52930,1963,195842295
38,22433,4493,5978423360
12.5%
2009
2,5992,587
1200
6868000
28,73421,5076,822301104
31,40124,1626,8333011040
23.1%
table 12.143: china: final energy demandPJ/a

Condensation power plantsCoalLigniteGasOilDiesel
Combined heat & power productionCoalLigniteGasOil
CO2 emissions power generation (incl. CHP public)CoalLigniteGasOil & diesel
CO2 emissions by sector% of 1990 emissionsIndustry1)Other sectors1)TransportPower generation2)District heating & other conversion
Population (Mill.)CO2 emissions per capita (t/capita)‘Efficiency’ savings (compared to Ref.)
1) including CHP autoproducers. 2) including CHP public
District heatingFossil fuelsBiomassSolar collectorsGeothermal
Heat from CHP Fossil fuelsBiomassGeothermalHydrogen
Direct heating1)Fossil fuelsBiomassSolar collectorsGeothermal2)Hydrogen
Total heat supply1)Fossil fuelsBiomassSolar collectorsGeothermal1)Hydrogen
RES share (including RES electricity)‘Efficiency’ savings (compared to Ref.)
1) heat from electricity (direct) not included; geothermal includes heat pumps
331
china: energy [r]evolution scenario
12
glo
ssary &
appen
dix
|APPENDIX - C
HINA
2015
76,70470,7989,8669,494
19154198420
2.0%
37,64111,366
9672,559180
17,0321,8374,484
84264150
4.0%
23,2915,8132,6881,059
583,0962,5571,522520
8,571153
51.5%
13,69819.3%
5,9063,627439
1,840
2020
83,76077,49812,00111,171
224883068215
4.8%
41,27814,1661,3283,265588
17,0721,3764,5471755471290
6.7%
24,2197,2664,4111,390232
3,1081,6591,574810
8,053359
57.2%
17,20422.2%
6,2613,707465
2,089
2030
86,73380,16914,06211,210
50805
1,856790141
11.8%
41,76817,2153,6654,5261,21412,725
5334,3566029798320
17.5%
24,3398,9987,4971,910517
2,446825
1,2931,3596,826681
69.4%
25,82732.2%
6,5643,571488
2,505
2040
83,45176,84512,7636,156
761,1064,9083,182517
36.2%
40,53419,0059,6105,2902,5463,849371
3,4583,4231,9473,157
3451.1%
23,5489,9589,1662,4921,283841255781
2,3435,883995
83.5%
44,99958.6%
6,6063,396491
2,719
2050
78,44072,43312,6123,725
841,0286,8866,304890
64.6%
37,55719,06416,9296,0564,686496312
1,3383,7062,1804,086319
84.9%
22,2639,8579,5473,7363,020
075347
2,4464,2301,57293.5%
60,84284.0%
6,0082,908447
2,653
Total (incl. non-energy use)Total (energy use)TransportOil productsNatural gasBiofuelsElectricity
RES electricityHydrogenRES share Transport
IndustryElectricity
RES electricityDistrict heat
RES district heatCoalOil productsGasSolarBiomass and wasteGeothermal/ambient heatHydrogenRES share Industry
Other SectorsElectricity
RES electricityDistrict heat
RES district heatCoalOil productsGasSolarBiomass and wasteGeothermal/ambient heatRES share Other Sectors
Total RESRES share
Non energy useOilGasCoal
2009
60,36955,5036,8166,631
1652117200
1.1%
28,5657,3411,2681,497
313,9322,0693,723
0030
4.5%
20,1233,7246437912
3,1172,4781,224301
8,42268
46.9%
10,78219.4%
4,8673,183362
1,322
table 12.144: china: electricity generationTWh/a
table 12.147: china: installed capacity GW
table 12.148: china: primary energy demand PJ/a
table 12.146: china: co2 emissionsMILL t/a
table 12.145: china: heat supplyPJ/a
2015
5,3223,881
0138100
14939812265225210
21913704703400
34185
5,5414,2134,018
0185100
1490
1,17981226522573210
2134970
4,827
2905.2%21%118
2020
6,3574,212
019950
2504499049835958552
4291900
1130
12320
164265
6,7864,7194,402
031250
2500
1,817990498359516710552
2215156
6,038
5958.8%27%464
2030
7,6273,850
019200
20055
1,1501,2001903659748235
9553020
3840
234360
505450
8,5824,7284,152
057600
2000
3,6541,1501,20019036529013348235
25246855
7,797
1,60018.6%43%1,292
2040
8,7462,441
08500
14634
1,3402,148357
1,014313
1,115110
1,4672650
6360
43211519
834633
10,2133,4272,706
072100
14619
6,6211,3402,148357
1,014466428
1,115110
208312241
9,436
3,27232.0%65%2,324
2050
9,2402805200031
1,4603,134519
1,525512
1,858640
1,772520
7210
61131078
993779
11,012853800
77300078
10,0811,4603,134519
1,525642822
1,858640
203187556
10,041
5,29948.1%92%3,323
Power plantsCoalLigniteGasOilDieselNuclearBiomassHydroWind
of which wind offshorePVGeothermalSolar thermal power plantsOcean energy
Combined heat & power plantsCoalLigniteGasOilBiomassGeothermalHydrogenCHP by producerMain activity producersAutoproducers
Total generationFossilCoalLigniteGasOilDiesel
NuclearHydrogenRenewablesHydroWindof which wind offshore
PVBiomassGeothermalSolar thermalOcean energy
Distribution lossesOwn consumption electricityElectricity for hydrogen productionFinal energy consumption (electricity)
Fluctuating RES (PV, Wind, Ocean)Share of fluctuating RESRES share (domestic generation)‘Efficiency’ savings (compared to Ref.)
2009
3,6402,826
082170702
6162700000
9595000000
095
3,7353,0202,921
082170700
64561627002000
1864390
3,106
270.7%17%
0
2015
1,267776050902110249130122010
53290160800
845
1,32088080506590210
42024913012218010
15211%32%
2020
1,58882306650338
29423411831421
983903502300
3959
1,6869688620
10250330
6852942341183312421
31719%41%
2030
2,08875505600261034151757221161389
220610
11204260
120100
2,3089848160
16800260
1,2983415175722151221389
74632%56%
2040
2,61649802700196
397845995425120328
323550
171075194
183140
2,9397505530
19800194
2,16639784599542816920328
1,41648%74%
2050
2,94990210005
4331,13913380383295161
378170
1880
1075015
216162
3,327236270
20900015
3,076433
1,139133803112133295161
2,10363%92%
Power plantsCoalLigniteGasOilDieselNuclearBiomassHydroWind
of which wind offshorePVGeothermalSolar thermal power plantsOcean energy
Combined heat & power productionCoalLigniteGasOilBiomassGeothermalHydrogenCHP by producerMain activity producersAutoproducers
Total generationFossilCoalLigniteGasOilDiesel
NuclearHydrogenRenewablesHydroWindof which wind offshore
PVBiomassGeothermalSolar thermalOcean energy
Fluctuating RES (PV, Wind, Ocean)Share of fluctuating RESRES share (domestic generation)
2009
899629033150111
1971300000
2121000000
021
920698650033150110
21219713001000
141%23%
2015
120,947103,89978,814
06,10018,985
1,62615,4232,924956727
10,5592570
12.7%5,543
2020
129,656106,21278,801
08,13719,274
2,72820,7163,5651,7932,03612,422
8947
16.0%15,465
2030
130,46893,38566,165
010,00417,216
2,18234,9014,1414,3217,93512,9595,421126
26.7%39,133
2040
119,24255,97835,472
09,81710,688
1,59361,6714,8257,73420,24514,16114,310
39651.7%62,054
2050
104,68919,2034,334
07,5867,283
085,4865,25711,28429,88813,26323,4902,30481.6%76,747
TotalFossilHard coalLigniteNatural gasCrude oil
NuclearRenewablesHydroWindSolarBiomassGeothermal/ambient heatOcean energyRES share‘Efficiency’ savings (compared to Ref.)
2009
96,01383,97865,408
02,78315,787
76511,2702,217
97302
8,579760
11.7%0
2015
4,0153,942
059140
2181670510
4,2334,109
011014
8,300370%2,182570684
4,042822
1,3776.0767
2020
4,2304,137
08570
2912000920
4,5214,337
01777
8,584383%2,216484805
4,314765
1,4076.1
1,703
2030
3,7303,647
08300
4672550
2120
4,1973,903
02940
7,531336%1,857365810
3,946553
1,4525.2
4,476
2040
2,1572,121
03600
4831930
2900
2,6402,314
03260
4,122184%780169446
2,412316
1,4742.8
8,650
2050
422202000
316340
2820
358560
3020
86038%2525027322561
1,4680.6
11,631
2009
3,2143,156
035230
116116000
3,3293,271
03523
6,875306%1,794547478
3,214842
1,3425.10
2015
3,3213,161133233
77564513000
33,05124,7057,4976052440
37,14728,5127,7596282480
23%
771
2020
3,5663,10321421436
1,6531,166477110
33,08724,0497,3639856900
38,30728,3178,0541,1997370
26%
2,078
2030
2,9252,223234322146
3,9622,8169911550
29,21718,5606,7421,9611,955
0
36,10423,5987,9672,2832,256
0
35%
4,303
2040
2,646944291794617
5,5343,3141,61153870
25,6398,1376,7345,7664,970
32
33,81912,3958,6376,5606,125102
63%
5,540
2050
4,1200
5361,5242,060
6,0492,3791,8801,551240
20,8522,0505,5336,1526,814303
31,0214,4297,9497,67610,424
543
86%
7,203
2009
2,5992,587
1200
6868000
28,73421,5076,8223011040
31,40124,1626,8333011040
23.1%
0
table 12.149: china: final energy demandPJ/a

WORLD ENERGY [R]EVOLUTIONA SUSTAINABLE WORLD ENERGY OUTLOOK
china: investment & employment
12
glo
ssary &
appen
dix
|APPENDIX - C
HINA
table 12.150: china: total investment in power sectorMILLION $ 2041-2050
686,936784,06683,985479,671177,71826,6935,4759,545979
105,6233,567,412169,254495,708857,503417,365438,486942,105246,991
2011-2050
3,055,6752,602,146264,873
1,383,419780,739127,41719,34223,9642,392
964,2789,125,495600,044
1,392,4822,453,0041,233,367927,685
2,207,990310,922
2011-2050AVERAGEPER YEAR
76,39265,0546,62234,58519,5183,18548459960
24,107228,13715,00134,81261,32530,83423,19255,2007,773
2031-2040
667,921566,27383,543195,611236,05739,9925,9084,1531,009
112,7142,434,956215,787288,897760,645456,537311,016362,69739,376
2021-2030
764,754504,81252,976257,219171,36014,5963,6604,648353
230,4011,802,607
87,463246,561501,949191,641159,943592,42722,623
2011-2020
936,064746,99544,370450,918195,60446,1364,2995,618
51
515,5401,320,520127,539361,317332,908167,82518,240310,7601,932
Reference scenario
Conventional (fossil & nuclear)RenewablesBiomassHydroWindPVGeothermalSolar thermal power plantsOcean energy
Energy [R]evolution
Conventional (fossil & nuclear)RenewablesBiomassHydroWindPVGeothermalSolar thermal power plantsOcean energy
table 12.151: china: total investment in renewable heating only (EXCLUDING INVESTMENTS IN FOSSIL FUELS)
2041-2050
33,20900
10,48322,726
1,821,29545,720911,988312,668550,919
2011-2050
205,98421,055
1852,870132,041
4,950,028342,916
1,620,2981,532,0151,454,798
2011-2050AVERAGEPER YEAR
5,1505260
1,3223,301
123,7518,57340,50738,30036,370
2031-2040
45,31600
12,38932,927
2,093,55399,461592,960935,744465,388
2021-2030
62,6289,928
1816,43836,244
528,39828,65284,624168,188246,934
2011-2020
64,83111,127
013,56140,143
506,783169,08330,726115,415191,558
MILLION $
Reference scenario
RenewablesBiomassGeothermalSolarHeat pumps
Energy [R]evolution scenario
RenewablesBiomassGeothermalSolarHeat pumps
table 12.152: china: total employment THOUSAND JOBS
2010
1,725930478
5,318-
8,451
5,969223231
2,0288023814271371.91.3
0.0425818.68,451
2015
868394504
3,730-
5,496
3,972223185
1,116563306161441.03.7
0.03333.0
5,496
2020
571280539
2,842-
4,233
3,010213101908486224138230.72.1
0.11297.2
4,233
REFERENCE ENERGY [R]EVOLUTION2030
339159429
1,836-
2,762
1,8943025351227515156110.50.8
0.16162.4
2,762
2015
883702495
3,957-
6,038
3,61825040
2,130733270438370
81622.112126
6,038
2020
514444554
3,229-
4,741
2,72526318
1,73566219733810416
1627.217971
4,741
2030
499390459
1,888-
3,235
1,4282629
1,53645416831419522836.222075
3,235
By sectorConstruction and installationManufacturingOperations and maintenanceFuel supply (domestic)Coal and gas exportTotal jobs
By technologyCoalGas, oil & dieselNuclearTotal renewables
BiomassHydroWindPVGeothermal powerSolar thermal powerOceanSolar - heatGeothermal & heat pump
Total jobs
332
© NASA/GSFC/METI/ERSDAC/JAROS
image ON THE NORTHERN TIP OF NEW ZEALAND’S SOUTH ISLAND, FAREWELL SPIT STRETCHES 30 KILOMETERS EASTWARD INTO THE TASMAN SEA FROM THE CAPEFAREWELL MAINLAND. AN INTRICATE WETLAND ECOSYSTEM FACES SOUTH TOWARD GOLDEN BAY. ON THE SOUTHERN SIDE, THE SPIT IS PROTECTED BY SEVERALKILOMETERS OF MUDFLATS, WHICH ARE ALTERNATELY EXPOSED AND INUNDATED WITH THE TIDAL RHYTHMS OF THE OCEAN. THE WETLANDS OF FAREWELL SPIT ARE ONTHE RAMSAR LIST OF WETLANDS OF INTERNATIONAL SIGNIFICANCE.
glo
ssary &
appen
dix
|APPENDIX - O
ECD ASIA OCEANIA
oecd asia oceania: scenario results data
333
12

334
WORLD ENERGY [R]EVOLUTIONA SUSTAINABLE WORLD ENERGY OUTLOOK
oecd asia oceania: reference scenario
12
glo
ssary &
appen
dix
|APPENDIX - O
ECD ASIA OCEANIA
Condensation power plantsCoalLigniteGasOilDiesel
Combined heat & power productionCoalLigniteGasOil
CO2 emissions power generation (incl. CHP public)CoalLigniteGasOil & diesel
CO2 emissions by sector% of 1990 emissionsIndustry1)Other sectors1)TransportPower generation2)District heating & other conversion
Population (Mill.)CO2 emissions per capita (t/capita)
1) including CHP autoproducers. 2) including CHP public
District heatingFossil fuelsBiomassSolar collectorsGeothermal
Heat from CHP Fossil fuelsBiomassGeothermalHydrogen
Direct heating1)Fossil fuelsBiomassSolar collectorsGeothermal2)
Total heat supply1)Fossil fuelsBiomassSolar collectorsGeothermal2)Hydrogen
RES share (including RES electricity)
1) heat from electricity (direct) not included; 2) including heat pumps.
2015
24,67421,2075,8045,609
6723105110
0.6%
7,2932,52425611515
1,6641,3841,260
133960
8.5%
8,1103,8713931041688
2,0131,863
649313
7.1%
1,2315.8%
3,4683,377
6130
2020
25,08321,6155,6105,385
7926119140
0.7%
7,5622,68330511716
1,9101,3351,147
336160
9.1%
8,4444,0964661091784
2,0441,945
549913
7.7%
1,3816.4%
3,4683,378
6130
2030
25,44022,0005,2434,95411728144190
0.9%
7,7332,83038311922
1,8511,2441,264
341470
10.7%
9,0254,4846061272675
2,0482,063
9312114
9.5%
1,7377.9%
3,4403,351
6029
2040
25,28821,8804,8524,49116928163260
1.1%
7,6762,86546413030
1,7351,1151,361
446170
12.6%
9,3524,7157631423632
2,0852,10611713915
11.4%
2,0919.6%
3,4083,319
6029
2050
24,65221,2544,3954,02816629172310
1.4%
7,5072,83651713436
1,4861,1131,424
450270
14.2%
9,3534,762868151439
2,0112,12313414717
12.9%
2,33611.0%
3,3983,309
6029
Total (incl. non-energy use)Total (energy use)TransportOil productsNatural gasBiofuelsElectricity
RES electricityHydrogenRES share Transport
IndustryElectricity
RES electricityDistrict heat
RES district heatCoalOil productsGasSolarBiomass and wasteGeothermal/ambient heatHydrogenRES share Industry
Other SectorsElectricity
RES electricityDistrict heat
RES district heatCoalOil productsGasSolarBiomass and wasteGeothermal/ambient heatRES share Other Sectors
Total RESRES share
Non energy useOilGasCoal
2009
23,68620,2166,0405,878
54198880
0.4%
6,4312,1151831135
1,0531,4381,394
031260
7.9%
7,7443,69132096664
2,0281,694
748513
6.4%
1,0315.1%
3,4713,380
6129
table 12.153: oecd asia oceania: electricity generationTWh/a
table 12.156: oecd asia oceania: installed capacity GW
table 12.157: oecd asia oceania: primary energy demand PJ/a
table 12.155: oecd asia oceania: co2 emissionsMILL t/a
table 12.154: oecd asia oceania: heat supplyPJ/a
2015
1,976597145473715
483291282429940
5736395300
2730
2,0341,344600151512765
4830
2071282429311040
961300
1,805
331.6%10%
2020
2,092619150506435
52833140364121190
6446454410
3034
2,1561,382622156552475
5280
24514036412361190
1011370
1,916
482.2%11%
2030
2,23968585476335
6504314466102313151
7835584710
3444
2,3171,35468890534375
6500
3131446610235014151
1031400
2,072
903.9%14%
2040
2,31066855524334
6505114895253022273
8733663930
3849
2,3971,35967158590364
6500
3881489525306025273
1041410
2,151
1285.3%16%
2050
2,31365040579283
59057155110353527355
94337121140
4054
2,4081,37965343650303
5900
43915511035356831355
1051430
2,158
1506.2%18%
Power plantsCoalLigniteGasOilDieselNuclearBiomassHydroWind
of which wind offshorePVGeothermalSolar thermal power plantsOcean energy
Combined heat & power plantsCoalLigniteGasOilBiomassGeothermalHydrogenCHP by producerMain activity producersAutoproducers
Total generationFossilCoalLigniteGasOilDiesel
NuclearHydrogenRenewablesHydroWindof which wind offshore
PVBiomassGeothermalSolar thermalOcean energy
Distribution lossesOwn consumption electricityElectricity for hydrogen productionFinal energy consumption (electricity)
Fluctuating RES (PV, Wind, Ocean)Share of fluctuating RESRES share (domestic generation)
2009
1,8015371374291066
42824114904800
5136355200
2228
1,8511,2635401434641106
4280
16011490426800
891210
1,637
130.7%9%
2015
4628931130403.375568100.76.41.51.70
120.82.96.31.40.700
6.75.5
4743059034137413.37509368100.76.45.61.61.70
174%20%
2020
4919133155273.380670141.48.61.62.70
130.92.77.31.10.900
7.06.0
5043219236162283.3800
10370141.48.66.51.72.70.3
234%21%
2030
52810418161203.396772243.2161.93.41.0
160.81.410.50.91.700
6.88.7
54332010419172213.3960
12772243.216.48.72.13.41.0
418%23%
2040
55810211181212.794872338213.35.42.1
180.70.912.60.72.100
7.410.2
57633310312194212.7940
14872337.621.410.53.75.42.1
5710%26%
2050
5701008
200192.08610703710254.06.43.2
190.80.713.70.52.40.60
7.711.0
5893451019
214192.0860
1587037
10.025.011.94.66.43.2
6511%27%
Power plantsCoalLigniteGasOilDieselNuclearBiomassHydroWind
of which wind offshorePVGeothermalSolar thermal power plantsOcean energy
Combined heat & power productionCoalLigniteGasOilBiomassGeothermalHydrogenCHP by producerMain activity producersAutoproducers
Total generationFossilCoalLigniteGasOilDiesel
NuclearHydrogenRenewablesHydroWindof which wind offshore
PVBiomassGeothermalSolar thermalOcean energy
Fluctuating RES (PV, Wind, Ocean)Share of fluctuating RESRES share (domestic generation)
2009
4228229106523.97046740
2.61.40.00
110.73.15.61.4000
6.05.2
4332838332111533.9700806740
2.64.51.400
72%19%
2015
38,05131,0168,7751,6236,59114,027
5,2651,770462851367882991
4.7%
2020
38,86131,1049,0661,6546,88613,498
5,7651,9925041291848503251
5.1%
2030
39,43729,8829,262945
6,97012,706
7,0882,467519236317
1,0243675
6.3%
2040
38,88828,7078,590598
7,56811,951
7,0923,089533342472
1,16256911
7.9%
2050
37,46027,5487,908410
8,02011,209
6,4383,474558396579
1,26366018
9.3%
TotalFossilHard coalLigniteNatural gasCrude oil
NuclearRenewablesHydroWindSolarBiomassGeothermal/ambient heatOcean energyRES share
2009
36,07629,9067,6921,5446,01914,651
4,6651,50641232877112630
4.2%
2015
942533161203423
36610145
97753917121650
2,148136%345264407961171
20410.6
2020
939538167205253
37710164
97554517622133
2,152137%358270391959173
20510.5
2030
88056694196203
3776204
91757310121626
2,035129%354276363899144
20410.0
2040
82652661217202
3664233
8635326524125
1,929123%338278332844136
1999.7
2050
78548942235162
3673242
8214964526020
1,823116%320271299801132
1939.5
2009
858469152171634
34611125
89247516318371
2,042130%301253425876187
20110.2
2015
35201500
189177840
7,2156,7743486528
7,4396,97037265320
6.3%
2020
32181400
1981811160
7,3996,9443715728
7,6297,14339657340
6.4%
2030
30171300
22118919130
7,6287,0614419629
7,8797,26847396420
7.8%
2040
32181400
24619725240
7,6697,01850012130
7,9477,233539121540
9.0%
2050
2112900
27020429370
7,5606,83655413832
7,8517,052592138690
10.2%
2009
38211600
177173400
6,6376,2163187428
6,8516,41133874290
6.4%
table 12.158: oecd asia oceania: final energy demandPJ/a

Condensation power plantsCoalLigniteGasOilDiesel
Combined heat & power productionCoalLigniteGasOil
CO2 emissions power generation (incl. CHP public)CoalLigniteGasOil & diesel
CO2 emissions by sector% of 1990 emissionsIndustry1)Other sectors1)TransportPower generation2)District heating & other conversion
Population (Mill.)CO2 emissions per capita (t/capita)‘Efficiency’ savings (compared to Ref.)
1) including CHP autoproducers. 2) including CHP public
District heatingFossil fuelsBiomassSolar collectorsGeothermal
Heat from CHP Fossil fuelsBiomassGeothermalHydrogen
Direct heating1)Fossil fuelsBiomassSolar collectorsGeothermal2)Hydrogen
Total heat supply1)Fossil fuelsBiomassSolar collectorsGeothermal1)Hydrogen
RES share (including RES electricity)‘Efficiency’ savings (compared to Ref.)
1) heat from electricity (direct) not included; geothermal includes heat pumps
335
oecd asia oceania: energy [r]evolution scenario
12
glo
ssary &
appen
dix
|APPENDIX - O
ECD ASIA OCEANIA
2015
23,90220,6265,6005,175
80198146270
4.0%
6,9872,44044316739
1,0181,3611,479
11442700
14.4%
8,0393,8006901143161
1,8191,84315917073
14.0%
2,35211.4%
3,2763,165
7734
2020
22,74019,8365,1504,5051692392146623
6.1%
6,9362,50777825994597
1,2941,551
745341200
23.1%
7,7503,6401,1302218148
1,3341,770247341149
25.1%
3,86119.5%
2,9042,415199289
2030
20,87918,1664,2502,628228445740416209
23.0%
6,4872,4661,388340230208637
1,39625968047328
46.9%
7,4293,4681,95356236722410
1,484517615351
51.2%
7,82743.1%
2,7131,904376433
2040
18,65316,1773,4501,031210482
1,337998390
51.3%
5,8592,3221,7334543970
337922334695694100
67.1%
6,8683,1352,3407646590
220892711650494
70.7%
10,55465.2%
2,4771,602418457
2050
16,38714,1432,850422170338
1,4221,329498
74.8%
5,1632,1301,991518501054316392566895292
89.4%
6,1302,7202,542944908063313848693549
90.4%
12,29186.9%
2,2451,391379475
Total (incl. non-energy use)Total (energy use)TransportOil productsNatural gasBiofuelsElectricity
RES electricityHydrogenRES share Transport
IndustryElectricity
RES electricityDistrict heat
RES district heatCoalOil productsGasSolarBiomass and wasteGeothermal/ambient heatHydrogenRES share Industry
Other SectorsElectricity
RES electricityDistrict heat
RES district heatCoalOil productsGasSolarBiomass and wasteGeothermal/ambient heatRES share Other Sectors
Total RESRES share
Non energy useOilGasCoal
2009
23,68620,2166,0405,878
54198880
0.4%
6,4312,1151831135
1,0531,4381,394
031260
7.9%
7,7443,69132096664
2,0281,694
748513
6.4%
1,0315.1%
3,4713,380
6129
table 12.159: oecd asia oceania: electricity generationTWh/a
table 12.162: oecd asia oceania: installed capacity GW
table 12.163: oecd asia oceania: primary energy demand PJ/a
table 12.161: oecd asia oceania: co2 emissionsMILL t/a
table 12.160: oecd asia oceania: heat supplyPJ/a
2015
1,922550130671983
115361327506026205
6835494520
3038
1,9901,5145531357201023
1150
361132750604128205
941200
1,774
1407.0%18%43
2020
1,86939275650403
113381501955
100544019
124249041761
5272
1,9931,26039479740443
1131
6191501955
10055604019
9311811
1,770
31415.8%31%176
2030
1,9993183047421304115947060260998045
1620096152112
6894
2,1619433183057022302
1,21715947060260931108045
8911498
1,858
77535.9%56%384
2040
2,0771210
3720305316363014039013512585
2040078097254
88116
2,2815741210
4500304
1,70316363014039015016012585
82105199
1,894
1,10548.4%75%589
2050
1,99000
11703053180710200490143170125
24500180
162578
110135
2,23513800
1350308
2,089180710200490215200170125
7393314
1,754
1,32559.3%93%763
Power plantsCoalLigniteGasOilDieselNuclearBiomassHydroWind
of which wind offshorePVGeothermalSolar thermal power plantsOcean energy
Combined heat & power plantsCoalLigniteGasOilBiomassGeothermalHydrogenCHP by producerMain activity producersAutoproducers
Total generationFossilCoalLigniteGasOilDiesel
NuclearHydrogenRenewablesHydroWindof which wind offshore
PVBiomassGeothermalSolar thermalOcean energy
Distribution lossesOwn consumption electricityElectricity for hydrogen productionFinal energy consumption (electricity)
Fluctuating RES (PV, Wind, Ocean)Share of fluctuating RESRES share (domestic generation)‘Efficiency’ savings (compared to Ref.)
2009
1,8015371374291066
42824114904800
5136355200
2228
1,8511,2635401434641106
4280
16011490426800
891210
1,637
130.7%9%0
2015
49179281484921867032043484
141381100
77
5053187931156502180
16970320437584
8016%33%
2020
5285617148252176757527181116
2312151410
1013
5512655718162262170
26875752711191116
16229%49%
2030
721476
144132077917119186151834
33001701320
1320
754229476
16113200
524791711918620171834
39152%70%
2040
857300
13302097922142279202559
45001802341
2124
902183300
1510201
718792214227932242559
55862%80%
2050
892007802098223957350213179
5100503592
2527
9438500830202
856822395735044313179
66971%91%
Power plantsCoalLigniteGasOilDieselNuclearBiomassHydroWind
of which wind offshorePVGeothermalSolar thermal power plantsOcean energy
Combined heat & power productionCoalLigniteGasOilBiomassGeothermalHydrogenCHP by producerMain activity producersAutoproducers
Total generationFossilCoalLigniteGasOilDiesel
NuclearHydrogenRenewablesHydroWindof which wind offshore
PVBiomassGeothermalSolar thermalOcean energy
Fluctuating RES (PV, Wind, Ocean)Share of fluctuating RESRES share (domestic generation)
2009
4228229106523.97046740
2.61.40.00
110.73.15.61.4000
6.05.2
4332838332111533.9700806740
2.64.51.400
72%19%
2015
35,85730,8807,7371,3758,46713,302
1,2553,722476270566
1,42896418
10.4%2,193
2020
33,71026,2035,902803
8,79110,707
1,2336,274539702
1,0431,9551,967
6818.6%5,147
2030
29,81118,1544,195300
7,5176,143
011,657
5711,6922,5363,1633,532162
39.1%9,619
2040
26,38710,9591,777
05,8463,337
015,427
5862,2683,8013,6504,815306
58.5%12,494
2050
22,8664,8996070
2,3021,990
017,966
6472,5564,7763,6705,869448
78.6%14,586
TotalFossilHard coalLigniteNatural gasCrude oil
NuclearRenewablesHydroWindSolarBiomassGeothermal/ambient heatOcean energyRES share‘Efficiency’ savings (compared to Ref.)
2009
36,07629,9067,6921,5446,01914,651
4,6651,50641232877112630
4.2%0
2015
980491144285582
3668174
1,01649715230264
2,097133%294246376
1,000181
20410.351
2020
70834183258242
4656324
7543468929029
1,697108%258205333734167
2058.3454
2030
49626233186132
3600351
5322633322115
1,11771%158119201516123
2045.5918
2040
241950
14402
4100410
283950
1862
55635%86838625744
1992.8
1,373
2050
46004502
1800180
6400622
16410%2333395117
1930.9
1,659
2009
858469152171634
34611125
89247516318371
2,042130%301253425876187
20110.2
0
2015
86454100
19817412120
7,0496,2274941701580
7,3336,4465471701700
12%
106
2020
183938612
30521549364
6,8105,4637103213160
7,2975,7718453233544
21%
331
2030
52614224210537
394152153818
6,1993,4881,07477583526
7,1193,7821,46988095334
47%
760
2040
6482633722758
59312727817117
5,4191,9851,1301,0451,168
91
6,6602,1371,7451,2721,398108
67%
1,287
2050
6040
29024272
8834744136331
4,506553
1,0761,2401,371266
5,993600
1,8081,4821,806297
90%
1,858
2009
38211600
177173400
6,6376,2163187428
6,8516,41133874290
6.4%
0
table 12.164: oecd asia oceania: final energy demandPJ/a

WORLD ENERGY [R]EVOLUTIONA SUSTAINABLE WORLD ENERGY OUTLOOK
oecd asia oceania: investment & employment
12
glo
ssary &
appen
dix
|APPENDIX - O
ECD ASIA OCEANIA
table 12.165: oecd asia oceania: total investment in power sectorMILLION $ 2041-2050
114,25085,85010,42718,87023,53211,9966,96411,2222,838
2,940703,02473,05425,699190,901194,93481,63764,88471,916
2011-2050
1,018,676456,47145,840160,95695,76651,40035,38958,4428,679
315,1332,610,856205,013192,841655,604706,671314,021288,858247,848
2011-2050AVERAGEPER YEAR
25,46711,4121,1464,0242,3941,285885
1,461217
7,87865,2715,1254,82116,39017,6677,8517,2216,196
2031-2040
216,460132,44310,53444,44331,20611,56511,87120,0922,732
62,777697,51560,56144,533190,739185,55973,99582,46059,669
2021-2030
344,952111,53911,62048,74922,44315,0927,3334,4581,844
76,766582,22340,04356,950165,970168,96061,68239,13149,487
2011-2020
343,014126,63913,25948,89418,58412,7479,22122,6701,265
172,649628,09531,35665,659107,995157,21996,708102,38266,776
Reference scenario
Conventional (fossil & nuclear)RenewablesBiomassHydroWindPVGeothermalSolar thermal power plantsOcean energy
Energy [R]evolution
Conventional (fossil & nuclear)RenewablesBiomassHydroWindPVGeothermalSolar thermal power plantsOcean energy
table 12.166: oecd asia oceania: total investment in renewable heating only (EXCLUDING INVESTMENTS IN FOSSIL FUELS)
2041-2050
14,5169,143
014,359
877
442,20345,63896,277172,770127,518
2011-2050
114,42562,078
043,7218,626
1,563,275262,599237,804592,829470,044
2011-2050AVERAGEPER YEAR
2,8611,552
01,093216
39,0826,5655,94514,82111,751
2031-2040
15,9069,783
05,678446
425,93161,01561,380161,014142,522
2021-2030
47,98421,275
023,0263,683
414,43077,64560,927161,028114,830
2011-2020
26,15621,877
0659
3,621
280,71178,30119,22098,01685,175
MILLION $
Reference scenario
RenewablesBiomassGeothermalSolarHeat pumps
Energy [R]evolution scenario
RenewablesBiomassGeothermalSolarHeat pumps
table 12.167: oecd asia oceania: total employment THOUSAND JOBS
2010
562181942.4255
7764387534207.19.30.83.60.3
--
255
2015
4313891094.4258
6277457435245.95.90.62.30.2
-0.03258
2020
4714941215.7282
7377528038238.28.60.61.30.4
-0.003282
REFERENCE ENERGY [R]EVOLUTION2030
168
10311916.2262
7177348039246.74.60.51.20.73.3
-262
2015
18564891182.4458
476449298642949748.38.8183414458
2020
201851011120.3500
325045372832776
1065.78.1114015500
2030
159631241290.3477
2145443671272751725.17.47.93930477
By sectorConstruction and installationManufacturingOperations and maintenanceFuel supply (domestic)Coal and gas exportTotal jobs
By technologyCoalGas, oil & dieselNuclearTotal renewables
BiomassHydroWindPVGeothermal powerSolar thermal powerOceanSolar - heatGeothermal & heat pump
Total jobs
336

glo
ssary &
appen
dix
|APPENDIX
337
12
WORLD ENERGY [R]EVOLUTIONA SUSTAINABLE WORLD ENERGY OUTLOOK
12
glo
ssary &
appen
dix
|2005-2012 DEVELOPMENT OF THE ENERGY [R
]EVOLUTION SCENARIOS
338
2005 – 2012 development of energy [r]evolution scenarios
Greenpeace published the first Energy [R]evolution scenario inMay 2005 for the EU-25 in conjunction with a 7-month long shiptour from Poland all the way down to Egypt. In five years the workhas developed significantly. The very first scenario was launched onboard of the ship with the support of former EREC Policy DirectorOliver Schäfer, the start of a long-lasting fruitful Energy[R]evolution collaboration between Greenpeace International andEREC. The German Aerospace Center’s Institute for TechnicalThermodynamics under Dr. Wolfram Krewitt’s leadership has beenthe scientific institution behind all published reports since then aswell. Between 2005 and 2009, these three very differentstakeholders managed to put together over 30 scenarios forcountries from all continents and published two editions of theGlobal Energy [R]evolution scenario which became a well-respected, progressive, alternative energy blueprint. The work hasbeen translated into over 15 different languages including Chinese,Japanese, Arabic, Hebrew, Spanish, Thai and Russian.
The concept of Energy [R]evolution scenario has been underconstant development ever since and today we are able tocalculate employment effects in parallel to the scenariodevelopment as well. The calculation program MESAP/PlaNethas been developed by software company seven2one and lots offeatures have been developed for this project. For the 2010edition, we developed a standardised report tool, which providesus with a “ready to print” executive summary for each regionand/or country we calculate and finally all regions interact witheach other, so the global scenario is set up like a cascade. Theseinnovative developments serve for an ever improving quality,faster development times and more user-friendly outputs.
In the past years, a team of about 20 scientists for all regionsacross the world formed to review regional and or country specificscenarios and to make sure that it has a basis within the region.
In some cases Energy [R]evolution scenarios have been the first-ever published, long-term energy scenario for a country, like theTurkish scenario published in 2009. Since the first Global Energy[R]evolution scenario published in January 2007, we have doneside events on every single UNFCCC climate conference, countlessenergy conferences and panel debates. Over 200 presentations inmore than 30 languages always had one message in common.“The Energy Revolution is possible; it is needed and pays off forfuture generations!”
Many high level meetings took place, for example on the 15thJuly 2009 when the Chilean President Michelle Bacheletattended our launch event for the Energy [R]evolution Chile.
The Energy [R]evolution work is a corner-stone of theGreenpeace climate and energy work worldwide and we wouldlike to thank all involved stakeholders. Unfortunately, in October2009, Dr Wolfram Krewitt from DLR passed away far too earlyand left a huge gap for everybody. His energy and dedicationhelped to make the energy revolution project a true success story.Arthouros Zervos and Christine Lins from EREC have beeninvolved in this work from the very beginning and Sven Teske
from Greenpeace International heads this work since the firstdevelopment late 2004. The well-received layout of all Energy[R]evolution documents has been done – also from the verybeginning – from Tania Dunster and Jens Christiansen from“onehemisphere” in Sweden with enormous passions especially inthe final phase when the report goes to print.
The third version of the report, published in June 2010 in Berlin,reached out the scientific community to a much larger extent. TheIPCC’s Special Report Renewables (SRREN) chose the Energy[R]evolution as one of the four benchmark scenarios for climatemitigation energy scenarios (discussed in this edition Chapter 4).That Energy [R]evolution was the most ambitious scenario:combining an uptake of renewable energies and energy efficiency,and put forwards the highest renewable energy share by 2050.However, this high share resulted in a very strict efficiencystrategy, and other scenarios actually had more renewables interms of Exajoule by the year 2050. Following the publication ofthe SRREN in May 2011 in Abu Dhabi, the ER became a widelyquoted energy scenario and is now part of many scientific debatesand referenced in numerous scientific peer-reviewed literatures.
This new edition, the Energy [R]evolution 2012, takes intoaccount the significantly changed situation of the global energysector that has occurred in just two years. In Japan, theFukushima Nuclear disaster following the devastating tsunami inJapan, triggered a faster phase-out of nuclear power in severalcountries. A serious oil spill occurred at the Deepwater Horizondrilling platform in the Gulf of Mexico in 2010, highlighting thedamage that can be done to eco-systems, and some countries areindicating new oil exploration in ever-more sensitive environmentslike the Arctic Circle. There is an increase in shale gas, which is aparticularly carbon-intensive way to obtain gas, and has requireda more detailed analysis where the gas use projection in theEnergy [R]evolution is coming from.
In the renewable energy sector, there has been a faster costreduction in the photovoltaic and wind industries, creating earlierbreak-even points for these renewable energy investments. Newand more detailed analysis of renewable energy potential isavailable and there are new storage technologies available, whichcould change the proportions of energy input types, for example,reduce the need for bio energy to make up the greenhouse gasreduction targets of the model.
Taking the above into account, this edition of the Energy[R]evolution includes:
• Detailed energy demand and technology investment pathwaysfor power, heating and transport
• Detailed employment calculations for all sectors
• Detailed analysis of the needed fossil fuel infrastructure (gas,oil exploration and coal mining capacities)
• Detailed market analysis of the current power plant market
12
glo
ssary &
appen
dix
|OVERVIEW OF THE ENERGY [R
]EVOLUTION SINCE 2005
339
overview of the energy [r]evolution publications since 2005
A Global Energy [R]evolution scenario has been published inseveral scientific and peer-review journals like “Energy Policy”.See below a selection of milestones from the Energy [R]evolutionwork between 2005 and June 2010.
June 2005: First Energy Revolution Scenario for EU 25presented in Luxembourg for members of the EU’sEnvironmental Council.
July – August 2005: National Energy Revolution scenarios forFrance, Poland and Hungary launched during an “Energyrevolution” ship tour with a sailing vessel across Europe.
January 2007: First Global Energy revolution Scenario publishedparallel in Brussels and Berlin.
April 2007: Launch of the Turkish translation from the Globalscenario.
July 2007: Launch of Futu[r]e Investment – An analysis of theneeded global investment pathway for the Energy [R]evolutionscenarios.
October 2008: Launch of the second edition of the Global Energy[R]evolution Report.
December 2008: Launch of a concept for specific feed in-tariffmechanism to implement the Global Energy [R]evolution Reportin developing countries at a COP13 side event in Poznan, Poland.
September 2009: Launch of the first detailed Job Analysis“Working for the Climate” – based on the global Energy[R]evolution report in Sydney/Australia.
November 2009: Launch of “Renewable 24/7” a detailedanalysis for the needed grid infrastructure in order to implementthe Energy [R]evolution for Europe with 90% renewable powerin Berlin / Germany.
June 2010: Launch of the third Global Energy [R]evolutionedition in Berlin / Germany.
May 2011: The IPCC Special Report Renewable Energy(SRREN) published its find report in Abu Dhabi – the Energy[R]evolution 2010 has been chosen as one out of four benchmarkscenarios.
June 2012: Launch of the fourth Global Energy [R]evolutionedition in Berlin / Germany.
energy [r]evolution country analysis & launch dates
• November 2007: Energy [R]evolution for Indonesia
• January 2008: Energy [R]evolution for New Zealand
• March 2008: Energy [R]evolution for Brazil
• March 2008: Energy [R]evolution for China
• June 2008: Energy [R]evolution for Japan
• June 2008: Energy [R]evolution for Australia
• August 2008: Energy [R]evolution for the Philippines
• August 2008: Energy [R]evolution for Mexico
• December 2008: Energy [R]evolution for the EU-27
• March 2009: Energy [R]evolution for the USA
• March 2009: Energy [R]evolution for India
• April 2009: Energy [R]evolution for Russia
• May 2009: Energy [R]evolution for Canada
• June 2009: Energy [R]evolution for Greece
• June 2009: Energy [R]evolution for Italy
• July 2009: Energy [R]evolution for Chile
• July 2009: Energy [R]evolution for Argentina
• October 2009: Energy [R]evolution for South Africa
• November 2009: Energy [R]evolution for Turkey
• April 2010: Energy [R]evolution for Sweden
• May 2011: Energy [R]evolution South Africa
• September 2011: Energy [R]evolution Japan
• September 2011: Energy [R]evolution Argentina
• November 2011: Energy [R]evolution Hungary
• April 2012: Energy [R]evolution for South Korea
• June 2012: Energy [R]evolution for Czech Republic
© GP/PETER CATON
image MINOTI SINGH AND HER SON AWAIT FORCLEAN WATER SUPPLY BY THE RIVERBANK INDAYAPUR VILLAGE IN SATJELLIA ISLAND: “WE DONOT HAVE CLEAN WATER AT THE MOMENT AND ONLYONE TIME WE WERE LUCKY TO BE GIVEN SOMERELIEF. WE ARE NOW WAITING FOR THEGOVERNMENT TO SUPPLY US WITH WATER TANKS”.
energy[r]evolution
© PLANETARY VISIONS LIMITED
image SATELLITE IMAGERY OF ANTARCTICA (22.5W, 90.0S.) BASED ON A COMBINATION OF DATA FROM THREE EARTH-OBSERVATION SATELLITE SYSTEMS. A MOSAIC OF THOUSANDSOF IMAGES TAKEN BY NOAA POLAR ORBITER WEATHER SATELLITES WAS COMBINED WITH 10 YEARS OF OCEAN COLOUR OBSERVATIONS FROM NASA’S NIMBUS 7 AND IMAGES OFTHE POLAR ICE CAPS FROM THE US AIR FORCE DEFENSE METEOROLOGICAL SATELLITE PROGRAM. front cover images SATELLITE IMAGERY OF THE ARCTIC REGION (45.0E, 90.0N.) © PLANETARY VISIONS LIMITED, © MARKEL REDONDO/GREENPEACE, © FRANCISCO RIVOTTI/GREENPEACE.
Greenpeace is a global organisation that usesnon-violent direct action to tackle the mostcrucial threats to our planet’s biodiversity andenvironment. Greenpeace is a non-profitorganisation, present in 40 countries acrossEurope, the Americas, Africa, Asia and thePacific. It speaks for 2.8 million supportersworldwide, and inspires many millions more totake action every day. To maintain itsindependence, Greenpeace does not acceptdonations from governments or corporations butrelies on contributions from individual supportersand foundation grants. Greenpeace has beencampaigning against environmental degradationsince 1971 when a small boat of volunteers andjournalists sailed into Amchitka, an area west ofAlaska, where the US Government wasconducting underground nuclear tests. Thistradition of ‘bearing witness’ in a non-violentmanner continues today, and ships are animportant part of all its campaign work.
Ottho Heldringstraat 5, 1066 AZAmsterdam, The Netherlandst +31 20 718 2000 f +31 20 718 [email protected]
The Global Wind Energy Council (GWEC)is the voice of the global wind energy sector.GWEC works at highest internationalpolitical level to create better policyenvironment for wind power. GWEC’s missionis to ensure that wind power establisheditself as the answer to today’s energychallenges, producing substantialenvironmental and economic benefits. GWECis a member based organisation thatrepresents the entire wind energy sector. Themembers of GWEC represent over 1,500companies, organisations and institutions inmore than 70 countries, includingmanufacturers, developers, componentsuppliers, research institutes, national windand renewables associations, electricityproviders, finance and insurance companies.
Rue d’Arlon 801040 Brussels, Belgiumt +32 2 213 1897 f+32 2 213 [email protected] www.gwec.net
European Renewable Energy Council (EREC)Created in April 2000, the EuropeanRenewable Energy Council (EREC) is theumbrella organisation of the Europeanrenewable energy industry, trade and researchassociations active in the sectors of bioenergy,geothermal, ocean, small hydro power, solarelectricity, solar thermal and wind energy.EREC thus represents the European renewableenergy industry with an annual turnover of€70 billion and employing 550,000 people.
Renewable Energy House, 63-67 rue d’Arlon B-1040 Brussels, Belgiumt +32 2 546 1933 f+32 2 546 [email protected] www.erec.org