Energy reform and local content in Mexico
103
Energy reform and local content in Mexico Effects in the mining sector Dr. Guillermo A. Musik Asali Dr. Ramón Espinasa Dr. Martin Walter Inter-American Development Bank Energy Division Infrastructure & Environment Sector TECHNICAL NOTE No. IDB-TN-771 April 2015
Transcript of Energy reform and local content in Mexico
Energy reform and local content in Mexico
Effects in the mining sector
Dr. Guillermo A. Musik Asali Dr. Ramón Espinasa Dr. Martin Walter
Inter-American Development Bank
Energy Division Infrastructure & Environment Sector
TECHNICAL NOTE
No. IDB-TN-771
April 2015

Energy reform and local content in Mexico
Effects in the mining sector
Dr. Guillermo A. Musik Asali Dr. Ramón Espinasa
Dr. Martin Walter
Inter-American Development Bank
2015

2015
Cataloging-in-Publication data provided by the Inter-American Development Bank Felipe Herrera Library Musik Asali, Guillermo Abdel . Energy reform and local content in Mexico: Effects in the mining sector / Guillermo Abdel Musik, Ramon Espinasa, Martin Walter. p. cm. — (IDB Technical Note ; 771) Includes bibliographic references. 1. Power resources—Law and legislation—Mexico. 2. Petroleum industry and trade—Mexico. 3. Mineral industries—Mexico. 4. Energy development—Mexico. I. Espinasa, Ramón . II. Walter, Martin. III. Inter-American Development Bank. Energy Division. IV. Title V. Series. IDB-TN-771 JEL code: K20; Q3; Q38; Q48
http://www.iadb.org
Copyright © Inter-American Development Bank. This work is licensed under a Creative Commons
IGO 3.0 Attribution-NonCommercial-NoDerivatives (CC-IGO BY-NC-ND 3.0 IGO) license (http://creative-commons.org/licenses/by-nc-nd/3.0/igo/legalcode) and may be reproduced with attribution to the IDB and for any non-commercial purpose. No derivative work is allowed.
Any dispute related to the use of the works of the IDB that cannot be settled amicably shall be submitted to arbitration pursuant to the UNCITRAL rules. The use of the IDB’s name for any purpose other than for attribution, and the use of IDB’s logo shall be subject to a separate written license agreement between the IDB and the user and is not authorized as part of this CC-IGO license.
Note that link provided above includes additional terms and conditions of the license.
The opinions expressed in this publication are those of the authors and do not necessarily reflect the views of the Inter-American Development Bank, its Board of Directors, or the countries they represent.
Ramon Espinasa ([email protected])
Martin Walter ([email protected]); Guillermo Abdel Musik ([email protected])
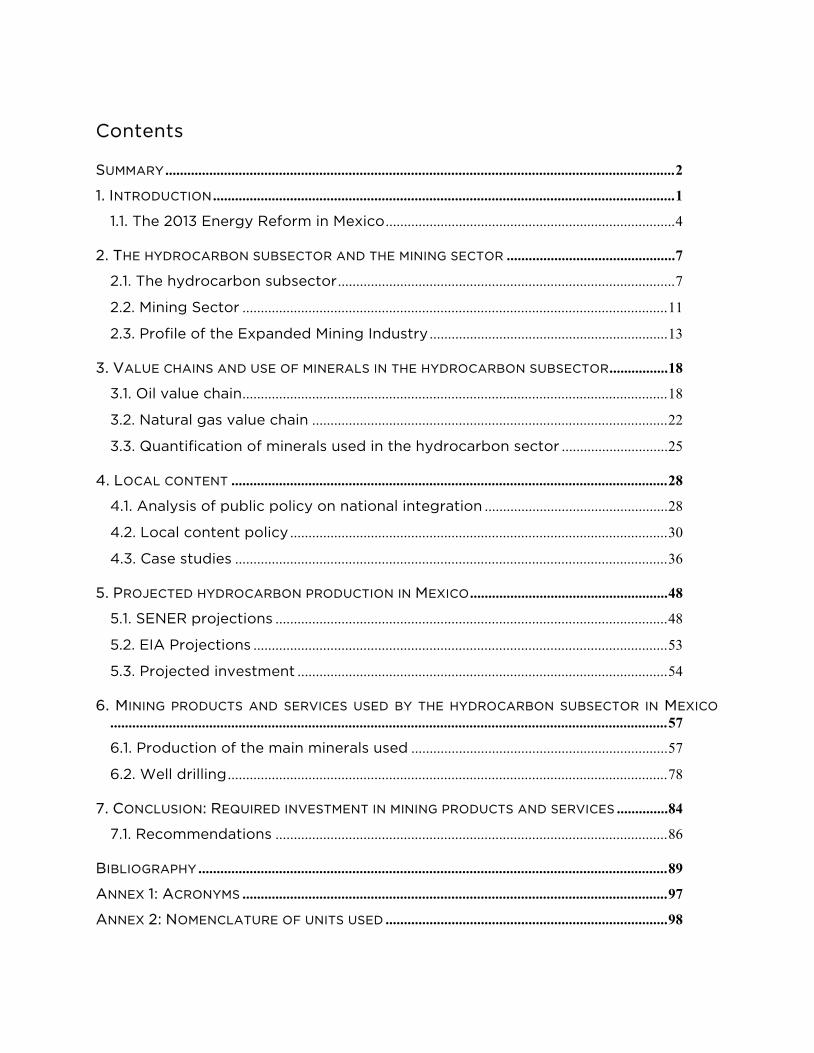
Contents
SUMMARY ........................................................................................................................................... 2
1. INTRODUCTION .............................................................................................................................. 1
1.1. The 2013 Energy Reform in Mexico ............................................................................... 4
2. THE HYDROCARBON SUBSECTOR AND THE MINING SECTOR .............................................. 7
2.1. The hydrocarbon subsector ............................................................................................ 7
2.2. Mining Sector .................................................................................................................... 11
2.3. Profile of the Expanded Mining Industry ................................................................. 13
3. VALUE CHAINS AND USE OF MINERALS IN THE HYDROCARBON SUBSECTOR ................ 18
3.1. Oil value chain .................................................................................................................... 18
3.2. Natural gas value chain ................................................................................................. 22
3.3. Quantification of minerals used in the hydrocarbon sector ............................. 25
4. LOCAL CONTENT ....................................................................................................................... 28
4.1. Analysis of public policy on national integration .................................................. 28
4.2. Local content policy ....................................................................................................... 30
4.3. Case studies ...................................................................................................................... 36
5. PROJECTED HYDROCARBON PRODUCTION IN MEXICO ...................................................... 48
5.1. SENER projections ........................................................................................................... 48
5.2. EIA Projections ................................................................................................................. 53
5.3. Projected investment ..................................................................................................... 54
6. MINING PRODUCTS AND SERVICES USED BY THE HYDROCARBON SUBSECTOR IN MEXICO........................................................................................................................................................ 57
6.1. Production of the main minerals used ...................................................................... 57
6.2. Well drilling ........................................................................................................................ 78
7. CONCLUSION: REQUIRED INVESTMENT IN MINING PRODUCTS AND SERVICES .............. 84
7.1. Recommendations ........................................................................................................... 86
BIBLIOGRAPHY ................................................................................................................................ 89
ANNEX 1: ACRONYMS .................................................................................................................... 97
ANNEX 2: NOMENCLATURE OF UNITS USED ............................................................................. 98
2
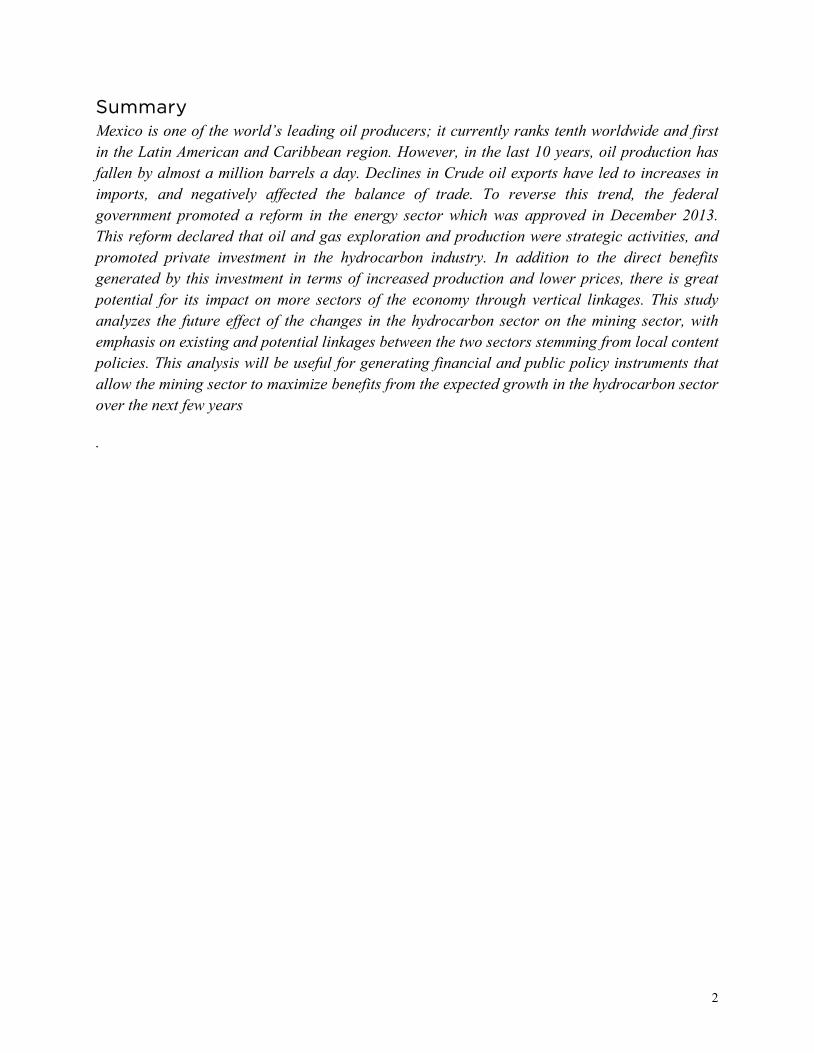
Summary Mexico is one of the world’s leading oil producers; it currently ranks tenth worldwide and first in the Latin American and Caribbean region. However, in the last 10 years, oil production has fallen by almost a million barrels a day. Declines in Crude oil exports have led to increases in imports, and negatively affected the balance of trade. To reverse this trend, the federal government promoted a reform in the energy sector which was approved in December 2013. This reform declared that oil and gas exploration and production were strategic activities, and promoted private investment in the hydrocarbon industry. In addition to the direct benefits generated by this investment in terms of increased production and lower prices, there is great potential for its impact on more sectors of the economy through vertical linkages. This study analyzes the future effect of the changes in the hydrocarbon sector on the mining sector, with emphasis on existing and potential linkages between the two sectors stemming from local content policies. This analysis will be useful for generating financial and public policy instruments that allow the mining sector to maximize benefits from the expected growth in the hydrocarbon sector over the next few years
.
1
1. Introduction
Mexico is one of the world’s leading oil producers; it currently ranks tenth worldwide and first in the Latin American and Caribbean region (EIA, 2014)1. Proven crude reserves in 2013 were 10.1 billion barrels and 17.0 billion cubic feet of natural gas (Pemex, 2014a).
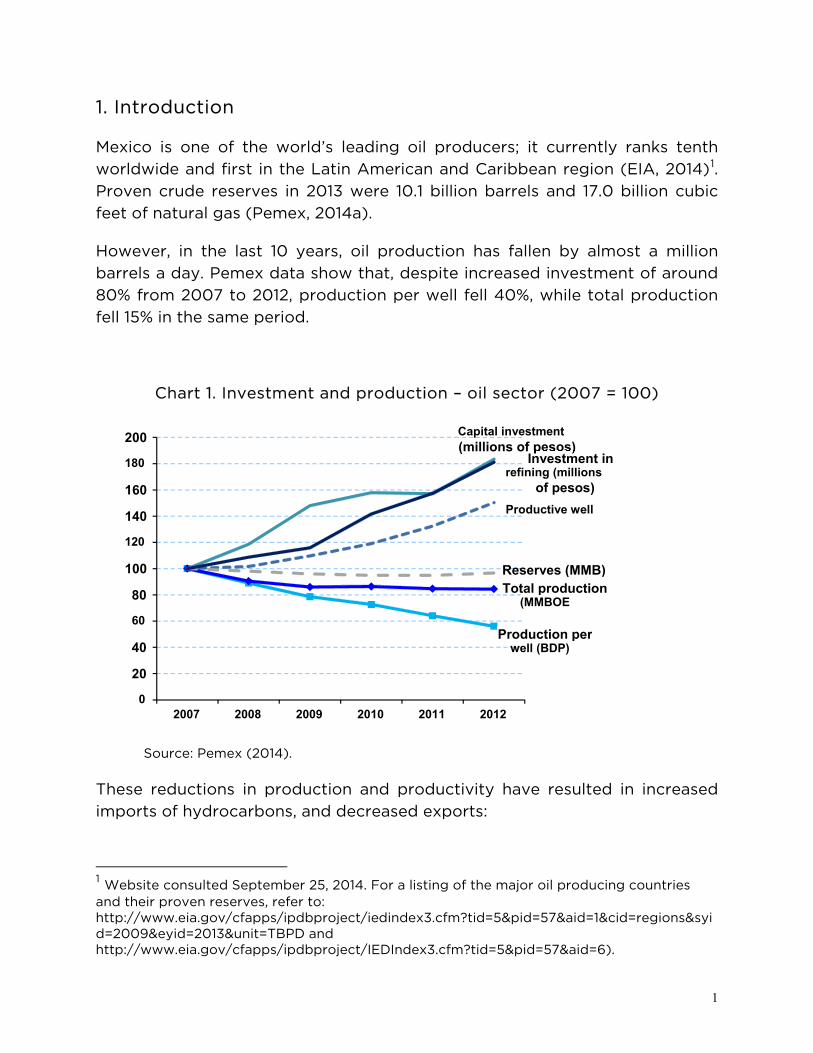
However, in the last 10 years, oil production has fallen by almost a million barrels a day. Pemex data show that, despite increased investment of around 80% from 2007 to 2012, production per well fell 40%, while total production fell 15% in the same period.
Chart 1. Investment and production – oil sector (2007 = 100)
Source: Pemex (2014).
These reductions in production and productivity have resulted in increased imports of hydrocarbons, and decreased exports:
1 Website consulted September 25, 2014. For a listing of the major oil producing countries and their proven reserves, refer to: http://www.eia.gov/cfapps/ipdbproject/iedindex3.cfm?tid=5&pid=57&aid=1&cid=regions&syid=2009&eyid=2013&unit=TBPD and http://www.eia.gov/cfapps/ipdbproject/IEDIndex3.cfm?tid=5&pid=57&aid=6).
Productive well
Production per well (BDP)
Total production (MMBOE
Reserves (MMB)
Capital investment (millions of pesos)
Investment in refining (millions
of pesos)
0 20
40
60 80
100
120 140
160
180 200
2007 2008 2009 2010 2011 2012
2
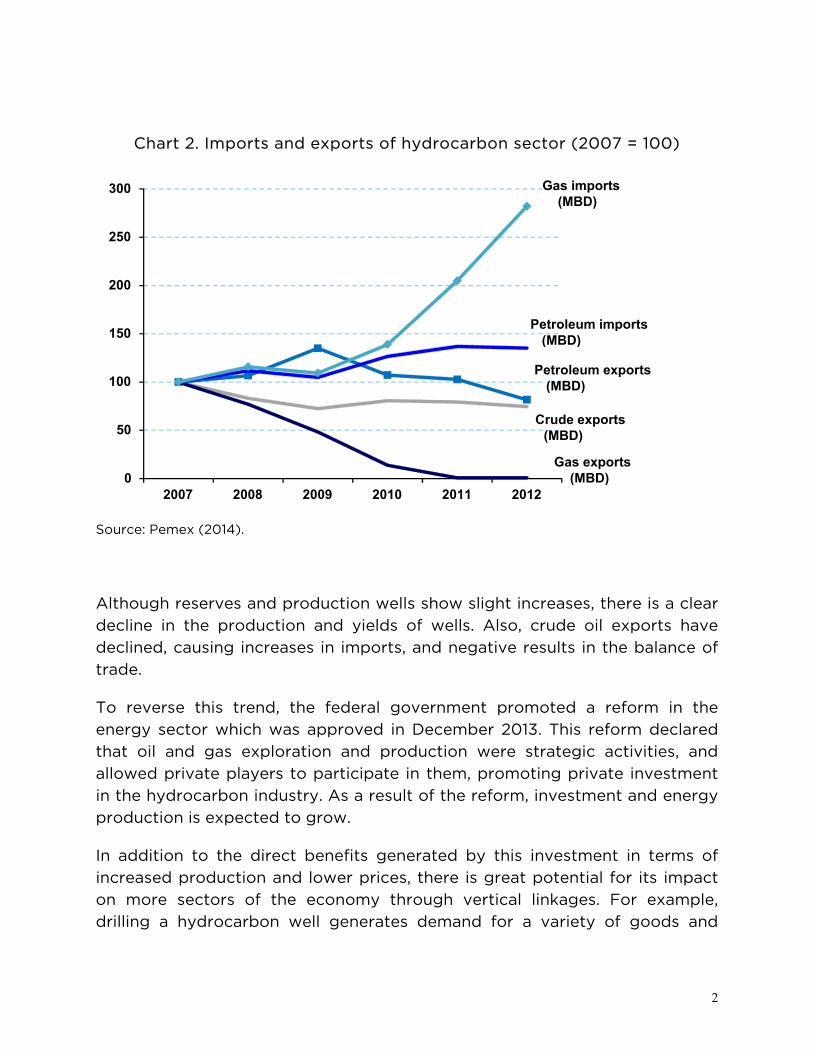
Chart 2. Imports and exports of hydrocarbon sector (2007 = 100)
Source: Pemex (2014).
Although reserves and production wells show slight increases, there is a clear decline in the production and yields of wells. Also, crude oil exports have declined, causing increases in imports, and negative results in the balance of trade.
To reverse this trend, the federal government promoted a reform in the energy sector which was approved in December 2013. This reform declared that oil and gas exploration and production were strategic activities, and allowed private players to participate in them, promoting private investment in the hydrocarbon industry. As a result of the reform, investment and energy production is expected to grow.
In addition to the direct benefits generated by this investment in terms of increased production and lower prices, there is great potential for its impact on more sectors of the economy through vertical linkages. For example, drilling a hydrocarbon well generates demand for a variety of goods and
Crude exports (MBD)
Petroleum exports (MBD)
Gas exports (MBD)
Petroleum imports (MBD)
Gas imports (MBD)
0
50
100
150
200
250
300
2007 2008 2009 2010 2011 2012
3
services, ranging from specialized drilling machinery and chemicals, to roads, food services and mining products.
This study analyzes the future effect of the changes in the hydrocarbon sector on the mining sector, with emphasis on existing and potential linkages between the two sectors stemming from local content policies. This analysis will be useful for generating financial and public policy instruments that allow the mining sector to maximize benefits from the expected growth in the hydrocarbon sector over the next few years.
To achieve this objective, the paper is divided into seven chapters. The rest of this chapter describes the expected benefits of the Energy Reform, and the main changes to the constitutional articles that support the reform. The aim is to identify complementarities and areas of opportunity for promoting local content policies for the mining sector.
The second chapter describes the political, institutional and regulatory aspects of the hydrocarbon subsector and mining sector, describing the structure of both sectors in the context of the recent Energy Reform. The chapter starts from documentary research on the legal and regulatory framework of the hydrocarbon industry, and concludes with the concept of Expanded Mining Industry, comprising various mining products and services which can be used by the hydrocarbon sector.
For a better understanding of hydrocarbon production and the areas of opportunity in which greater involvement in the mining sector could be stimulated, the third chapter presents a study on the value chain of oil, natural gas and the derived demand for minerals, and goods and services by link.
In the fourth chapter local content policies are analyzed from their definition and applications, to the policies relating to local content applied in Mexico. The cases of Norway, Brazil and Colombia are discussed, as experiences in the design and application of local content policies in the hydrocarbon industry.
The fifth chapter presents the outlook for growth of oil and natural gas production over the next 20 years, based on official statistics, and the outlook for investment required to reach expected production levels. From this information, combined with data on production of the minerals used in hydrocarbon production, the study estimates potential demand for these minerals and the investment required to meet the expected increases.

4
The sixth chapter describes the value chains, and analyzes the production of the main metallic and nonmetallic minerals, as well as the activities of the mining production chain of the Mexican companies that receive or may receive support from the Mining Development Trust (Fifomi).2
The final chapter details the conclusions and makes recommendations for development of tools to facilitate the growth and development of the small- and medium-scale mining which produces the minerals used in hydrocarbon production.
1.1. The 2013 Energy Reform in Mexico
For 75 years hydrocarbon production in Mexico was an exclusive right of the State. This situation changed radically with the Energy Reform in December 2013, which opened the door to private investment in the sector and its participation in various productive activities in the value chain. The main objective of the reform was to increase the competitiveness of the energy sector, by creating a legal framework which guarantees international standards of efficiency, transparency and accountability.
The Reform is also expected to attract investment into the Mexican energy sector, which will drive growth in future years. According to estimates, projected oil production will reach annual average growth rates of 4% in barrels per day. By 2018 this figure will be equivalent to a volume of 3 million barrels per day (González, 2014).
2 Fifomi is a para-state entity attached to the SE, which promotes the strengthening and integration of mining and its production chains through financing, training and technical assistance.

5
Chart 3. Projected oil production
Source: González (2014).
The Energy Reform is expected to bring considerable benefits to the economy by allowing private companies to obtain licenses in order to record reserves in their assets, which will be a major attraction for foreign investors. It is estimated that, in order to develop proven reserves, the reform will attract annual private investment of US$12.00 billion, in addition to the US$15.00 billion investment to be made by Pemex in exploration and development (De la Fuente 2013).
The specific benefits that the federal government expects to obtain from the Energy Reform are (Federal Government, 2013):
1. Reduce electricity rates, gas and food prices.
2. Achieve rates of return of proven oil and gas reserves above 100%.
3. Increase oil production from the 2.5 million barrels per day currently produced, to 3 million barrels in 2018 and to 3.5 million in 2025. Increase production of natural gas from current production of 5.70 billion cubic feet per day to 8.00 billion in 2018 and to 10.40 billion in 2025.
4. Generate about 1 percentage point economic growth in 2018 and approximately 2 percentage points more by 2025.
6
5. Create nearly half a million additional jobs in the six-year period and 2.5 million more jobs by 2025.
The legal basis of the Energy Reform includes changes to several paragraphs in Articles 25, 27 and 28 of the Constitution, and the decree establishing the Energy Reform. These amendments specify the possibility of private participation in the sector, and the exclusive rights retained by the State.
The amendments to the fourth paragraph of Article 25 state in the main that the Nation is responsible for the planning and control of the national grid and the public service of electricity transmission and distribution, in addition to exploration and production of oil and other hydrocarbons. They state that "the law shall establish the regulations relating to the administration, organization, operation, contracting procedures and other legal transactions that productive State enterprises enter into, as well as the remuneration regime of their staff [...]."
Article 27 states that the planning and control of the national grid, electric power transmission and distribution, remain under State control. Changes to Article 27 state that "no concessions will be granted, without prejudice to the State entering into contracts with private parties on the terms established by law, which will also determine the way in which private entities can participate in the other activities of electricity industry.”
It also states that the State "shall undertake the exploration and production of oil and other hydrocarbons through allocations to productive state enterprises or through contracts with these or with private parties [...]." That is, the Nation retains ownership of the hydrocarbons, but exploration and production activities can be undertaken through contracts with Pemex or private parties.
For their part, the amendments to Article 28 relating to the functions that the State exercises in planning and control of the national grid, the public service electric power transmission and distribution system, and exploration and production of oil and other hydrocarbons, do not constitute monopolies. Moreover, the State will set up a public trust known as the Mexican Oil Fund for Stabilization and Development, to receive, manage and distribute the income from allocations and contracts for exploration and production of oil and other hydrocarbons.
7
Amendments to Article 27 of the Constitution are particularly relevant with respect to the possibility of creating linkages between various industries and the national hydrocarbon industry since, for the first time, the State may assign, through contracts, the operation of productive activities to private entities. This opens up important opportunities for the industries in the hydrocarbon value chain, particularly the mining sector.
2. The hydrocarbon subsector and the mining sector
This chapter describes the political and institutional context of the mining sector and the hydrocarbon subsector. This chapter describes the functions of the State in the production chains of the sectors analyzed, and those responsible for decisions and activities that take place by link and phase of the value processes in the industry.
The chapter also analyzes the Expanded Mining Industry (IMA Spanish acronym), which is relevant to this study because, apart from mining activities related to the hydrocarbon subsector, it includes related services such as oil and gas drilling, which are also expected to receive a significant impact from the Energy Reform and local content policies.
2.1. The hydrocarbon subsector
The starting point of the recent history of the oil industry in Mexico is the expropriation of 1938. The expropriation resulted in a radical change in the structure and production of oil in Mexico, completely eliminating the participation of foreign companies, placing absolute control of oil resources in the hands of the Mexican state. In later decades, its powers were expanded with the creation of para-state companies and institutions which participated and controlled each stage of production in the industry, such as Pemex and the Mexican Petroleum Institute (Cárdenas Gracia, 2009).
In the 1940s, the nationalization policy established an economic model of import substitution, and thereafter the oil industry became a fundamental pillar of national economic development. The federal budget began to be defined on the basis of estimates of the industry’s production and sales, which in turn became the main source of foreign exchange for the country (Cárdenas Gracia, 2009).
8
Throughout the twentieth century laws and regulations were created and changed to restrict the participation of private entities which in turn burdened Pemex with fiscal responsibilities, as well as transferring its income to pay the budget deficit, as happened in the first decade of 2000 (Zenteno Barrios, 1997).
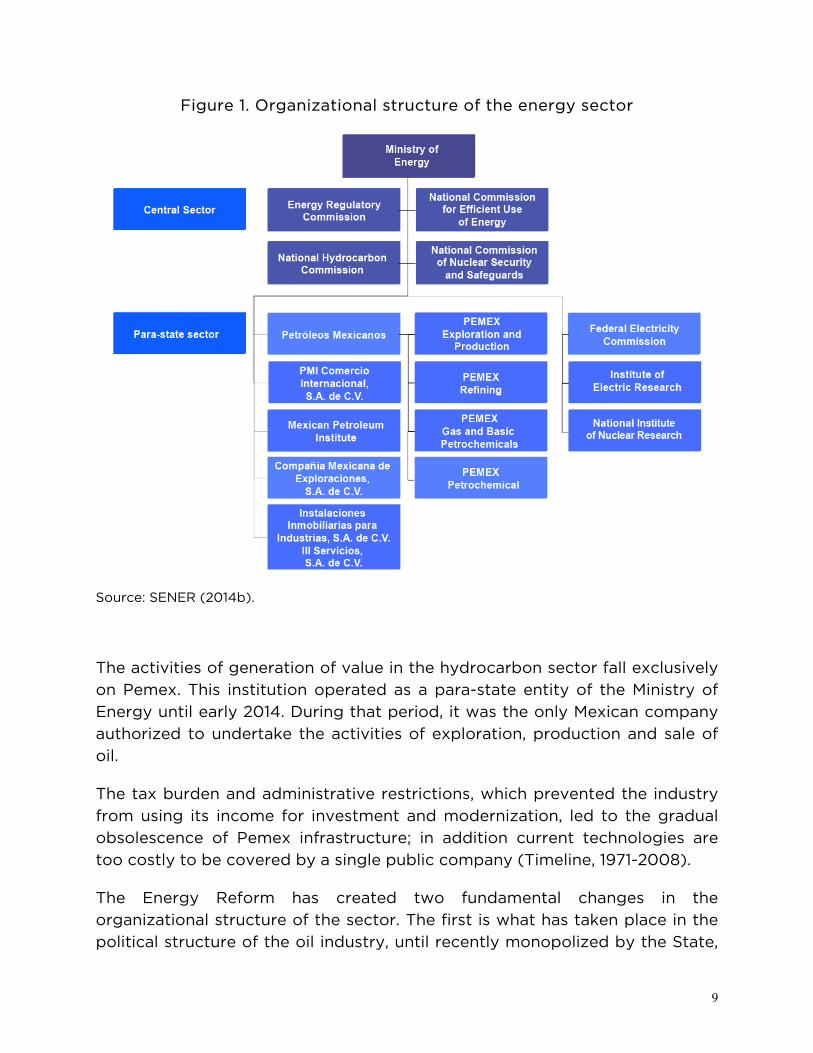
Currently, the energy sector in Mexico is coordinated by the Ministry of Energy, which is responsible for policies related to electricity and hydrocarbon production. In the organization of the sector, public enterprises are fundamental because, in addition to their contributions in economic terms and services, two of the largest companies in the country are in this sector: Petróleos Mexicanos and subsidiaries (Pemex) and the Federal Electricity Commission (CFE).3
The Energy Ministry (Secretaría de Energía, SENER), in addition to the companies mentioned, encompasses other entities responsible for various services related to the sector, including the Mexican Petroleum Institute, the Electrical Research Institute and the National Institute for Nuclear Research, responsible for scientific work and promoters of training of specialized human capital.
Exploration work and high technology services are undertaken by Compañía Mexicana de Exploraciones, S.A., while management services and real estate operations are the responsibility of III Servicios S.A. de C.V. Hydrocarbons are marketed internationally by PMI Comercio Internacional, S.A. de C.V.
3 Due to its scope and objectives, this paper will focus on the description and analysis of the oil industry and Pemex, only mentioning CFE, without going into details about the company.
9
Figure 1. Organizational structure of the energy sector
Source: SENER (2014b).
The activities of generation of value in the hydrocarbon sector fall exclusively on Pemex. This institution operated as a para-state entity of the Ministry of Energy until early 2014. During that period, it was the only Mexican company authorized to undertake the activities of exploration, production and sale of oil.
The tax burden and administrative restrictions, which prevented the industry from using its income for investment and modernization, led to the gradual obsolescence of Pemex infrastructure; in addition current technologies are too costly to be covered by a single public company (Timeline, 1971-2008).
The Energy Reform has created two fundamental changes in the organizational structure of the sector. The first is what has taken place in the political structure of the oil industry, until recently monopolized by the State,
10
which opens the door to participation by private actors in exploration, extraction and production processes of hydrocarbons, without the State losing ownership. As a result of the Energy Reform, the institutional organization of the sector will undergo significant changes in its structure and in related legislations and regulations.
The second organizational change is the change of Pemex’s legal personality from para-state to productive state enterprise, which is intended to give it an entrepreneurial character with budgetary autonomy, subject only to financial balance, a cap on personal services and autonomous budget projects (SENER, 2014a).
This new personality gives the Board of Directors of the company a new organizational structure in line with international best practices, and assigns special responsibilities and remuneration regimes in accord with similar companies in the private sector. As a productive State enterprise, Pemex must file financial information under the provisions of the Securities Market Law, even though it is not listed on the Stock Exchange (SENER, 2014a).
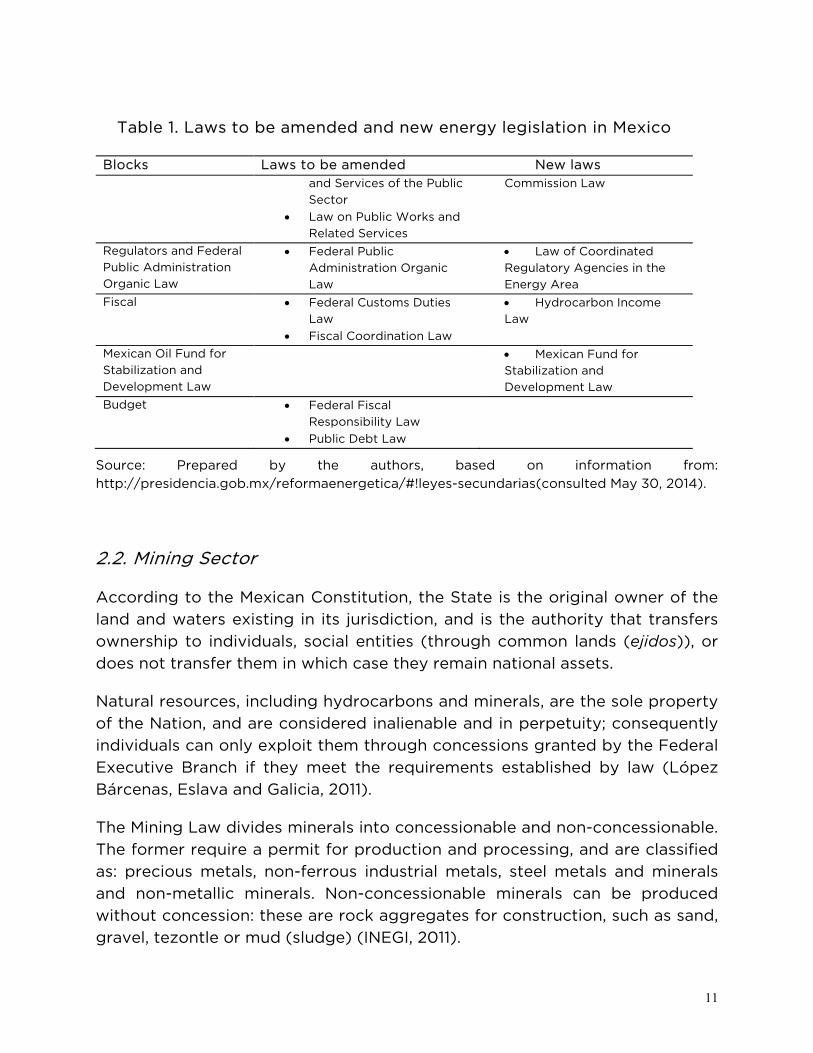
With respect to changes in the legislation of the hydrocarbon subsector, the Energy Reform of 2013 - with its amendments to Articles 25, 27 and 28 - required review and amendment of 12 laws, as well as nine new laws related to the sector, which were submitted to Congress in April 2014. The laws to be amended are grouped into nine blocks, as shown in Table 1.
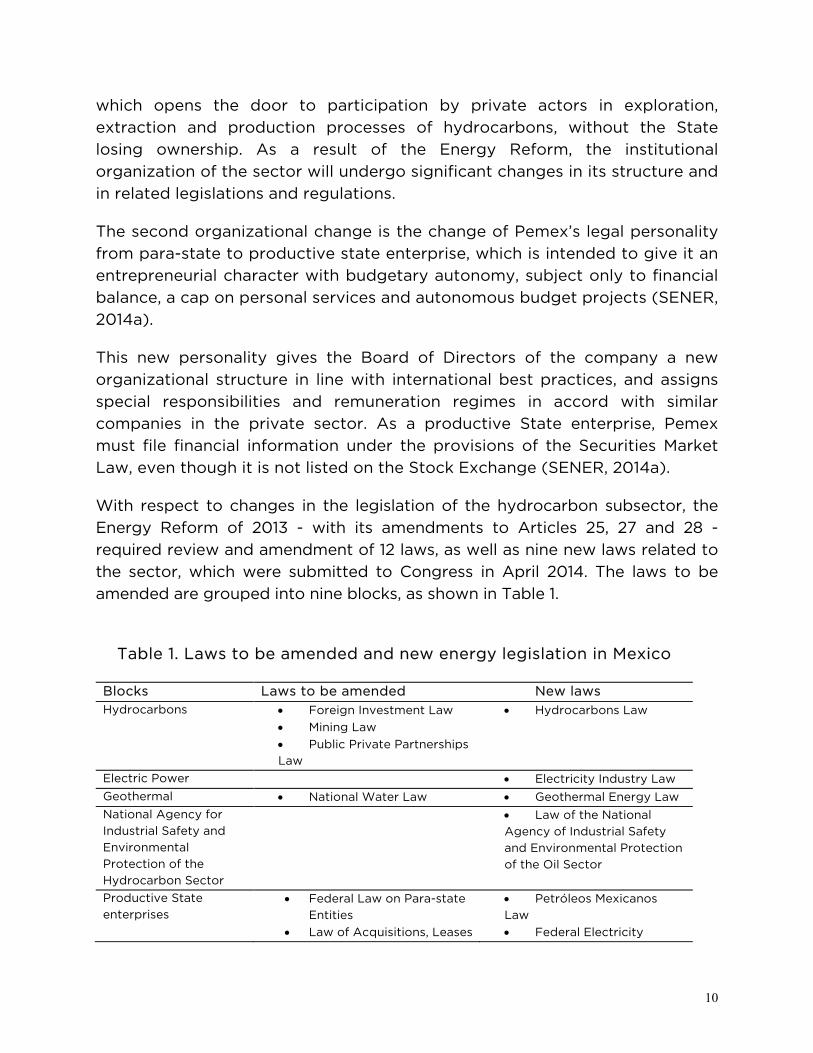
Table 1. Laws to be amended and new energy legislation in Mexico
Blocks Laws to be amended New laws Hydrocarbons • Foreign Investment Law
• Mining Law • Public Private Partnerships Law
• Hydrocarbons Law
Electric Power • Electricity Industry Law Geothermal • National Water Law • Geothermal Energy Law National Agency for Industrial Safety and Environmental Protection of the Hydrocarbon Sector
• Law of the National Agency of Industrial Safety and Environmental Protection of the Oil Sector
Productive State enterprises
• Federal Law on Para-state Entities
• Law of Acquisitions, Leases
• Petróleos Mexicanos Law • Federal Electricity
11
Table 1. Laws to be amended and new energy legislation in Mexico
Blocks Laws to be amended New laws and Services of the Public Sector
• Law on Public Works and Related Services
Commission Law
Regulators and Federal Public Administration Organic Law
• Federal Public Administration Organic Law
• Law of Coordinated Regulatory Agencies in the Energy Area
Fiscal • Federal Customs Duties Law
• Fiscal Coordination Law
• Hydrocarbon Income Law
Mexican Oil Fund for Stabilization and Development Law
• Mexican Fund for Stabilization and Development Law
Budget • Federal Fiscal Responsibility Law
• Public Debt Law
Source: Prepared by the authors, based on information from: http://presidencia.gob.mx/reformaenergetica/#!leyes-secundarias(consulted May 30, 2014).
2.2. Mining Sector
According to the Mexican Constitution, the State is the original owner of the land and waters existing in its jurisdiction, and is the authority that transfers ownership to individuals, social entities (through common lands (ejidos)), or does not transfer them in which case they remain national assets.
Natural resources, including hydrocarbons and minerals, are the sole property of the Nation, and are considered inalienable and in perpetuity; consequently individuals can only exploit them through concessions granted by the Federal Executive Branch if they meet the requirements established by law (López Bárcenas, Eslava and Galicia, 2011).
The Mining Law divides minerals into concessionable and non-concessionable. The former require a permit for production and processing, and are classified as: precious metals, non-ferrous industrial metals, steel metals and minerals and non-metallic minerals. Non-concessionable minerals can be produced without concession: these are rock aggregates for construction, such as sand, gravel, tezontle or mud (sludge) (INEGI, 2011).
12
Hydrocarbons and radioactive minerals do not fall into any of the above classifications because, until the Energy Reform, they could only be produced by the State (INEGI, 2011).
Historically, there have been significant changes to the role played by the State in mining. The Mexican mining industry has been nationalized since the 1960s, permitting direct state involvement and promoting modernization of systems, organization of mining work and vertical integration of the steel industry (CEC-ITAM, 2004).
In the 1970s and 1980s, nationalization led to interventionist policies which closed off entry and expelled foreign investment, which meant putting several Mexican and foreign companies under state control. The only survivors were large mining companies and companies of various sizes with high quality mineral deposits which operated at low cost. Mining was concentrated in a small number of Mexican companies and exploration was reduced to the bare minimum (CEC-ITAM, 2004).
In the 12 years between 1982 and 1994, the institutional structure favored linkage and shared policy between energy and mining, since both sectors were concentrated in the Ministry of Energy, Mines and Para-state Industry (SEMIP). However, over the years, the large size of para-state companies has reduced their flexibility to address the challenges following economic globalization and the change in international markets.
These deficiencies led to a change of policy in the 1990s. It was established that the government would no longer participate in mining companies and restrictions on foreign participation were removed. The opening of the sector coincided with an upturn in demand on international markets and the prices of the main metals. These factors facilitated increases in production and employment in the mining of gold, silver, zinc, copper, fluorspar, coal, gypsum, lead and iron.
The Foreign Investment Law allowed participation of up to 100% foreign capital in mining companies established under Mexican laws. With the signing of the North American Free Trade Agreement (NAFTA), 95% of tariff classifications were opened for Mexican mining-metallurgical products entering the northern market.
13
After the reforms and changes to mining legislation in the 1990s, there were no further changes or sweeping reforms to mining policy until the current Energy Reform, which is the latest change in this context.
The Energy Reform of 2013 will not require any changes to the institutional framework of the mining sector. However, it is important to be familiar with the latter to understand its structure and identify the agents and actors involved to determine which areas are linked to the hydrocarbon subsector.
2.3. Profile of the Expanded Mining Industry
The Expanded Mining Industry (IMA its Spanish acronym) is a concept developed by the National Institute of Statistics and Geography (INEGI) for the purpose of sectorial classification and is defined as "the set of activities directly related to mining of metallic and nonmetallic minerals, characterized by various production processes ranging from mining, concentration, smelting and refining, to the manufacture of products of intermediate or final demand for use by other manufacturing industries, the construction industry, or, for consumption in households." (INEGI, 2011).
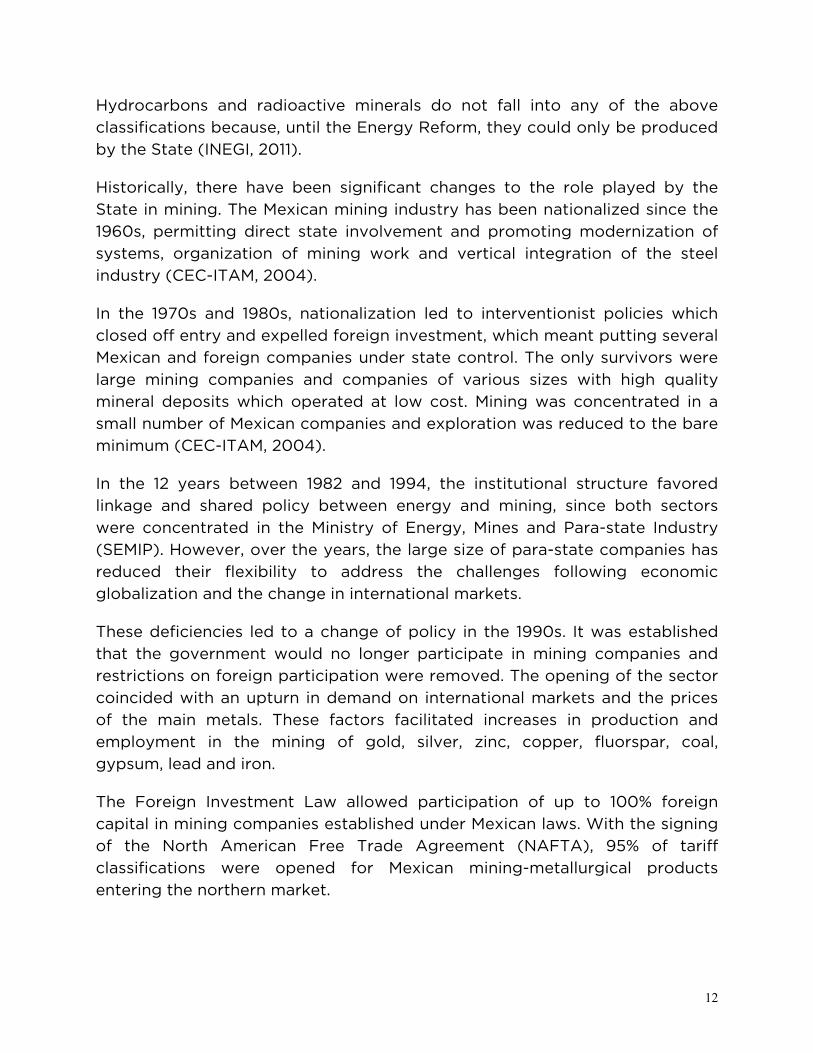
According to INEGI the concept of Expanded Mining Industry is based on analysis of the statistics derived from the mining industry and mineral manufacturing. Some economic mining activities are included in addition to oil and gas production, which are registered in the North American Industrial Classification System (NAICS). Table 2 shows the activities included in the concept of IMA.
Table 2. Sub-branches and sub-sectors in the IMA NIACS Code Subsector Classes included
212 Mining of metallic and nonmetallic minerals, except oil and gas
All except radioactive materials
213 Mining-related services Onea
324 Manufacture of oil and coal products All
327 Manufacturing of products based on
nonmetallic minerals
All
331 Basic metal industries All
a Includes only manufacture of coke and other refined oil and coal products.
14
The analysis of the IMA includes in Class 213 activities related to oil and gas drilling, which are expected to be impacted by the Energy Reform and local content policies arising from this.
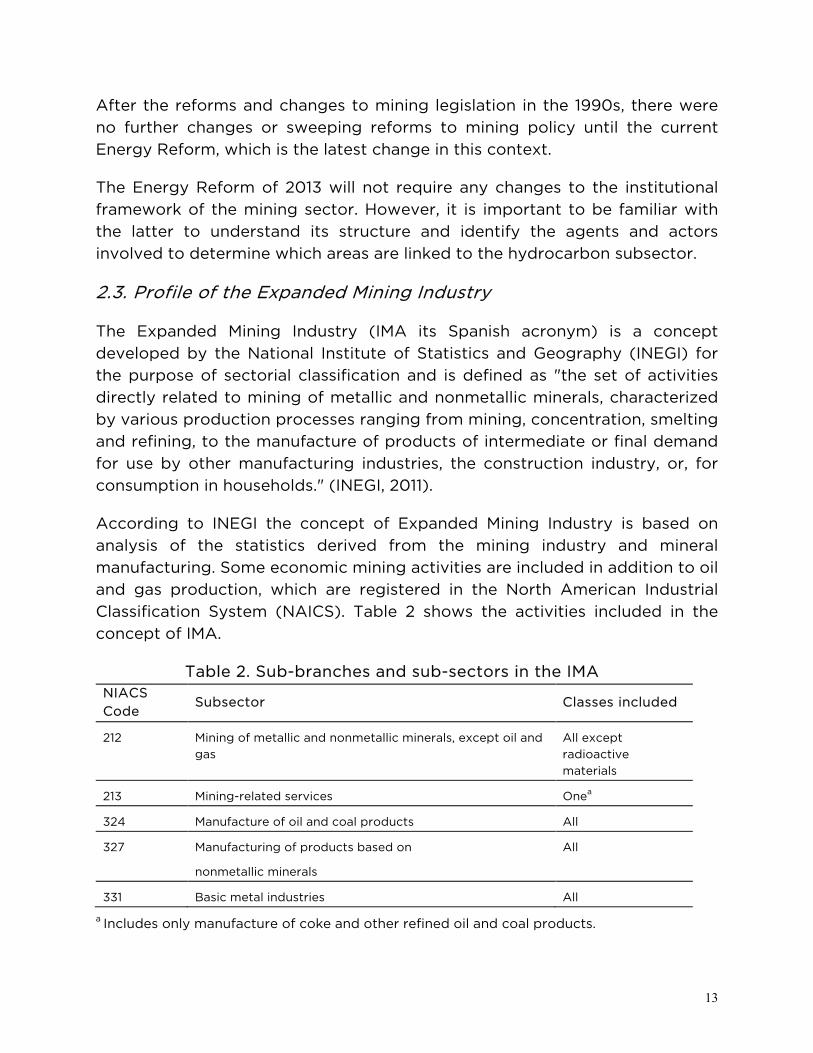
The results of the Economic Census 2009 for the IMA show that non-oil mining activity comprises 2,916 economic units, the main ones involved in mining and processing of non-metallic minerals such as rock aggregates for construction, clays and other basic minerals for preparation of chemical products. Mines and processing plants of metallic minerals and coal are present to a lesser extent, along with companies that provide services for mining, exploration, drilling and rig maintenance in oil and natural gas fields.
Chart 5. Economic units of the expanded mining industry
Source: INEGI (2011).
With respect to jobs in the sector, the non-metallic minerals subsector employs the largest number of workers in the industry, followed by activities related to mining of metallic minerals. Mining-related services provided 16,124 jobs in mining exploration activities and maintenance of oil and gas wells.
15
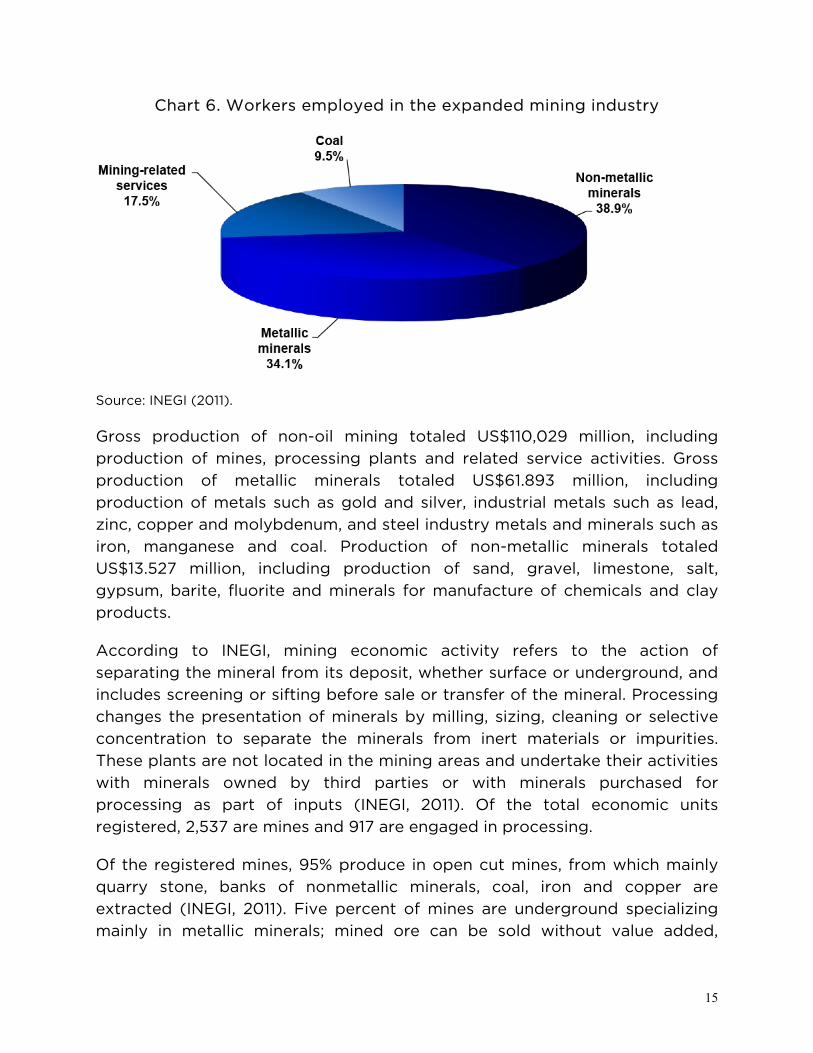
Chart 6. Workers employed in the expanded mining industry
Source: INEGI (2011).
Gross production of non-oil mining totaled US$110,029 million, including production of mines, processing plants and related service activities. Gross production of metallic minerals totaled US$61.893 million, including production of metals such as gold and silver, industrial metals such as lead, zinc, copper and molybdenum, and steel industry metals and minerals such as iron, manganese and coal. Production of non-metallic minerals totaled US$13.527 million, including production of sand, gravel, limestone, salt, gypsum, barite, fluorite and minerals for manufacture of chemicals and clay products.
According to INEGI, mining economic activity refers to the action of separating the mineral from its deposit, whether surface or underground, and includes screening or sifting before sale or transfer of the mineral. Processing changes the presentation of minerals by milling, sizing, cleaning or selective concentration to separate the minerals from inert materials or impurities. These plants are not located in the mining areas and undertake their activities with minerals owned by third parties or with minerals purchased for processing as part of inputs (INEGI, 2011). Of the total economic units registered, 2,537 are mines and 917 are engaged in processing.
Of the registered mines, 95% produce in open cut mines, from which mainly quarry stone, banks of nonmetallic minerals, coal, iron and copper are extracted (INEGI, 2011). Five percent of mines are underground specializing mainly in metallic minerals; mined ore can be sold without value added,
16
especially in the case of rock minerals. Minerals such as metals or clays are transported to the transformation plants before use by other industries (INEGI, 2011).
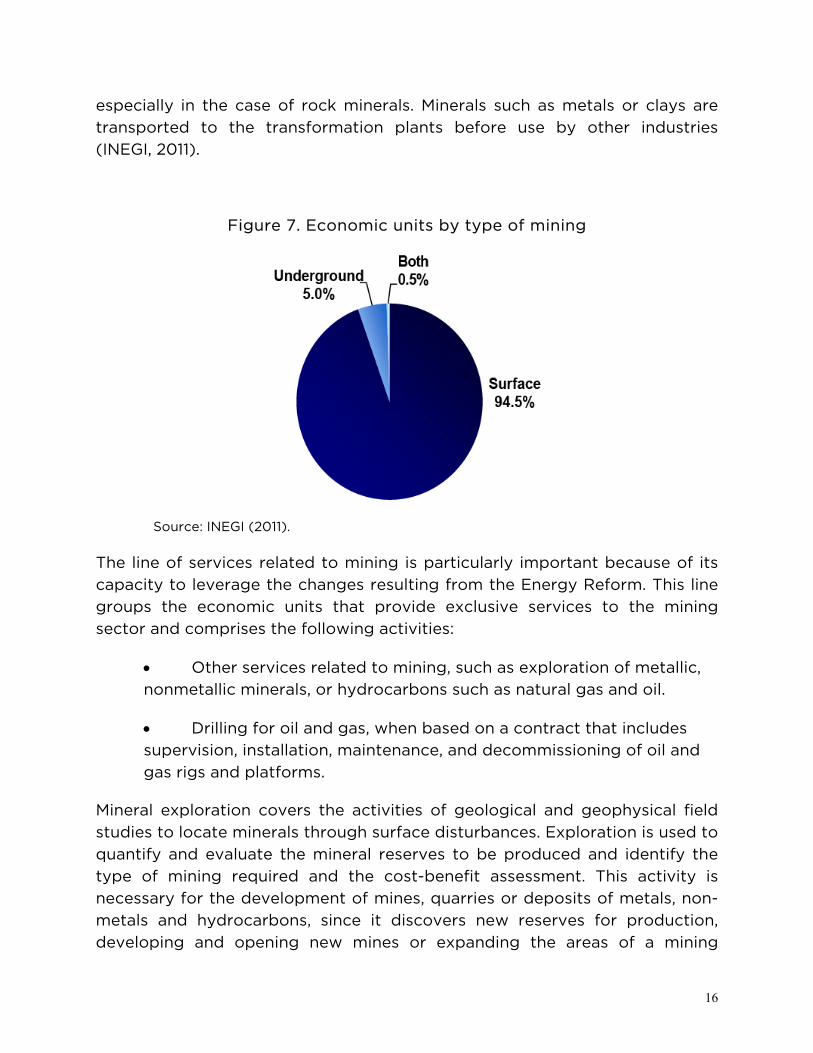
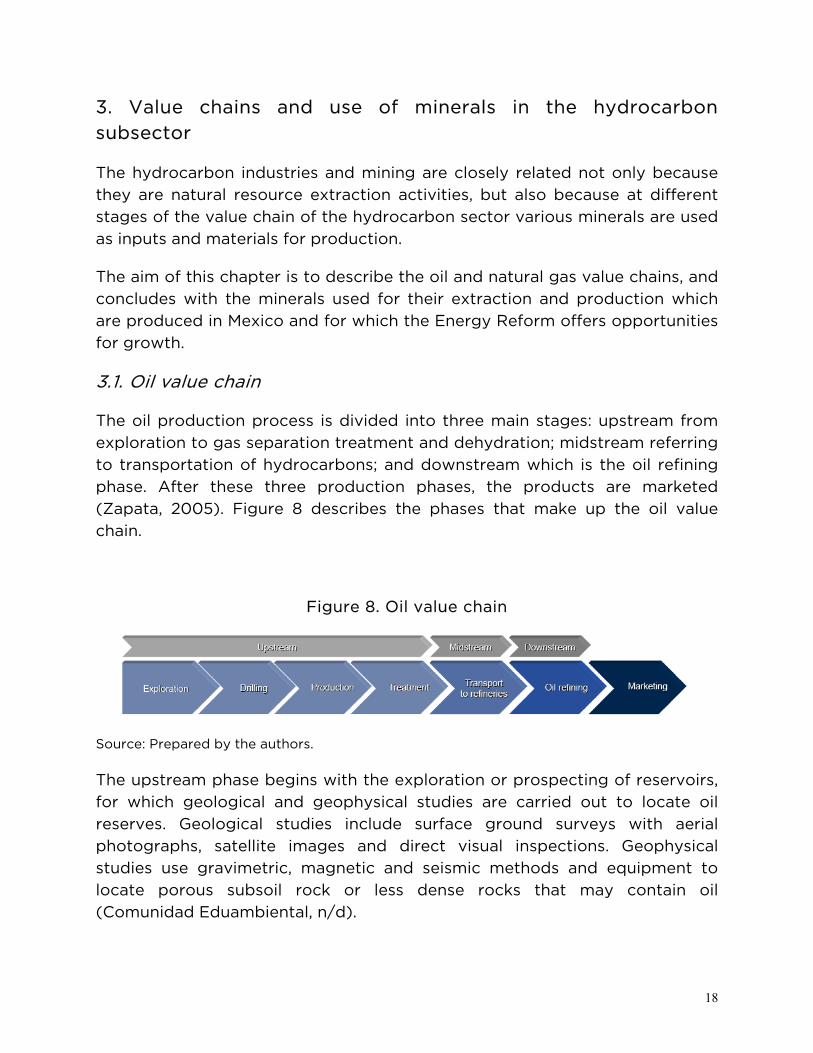
Figure 7. Economic units by type of mining
Source: INEGI (2011).
The line of services related to mining is particularly important because of its capacity to leverage the changes resulting from the Energy Reform. This line groups the economic units that provide exclusive services to the mining sector and comprises the following activities:
• Other services related to mining, such as exploration of metallic, nonmetallic minerals, or hydrocarbons such as natural gas and oil.
• Drilling for oil and gas, when based on a contract that includes supervision, installation, maintenance, and decommissioning of oil and gas rigs and platforms.
Mineral exploration covers the activities of geological and geophysical field studies to locate minerals through surface disturbances. Exploration is used to quantify and evaluate the mineral reserves to be produced and identify the type of mining required and the cost-benefit assessment. This activity is necessary for the development of mines, quarries or deposits of metals, non-metals and hydrocarbons, since it discovers new reserves for production, developing and opening new mines or expanding the areas of a mining
17
project already in production. Exploration companies are located in relation to the site of mineral deposits. The economic units engaged in exploration are mobile, since they have to move qualified staff and equipment to the mining claims where they provide their services. Most exploration takes place in the states of Sonora, Chihuahua, Coahuila, Durango and Zacatecas.
According to the 2009 Economic Census, 125 economic units provided mining-related services, of which 102 are in the activity "other mining-related services," and the rest " oil and gas drilling services." The annual report of the Mexican Mining Chamber (Camimex) shows 439 exploration companies registered in 2012 with 1,171 mining projects in Mexico. Although the work of crude oil and natural gas production, along with exploration of hydrocarbon mantles and deposits is carried out directly by Pemex, multiple service contracts are also assigned to private entities to provide drilling and maintenance operations for oil and gas facilities.
Information from the 2009 Census shows that there were 23 establishments providing drilling and maintenance services, located mainly on the coast of the Gulf of Mexico. These companies reported 9,719 employees, of which 23.7% were dependent and the rest were outsourced. The states employing most workers in this type of company are in Campeche (48%), Federal District (33%), Tamaulipas (9%), Tabasco (5%) and Veracruz (1%).
Oil and gas drilling activities in 2009 generated total gross production of US$18. 928 billion. The share of the states is as follows: Campeche 43%, Federal District 30%, Tamaulipas 11% and Tabasco 10%. The Federal District (Mexico City) is included in these activities because the headquarters of some companies are located there although their operational activities take place in the oil areas.
Given the characteristics of the Mexican mining sector, and thanks to the distribution and ownership of land in Mexico, many mineral resources are exploited by communities or small groups of miners, which sell them to large companies, intermediates or brokers in the industry. Small-scale mining in Mexico represents 2.9% of the total value of national mining-metallurgical production, and 1.6% of the country’s gross domestic product (GDP). Small-scale mining creates formal and informal jobs. Its production methods, due to technological deficiencies, are often classed as artisanal (González-Sánchez and Camprubí, 2010).
18
3. Value chains and use of minerals in the hydrocarbon subsector
The hydrocarbon industries and mining are closely related not only because they are natural resource extraction activities, but also because at different stages of the value chain of the hydrocarbon sector various minerals are used as inputs and materials for production.
The aim of this chapter is to describe the oil and natural gas value chains, and concludes with the minerals used for their extraction and production which are produced in Mexico and for which the Energy Reform offers opportunities for growth.
3.1. Oil value chain
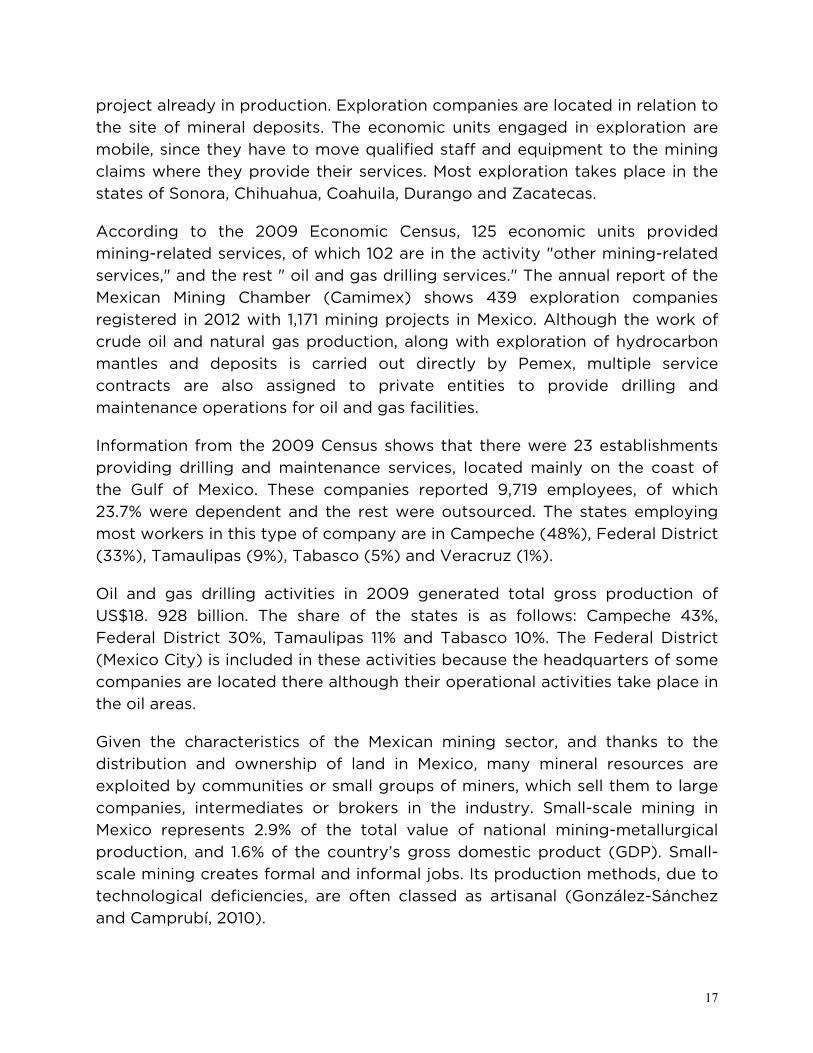
The oil production process is divided into three main stages: upstream from exploration to gas separation treatment and dehydration; midstream referring to transportation of hydrocarbons; and downstream which is the oil refining phase. After these three production phases, the products are marketed (Zapata, 2005). Figure 8 describes the phases that make up the oil value chain.
Figure 8. Oil value chain
Source: Prepared by the authors.
The upstream phase begins with the exploration or prospecting of reservoirs, for which geological and geophysical studies are carried out to locate oil reserves. Geological studies include surface ground surveys with aerial photographs, satellite images and direct visual inspections. Geophysical studies use gravimetric, magnetic and seismic methods and equipment to locate porous subsoil rock or less dense rocks that may contain oil (Comunidad Eduambiental, n/d).
19
After locating areas propitious for production, exploration wells are drilled to determine the presence of oil, types of subsurface rock, radioactivity, porosity, permeability and electric logs. The exploration stage concludes with a series of drillings to determine the potential of the reservoir, its permeability, productivity rate, volume of recoverable oil and location of the oil underground.
The second link in the upstream phase is drilling, where different methods are used in line with the nature of the reservoir and its location (onshore or offshore). Various tools are used for drilling, ranging from rotary tables to tools driven by the hydraulic power of drilling muds, with rotating diamond teeth cutting the ground. The mud is also used to remove cuttings or detritus. Drilling muds are pumped through the pipe at high pressure from the surface and return through the annular space between the injection pipe and wellbore, dragging waste along.
The muds are treated on the outside to separate them from residues and recondition them for their next injection, in a continuous process which pumps them through tanks, vibrating screens, washing and mixing systems with freshly made muds to then re-enter the drill hole.
Drilling muds are important inputs for this analysis, since they contain minerals obtained in Mexico for which the local content policies, resulting from the Energy Reform, will open an important opportunity for investment and growth.

20
Box 2. Drilling muds (Ecapetrol, n/d)
Drilling muds are a fundamental use of the minerals in the value chain. They are water- or oil-based fluids, with additives to improve certain properties such as density, viscosity, filtering or PH. The composition of the muds depends on the type of detritus to be extracted. Their main functions are to cool and lubricate the cutting tool, cool the rods and carry the cuttings to the surface.
There is a wide range of types of mud with no single composition. However, it is possible to establish general classifications of drilling muds. To change the characteristics of the mud, additives are used including:
• Weighting agents (such as barite, calcium carbonate and soluble salts), which help control the underground pressure and support the well walls.
• Viscosifying clays, which are polymers and liquid emulsifier agents that thicken the muds, increasing their capacity to transport and suspend cuttings and solid materials.
• Dispersants increase the fluidity of the muds reducing suction pressures, piston effects and problems of circulation pressure.
These additives also reduce mud filtration through the borehole wall, minimizing damage to the underground formations, the problems of differential sticking and the problems of interpreting cable profiles.
Other additives of muds include salts, sodium hydroxide, preservatives, bactericides, emulsifiers and temperature extenders, along with lubricants, corrosion inhibitors, chemicals that bind with contaminating calcium ions and flocculants to help remove the cuttings.
Clays are the key components of these additives because they contain in themselves the properties required by the drilling fluid. These clays are fine-grained plastic materials that occur naturally in the soil. Some, such as montmorillonites (also known by the name sodium montmorillonite or bentonites) have hydrophilic and thixotropic properties. The most important clays for the muds are the viscosifiers because they increase fluidity, hydraulic power transmission and control of filtrate loss.
Calcium montmorillonite, also known as sub-bentonite, swells to two or four

21
times its original dry volume on contact with fresh water, and is used to improve distribution of the size or the particles in the muds to reduce filtrate loss.
When bentonite is mixed with water it retains its characteristics of stability and consistency, with the particularity that when the mixture is kneaded without producing water variation, it loses strength and behaves like a fluid. However, at rest, it recovers the lost strength needed to prevent collapse of the excavation walls and maintain suspension of the cuts. With this mix of their hydrophilic and thixotropic properties of the bentonite mud, the drilling is faster and much more effective (Triopas, n/d).
Bentonite yields 90-100 barrels per tonne (in freshwater), while sub-bentonite yields 40-50 bbl/tonne (Ecapetrol, n/d).
Among the weighting agents, the most commonly used additive is barite. Barite is a barite sulfate mineral normally found in nature and is the densest of the drill solids. It is an inert, non-abrasive mineral.
The barite is crushed and ground for use, its size is critical in the use of the muds. Large particles require a thick mud in order to remain in suspension and are removed in a vibrator screen. Very fine particles are undesirable because they result in formation of a large solid surface area that is exposed to the liquid phase, causing excessive viscosity and gel strength. A commonly used substitute for barite is soluble salts.
Various procedures and technologies can be used in the extraction link, according to the nature of the reservoir and its location on or offshore. Considering the type of deposit, extraction can be:
o Primary, in this case the gas pressure on the crude forces it out through the drilling.
o Secondary, injecting water, gas and other liquids to force the oil out.
o Tertiary using mechanical pumping systems.

22
The last link of the upstream phase is treatment, when crude is subjected to a primary stabilization treatment which separates the seawater and solids in suspension.
The midstream phase corresponds to the transport link of the crude to the refinery. Large-scale transportation is by pipelines or tankers. The oil is pumped from the head station and boosted again by intermediate stations; from the pipelines and tankers the crude is unloaded into large tanks at the base of the refinery (Comunidad Eduambiental, n/d).
The downstream phase corresponds to the refining link, that is: separation of the oil components. The objective of oil refining is to separate the components, converting the heaviest fractions into lighter ones by distillation processes, as well as with molecular division processes, known as cracking. In addition, the oil contaminants are chemically cleaned, especially to remove sulfur compounds. Refining is used to improve product quality and to obtain gasolines (Comunidad Eduambiental, n/d). The last link in the oil value chain is marketing. In this link, the products are transported from the refinery tanks to domestic and foreign markets, either for use as fuel in industries or as products for other uses.
3.2. Natural gas value chain
The natural gas value chain has three phases: production, transportation and marketing (Zapata, 2005). The production phase of natural gas is similar to that of oil, since the two are commonly associated. Non-associated gas can be found when accompanied by small quantities of other hydrocarbons.
23
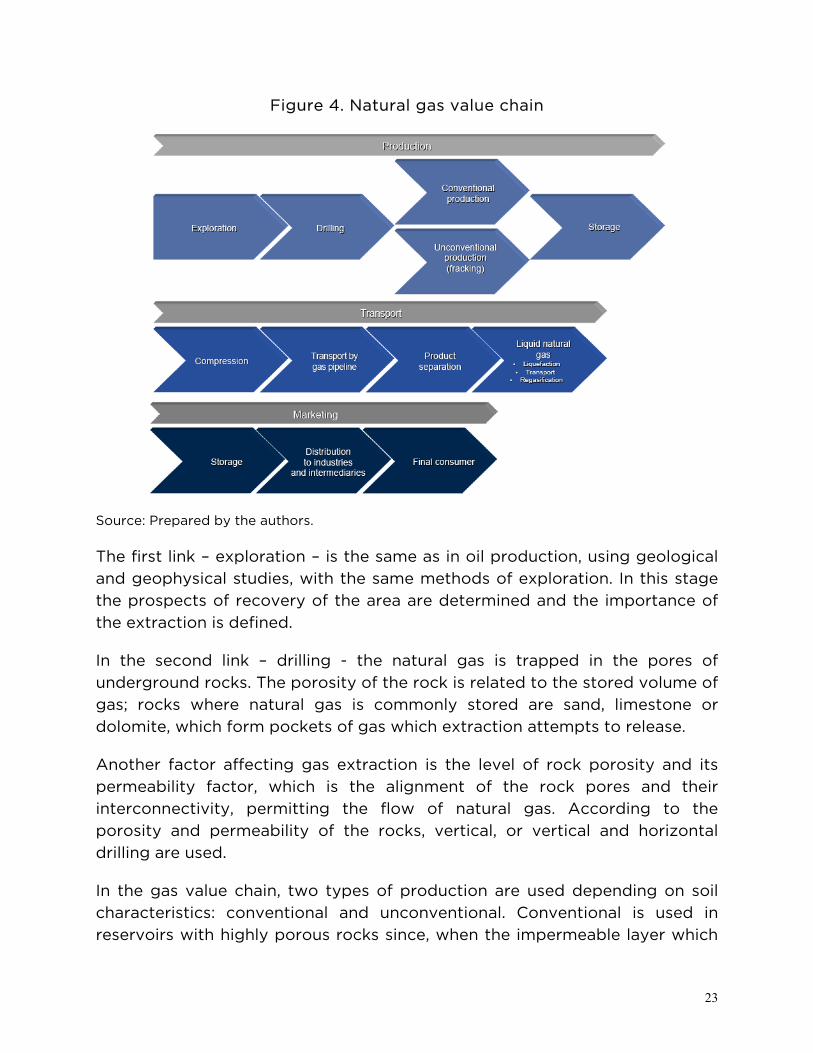
Figure 4. Natural gas value chain
Source: Prepared by the authors.
The first link – exploration – is the same as in oil production, using geological and geophysical studies, with the same methods of exploration. In this stage the prospects of recovery of the area are determined and the importance of the extraction is defined.
In the second link – drilling - the natural gas is trapped in the pores of underground rocks. The porosity of the rock is related to the stored volume of gas; rocks where natural gas is commonly stored are sand, limestone or dolomite, which form pockets of gas which extraction attempts to release.
Another factor affecting gas extraction is the level of rock porosity and its permeability factor, which is the alignment of the rock pores and their interconnectivity, permitting the flow of natural gas. According to the porosity and permeability of the rocks, vertical, or vertical and horizontal drilling are used.
In the gas value chain, two types of production are used depending on soil characteristics: conventional and unconventional. Conventional is used in reservoirs with highly porous rocks since, when the impermeable layer which
24
encloses the natural gas is perforated, the gas is released through the well to the surface (Corporación Mexicana de Investigación en Materiales, 2013).
Unconventional production is used in rocks with low porosity and less permeability such as compact sands, coal beds and slate. This type of production requires more complex and aggressive techniques with the subsurface and the environment (Corporación Mexicana de Investigación en Materiales, 2013).
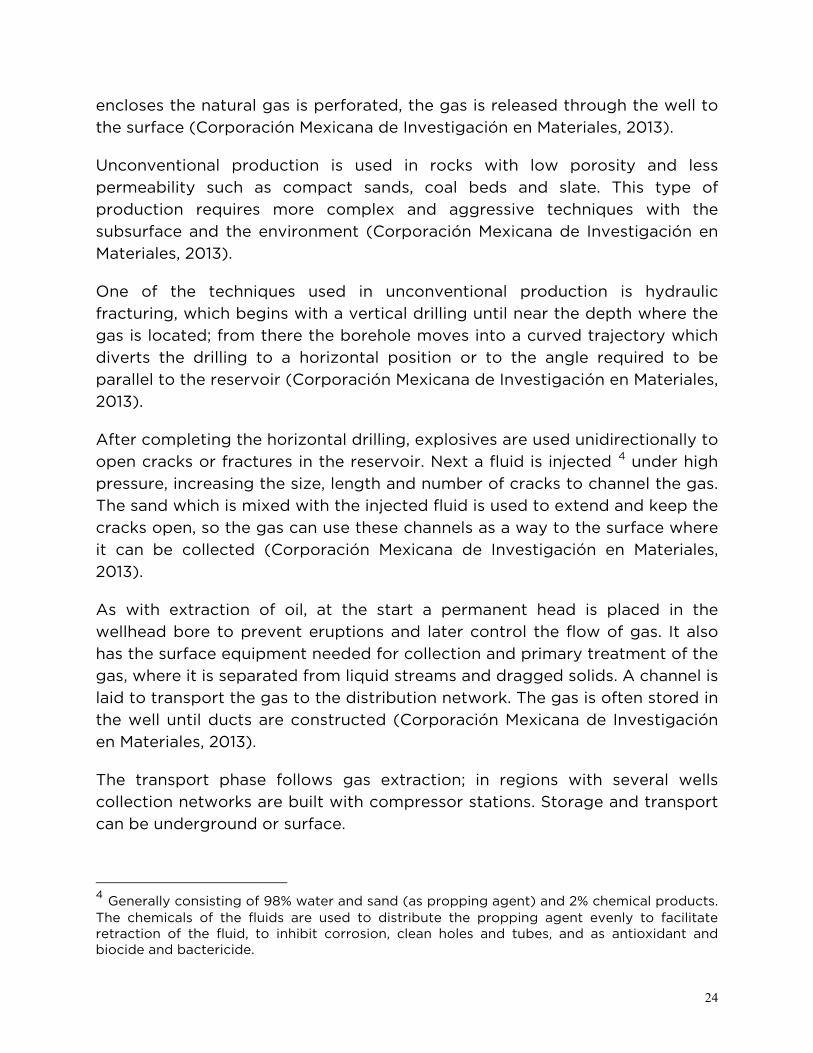
One of the techniques used in unconventional production is hydraulic fracturing, which begins with a vertical drilling until near the depth where the gas is located; from there the borehole moves into a curved trajectory which diverts the drilling to a horizontal position or to the angle required to be parallel to the reservoir (Corporación Mexicana de Investigación en Materiales, 2013).
After completing the horizontal drilling, explosives are used unidirectionally to open cracks or fractures in the reservoir. Next a fluid is injected 4 under high pressure, increasing the size, length and number of cracks to channel the gas. The sand which is mixed with the injected fluid is used to extend and keep the cracks open, so the gas can use these channels as a way to the surface where it can be collected (Corporación Mexicana de Investigación en Materiales, 2013).
As with extraction of oil, at the start a permanent head is placed in the wellhead bore to prevent eruptions and later control the flow of gas. It also has the surface equipment needed for collection and primary treatment of the gas, where it is separated from liquid streams and dragged solids. A channel is laid to transport the gas to the distribution network. The gas is often stored in the well until ducts are constructed (Corporación Mexicana de Investigación en Materiales, 2013).
The transport phase follows gas extraction; in regions with several wells collection networks are built with compressor stations. Storage and transport can be underground or surface.
4 Generally consisting of 98% water and sand (as propping agent) and 2% chemical products. The chemicals of the fluids are used to distribute the propping agent evenly to facilitate retraction of the fluid, to inhibit corrosion, clean holes and tubes, and as antioxidant and biocide and bactericide.
25
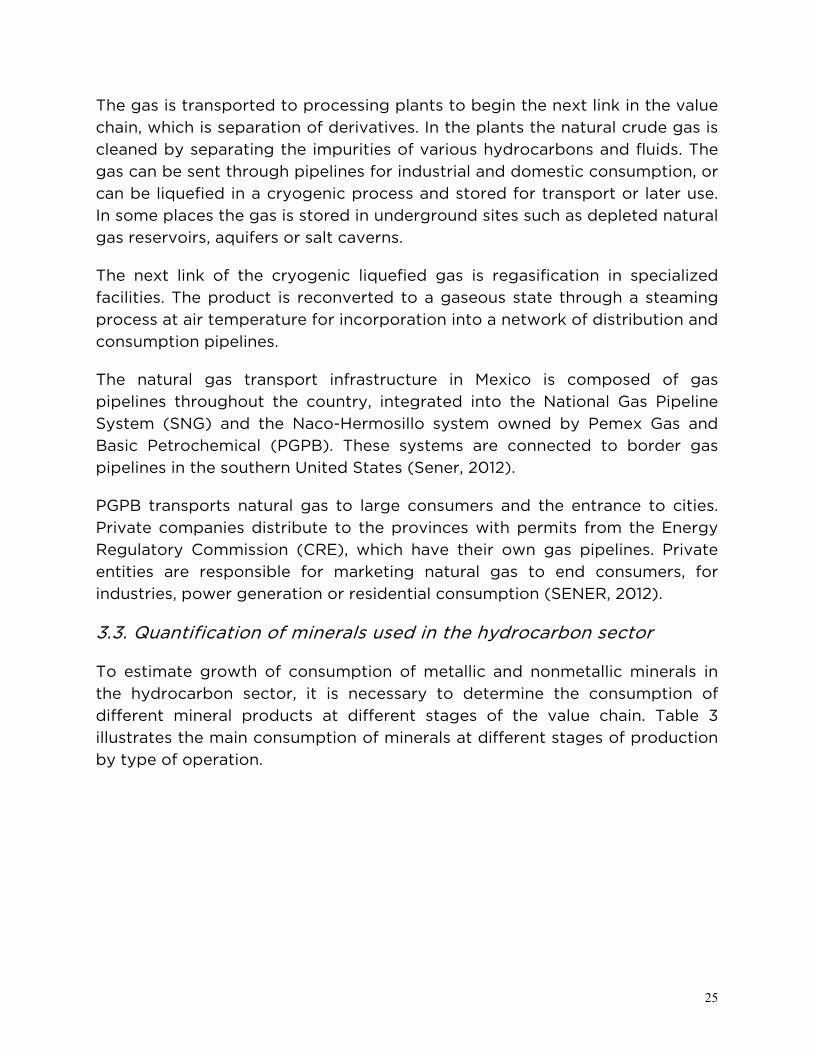
The gas is transported to processing plants to begin the next link in the value chain, which is separation of derivatives. In the plants the natural crude gas is cleaned by separating the impurities of various hydrocarbons and fluids. The gas can be sent through pipelines for industrial and domestic consumption, or can be liquefied in a cryogenic process and stored for transport or later use. In some places the gas is stored in underground sites such as depleted natural gas reservoirs, aquifers or salt caverns.
The next link of the cryogenic liquefied gas is regasification in specialized facilities. The product is reconverted to a gaseous state through a steaming process at air temperature for incorporation into a network of distribution and consumption pipelines.
The natural gas transport infrastructure in Mexico is composed of gas pipelines throughout the country, integrated into the National Gas Pipeline System (SNG) and the Naco-Hermosillo system owned by Pemex Gas and Basic Petrochemical (PGPB). These systems are connected to border gas pipelines in the southern United States (Sener, 2012).
PGPB transports natural gas to large consumers and the entrance to cities. Private companies distribute to the provinces with permits from the Energy Regulatory Commission (CRE), which have their own gas pipelines. Private entities are responsible for marketing natural gas to end consumers, for industries, power generation or residential consumption (SENER, 2012).
3.3. Quantification of minerals used in the hydrocarbon sector
To estimate growth of consumption of metallic and nonmetallic minerals in the hydrocarbon sector, it is necessary to determine the consumption of different mineral products at different stages of the value chain. Table 3 illustrates the main consumption of minerals at different stages of production by type of operation.
26
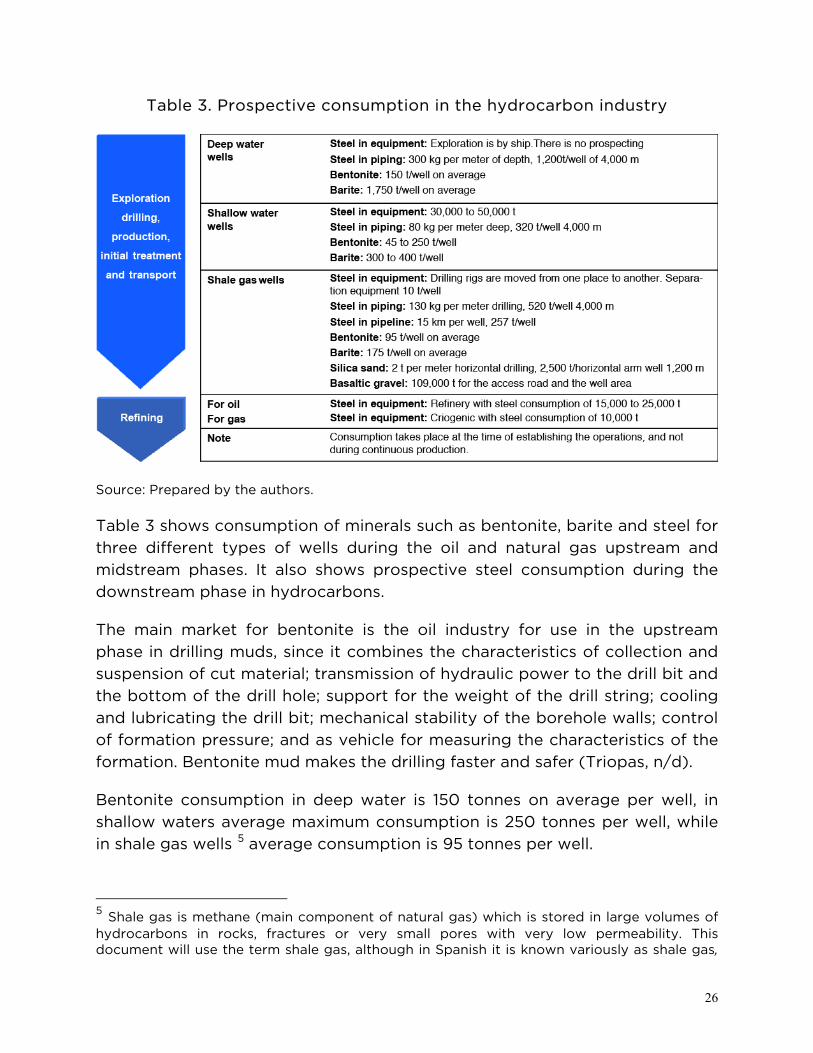
Table 3. Prospective consumption in the hydrocarbon industry
Source: Prepared by the authors.
Table 3 shows consumption of minerals such as bentonite, barite and steel for three different types of wells during the oil and natural gas upstream and midstream phases. It also shows prospective steel consumption during the downstream phase in hydrocarbons.
The main market for bentonite is the oil industry for use in the upstream phase in drilling muds, since it combines the characteristics of collection and suspension of cut material; transmission of hydraulic power to the drill bit and the bottom of the drill hole; support for the weight of the drill string; cooling and lubricating the drill bit; mechanical stability of the borehole walls; control of formation pressure; and as vehicle for measuring the characteristics of the formation. Bentonite mud makes the drilling faster and safer (Triopas, n/d).
Bentonite consumption in deep water is 150 tonnes on average per well, in shallow waters average maximum consumption is 250 tonnes per well, while in shale gas wells 5 average consumption is 95 tonnes per well.
5 Shale gas is methane (main component of natural gas) which is stored in large volumes of hydrocarbons in rocks, fractures or very small pores with very low permeability. This document will use the term shale gas, although in Spanish it is known variously as shale gas,
27
Barite is a nonmetallic mineral also known as baritone. Its main uses are in the oil industry, which receives 95% of national production; the rest goes to industries such as the automotive (production of automotive paints) and medical (as opaque medium in radiography).
Barite is also used in the oil industry in the upstream phase for the drilling muds. Consumption of barite in deep water is 1,750 tonnes on average per well, in shallow water average maximum consumption is 400 tonnes per well, while in shale gas wells average consumption is 175 tonnes per well.
Steel is used in the midstream and downstream phases as inputs for the pipelines for transporting hydrocarbons, and for production equipment. The highest consumption is in shallow water wells, where an estimated 50,000 tonnes is used on average per well. In oil refining, steel consumption up to 25,000 tonnes can be expected for equipment.
Steel for pipelines has a prospective consumption of up to 1,200 tonnes per well. In deepwater wells expected consumption is 320 tonnes per well, and in shale gas wells up to 520 tonnes per well. Consumption was analyzed for wells with a depth of 4,000 meters.
Deepwater wells were not analyzed because the exploration is by ship, and in the case of shale gas wells, the drilling equipment is moved from one place to another.
For shale gas wells, consumption of other non-metallic minerals is calculated on the basis that the wells are located in areas distant from residential areas and roads and, due to their constant consumption of minerals and other goods and inputs, they require special roads connecting the wells with each other and to the main roads to the centers of the marketing phase of the value chain.
To develop these special roads, consumption volumes are estimated at 109,000 tonnes for access roads and the well areas. In hydraulic drilling for shale gas extraction, silica sand is used whose consumption is calculated at 2,500 tonnes per 1,200-meter horizontal arm well.
gas de lutita, gas de esquisto or gas de pizarra bituminosa. This latter name comes from the fact that it is usually stored in slate deposits and in source rocks or originating from conventional natural gas fields (Estrada, 2013).
28
4. Local content
4.1. Analysis of public policy on national integration
The concept of local content includes various schemes ranging from delivery of raw materials on site, to establishment of commercial relations with firms with permanent operational offices in a given area (Esteves, Coyne and Moreno, 20130).
According to Esteves, Coyne and Moreno (2013), local content policies in the context of the hydrocarbon sector are aimed at extending or expanding the benefits of the oil, gas and mining activities for the national economy. These policies attempt to open access to economic opportunities through employment, participation in supply chains or provision of other related support services (Esteves, Coyne and Moreno, 2013).
Bacon, Tordo and Anouti (2013) point out that local content policies are not only related to the immediate increase in local services or products, but also to actions that will result in improvements and long-term growth in other sectors related to the hydrocarbon industry. The improvements that can be expected include skills development and creation and maintenance of clusters of other industries that have natural synergies with the oil sector.
Local content requirements stipulate that companies that produce goods in one a country must obtain a certain proportion of domestic inputs or materials. Belderbos and Sleuwaegen (1997) say that the purpose of local content policies, in addition to increasing production of national intermediate goods, is to create a "level" field of participation for national processing companies forcing acquisition conditions on foreign companies (Sleuwaegen and Belderbos, 1997).
Bacon, Tordo and Anouti (2013) also mention that the concept of local content ranges from purchasing local materials and inputs from national and foreign owners, to purchases from local owners located in other countries. These authors emphasize that these distinctions are important because, on the one hand, the direct benefits to the national economy may differ depending on the ownership of the local company while, on the other hand, monitoring of local content requires considering the nature of ownership (Bacon, Tordo and Anouti, 2013).
29
Two different concepts are used in defining local content policies: local content and local participation in the. Local content is defined as the percentage of workers, goods and services and materials locally produced which are supplied to the oil, gas and mining industries. In economic terms, it is the value contributed to the national economy through purchase of national goods and services, that is local value added (Esteves, Coyne and Moreno, 2013).
Local participation is the level of assets owned by local citizens, with any of the following characteristics (Esteves, Coyne and Moreno, 2013):
• Local registration: the legal entity is registered under local laws.
• Local ownership: a certain percentage of the company is owned by citizens of the country or by locally owned entities registered locally.
• Local workforce: mostly the company workforce, both directly employed and contracted, composed of citizens of the country.
• Local value added: a specific percentage of the goods/services produced in the country.
• Joint venture between a foreign and a local company: the local company participates with a foreign company in a venture with a minimum percentage.
Bacon Tordo and Anouti (2013) emphasize that local content can refer to jobs or value added created anywhere in the domestic economy as a result of the actions of oil companies, as well as the jobs created in localities adjacent to oil and gas production plants. Although most of the policies do not specifically refer to localization of local content in the economy, it is common for communities near the gas and oil production facilities - possibly the most affected – to exert greater pressure for job creation.
For Perez (2012), the aim of local content policies is to make the participation of countries in globalized industries as broad as possible in terms of value added, which means that the incentives for local content may range from interest rate subsidies in favor of strategic sectors and projects, to contractual obligations in the public market. Pérez notes that foreign companies must be seen as partners in the implementation of local content policies, because they

30
are the starting point for generating economic and technological chains which open access to larger segments of the global production chains.
With respect to local content policies for the hydrocarbon subsector in Mexico, the transitional seventh article of the Energy Reform states: "To promote participation of national and local supply chains, the law establishes, [...], the bases and minimum percentages of national content in procurement for execution of the assignments and contracts referred to in this decree. [...] "(Presidency of the Republic, 2013). This means that the Energy Reform aims to promote national investment and development of value chains in the hydrocarbon sector, favoring national industries and producers which supply raw materials, inputs and technologies to the hydrocarbon industry.
Developing a local content policy is challenging since it requires building capacities in both in the workforce and in human capital. Different countries have enacted rules and laws which require mining companies to use local products, companies, resources and workers and offer incentives to do so. In the section on case studies, examples of successful local content policies are analyzed, which can serve as a model for Mexico.
4.2. Local content policy
The concept of local content is not new in relation to policymaking in Mexico. Promotion of national industries was based on the import substitution model of the 1940s.This model aimed to promote the growth and development of industrialization based on strong state intervention. The import substitution policy included applying for permits prior to import, establishing official prices for certain imported goods and prohibitions on import of products of foreign origin. Foreign direct investment (FDI) was also highly regulated and was only accepted as a minority share in non-strategic areas of manufacturing (SE, n/d).
The import substitution model had become outdated by the 1980s when market liberalization policies began to be implemented. These new policies involved a reduction in subsidies and tax incentives for manufacturing, along with deregulation and opening to FDI (SE, n/d). Although liberalization policies significantly reduced the role of the State in terms of subsidies or protection policies for national industries and companies, some initiatives to promote strategic sectors for economic development remained. One example is the case of the energy sector, whose effort to integrate producers and
31
service providers in the hydrocarbon value chains is reflected in the 2008 Energy Reform, which created mandates to promote support strategies for development of national suppliers and contractors by Pemex.
In 2009 Pemex published the document "Strategy of Petróleos Mexicanos to Develop Suppliers, Contractors and National Content" (Pemex, 2009). The strategy was designed to find alternatives to reduce the impact of declining oil prices and of increased production costs due to exhaustion in low-cost fields, as well as to deal with the fiscal burden imposed on the company.
Since then, the justification for increasing the national component in Pemex purchases has been based on generating more economic activity and hence increasing the tax revenue base. Another reason was to develop an industrialization strategy based on productive chains with high value added, such as industries supplying goods, services and public works.
The strategy aimed to increase the degree of national content in Pemex purchases by at least 25%. To support this, the Trust to Promote Development of National Suppliers and Contractors for the State Oil Industry was set up in partnership with the Ministry of Finance and Public Credit and Nacional Financiera as a means of channeling financial resources to local suppliers, particularly small- and medium-sized enterprises (SMEs).
To meet the established conditions and achieve national content targets, a specialized area was created to promote and incorporate contractors and suppliers, whose functions were:
• Publish and promote the local content strategy. • Identify opportunities for development of national suppliers
and contractors. • Propose policies and actions to achieve local content targets. • Support the actions of Pemex and its subsidiary bodies in
achieving the targets set. • Monitor development of the strategy and report progress to
the Board. • Support Nacional Financiera in the actions of the Fund and
promote financing schemes for development of national suppliers and contractors.
32
For its part, the current Energy Reform (2013) proposes a series of tools and instruments to guarantee development of suppliers and productive chains, especially:
• Establishment of a minimum average national content. • Minimum percentage for each assignment or contract and a
compliance schedule.
Under the new reform, rules will give preference to nationals when offering similar conditions in terms of price, quality and on-time delivery for procurement of goods and contracting of services and works, and recruitment and training of personnel.
The national content requirement for contracting services and procurement of supplies for the sector is reflected legally in Article 46 of the newly enacted Hydrocarbons Law, which states: "The set of activities of Exploration and Extraction of Hydrocarbons which is undertaken in national territory through Assignments and Contracts of Exploration and Extraction should reach, on average, at least 35% national content." The same article states that allocations and contractors must individually and progressively meet a minimum percentage of national content, assigned by law.
It is the responsibility of the Ministry of Economy (SE) to set a national content target in accordance with the characteristics of these activities and determine the percentage for each company. The methodology for calculating national content defined in Article 46 states that the Ministry must use the following:
i. Contracted goods and services, considering their origin.
ii. National manpower and skilled labor.
iii. Training of national workforce.
iv. Investment in local and regional physical infrastructure.
v. Technology transfer.
The Hydrocarbons Law stipulates that national content targets exclude exploration and production of hydrocarbons in deep and ultra-deep waters.

33
The criteria established by the Ministry to determine when goods are national are that they must have been manufactured in Mexico and have at least 50% national content.
The degree of national content is calculated with any of the following formulas:
(1) 𝐶𝐶 = �𝐶𝑃−𝑅−𝐶𝐼𝐶𝑃−𝑅
� ∗ 100 (2) 𝐶𝐶 = �0.82𝑃𝑉−𝐶𝐼0.82𝑃𝑉
� ∗ 100
Where:
CN= Degree of national content of the goods offered in the procurement procedure expressed as a percentage
P P= Cost of production of the good offered in the procurement procedure
C I= Cost of direct and indirect imports of inputs, incorporated in the goods offered in the procurement procedure, including cost of transport to the plant, import duties and customs charges
R = Value of the cost of sales promotion, marketing, royalties, shipping and the good offered in the procurement procedure
P V= Selling price of the product offered in the procurement procedure
For example, in a bidding process for acquisition of mud pumps an estimated cost of US$13.600 million (considering hypothetical values), the degree of national content will depend mainly on the cost of direct and indirect imports of the inputs incorporated into the mud pumps, whose value cannot exceed US$9,401,205 to comply with 30% of national content in the product.
Table 4. Acquisition of triplex reciprocating mud pumps, single action, 1600 HP and 2200 HP for well drilling equipment - South Division
(In US dollars)
Formula (1) Formula (2)
CP= Cost of production of goods offered in the procurement procedure
13,600,000 13,600,000
34
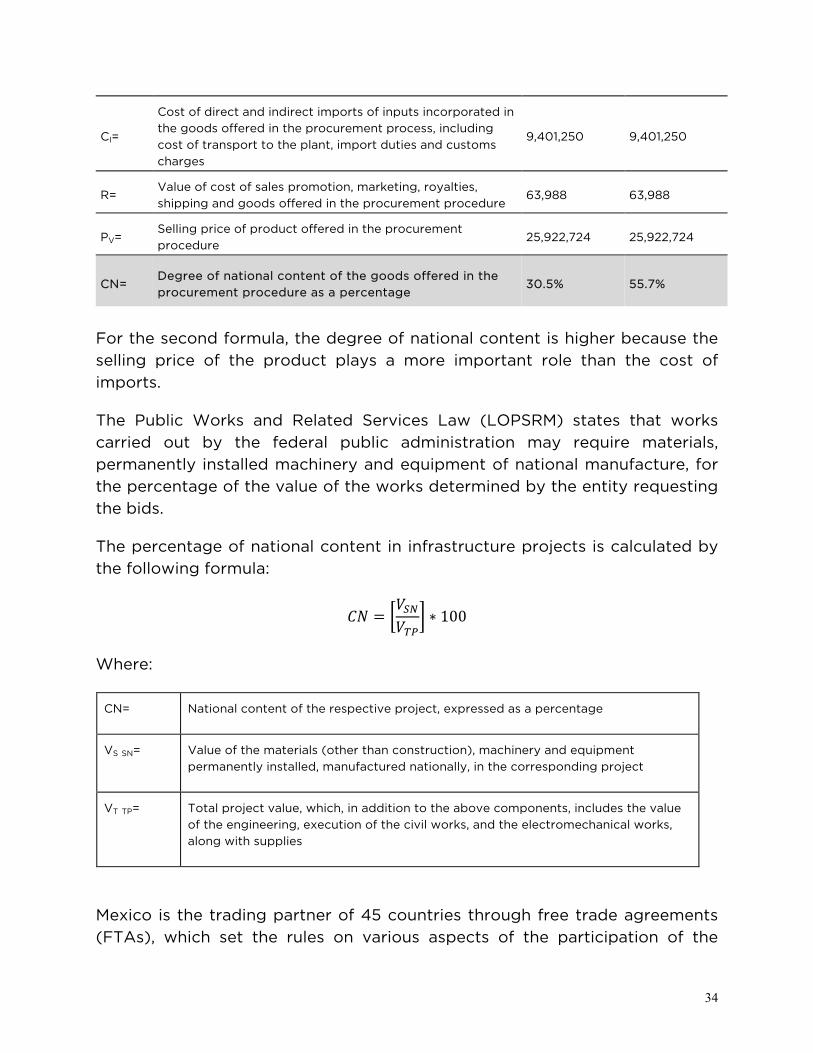
CI=
Cost of direct and indirect imports of inputs incorporated in the goods offered in the procurement process, including cost of transport to the plant, import duties and customs charges
9,401,250 9,401,250
R= Value of cost of sales promotion, marketing, royalties, shipping and goods offered in the procurement procedure
63,988 63,988
PV= Selling price of product offered in the procurement procedure
25,922,724 25,922,724
CN= Degree of national content of the goods offered in the procurement procedure as a percentage
30.5% 55.7%
For the second formula, the degree of national content is higher because the selling price of the product plays a more important role than the cost of imports.
The Public Works and Related Services Law (LOPSRM) states that works carried out by the federal public administration may require materials, permanently installed machinery and equipment of national manufacture, for the percentage of the value of the works determined by the entity requesting the bids.
The percentage of national content in infrastructure projects is calculated by the following formula:
𝐶𝐶 = �𝑉𝑆𝑆𝑉𝑇𝑃
� ∗ 100
Where:
CN= National content of the respective project, expressed as a percentage
VS SN= Value of the materials (other than construction), machinery and equipment permanently installed, manufactured nationally, in the corresponding project
VT TP= Total project value, which, in addition to the above components, includes the value of the engineering, execution of the civil works, and the electromechanical works, along with supplies
Mexico is the trading partner of 45 countries through free trade agreements (FTAs), which set the rules on various aspects of the participation of the

35
signatory countries in different economic sectors and activities. FTA rules applicable to government procurement set out procedures that guarantee equal and non-discriminatory treatment in procurement for all goods, services and public works.
FTAs prohibit national content requirements, known as "offsets," including the following:
• Rate and select suppliers, goods or services in the evaluation of bids or award of contracts.
• Impose or consider conditions to encourage local development or improve the balance of payment.
• Request local content requirements and licenses for the use of technology, investment, countertrade or similar requirements.
This means that the margin of action for Pemex to include national content requirements in its procurement and works is limited.
Mexico’s main trade agreement is the North American Free Trade Agreement (NAFTA) which specifies that none of the signatories can "impose or enforce requirements or enforce commitments or undertakings in relation to the establishment, acquisition, expansion, management, conduct or operation of an intervention by an investor or by a party or a country not part of its territory to [...] reach a given level or percentage of national content "(OAS, n/d ).
For this restriction, thresholds of procurement amounts were established in NAFTA and FTAs with other countries. The limits are given in Table 5.
Table 5. Thresholds of the procurement amounts set in FTAs (in US dollars)
Countries with FTA Goods or services Public works
North America, Europe, Israel and Japan
339,132 10,852,752
South America 318,242 10,183,723
36
When these procurement amounts are exceeded, acquisitions and works must take the form of international bidding processes and cannot be reserved for national suppliers and contractors.
FTAs also provide for the possibility of government purchases through reserve mechanisms. Using these mechanisms, Pemex can make national acquisitions up to an annual amount set in 2009 at US$206 million, which is adjustable in line with NAFTA provisions.
In accordance with the provisions of the FTAs, it is only possible to establish national content requirements for:
• Procurement of goods and services whose estimated purchase value is less than the thresholds for procurement and in procedures reserved in FTAs.
• Public works, when the project value is below procurement thresholds, in projects reserved of FTAs, and in “turnkey” or "large integrated" projects.
These restrictions arising from Mexico's trade agreements with partner countries can create uncertainty in the implementation of public policies since, despite the intention to increase the participation of national companies and producers in the value chain, the conditions of trade agreements must be respected. This obstacle could require a reduction in national content targets and limit the participation of companies or Mexican products in the hydrocarbon subsector.
4.3. Case studies
This section describes three case studies of local content policies applied to the hydrocarbon sector, which can provide useful elements for Mexico. In the Norwegian case, the hydrocarbon sector was virtually nonexistent until the mid-1960s, but within a few years became a leading player not only in hydrocarbon production, but also in the development of advanced technologies for the industry. The case of Brazil is presented because of the rapid growth of its oil industry in recent years, based on application of stringent local content policies.
In both countries the success factor of the strategies to develop national suppliers has been the institutional arrangement in which they operate,
37
through changes in legal frameworks, regulations and public-private participation. Importantly, institutional arrangements are not static but have changed over time.
Finally the case of Colombia is presented. In addition to the national oil company, Ecopetrol, a large number of private companies participate in the oil industry, which have implemented their own local content initiatives, demonstrating that such initiatives are not limited to the public sector or to policies adopted by the government.
4.3.1. Norway
Oil and gas exploration and production in Norway began in the mid-1960s, and its first production field became operational in 1971. In 2013 crude oil production was 1,529,900 bpd, the largest producer in Western Europe (US Energy Information Administration, n/d). The Norwegian oil sector employs approximately 80,000 workers (Norwegian Embassy in Chile, n/d).
Since the 1970s, Norway has become one of the world’s leading oil producers and exporters. Its exports represent 47% of its total export market and it is the world's third largest oil exporter (Norwegian Embassy in Chile, n/d).
More than 40 oil companies (EURES, 2013) operate in the country, of which the most important is the state company StatoilHydro, which operates on the Norwegian continental shelf and is present in nearly 40 countries. In 2013 it produced 1.99 million barrels per day (América Economía, 2013).
The Norwegian case is notable because in four decades it has ceased to be a country without reserves or experience in the sector to become one of the largest producers and exporters of oil and natural gas. This was achieved thanks to local content policies implemented by the government, which also converted the country into an international provider of cutting edge products and solutions for the oil industry (Heum, 2008).
Norwegian local content policy is the result of internal political strategies which included adaptations of laws and institutions. The stimulus for the policy started from the principle that it was necessary to attract international oil companies, and have the financial and professional resources to develop the offshore oil reserves (Estrada, 2006).
38
At the same time the country built capacities to undertake this work on its own account while maintaining full sovereignty over its oil resources, and controlling their development. The internal development plan coordinated government efforts with various social and industrial groups in order to develop the hydrocarbon industry, which evolved in three phases (Estrada, 2006):
• Three national oil companies took part to learn the business and gradually transfer to them the responsibility for the new ventures in exploration and production.
• Existing companies in traditional economic activities were encouraged to renew and adapt to become suppliers to the industry.
• Financial support was given to universities and research centers to develop knowledge and programs in oil subjects.
Once the positive results of these phases began to be seen, an oil cluster was formed which entered international markets (Estrada, 2006).
The position for formulation of local content policies in Norway was to maximize value creation above what could be obtained from the sale of hydrocarbons. In addition to favoring national companies and industries, a strict tax regime was set up (Estrada, 2006). Oil companies pay ordinary income tax of 28%, just like the rest of the country's businesses, but they also pay a 50% tax on profits (Appel, 2013).
To ensure a level playing field for local suppliers, the concession companies were required to adopt transparent and predictable procurement processes, and explicitly make known the goods and services acquired from each supplier (Pemex, 2009).
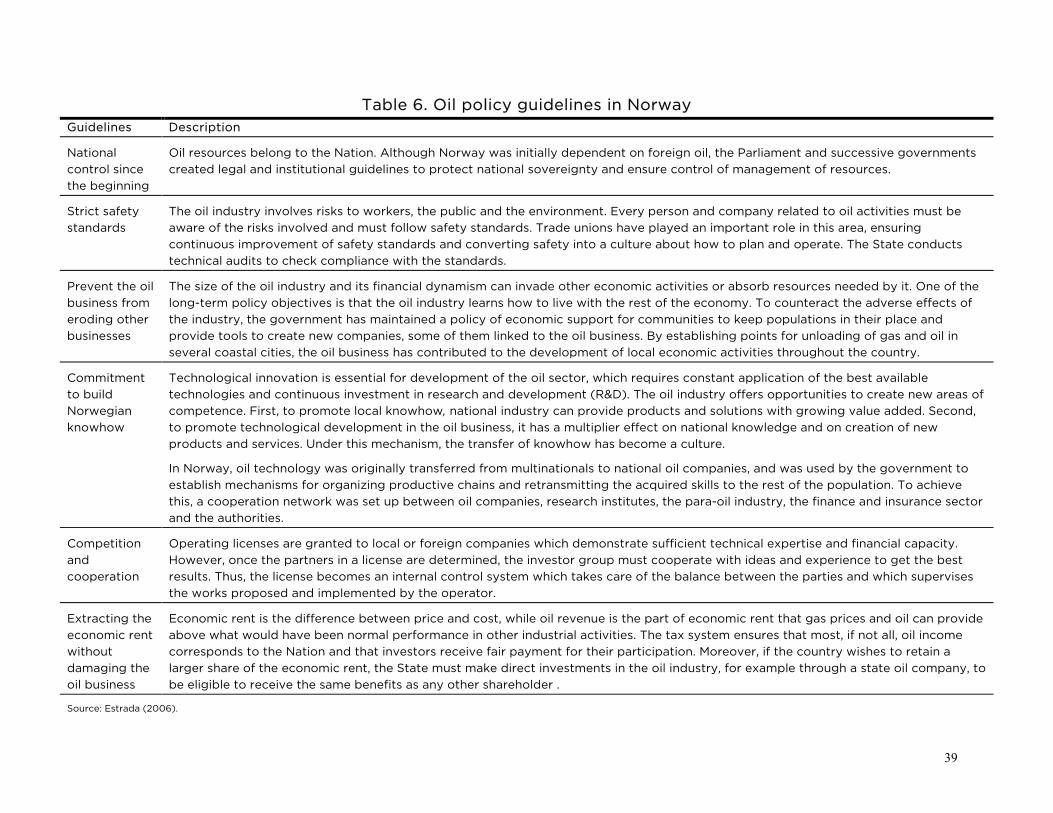
Norway’s local content policy is based on six guidelines, as detailed in Table 6.
39
Table 6. Oil policy guidelines in Norway Guidelines Description
National control since the beginning
Oil resources belong to the Nation. Although Norway was initially dependent on foreign oil, the Parliament and successive governments created legal and institutional guidelines to protect national sovereignty and ensure control of management of resources.
Strict safety standards
The oil industry involves risks to workers, the public and the environment. Every person and company related to oil activities must be aware of the risks involved and must follow safety standards. Trade unions have played an important role in this area, ensuring continuous improvement of safety standards and converting safety into a culture about how to plan and operate. The State conducts technical audits to check compliance with the standards.
Prevent the oil business from eroding other businesses
The size of the oil industry and its financial dynamism can invade other economic activities or absorb resources needed by it. One of the long-term policy objectives is that the oil industry learns how to live with the rest of the economy. To counteract the adverse effects of the industry, the government has maintained a policy of economic support for communities to keep populations in their place and provide tools to create new companies, some of them linked to the oil business. By establishing points for unloading of gas and oil in several coastal cities, the oil business has contributed to the development of local economic activities throughout the country.
Commitment to build Norwegian knowhow
Technological innovation is essential for development of the oil sector, which requires constant application of the best available technologies and continuous investment in research and development (R&D). The oil industry offers opportunities to create new areas of competence. First, to promote local knowhow, national industry can provide products and solutions with growing value added. Second, to promote technological development in the oil business, it has a multiplier effect on national knowledge and on creation of new products and services. Under this mechanism, the transfer of knowhow has become a culture.
In Norway, oil technology was originally transferred from multinationals to national oil companies, and was used by the government to establish mechanisms for organizing productive chains and retransmitting the acquired skills to the rest of the population. To achieve this, a cooperation network was set up between oil companies, research institutes, the para-oil industry, the finance and insurance sector and the authorities.
Competition and cooperation
Operating licenses are granted to local or foreign companies which demonstrate sufficient technical expertise and financial capacity. However, once the partners in a license are determined, the investor group must cooperate with ideas and experience to get the best results. Thus, the license becomes an internal control system which takes care of the balance between the parties and which supervises the works proposed and implemented by the operator.
Extracting the economic rent without damaging the oil business
Economic rent is the difference between price and cost, while oil revenue is the part of economic rent that gas prices and oil can provide above what would have been normal performance in other industrial activities. The tax system ensures that most, if not all, oil income corresponds to the Nation and that investors receive fair payment for their participation. Moreover, if the country wishes to retain a larger share of the economic rent, the State must make direct investments in the oil industry, for example through a state oil company, to be eligible to receive the same benefits as any other shareholder .
Source: Estrada (2006).
40
The current local content requirement in the Norwegian hydrocarbon industry is between 50% and 60% (calculated by value added) for investments in development of new oil fields and 80% for maintenance and operation activities (Heum, 2008).
The main results of these policies are creation of Shell University in Stavanger and the existence of more than 500 SMEs producing goods and services for the oil and gas industries, which operate internationally (Pemex, 2009).
The economic benefits generated by oil activities in Norway have been transferred to society through saving financial resources, infrastructure construction, transfer of resources to the education system and development of local productive activities. Moreover, to avoid inflationary problems arising from the increased flow of income, a national savings fund was set up to use part of oil revenues in cases of need or urgency (Estrada, 2006).
4.3.2. Brazil
Brazil is the world’s thirteenth largest oil producer and the second (EIA US Energy Information Administration, n/d) Latin American country with largest proven oil reserves. In 2011 these totaled 15.00 billion barrels (The Economist, 2014). In July 2013 crude oil production reached 2,023.880 barrels per day (Pemex, 2009).
As part of the policies to stimulate economic growth and development in Brazil and its oil industry, the government has implemented various policies to gradually increase local content in all bidding processes involving both national and foreign companies and even Petrobras itself, the leading Brazilian oil company in which the State has a majority holding.
These policies are based on three pillars: training of professionals and technicians, industrial policy of active stimulus to local suppliers through tax breaks and access to financing, as well as detailed diagnosis of local chains of suppliers of goods and services to identify strengths and weaknesses. The strategy emphasized development of small and medium-sized enterprises with high national content.
Specifically, Decree No. 4,925/2003 sets the following goal "Maximize the participation of the national industry of goods and services based on competition and sustainability in oil and natural gas projects in Brazil or

41
abroad; increased training and national technological development and training and local professional qualifications"(Huerta and Ruiz, 2012).
The Agência Nacional do Petróleo, Gas Natural e Biocombustíveis (ANP) is the regulatory body for the activities of the oil, gas and hydrocarbon industry in Brazil. This institution promotes bidding processes and closes contracts on behalf of the State with concession holders, related to exploration, development and production in the industry. It is also responsible for overseeing directly and indirectly regulated industries in the sector (BNamericas, n/d).
The ANP is the regulator of local content commitments originally established through concession contracts. Subsequently, the ANP issued an ordinance which defined specific rules relating to information and monitoring of local content (Redo and Macedo, 2009).
The local content requirements are compulsory and the ANP has the power to review compliance with legal obligations before and after the signing of the contracts (Huerta and Ruiz, 2012).
The first bidding rounds for concessions established very low local content commitments of 5% in the operational phase and 15% in the development stage (Redo and Macedo, 2009), as a way of building the competences of national companies. Local content requirements in the hydrocarbon industry have been rising. Table 7 shows the percentages for 2011 in Brazil.
Table 7. Minimum local content requirements in the Brazilian oil industry
Type of activity Exploration Development
Land 70% 77%
Shallow waters <100 m 51% 63%
Shallow waters 100-400 m 37% 55%
Deep water> 400 m 37% 55%
Source: Huerta and Ruiz (2012).
Thanks to local content requirements, the participation of local industries in investments in the oil and gas sector have significantly increased from 57% in 2003 to 75% in the first quarter of 2009, an additional value of US$14.200
42
million in goods and services purchased in the Brazilian market; moreover, it is estimated that this has resulted in the creation of 640,000 new jobs (Redo and Macedo, 2009).
Local content requirements are not relaxed despite the technical difficulties that land exploration and production can involve. For example, in the newly discovered Pre-Salt region (Pérez, 2012), 6 the government decreed that by 2020 local content should reach between 85% and 95%, which means that any player intending to participate in oil production in these fields will have to be established in the country or have local operators, particularly players focused on supplying equipment (Redo and Macedo, 2009). Also strategic control was increased to deepen backward and forward spillovers.
Experts believe that, to comply with these decrees, the participation of foreign companies will be necessary to start a process of competitive innovation, which finances their applications in the oil industry and service-related industries. In turn, the government expects to have joint ventures that make creation of technology and local ownership compatible (Pérez, 2012).
Brazilian universities and Petrobras have developed an oil technology cluster in Rio de Janeiro, where they plan to build the capacity needed to exploit Pre-Salt. At the same time the company, in coordination with the Technology Park of the Federal University of Rio de Janeiro, installed a research and development center which their local engineering suppliers have joined to take advantage of the public-private partnership networks between Petrobras and foreign companies (Pérez, 2012).
To regulate compliance with local content policies, the ANP set up a content certification system that is applied to concession contracts between the ANP and its concession holders (Redo and Macedo, 2009).
The Local Content Certificate is a document prepared by a certifier previously registered by the ANP. The most important certifier is the ONIP which has registered 2,000 companies involved in the offshore oil supply chain (Redo and Macedo, 2009).
6 Pre-Salt is found in a geological layer on the ocean bottom under 2 km of salt. This reserve contains an estimated 80 billion barrels of crude and poses an important technological and operational challenge for exploration and extraction, since to reach the deposits, the drill has to pass through 2 km of ocean, 1 km of rock and a salt layer 2,000 meters thick, located 150 km from the coast.
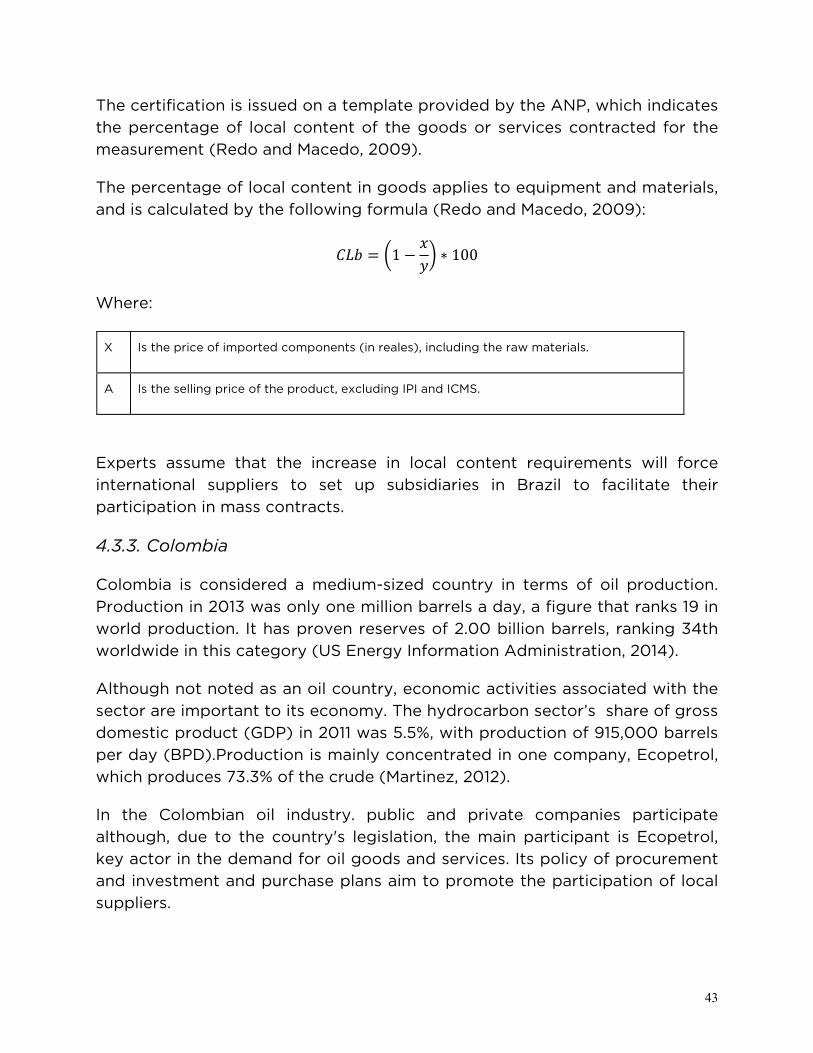
43
The certification is issued on a template provided by the ANP, which indicates the percentage of local content of the goods or services contracted for the measurement (Redo and Macedo, 2009).
The percentage of local content in goods applies to equipment and materials, and is calculated by the following formula (Redo and Macedo, 2009):
𝐶𝐶𝐶 = �1 −𝑥𝑦�
∗ 100
Where:
X Is the price of imported components (in reales), including the raw materials.
A Is the selling price of the product, excluding IPI and ICMS.
Experts assume that the increase in local content requirements will force international suppliers to set up subsidiaries in Brazil to facilitate their participation in mass contracts.
4.3.3. Colombia
Colombia is considered a medium-sized country in terms of oil production. Production in 2013 was only one million barrels a day, a figure that ranks 19 in world production. It has proven reserves of 2.00 billion barrels, ranking 34th worldwide in this category (US Energy Information Administration, 2014).
Although not noted as an oil country, economic activities associated with the sector are important to its economy. The hydrocarbon sector’s share of gross domestic product (GDP) in 2011 was 5.5%, with production of 915,000 barrels per day (BPD).Production is mainly concentrated in one company, Ecopetrol, which produces 73.3% of the crude (Martinez, 2012).
In the Colombian oil industry. public and private companies participate although, due to the country's legislation, the main participant is Ecopetrol, key actor in the demand for oil goods and services. Its policy of procurement and investment and purchase plans aim to promote the participation of local suppliers.

44
Under Colombian law, in partnership contracts the State receives a royalty of 20% of production regardless of the size of the reservoirs, while the remaining 80% is divided between Ecopetrol and the partner (Campodónico, 2004).
Partnership contracts between the State and private companies consist of the partnership between the State, through Ecopetrol, and companies with successful oil exploration, that is, they have found oil. Ecopetrol has a 50% share in investments to develop production, which means the private company which assumes the exploration risk has less need for investment capital (Campodónico, 2004).
Decree DL1760 of 2003 opened the way for all types of contract, including concessions. Ecopetrol was also restructured, and since then has been involved exclusively with development of industrial and commercial activities, as oil company responsible for the oil operation that corresponds to the State (Campodónico, 2004).
The decree created two new companies: the National Hydrocarbons Agency (ANH) and the Sociedad Promotora de Energía de Colombia. The main function of the ANH is to comprehensively manage the hydrocarbon reserves owned by the Nation. The Sociedad Promotora de Energía de Colombia participates or invests in companies whose corporate purpose relates to activities in the energy sector or similar, related or complementary activities (Campodónico, 2004).
Oil legislation establishes that contractors that sign agreements with Ecopetrol must develop scientific and technological activities at the request of the ANH, which also determines the purpose and conditions of the research projects. These projects may not exceed US$100,000 per year (Baker & McKenzie, 2012).
Ecopetrol has a Supplier Development Program that supports regional and local contractors and suppliers in areas of interest to the operation and business development. Between 2006 and 2011 the participation of local suppliers of goods and services substantially increased the contracting of non-foreign suppliers. As shown in Figure 10, the share of local suppliers in 2006 was only 12.2%, but by 2011 this had increased to 46.1%.
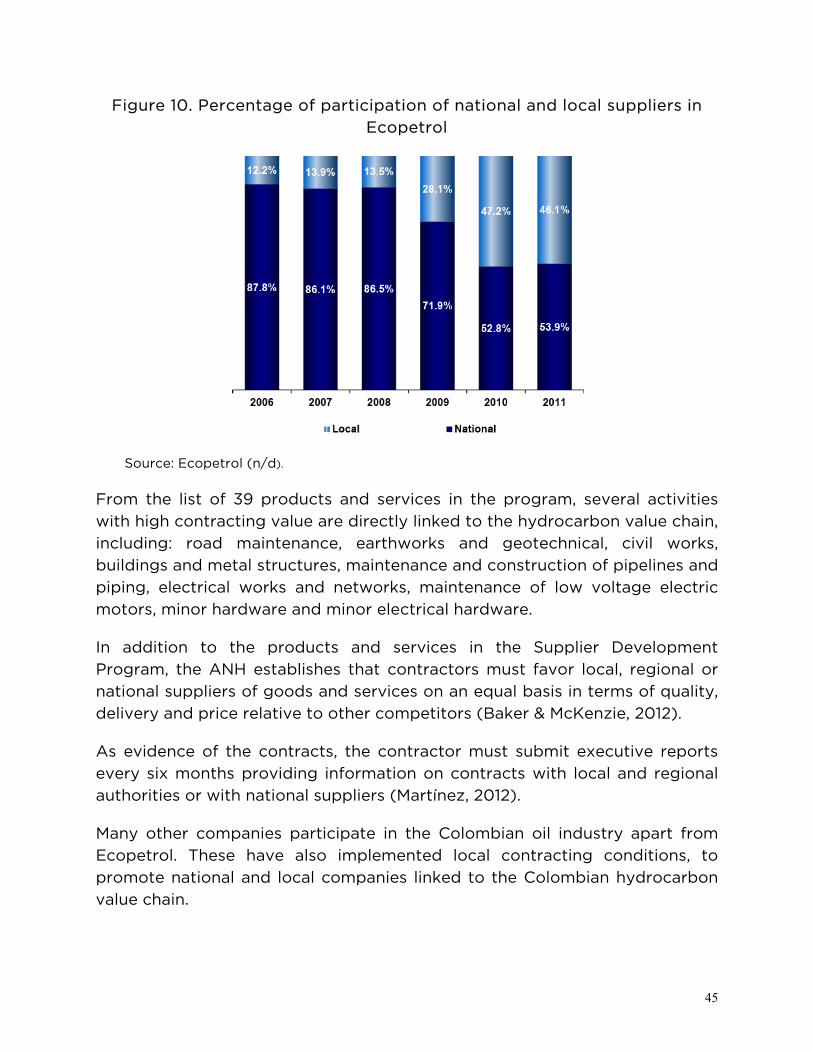
45
Figure 10. Percentage of participation of national and local suppliers in Ecopetrol
Source: Ecopetrol (n/d).
From the list of 39 products and services in the program, several activities with high contracting value are directly linked to the hydrocarbon value chain, including: road maintenance, earthworks and geotechnical, civil works, buildings and metal structures, maintenance and construction of pipelines and piping, electrical works and networks, maintenance of low voltage electric motors, minor hardware and minor electrical hardware.
In addition to the products and services in the Supplier Development Program, the ANH establishes that contractors must favor local, regional or national suppliers of goods and services on an equal basis in terms of quality, delivery and price relative to other competitors (Baker & McKenzie, 2012).
As evidence of the contracts, the contractor must submit executive reports every six months providing information on contracts with local and regional authorities or with national suppliers (Martínez, 2012).
Many other companies participate in the Colombian oil industry apart from Ecopetrol. These have also implemented local contracting conditions, to promote national and local companies linked to the Colombian hydrocarbon value chain.
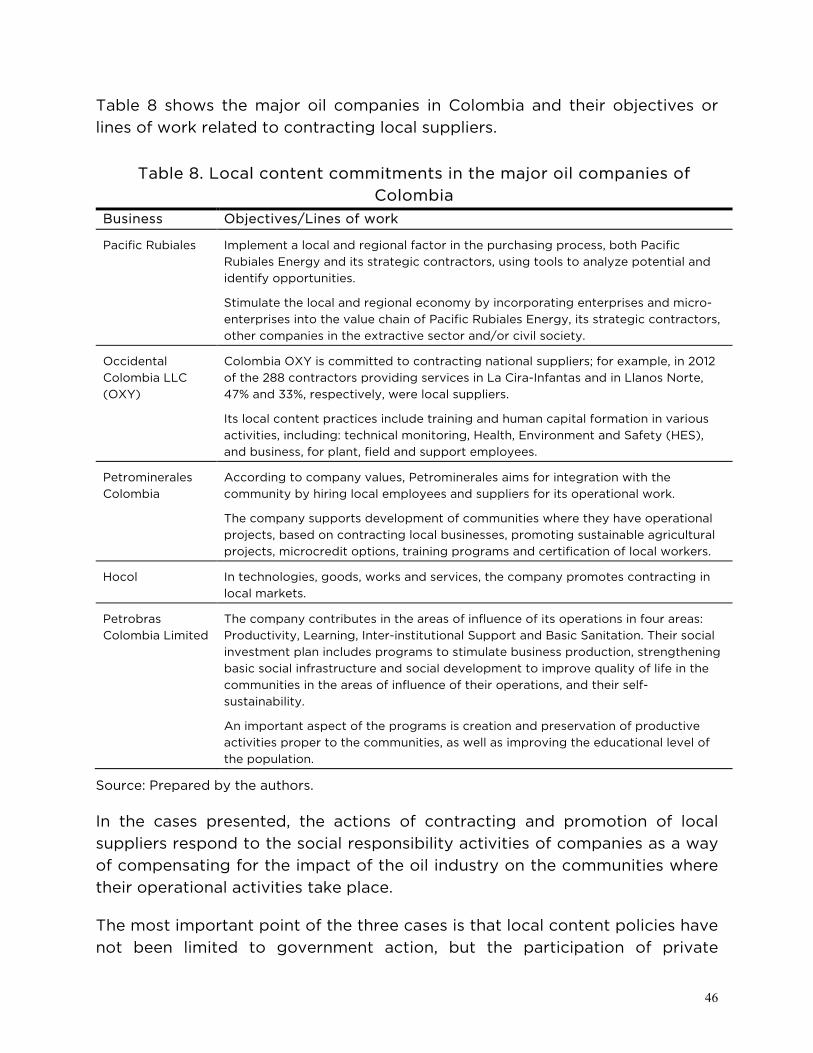
46
Table 8 shows the major oil companies in Colombia and their objectives or lines of work related to contracting local suppliers.
Table 8. Local content commitments in the major oil companies of Colombia
Business Objectives/Lines of work
Pacific Rubiales Implement a local and regional factor in the purchasing process, both Pacific Rubiales Energy and its strategic contractors, using tools to analyze potential and identify opportunities.
Stimulate the local and regional economy by incorporating enterprises and micro-enterprises into the value chain of Pacific Rubiales Energy, its strategic contractors, other companies in the extractive sector and/or civil society.
Occidental Colombia LLC (OXY)
Colombia OXY is committed to contracting national suppliers; for example, in 2012 of the 288 contractors providing services in La Cira-Infantas and in Llanos Norte, 47% and 33%, respectively, were local suppliers.
Its local content practices include training and human capital formation in various activities, including: technical monitoring, Health, Environment and Safety (HES), and business, for plant, field and support employees.
Petrominerales Colombia
According to company values, Petrominerales aims for integration with the community by hiring local employees and suppliers for its operational work.
The company supports development of communities where they have operational projects, based on contracting local businesses, promoting sustainable agricultural projects, microcredit options, training programs and certification of local workers.
Hocol In technologies, goods, works and services, the company promotes contracting in local markets.
Petrobras Colombia Limited
The company contributes in the areas of influence of its operations in four areas: Productivity, Learning, Inter-institutional Support and Basic Sanitation. Their social investment plan includes programs to stimulate business production, strengthening basic social infrastructure and social development to improve quality of life in the communities in the areas of influence of their operations, and their self-sustainability.
An important aspect of the programs is creation and preservation of productive activities proper to the communities, as well as improving the educational level of the population.
Source: Prepared by the authors.
In the cases presented, the actions of contracting and promotion of local suppliers respond to the social responsibility activities of companies as a way of compensating for the impact of the oil industry on the communities where their operational activities take place.
The most important point of the three cases is that local content policies have not been limited to government action, but the participation of private

47
companies has played an important role in the implementation and success of these initiatives.
Although in the case of private companies, local content initiatives respond mainly to issues of corporate image and social responsibility, undeniably it is possible to promote the economic, social and productive participation of the localities where oil activities take place.
In the three case studies six main strategies were identified whose implementation can mean the success of local content policies, although in some cases care should be taken that the policies and changes due to the Energy Reform do not pose a risk to the hydrocarbon subsector. The strategies and their possible success and risk factors are presented in Table 9.
Table 9. Success and risk factors in local content policies Strategies Success Risk
National supervision from the start
It is possible to maintain the Nation’s supervision of oil resources despite the entry of private and foreign capital.
Assignment of non-transparent contracts or influence peddling to win bidding awards.
Prevent the oil business from eroding other businesses
Detailed diagnosis of local chains of suppliers of goods and services to identify strengths and weaknesses.
The attraction of new investments in the industry could harm other industries and companies in the localities where new investments are made.
Commitment to build national knowhow
This is a key factor in development of policies with social content. In all three case studies, national governments have emphasized the need for private investors to contribute to investment in research and development for the national hydrocarbon industries.
This has increased the value-added of national products and created scientific and technological clusters.
Extracting the economic rent without damaging the oil business
At the same time, the government must make direct investments in the industry to be entitled to the same benefits as any shareholder, through a properly designed tax system which ensures that profits from oil remain in the country but do not threaten investments.
An over rigid tax system can repel private investors.
Industrial policy of Using financing tools, government
48
Table 9. Success and risk factors in local content policies Strategies Success Risk active stimulus to local suppliers through fiscal methods and access to financing
agencies and development banks can promote expansion and increased investment flows to companies in the value chain, particularly SMEs, which participate as suppliers of goods and services.
Gradual increase without exceptions of national content requirements
More support for SMEs directly linked to the industry, to strengthen their development.
This can mean bottlenecks in project bidding. Although investment is encouraged in local companies, mechanisms are needed to guarantee the transparency of investments and speed up contract procedures.
Source: Prepared by the authors.
5. Projected hydrocarbon production in Mexico
This section presents data and statistics collected from official sources on estimates for hydrocarbon production over the next few years, and the investment priorities in the country.
The projections come from three sources and provide additional information. The first are from SENER and generate two production projections, one inertial and one based on the National Energy Strategy. The second projection is from the US EIA and presents projections of production of barrels per day between 2010 and 2040. These data include the expected increase resulting from the Energy Reform. Finally projections from SENER are presented on investment needs for different types of hydrocarbon deposits.
5.1. SENER projections
The main source of statistical information on the hydrocarbon subsector is SENER and its statistical information system. According to the publication Prospectiva de petroleo crudo y petrolíferos 2013-2026 (SENER, 2013), crude oil production is estimated to reach 2,884,000 barrels per day in 2020, and 3,138,000 barrels per day in 2027, with an average annual growth rate (AAGR) of 1.4% for the period 2013-2027.
The same document states that the medium- and long-term outlook for Pemex to continue diversifying exploration work in multiple national
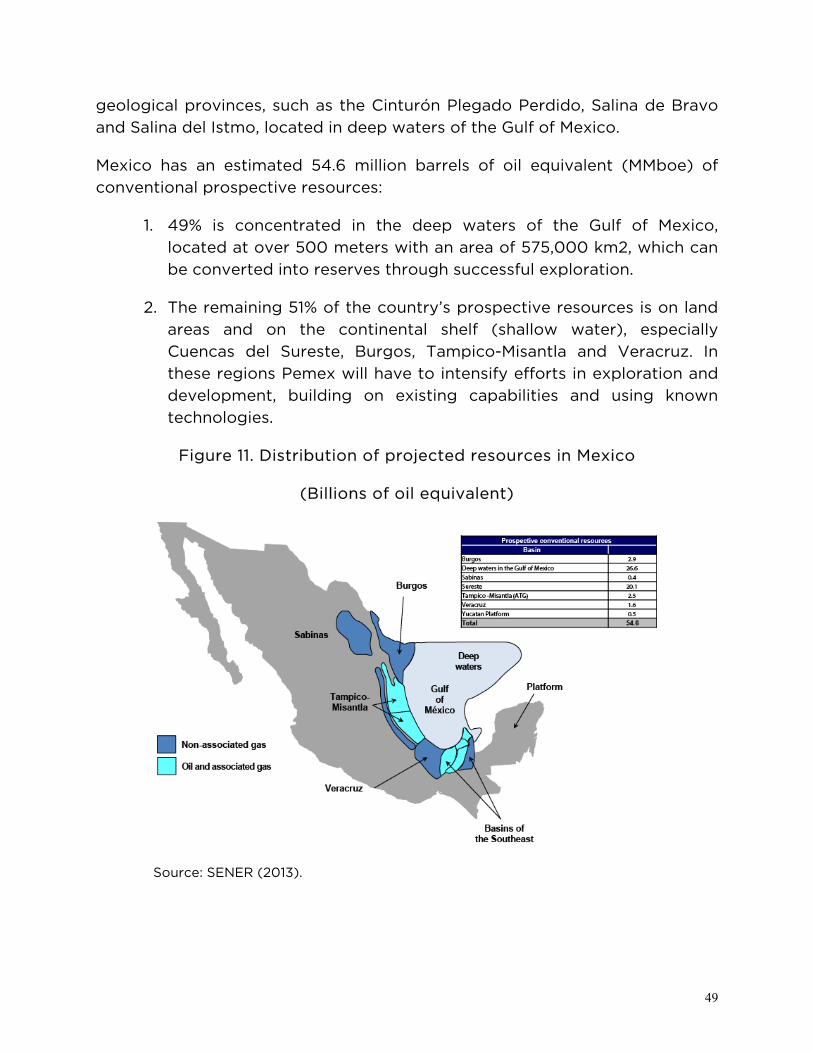
49
geological provinces, such as the Cinturón Plegado Perdido, Salina de Bravo and Salina del Istmo, located in deep waters of the Gulf of Mexico.
Mexico has an estimated 54.6 million barrels of oil equivalent (MMboe) of conventional prospective resources:
1. 49% is concentrated in the deep waters of the Gulf of Mexico, located at over 500 meters with an area of 575,000 km2, which can be converted into reserves through successful exploration.
2. The remaining 51% of the country’s prospective resources is on land areas and on the continental shelf (shallow water), especially Cuencas del Sureste, Burgos, Tampico-Misantla and Veracruz. In these regions Pemex will have to intensify efforts in exploration and development, building on existing capabilities and using known technologies.
Figure 11. Distribution of projected resources in Mexico
(Billions of oil equivalent)
Source: SENER (2013).

50
The projection for the system considers two scenarios: inertial and National Energy Strategy (NES).7
In the inertial scenario deepwater production is expected to start from 2015, with gas production from the Lakach project. Oil would begin in 2021 with the Área Perdido and Holok, to which Tlancanán will be added later. The inertial scenario will require an average of 1,556 wells drilled per year between 2012 and 2026. It is estimated that the exploration projects will incorporate total hydrocarbon reserves (3P) of 2,004 mmboe annual average over the period 2012-2026 (SENER, 2012).
The average annual investment to support the scenario is Mex$310.500 billion in the period 2012-2026 which will be used to improve exploration results and maintain the production platform.
Prospective crude production in the inertial scenario is planned at 2.62 billion barrels in 2013 and 2.83 billion barrels per day in 2026, with a 60% AAGR.
Figure 12. Projected crude oil production, inertial scenario 2026
Billions of barrels per day
Source: Energy Information System (2014).
7 Scenario calculated from the 2012-2026 National Energy Strategy (NES).Although the projections are made by 2006-2012 administration, and based on the 2008 Energy Reform, the Energy Information System SENER continues using both scenarios, and since it is the only official statistical information available on the sector, it is considered valid.
2.62
2.70
2.76
2.82
2.93
2.982.95
2.912.89
2.822.78 2.77 2.78
2.83
2.40
2.50
2.60
2.70
2.80
2.90
3.00
3.10
2013 2014 2015 2016 2017 2018 2019 2020 2021 2022 2023 2024 2025 2026

51
For natural gas production, the inertial scenario estimates a production of 6.662 billion cubic feet per day in 2013 and 9.390 billion cubic feet per day in 2026, with an AAGR of 2.68%.
Figure 13. Projected natural gas production, inertial scenario 2026
(Million cubic feet per day)
Source: Energy Information System (2014).
According to the ENE scenario, investment requirements will reach an annual average of Mex$339.900 billion between 2012 and 2026. Of this amount, 37.9% will be used for operation of existing fields, 22.7% for exploration of new fields, 17.7% for development of deepwater projects, 7.7% will be for investments supplementary to the Integrated Contracts, 7.6% will go to develop two shale gas plays, while the remaining 1.8% will be to implement an enhanced recovery program.
In the scenario, the same deepwater projects will be implemented as in the inertial scenario but with higher crude production at 40 mbd in 2026.
From 2018 an enhanced recovery program will be integrated into oil production. The average number of wells to be drilled between 2012 and 2026 is 1,753 per year, and the incorporation of 3P reserves will be 2,020 mmboe annual average in the period 2012-2026 (SENER, 2012).
6,662 6,706 6,785 7,0067,583
8,443 8,582 8,546 8,589 8,786 8,874 8,899 8,9679,391
0
1,000
2,000
3,000
4,000
5,000
6,000
7,000
8,000
9,000
10,000
2013 2014 2015 2016 2017 2018 2019 2020 2021 2022 2023 2024 2025 2026

52
Projected crude production in this scenario is estimated at 2.62 billion barrels per day in 2013 and 3.35 billion barrels per day by 2026, with an AAGR of 1.93%.
Figure 14. Projected crude oil production, ENE scenario to 2026
(billions of barrels per day)
Source: Energy Information System (2014).
The ENE scenario estimates that natural gas production will be 6.651 million cubic feet per day in 2013 and 12.048 million cubic feet per day by 2026, with an AAGR of 4.68%.
Figure 15. Projected natural gas production, ENE scenario to 2026 (millions of cubic feet per day)
Source: Energy Information System (2014).
2.62 2.70 2.76 2.82 2.93 3.00 2.99 2.98 2.99 2.97 3.02 3.103.23
3.35
0.00
0.50
1.00
1.50
2.00
2.50
3.00
3.50
4.00
2013 2014 2015 2016 2017 2018 2019 2020 2021 2022 2023 2024 2025 2026
6,651 6,717 6,827 7,0647,592
8,1788,651
9,0749,569
10,09510,49010,856
11,34812,048
0
2,000
4,000
6,000
8,000
10,000
12,000
14,000
2013 2014 2015 2016 2017 2018 2019 2020 2021 2022 2023 2024 2025 2026
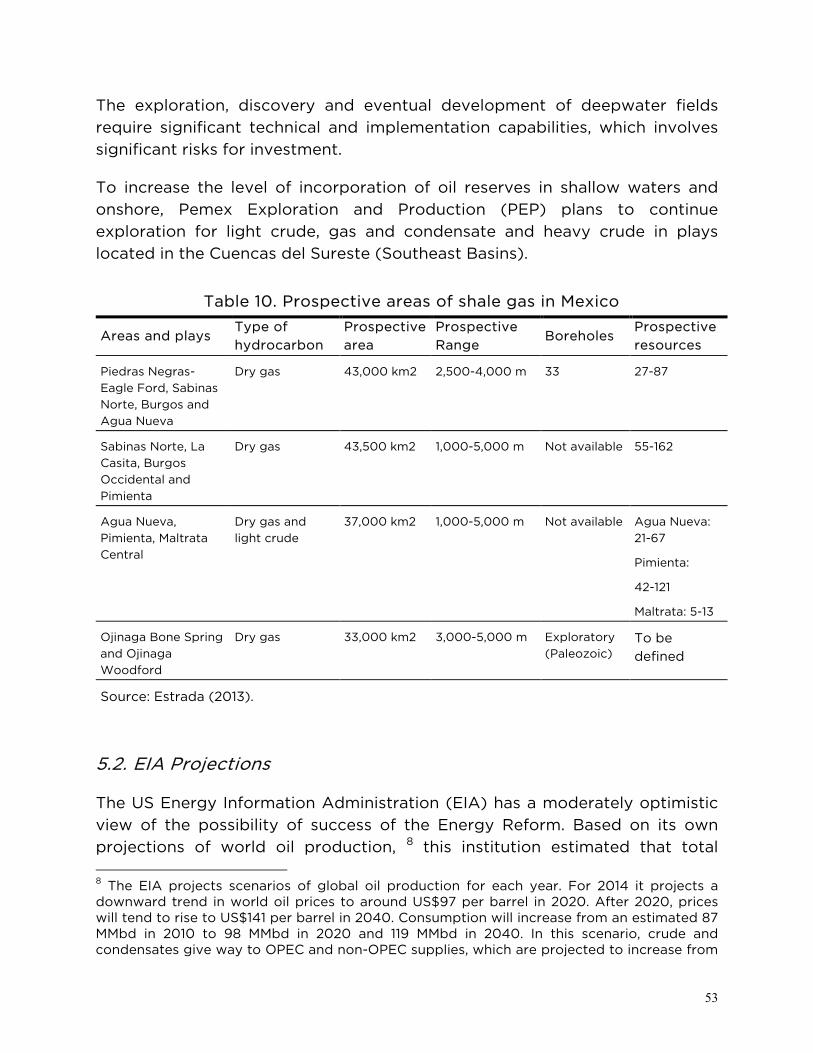
53
The exploration, discovery and eventual development of deepwater fields require significant technical and implementation capabilities, which involves significant risks for investment.
To increase the level of incorporation of oil reserves in shallow waters and onshore, Pemex Exploration and Production (PEP) plans to continue exploration for light crude, gas and condensate and heavy crude in plays located in the Cuencas del Sureste (Southeast Basins).
Table 10. Prospective areas of shale gas in Mexico
Areas and plays Type of hydrocarbon
Prospective area
Prospective Range
Boreholes Prospective resources
Piedras Negras-Eagle Ford, Sabinas Norte, Burgos and Agua Nueva
Dry gas 43,000 km2 2,500-4,000 m 33 27-87
Sabinas Norte, La Casita, Burgos Occidental and Pimienta
Dry gas 43,500 km2 1,000-5,000 m Not available 55-162
Agua Nueva, Pimienta, Maltrata Central
Dry gas and light crude
37,000 km2 1,000-5,000 m Not available Agua Nueva: 21-67
Pimienta:
42-121
Maltrata: 5-13
Ojinaga Bone Spring and Ojinaga Woodford
Dry gas 33,000 km2 3,000-5,000 m Exploratory (Paleozoic)
To be defined
Source: Estrada (2013).
5.2. EIA Projections
The US Energy Information Administration (EIA) has a moderately optimistic view of the possibility of success of the Energy Reform. Based on its own projections of world oil production, 8 this institution estimated that total 8 The EIA projects scenarios of global oil production for each year. For 2014 it projects a downward trend in world oil prices to around US$97 per barrel in 2020. After 2020, prices will tend to rise to US$141 per barrel in 2040. Consumption will increase from an estimated 87 MMbd in 2010 to 98 MMbd in 2020 and 119 MMbd in 2040. In this scenario, crude and condensates give way to OPEC and non-OPEC supplies, which are projected to increase from
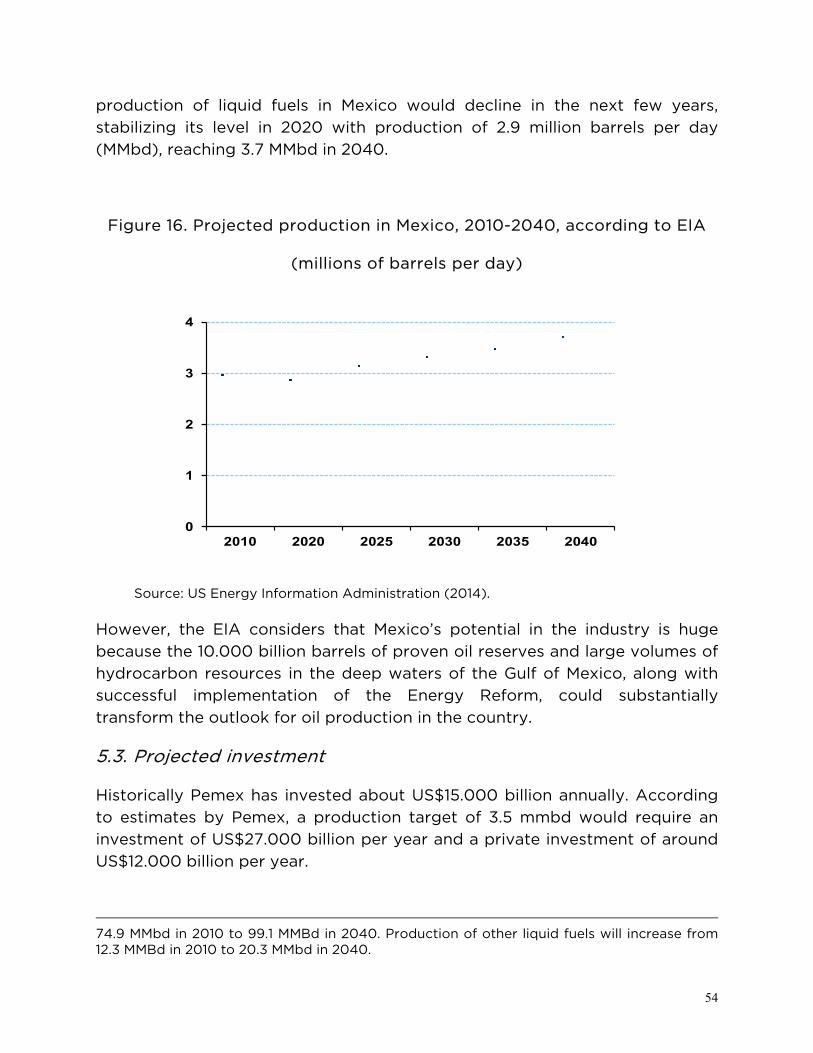
54
production of liquid fuels in Mexico would decline in the next few years, stabilizing its level in 2020 with production of 2.9 million barrels per day (MMbd), reaching 3.7 MMbd in 2040.
Figure 16. Projected production in Mexico, 2010-2040, according to EIA
(millions of barrels per day)
Source: US Energy Information Administration (2014).
However, the EIA considers that Mexico’s potential in the industry is huge because the 10.000 billion barrels of proven oil reserves and large volumes of hydrocarbon resources in the deep waters of the Gulf of Mexico, along with successful implementation of the Energy Reform, could substantially transform the outlook for oil production in the country.
5.3. Projected investment
Historically Pemex has invested about US$15.000 billion annually. According to estimates by Pemex, a production target of 3.5 mmbd would require an investment of US$27.000 billion per year and a private investment of around US$12.000 billion per year.
74.9 MMbd in 2010 to 99.1 MMBd in 2040. Production of other liquid fuels will increase from 12.3 MMBd in 2010 to 20.3 MMbd in 2040.
0
1
2
3
4
2010 2020 2025 2030 2035 2040
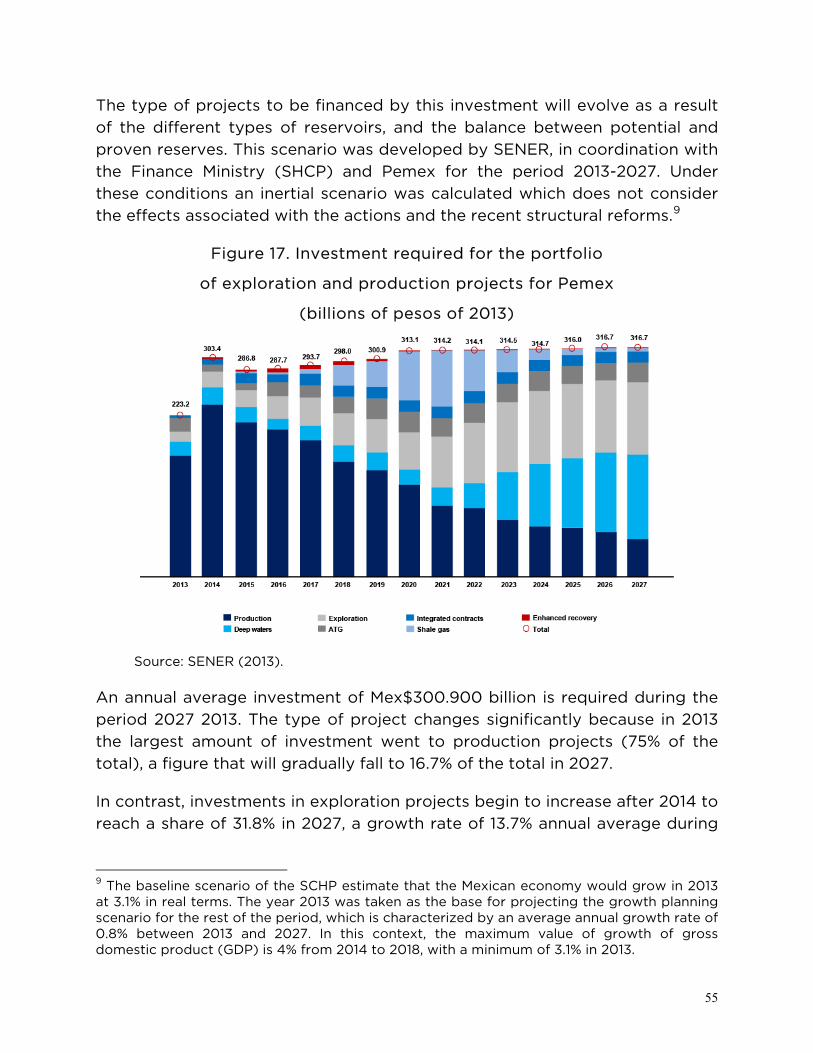
55
The type of projects to be financed by this investment will evolve as a result of the different types of reservoirs, and the balance between potential and proven reserves. This scenario was developed by SENER, in coordination with the Finance Ministry (SHCP) and Pemex for the period 2013-2027. Under these conditions an inertial scenario was calculated which does not consider the effects associated with the actions and the recent structural reforms.9
Figure 17. Investment required for the portfolio
of exploration and production projects for Pemex
(billions of pesos of 2013)
Source: SENER (2013).
An annual average investment of Mex$300.900 billion is required during the period 2027 2013. The type of project changes significantly because in 2013 the largest amount of investment went to production projects (75% of the total), a figure that will gradually fall to 16.7% of the total in 2027.
In contrast, investments in exploration projects begin to increase after 2014 to reach a share of 31.8% in 2027, a growth rate of 13.7% annual average during
9 The baseline scenario of the SCHP estimate that the Mexican economy would grow in 2013 at 3.1% in real terms. The year 2013 was taken as the base for projecting the growth planning scenario for the rest of the period, which is characterized by an average annual growth rate of 0.8% between 2013 and 2027. In this context, the maximum value of growth of gross domestic product (GDP) is 4% from 2014 to 2018, with a minimum of 3.1% in 2013.
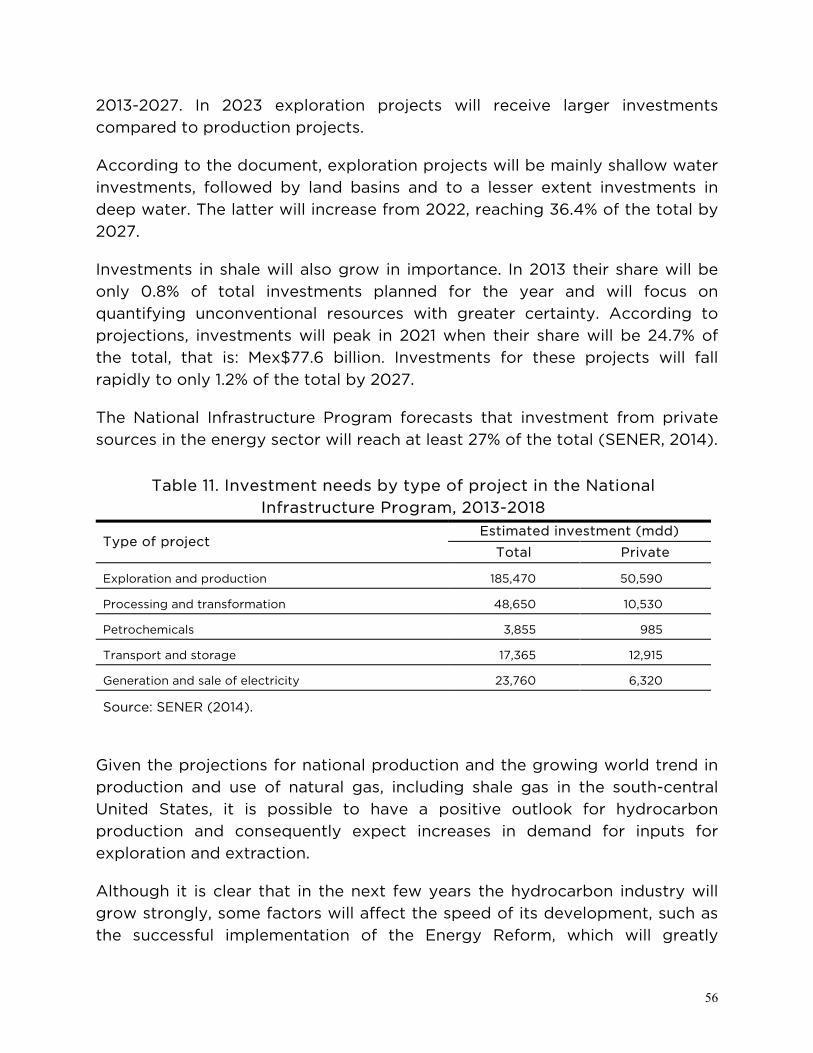
56
2013-2027. In 2023 exploration projects will receive larger investments compared to production projects.
According to the document, exploration projects will be mainly shallow water investments, followed by land basins and to a lesser extent investments in deep water. The latter will increase from 2022, reaching 36.4% of the total by 2027.
Investments in shale will also grow in importance. In 2013 their share will be only 0.8% of total investments planned for the year and will focus on quantifying unconventional resources with greater certainty. According to projections, investments will peak in 2021 when their share will be 24.7% of the total, that is: Mex$77.6 billion. Investments for these projects will fall rapidly to only 1.2% of the total by 2027.
The National Infrastructure Program forecasts that investment from private sources in the energy sector will reach at least 27% of the total (SENER, 2014).
Table 11. Investment needs by type of project in the National Infrastructure Program, 2013-2018
Type of project Estimated investment (mdd)
Total Private
Exploration and production 185,470 50,590
Processing and transformation 48,650 10,530
Petrochemicals 3,855 985
Transport and storage 17,365 12,915
Generation and sale of electricity 23,760 6,320
Source: SENER (2014).
Given the projections for national production and the growing world trend in production and use of natural gas, including shale gas in the south-central United States, it is possible to have a positive outlook for hydrocarbon production and consequently expect increases in demand for inputs for exploration and extraction.
Although it is clear that in the next few years the hydrocarbon industry will grow strongly, some factors will affect the speed of its development, such as the successful implementation of the Energy Reform, which will greatly
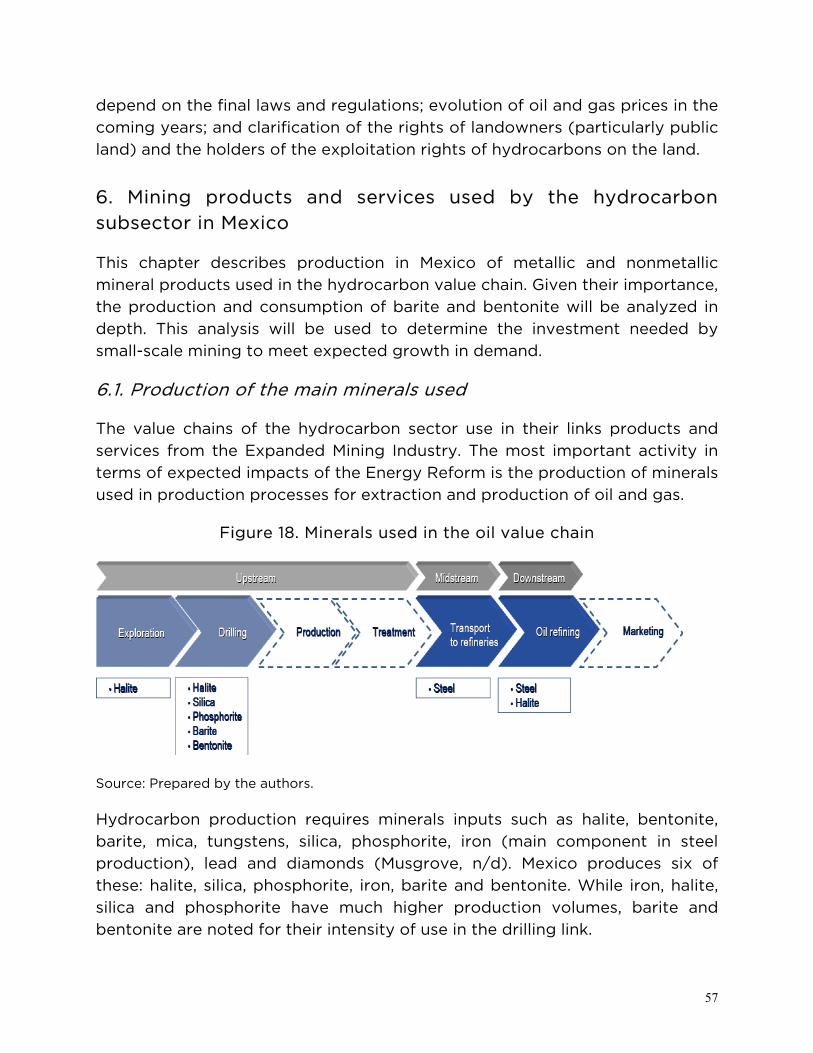
57
depend on the final laws and regulations; evolution of oil and gas prices in the coming years; and clarification of the rights of landowners (particularly public land) and the holders of the exploitation rights of hydrocarbons on the land.
6. Mining products and services used by the hydrocarbon subsector in Mexico
This chapter describes production in Mexico of metallic and nonmetallic mineral products used in the hydrocarbon value chain. Given their importance, the production and consumption of barite and bentonite will be analyzed in depth. This analysis will be used to determine the investment needed by small-scale mining to meet expected growth in demand.
6.1. Production of the main minerals used
The value chains of the hydrocarbon sector use in their links products and services from the Expanded Mining Industry. The most important activity in terms of expected impacts of the Energy Reform is the production of minerals used in production processes for extraction and production of oil and gas.
Figure 18. Minerals used in the oil value chain
Source: Prepared by the authors.
Hydrocarbon production requires minerals inputs such as halite, bentonite, barite, mica, tungstens, silica, phosphorite, iron (main component in steel production), lead and diamonds (Musgrove, n/d). Mexico produces six of these: halite, silica, phosphorite, iron, barite and bentonite. While iron, halite, silica and phosphorite have much higher production volumes, barite and bentonite are noted for their intensity of use in the drilling link.
58
The highest volume mineral Mexico is iron. This product is consumed by a range of industries, and is used in the hydrocarbon sector in the processes of production, transportation and refining of oil, natural gas and other chemicals, as well as in oil and gas platforms for construction of systems of piping, electricity, power turbine components, electrical towers and wind turbines.
Iron production in 2011 was 12.8 million tonnes, 9% lower than in 2010, and mining of the product was 65% of the volume obtained (SE, 2013a). The main iron producing states are Michoacán, Coahuila, Coahuila, Colima, Jalisco, Sonora, Durango and Chihuahua, which together account for 95% of national iron production (SE, 2013a).
According to the SE, the increase in world demand for inputs has led to a shortage of iron ore, among other products, resulting in higher prices.
Halite or salt, as it is commonly known, is the second most produced mineral in the industry. In the oil industry salt is used as a flocculent to increase the density of the drilling fluids to prevent dissolution of saline horizons and speed up hardening of the concrete used in the drilling (SE, 2013a).
Salt production in 2011 was 8,769,000 tonnes, mainly in Baja California Sur which had a production of almost 20,000 tonnes per day, which goes entirely to the export market. The rest of the production comes from the salt pans in the states of Veracruz, Nuevo León and Colima which supply the national market.
Salt is obtained mainly in Guerrero Negro, Baja California Sur, where 82% of national production is mined. The states of Veracruz, Nuevo León and Colima provide the remaining 18%. There is also potential for production in the states of Yucatán, Coahuila, San Luis Potosí, Tamaulipas and Chihuahua (SE, 2013a).
The main use of silica in the industry is for cementing and fracturing oil wells. This process involves injecting round grain uniform silica sand. National production of silica in 2011 was 2.5 million tonnes, 3% less than in the previous year. Silica occurs mainly in the states of Coahuila, Veracruz and Nuevo León (SE, 2013a).
Phosphorite is used in the preparation of drilling muds and hydraulic fluids, triphosphate is also used in oil drilling to improve the mechanical properties of soils. In 2011 national production of phosphorite was 1,690,606 tonnes, 12%
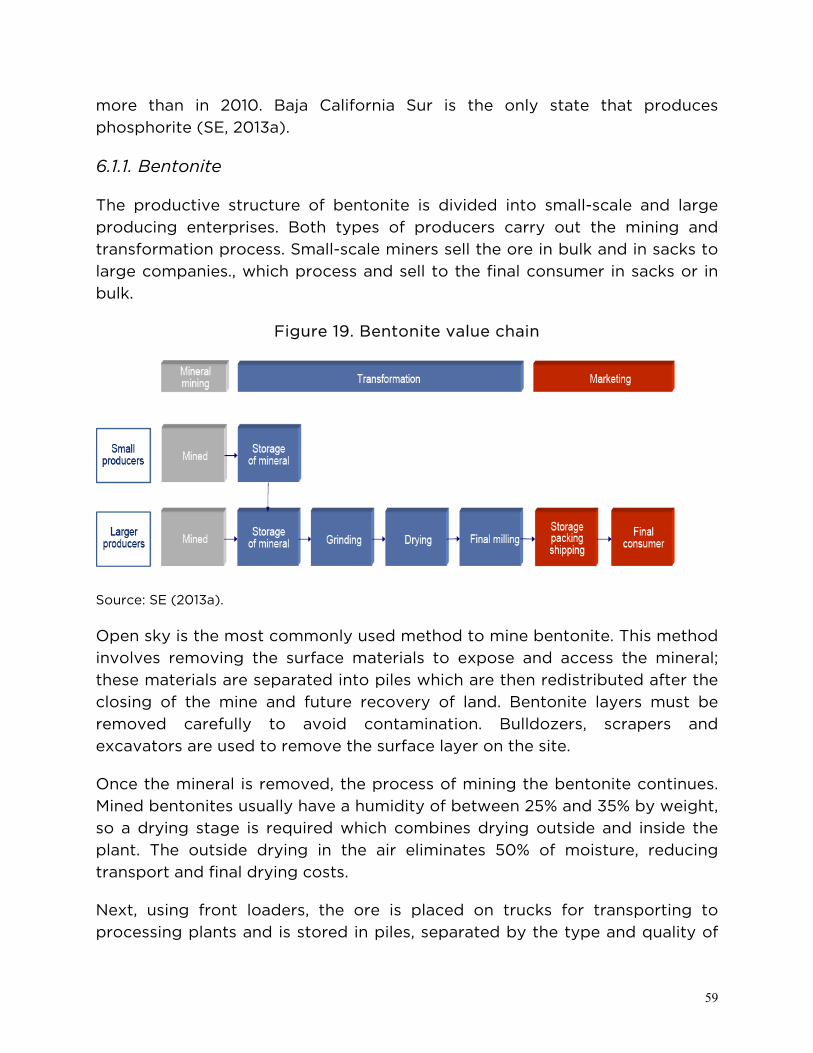
59
more than in 2010. Baja California Sur is the only state that produces phosphorite (SE, 2013a).
6.1.1. Bentonite
The productive structure of bentonite is divided into small-scale and large producing enterprises. Both types of producers carry out the mining and transformation process. Small-scale miners sell the ore in bulk and in sacks to large companies., which process and sell to the final consumer in sacks or in bulk.
Figure 19. Bentonite value chain
Source: SE (2013a).
Open sky is the most commonly used method to mine bentonite. This method involves removing the surface materials to expose and access the mineral; these materials are separated into piles which are then redistributed after the closing of the mine and future recovery of land. Bentonite layers must be removed carefully to avoid contamination. Bulldozers, scrapers and excavators are used to remove the surface layer on the site.
Once the mineral is removed, the process of mining the bentonite continues. Mined bentonites usually have a humidity of between 25% and 35% by weight, so a drying stage is required which combines drying outside and inside the plant. The outside drying in the air eliminates 50% of moisture, reducing transport and final drying costs.
Next, using front loaders, the ore is placed on trucks for transporting to processing plants and is stored in piles, separated by the type and quality of
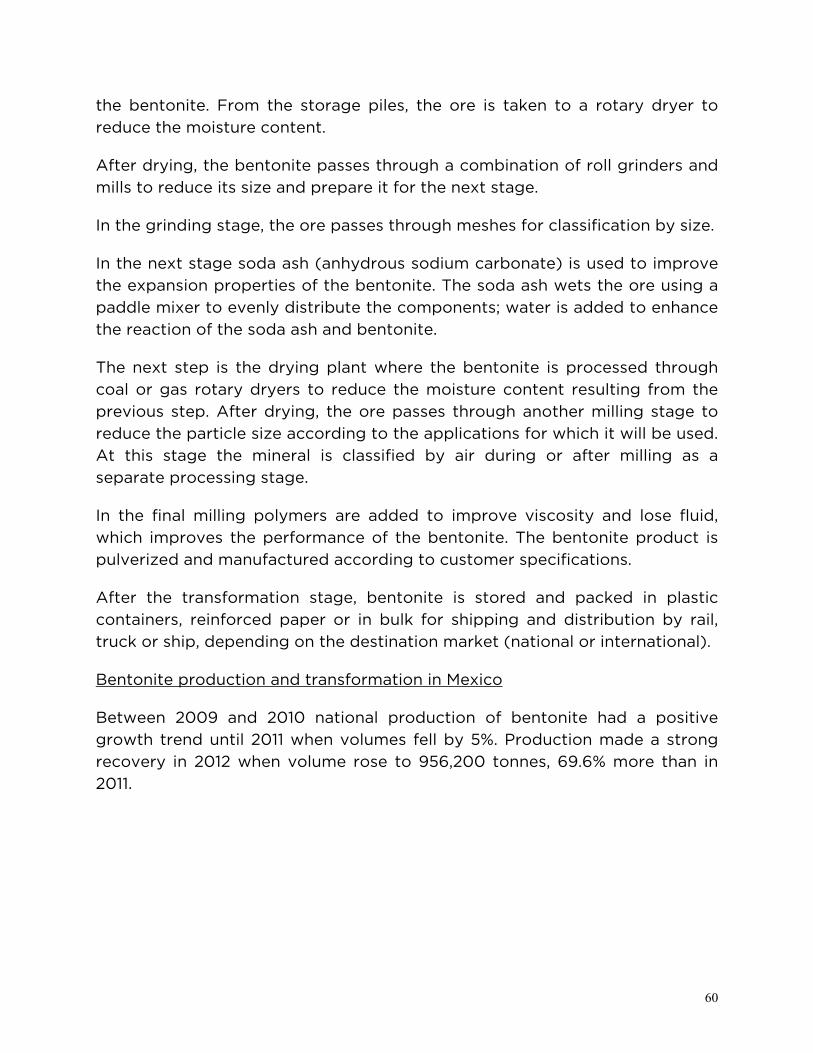
60
the bentonite. From the storage piles, the ore is taken to a rotary dryer to reduce the moisture content.
After drying, the bentonite passes through a combination of roll grinders and mills to reduce its size and prepare it for the next stage.
In the grinding stage, the ore passes through meshes for classification by size.
In the next stage soda ash (anhydrous sodium carbonate) is used to improve the expansion properties of the bentonite. The soda ash wets the ore using a paddle mixer to evenly distribute the components; water is added to enhance the reaction of the soda ash and bentonite.
The next step is the drying plant where the bentonite is processed through coal or gas rotary dryers to reduce the moisture content resulting from the previous step. After drying, the ore passes through another milling stage to reduce the particle size according to the applications for which it will be used. At this stage the mineral is classified by air during or after milling as a separate processing stage.
In the final milling polymers are added to improve viscosity and lose fluid, which improves the performance of the bentonite. The bentonite product is pulverized and manufactured according to customer specifications.
After the transformation stage, bentonite is stored and packed in plastic containers, reinforced paper or in bulk for shipping and distribution by rail, truck or ship, depending on the destination market (national or international).
Bentonite production and transformation in Mexico
Between 2009 and 2010 national production of bentonite had a positive growth trend until 2011 when volumes fell by 5%. Production made a strong recovery in 2012 when volume rose to 956,200 tonnes, 69.6% more than in 2011.

61
Figure 20. National production of bentonite
Source: SE (2013a).
Durango state accounts for 98.49% of national bentonite production, while the rest of comes from the states of Puebla, San Luis Potosí and Jalisco. The states of Coahuila, Nuevo León and Tamaulipas record production volumes of bentonite in some years, although since 2010 there is no more data on production of this mineral (see Table 12) (SE, 2013b).
Table 12. Bentonite producing states (tonnes)
Bentonite 2009 2010 2011 2012 *
Total 511,430 590,998 563,795 956,224
Durango 430,000 532,800 536,300 941,800
Puebla 20,948 36,422 19,895 8,915
San Luis Potosí 6,000 5,800 6,800 4,533
Jalisco 4,000 976 800 976
Coahuila 40,000 15,000 - -
Nuevo León 8,882 - - -
Tamaulipas 1,600 - - -
Source: SE (2013b). * Preliminary figures.
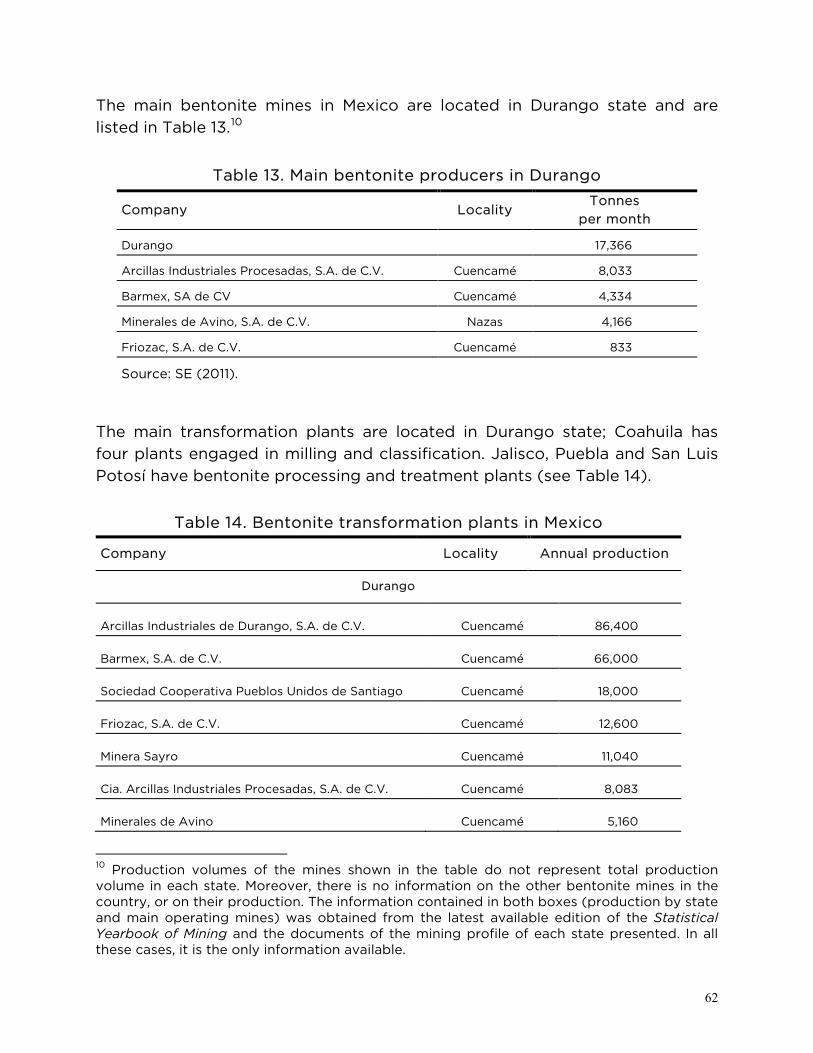
62
The main bentonite mines in Mexico are located in Durango state and are listed in Table 13.10
Table 13. Main bentonite producers in Durango
Company Locality Tonnes
per month
Durango 17,366
Arcillas Industriales Procesadas, S.A. de C.V. Cuencamé 8,033
Barmex, SA de CV Cuencamé 4,334
Minerales de Avino, S.A. de C.V. Nazas 4,166
Friozac, S.A. de C.V. Cuencamé 833
Source: SE (2011).
The main transformation plants are located in Durango state; Coahuila has four plants engaged in milling and classification. Jalisco, Puebla and San Luis Potosí have bentonite processing and treatment plants (see Table 14).
Table 14. Bentonite transformation plants in Mexico
Company Locality Annual production
Durango
Arcillas Industriales de Durango, S.A. de C.V. Cuencamé 86,400
Barmex, S.A. de C.V. Cuencamé 66,000
Sociedad Cooperativa Pueblos Unidos de Santiago Cuencamé 18,000
Friozac, S.A. de C.V. Cuencamé 12,600
Minera Sayro Cuencamé 11,040
Cia. Arcillas Industriales Procesadas, S.A. de C.V. Cuencamé 8,083
Minerales de Avino Cuencamé 5,160
10 Production volumes of the mines shown in the table do not represent total production volume in each state. Moreover, there is no information on the other bentonite mines in the country, or on their production. The information contained in both boxes (production by state and main operating mines) was obtained from the latest available edition of the Statistical Yearbook of Mining and the documents of the mining profile of each state presented. In all these cases, it is the only information available.
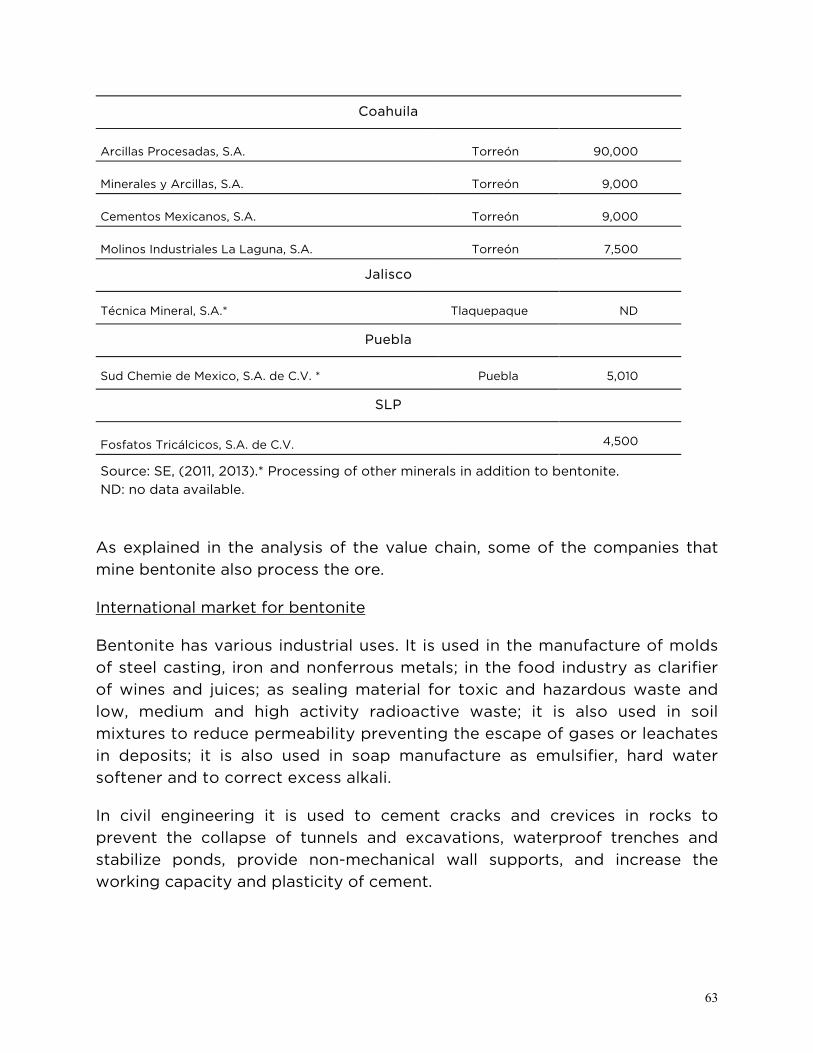
63
Coahuila
Arcillas Procesadas, S.A. Torreón 90,000
Minerales y Arcillas, S.A. Torreón 9,000
Cementos Mexicanos, S.A. Torreón 9,000
Molinos Industriales La Laguna, S.A. Torreón 7,500
Jalisco
Técnica Mineral, S.A.* Tlaquepaque ND
Puebla
Sud Chemie de Mexico, S.A. de C.V. * Puebla 5,010
SLP
Fosfatos Tricálcicos, S.A. de C.V. 4,500
Source: SE, (2011, 2013).* Processing of other minerals in addition to bentonite. ND: no data available.
As explained in the analysis of the value chain, some of the companies that mine bentonite also process the ore.
International market for bentonite
Bentonite has various industrial uses. It is used in the manufacture of molds of steel casting, iron and nonferrous metals; in the food industry as clarifier of wines and juices; as sealing material for toxic and hazardous waste and low, medium and high activity radioactive waste; it is also used in soil mixtures to reduce permeability preventing the escape of gases or leachates in deposits; it is also used in soap manufacture as emulsifier, hard water softener and to correct excess alkali.
In civil engineering it is used to cement cracks and crevices in rocks to prevent the collapse of tunnels and excavations, waterproof trenches and stabilize ponds, provide non-mechanical wall supports, and increase the working capacity and plasticity of cement.

64
On the international bentonite market, the world's largest producer is the United States. According to data from the USGS (2014), Mexico was the tenth largest producer of bentonite in 2013.
Table 15. World bentonite production (thousands of tonnes per year)
Country 2011 2012 2013
USA 4,810 4,980 4,950
Greece 850 800 1,200
Brazil 532 567 570
Turkey 1,000 400 400
Germany 350 375 350
Czech Republic 160 221 220
Ukraine 185 210 210
Spain 155 115 110
Italy 110 110 100
Mexico 54 54 50
Others 2,100 2,100 2,100
World production 7,690 9,950 10,300
Source: USGS (2014).
The main markets for bentonite are North America, Asia and Europe; consumption patterns vary according to local needs and the degree of industrialization of the importing countries.
In terms of price, in 2013 the price averaged US$65 per tonne and has been steadily rising since 2009. Although in 2012 growth slowed from previous years, the rate of change of bentonite prices is positive.
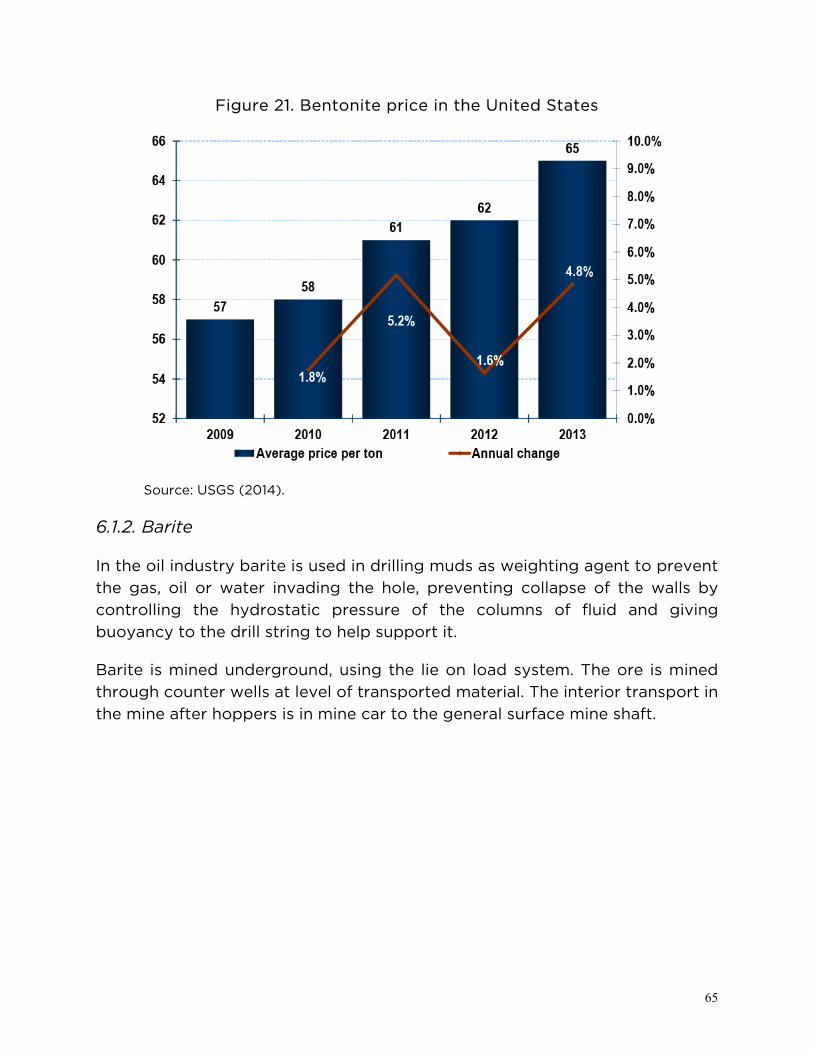
65
Figure 21. Bentonite price in the United States
Source: USGS (2014).
6.1.2. Barite
In the oil industry barite is used in drilling muds as weighting agent to prevent the gas, oil or water invading the hole, preventing collapse of the walls by controlling the hydrostatic pressure of the columns of fluid and giving buoyancy to the drill string to help support it.
Barite is mined underground, using the lie on load system. The ore is mined through counter wells at level of transported material. The interior transport in the mine after hoppers is in mine car to the general surface mine shaft.
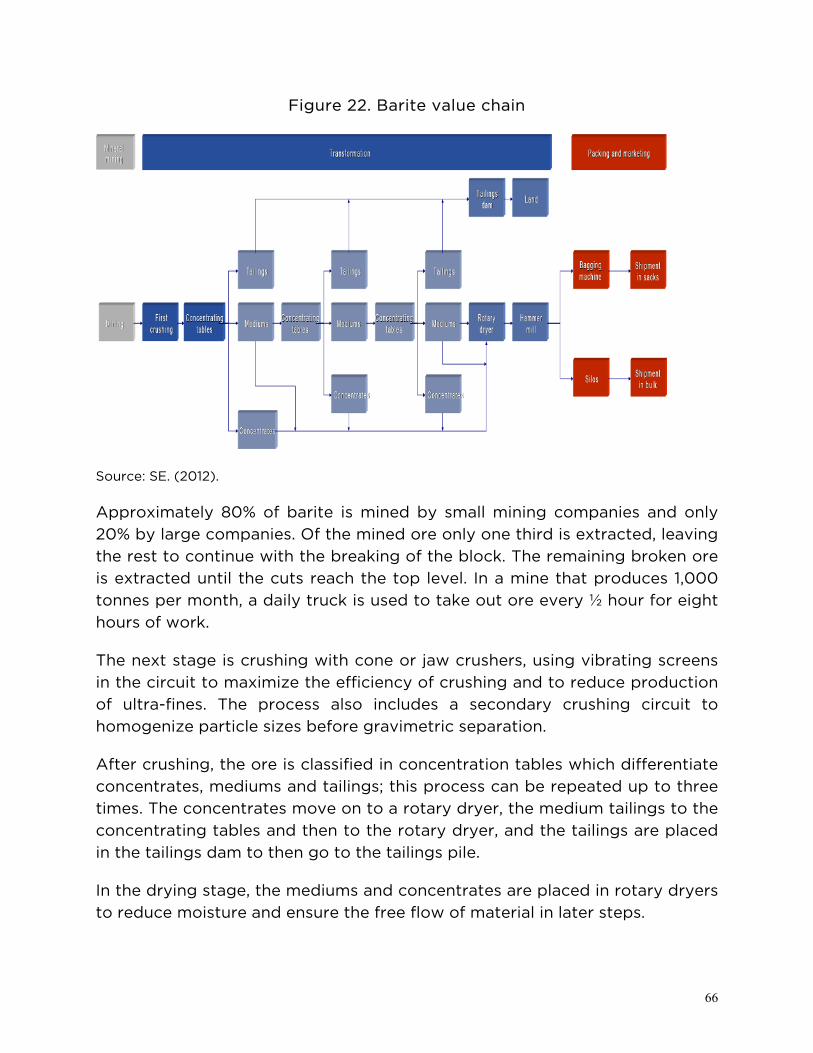
66
Figure 22. Barite value chain
Source: SE. (2012).
Approximately 80% of barite is mined by small mining companies and only 20% by large companies. Of the mined ore only one third is extracted, leaving the rest to continue with the breaking of the block. The remaining broken ore is extracted until the cuts reach the top level. In a mine that produces 1,000 tonnes per month, a daily truck is used to take out ore every ½ hour for eight hours of work.
The next stage is crushing with cone or jaw crushers, using vibrating screens in the circuit to maximize the efficiency of crushing and to reduce production of ultra-fines. The process also includes a secondary crushing circuit to homogenize particle sizes before gravimetric separation.
After crushing, the ore is classified in concentration tables which differentiate concentrates, mediums and tailings; this process can be repeated up to three times. The concentrates move on to a rotary dryer, the medium tailings to the concentrating tables and then to the rotary dryer, and the tailings are placed in the tailings dam to then go to the tailings pile.
In the drying stage, the mediums and concentrates are placed in rotary dryers to reduce moisture and ensure the free flow of material in later steps.
67
Barite milling is performed with hammer mills to have better control over the particle size. The milling can adjust the size of the ore to the needs and specifications of the customer. The ground ore is stored in silos or shipped in bulk or in sacks.
In the marketing stage producers sell the barite in bulk directly to oil well drilling companies operating as Pemex contractors. The ore is purchased at the mine head, milled, in sacks and in trucks.
There are two buyer profiles:
• Barite user, with very strict specifications.
• Intermediary barite user: this is the most convenient because they buy any type of quality which results in cost savings for the producer.
The producer is responsible for logistics and hires the equipment to transport the ore to the consumption points. For transportation of the ore, pressurized trucks are used whose cost varies11. The cost of transport is an important component since the cost of moving material from the center of the country ranges from Mex$490 to Mex$580, representing 35% of the final price.
Some producers have set up plants near import ports so as not to have to invest in transportation costs. Barite is imported by the producers themselves to supplement their production and they are responsible for import logistics.
The consumption centers acquire the ore immediately before its use in the wells, so the producer or marketer must include the use of storage silos in their costs so that the ore is available on request. Costs also include transport of the ore from the production center to the silo, and from the silo to the consumption center.
11 For example, the cost of freight to the United States is Mex$490 to Mex$580 per tonne; a special price in pesos is charged to the northern border where the material is unloaded and moved to another truck, from where another tariff is charged. The further the material is transported, the higher the cost. In a shipment from Puebla to Villahermosa (about 10 km), the approximate cost is Mex$500 per tonne, and if the truck takes more than 24 hours to unload the cost rises. According to the regulations, only 60 tonnes of ore can be carried per truck.
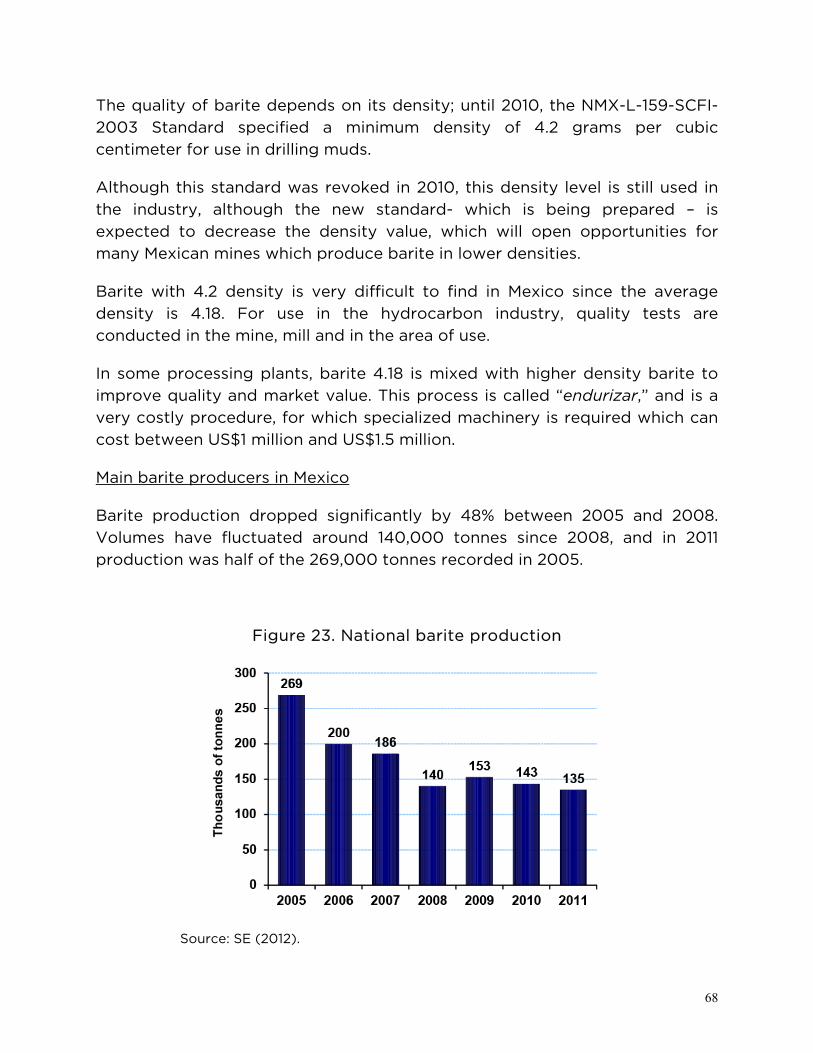
68
The quality of barite depends on its density; until 2010, the NMX-L-159-SCFI-2003 Standard specified a minimum density of 4.2 grams per cubic centimeter for use in drilling muds.
Although this standard was revoked in 2010, this density level is still used in the industry, although the new standard- which is being prepared – is expected to decrease the density value, which will open opportunities for many Mexican mines which produce barite in lower densities.
Barite with 4.2 density is very difficult to find in Mexico since the average density is 4.18. For use in the hydrocarbon industry, quality tests are conducted in the mine, mill and in the area of use.
In some processing plants, barite 4.18 is mixed with higher density barite to improve quality and market value. This process is called “endurizar,” and is a very costly procedure, for which specialized machinery is required which can cost between US$1 million and US$1.5 million.
Main barite producers in Mexico
Barite production dropped significantly by 48% between 2005 and 2008. Volumes have fluctuated around 140,000 tonnes since 2008, and in 2011 production was half of the 269,000 tonnes recorded in 2005.
Figure 23. National barite production
Source: SE (2012).
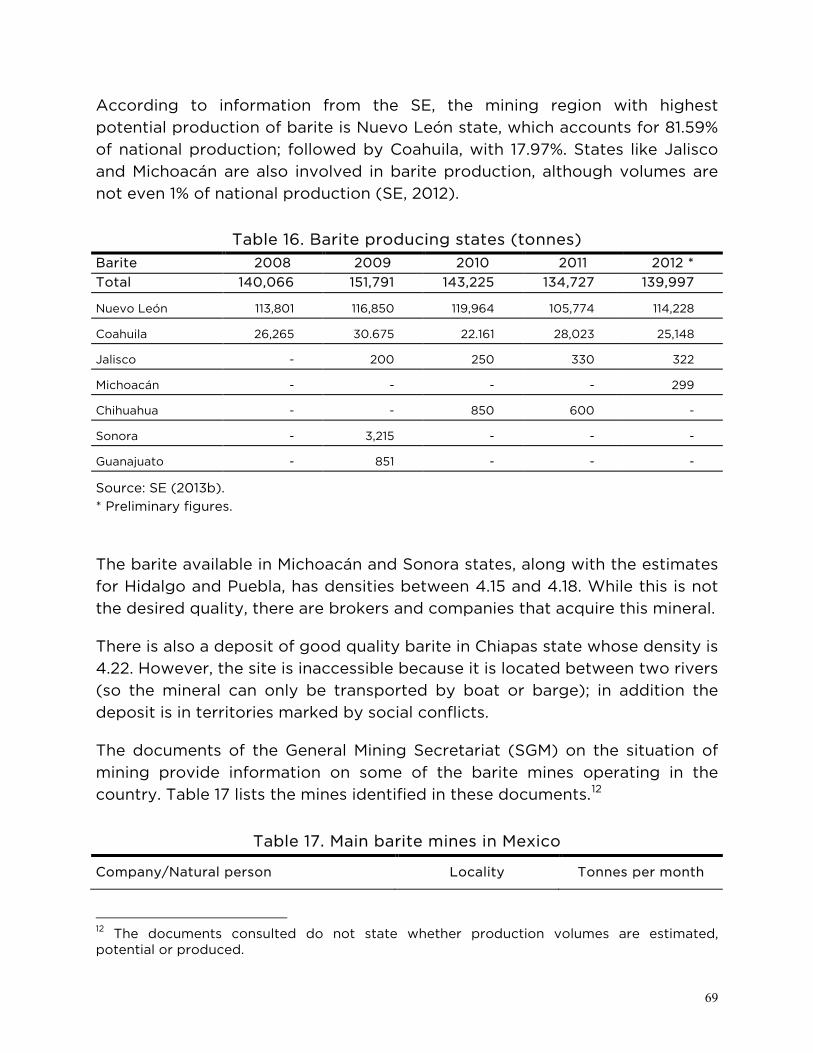
69
According to information from the SE, the mining region with highest potential production of barite is Nuevo León state, which accounts for 81.59% of national production; followed by Coahuila, with 17.97%. States like Jalisco and Michoacán are also involved in barite production, although volumes are not even 1% of national production (SE, 2012).
Table 16. Barite producing states (tonnes) Barite 2008 2009 2010 2011 2012 * Total 140,066 151,791 143,225 134,727 139,997
Nuevo León 113,801 116,850 119,964 105,774 114,228
Coahuila 26,265 30.675 22.161 28,023 25,148
Jalisco - 200 250 330 322
Michoacán - - - - 299
Chihuahua - - 850 600 -
Sonora - 3,215 - - -
Guanajuato - 851 - - -
Source: SE (2013b). * Preliminary figures.
The barite available in Michoacán and Sonora states, along with the estimates for Hidalgo and Puebla, has densities between 4.15 and 4.18. While this is not the desired quality, there are brokers and companies that acquire this mineral.
There is also a deposit of good quality barite in Chiapas state whose density is 4.22. However, the site is inaccessible because it is located between two rivers (so the mineral can only be transported by boat or barge); in addition the deposit is in territories marked by social conflicts.
The documents of the General Mining Secretariat (SGM) on the situation of mining provide information on some of the barite mines operating in the country. Table 17 lists the mines identified in these documents.12
Table 17. Main barite mines in Mexico
Company/Natural person Locality Tonnes per month
12 The documents consulted do not state whether production volumes are estimated, potential or produced.
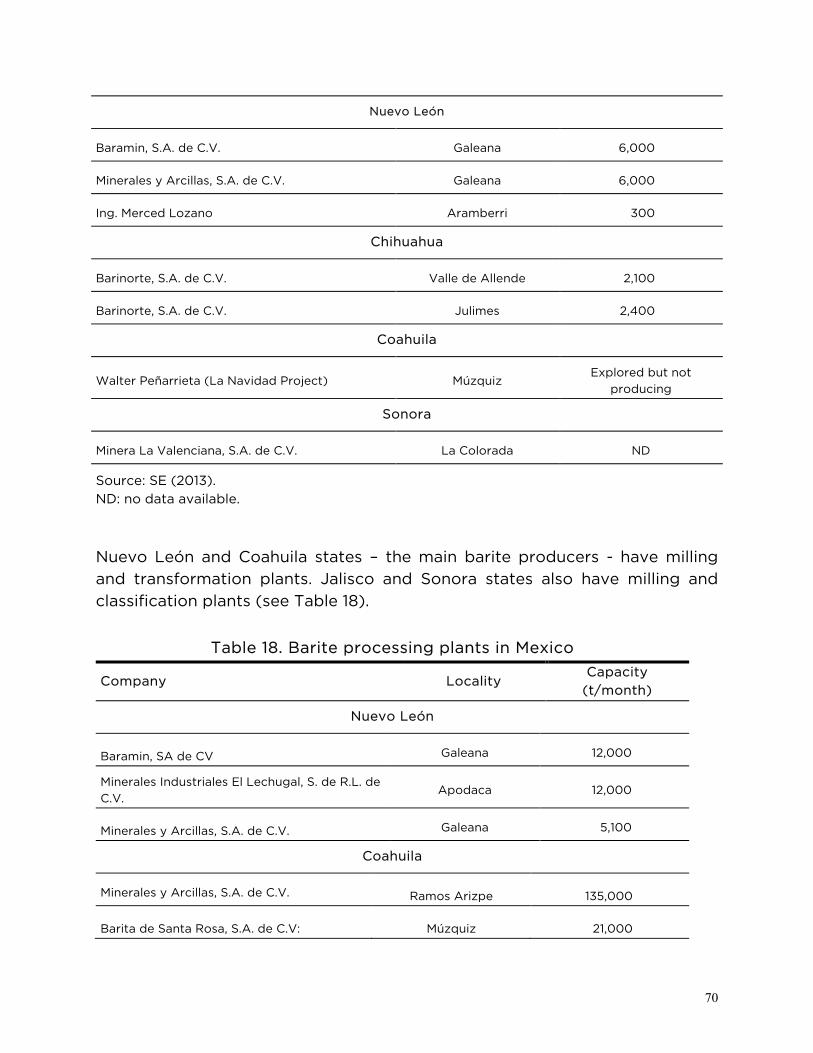
70
Nuevo León
Baramin, S.A. de C.V. Galeana 6,000
Minerales y Arcillas, S.A. de C.V. Galeana 6,000
Ing. Merced Lozano Aramberri 300
Chihuahua
Barinorte, S.A. de C.V. Valle de Allende 2,100
Barinorte, S.A. de C.V. Julimes 2,400
Coahuila
Walter Peñarrieta (La Navidad Project) Múzquiz Explored but not
producing
Sonora
Minera La Valenciana, S.A. de C.V. La Colorada ND
Source: SE (2013). ND: no data available.
Nuevo León and Coahuila states – the main barite producers - have milling and transformation plants. Jalisco and Sonora states also have milling and classification plants (see Table 18).
Table 18. Barite processing plants in Mexico
Company Locality Capacity
(t/month)
Nuevo León
Baramin, SA de CV Galeana 12,000
Minerales Industriales El Lechugal, S. de R.L. de C.V.
Apodaca 12,000
Minerales y Arcillas, S.A. de C.V. Galeana 5,100
Coahuila
Minerales y Arcillas, S.A. de C.V. Ramos Arizpe 135,000
Barita de Santa Rosa, S.A. de C.V: Múzquiz 21,000

71
Table 18. Barite processing plants in Mexico
Company Locality Capacity
(t/month)
Jalisco
Técnica Mineral, S.A.* Tlaquepaque ND
Sonora
Minas de Barita, S.de R.L. de C.V. Mazatlán 18,000
Source: SE (2011). * Produce other minerals besides barite. ND: no data available.
International barite market
On the international barite market, the world's largest producer is China. In the list of the USGS (2014), Mexico was in eighth place in production in 2013.
Table 19. World barite production (thousands of tonnes per year)
Country 2011 2012 2013
China 4,000 4,200 3,800
India 1,100 1,700 1,500
Morocco 650 1,000 850
USA 640 666 660
Iran 200 330 330
Turkey 250 260 260
Kazakhstan 200 250 250
Mexico 154 140 125
Vietnam 85 85 90
Russia 60 63 65
Germany 50 55 55
Pakistan 50 52 50

72
Table 19. World barite production (thousands of tonnes per year)
Country 2011 2012 2013
Other countries 300 250 300
World production 8,370 9,200 8,500
Source: USGS (2014).
The barite reserves of the United States are estimated at 150 million tonnes, in addition another 150 million tonnes are unproven in that country, while worldwide there are 740 million tonnes of proven barite.
The average price per tonne of barite in 2013 was US$115. Although from 2009 to 2010 the price declined slightly, since 2011 the growth rate has been positive, with the biggest change in 2011-2012 when the average price per ton increased 30.2%.
Figure 24. Price of barite in the United States
Source: USGS (2014).
In Mexico, prices are independent and different from the United States ranging between US$70 and US$80 per tonne from mine to mill, and milling costs approximately US$30 per tonne.
73
6.1.3. Rock minerals
Rock minerals require hardly any processing. Their use is almost exclusively for the construction industry. They are regularly found in the form of blocks, tiles or fragments of different sizes. Rock minerals are classified into three types:
• Natural: Located in deposits, quarries and/or natural gravel pits. For use it is only necessary to select, refine and sort them by size.
• Artificial: Located in rock masses. To extract them blasting procedures with explosives are used; they are then cleaned, crushed and classified for use.
• Industrial: Minerals that have gone through various manufacturing processes, including waste products, charred materials from demolitions, or some that have already been manufactured and improved.
These minerals can also be classified by composition: with base of lime, silica and alumina.
Rock minerals, like all rocks or products from their decomposition which can only be used for manufacture of building materials, are excepted from the Mining Law as concessionables, except when they require underground work for extraction.
As a non-concessionable mineral, they are exempt from payment of mining rights, and the provisions of the Mining Law, although their regulation is the competence of the states. The minerals are the property of the landowner provided their extraction is by open cut or quarry (open pit system).
Production of rock minerals is widely distributed throughout the country, and is normally located near the centers of urban development and expansion of the road network, because of its use in construction. The minerals are also used in the cement industry and in production of silica for polishing and cleaning, besides being used in coatings and finishes.
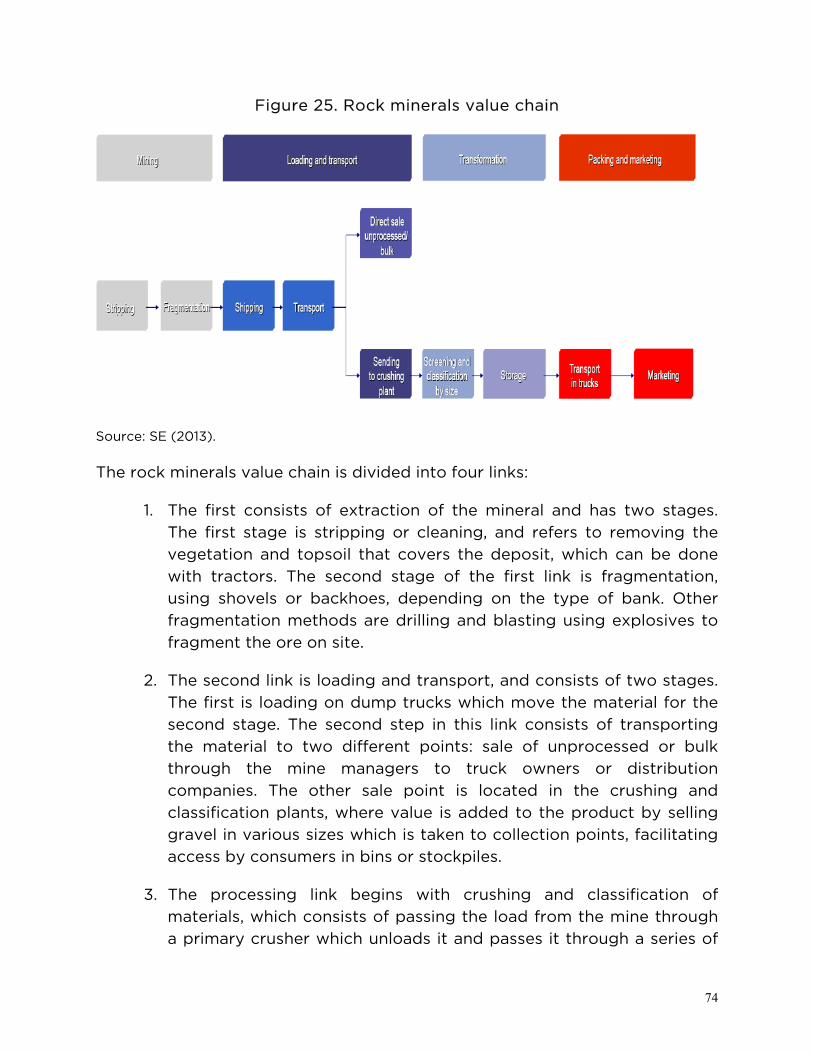
74
Figure 25. Rock minerals value chain
Source: SE (2013).
The rock minerals value chain is divided into four links:
1. The first consists of extraction of the mineral and has two stages. The first stage is stripping or cleaning, and refers to removing the vegetation and topsoil that covers the deposit, which can be done with tractors. The second stage of the first link is fragmentation, using shovels or backhoes, depending on the type of bank. Other fragmentation methods are drilling and blasting using explosives to fragment the ore on site.
2. The second link is loading and transport, and consists of two stages. The first is loading on dump trucks which move the material for the second stage. The second step in this link consists of transporting the material to two different points: sale of unprocessed or bulk through the mine managers to truck owners or distribution companies. The other sale point is located in the crushing and classification plants, where value is added to the product by selling gravel in various sizes which is taken to collection points, facilitating access by consumers in bins or stockpiles.
3. The processing link begins with crushing and classification of materials, which consists of passing the load from the mine through a primary crusher which unloads it and passes it through a series of
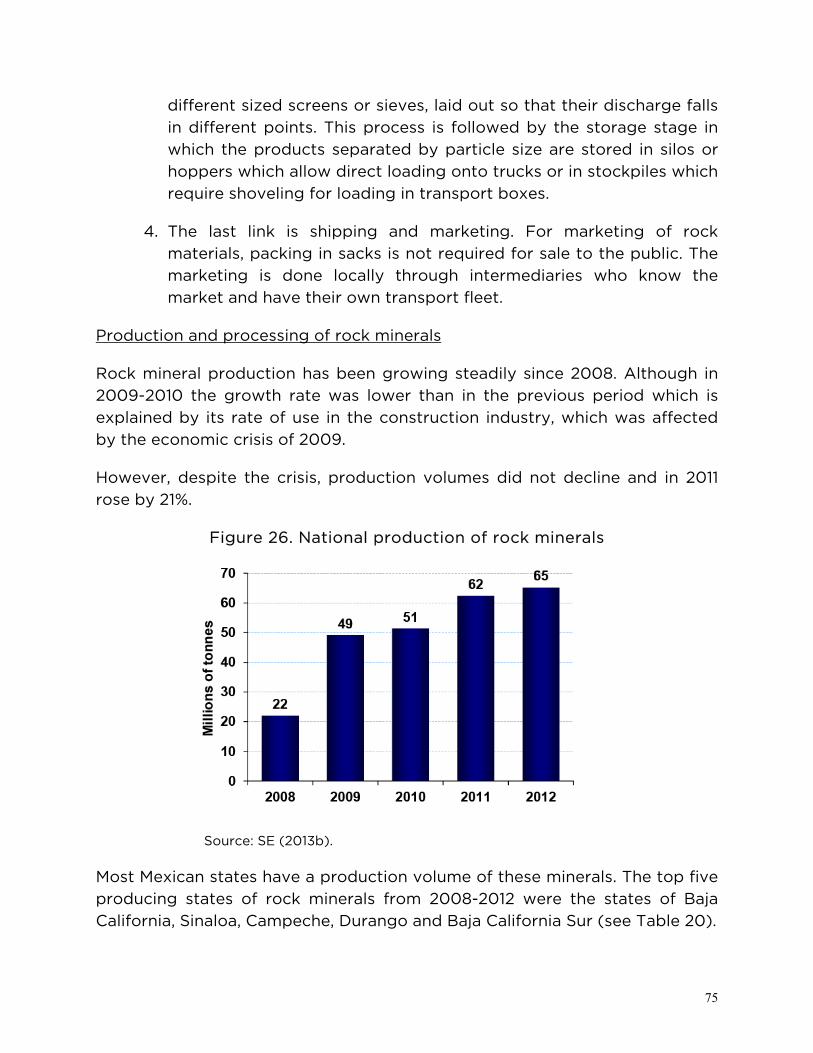
75
different sized screens or sieves, laid out so that their discharge falls in different points. This process is followed by the storage stage in which the products separated by particle size are stored in silos or hoppers which allow direct loading onto trucks or in stockpiles which require shoveling for loading in transport boxes.
4. The last link is shipping and marketing. For marketing of rock materials, packing in sacks is not required for sale to the public. The marketing is done locally through intermediaries who know the market and have their own transport fleet.
Production and processing of rock minerals
Rock mineral production has been growing steadily since 2008. Although in 2009-2010 the growth rate was lower than in the previous period which is explained by its rate of use in the construction industry, which was affected by the economic crisis of 2009.
However, despite the crisis, production volumes did not decline and in 2011 rose by 21%.
Figure 26. National production of rock minerals
Source: SE (2013b).
Most Mexican states have a production volume of these minerals. The top five producing states of rock minerals from 2008-2012 were the states of Baja California, Sinaloa, Campeche, Durango and Baja California Sur (see Table 20).
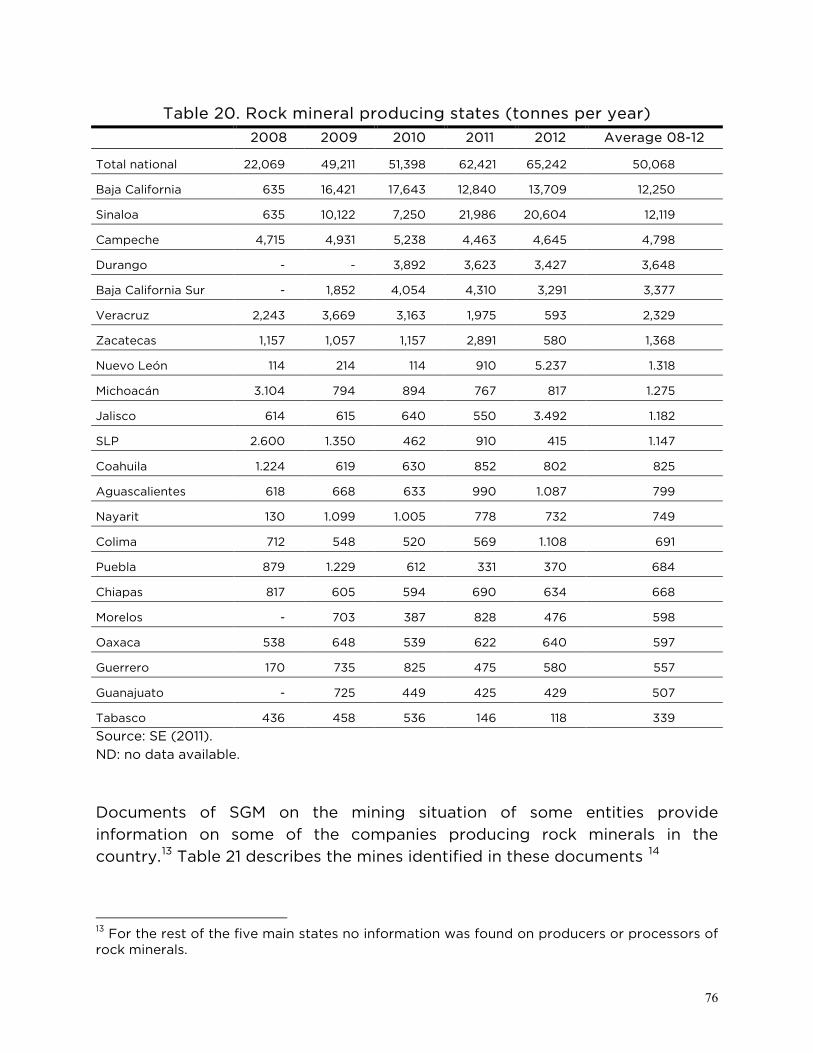
76
Table 20. Rock mineral producing states (tonnes per year) 2008 2009 2010 2011 2012 Average 08-12
Total national 22,069 49,211 51,398 62,421 65,242 50,068
Baja California 635 16,421 17,643 12,840 13,709 12,250
Sinaloa 635 10,122 7,250 21,986 20,604 12,119
Campeche 4,715 4,931 5,238 4,463 4,645 4,798
Durango - - 3,892 3,623 3,427 3,648
Baja California Sur - 1,852 4,054 4,310 3,291 3,377
Veracruz 2,243 3,669 3,163 1,975 593 2,329
Zacatecas 1,157 1,057 1,157 2,891 580 1,368
Nuevo León 114 214 114 910 5.237 1.318
Michoacán 3.104 794 894 767 817 1.275
Jalisco 614 615 640 550 3.492 1.182
SLP 2.600 1.350 462 910 415 1.147
Coahuila 1.224 619 630 852 802 825
Aguascalientes 618 668 633 990 1.087 799
Nayarit 130 1.099 1.005 778 732 749
Colima 712 548 520 569 1.108 691
Puebla 879 1.229 612 331 370 684
Chiapas 817 605 594 690 634 668
Morelos - 703 387 828 476 598
Oaxaca 538 648 539 622 640 597
Guerrero 170 735 825 475 580 557
Guanajuato - 725 449 425 429 507
Tabasco 436 458 536 146 118 339 Source: SE (2011). ND: no data available.
Documents of SGM on the mining situation of some entities provide information on some of the companies producing rock minerals in the country.13 Table 21 describes the mines identified in these documents 14
13 For the rest of the five main states no information was found on producers or processors of rock minerals.
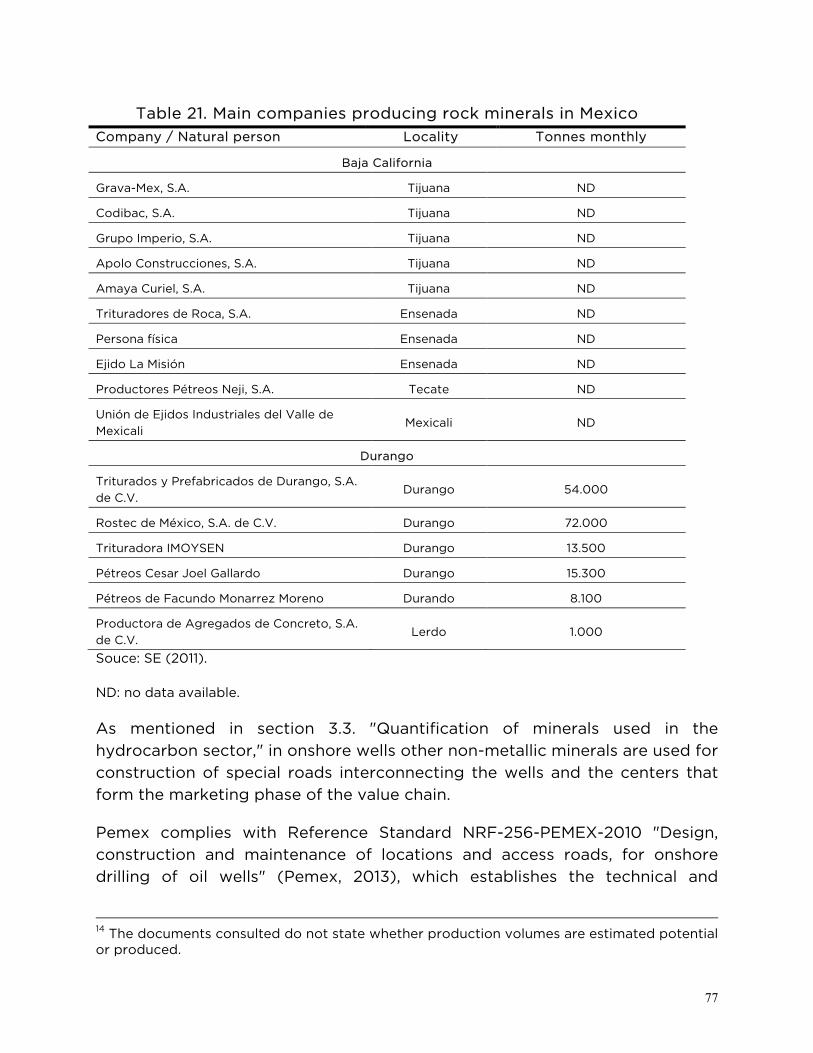
77
Table 21. Main companies producing rock minerals in Mexico Company / Natural person Locality Tonnes monthly
Baja California
Grava-Mex, S.A. Tijuana ND
Codibac, S.A. Tijuana ND
Grupo Imperio, S.A. Tijuana ND
Apolo Construcciones, S.A. Tijuana ND
Amaya Curiel, S.A. Tijuana ND
Trituradores de Roca, S.A. Ensenada ND
Persona física Ensenada ND
Ejido La Misión Ensenada ND
Productores Pétreos Neji, S.A. Tecate ND
Unión de Ejidos Industriales del Valle de Mexicali
Mexicali ND
Durango
Triturados y Prefabricados de Durango, S.A. de C.V.
Durango 54.000
Rostec de México, S.A. de C.V. Durango 72.000
Trituradora IMOYSEN Durango 13.500
Pétreos Cesar Joel Gallardo Durango 15.300
Pétreos de Facundo Monarrez Moreno Durando 8.100
Productora de Agregados de Concreto, S.A. de C.V.
Lerdo 1.000
Souce: SE (2011).
ND: no data available.
As mentioned in section 3.3. "Quantification of minerals used in the hydrocarbon sector," in onshore wells other non-metallic minerals are used for construction of special roads interconnecting the wells and the centers that form the marketing phase of the value chain.
Pemex complies with Reference Standard NRF-256-PEMEX-2010 "Design, construction and maintenance of locations and access roads, for onshore drilling of oil wells" (Pemex, 2013), which establishes the technical and
14 The documents consulted do not state whether production volumes are estimated potential or produced.
78
documentary requirements for contracting the services of design, construction and maintenance of locations and their access roads.
The standard is based on the idea that drilling and repair of oil wells are high risk activities due to the energy levels they generate and to the depths of excavation, types of fluids and formation or reservoir pressures, so it is important to have correct design, construction and maintenance of roads.
According to the Reference Standard, when excavations have to be made for road construction they must be filled with gravel and rock minerals, whose thickness is defined in the document.
There is also evidence that in road construction, construction materials of rock origin are used, such as sand, clay and coating gravel, extracted from banks near the construction sites with legal operating permits (Pemex, n/d).
6.2. Well drilling
Well drilling is the second link in the upstream phase of the hydrocarbon value chain. Drilling techniques are used to survey and explore sedimentary strata at great depths below the continental shelves. This link is of great interest for this study for two reasons. First, the greatest use of minerals in the hydrocarbon chain occurs in the drilling muds. Second, drilling oil and gas wells is an activity classified as mining-related services in NAICS so it is included in the expanded mining industry.
Hydrocarbon production can occur in near-surface spaces and in shallow depths on- and offshore. Oil production can be by liquid or gaseous extraction procedures.
Due to the decline of production of onshore oil fields, oil exploration is becoming more intensive in hard-to-reach areas such as deep and ultra-deep waters. This creates serious technical and technological challenges for development.
There are now technologies for hydrocarbon production to develop wells located on offshore platforms in depths of hundreds of meters. To facilitate removal of the rock drilled in these wells, mud is circulated constantly through the drill pipe and through a system of nozzles in the drill bit itself. With this technique, wells can be drilled to a depth of 6,400 meters from sea level.
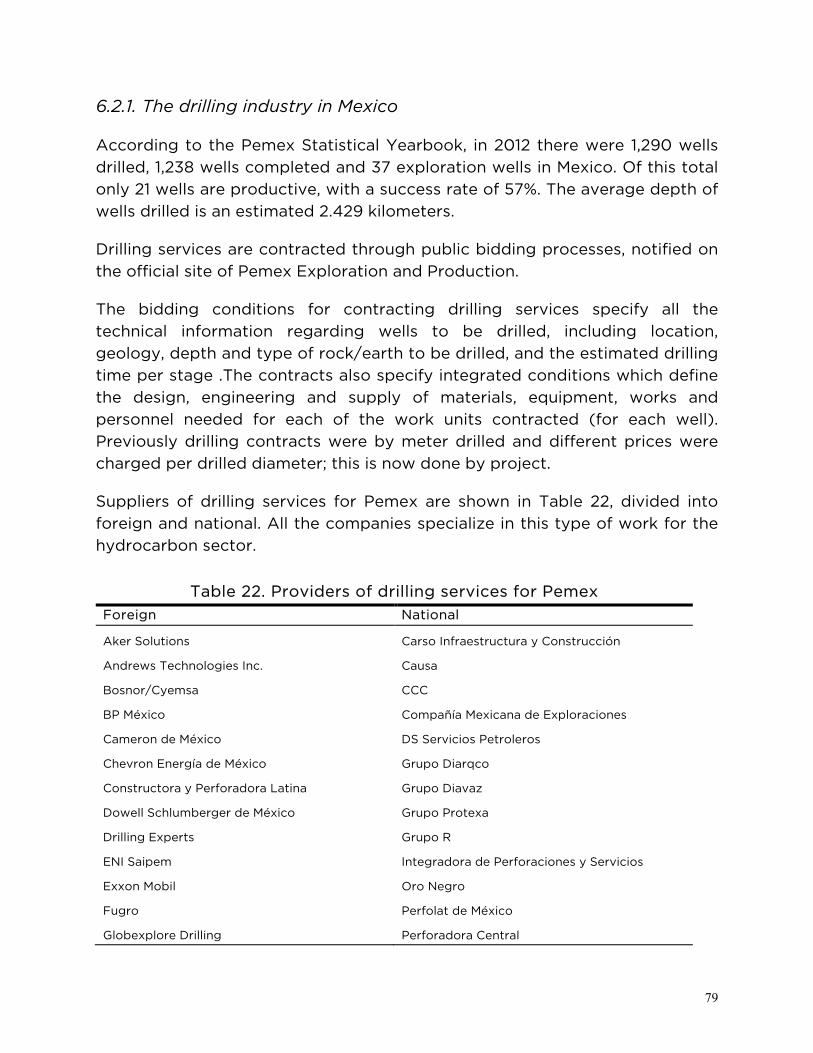
79
6.2.1. The drilling industry in Mexico
According to the Pemex Statistical Yearbook, in 2012 there were 1,290 wells drilled, 1,238 wells completed and 37 exploration wells in Mexico. Of this total only 21 wells are productive, with a success rate of 57%. The average depth of wells drilled is an estimated 2.429 kilometers.
Drilling services are contracted through public bidding processes, notified on the official site of Pemex Exploration and Production.
The bidding conditions for contracting drilling services specify all the technical information regarding wells to be drilled, including location, geology, depth and type of rock/earth to be drilled, and the estimated drilling time per stage .The contracts also specify integrated conditions which define the design, engineering and supply of materials, equipment, works and personnel needed for each of the work units contracted (for each well). Previously drilling contracts were by meter drilled and different prices were charged per drilled diameter; this is now done by project.
Suppliers of drilling services for Pemex are shown in Table 22, divided into foreign and national. All the companies specialize in this type of work for the hydrocarbon sector.
Table 22. Providers of drilling services for Pemex Foreign National
Aker Solutions
Andrews Technologies Inc.
Bosnor/Cyemsa
BP México
Cameron de México
Chevron Energía de México
Constructora y Perforadora Latina
Dowell Schlumberger de México
Drilling Experts
ENI Saipem
Exxon Mobil
Fugro
Globexplore Drilling
Carso Infraestructura y Construcción
Causa
CCC
Compañía Mexicana de Exploraciones
DS Servicios Petroleros
Grupo Diarqco
Grupo Diavaz
Grupo Protexa
Grupo R
Integradora de Perforaciones y Servicios
Oro Negro
Perfolat de México
Perforadora Central
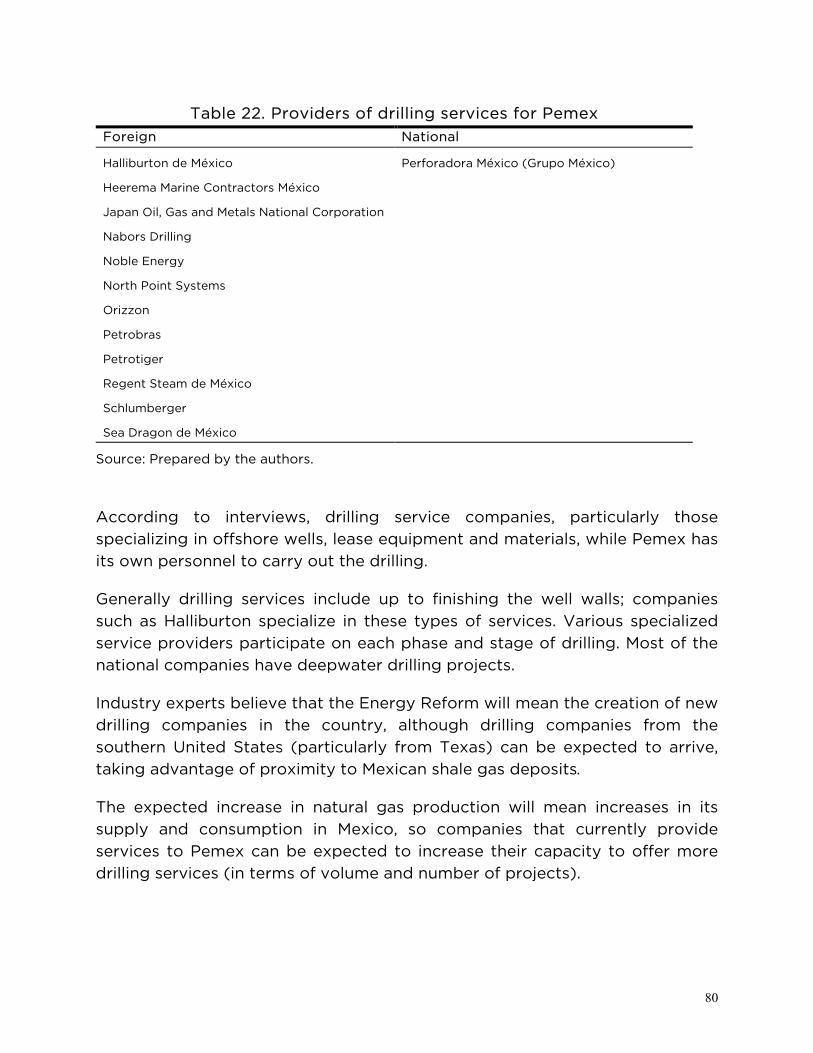
80
Table 22. Providers of drilling services for Pemex Foreign National
Halliburton de México
Heerema Marine Contractors México
Japan Oil, Gas and Metals National Corporation
Nabors Drilling
Noble Energy
North Point Systems
Orizzon
Petrobras
Petrotiger
Regent Steam de México
Schlumberger
Sea Dragon de México
Perforadora México (Grupo México)
Source: Prepared by the authors.
According to interviews, drilling service companies, particularly those specializing in offshore wells, lease equipment and materials, while Pemex has its own personnel to carry out the drilling.
Generally drilling services include up to finishing the well walls; companies such as Halliburton specialize in these types of services. Various specialized service providers participate on each phase and stage of drilling. Most of the national companies have deepwater drilling projects.
Industry experts believe that the Energy Reform will mean the creation of new drilling companies in the country, although drilling companies from the southern United States (particularly from Texas) can be expected to arrive, taking advantage of proximity to Mexican shale gas deposits.
The expected increase in natural gas production will mean increases in its supply and consumption in Mexico, so companies that currently provide services to Pemex can be expected to increase their capacity to offer more drilling services (in terms of volume and number of projects).
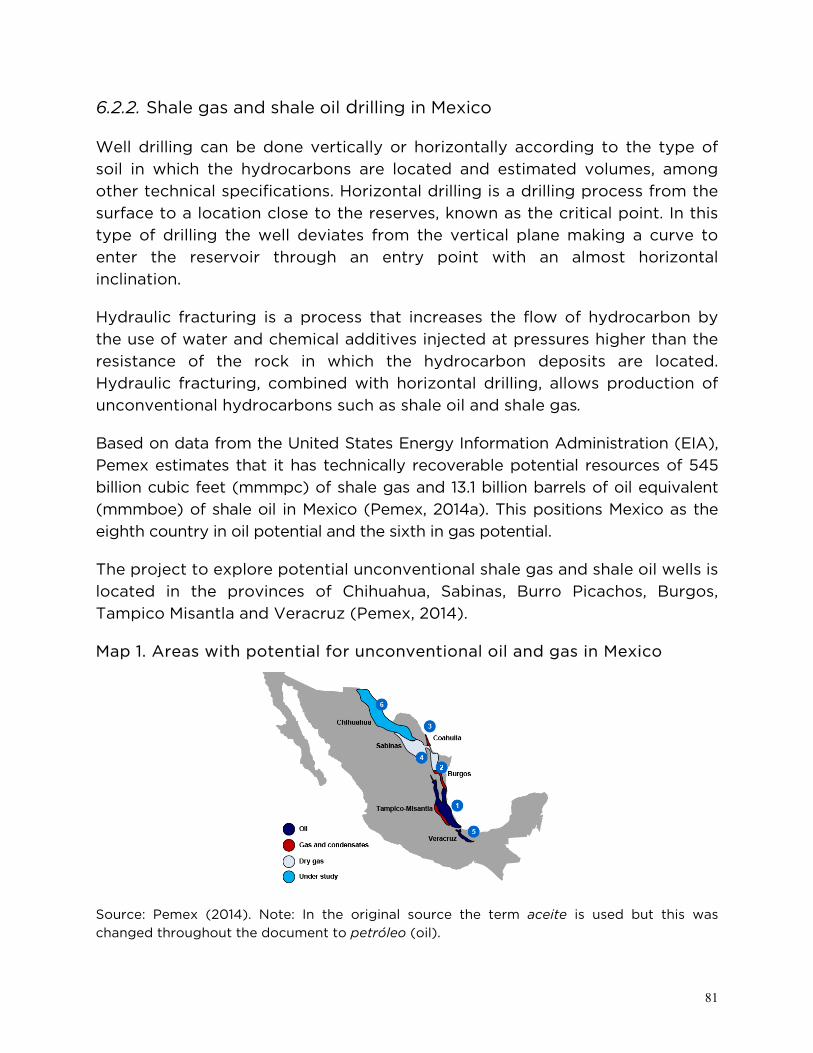
81
6.2.2. Shale gas and shale oil drilling in Mexico
Well drilling can be done vertically or horizontally according to the type of soil in which the hydrocarbons are located and estimated volumes, among other technical specifications. Horizontal drilling is a drilling process from the surface to a location close to the reserves, known as the critical point. In this type of drilling the well deviates from the vertical plane making a curve to enter the reservoir through an entry point with an almost horizontal inclination.
Hydraulic fracturing is a process that increases the flow of hydrocarbon by the use of water and chemical additives injected at pressures higher than the resistance of the rock in which the hydrocarbon deposits are located. Hydraulic fracturing, combined with horizontal drilling, allows production of unconventional hydrocarbons such as shale oil and shale gas.
Based on data from the United States Energy Information Administration (EIA), Pemex estimates that it has technically recoverable potential resources of 545 billion cubic feet (mmmpc) of shale gas and 13.1 billion barrels of oil equivalent (mmmboe) of shale oil in Mexico (Pemex, 2014a). This positions Mexico as the eighth country in oil potential and the sixth in gas potential.
The project to explore potential unconventional shale gas and shale oil wells is located in the provinces of Chihuahua, Sabinas, Burro Picachos, Burgos, Tampico Misantla and Veracruz (Pemex, 2014).
Map 1. Areas with potential for unconventional oil and gas in Mexico
Source: Pemex (2014). Note: In the original source the term aceite is used but this was changed throughout the document to petróleo (oil).
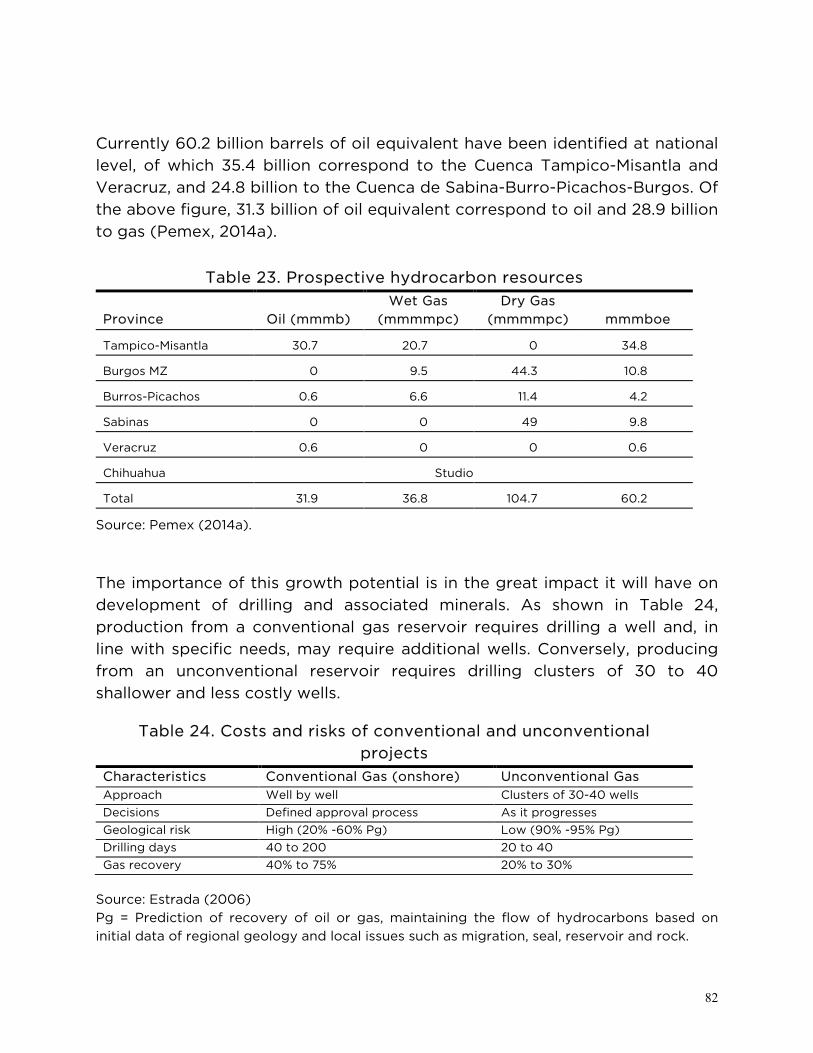
82
Currently 60.2 billion barrels of oil equivalent have been identified at national level, of which 35.4 billion correspond to the Cuenca Tampico-Misantla and Veracruz, and 24.8 billion to the Cuenca de Sabina-Burro-Picachos-Burgos. Of the above figure, 31.3 billion of oil equivalent correspond to oil and 28.9 billion to gas (Pemex, 2014a).
Table 23. Prospective hydrocarbon resources
Province Oil (mmmb) Wet Gas
(mmmmpc) Dry Gas
(mmmmpc) mmmboe
Tampico-Misantla 30.7 20.7 0 34.8
Burgos MZ 0 9.5 44.3 10.8
Burros-Picachos 0.6 6.6 11.4 4.2
Sabinas 0 0 49 9.8
Veracruz 0.6 0 0 0.6
Chihuahua Studio
Total 31.9 36.8 104.7 60.2
Source: Pemex (2014a).
The importance of this growth potential is in the great impact it will have on development of drilling and associated minerals. As shown in Table 24, production from a conventional gas reservoir requires drilling a well and, in line with specific needs, may require additional wells. Conversely, producing from an unconventional reservoir requires drilling clusters of 30 to 40 shallower and less costly wells.
Table 24. Costs and risks of conventional and unconventional projects
Characteristics Conventional Gas (onshore) Unconventional Gas Approach Well by well Clusters of 30-40 wells Decisions Defined approval process As it progresses Geological risk High (20% -60% Pg) Low (90% -95% Pg) Drilling days 40 to 200 20 to 40 Gas recovery 40% to 75% 20% to 30%
Source: Estrada (2006) Pg = Prediction of recovery of oil or gas, maintaining the flow of hydrocarbons based on initial data of regional geology and local issues such as migration, seal, reservoir and rock.

83
Given proximity and geological similarity, we can use as reference the experience of developing unconventional reservoirs in the United States (Box 3).
Box 3. Shale gas production in the United States
In the United States shale gas extraction has gone through a boom in the Marcellus region. In many cases, the extraction areas identified are on private land owned by the residents of the region who lease their land to energy and gas companies. Generally the same companies contact the landowners to offer leases that allow them to extract the natural gas identified there.
The gas companies need a sufficiently large expanse of land to undertake their work, and the land must be leased before the start of the work (Hefley et al.(2011). The land on which production usually takes place has an area of 2.6 million m2 (642 acres). Permits are usually granted for a certain number of years, usually five, with option to automatic prerogatives (Estrada, 2013).
The right to work in the field is negotiated with the owners and it is common for them to organize neighborhood associations for information and advice, as well as concentrating their forces in negotiations with the gas companies on contracts (Hefley et al.(2011). The landowners receive a percentage of the natural gas produced before expenses and taxes. Royalties are calculated on the average annual price of gas at the wellhead, and the percentages vary from 12.5% and 18%.
In some states, companies must also obtain a permit from the Environmental Protection Department and pay a bond for water supply, drilling standards, closing the well once abandoned and restoration of the terrain. These bonds cost US$2,500.
Companies must also pay for building of roads to transport people and supplies, land leveling and debris removal, construction of lined ponds to retain fracking fluids, wastewater management, building drilling rig and planting, and maintenance of the surrounding area to prevent erosion. The approximate cost of site preparation totals US$400,000. The cost of permits, bond and site preparation may add up to US$450,000 (Estrada, 2013).
84
7. Conclusion: Required investment in mining products and services
Prospective analyses present an optimistic outlook for the growth of hydrocarbon production in Mexico. By analyzing the value chain, we can quantify the impact of this growth on other sectors of the economy. This analysis shows that demand for mining products and services is heavily concentrated in the exploration and drilling stage, so the main driver of demand will be the number of wells drilled.
In the prospective section, the ENE scenario estimates that 1,753 wells will be drilled annually. This projection may seem ambitious considering that in its 75 year history Pemex has drilled 28,686 wells (4,359 exploratory and 24,327 development) (Estrada, 2013).
However, two factors suggest that this may be a conservative projection. First, the data relates to the period before the Energy Reform, so the SENER estimate does not consider the growth of private investment expected to result from the reform. Second, the ENE scenario concentrates mainly on conventional wells, and does not consider shale wells. The latter require more drilling services (because they are located in clusters of 30-40) and more complex services (because of horizontal drilling).
To provide context for the potential impact of the latter factor, it is worth mentioning that according to the Texas Commission on Environmental Quality (TCEQ) in January 2013 41,232 wells operating in the state, along with 7,693 drilling permits not yet in use. Of these, 18,379 are located in the Barnett shale formation which began to be developed in 2000 (TCEQ, n/d).
For the estimates of demand and investment required presented below, the figure of 1,753 annual average will be used for the next 10 years. Next, the demand and investment required for the main products and services analyzed are calculated.
Barite consumption per borehole ranges between 175 and 1,750 tonnes, depending on the depth and type (shale gas, shallow or deep water). Considering a weighted average that concentrates production in onshore wells and in shallow water, we calculate an average of 300 tonnes of barite per well. This results in a demand of 525,000 tonnes per year which is 200% growth over apparent current consumption of 173,000 tonnes.
85
A typical barite mine deposit that can be mined by an SME produces between 12,000 and 14,000 tonnes per year. Considering the potential demand for 350,000 additional tonnes, this gives an estimate of a market for up to 27 additional small mines.
The investment required in a mine with these characteristics varies considerably, since, according to the experts interviewed, costs depend on the type of land, the area of the land and quality of the mineral, as well as location of the mines in relation to consumption centers. Based on these factors, investment for production can range from Mex$1.500 billion and $4.5 billion.15 The total investment needed to fill the gap in demand would be around Mex$50 million to Mex$70 million.
The most suitable deposits for production are found near areas with hydrocarbon potential. In this respect, the deposits of Nuevo León, Coahuila, Chihuahua, Puebla and Mexico State have the advantage, along with the basins of Sabinas Burgos, Tampico-Misantla and Veracruz. In the case of Nuevo León, work is already underway to revive eight mines that ceased to be profitable when the price of barite dropped drastically, but which have now become attractive again at current prices.
In the case of mines in border states, it is important to note that both barite producers and the promotion bodies in the industry constantly receive requests from US companies that require barite suppliers that can deliver 20,000 tonnes per month. This fact is important because there are alternative markets which reduces the risk of rapid expansion.
Other aspects of the chain which require investment in later links of the chain are mills and processes to increase specific weight to 4.2 g/cm3 which the drilling industry requires. According to interviews, the latter process requires investments of Mex$15 million, although this is only necessary when the barite has low specific weight.
In the case of bentonite, demand per well ranges from 45 tonnes to 250 tonnes, depending on the type of well. Assuming an average consumption of 150 tonnes per well, this results in demand of 263,000 tonnes annually. Current apparent national consumption is 980,000 tonnes. However, unlike barite, drilling muds represent a small percentage of national consumption.
15 These costs are for investment in machinery and capital, and assume that the concession already exists for production.
86
Based on an estimate of this percentage of 10% to 15% of total consumption, growth of the oil sector would mean an additional demand of 150,000 tonnes.
Bentonite mining is less costly than barite mining because, as a clay, it is usually produced by the open pit method and does not require sophisticated machinery. A small bentonite mine can produce about 20,000 tonnes per year, and requires less investment, around Mex$1 million to Mex$2 million, which means that the demand gap will require additional investments of Mex$10 million.
The price of US$65/t of bentonite makes proximity to the end market even more critical than in the case of barite. Much of this production could take place in Durango deposits which are currently untapped, or in Coahuila, Nuevo León or Veracruz.
With respect to drilling services, companies currently providing exploration and drilling services in the mining subsector might be expected to migrate to the hydrocarbon subsector, where they will need to specialize and learn the technology used in the industry.
For these companies, investment requirements will depend largely on the machinery they already have. However, there is a great need for training and technical assistance in the particular characteristics of hydrocarbon exploration and drilling, which have a much greater degree of complexity than conventional minerals.
7.1. Recommendations
The 2013 Energy Reform represents a fundamental change in the structure of the hydrocarbon sector. Its key implication is the opening of private investment to activities previously exclusively in the hands of the State.
This opening will lead to significant growth of the hydrocarbon sector in Mexico, estimated at 2.83 billion and 3.35 billion barrels in 2026. Large reserves of shale gas are also expected to be produced, which have not been worked. To achieve these increases in production, the government estimates investment of US$27.00 billion annually will be needed, of which US$12.00 billion annually relate to private investment. This growth has the potential to operate as driver of demand for other products and services, including those related to the mining sector.
87
An analysis of the hydrocarbon value chain shows that barite and bentonite are the main products that will experience growth in demand, since they are major components in preparation of drilling muds. With respect to services, demand for exploration and production will grow. Also, in certain cases, in the right conditions, it is possible that demand for gravel for building roads between wells and to processing and consumption centers could increase, which would have a positive impact on local economies.
In Mexico there is considerable potential for increasing barite and bentonite production. The country is the world’s eighth largest producer of barite. Currently production is geographically concentrated in Nuevo León, which supplies 82% of national production with three major production companies. However, there are untapped deposits in several states from Chiapas to Sonora. The feasibility of the deposits depends largely on their proximity to markets and the quality of the ore.
With respect to bentonite production, Mexico is the tenth largest producer worldwide. The main producing state is Durango, which mines 95% of the bentonite in Mexico. In this state three bentonite companies have high production volumes and are estimated to cover the state’s annual production. Also in at least three other states (Puebla, Veracruz and Colima), high production potential has been identified.
However, in the case of drilling services, it is unclear whether drilling and exploration companies will be able to develop the necessary capabilities to provide similar services in the hydrocarbon subsector. Expert opinion is reserved because they consider that the capabilities and technical requirements of the mining sector are different from those of the hydrocarbon subsector.
On the issue of local content, the commitment of the Energy Reform is to provide opportunities for development and growth to local small- and medium-sized enterprises. Therefore, it is possible to expect that increases in demand for minerals such as barite, bentonite and gravel will result in increases in the production of small- and medium-scale mining enterprises.
Despite potential demand, there are obstacles to developing these enterprises, such as lack of financing, lack of quantification of deposits, issues related to ownership and concession of minerals on public land, technical constraints, poor logistics and high transport costs, as well as limited
88
experience and lack of skills required for exploitation of human capital. Moreover, there are significant gaps in information on the quantity and quality of potential mines in Mexico, since current studies on their potential are scarce and the scant information that can be collected is contradictory and difficult to corroborate.
In this respect, prospective studies on quantification of minerals, especially barite and bentonite, have detected an important area of opportunity for private investment. These studies are useful not only for improving the public information available, but also for attracting investments in their production and for accurate estimates of the supply of minerals available for the hydrocarbon industry.
To create opportunities for growth, appropriate and special instruments need to be designed for small- and medium-scale mining, which facilitate access to financing and their integration as suppliers to the value chains of the hydrocarbon subsector.
89
Bibliography
Bacon, R. W., S. Tordo and Y. Anouti. (2013). Defining Local Content. Local Content Policies in the Oil and Gas Sector. Washington, D.C.: World Bank.
Baker & McKenzie. 2012. Latin America Oil & Gas Handbook. Washington, D.C.: Baker & McKenzie.
Belderbos, R. A and L. Sleuwaegen. 1997. “Local Content Requirements and Vertical Market Structure.” European Journal of Political Economy, Vol. 13 (1997):107-119.
Campodónico, H. 2004. Reformas e inversión en la industria de hidrocarburos de América Latina. Series “Recursos naturales e infraestructura” of ECLAC. Santiago de Chile: ECLAC.
Cárdenas Gracia, J. 2009. La disputa por el petróleo en México. Breve historia de los hidrocarburos. En defensa del petróleo. Series Doctrina Jurídica, Núm. 522, pp.35. Mexico, DF: Instituto de Investigaciones Jurídicas UNAM.
CEC-ITAM (Centro de Estudios de Competitividad). 2004. El sector minero en México: Diagnóstico, Prospectiva y Estrategia. México, DF: CEC-ITAM.
--------. 2009. Evaluación de Diseño del Servicio Geológico Mexicano. Mexico, DF: CEC-ITAM.
Corporación Mexicana de Investigación en Materiales, S.A. de C.V. 2013. Fracturación de pozos para extracción de gas. Mexico, DF: Corporación Mexicana de Investigación en Materiales.
De la Fuente, R. 2013). Mexico Energy Reform: Yes, It’s a Big Deal. Mexico, DF: UBS.
Esteves, A. M., B. Coyne y A. Moreno. 2013. Iniciativas sobre contenido local: mejorar los beneficios subnacionales de los sectores petrolero, gasífero y minero. Nueva York: Revenue Watch Institute.

90
Estrada, J. H. 2006. El modelo petrolero noruego y sus beneficios. México, DF: Analítica Energética, S.C.
Estrada, J. H. 2013. Desarrollo de gas lutita (shale gas) y su impacto en el mercado energético de México: Reflexiones para Centroamérica. Santiago de Chile: ECLAC.
De la Fuente, R. 2013). Mexico Energy Reform: Yes, It’s a Big Deal. México, DF: UBS.
González, N. 2014. “Aumentará la producción de hidrocarburos. Ahora habrá competencia,” published in El Universal Friday July 11, 2014.
González-Sánchez, F. and A. Camprubí. 2010. “La pequeña minería en México.” Boletín de la Sociedad Geológica Mexicana, Vol. 62, Num. 1:101-108.
Hefley, W. E., S. M. Seydor et al. 2011. “The Economic Impact of the Value Chain of a Marcellus Shale Well.” Pittsburgh, PA: University of Pittsburgh, Pitt Business.
Hentschel, T., F. Hruschka and M. Priester. 2003. Artisanal and Small-Scale Mining. Challenges and Opportunities. London: IIED, World Business Council for Sustainable Development.
Heum, P. 2008. “Local Content Development. Experiences from Oil and Gas Activities in Norway.” Working document of SNF Num. 02/08. Bergen: Institute for Research in Economics and Business Administration.
Huerta, C. and F. Ruíz, F. 2012. “Petrobras: petróleo, finanzas públicas y desarrollo.” Revista Ola Financiera, Vol. 5, Num. 12.
INEGI (Instituto Nacional de Estadística y Geografía). 2011. Censos Económicos 2009. La industria minera ampliada. Mexico, DF: INEGI.
----------. 2013. La minería en México 2013. Mexico, DF: INEGI.
López Bárcenas, F., Eslava and M. M. Galicia. 2011. El mineral o la vida. La legislación minera en México, pp. 9-15 Mexico, DF: Centro de Orientación y Asesoría a Pueblos Indígenas.
91
Martínez, A. 2012. Política de proveedores del sector petrolero. Bogota: Fedesarrollo.
Pemex (Petróleos Mexicanos). 2009. Estrategia de Petróleos Mexicanos para el desarrollo de proveedores, contratistas y contenido nacional. Mexico, DF: Pemex.
----------. 2013. Comité de Normalización de Petróleos Mexicanos y Organismos Subsidiarios. Reference Standard NRF-038-PEMEX-2013. “Caminos de acceso a instalaciones industriales.” Mexico, DF: Pemex.
----------. 2014a. Petróleos Mexicanos. Informe anual 2013. Mexico, DF: Pemex.
----------. 2014b. Anuario Estadístico 2013. Mexico, DF: Pemex.
Pemex Exploración y Producción. n/d. Manifestación de Impacto Ambiental, modalidad particular del proyecto: “Acondicionamiento del camino y construcción de localización para la perforación direccional del pozo exploratorio Altamonti 1.” Mexico, DF: Pemex.
Pérez, A. 2012. Inversión extranjera sí, pero con contenido local: estrategias de desarrollo en Brasil (DT). Working document 7/2012. Madrid: Real Instituto Elcano, Cooperación Internacional y Desarrollo, Latin America.
Presidency of the Republic. 2013. DOF of December 20, 2013.. Decreto por el que se reforman y adicionan diversas disposiciones de la Constitución Política de los Estados Unidos Mexicanos, en materia de energía. México, DF: Presidency of the Republic.
Redo, H. and M. Macedo. 2009. “Local Content in Brazilian Oil Industry.” T&B Petroleum, Num. 28.
SE (Secretaría de Economía). 2011. Panorama minero del estado de Coahuila./ Panorama minero del estado de Nuevo León./ Panorama minero del estado de Durango./ Panorama minero del estado de Jalisco./ Panorama minero del estado de San Luis Potosí./ Panorama minero del estado de Tamaulipas./ Mexico, DF: SE.
----------. 2013. Perfil de mercado del hierro-acero./ Perfil de mercado de la sal./ Perfil de mercado del sílice./ Perfil de mercado de la fosforita./

92
Perfil de mercado de la bentonita./ Perfil de mercado de la barita. Mexico, DF: SE, Coordinación General de Minería, Dirección General de Desarrollo Minero.
---------. (2013b). Anuario Estadístico de la Minería Mexicana 2012. Mexico, DF: SE.
---------. 2013c. Panorama minero del estado de Michoacán./ Panorama minero del estado de Puebla./ Panorama minero del estado de Sonora. Mexico, DF: SE.
SENER (Secretaría de Energía). 2012a. Prospectiva de petróleo crudo y petrolíferos 2012-2026. Mexico, DF: SENER.
----------. 2012b. Prospectiva del mercado de gas natural 2012-2026. Mexico, DF: SENER.
----------. 2014. “El nuevo modelo energético de México.” Mexican Energy Summit, September 10, 2014. Mexico, DF: SENER.
USGS (United States Geological Survey). 2013. Mineral Commodity Summaries 2013. Washington, D.C.: USGS.
------------. 2014. Mineral Commodity Summaries 2014. Washington, D.C.: USGS.
Zapata, E. 2005. “Industria de los hidrocarburos. Cadena de servicios y cadena de valor. Impacto de la emergencia económica sobre la cadena de valor del gas natural” (presentation). Buenos Aires: Centro de Estudios de la Actividad Regulatoria Energética.
Zenteno Barrios, F. J. 1997. “La regulación de los hidrocarburos en México.” In: Regulación del sector energético. Series E: Varios, Num. 85. Mexico: Instituto de Investigaciones Jurídicas de la UNAM.
Websites and electronic resources
América Economía. 2013. “Petrolera Statoil gana en el primer trimester 58% menos tras recaudar 842M de euros.” Note of May 2. Consulted September 22, 2014 in: http://www.americaeconomia.com/negocios-
93
industrias/petrolera-statoil-gana-en-el-primer-trimestre-58-menos-tras-recaudar-842m-de-eur.
Appel, M. 2013. “Noruega: concesiones petroleras sí, pero reguladas.” Published August 20, 2013 in: http://www.proceso.com.mx/?p=350521.
World Bank. n/d. Artisanal and Small-Scale Mining. Washington, D.C.: World Bank. Consulted November 25, 2014, in: http://www.worldbank.org/en/topic/extractiveindustries/brief/artisanal-and-small-scale-mining.
BNAmericas (Brazil). n/d. Information consulted September 12, 2014 in: http://www.bnamericas.com/company-profile/es/Agencia_Nacional_do_Petroleo,_Gas_Natural_e_Biocombustiveis-ANP_,Brasil,.
CNN Mexico. n/d. “Las tres reformas que Peña Nieto quiere para 2013.” Consulted June 9, 2014, in: http://mexico.cnn.com/nacional/2013/01/03/reforma-energetica.
Ecapetrol. n/d. “Química de lodos.” Consulted June 27, 2014, in: https://www.academia.edu/4009475/2_1_._Quimica_de_Lodos.
Ecopetrol. n/d. “Contratación local 2006-2011.” Consulted September 10, 2014, in: http://www.Ecopetrol.com.co/contenido.aspx?catID=551&conID=47866.
EIA (U.S. Energy Information Administration). 2014a. International Energy Statistics. Crude Oil Including Lease Condensate. Material consulted September 25, 2014, in: http://www.eia.gov/cfapps/ipdbproject/iedindex3.cfm?tid=5&pid=57&aid=1&cid=regions&syid=2009&eyid=2013&unit=TBPD.
---------. 2014b. International Energy Statistics. Material consulted September 25, 2014, in: http://www.eia.gov/cfapps/ipdbproject/iedindex3.cfm?tid=5&pid=57&aid=1&cid=regions&syid=2009&eyid=2013&unit=TBPD y http://www.eia.gov/cfapps/ipdbproject/IEDIndex3.cfm?tid=5&pid=57&aid=6.

94
El Economista. 2014. “Producción de crudo brasileño llega a 2,3 millones de barriles diarios.” Published September 2, 2014, in: http://eleconomista.com.mx/industrias/2014/09/02/produccion-crudo-brasileno-llega-23-millones-barriles-diarios.
Energía del petróleo. n/d. Material consulted June 30, 2014, in: http://comunidad.eduambiental.org/file.php/1/curso/contenidos/docpdf/capitulo15.pdf.
Eures. 2013. “Working in the Oil and Gas Industry in Norway.” Consulted September 22, 2014, in: http://www.eures.dk/getattachment/JobSeeker/S%C3%A6rlige-job-og-brancher/Off-shore/Working-in-the-Norwegian-Oil-and-Gas-industry-in-Norway-2013.pdf.aspx.
Federal Government. 2013. Documento explicativo sobre la Reforma Energética 2013. Mexico, DF: Gobierno Federal. Consulted May 12, 2014, in: http://embamex.sre.gob.mx/suecia/images/reforma%20energetica.pdf.
Historia de la industria petrolera en la República Mexicana. Consulted June 6, 2014, http://www.industriapetroleramexicana.com/2012/03/historia-de-la-industria-petrolera-en-la-republica-mexicana/.
Línea del tiempo 1971-2008. Fuentes para la historia del petróleo en México. Consulted August 28, 2014, in: http://petroleo.colmex.mx/index.php/inicio/58
Lodos bentoníticos. Tratamiento de lodos bentoníticos in-situ. Consulted June 13, 2014, in: http://www.triopas.es/industria/soluciones/tratamiento-lodos-bentoniticos
Ministry of Finance. n/d. Glosario de términos. Mexico, DF: Ministry of Finance. Consulted June 9, 2014, in: http://www.apartados.hacienda.gob.mx/pipp/pidiregas/glosario.pdf.
Musgrove, S. Mineralls Used in the Petroleum Industry. Consulted June 26, 2014, in: http://academic.emporia.edu/abersusa/go336/musgrove/
95
OAS (Organization of American States). n/d. Tratado de Libre Comercio de América del Norte, Quinta Parte: Inversión, servicios y asuntos relacionados. Washington, D.C.: OAS. Consulted August 19, 2014, in: http://www.sice.oas.org/trade/nafta_s/cap11_1.asp.
Pemex 2014a. Structural organization charte of Pemex (actual). Fuentes para la historia del Petróleo en México, Consulted June 9, 2014, in: http://petroleo.colmex.mx/index.php/presentacion
Pemex 2014b. Organismos subsidiarios y filiales. Consulted June 9, 2014, in: http://www.pemex.com/organismos/Paginas/default.aspx#.U5Y5V3J5OVM
PetroStrategies, Inc. Oil and Gas Value Chains. n/d. Consulted August 1, 2014, in: http://www.petrostrategies.org/Learning_Center/oil_and_gas_value_chains.htm.
Official portal of the Embassy of Norway in Chile. n/d. 35 años de producción petrolera en Noruega. Santiago de Chile: Embassy of Norway. Consulted September 22, 2014, in: http://www.noruega.cl/ARKIV/Negocios/Energia/oilproduction/#.VCBl2ZR5OVN.
Presidency of the Republic. 2013. Iniciativas de leyes energéticas, Reforma Energética. Mexico, DF: Presidency of the Republic. Consulted May 30, 2014, in: http://presidencia.gob.mx/reformaenergetica/#!leyes-secundarias.
----------. 2014. Reforma Energética. Mexico, DF: Presidency of the Republic. Consulted May 30, 2014, in: http://presidencia.gob.mx/reformaenergetica/#!leyes-secundarias.
ProMéxico. n/d. “Minería. Inversión y Comercio.” Consulted June 10, 2014, in: http://www.promexico.gob.mx/es_ca/promexico/Mineria_EM.
SE (Ministry of Economy). Evolución del comercio internacional. Mexico, DF: SE. Presentation on line consulted September 19, 2014, in: http://www.siicex.gob.mx/portalSiicex/Pagina%20principal/EVOLUCION%20DEL%20COMERCIO%20EXTERIOR.pdf
96
SENER (Ministry of Energy). 2014a. Empresas productivas del Estado. Mexico, DF: SENER. Consulted September 30, 2014, in: http://www.energia.gob.mx/webSener/leyes_Secundarias/9214.html.
---------. 2014b. Estructura del sector. Mexico, DF: SENER. Consulted June 9, 2014, in: http://www.sener.gob.mx/portal/Default.aspx?id=2627.
TCEQ (Texas Commission on Environmental Quality). n/d. Material consulted December 11, 2014, in: http://www.tceq.state.tx.us/assets/public/implementation/barnett_shale/bsAnnualWellCount.pdf.
Triopas. n/d. Tratamiento de lodos bentoníticos in situ. Consulted June 13, 2014, in: http://www.triopas.es/industria/soluciones/tratamiento-lodos-bentoniticos.
U.S. Energy Information Administration. n/d. Norway Country Analysis Brief Overview. Consulted September 22, 2014, in: http://www.eia.gov/countries/country-data.cfm?fips=no.
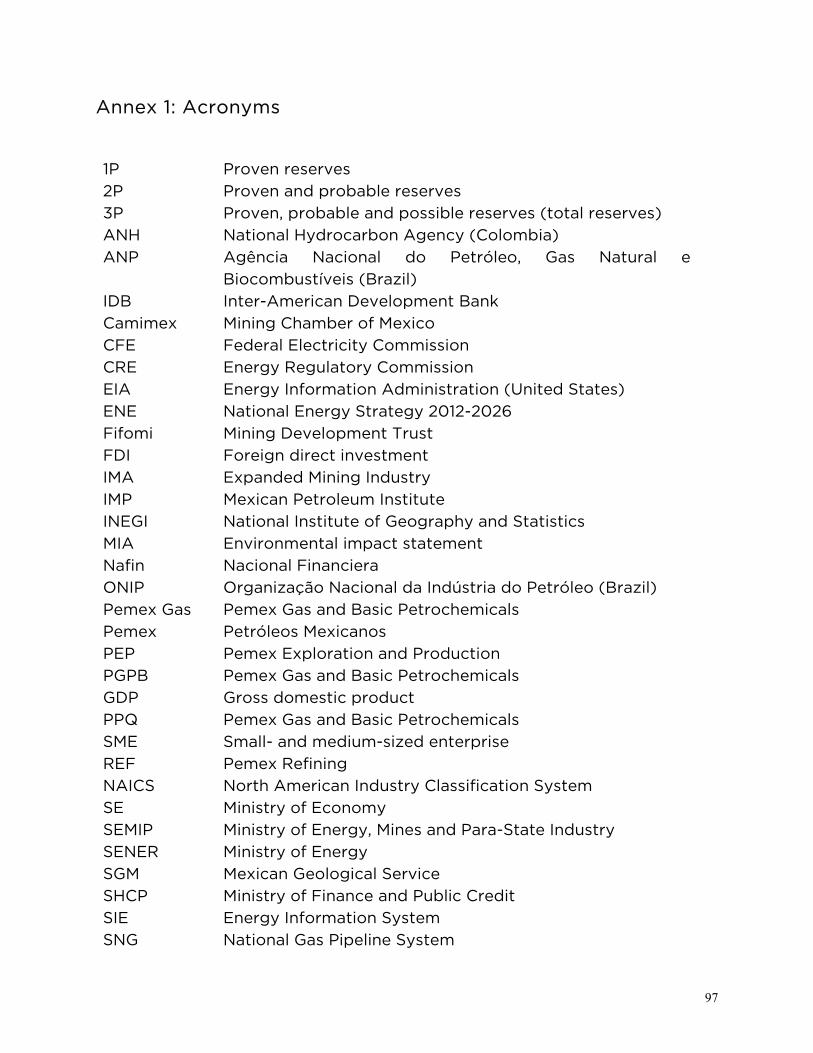
97
Annex 1: Acronyms
1P Proven reserves 2P Proven and probable reserves 3P Proven, probable and possible reserves (total reserves) ANH National Hydrocarbon Agency (Colombia) ANP Agência Nacional do Petróleo, Gas Natural e
Biocombustíveis (Brazil) IDB Inter-American Development Bank Camimex Mining Chamber of Mexico CFE Federal Electricity Commission CRE Energy Regulatory Commission EIA Energy Information Administration (United States) ENE National Energy Strategy 2012-2026 Fifomi Mining Development Trust FDI Foreign direct investment IMA Expanded Mining Industry IMP Mexican Petroleum Institute INEGI National Institute of Geography and Statistics MIA Environmental impact statement Nafin Nacional Financiera ONIP Organização Nacional da Indústria do Petróleo (Brazil) Pemex Gas Pemex Gas and Basic Petrochemicals Pemex Petróleos Mexicanos PEP Pemex Exploration and Production PGPB Pemex Gas and Basic Petrochemicals GDP Gross domestic product PPQ Pemex Gas and Basic Petrochemicals SME Small- and medium-sized enterprise REF Pemex Refining NAICS North American Industry Classification System SE Ministry of Economy SEMIP Ministry of Energy, Mines and Para-State Industry SENER Ministry of Energy SGM Mexican Geological Service SHCP Ministry of Finance and Public Credit SIE Energy Information System SNG National Gas Pipeline System
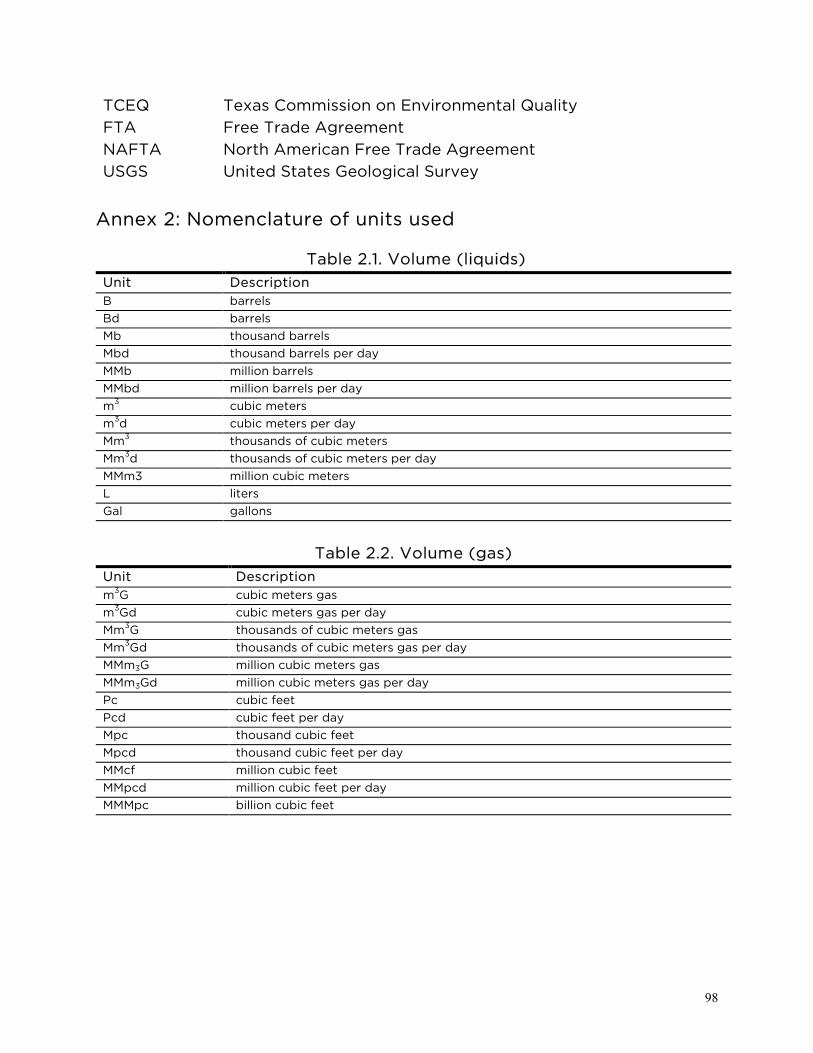
98
TCEQ Texas Commission on Environmental Quality FTA Free Trade Agreement NAFTA North American Free Trade Agreement USGS United States Geological Survey
Annex 2: Nomenclature of units used
Table 2.1. Volume (liquids) Unit Description B barrels Bd barrels Mb thousand barrels Mbd thousand barrels per day MMb million barrels MMbd million barrels per day m3 cubic meters m3d cubic meters per day Mm3 thousands of cubic meters Mm3d thousands of cubic meters per day MMm3 million cubic meters L liters Gal gallons
Table 2.2. Volume (gas)
Unit Description m3G cubic meters gas m3Gd cubic meters gas per day Mm3G thousands of cubic meters gas Mm3Gd thousands of cubic meters gas per day MMm3G million cubic meters gas MMm3Gd million cubic meters gas per day Pc cubic feet Pcd cubic feet per day Mpc thousand cubic feet Mpcd thousand cubic feet per day MMcf million cubic feet MMpcd million cubic feet per day MMMpc billion cubic feet