EnErgy Policy ToolkiT - International Energy Agency · EnErgy Policy ToolkiT for EnErgy EfficiEncy...
36
ENERGY POLICY TOOLKIT FOR ENERGY EFFICIENCY IN APPLIANCES, LIGHTING, AND EQUIPMENT PREPARED BY L CTU ow Carbon Transition Unit
Transcript of EnErgy Policy ToolkiT - International Energy Agency · EnErgy Policy ToolkiT for EnErgy EfficiEncy...

EnErgy Policy ToolkiT for EnErgy EfficiEncy in AppliAnces, lighting, And equipment
prepAred byLCTUow Carbon Transition Unit

Introduction ....................................................................................................................................................................... 1
Appliance Energy Efficiency Standards & Labels (S&L) ........................................................................................ 4
Appliance Energy Efficiency Standards ..............................................................................................................4
Product Energy Efficiency Labels .........................................................................................................................5
Complementary Policies ........................................................................................................................................6
Designing and Implementing Successful S&L Policies ........................................................................................ 8
Assessing Capacity, Resources, and Leverage .................................................................................................8
Analyzing and Setting Standards .....................................................................................................................10
Designing, Implementing, and Communicating a Labeling Program ........................................................12
Designing and Establishing Financial Incentives.............................................................................................15
Developing Test Procedures, Testing Capacity, and Compliance ...............................................................17
Evaluating an Energy Efficiency S&L Program ...............................................................................................21
S&L Start to Finish: Tunisia S&L for Refrigerators ................................................................................................24
Key Points & Recommendations ...............................................................................................................................26
Resources and Tools for Policymakers and S&L Practitioners ..........................................................................27
List of Contributors .......................................................................................................................................................31
Acronyms & Abbreviations ..........................................................................................................................................32
EnErgy Policy ToolkiT for EnErgy EfficiEncy in AppliAnces, lighting, And equipment

Figures and Tables
FIguRES
Figure 1. The cost of electricity in the U.S. from various new sources in 2013 ..........................................1
Figure 2. PAMS analysis showing energy and cost savings from Ghana’s room air conditioner MEPS. ...................................................................................................2
Figure 3. Annual energy use and real price of new refrigerators in the U.S. ..............................................4
Figure 4. EU Energy Label increases market share of highest efficiency refrigerators .............................5
Figure 5. Benefits of standards and labels for product energy efficiency ...................................................6
Figure 6. Typically, incentives are implemented through upstream, midstream, or downstream programs. ..................................................................................................................15
Figure 7. Energy efficiency tiers and percentage of products eligible for 2012–2013 China subsidy ............................................................................................................16
Figure 8. Planning a MV&E Framework for mandatory and voluntary S&L programs............................19
Figure 9. Energy labels in China: Market distribution within energy efficiency tiers ...............................22
Figure 10. Key steps in creating procurement criteria ...................................................................................28
Figure 11. Compliance enhances S&L benefits and reduces risks ..............................................................29
Figure 12. Global S&L database use by economy ..........................................................................................30
TAbLES
Table 1. Benefits of appliance S&L .......................................................................................................................3
Table 2. Multilateral collaborations for appliance energy efficiency ............................................................9
Table 3. MV&E program cost distribution .........................................................................................................19

S&L Toolkit
1
Appliances, lighting, and equipment account for a major share of energy use globally—lighting alone comprises approximately
20% of total electricity use worldwide. This energy consumption drives up costs for governments and citizens, increases the need to invest in new energy infrastructure, and stresses our scarce resources, negatively impacting people and the environment.
Energy efficiency standards and labeling (S&L) policies for all of these products help to reduce energy consumption and lessen peak electricity demand, diminishing the need to build power plants and saving money for governments and consumers. Among other benefits, S&L policies help to cut air pollution, abate greenhouse gas emissions, and are among the most cost-effective forms of energy policy.
This toolkit is designed for practitioners, governmental and other energy experts, and policymakers who are interested in developing and improving appliance energy efficiency policies. Acknowledging that governments operate under constrained resources, it provides examples of policies that have been implemented successfully with minimal costs, and illustrates different
choices policymakers may consider. Finally, it demonstrates ways to leverage financial and intellectual resources.
The toolkit was prepared by CLASP in collaboration with the Danish Low Carbon Transition Unit (LCTU), based at the Danish Energy Agency under the Ministry for Climate, Energy and Building. It builds on the extensive work previously completed by CLASP on S&L policies, particularly its comprehensive S&L Guidebook, as well as the work of some of the world’s foremost experts on the various aspects of appliance energy efficiency. The toolkit is part of a series of energy policy toolkits prepared by the LCTU.
Appliance Energy Efficiency Policies Cost-Effectively Realize Benefits
Energy efficiency policies require a relatively small up-front investment and produce numerous economic, social, and environmental benefits. The cost of avoiding electricity use through energy efficiency is far less than the cost of having to supply it.
14
12
10
8
6
4
2
0
Ann
ualiz
ed C
ost
in 1
99
9 (c
ents
per
kW
h, 2
011
)
Gas
Com
bine
d C
ycle
Cle
an C
oal
Com
bust
ion
Turb
ine
Geo
ther
mal
Win
d
Sta
ndar
ds
& L
abel
s
Figure 1. The cost of electricity in the U.S. from various new sources in 20131
Introduction
S&L Toolkit
2
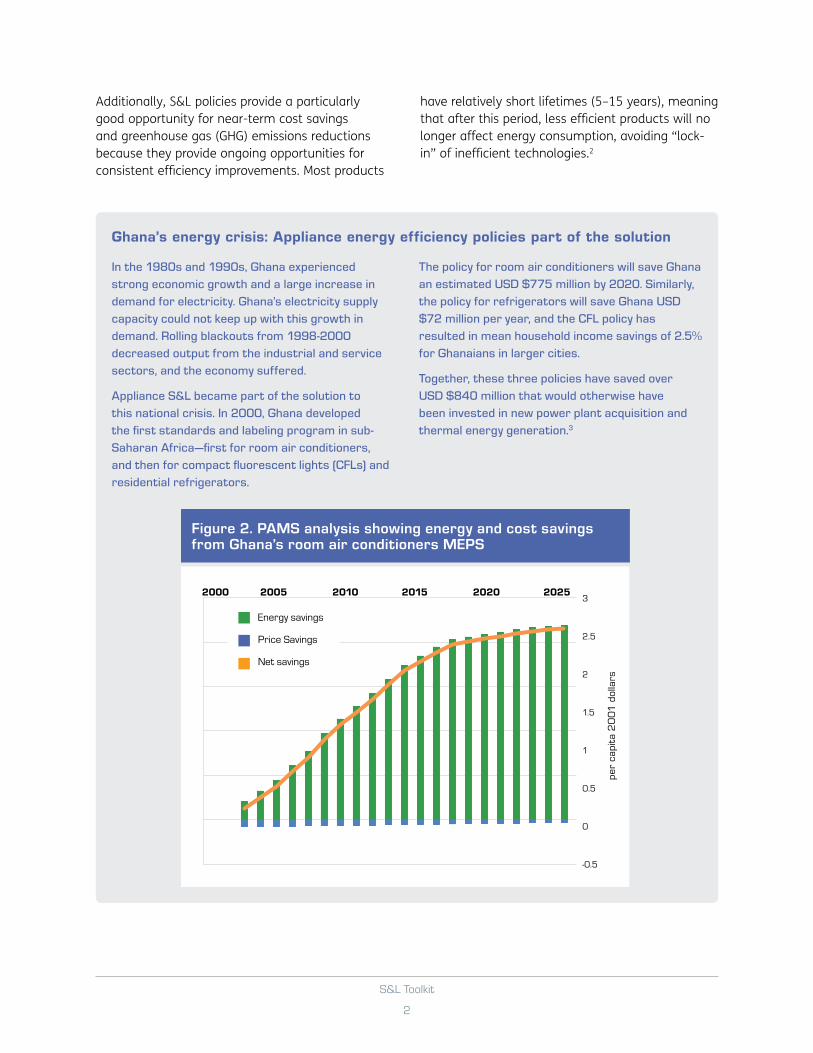
Ghana’s energy crisis: Appliance energy efficiency policies part of the solution
in the 1980s and 1990s, ghana experienced
strong economic growth and a large increase in
demand for electricity. ghana’s electricity supply
capacity could not keep up with this growth in
demand. rolling blackouts from 1998-2000
decreased output from the industrial and service
sectors, and the economy suffered.
Appliance s&l became part of the solution to
this national crisis. in 2000, ghana developed
the first standards and labeling program in sub-
saharan Africa—first for room air conditioners,
and then for compact fluorescent lights (cFls) and
residential refrigerators.
the policy for room air conditioners will save ghana
an estimated usd $775 million by 2020. similarly,
the policy for refrigerators will save ghana usd
$72 million per year, and the cFl policy has
resulted in mean household income savings of 2.5%
for ghanaians in larger cities.
together, these three policies have saved over
usd $840 million that would otherwise have
been invested in new power plant acquisition and
thermal energy generation.3
Additionally, S&L policies provide a particularly good opportunity for near-term cost savings and greenhouse gas (GHG) emissions reductions because they provide ongoing opportunities for consistent efficiency improvements. Most products
have relatively short lifetimes (5–15 years), meaning that after this period, less efficient products will no longer affect energy consumption, avoiding “lock-in” of inefficient technologies.2
Figure 2. PAMS analysis showing energy and cost savings from Ghana’s room air conditioners MEPS
3
2.5
2
1.5
1
0.5
0
-0.5
2000 2005 2010 2015 2020 2025
Energy savings
Price Savings
Net savings
per
capi
ta 2
00
1 d
olla
rs

S&L Toolkit
3
Table 1. Benefits of appliance S&L
benefits to the economy, people, and the envionment
Energy efficient products:
Reduce energy costs for consumers, businesses, and government;
Free up existing energy capacity and preclude the need to invest in new supply infrastructure;
Decrease government expenditures on energy subsidies;
Lessen peak load and black-outs;
Spur innovation towards further efficiency gains;
Increase energy independence and security of supply;
Improve air quality and health; and
Reduce greenhouse gas emissions and mitigate climate change.
Appliance energy efficiency policies can help to cost effectively meet national and international climate change mitigation goals. Avoiding the serious effects of climate change requires reducing global GHG emissions by about 14 GtCO2e per year by 2020.4
According to uNEP’s The Emissions gap Report: 2012: “If best practice policies are adopted worldwide, [energy efficiency] standards and labels could result in emission reductions of approximately 0.7 GtCO2e in 2020”—this is a full 5% of the target.
1 U.S. Energy Information Administration’s National Energy Modeling System. Stephen Meyers, Alison Williams, & Peter Chan, LBNL, 2012. Energy and Economic Impacts of U.S. Federal Energy Conservation Standards Adopted From 1987 Through 2011.2 United Nations Foundation, 2007. Realizing the Potential of Energy Efficiency.3 CLASP& Kofi Agyarko, 2002. Transforming the West African Market for Energy Efficiency: Ghana Leads the Way with Mandatory Standards and Labels. 4 UNEP, 2012. The Emissions Gap Report 2012.

S&L Toolkit
4
Standards reduce costs & energy consumption
the case of refrigerator efficiency in the us market
demonstrates the impressive impact a standard
can have on appliance efficiency. us refrigerator
standards—which were first implemented in the
mid-1980s—are expected to save consumers almost
$40 billion by 2015.
Figure 3 shows how the
us’s 1990, 1993 and
2001 meps shifted
the market toward
refrigerators that are
substantially more
efficient.
the 1993 standard
increased refrigerator
energy efficiency by 25–
30%, eliminating 99%
of the models previously
on the market. between
1995 and 2000,
refrigerator energy use
rose slightly, perhaps
driven by significant
increases in product
volumes or manufacturer
expectations that
additional regulations
were distant. then, given the innovation of new
technologies, the 2001 standard required an
additional 25–30% efficiency increase that
eliminated about 95% of the models on the market
by that time. even as energy use decreased
over time, the graph shows that refrigerators
concurrently became less expensive.
APPLiANCE ENERgy EffiCiENCy STANdARdS
Energy efficiency standards specify a minimum level of energy performance and prohibit sales of new products that are less efficient than that minimum level.
Standards prevent inefficient products from entering the marketplace, raise the average energy efficiency of products, and encourage product manufacturers to increase product efficiency on a continuing basis if standards are regularly updated and revisions are announced ahead of implementation.
Minimum energy performance standards (MEPS) prescribe the allowable energy consumption manufacturers must achieve in all models of an applicable product. MEPS do not specify the technology or design of a product.
Prescriptive standards require a particular feature or device to be installed in new products.
Class-average standards specify the average efficiency required across all models of a manufactured product, allowing manufacturers to select the efficiency of each model such that the overall prescribed average is achieved.
Appliance Energy Efficiency Standards & Labels (S&L)
Figure 3. Annual energy use and real price of new refrigerators in the U.S.5
1987 1990 1993 1996 1999 2002 2005 2008 2011
1050
950
850
750
650
550
450
– 1050
– 950
– 850
– 750
– 650
– 550
– 450
Energy Use (kWh/yr)
Price (in 2009 $)
1990 Standard
1993 Standard
2001 Standard
Declining Price Trend
Year Shipped

S&L Toolkit
5
PRoduCT ENERgy EffiCiENCy LABELS
Energy efficiency labels make energy efficient products visible to consumers. They describe the energy performance of a product, telling consumers how much energy it uses, how efficient it is, or what energy costs to expect, giving consumers the information necessary to make informed purchases.
There are two main categories of labels— comparative labels and endorsement labels.
Comparative labels allow consumers to compare energy performance among models of similar products. By allowing consumers to compare the energy efficiency of different models while making a purchasing decision, comparative labels motivate manufacturers to build products that are more efficient than their competitors’ products. Comparative labels may use a continuous scale or discrete categories of performance with minimum criteria for each level.
Endorsement labels are essentially “seals of approval” awarded to product models according to specified energy efficiency criteria. By identifying the set of most energy efficient products for consumers, endorsement labels provide an incentive (market advantage) for manufacturers to build products
that meet the specified criteria. Since there is no indication of which products among those endorsed are more energy efficient, manufacturers may not need to design products that are more efficient than their competitors’ products.
Both types of labels pull the appliance, equipment and lighting market toward greater energy efficiency.
Photo: India’s BEE STAR endorsement label (left) and Russia’ voluntary energy efficiency endorsement label (right)
China Energy Label, a comparative label (left) and India’s bEE STAR endorsement label (right)
Photo: China Energy Label (left) and India’s Power Savings Guide label (right)
Figure 4. EU Energy Label increases market share of highest efficiency refrigerators6
45
40
35
30
25
20
15
10
5
0
Mar
ket
Sha
re (%
)
A+ A B C D E F G
Energy Class Labels
2003 1st 3 months
1997
1990–2

S&L Toolkit
6
In some cases, standards alone can significantly improve the efficiency of products on a market. For example, many countries have implemented standards for domestic lighting products. By specifying a certain efficiency level, these standards have effectively removed the least efficient lighting technology (incandescent lamps) from the market.
ComPLEmENTARy PoLiCiES
A range of financing and incentive programs have been used to overcome the barrier of higher first cost that often restricts the purchase of energy-efficient technologies. The most common incentives are consumer rebates or grants, tax credits or accelerated depreciation, loan financing (including shared-savings or performance-based contracting), and equipment leasing. Government “green” procurement programs can also drastically improve the market uptake of certain products, especially emerging technologies. Energy labels and standards are an important foundation for these
How Standards & Labels Work Together
Standards eliminate inefficient models by establishing a baseline of energy performance that products must meet. Labels provide information to consumers to allow them to make rational decisions about buying energy-efficient models of products, which in turn stimulates manufacturers to design products that achieve higher ratings than the minimum standard. Together, these policies shift the distribution of models of products sold in the market towards greater energy efficiency.
Governments often start S&L programs with labels only.Sometimes these labels are voluntary, giving manufacturers the opportunity to adjust to a regulated market. For example, India began its S&L program by introducing voluntary labels for frost-free refrigerators, room air conditioners, distribution transformers, and tubular fluorescent lamps in 2006. In 2010, the efficiency thresholds in the labels became mandatory, removing the least efficient of these products from the market and effectively creating a mandatory standard.
Figure 5. Benefits of standards and labels for product energy efficiency7
Sal
es
Efficiency
No standards or labels
Standards only
Standards and labels

S&L Toolkit
7
programs because they provide a verified baseline for judging enhanced performance and establishing appropriate incentives. Incentive programs can use product listings available from the labeling program
Bangladesh, with World Bank support, procures and distributes 10.5 million energy efficient compact fluorescent lamps
in 2010, bangladesh suffered a peak load deficit
of over 2,000 mW in electricity. this posed a
major challenge for the country’s power sector,
with blackouts and brownouts affecting urban and
rural consumers. it takes time to create additional
generation capacity, and emergency measures
such as rental power only partially addressed
the situation.
With support from the World bank, the government
of bangladesh procured and distributed 10.5 million
energy efficient compact fluorescent lamps (cFls)
in exchange for less efficient incandescent lamps. 5
million of these were distributed in one day.
the bulk-scale deployment of high quality cFls is
expected to reduce peak electricity demand and
lessen load shedding throughout bangladesh. phase
i deployment of 10.5 million cFls is estimated
to have the same impact as installing 300 mW
of additional generation capacity. the technical
specifications of the cFls procured under the
program maintained higher power factor, higher
voltage tolerance range, and longer life.
For this project, the bangladesh government used
bulk purchasing power to drastically alter the
market towards more energy efficient products—
without putting a new standard or label in place.
Overall, this project cost much less than building
new power plants.8
to establish which products meet higher efficiency levels and to identify the models qualified to receive incentives.
5 AHAM Factbooks, Rosenfeld 1999 and Bureau of Labor Statistics6 Paolo Bertoldi, Benoit Lebot, & Paul Waide, 2001. Assessing the market transformation for domestic appliances resulting from Euorpean Union policies. 7 Stephen Wiel, James E. McMahon, et al,, 2005. CLASP S&L Guidebook. 8 World Bank, 2010. Bangladesh Sets a World Record: 5 million CFLs in One Day.

S&L Toolkit
8
ASSESSiNg CAPACiTy, RESouRCES, ANd LEvERAgE
In order to implement a S&L program, governments need a legal framework and an annual budget.
A legal framework gives governments the authority to implement S&L, either within a single agency or with aspects of the program divided among several agencies.
An annual budget covers annual operating costs, which generally include staff and personnel to manage the program and project funds to pay for the technical or market research necessary to implement S&L. Annual operating costs will be more expensive in the first year as operations and infrastructure are established.
If the allocated annual program budget isn’t large enough to adequately cover estimated program costs, programs can either raise funds from international donors or plan to charge manufacturers for their participation in the S&L program, assuming that consumers will be properly
incentivized to pay for energy efficient products. For example, China’s voluntary endorsement label is supported in part through a certification fee collected from manufacturers in exchange for use of the label.
Leveraging Resources by Participating in Multilateral Initiatives: In order to reduce costs, learn from peers, and increase policy effectiveness, policymakers should consider participating in regional and multinational energy efficiency collaborations where governments exchange information on specific products; fundraise
rEsourcEs for imPlEmEnTErs: For more information on developing legal frameworks, read “Deciding Whether or How to Implement Energy Efficiency Labels and Standards” in CLASP’s S&L Guidebook.
ECOWAS: Accelerating S&L through regional collaboration
When starting or accelerating s&l, collaboration among several governments may be more attractive to donors who wish to maximize their return on investment.
in 2007, the economic cooperation of West African states (ecOWAs) designed a strategic plan to achieve energy efficiency and renewable energy goals. With the support of international donors, ecOWAs estimated the potential energy
savings from implementing a regional s&l program. initial analysis suggested the region could save over 60,000 gWh of electricity per year by 2030—nearly as much electricity as was consumed by the entire ecOWAs region in 2011—through the adoption of best practice efficiency standards for refrigerators, air conditioners, lighting and other equipment.9
Designing and Implementing Successful S&L Policies

S&L Toolkit
9
collectively; and pool resources to conduct projects that are valuable for the whole group.
Globally and regionally, there are many existing multilateral initiatives to help governments leverage technical and financial resources and
Table 2. Multilateral collaborations for appliance energy efficiency
iNiTiATivE KEy ACTiviTiESPARTiCiPATiNg govERNmENTS
Asia Pacific Economic Cooperation Expert group on Energy Efficiency and Conservation (APEC EgEE&C)
The APEC EGEE&C aims to reduce trade barriers for environmental goods and services in APEC economies by promoting energy efficiency practices and technologies; improving analytical, technical, and policy capacity for energy efficiency and conservation; and supporting the development of aligned energy efficiency S&L.
Australia, Brunei Darussalam, Canada, Chile, China, Hong Kong, Indonesia, Japan, Korea, Malaysia, Mexico, New Zealand, Papua New Guinea, Peru, the Philippines, Russia, Singapore, Chinese Taipei, Thailand, the United States, Vietnam
international Energy Agency Efficient Electrical End-use Equipment (iEA 4E) implementing Agreement
IEA 4E activities are designed to advance consumer access to energy efficient electrical appliances. 4E provides a forum for member governments to share information and transfer experience in order to support good policy development in the field of energy efficient appliances and equipment. Four Annexes are established under the 4E framework to facilitate product-specific technical research: Mapping & Benchmarking, Standby Power, Solid State Lighting, and Electric Motor Systems.
Australia, Austria, Canada, Denmark, France, Japan, Korea, the Netherlands, Sweden, Switzerland, UK, and the United States
Super-efficient Equipment and Appliance deployment (SEAd) initiative
SEAD is a voluntary multinational collaboration whose primary objective is to advance global market transformation for energy efficient products. SEAD participating governments work together to develop common technical foundations that will enable faster and easier adoption of cost-effective product efficiency policies and programs. SEAD’s main areas of focus include: S&L, awards, incentives, procurement, and technical analysis.
Australia, Brazil, Canada, the European Commission, France, Germany, India, Japan, Korea, Mexico, Russia, South Africa, Sweden, the United Arab Emirates, the United Kingdom, and the United States
Economic Cooperation of West African States (ECoWAS) Regional Centre for Renewable Energy and Energy Efficiency (ECREEE)
ECREEE is a specialized agency of ECOWAS that supports efforts to create a regional system of appliance energy efficiency S&L in West Africa through establishing regional energy efficiency targets, standards, and key actions to be implemented on national levels.
Benin, Burkina Faso, Cape Verde, Cote D’Ivoire, Gambia, Ghana, Guinea, Guinea Bissau, Liberia, Mali, Niger, Nigeria, Senegal, and Sierra Leone
Lighting information and Technical Exchange for Standards (lites).asia
lites.asia facilitates policymaker cooperation within the Asia region to improve knowledge of lighting standards across the region, increase participation of regional economies in the IEA standards development process to ensure test procedures are appropriate to the region, and develop national and regional capacity for compliance in S&L processes.
Australia, China, India, Indonesia, Philippines, Sri Lanka, Thailand, the United States, and Vietnam
facilitate information sharing and best practice collaborations.
The table below lists some multilateral collaborations that focus on appliance energy efficiency.
S&L Toolkit
10
ANALyziNg ANd SETTiNg STANdARdS
As discussed above, minimum energy performance standards (MEPS) are useful policy tools for shifting markets towards greater energy efficiency. Among other benefits, MEPS can:
Eliminate inefficient models currently on the market;
Prevent the importation of inefficient products from other countries (a.k.a “dumping”); and
Encourage trade partners and local manufacturers to develop more cost effective and energy efficient products.
Establishing a Technical and Economic Basis for Standards
The first step in establishing a national program for appliance energy efficiency standards is to conduct a baseline data assessment, which determines how much energy products typically consume prior to the implementation of standards and labels. This serves as a foundation for identifying potential energy efficiency improvements, and enables poli-cymakers to evaluate the effectiveness of an S&L program over time.
Once a baseline is established, several types of anal-yses can be conducted to ensure that a standard achieves maximum energy and cost savings. Each analysis enables policymakers to make informed de-cisions on several key issues, such as which products to regulate, how stringent a standard should be, and the potential impacts of new policies on manu-facturers, consumers, and the market.
Engineering Analysis: Assesses the feasibility and cost of improving the energy efficiency of a specific appliance through technological enhancements.
ExAMPLE: The International Energy Initiative (Latin America) conducted an analysis of technological improvements to residential refrigerators in Brazil in 2003 to support the implementation of mandatory energy efficiency standards for the product group.
Market Analysis: Provides an overarching view of the market for a specific appliance in terms of existing levels of efficiency and energy consump-tion. This enables decision makers to identify which products (or which models) are consum-ing the most energy and compare different policy options in terms of financial costs and energy use.
ExAMPLE: In 2011, Russia analyzed the Russian air-conditioner market, providing an overview of historic and current air-conditioner market characteristics and estimating the total national energy consumption from air-conditioners.
Consumer Analysis: Determines the economic impacts of a standard on individual consumers, including effects on purchase and operating costs.
Manufacturing Analysis: Assesses the impact of a standard on domestic and international manufacturers, including effects on profitability, growth, and competitiveness of an industry. Depending on the local situation, this analysis may also include distributors and retailers.
Most countries do not have the resources to perform rigorous versions of each analysis. If this is the case, policymakers and practitioners can employ the following tactics to conduct simplified analyses adapted from other countries to assist in setting appropriate standards:
1. Identify and replicate product standards that are consistent with those of neighboring economies or major trading partners with similar market characteristics.
2. Evaluate a proposed standard with an analytical tool such as the Policy Analysis Modeling System (PAMS), which uses proxy data to approximate
rEsourcEs for imPlEmEnTErs: For
more information on how to conduct baseline
assessments, visit Sections 9.4.1/3.5.4 of
CLASP’s S&L Guidebook.

S&L Toolkit
11
the cost and energy savings produced by that standard. If analysis of a potential standard results in costs that are too high, lower the MEPS threshold until it meets the required criteria. MEPS should then be periodically reevaluated and upgraded as the market adjusts and efficient products decrease in price. This process also stimulates manufacturer innovation.
PAMS is a spreadsheet-based tool that provides techno-economic analysis to countries with limited resources and limited data available.
After designing a standard or standards program, a system is needed to test whether products comply with those standards. For more information about testing and compliance for a standards program, read the section below on Developing Test Procedures, Testing Capacity, and Compliance.
Ghana’s standards eliminate “dumping” of inefficient appliances
ghana followed its first standards for air conditioners and lighting with an additional standard for refrigerators to eliminate many inefficient products that were previously “dumped” into the market. unlike the market for room air conditioners which mainly consists of new equipment, more than half of refrigerators sold in ghana in 2006 (before the standard) were used products, many of which were shipped from europe.
A pAms analysis conducted in 2006 showed that consumers in ghana could save approximately usd $35 per year, which was about one-third of the price of a refrigerator.
At the same time, ghana revised its standards for air conditioners and lighting. standards need to be revised and updated to reflect changing market conditions. improving or “ratcheting” standards over time also helps consumers and manufacturers adjust to changes in price and policy requirements. 10

S&L Toolkit
12
dESigNiNg, imPLEmENTiNg, ANd CommuNiCATiNg A LABELiNg PRogRAm
For consumers, energy labels are the most visible element of an S&L program. Well-designed labels simultaneously increase consumer awareness about appliance efficiency and encourage the purchase of energy efficient products, enabling market shifts toward greater energy efficiency.
To start designing a labeling program, consider several key choices:
What products should be covered?
Should a program start with endorsement or comparative labeling?
How, and to what degree, should endorsement and comparative labels be linked?
If a comparative labeling program is chosen, should it be mandatory or voluntary?
Should comparative labels be continuous (using a continuous scale) or categorical (using discrete categories of performance)?
Communicating Energy Labels to Consumers: Because energy labels will only be effective if they are understood and supported by consumers, it is important to get consumer feedback (e.g., through market research surveys or focus groups) throughout the label design process. In addition, communicating to consumers about energy labels once they are implemented facilitates greater consumer comprehension and consumer and retailer support of energy efficient products.
Messages should focus on benefits, be straightforward, and be relevant to the audience. Possible messages might include that purchasing energy efficient products:
Saves money
Helps the environment
Improves public health
Improves national energy security
Is a source of social responsibility or pride
Increases self-assurance
Increases convenience
Increases comfort
An energy labeling program must have a system that can test whether products are eligible to carry a label and verify that the information presented on the label is accurate. For more information about testing and compliance for a labeling program, read the section below on Developing Test Procedures, Testing Capacity, and Compliance.
rEsourcEs for imPlEmEnTErs:
For more information on communications
campaigns for energy labeling programs, see
the CLASP S&L Guidebook.

S&L Toolkit
13
Promoting India’s energy label through consumer interest groups
Organizations dedicated to promoting the public
good (e.g., protecting the environment) or to
protecting the rights of citizens and consumers
(e.g., consumer advocacy organizations) are natural
partners for communicating with consumers
about energy labels. in india one such non-profit
organization, consumer VOice, is dedicated to
promoting safe and healthy choices for consumers
and the environment by providing consumer
education.
After india launched a 5-star energy label for
refrigerators and air conditioners in 2006, the
national bureau of energy efficiency (bee), clAsp,
and consumer VOice partnered to conduct a low-
cost nationwide consumer awareness and outreach
campaign that accelerated the purchase of star-
labeled air conditioners and refrigerators. consumer
VOice worked through a network of non-profit
organizations in 14 indian cities to raise awareness
of the label, distributing promotional leaflets in
several languages including bengali, gujarati, hindi,
malayalam, and Oriya.11
Facts and figures
total cost of communications campaign: $50,000 usd
star-labeled air conditioners
units sold in india in 2010: 2.2 million
cumulative electricity savings: 1.09 gWh12
Avoided generation capacity: 1.456 gW
Annual savings for indian consumers: over $40,000 usd 13
star-labeled refrigerators
units sold in india in 2010: 6.36 million
cumulative electricity savings: 2.64 gWh 14
Avoided generation capacity: 0.481 gW
Annual savings for indian consumers: over $300,000 usd15

S&L Toolkit
14
Tunisia adapts EU label design and labeling thresholds
From 2001 to 2004 the tunisian government
implemented the country’s first s&l program for
refrigerators. A limited budget precluded a full
new label design process. instead, the government
of tunisia:
reviewed several international label examples;
Adapted and modified eu label design for the
tunisia context, based on the similarities of
refrigerator products sold in both countries; and
conducted market research (focus groups
and quantitative surveys) with consumers and
retailers.
the european union’s energy label was the first
leading energy label design informed by consumer
research. A result of this process was the A-to-g
energy efficiency classification scale with stacked
horizontal bars colored from green to red.
tunisia changed the eu’s letter scale to numbers,
and adapted the stacked bar design so it could be
read left to right (in French) and right to left (in
Arabic). they also added a top category in the color
blue to accommodate and encourage additional
energy efficiency product technology innovation.
the final design, field-tested through consumer
interviews, had a very high comprehension rate
of 75%.
An earlier survey had revealed that eu-derived
refrigerator models dominated the tunisian market
and that tunisian-derived refrigerators were broadly
similar in type to those found in the eu. therefore,
tunisia decided to largely harmonize the product
categories and label efficiency thresholds with those
in place in the eu.16
Photo: Tunisia’s (left) and European Union’s (right) Energy Efficiency Label for refrigerators
Tunisia’s (left) and European union’s (right) Energy Efficiency Label for refrigerators
rEsourcEs for imPlEmEnTErs: For
more information on designing a labeling
program, visit CLASP’s S&L Guidebook.
Aligning with Regional Labels
Policymakers should consider regional labeling if the marketplace is more regional than national, in order to take advantage of the collective market power of a larger quantity of appliances. Even slightly different labeling requirements among countries can be disruptive to trade, limit choices, and add to consumer costs. However, if cultural differences within a region would make a single label design ineffective, then customized label designs may be preferable.
Harmonization of labels can be considered in two parts: harmonization of the technical foundation
(i.e., shared metrics and technical categorization) and harmonization of label design and presentation (i.e., use of colors, numbers, letters, or stars to indicate efficiency). For developing countries with limited manufacturing capacity, aligning technical requirements with regional partners can remove trade barriers and thereby strengthen the national economy.
S&L Toolkit
15
dESigNiNg ANd ESTABLiSHiNg fiNANCiAL iNCENTivES
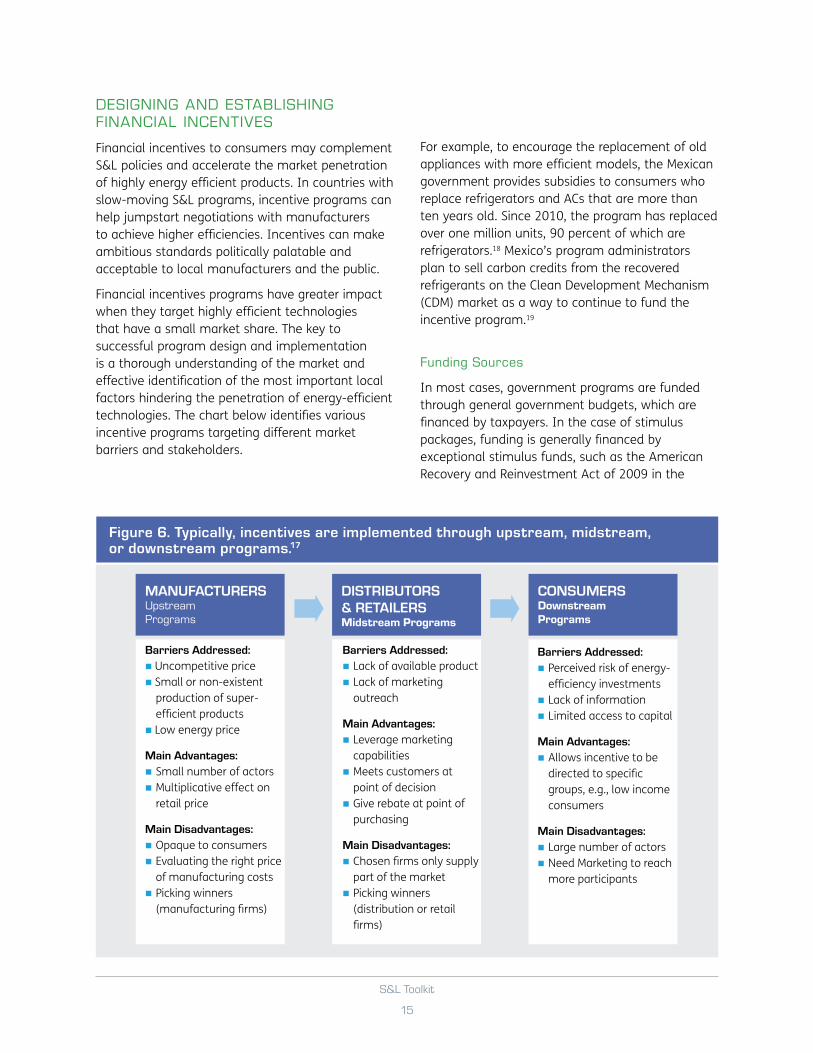
Financial incentives to consumers may complement S&L policies and accelerate the market penetration of highly energy efficient products. In countries with slow-moving S&L programs, incentive programs can help jumpstart negotiations with manufacturers to achieve higher efficiencies. Incentives can make ambitious standards politically palatable and acceptable to local manufacturers and the public.
Financial incentives programs have greater impact when they target highly efficient technologies that have a small market share. The key to successful program design and implementation is a thorough understanding of the market and effective identification of the most important local factors hindering the penetration of energy-efficient technologies. The chart below identifies various incentive programs targeting different market barriers and stakeholders.
For example, to encourage the replacement of old appliances with more efficient models, the Mexican government provides subsidies to consumers who replace refrigerators and ACs that are more than ten years old. Since 2010, the program has replaced over one million units, 90 percent of which are refrigerators.18 Mexico’s program administrators plan to sell carbon credits from the recovered refrigerants on the Clean Development Mechanism (CDM) market as a way to continue to fund the incentive program.19
funding Sources
In most cases, government programs are funded through general government budgets, which are financed by taxpayers. In the case of stimulus packages, funding is generally financed by exceptional stimulus funds, such as the American Recovery and Reinvestment Act of 2009 in the
MAnUFACTUrErSupstream Programs
Barriers Addressed: Uncompetitive price Small or non-existent
production of super-efficient products
Low energy price
Main Advantages: Small number of actors Multiplicative effect on
retail price
Main Disadvantages: Opaque to consumers Evaluating the right price
of manufacturing costs Picking winners
(manufacturing firms)
DISTrIBUTorS & rETAILErSMidstream Programs
Barriers Addressed: Lack of available product Lack of marketing
outreach
Main Advantages: Leverage marketing
capabilities Meets customers at
point of decision Give rebate at point of
purchasing
Main Disadvantages: Chosen firms only supply
part of the market Picking winners
(distribution or retail firms)
ConSUMErSDownstream Programs
Barriers Addressed: Perceived risk of energy-
efficiency investments Lack of information Limited access to capital
Main Advantages: Allows incentive to be
directed to specific groups, e.g., low income consumers
Main Disadvantages: Large number of actors Need Marketing to reach
more participants
Figure 6. Typically, incentives are implemented through upstream, midstream, or downstream programs.17

S&L Toolkit
16
China relies on energy efficiency tiers to determine appliance eligibility for subsidy program
in June 2012, the chinese government extended
their appliance subsidy program to include tVs,
refrigerators, washing machines, and water heaters.
their total budget was rmb 26.5 billion (usd $4.1
billion) and the time frame was one year. the main
goal was to promote energy-saving home appliances
and stimulate the economy to offset the impact of
the international economic crisis.
six months after kick-off, clAsp began evaluating
the program. the evaluation uncovered that china
was subsidizing too many products, not limiting
those subsidies to only highly efficient products.
the chinese
government relied
on energy efficiency
tiers to determine
product eligibility
for the subsidy
program. subsidized
products faced one
of two circumstances
with regards to the
chinese energy label.
For air conditioners,
the top two tiers were
eligible for subsidies,
resulting in subsidies
for a very large
percentage of models
on the market. For
the other subsidized
products—flat panel
televisions, refrigerators, and clothes washers—only
a portion of models in the top tier were eligible for
the subsidy.
For this second set of products, the top ee tier was
too saturated to sufficiently differentiate the most
efficient products, so the chinese government had
to put in place more stringent eligibility criteria for
subsidies. this signified a need for policymakers
to revise their labeling tiers to better differentiate
the energy efficiency of product models, both for
consumer decision making and for more effective
incentive policies.
Figure 7. Energy efficiency tiers and percentage of products eligible for 2012–2013 China subsidy22
51.1%
31.3%
4.6%
30.8%
19.2%
Fixed Speed Air Conditioners
Variable Speed Air Conditioners
Flat-panel TV
Domestic Refrigerators
Clothes washers
Tier 5 Tier 4 Tier 3 Tier 2 Tier 1
0% 20% 40% 60% 80% 100%
% eligible for subsidy
KEYmore energy efficient
more energy efficient
rEsourcEs for imPlEmEnTErs:
For more information about designing and
implementing incentive programs, read the
SEAD Initiative’s A Global review of Incentive
Programs to Accelerate Energy-Efficient
Appliances and Equipment.
United States.20 Governments from developing countries or economies in transition can seek financial support from various international financial institutions such as the World Bank, the Clean Technology Fund, and the Global Environmental Facility. For example, the Mexican replacement of refrigerators and ACs is co-funded by loans from the International Bank for Reconstruction and Development and the Clean Technology Fund.21

S&L Toolkit
17
dEvELoPiNg TEST PRoCEduRES, TESTiNg CAPACiTy, ANd ComPLiANCE
Test Procedures & Assessing Testing Capacity
As a country adds products to its S&L program, it is critical to set up product-specific testing infrastructure to measure and evaluate all products in a consistent manner. This is best accomplished by identifying and accrediting test facilities, adopting standardized test procedures, and establishing a process for assuring compliance with testing requirements.
Test procedures describe how to measure the energy use of a product, providing an accurate and consistent comparison of energy use among different manufacturers’ products. Effective test procedures:
Reflect typical usage conditions;
Are repeatable, reproducible, and produce accurate results; and
Are relatively affordable.
Adopting or adapting existing test procedures—rather than managing the expense and technical analysis required to create a new one—has many benefits, including:
Minimal up-front investment;
Reduced need for high-level technical capacity or access to accredited testing facilities; and
Knowing the accuracy, benefits, complications, and risks involved.
In many cases, international standardization bodies like the International Organization for Standardization (ISO) and International Electrotechnical Commission (IEC) develop and publish test procedures that can be readily adapted to meet a country’s specific circumstances.
Policymakers can also consider adopting the test procedure of a major regional trading partner.
Conducting Testing with Constrained Resources
There are approaches to conduct effective testing with limited resources, even though best practice suggests that testing should be one of the most resource-intensive and time-consuming aspect of an S&L program. The lack of availability of testing laboratories or of funds for their development has often been a serious barrier to the development of S&L programs.
Some options for low-cost, high-quality testing include:
Pooling resources with neighboring countries to establish a regionally funded and managed test laboratory.
Relying on existing test facilities from the country of origin if most units of an appliance are imported.
Establishing energy-efficiency testing as part of wider government programs covering product safety, quality, and environmental acceptability.
Cooperating with existing test laboratories in the private sector or at technical universities. Care must be taken, however, to avoid potential conflicts of interest. For example, it may not be appropriate for test laboratories that are doing research for regulated companies on a contract basis to also act as program-designated test centers.
By considering testing already being undertaken by neighboring countries or major trading partners, an S&L program can effectively reduce testing costs and gather more market intelligence. One way to start collaborating between two or more countries is through a mutual recognition agreement (MRA). An MRA enables countries under
rEsourcEs for imPlEmEnTErs:
For more information on energy testing for
appliances, visit CLASP’s S&L Guidebook.

S&L Toolkit
18
the agreement to recognize some or all aspects of each other’s testing results and supporting documentation and thus simplify the inspection process for cross-border trade. Another option is
to contract existing accredited test laboratories in neighboring countries or major trading partners to perform testing, moderating the need to build new testing capacity.
Australia conducts lamp testing in China to reduce program costs
in 2010, the Australian government commissioned
the national lighting test centre (nltc) in beijing,
china, to undertake performance testing of cFls
available in the Australian market. Over 2,000
lamps were tested (140 individual models) against a
range of performance criteria including light output,
efficacy, color rendering, lumen maintenance and
lifetime. Additionally, a proportion of the lamps were
tested for mercury content.
the results of this testing are serving as a
benchmark for measuring improvements in cFl
quality following the implementation of performance
and energy efficiency regulations implemented as
part of the Australian incandescent lamp phase-
out actions.
the competence of nltc to undertake this
compliance testing on behalf of the Australian
government had been established before 2010
through comparison testing with laboratories in
the u.s. and Australia. since these initial tests, the
Australian government has commissioned nltc
to undertake a range of testing activities including
assessment of market developments (particularly
for cFls and leds) and the management of a
round robin test verifying a new reflector lamp test
methodology.23
designing and implementing a Compliance framework
For any S&L program, a compliance framework—a process of monitoring, verification, and enforcement (MV&E)—must be established to:
Verify that a product’s energy efficiency performance lives up to manufacturer claims; and
To remove inefficient products from the market when they are found to be non-compliant with S&L program requirements.
High rates of compliance benefit all S&L stakeholders by:
Generating increased consumer confidence and purchasing;
Creating a fair market for manufacturers; and
Encouraging industry investment in energy efficiency and technological innovation.
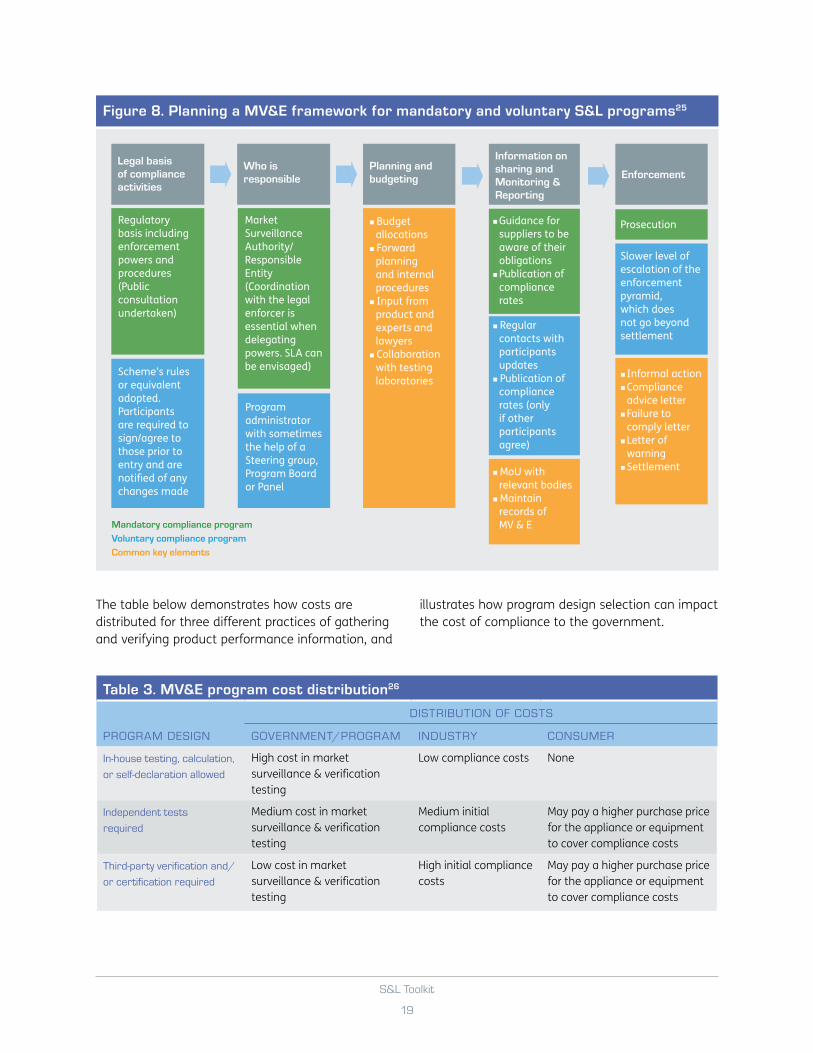
The diagram in Figure 8 illustrates the components that should be taken into consideration when designing and implementing an MV&E framework for mandatory and voluntary S&L programs. 24
Several factors affect the budget required for an MV&E framework, including investment in information and tracking systems, in-country or external verification testing, and legal costs related to enforcement actions. These costs can be distributed in various ways among government, industry, and consumers.
rEsourcEs for imPlEmEnTErs: For
more information on designing and implementing
MV&E, visit Mark Ellis & Associates and
CLASP’s MV&E Best Practice Guidebook.
S&L Toolkit
19
Figure 8. Planning a MV&E framework for mandatory and voluntary S&L programs25
Legal basis of compliance activities
Regulatory basis including enforcement powers and procedures (Public consultation undertaken)
Scheme’s rules or equivalent adopted.Participants are required to sign/agree to those prior to entry and are notified of any changes made
Who is responsible
Market Surveillance Authority/Responsible Entity (Coordination with the legal enforcer is essential when delegating powers. SLA can be envisaged)
Program administrator with sometimes the help of a Steering group, Program Board or Panel
Budget allocations
Forward planning and internal procedures
Input from product and experts and lawyers
Collaboration with testing laboratories
Information on sharing and Monitoring & reporting
Planning and budgeting
Guidance for suppliers to be aware of their obligations
Publication of compliance rates
Regular contacts with participants updates
Publication of compliance rates (only if other participants agree)
Enforcement
Prosecution
Mandatory compliance program
Voluntary compliance program
Common key elements
Informal action Compliance
advice letter Failure to
comply letter Letter of
warning Settlement
MoU with relevant bodies
Maintain records of MV & E
Slower level of escalation of the enforcement pyramid, which does not go beyond settlement
Table 3. MV&E program cost distribution26
PRogRAm dESigN
diSTRiBuTioN of CoSTS
govERNmENT/PRogRAm iNduSTRy CoNSumER
in-house testing, calculation,
or self-declaration allowed
High cost in market surveillance & verification testing
Low compliance costs None
independent tests
required
Medium cost in market surveillance & verification testing
Medium initial compliance costs
May pay a higher purchase price for the appliance or equipment to cover compliance costs
Third-party verification and/
or certification required
Low cost in market surveillance & verification testing
High initial compliance costs
May pay a higher purchase price for the appliance or equipment to cover compliance costs
The table below demonstrates how costs are distributed for three different practices of gathering and verifying product performance information, and
illustrates how program design selection can impact the cost of compliance to the government.

S&L Toolkit
20
Denmark drives effective compliance through review of technical documents
to reduce the cost of ensuring compliance with s&l,
in 2010 the danish energy Agency (deA) refocused
their market surveillance efforts from exclusively
focusing on product testing to also incorporating
evaluation of technical documentation supplied by
product suppliers (e.g., importers). this allowed the
deA to increase the number of products inspected
without increasing the total costs.
With this joint approach, around two-thirds
of all inspections are evaluations of technical
documentation provided by manufacturers. the
remaining inspections are carried out through
laboratory testing. in addition, the deA uses the
technical documentation inspections to identify
the specific models which are tested in the
laboratories.
in addition to enabling more products to be checked
using the same resources, document inspection has
the following advantages:
document inspections give quick and effective
insight into supplier awareness of legal
requirements. if the supplier is aware of the
regulations, the documentation is generally
present and of a high quality; if a supplier is
unaware of the regulations, the documentation is
often absent or of a low quality.
results from document checks can be used
to select products for laboratory testing.
if a supplier repeatedly has low quality
documentation, compliance officers may choose
to prioritize testing of those products.
document inspections reveal the need and
possibility for improved information, dialogue, and
cooperation with suppliers.
market surveillance cannot be based on document
inspections alone, but must supplement these
inspections with tests and measurements, albeit at
a lower frequency. possible problems with document
inspection include:
suppliers may lack the technical skills to
understand complicated regulations, which may
lead officials to wrongly regard products as non-
compliant.
When suppliers are accustomed to document
inspections, there may be a risk that they will
adjust documentation to meet the requirements,
thereby showing product compliance on paper
where it does not exist in practice.27
Seeking the help and guidance of other S&L programs around the world can also help to reduce the cost of MV&E programs. Peer learning and information exchange can quickly build internal expertise; harmonizing energy performance
requirements, test procedures, and reporting methods across countries can minimize the time and resources needed for data collection; and the use of online tools can help product suppliers to provide information at a low cost.

S&L Toolkit
21
EvALuATiNg AN ENERgy EffiCiENCy S&L PRogRAm
Regularly evaluating the effectiveness of S&L policies in achieving national goals (e.g., carbon abatement, cost savings, or reduced energy demand) is essential for adapting policies to respond to changing appliance and equipment markets and energy efficiency levels. Evaluations also help governments regularly and appropriately improve S&L over time.
According to the International Energy Agency’s World Energy Outlook 2013, energy efficiency’s economic benefits are difficult to quantify because, unlike supply-side options, energy efficiency is rarely traded or priced. This can make some aspects of S&L evaluation difficult, particularly when a government desires to measure the economic benefits of the program.
Evaluations are built on data—such as market size and shares, trends, drivers, and sales—all of which are an integral part of overall S&L program design and implementation. Regularly collecting, comparing, and evaluating data alleviates difficulties associated with program and policy evaluation.
Focus areas of evaluations can include a program’s process as well as its impact on energy use, its cost-effectiveness, and other areas concerning the environment, people, and the economy. The most effective evaluations incorporate both process and impact components.
A process evaluation measures how well a program is functioning. This (often qualitative) assessment helps to improve program design, acquire more participants, and increase cost-effective energy savings generated by the program.
Process evaluation elements assess:
Consumer priorities;
Consumer awareness;
Administrative efficiency (e.g., registration times); and
Manufacturer claims (e.g., maintaining program credibility).
An impact evaluation can determine the effectiveness of individual standards and labeling policies. Impact evaluations reveal opportunities for program improvements through comparisons between the predicted and actual effectiveness.
Both process and impact evaluations should be performed in part or whole regularly—every two to three years—and are especially critical during the initial implementation of an S&L program.
Impact Evaluation of Standards: Governments and policymakers determine the estimated energy and economic impacts of established standards programs, including collecting data and evaluating effects on consumer energy bills, greenhouse gas emissions reductions, equipment cost effectiveness, manufacturer costs, retail sales, and national or regional energy consumption. Impacts assessment data can be used for forecasting energy use and resource planning.
Impacts Evaluation of Labels: This effort involves tracking market indicators and performing interviews to better understand the attitudes and decision-making processes of consumers and retailers. Impacts assessments of labels provide information about when to adjust efficiency grades upwards to maintain the success of a labeling program as well as increased understanding of the impact of the label on retailer and consumer decision making.

S&L Toolkit
22
Market Analysis of China Energy Efficient Products identifies where current policies are not keeping pace with market and technological shifts
the market for domestic appliances in china
has flourished in recent years. Without policy
intervention to reduce the amount of energy
consumed by domestic appliances, their projected
electricity consumption will rise from 591 tWh per
year in 2012 to 748 tWh per year in 2020—a 79%
increase over eight years.28
in 2013, clAsp and top10 china published a
study, market Analysis of china energy efficient
products (mAceep), that combines market
research and policy analysis to identify products
for which china’s appliance energy efficiency
policies are not keeping pace with energy efficiency
trends, emerging technologies, or rapid market
shifts. Figure 9 below uses data from the mAceep
study to demonstrate the efficiency distributions of
several products in the chinese market based on
energy efficiency levels, or “tiers,” defined for the
chinese energy label—tier 1 being the most efficient
and tier 5 being the least efficient.
As shown, a large proportion of several appliances
in the market qualify for tiers 1 and 2, which
indicates that product efficiency has significantly
outpaced the minimum requirements stated in the
s&l program. to continue driving further energy
efficiency improvements, therefore, s&l energy
efficiency requirements need to be “ratcheted,”
cOntinued On pAge 23
Figure 9. Energy labels in China: Market distribution within energy efficiency tiers29
Tier 5 Tier 4 Tier 3 Tier 2 Tier 1
0% 20% 40% 60% 80% 100%
KEYmore energy efficient
more energy efficient
Fixed Speed Air Conditioners
Variable Speed Air Conditioners
Flat-panel TV—PDP
Flat-panel TV—CCFL
Flat-panel TV—LED
All Flat-panel TVs
Domestic Refrigerators
Washing machines —Impeller
Washing macines—Drum
All washing machines
Automatic Rice Cookers
Induction Cookers (Hobs)
Copiers—Color MFD
Copier—Monochrome MFD
Computer monitors—LEDs
Computer monitors—CCFLs
All monitors

S&L Toolkit
23
9 Clean Energy Ministerial, 2013. SEAD Contributes to the ECOWAS Energy Efficiency Policy Action Plan.10 CLASP& Kofi Agyarko, 2002. Transforming the West African Market for Energy Efficiency: Ghana Leads the Way with Mandatory Standards and Labels11 CLASP & Consumer VOICE. Promotion of S&L of Refrigerators & Air Conditioners in India. 12 Bureau of Energy Efficiency, 2010. Report on Verified Energy Savings with the Activities of Bureau of Energy Efficiency for the year 2009-2010.13 CLASP & IMRS Advisory, 2009. Impact Assessment for BEE Labeling Program.14 Bureau of Energy Efficiency, 2010. Report on Verified Energy Savings with the Activities of Bureau of Energy Efficiency for the year 2009-2010.15 CLASP & IMRS Advisory, 2009. Impact Assessment for BEE Labeling Program.16 Kawther Lihidheb & Paul Waide, The Tunisian standards and labeling programme.17 SEAD Initiative and LBNL. Stephane de la Rue du Can, Amol Phadke, et al., 2013.A Global Review of Incentive Programs to Accelerate Energy-Efficient Appliances and Equipment.18 Lucas Davis, Alan Fuchs, and Paul Gertler, 2012. Cash for Coolers: Evaluating a Large-Scale Appliance Replacement Program in Mexico. (Revised 2013).19 SEAD Initiative and LBNL. Stephane de la Rue du Can, Amol Phadke, et al., 2013. A Global Review of Incentive Programs to Accelerate Energy-Efficient Appliances and Equipment.20 Ultimately, these stimulus funds will be paid for either through borrowing or currency devaluation, creating financial burdens ultimately borne by taxpayers.21 SEAD Initiative and LBNL. Stephane de la Rue du Can, Amol Phadke, et al., 2013.A Global Review of Incentive Programs to Accelerate Energy-Efficient Appliances and Equipment.22 CLASP, 2013. Appliance Energy Efficiency Opportunities: China 2013. 23 Mark Ellis & Associates, 2013. Contribution. 24 CLASP and Mark Ellis & Associates, 2010. Compliance Counts: A Practitioner’s Guidebook on Best Practice Monitoring, Verification, and Enforcement for Appliance Standards & Labeling25 CLASP and Mark Ellis & Associates, 2010. Compliance Counts: A Practitioner’s Guidebook on Best Practice Monitoring, Verification, and Enforcement for Appliance Standards & Labeling26 CLASP and Mark Ellis & Associates, 2010. Compliance Counts: A Practitioner’s Guidebook on Best Practice Monitoring, Verification, and Enforcement for Appliance Standards & Labeling27 Danish Energy Agency, 2013. Contribution.28 CLASP and Top10 China. Jayond Li, Steven Zeng, et al., 2013. Market Analysis of China Energy Efficient Products.29 CLASP, 2013. Appliance Energy Efficiency Opportunities: China 2013. Data collected July 2013.
or made more stringent, such that only the best
products in the market achieve tier 1 status.
As an evaluation of china’s s&l program, mAceep
offers several conclusions and recommendations to
chinese policymakers, including the following:
china could save 1,057 tWh of electricity—
roughly equivalent to the annual carbon
emissions from 15.5 million passenger vehicles—
from 2013 to 2030 by raising the energy
efficiency standards of the nine evaluated
products to the level of the most efficient models
currently on the market.
Adopting relatively simple revisions to the meps
for induction cookers, monitors, refrigerators,
rice cookers, and washing machines would result
in energy savings of at least 269 tWh from
2013 to 2030.
A large proportion of products in china’s
market qualify for the top two energy efficiency
tiers (tiers 1 and 2) of the china energy label.
restricting tiers 1 and 2 to only the top 5% and
10% of energy efficient products in the market,
respectively, would encourage the development
and purchase of new high-performance products.
cOntinued FrOm pAge 22
S&L Toolkit
24
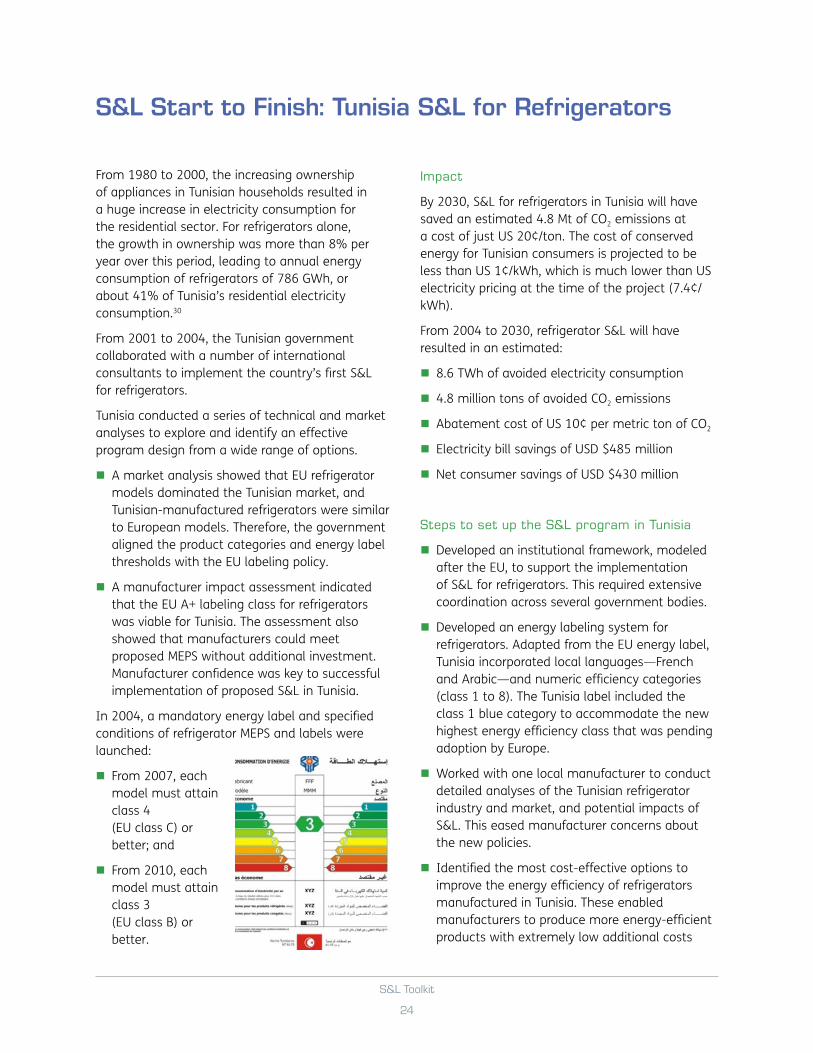
From 1980 to 2000, the increasing ownership of appliances in Tunisian households resulted in a huge increase in electricity consumption for the residential sector. For refrigerators alone, the growth in ownership was more than 8% per year over this period, leading to annual energy consumption of refrigerators of 786 GWh, or about 41% of Tunisia’s residential electricity consumption.30
From 2001 to 2004, the Tunisian government collaborated with a number of international consultants to implement the country’s first S&L for refrigerators.
Tunisia conducted a series of technical and market analyses to explore and identify an effective program design from a wide range of options.
A market analysis showed that EU refrigerator models dominated the Tunisian market, and Tunisian-manufactured refrigerators were similar to European models. Therefore, the government aligned the product categories and energy label thresholds with the EU labeling policy.
A manufacturer impact assessment indicated that the EU A+ labeling class for refrigerators was viable for Tunisia. The assessment also showed that manufacturers could meet proposed MEPS without additional investment. Manufacturer confidence was key to successful implementation of proposed S&L in Tunisia.
In 2004, a mandatory energy label and specified conditions of refrigerator MEPS and labels were launched:
From 2007, each model must attain class 4 (EU class C) or better; and
From 2010, each model must attain class 3 (EU class B) or better.
impact
By 2030, S&L for refrigerators in Tunisia will have saved an estimated 4.8 Mt of CO2 emissions at a cost of just US 20¢/ton. The cost of conserved energy for Tunisian consumers is projected to be less than US 1¢/kWh, which is much lower than US electricity pricing at the time of the project (7.4¢/kWh).
From 2004 to 2030, refrigerator S&L will have resulted in an estimated:
8.6 TWh of avoided electricity consumption
4.8 million tons of avoided CO2 emissions
Abatement cost of US 10¢ per metric ton of CO2
Electricity bill savings of USD $485 million
Net consumer savings of USD $430 million
Steps to set up the S&L program in Tunisia
Developed an institutional framework, modeled after the EU, to support the implementation of S&L for refrigerators. This required extensive coordination across several government bodies.
Developed an energy labeling system for refrigerators. Adapted from the EU energy label, Tunisia incorporated local languages—French and Arabic—and numeric efficiency categories (class 1 to 8). The Tunisia label included the class 1 blue category to accommodate the new highest energy efficiency class that was pending adoption by Europe.
Worked with one local manufacturer to conduct detailed analyses of the Tunisian refrigerator industry and market, and potential impacts of S&L. This eased manufacturer concerns about the new policies.
Identified the most cost-effective options to improve the energy efficiency of refrigerators manufactured in Tunisia. These enabled manufacturers to produce more energy-efficient products with extremely low additional costs
S&L Start to Finish: Tunisia S&L for refrigerators

S&L Toolkit
25
(e.g., improve chest freezer efficiency by 45% with a USD $1.35 design modification).
Developed a test laboratory in Tunisia and supported accreditation for refrigerator testing. This provided Tunisia with the capacity to conduct reliable conformity assessments and compliance procedures. The cost to set up the test laboratory and get accreditation was about USD $250,000.
Conducted a pilot labeling program to test labeling implementation in advance of the full implementation of the scheme.
Conducted a comprehensive consumer outreach campaign including TV and radio ads, brochures, and retailer training.
Conducted an evaluation of the energy, economic and environmental impacts of the adopted S&L policies for refrigerators.
Given budget limitations, the Tunisian government had to leverage resources from the international Tunisia’s pilot labeling program
community. Funding included USD $700,000 from the Global Environmental Facility (GEF), matched by $700,000 cash and $700,000 in-kind contribution from the Government of Tunisia.
30 Kawther Lihidheb & Paul Waide, The Tunisian standards and labeling programme.

S&L Toolkit
26
Energy efficiency policies and programs for appliances, lighting, and equipment can be implemented well and successfully under constrained resources. This Toolkit illustrates ways to minimize costs; depicts different choices policymakers may consider in implementation; and points to ways to leverage financial and intellectual resources, replicating successes for impactful policies.
Key Points and recommendations
Assessing Capacity, Resources, and Leverage: Complement an annual budget by fundraising to international donors or look for ways to distribute costs across stakeholders. Consider participating in multilateral initiatives to leverage existing knowledge and financial resources, and to replicate successful policies and programs. Fundraising for S&L is often more effective when conducted in collaboration with other governments.
Analyzing and Setting Standards: Consider conducting simplified standards analyses adapted from other countries. This can be done by identifying a major trading partner’s specifications for the product under consideration and using this MEPS threshold in an analytical tool (such as PAMS) to provide approximate cost and energy savings information. Identify and set standards for the highest-impact products in terms of energy use and market penetration (e.g., air-conditioners and refrigerators).
Designing, Implementing, and Communicating a Labeling Program: Collaborate with an environmental or consumer interest organization to promote labels and their associated benefits to consumers. This will aid in the design of targeted messaging and reduce costs. Adopting or adapting a regional trading partner’s label design or labeling technical foundation can also save time and resources.
Designing and Establishing Financial Incentives: Financial incentives programs have greater impact when they target highly efficient technologies that have a small market share. Pay close attention to which segment of the market you want to influence—manufacturers, retailers, and/or consumers—during program design. Seek support from international financial institutions for large-scale projects.
Developing Test Procedures, Testing Capacity, and Compliance: Adopt or adapt international test procedures and reporting methods rather than designing new ones. This helps reduce costs, preserve resources, and minimize trade barriers. Rely on existing testing facilities—for example, in neighboring countries, at technical universities, or in a product’s country of origin. This reduces barriers associated with high testing costs. Distribute the costs of compliance across program stakeholders—government, industry, and consumers.
Evaluating an Energy Efficiency S&L Program: Evaluate a program, its processes, and/or individual policies every two to three years. Focus areas should include overall effectiveness in terms of economic, social, and environmental and climate benefits. Evaluations can reveal programmatic opportunities for improvement—as well as cost saving measures that can be taken.

S&L Toolkit
27
There are numerous tools to help policymakers and S&L practitioners make better informed decisions on appliance energy efficiency, mitigating costs and drawing upon best practices.
resources and Tools for Policymakers and S&L Practitioners
In 2008, twelve countries from the Asia-Pacific, Europe and North America convened under the forum of the International Energy Agency (IEA)’s Implementing Agreement for a Co-operating Program on Efficient Electrical End-Use Equipment (4E) to share information and experience that supports good policy development in the field of energy efficient appliances and equipment. Four annexes currently exist under this agreement, focusing on sectors where there is the most immediate interest, the largest energy-saving potential, and the greatest opportunities for international coordination: mapping and benchmarking, standby power, solid state lighting, and electric motor systems.
Under 4E, IEA publishes various policy briefs that provide high-level observations and key findings from deeper technical studies on products covered by the annexes.31 The briefs provide policymakers
with summaries of key issues concerning the regulation of a certain product under an S&L program, including globally-collected data on energy consumption and policy actions or specifications that have proven particularly effective in other economies.32
These resources enable S&L policymakers to benefit from lessons learned in other economies and address potential challenges before they arise, increasing the efficacy of new or revised policies and preventing costly mistakes. Moreover, they facilitate regional or global alignment on energy efficiency performance standards and test methods, which help to lower trade barriers and promote increased commerce across borders.
Nearly all IEA-4E policy briefs are available in English, French, German, Korean, and Japanese.
CLASP’s S&L Guidebook is a manual for government officials and others around the world responsible for developing, implementing, enforcing, monitoring, and maintaining energy efficiency labeling and standards-setting programs. It discusses the pros and cons of adopting energy efficiency labels and standards. It describes the data, facilities, and institutional and human resources needed for these programs. It provides guidance on the design, development, implementation, maintenance, and evaluation of the programs and on the design of
standards and labels themselves. In essence, it is a primary reference for practitioners to learn whether and how to implement an S&L program, S&L policies, complementary measures such as compliance frameworks and consumer incentive programs, and approaches for harmonizing policies with those of other countries.
The primary authors of the S&L Guidebook are Stephen Wiel and James E. McMahon. Copies are available in English, Chinese, Spanish, and Korean.
S&L guidEBooK: A mANuAL foR PRACTiTioNERS
iEA-4E PoLiCy BRiEfS

S&L Toolkit
28
Public street and area lighting, which are important for visibility and safety, account for up to 40% of electricity consumed by municipalities, as well as 1–3% of total electricity demand.33 The SEAD Street Lighting Tool provides a quick, easy way for municipalities to lower their energy consumption and reduce life cycle costs while ensuring light quality in the transition to more efficient street lights.
The Street Lighting Tool is a free, simple calculator that can help a diverse set of users—from local procurement officials to experienced lighting designers, utilities, and manufacturers—to make more informed choices when upgrading street lighting fixtures. By combining basic photometric analysis with life cycle cost and energy analysis, it enables users to more easily evaluate numerous available fixtures in terms of energy efficiency and light quality, as well as develop a better
ANd EvALuATioN guidEFigure 10. Key steps in creating procurement criteria
9% Thailand
1. Decide which products to cover Criteria may include energy use, existing S&L programs
coverage, etc.
2. Determine target efficiency levels for those products Target levels may reference efficiency ranges for a
group of products (i.e. top 25%)
3. Periodically review target levels as markets evolve A successful program will naturaly shift the markets
towards more efficient products
4. Modify procurement systems to capture product data relvant to the efficiency criteria This may be used to verify compliance with
requirements
SEAd STREET LigHTiNg TooL
understanding of tradeoffs between price and performance. The tool also makes it quick and easy to create preliminary street lighting designs of the most common road layouts, even for novice users.
The SEAD Street Lighting Tool is the result of collaboration between the SEAD Initiative and the Alliance to Save Energy. Designed for international use, the tool is currently available in English, French, and Spanish.
SEAd PRoCuREmENT moNiToRiNg
Procurement policies leverage the bulk purchasing power of public and private sector buyers to signal demand for highly efficient equipment and appliances in the market, helping to advance market transformation towards these products.
The SEAD Initiative’s Energy Efficient Public Procurement Best Practices Guide identifies challenges in delivering public procurement programs and presents mechanisms to overcome these challenges, backed by case studies from selected SEAD participating governments.
The report highlights best practices for developing effective procurement policies, purchasing criteria, training programs, and resources for buyers, as well as tracking the policies’ impacts. In essence, the guide provides government procurement officials with a roadmap to implementing effective program structures.
SEAD’s Procurement Guide and tools are the result of collaboration between the SEAD Initiative and the Alliance to Save Energy.

S&L Toolkit
29
Quality data regarding appliance ownership and use patterns are the technical foundation for the assessment and development of any energy efficiency policy. Residential and commercial survey datasets provide an indication of ownership rates, common product classes, and use patterns for a variety of products.34 In addition, they yield market information such as brand, model type and price paid for common equipment. This information helps policymakers to set energy efficiency standards and labels that are both stringent and feasible in the current market.
CLASP developed a publicly available set of survey tools as a resource to program managers and analysts. The tools provided are (1) standard printable survey forms, and (2) data entry and collection software for two survey types, residential (RECS) and small business (SBECS).
The tools provide ready-made frameworks for survey questions and data aggregation, which can help reduce costs in expensive data collection processes. User instructions are also available to facilitate accurate use and ensure high quality data collection and outputs, as well as provide guidance towards effective survey program implementation.
Efforts to improve compliance rates
Increased consumer
confidence & purchase
More support for S&L programs
Greater energy savings
More industry
investment in energy efficiency
Lower energy savings
Reduced support for S&L
programsNo level
playing fieldReduced industry
investment & participation
Consumers, press, NGOs become
skeptical
Low attention to compliance
Benefits risks
ENERgy CoNSumPTioN SuRvEy TooLS
moNiToRiNg, vERifiCATioN, ANd ENfoRCEmENT guidEBooK & RESouRCES
Establishing an effective compliance framework using monitoring, verification, and enforcement (MV&E) is critical to safeguarding the credibility of S&L programs and to realizing expected energy savings. CLASP’s MV&E Guidebook, Compliance Counts, written by Mark Ellis & Associates, provides practical information on compliance frameworks based on the experiences of existing S&L programs. It is designed as a manual for policymakers, program administrators, and others involved in the design and implementation of S&L programs worldwide. The MV&E Guidebook is available in English, Chinese, and Russian.
The MV&E Guidebook also demonstrates the importance of effective compliance frameworks in safeguarding current and future energy savings, ensuring a level playing field for industry, and encouraging greater levels of investment and innovation in energy efficient products.
To complement the MV&E Guidebook, CLASP has also developed online MV&E resources—the MV&E Publications Library and MV&E Economy Access—which provide quick and direct access to technical and policy studies, best practices information, and country-specific links and resources.
Figure 11. Compliance enhances S&L benefits and reduces risks

S&L Toolkit
30
Figure 12. Global S&L database use by economy
32% united States
9% Japan8% China7% united Kingdom
4% India4% Taiwan
3% germany
3% France2% Hong Kong
19% 67 Other Economies
9% Thailand
CLASP’s Global S&L Database is a free and easy-to-use policy resource designed to support the research needs of S&L practitioners and policymakers. It provides comprehensive information on S&L regulations in 48 economies around the world, covering Africa, Asia, Europe, the Middle East, North America, Oceania, and South America. These regulations include standards, comparative labels, endorsement labels, and codes of conduct for 17 categories of appliances, equipment, and lighting.
The database allows policymakers and S&L practitioners to:
Compare policies and regulations for defined products across economies;
Explore specific information about these policies, including current status; and
PoLiCy ANALySiS modELiNg SySTEm (PAmS)
An estimate of impacts from any potential policy, both environmental and financial, is critical in guiding decision makers and funding agencies in prioritizing strategies that afford maximum benefit. CLASP and Lawrence Berkeley National Laboratory (LBNL) developed the Policy Analysis Modeling System (PAMS) as an easy-to-use software tool to help local policymakers assess the benefits of energy efficiency S&L programs and identify the most attractive targets for appliances and efficiency levels.
PAMS is an ideal resource for countries with few technical or financial resources. It is a sophisticated Excel spreadsheet that estimates the energy savings and monetary costs of implementing local standards based on factors such as life cycle costs, national energy savings, national financial impacts, and greenhouse gas emissions reductions. If these data are not available, PAMS can generate estimates based on data from over 150 other countries. Conversely, the model can also be customized in several critical areas where country-specific data is available, in order to improve the accuracy of forecasts.
View and understand the legislative framework and S&L history by country and economic region through the Economy Finder feature.
gLoBAL S&L dATABASE
31 To date (2013), 4E has published briefs on standby power, vending machines, clothes dryers, televisions, notebook computers, lighting, air conditioners, washing machines, and refrigerators and freezers. 32 For example, the Mapping & Benchmarking annex has published numerous briefs that compare the product efficiency, S&L policies, test methods, and potential energy savings for a single appliance across several economies, and highlight common trends, challenges, and opportunities.33 The Climate Group, 2012.34 Lighting, air conditioning and fans, space heating, refrigerator-freezers, water heating, clothes washers, clothes dryers, and televisions.

S&L Toolkit
31
List of Contributors
Danish Energy Agency would like to acknowledge the following people and organizations for their contribution to, review of, and invaluable feedback on the Appliance Energy Efficiency Toolkit.
Contributor Affiliation
Amol Phadke Lawrence Berkeley National Laboratory
Anand Gopal Lawrence Berkeley National Laboratory
Christine Egan CLASP
Corinne Schneider CLASP
Debbie Karpay Weyl CLASP
Elisa Lai CLASP
Greg Leventis Lawrence Berkeley National Laboratory
H. Wadhwa Consumer VOICE, India
Ibrahim Soumaila ECOWAS Regional Centre for Renewable Energy and Energy Efficiency
James E. McMahon Independent Expert
Jenny Corry Smith Super-efficient Equipment and Appliance Deployment (SEAD) Initiative Program at CLASP
Jesper Ditlefsen Danish Energy Agency
Karin Reiss ECOWAS Regional Centre for Renewable Energy and Energy Efficiency
Kathleen Callaghy CLASP
Kofi Agyarko Ghana Energy Commission
Mark Ellis Mark Ellis & Associates
Michael McNeil Lawrence Berkeley National Laboratory
Mirka della Cava Independent Expert
My Ton CLASP
Paul Waide Waide Strategic Efficiency
Peter Larsen Danish Energy Agency
Stephane de la Rue du Can Lawrence Berkeley National Laboratory
Stephen Pantano CLASP
Stephen Wiel Independent Expert
Steven Zeng CLASP

S&L Toolkit
32
Acronyms & Abbreviations
Ac Air conditioner
Apec
egee&c
Asia Pacific Economic CooperationExpert Group on Energy Efficiency and Conservation
bee Bureau of Energy Efficiency (India)
cdm Clean Development Mechanism
cFc chlorofluorocarbon
cFl compact fluorescent lamps
deA Danish Energy Agency
dOe Department of Energy (USA)
ecOWAs Economic Cooperation of West African States
ecreee ECOWAS Regional Centre for Renewable Energy and Energy Efficiency
ee energy efficiency
eu European Union
geA Green Energy Agency (Europe)
geF Global Environment Facility
ghg Greenhouse gases
gtcO2e gigatons of carbon dioxide equivalent
gWh gigawatt hours
ieA 4e International Energy Agency Efficient Electrical End-Use Equipment
iec International Electrotechnical Commission
isO International Organization for Standardization
lites.asia Lighting Information and Technical Exchange for Standards
lbnl Lawrence Berkeley National Laboratory (United States)
lctu Danish Low Carbon Transition Unit
led Light-emitting diode
mAceep Market Analysis of China Energy Efficient Products
meps minimum energy performance standards
mrA mutual recognition agreement
mV&e monitoring, verification, and enforcement
nltc National Lighting Test Center (China)
pAms Policy Analysis Modeling System
recs residential energy consumption survey
rmb Renminbi, official currency of the People’s Republic of China
sbecs small business energy consumption survey
seAd Super-efficient Equipment and Appliance Deployment
s&l standards and labels, or standards and labeling
tWh terawatt hour
us United States
usd US dollars, currency