Energy Pathways for Sustainable Development - IIASA
101
1205 Energy Pathways for Sustainable Development Convening Lead Author (CLA) Keywan Riahi (International Institute for Applied Systems Analysis, Austria) Lead Authors (LA) Frank Dentener (Joint Research Center, Italy) Dolf Gielen (United Nations Industrial Development Organization) Arnulf Grubler (International Institute for Applied Systems Analysis, Austria and Yale University, USA) Jessica Jewell (Central European University, Hungary) Zbigniew Klimont (International Institute for Applied Systems Analysis, Austria) Volker Krey (International Institute for Applied Systems Analysis, Austria) David McCollum (University of California, Davis, USA) Shonali Pachauri (International Institute for Applied Systems Analysis, Austria) Shilpa Rao (International Institute for Applied Systems Analysis, Austria) Bas van Ruijven (PBL, Netherlands Environmental Assessment Agency) Detlef P. van Vuuren (PBL, Netherlands Environmental Assessment Agency) Charlie Wilson (Tyndall Centre for Climate Change Research, UK) Contributing Authors (CA) Morna Isaac (PBL, Netherlands Environmental Assessment Agency) Mark Jaccard (Simon Fraser University, Canada) Shigeki Kobayashi (Toyota Central R&D Laboratories, Japan) Peter Kolp (International Institute for Applied Systems Analysis, Austria) Eric D. Larson (Princeton University and Climate Central, USA) Yu Nagai (Vienna University of Technology, Austria) Pallav Purohit (International Institute for Applied Systems Analysis, Austria) Jules Schers (PBL, Netherlands Environmental Assessment Agency) Diana Ürge-Vorsatz (Central European University, Hungary) Rita van Dingenen (Joint Research Center, Italy) Oscar van Vliet (International Institute for Applied Systems Analysis, Austria) Review Editor Granger Morgan (Carnegie Mellon University, USA) 17
Transcript of Energy Pathways for Sustainable Development - IIASA

1205
Energy Pathways for Sustainable Development
Convening Lead Author (CLA) Keywan Riahi (International Institute for Applied Systems Analysis, Austria)
Lead Authors (LA) Frank Dentener (Joint Research Center, Italy) Dolf Gielen (United Nations Industrial Development Organization) Arnulf Grubler (International Institute for Applied Systems Analysis, Austria and Yale University, USA) Jessica Jewell (Central European University, Hungary) Zbigniew Klimont (International Institute for Applied Systems Analysis, Austria) Volker Krey (International Institute for Applied Systems Analysis, Austria) David McCollum (University of California, Davis, USA) Shonali Pachauri (International Institute for Applied Systems Analysis, Austria) Shilpa Rao (International Institute for Applied Systems Analysis, Austria) Bas van Ruijven (PBL, Netherlands Environmental Assessment Agency) Detlef P. van Vuuren (PBL, Netherlands Environmental Assessment Agency) Charlie Wilson (Tyndall Centre for Climate Change Research, UK)
Contributing Authors (CA) Morna Isaac (PBL, Netherlands Environmental Assessment Agency) Mark Jaccard (Simon Fraser University, Canada) Shigeki Kobayashi (Toyota Central R&D Laboratories, Japan) Peter Kolp (International Institute for Applied Systems Analysis, Austria) Eric D. Larson (Princeton University and Climate Central, USA) Yu Nagai (Vienna University of Technology, Austria) Pallav Purohit (International Institute for Applied Systems Analysis, Austria) Jules Schers (PBL, Netherlands Environmental Assessment Agency) Diana Ü rge-Vorsatz (Central European University, Hungary) Rita van Dingenen (Joint Research Center, Italy) Oscar van Vliet (International Institute for Applied Systems Analysis, Austria)
Review Editor Granger Morgan (Carnegie Mellon University, USA)
17

Energy Pathways for Sustainable Development Chapter 17
1206
Contents
Executive Summary . . . . . . . . . . . . . . . . . . . . . . . . . . . . . . . . . . . . . . . . . . . . . . . . . . . . . . . . . . . . . . . . . . . . . . . . . . . . . . . . . . . . . . . . . . . . . . . . . . . . . . . . . . . . . . . . . . . . . . . . . . . . . . . . . . . . . . . . . . . . . . . . . . . . . . . . . . . 1208
17.1 Introduction . . . . . . . . . . . . . . . . . . . . . . . . . . . . . . . . . . . . . . . . . . . . . . . . . . . . . . . . . . . . . . . . . . . . . . . . . . . . . . . . . . . . . . . . . . . . . . . . . . . . . . . . . . . . . . . . . . . . . . . . . . . . . . . . . . . . . . . . . . . . . . . . . . . . . . 1212
17.1.1 Scenarios and Energy Transformations . . . . . . . . . . . . . . . . . . . . . . . . . . . . . . . . . . . . . . . . . . . . . . . . . . . . . . . . . . . . . . . . . . . . . . . . . . . . . . . . . . . . . . . . . . . . . . . . . . . . . . . . . . . . . . . . . . . . 1212
17.1.2 Roadmap of the Chapter . . . . . . . . . . . . . . . . . . . . . . . . . . . . . . . . . . . . . . . . . . . . . . . . . . . . . . . . . . . . . . . . . . . . . . . . . . . . . . . . . . . . . . . . . . . . . . . . . . . . . . . . . . . . . . . . . . . . . . . . . . . . . . . . . . . . . . . . . 1212
17.2 GEA Scenario Logic . . . . . . . . . . . . . . . . . . . . . . . . . . . . . . . . . . . . . . . . . . . . . . . . . . . . . . . . . . . . . . . . . . . . . . . . . . . . . . . . . . . . . . . . . . . . . . . . . . . . . . . . . . . . . . . . . . . . . . . . . . . . . . . . . . . . . . . . . 1213
17.2.1 Scenario Taxonomy . . . . . . . . . . . . . . . . . . . . . . . . . . . . . . . . . . . . . . . . . . . . . . . . . . . . . . . . . . . . . . . . . . . . . . . . . . . . . . . . . . . . . . . . . . . . . . . . . . . . . . . . . . . . . . . . . . . . . . . . . . . . . . . . . . . . . . . . . . . . . . . . . 1213
17.2.2 Branching Points and the GEA Pathways . . . . . . . . . . . . . . . . . . . . . . . . . . . . . . . . . . . . . . . . . . . . . . . . . . . . . . . . . . . . . . . . . . . . . . . . . . . . . . . . . . . . . . . . . . . . . . . . . . . . . . . . . . . . . . . . . 1214
17.2.3 Energy Goals and Targets of the Sustainability Transition . . . . . . . . . . . . . . . . . . . . . . . . . . . . . . . . . . . . . . . . . . . . . . . . . . . . . . . . . . . . . . . . . . . . . . . . . . . . . . . . . . . . . . . . 1215
17.3 The GEA Energy Transition Pathways . . . . . . . . . . . . . . . . . . . . . . . . . . . . . . . . . . . . . . . . . . . . . . . . . . . . . . . . . . . . . . . . . . . . . . . . . . . . . . . . . . . . . . . . . . . . . . . . . . . . . . . . 1220
17.3.1 Economic Growth and Demographic Change . . . . . . . . . . . . . . . . . . . . . . . . . . . . . . . . . . . . . . . . . . . . . . . . . . . . . . . . . . . . . . . . . . . . . . . . . . . . . . . . . . . . . . . . . . . . . . . . . . . . . . . . . . . 1221
17.3.2 Energy Demand and Services . . . . . . . . . . . . . . . . . . . . . . . . . . . . . . . . . . . . . . . . . . . . . . . . . . . . . . . . . . . . . . . . . . . . . . . . . . . . . . . . . . . . . . . . . . . . . . . . . . . . . . . . . . . . . . . . . . . . . . . . . . . . . . . . . . 1221
17.3.3 Energy Supply . . . . . . . . . . . . . . . . . . . . . . . . . . . . . . . . . . . . . . . . . . . . . . . . . . . . . . . . . . . . . . . . . . . . . . . . . . . . . . . . . . . . . . . . . . . . . . . . . . . . . . . . . . . . . . . . . . . . . . . . . . . . . . . . . . . . . . . . . . . . . . . . . . . . . . . . 1229
17.3.4 The GEA Pathways: Energy System Transformations . . . . . . . . . . . . . . . . . . . . . . . . . . . . . . . . . . . . . . . . . . . . . . . . . . . . . . . . . . . . . . . . . . . . . . . . . . . . . . . . . . . . . . . . . . . . . . . . 1238
17.3.5 Energy Investments . . . . . . . . . . . . . . . . . . . . . . . . . . . . . . . . . . . . . . . . . . . . . . . . . . . . . . . . . . . . . . . . . . . . . . . . . . . . . . . . . . . . . . . . . . . . . . . . . . . . . . . . . . . . . . . . . . . . . . . . . . . . . . . . . . . . . . . . . . . . . . . . 1252
17.3.6 Key Features of the Energy Transition . . . . . . . . . . . . . . . . . . . . . . . . . . . . . . . . . . . . . . . . . . . . . . . . . . . . . . . . . . . . . . . . . . . . . . . . . . . . . . . . . . . . . . . . . . . . . . . . . . . . . . . . . . . . . . . . . . . . . 1258
17.4 Access to Modern Energy Carriers and Cleaner Cooking . . . . . . . . . . . . . . . . . . . . . . . . . . . . . . . . . . . . . . . . . . . . . . . . . . . . . . . . . . . . . . . . . . . . 1260
17.4.1 Access to Clean Fuels for Cooking . . . . . . . . . . . . . . . . . . . . . . . . . . . . . . . . . . . . . . . . . . . . . . . . . . . . . . . . . . . . . . . . . . . . . . . . . . . . . . . . . . . . . . . . . . . . . . . . . . . . . . . . . . . . . . . . . . . . . . . . . . 1261
17.4.2 Access to Electricity . . . . . . . . . . . . . . . . . . . . . . . . . . . . . . . . . . . . . . . . . . . . . . . . . . . . . . . . . . . . . . . . . . . . . . . . . . . . . . . . . . . . . . . . . . . . . . . . . . . . . . . . . . . . . . . . . . . . . . . . . . . . . . . . . . . . . . . . . . . . . . . . 1264
17.4.3 Impacts of Access Policies on Energy Demand and Greenhouse Gas Emissions . . . . . . . . . . . . . . . . . . . . . . . . . . . . . . . . . . . . . . . . . . . . . . . . . . . . . . . . . 1266
17.4.4 Summary of the Costs and Impacts of Access Policies . . . . . . . . . . . . . . . . . . . . . . . . . . . . . . . . . . . . . . . . . . . . . . . . . . . . . . . . . . . . . . . . . . . . . . . . . . . . . . . . . . . . . . . . . . . . . . 1267
Chapter 17 Energy Pathways for Sustainable Development
1207
17.5 Energy and the Environment . . . . . . . . . . . . . . . . . . . . . . . . . . . . . . . . . . . . . . . . . . . . . . . . . . . . . . . . . . . . . . . . . . . . . . . . . . . . . . . . . . . . . . . . . . . . . . . . . . . . . . . . . . . . . . . . . . . . . . . 1267
17.5.1 Climate Change . . . . . . . . . . . . . . . . . . . . . . . . . . . . . . . . . . . . . . . . . . . . . . . . . . . . . . . . . . . . . . . . . . . . . . . . . . . . . . . . . . . . . . . . . . . . . . . . . . . . . . . . . . . . . . . . . . . . . . . . . . . . . . . . . . . . . . . . . . . . . . . . . . . . . . 1267
17.5.2 Air Pollution . . . . . . . . . . . . . . . . . . . . . . . . . . . . . . . . . . . . . . . . . . . . . . . . . . . . . . . . . . . . . . . . . . . . . . . . . . . . . . . . . . . . . . . . . . . . . . . . . . . . . . . . . . . . . . . . . . . . . . . . . . . . . . . . . . . . . . . . . . . . . . . . . . . . . . . . . . . 1276
17.6 Energy Security . . . . . . . . . . . . . . . . . . . . . . . . . . . . . . . . . . . . . . . . . . . . . . . . . . . . . . . . . . . . . . . . . . . . . . . . . . . . . . . . . . . . . . . . . . . . . . . . . . . . . . . . . . . . . . . . . . . . . . . . . . . . . . . . . . . . . . . . . . . . . . . . 1283
17.6.1 Introduction . . . . . . . . . . . . . . . . . . . . . . . . . . . . . . . . . . . . . . . . . . . . . . . . . . . . . . . . . . . . . . . . . . . . . . . . . . . . . . . . . . . . . . . . . . . . . . . . . . . . . . . . . . . . . . . . . . . . . . . . . . . . . . . . . . . . . . . . . . . . . . . . . . . . . . . . . . . 1283
17.6.2 Fuels . . . . . . . . . . . . . . . . . . . . . . . . . . . . . . . . . . . . . . . . . . . . . . . . . . . . . . . . . . . . . . . . . . . . . . . . . . . . . . . . . . . . . . . . . . . . . . . . . . . . . . . . . . . . . . . . . . . . . . . . . . . . . . . . . . . . . . . . . . . . . . . . . . . . . . . . . . . . . . . . . . . . . . 1284
17.6.3 End-Use Sectors . . . . . . . . . . . . . . . . . . . . . . . . . . . . . . . . . . . . . . . . . . . . . . . . . . . . . . . . . . . . . . . . . . . . . . . . . . . . . . . . . . . . . . . . . . . . . . . . . . . . . . . . . . . . . . . . . . . . . . . . . . . . . . . . . . . . . . . . . . . . . . . . . . . . . . 1287
17.6.4 Regions . . . . . . . . . . . . . . . . . . . . . . . . . . . . . . . . . . . . . . . . . . . . . . . . . . . . . . . . . . . . . . . . . . . . . . . . . . . . . . . . . . . . . . . . . . . . . . . . . . . . . . . . . . . . . . . . . . . . . . . . . . . . . . . . . . . . . . . . . . . . . . . . . . . . . . . . . . . . . . . . . . 1288
17.6.5 Conclusions on Energy Security . . . . . . . . . . . . . . . . . . . . . . . . . . . . . . . . . . . . . . . . . . . . . . . . . . . . . . . . . . . . . . . . . . . . . . . . . . . . . . . . . . . . . . . . . . . . . . . . . . . . . . . . . . . . . . . . . . . . . . . . . . . . . . . 1289
17.7 Synergies and Multiple Benefi ts of Achieving Different Energy Objectives Simultaneously . . . . . . . . . . . . . . . . . . . . . . . . . . . . . . . . . . . . . . . . . . . . . . . . . . . . . . . . . . . . . . . . . . . . . . . . . . . . . . . . . . . . . . . . . . . . . . . . . . . . . . . . . . . . . . . . . . . . . . . . . . . 1290
17.7.1 Characterization of the Full Scenario Space . . . . . . . . . . . . . . . . . . . . . . . . . . . . . . . . . . . . . . . . . . . . . . . . . . . . . . . . . . . . . . . . . . . . . . . . . . . . . . . . . . . . . . . . . . . . . . . . . . . . . . . . . . . . 1291
17.7.2 Synergies between Objectives . . . . . . . . . . . . . . . . . . . . . . . . . . . . . . . . . . . . . . . . . . . . . . . . . . . . . . . . . . . . . . . . . . . . . . . . . . . . . . . . . . . . . . . . . . . . . . . . . . . . . . . . . . . . . . . . . . . . . . . . . . . . . . . . 1294
17.7.3 Conclusion . . . . . . . . . . . . . . . . . . . . . . . . . . . . . . . . . . . . . . . . . . . . . . . . . . . . . . . . . . . . . . . . . . . . . . . . . . . . . . . . . . . . . . . . . . . . . . . . . . . . . . . . . . . . . . . . . . . . . . . . . . . . . . . . . . . . . . . . . . . . . . . . . . . . . . . . . . . . . 1299
References . . . . . . . . . . . . . . . . . . . . . . . . . . . . . . . . . . . . . . . . . . . . . . . . . . . . . . . . . . . . . . . . . . . . . . . . . . . . . . . . . . . . . . . . . . . . . . . . . . . . . . . . . . . . . . . . . . . . . . . . . . . . . . . . . . . . . . . . . . . . . . . . . . . . . . . . . . . . . . . . . . . . . . . . . . . 1301

Energy Pathways for Sustainable Development Chapter 17
1208
Executive Summary
Chapter 17 explores possible transformational pathways of the future global energy system with the overarching aim of assessing the technological feasibility as well as the economic implications of meeting a range of sustainability objectives simultaneously. As such, it aims at the integration across objectives, and thus goes beyond earlier assessments of the future energy system that have mostly focused on either specific topics or single objectives. Specifically, the chapter assesses technical measures, policies, and related costs and benefits for meeting the objectives that were identified in Chapters 2 to 6 , including:
providing almost universal access to affordable clean cooking and electricity for the poor • 1 ; limiting air pollution and health damages from energy use; • improving energy security throughout the world; and • limiting climate change. •
The assessment of future energy pathways in this chapter shows that it is technically possible to achieve improved energy access, air quality, and energy security simultaneously while avoiding dangerous climate change. In fact, a number of alternative combinations of resources, technologies, and policies are found capable of attaining these objectives. From a large ensemble of possible transformations, three distinct groups of pathways (GEA-Supply, GEA-Mix, and GEA-Efficiency) have been identified and analyzed. Within each group, one pathway has been selected as “illustrative” in order to represent alternative evolutions of the energy system toward sustainable development. The pathway groups, together with the illustrative cases, depict salient branching points for policy implementation and highlight different degrees of freedom and different routes to the sustainability objectives. The characteristics of the pathways thus differ significantly from each other, depending on the choices made about technologies, infrastructures, behaviors, and lifestyles, as well as on future priorities with respect to the portfolio of supply- and demand-side policies. These choices, in turn, have broad implications for issues of technological availability and scale-up, institutional and capacity requirements, and financing needs.
The analysis in this chapter shows that achieving all the objectives simultaneously remains an extremely ambitious task. Although a successful transformation is found to be technically possible, it will require the rapid introduction of policies and fundamental political changes toward concerted and coordinated efforts to integrate global concerns, such as climate change, into local and national policy priorities (such as health and pollution, energy access, and energy security). An integrated policy design will thus be necessary in order to identify cost-effective “win-win” solutions that can deliver on multiple objectives simultaneously.
The transition can be achieved from different levels of energy demand as well as through alternative combinations of energy resources. An in-depth modeling sensitivity analysis shows, however, that efficiency improvements throughout the energy system are the most important options to achieve the energy transformation toward a more sustainable future. Under assumptions of high energy efficiency (the GEA-Efficiency pathways), it is feasible to achieve the transformation under any of the analyzed supply-side portfolio restrictions. This includes in particular the feasibility of the transformation in absence of carbon dioxide (CO 2 ) capture and storage in combination with the phase-out of nuclear as well as cases without bioenergy with carbon capture and storage, or without relying on carbon sink management. Under the contrary assumption of high energy demand (the GEA-Supply pathways), however, the rapid and simultaneous growth of many advanced technologies is required. For instance, with high energy demand the sustainability targets remain out of reach if the supply of intermittent renewables or carbon capture and storage (CCS) is restricted, thus making these two “options” in effect mandatory in the absence of important improvements on the demand side. Assuming a nuclear phaseout, on the other hand, was found compatible with the transformation also at high energy demand.
1 The target is “almost universal access” because reaching the remotest rural populations is exceedingly expensive.

Chapter 17 Energy Pathways for Sustainable Development
1209
Despite the flexibility and choices available to direct the energy system transformation, a large number of robust and nondiscretionary components of an energy transition would need to begin being implemented now. These are referred to in the chapter as necessary conditions, summarizing the commonalities across all pathways to achieve the objectives. They include the following:
Future improvements of at least the historical rate of change in the energy intensity of the economy, to reduce •the risk that the sustainability objectives become unreachable. Further improvements in energy intensity, entailing aggressive efforts to improve end-use efficiency, increase the flexibility of supply and the overall cost-effectiveness of the energy system transformation.
A broad portfolio of supply-side options, focusing on low-carbon energy from non-combustible renewables, •bioenergy, nuclear energy, and CCS, achieving low-carbon shares in primary energy of at least 60–80% by 2050. These include:
strong growth in renewable energy beginning immediately and reaching 165–650 exajoules (EJ) of primary –energy by 2050;
an increasing requirement for storage technologies to support system integration of intermittent wind and solar –energy;
growth in bioenergy in the medium term to 80–140 EJ by 2050 (including extensive use of agricultural residues –and second-generation bioenergy to mitigate adverse impacts on land use and food production);
nuclear energy plays an important role in the supply-side portfolio in some transition pathways, but the –assessment of pathways with “restricted” portfolios suggests that it is also feasible to phase out nuclear and still meet the sustainability targets; and
fossil CCS as an optional bridging or transitional technology in the medium term, and increasing the contribution –of biomass with CCS in the long term, unless energy demand is high, in which case cumulative storage of up to 250 gigatons of carbon dioxide (GtCO 2 ) by 2050 would be needed in order to limit global average temperature change to below 2°C.
Aggressive decarbonization in the electricity sector, reaching low-carbon shares of 75% to almost 100% by 2050; •phase-out of conventional coal power (i.e., without CCS); natural gas power could act as a bridging or transitional technology in the short to medium term.
Enhancements of the transportation sector through electrification or the introduction of hydrogen vehicles to •improve end-use efficiency, increase the flexibility of supply, and improve the overall cost-effectiveness of the energy system transformation.
A peak in oil use in the transportation sector by 2030, followed by a phase-out over the medium term; a strong •growth of liquid biofuels in the short to medium term, after which the mix of liquid and gaseous fuels depends on transportation system choices and technological breakthroughs.
Availability of energy resources (fossil and non-fossil) does not limit deployment on an aggregated global scale but •may pose important constraints regionally, particularly in Asia, where energy demand is expected to grow rapidly.
The analysis of the GEA pathways shows, similarly to earlier assessments, that the transformation of the energy system would require dedicated efforts to increase global energy-related investments to between US$1.7 trillion and US$2.2 trillion annually, compared with about US$1.3 trillion in annual investment today. Out of this total, about US$300 to US$550 billion of efficiency-related investments are required on the demand-side of the pathways. This includes only the efficiency-increasing part of the investment to improve energy intensity beyond historical improvement rates. The full demand-side investments into all energy components of appliances might thus be significantly higher. Total investments into energy supply and efficiency-related investments at the demand-side correspond in sum to a small fraction

Energy Pathways for Sustainable Development Chapter 17
1210
(about 2%) of global gross domestic product (GDP). Future transitions with a focus on energy efficiency achieve the targets at more modest cost and thus represent the lower bound of the investment range.
Meeting the sustainability objectives will require the further tightening of present and planned legislation and the introduction of new policies:
• Universal access to electricity and clean cooking requires the rapid shift from the use of traditional biomass to cleaner fuels and/or clean cooking technologies. This is feasible over the next 20 years, provided that sufficient financial resources are made available for investments on the order of US$36 billion to US$41 billion/year (half of it in Africa).
• Pollution control measures across all sectors need to be tightened beyond those in present and planned legislation so that the majority of the world population is meeting the World Health Organization (WHO) air quality guideline (annual PM2.5 (particulate matter less than 2.5 μg in size) concentration < 10 μg/m 3 by 2030), while remaining populations are staying well within the WHO Tier I-III levels (15–35 μg/m 3 by 2030). Estimated global costs to meet the air pollution target are about US$200 billion to US$350 billion/year to 2030 (about 10–20% of energy costs). This estimate accounts for ancillary benefits of stringent climate change mitigation policies that reduce overall pollution control costs by about 50–65%.
• Limiting global temperature change to less than 2°C over preindustrial levels (with a probability of > 50%) is achieved through rapid reductions of global CO 2 emissions from the energy sector, which peak around 2020 and decline thereafter to 30–70% below 2000 emissions levels in 2050, reaching finally almost zero or even negative CO 2 emissions in the second half of the century.
• Enhanced energy security for regions can be achieved by increasing the use of domestic energy sources and by increasing the diversity and resilience of energy systems. A focus on energy efficiency improvement and renewable deployment increases the share of domestic (national or regional) supply in primary energy by a factor of 2 and thus significantly decreases import dependency. At the same time, the share of oil in global energy trade is reduced from the present 75% to under 40% and no other fuel assumes a similarly dominant position in the future.
Achieving society’s near-term pollution reduction and health objectives is greatly furthered by climate change mitigation, and similarly, stringent climate policy can help further the energy security goals of individual countries. The simultaneous achievement of climate change mitigation, energy security, and air pollution control comes thus at a significantly reduced total energy cost when the multiple economic benefits of each are properly accounted for. This concerns:
the added costs of future air pollution control measures at the global level, which can be cut significantly (by up to •US$500 billion annually to 2030) in the case of stringent climate policy;
energy security costs, which can be substantially decreased under increasingly stringent levels of decarbonization, •approaching almost zero for very stringent climate policies and translating to an annual cost savings of about US$130 billion annually in 2030; and
subsidies of carbon-intensive oil products and coal amount at present to about US$132 billion to •US$240 billion/year. Rapid decarbonization of the energy system reduces the need for these subsidies by about US$70 billion to US$130 billion/year by 2050.
The transformation toward the sustainability objectives offers multiple benefits that cannot be assigned monetary values at a detailed level, but are nevertheless important to account for. The following are some important nonpecuniary benefits of the transformation:
Chapter 17 Energy Pathways for Sustainable Development
1211
Universal access to electricity and clean cooking increases the productivity of the poorest people and thus • contributes to overall well-being and more equitable economic growth. In addition, such access results in significant health benefits of more than 24 million disability-adjusted life years (DALYs) saved in 2030.
Stringent pollution control policies to meet the WHO air quality guidelines for the majority of the world population •result in health benefits on the order of 20 million DALYs saved in 2030.
Limiting climate change to less than 2°C compared with preindustrial times reduces the risks of a number of •different types of climate impacts, summarized by five main reasons for concern: the risk to unique or threatened systems; the risk of more frequent episodes of extreme weather; an inequitable distribution of impacts (given that some regions, countries, and populations may face greater harm from climate change); large aggregate damages (assessing comprehensive measures of impacts through efforts to aggregate into a single metric, such as monetary damages); and the risk of large-scale discontinuities (e.g., tipping points associated with very large impacts, such as the deglaciation of the West Antarctic or the Greenland ice sheet).
Rapid decarbonization and thus stronger reliance on efficiency improvements and low-carbon energy (e.g., • renewables) may create new job opportunities, thus providing additional economic benefits.

Energy Pathways for Sustainable Development Chapter 17
1212
17.1 Introduction
17.1.1 Scenarios and Energy Transformations
Chapter 17 represents an integrative module of the Global Energy Assessment (GEA). It builds on Clusters I and II of this report to shed light on the question of how future energy systems can address mul-tiple challenges and sustainability goals, ranging from issues of energy access to climate change mitigation. Specifically, the analysis of inte-grative future energy pathways presented in this chapter aims at illus-trating how the energy system components, technologies, and resources described in Cluster II can be combined to address the challenges and realize the sustainability goals identified in Cluster I. The resulting energy transitions achieve multiple goals simultaneously and include various combinations of policy measures and instruments as well as lifestyle and value changes. The results of this scenario analysis thus prepare the ground for Cluster IV, which assesses policy packages and institutional and governance changes for realizing the different sustainable futures.
The two main objectives of developing the transformational pathways are, first, to provide a quantitative and qualitative framework for the identification of policies and measures for a transition toward an energy system that supports sustainable development, and second, to facilitate the integration of diverse energy issues and consistency across the dif-ferent chapters of the GEA.
The existing literature contains a large number of scenarios, follow-ing different traditions in scenario design, development process and objectives. Broadly, one can distinguish between scenarios along “quali-tative versus quantitative” lines or along “normative versus descrip-tive” lines. Whereas quantitative scenarios provide detailed numerical information about underlying processes and dynamics, qualitative scenarios aim at a textual and narrative description of how the future might unfold, thus providing an overarching story (see, e.g., Schwartz, 1991 ). A few scenario exercises have combined the two traditions and developed quantitative scenarios with so-called underlying storylines (among the first of which were those in the IPCC (Intergovernmental Panel on Climate Change) Special Report on Emissions Scenarios (SRES) (Nakicenovic and Swart, 2000 ) and the scenarios developed by the Millennium Ecosystem Assessment (Carpenter and Pingali, 2005 ). Descriptive scenarios usually aim at exploring a wide scenario space and thus improving our understanding of future uncertainties (given the variation of underlying assumptions about driving forces). Prominent examples include the IPCC reference greenhouse gas (GHG) emissions scenarios, such as the IS92 (Leggett et al., 1992 ; Pepper et al., 1992 ) and the SRES. Normative scenarios, by contrast, explore the underlying dynamics of change in order to achieve specific desirable outcomes or targets, usually assuming the deployment of a certain set of measures or policies. Consequently, normative scenarios usually do not aim at exploring the whole uncertainty space of possible future developments, but rather focus on the main characteristics of the transition that are considered necessary to achieve specific objectives.
Although various combinations of the above scenario designs are pos-sible, a descriptive or a qualitative scenario design would not be suf-ficient to address the main aim of the GEA scenario analysis, which is to identify specific measures and policies that would enable the trans-formation of the energy system. Instead the GEA adopts a combination of a normative and a quantitative scenario approach, whereby specific targets for various energy objectives are defined and formal modeling approaches are used to quantify how, over what time frame, and at what costs those objectives can be achieved.
The GEA energy transition pathways presented in this chapter are designed to describe transformative changes toward a more sustainable future. A specific feature of these pathways is that they simultaneously achieve normative goals related to all major energy challenges, including the environmental impacts of energy conversion and use, energy secu-rity, and how to provide access to clean and affordable energy services for growing populations and higher standards of living (particularly for the world’s poorest 3–4 billion people). Emphasis is given to the identi-fication of potential synergies, or in other words, of integrated solutions and “win-win” strategies in addressing multiple energy objectives at the same time. One possible way of understanding the GEA pathways is to regard them as alternative interpretations of one overarching GEA scenario in which the energy system is transformed under normative, sustainable goals. The pathways highlight different degrees of freedom and routes to these goals.
17.1.2 Roadmap of the Chapter
The chapter is structured as follows ( Figure 17.1 ). First, the GEA scen-ario logic and taxonomy are introduced, followed by assumptions about the main sustainability objectives and targets as defined by various chapters of Cluster I of the report. Next, the main characteristics of
Scenario Taxonomy
(Sec�on 17.2.1)
Branching Points
(Sec�on 17.2.2)
Sustainability Objec�ves &
Targets(Sec�on 17.2.3)
Energy Demand
(Sec�on 17.3.2)
Energy Supply
(Sec�on 17.3.3)
Energy System
Transfor-ma�ons
(Sec�on 17.3.4)
Investments &
Policy Mechanisms(Sec�on 17.3.5)
Transforma�on Pathways
Implica�ons for Objec�ves
Energy Access(Sec�on 17.4)
Climate Change & Air pollu�on
(Sec�on 17.5.1 & 17.5.2)
Energy Security(Sec�on 17.6)
IntegratedSolu�ons
&Synergies
(Sec�on 17.7)
Figure 17.1 | Roadmap of Chapter 17 .
Chapter 17 Energy Pathways for Sustainable Development
1213
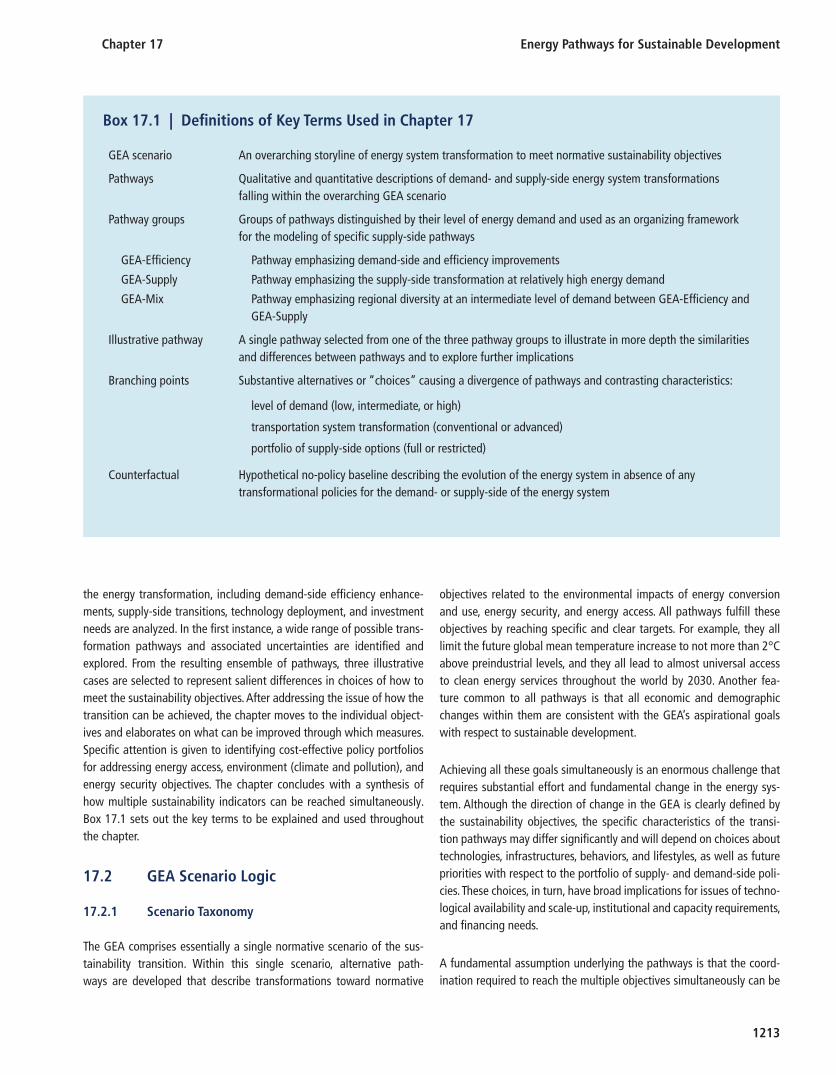
the energy transformation, including demand-side efficiency enhance-ments, supply-side transitions, technology deployment, and investment needs are analyzed. In the first instance, a wide range of possible trans-formation pathways and associated uncertainties are identified and explored. From the resulting ensemble of pathways, three illustrative cases are selected to represent salient differences in choices of how to meet the sustainability objectives. After addressing the issue of how the transition can be achieved, the chapter moves to the individual object-ives and elaborates on what can be improved through which measures. Specific attention is given to identifying cost-effective policy portfolios for addressing energy access, environment (climate and pollution), and energy security objectives. The chapter concludes with a synthesis of how multiple sustainability indicators can be reached simultaneously. Box 17.1 sets out the key terms to be explained and used throughout the chapter.
GEA scenario An overarching storyline of energy system transformation to meet normative sustainability objectives
Pathways Qualitative and quantitative descriptions of demand- and supply-side energy system transformations falling within the overarching GEA scenario
Pathway groups Groups of pathways distinguished by their level of energy demand and used as an organizing framework for the modeling of specifi c supply-side pathways
GEA-Effi ciency Pathway emphasizing demand-side and effi ciency improvements
GEA-Supply Pathway emphasizing the supply-side transformation at relatively high energy demand
GEA-Mix Pathway emphasizing regional diversity at an intermediate level of demand between GEA-Effi ciency and GEA-Supply
Illustrative pathway A single pathway selected from one of the three pathway groups to illustrate in more depth the similarities and differences between pathways and to explore further implications
Branching points
Counterfactual
Substantive alternatives or “choices” causing a divergence of pathways and contrasting characteristics:
level of demand (low, intermediate, or high)
transportation system transformation (conventional or advanced)
portfolio of supply-side options (full or restricted)
Hypothetical no-policy baseline describing the evolution of the energy system in absence of any transformational policies for the demand- or supply-side of the energy system
Box 17.1 | Defi nitions of Key Terms Used in Chapter 17
17.2 GEA Scenario Logic
17.2.1 Scenario Taxonomy
The GEA comprises essentially a single normative scenario of the sus-tainability transition. Within this single scenario, alternative path-ways are developed that describe transformations toward normative
objectives related to the environmental impacts of energy conversion and use, energy security, and energy access. All pathways fulfill these objectives by reaching specific and clear targets. For example, they all limit the future global mean temperature increase to not more than 2°C above preindustrial levels, and they all lead to almost universal access to clean energy services throughout the world by 2030. Another fea-ture common to all pathways is that all economic and demographic changes within them are consistent with the GEA’s aspirational goals with respect to sustainable development.
Achieving all these goals simultaneously is an enormous challenge that requires substantial effort and fundamental change in the energy sys-tem. Although the direction of change in the GEA is clearly defined by the sustainability objectives, the specific characteristics of the transi-tion pathways may differ significantly and will depend on choices about technologies, infrastructures, behaviors, and lifestyles, as well as future priorities with respect to the portfolio of supply- and demand-side poli-cies. These choices, in turn, have broad implications for issues of techno-logical availability and scale-up, institutional and capacity requirements, and financing needs.
A fundamental assumption underlying the pathways is that the coord-ination required to reach the multiple objectives simultaneously can be

Energy Pathways for Sustainable Development Chapter 17
1214
achieved. The pathways thus illustrate the extent of coordination that is necessary and the benefits of policy integration across local and global concerns. By doing so, they inform decision making about the impacts of successful policy implementation. They do not, however, aim at develop-ing recommendations of how the favorable political environment that is also necessary for successful policy coordination and implementation should be achieved (see Chapters 22 and 24 ).
The main aim of the GEA pathways is thus to provide a better understand-ing of what combination of measures, over which time frames and at what costs, is needed to deliver the necessary solutions. Although some combination of both supply- and demand-side measures is needed to transform the energy system, emphasis on one side or the other consti-tutes an important point of divergence between different policy choices that may drive the energy system in alternative directions. Thus, a critical factor is to what extent demand-side efficiency measures, together with lifestyle and behavioral changes, can reduce the amount of energy used for mobility, housing, and industrial services, and thus help fulfill the GEA’s aspirational goals across virtually the whole range of sustainabil-ity objectives. If energy demand is low, any of a number of alternative supply-side configurations might be able to fulfill the goals. By contrast, a lower emphasis on reducing energy demand will require a much more rapid expansion of a broader portfolio of supply-side options. Hence, the successful implementation of demand-side policies increases the flex-ibility of supply-side options, and, vice versa, more rapid transformation of the supply side increases flexibility on the demand side.
Figure 17.2 illustrates this concept, which is the logical basis of the over-arching GEA scenario and of the different GEA pathways. Three GEA pathway groups, labeled GEA-Efficiency, GEA-Mix, and GEA-Supply, are constructed to represent different emphases in terms of demand-side and supply-side changes. Each group varies in particular with respect to assumptions about the comprehensiveness of demand-side policies to enhance efficiency, leading to pathways of comparatively low energy demand (GEA-Efficiency), intermediate demand (GEA-Mix), and high demand (GEA-Supply). Within each group, a range of alternative path-ways for the supply-side transformation are explored. These include a large diversity of supply portfolios in the GEA-Efficiency group of path-ways, exploring, for example, the implications of the transformation with limited contributions of either nuclear, carbon capture and storage (CCS), or renewable technologies. In contrast, the GEA-Supply pathways involve much less flexibility with respect to supply-side measures, as most options need to expand pervasively and successfully, given the assumed high level of demand. By the same token, the GEA-Supply path-ways show the most flexibility on the demand side of the energy system, requiring, for example, a much less pervasive introduction of efficiency measures to reduce energy demand for services. The pathways thus explore not only alternative combinations of supply- and demand-side policy portfolios, but also different choices with respect to overall strat-egy and level of implementation. In this context, the GEA-Mix pathways explore the degrees of freedom offered by more diverse energy systems, from resource extraction to services delivered to end users. The emphasis
of GEA-Mix is on the diversity of the energy supply mix, to enhance the system’s resilience against innovation failures or technology shocks. This emphasis also implies that the GEA-Mix group of pathways is not neces-sarily intermediate between the other two groups in terms of other sali-ent scenario characteristics (e.g., the required policy portfolio, 2 costs, fuel choices, or deployment of individual technologies).
17.2.2 Branching Points and the GEA Pathways
Many alternative GEA pathways fulfill the normative objectives set out for the global energy system. Moving from these objectives to a specific pathway entails three critical choices or “branching points.” The first branching point involves a choice among alternative levels of energy demand and efficiency improvements, leading to distinct pathway groups of low, high, and intermediate demand (GEA-Efficiency, GEA-Supply, and GEA-Mix, respectively).
Another branching point explores alternative transformations on the supply side with the main aim of testing the flexibility of different supply-side configurations to fulfill the GEA sustainability objectives, given the levels of energy demand resulting from the choice at the first branching point. One aim was specifically to use the GEA Integrated Assessment Models to explore whether any of the supply options were mandatory.
Efficiency Improvement
Supp
ly T
rans
form
a�on
GEA-Supply
GEA-Mix
GEA-Efficiency
supply-side flexibility
Figure 17.2 | Schematic illustration of the GEA pathways. The different pathways (GEA-Supply, GEA-Mix, and GEA-Effi ciency) explore alternative combinations of effi -ciency improvements and supply-side transformations to achieve ambitious targets for sustainable development. The ambitiousness of the targets defi nes the feasibil-ity frontier for the combinations of supply and effi ciency measures. High levels of effi ciency improvements, as depicted by the GEA-Effi ciency pathways, increase the supply-side fl exibility to reach the targets, and vice versa, the rapid transformation of supply increases the fl exibility for the required effi ciency improvements to limit energy demand.
2 The emphasis on policy in GEA-Mix is on developing and maintaining a diversity of demand- and supply-side options through a diversity of policy choices.
Chapter 17 Energy Pathways for Sustainable Development
1215
To do this, constraints were set on the portfolio of supply-side options by prohibiting or limiting the availability of specific technologies, including nuclear, CCS, biomass, and other renewables.
A third branching point, whose importance was revealed by this supply-side analysis, concerns changes in the transportation system. A “conven-tional” transportation system relying on liquid fuels has substantively different implications for supply flexibility than an “advanced” system dominated by electric or hydrogen-powered vehicles. Although any major transformation in an end-use sector that entails fuel switching will impact the energy supply, the magnitude of the impact of such a transformation in the transportation system alone warranted its inclu-sion as an explicit branching point.
The sequencing of these branching points is important and reflects a central tenet of an integrated, systemic approach to efficient environ-mental design that is equally applicable to wider technological systems (von Weizs ä cker et al., 1997 ). In the context of energy systems, it is the demand for energy services such as mobility, heating, and industrial processes that drives the system. Hence, systems design should begin with the demand for energy services, emphasizing efficiency improve-ments and other means of reducing demand. This “sizes” the overall system and forms the basis for exploring supply-side options to meet this demand.
Whereas the first branching point thus addresses the main question of which level of resources needs to be mobilized in order to make the provision of energy services more efficient as well as reduce overall demand for those services, the other two branching points address issues of technological risk and uncertainty related to potential barriers to the deployment of specific supply technologies, which would hinder their adoption at full scale. These barriers might include, for example, the high investment requirements of a hydrogen distribution and refuel-ing infrastructure, system constraints on the scale-up of specific tech-nologies (e.g., integrating large amounts of power from intermittent renewable energy sources into electricity grids), potential public oppos-ition (e.g., to the widespread deployment of CCS or nuclear power), and other specific risks of individual technologies (e.g., proliferation in the case of nuclear).
The branching points also depict irreversibilities, “lock-ins,” and path dependencies within the system, reflecting the fact that once techno-logical change is initiated in a particular direction, it becomes increas-ingly difficult to change its course. A prominent historical example of lock-in is the success of the internal combustion engine; in the same way, the two branches for the transportation sector – toward either electric or hydrogen-powered vehicles or clean liquid fuels – depict two alternative and not easily reversible directions of technological change for the future.
These branching points generate a wide range of alternative GEA pathways exploring different interactions between possible energy
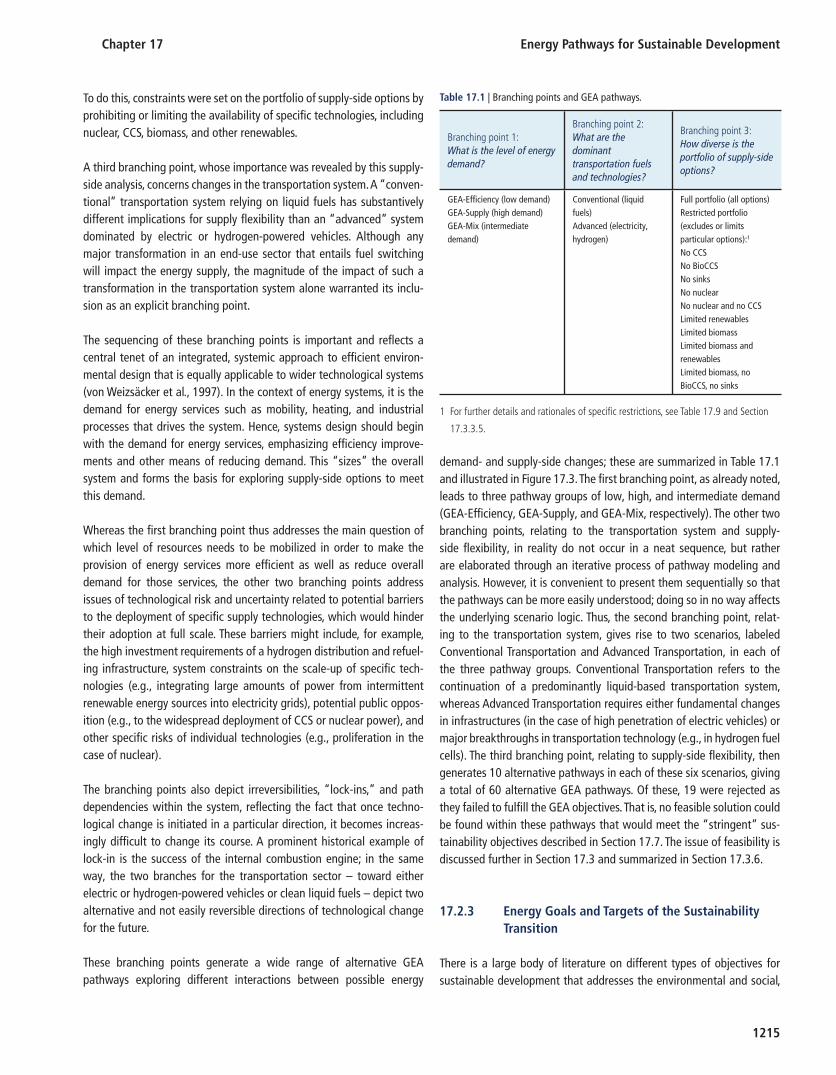
demand- and supply-side changes; these are summarized in Table 17.1 and illustrated in Figure 17.3 . The first branching point, as already noted, leads to three pathway groups of low, high, and intermediate demand (GEA-Efficiency, GEA-Supply, and GEA-Mix, respectively). The other two branching points, relating to the transportation system and supply-side flexibility, in reality do not occur in a neat sequence, but rather are elaborated through an iterative process of pathway modeling and analysis. However, it is convenient to present them sequentially so that the pathways can be more easily understood; doing so in no way affects the underlying scenario logic. Thus, the second branching point, relat-ing to the transportation system, gives rise to two scenarios, labeled Conventional Transportation and Advanced Transportation, in each of the three pathway groups. Conventional Transportation refers to the continuation of a predominantly liquid-based transportation system, whereas Advanced Transportation requires either fundamental changes in infrastructures (in the case of high penetration of electric vehicles) or major breakthroughs in transportation technology (e.g., in hydrogen fuel cells). The third branching point, relating to supply-side flexibility, then generates 10 alternative pathways in each of these six scenarios, giving a total of 60 alternative GEA pathways. Of these, 19 were rejected as they failed to fulfill the GEA objectives. That is, no feasible solution could be found within these pathways that would meet the “stringent” sus-tainability objectives described in Section 17.7 . The issue of feasibility is discussed further in Section 17.3 and summarized in Section 17.3.6 .
17.2.3 Energy Goals and Targets of the Sustainability Transition
There is a large body of literature on different types of objectives for sustainable development that addresses the environmental and social,
Table 17.1 | Branching points and GEA pathways.
Branching point 1: What is the level of energy demand?
Branching point 2: What are the dominant transportation fuels and technologies?
Branching point 3: How diverse is the portfolio of supply-side options?
GEA-Effi ciency (low demand) GEA-Supply (high demand) GEA-Mix (intermediate demand)
Conventional (liquid fuels) Advanced (electricity, hydrogen)
Full portfolio (all options) Restricted portfolio (excludes or limits particular options): 1 No CCS No BioCCS No sinks No nuclear No nuclear and no CCS Limited renewables Limited biomass Limited biomass and renewables Limited biomass, no BioCCS, no sinks
1 For further details and rationales of specifi c restrictions, see Table 17.9 and Section
17.3.3.5 .

Energy Pathways for Sustainable Development Chapter 17
1216
as well as the economic, dimensions of sustainability (Hirschberg et al., 2007 ; Vera and Langlois, 2007 ). This section does not intend to be comprehensive with respect to all these dimensions but instead focuses on the main energy challenges, and thus on selected objectives that are directly or indirectly affected by energy use. The targets identified here thus refer only to the necessary changes in local and global energy systems; much more is required in other sectors of societies for overall sustainability to be realized.
The definition of the targets builds upon the assessment of the objec-tives presented in the chapters of Cluster I of this report. Their selection has, to the extent possible, been guided by agreements and aspirations expressed by the international community or by United Nations actions and resolutions.
The targets are of central importance, since they define the ambitious-ness and the magnitude and pace of the required transformation. The targets are thus major drivers of the pathways, defining the policy
stringency and portfolio of measures to respond to the energy chal-lenges (see Sections 17.3 to 17.7 ). The model-based assessment in this chapter focuses predominantly on the technological feasibility, required policies, and associated costs and benefits of reaching the targets. The political feasibility of the assessed pathways will depend, in addition, on whether international and regional agreements for the implementation of the policies are put in place (see Chapters 22 and 26).
Table 17.2 summarizes the main target levels. These are used in the analysis of pathways to sustainability as the main boundary conditions or formal constraints in the integrated assessment modeling frame-works MESSAGE and IMAGE (see Box 17.2 ). The targets are defined in quantitative terms and prescribe a specific time schedule for meeting certain goals. They cover goals for all four principal energy challenges: energy access, air pollution and health, climate change, and energy security. In addition to these goals, the GEA also adopted adequate energy services to support economic growth as a normative goal (see Chapter 6 ).
High
demand
Intermediate
demand
Low
demand
GEA-Mix
Branching point:Efficiency
Branching point:Transportation
Branching point:Supply
Conventional
Transport
Advanced
Transport
Conventional
Transport
Advanced
Transport
Conventional
Transport
Advanced
Transport
n=2
n=6
n=6
n=7
n=10
n=10
Supp
ly-s
ide
Fl
exib
ility
Dem
and-
side
Fl
exib
ility
Feasible supply-side transitions
(primary energy by 2050)
n = number of feasible pathways (≤ 10)
Figure 17.3 | Schematic illustration of the GEA pathways and the three branching points. The scenario setup features alternative choices for the combination of demand-side effi ciency improvements and supply-side transformations, describing alternative policy emphases that would enable the transformation of the energy system. The pie charts represent primary energy portfolios of feasible transformation pathways under different branching point assumptions.
Chapter 17 Energy Pathways for Sustainable Development
1217
Box 17.2 | Scenario Development Process
The GEA scenarios were developed in parallel by two integrated assessment modeling frameworks and through an iterative and participatory process so as to achieve integration across various chapters of the GEA. Figure 17.4 illustrates the scenario development process, showing the fl ow of information from individual chapters to the scenario development team and the iterations across various knowledge clusters.
Important inputs to the GEA scenarios include quantitative technoeconomic information such as technology costs, energy resources, and potentials provided by other GEA clusters. In addition, a series of workshops and a scenario questionnaire were prepared by the GEA writing team and external experts to solicit input for defi ning the main characteristics of the GEA scenario taxonomy and the set of objectives for a sustainable energy system with specifi c targets and timelines. These inputs are used by two modeling frameworks for the development of the GEA pathways:
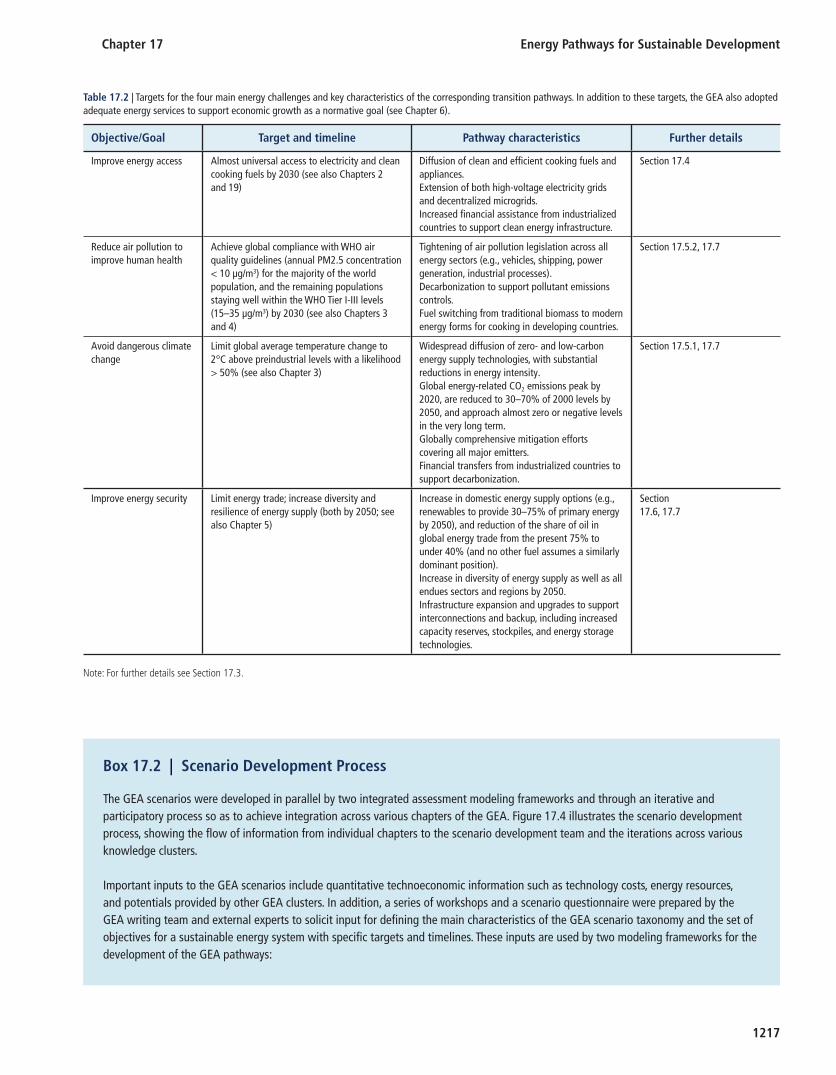
Table 17.2 | Targets for the four main energy challenges and key characteristics of the corresponding transition pathways. In addition to these targets, the GEA also adopted adequate energy services to support economic growth as a normative goal (see Chapter 6 ).
Objective/Goal Target and timeline Pathway characteristics Further details
Improve energy access Almost universal access to electricity and clean cooking fuels by 2030 (see also Chapters 2 and 19 )
Diffusion of clean and effi cient cooking fuels and appliances. Extension of both high-voltage electricity grids and decentralized microgrids. Increased fi nancial assistance from industrialized countries to support clean energy infrastructure.
Section 17.4
Reduce air pollution to improve human health
Achieve global compliance with WHO air quality guidelines (annual PM2.5 concentration < 10 μg/m3) for the majority of the world population, and the remaining populations staying well within the WHO Tier I-III levels (15–35 μg/m3) by 2030 (see also Chapters 3 and 4 )
Tightening of air pollution legislation across all energy sectors (e.g., vehicles, shipping, power generation, industrial processes). Decarbonization to support pollutant emissions controls. Fuel switching from traditional biomass to modern energy forms for cooking in developing countries.
Section 17.5.2, 17.7
Avoid dangerous climate change
Limit global average temperature change to 2°C above preindustrial levels with a likelihood > 50% (see also Chapter 3 )
Widespread diffusion of zero- and low-carbon energy supply technologies, with substantial reductions in energy intensity. Global energy-related CO 2 emissions peak by 2020, are reduced to 30–70% of 2000 levels by 2050, and approach almost zero or negative levels in the very long term. Globally comprehensive mitigation efforts covering all major emitters . Financial transfers from industrialized countries to support decarbonization .
Section 17.5.1, 17.7
Improve energy security Limit energy trade; increase diversity and resilience of energy supply (both by 2050; see also Chapter 5 )
Increase in domestic energy supply options (e.g., renewables to provide 30–75% of primary energy by 2050), and reduction of the share of oil in global energy trade from the present 75% to under 40% (and no other fuel assumes a similarly dominant position). Increase in diversity of energy supply as well as all endues sectors and regions by 2050. Infrastructure expansion and upgrades to support interconnections and backup, including increased capacity reserves, stockpiles, and energy storage technologies.
Section 17.6, 17.7
Note: For further details see Section 17.3 .

Energy Pathways for Sustainable Development Chapter 17
1218
MESSAGE (Model for Energy Supply Strategy Alternatives and their General Environmental Impact) is a systems engineering optimization model used for medium- to long-term energy system planning, energy policy analysis, and scenario development (Messner and Strubegger, 1995 ; Riahi et al., 2007 ). The model provides a framework for representing an energy system with all its interdependencies from resource extraction, imports and exports, conversion, transport, and distribution to the provision of energy end-use services such as light, space heating and cooling, industrial production processes, and transportation. The framework covers all GHG-emitting sectors, including agriculture, forestry, energy, and industrial sources, for a full basket of greenhouse gases and other radiatively active gases: CO 2 , methane, nitrous oxide, nitrogen oxides, volatile organic compounds, carbon monoxide, sulfur dioxide, black carbon and organic carbon, tetrafl uoromethane, hexafl uoroethane, various hydrofl uorocarbons (HFC125, HFC134a, HFC143a, HFC227ea, HFC245ca), and sulfur hexafl uoride. MESSAGE is used in conjunction with MAGICC (Model for Greenhouse Gas Induced Climate Change) version 5.3 (Wigley and Raper, 2001 ) for calculating internally consistent scenarios for atmospheric concentrations, radiative forcing, annual-mean global surface air temperature, and global-mean sea level implications.
IMAGE is an integrated assessment modeling framework consisting of a set of linked and integrated models (Bouwman et al., 2006 ). Together the framework describes important elements in the long-term dynamics of global environmental change, such as air pollution, climate change, and land use change. Important subcomponents of the model are the global energy model TIMER, the land use and land cover submodels of IMAGE, the detailed description of the carbon cycle, and the MAGICC 6.0 (Meinshausen et al., 2009 ) model that is included as the climate model within IMAGE. The model focuses on several dynamic relationships within the energy system, such as inertia, learning-by-doing, depletion, and trade among the different regions. Technological choices are made on the basis of relative costs (using multinomial logit equations). The land cover submodels in the earth system simulate the change in land use and land cover at a resolution of 0.5 × 0.5 degrees (driven by demands for food, timber and biofuels, and changes in climate). The earth system also includes a natural vegetation model to compute changes in vegetation in response to climate change feedbacks from changes in temperature, precipitation, and atmospheric CO 2 concentrations.
Both models use a set of harmonized assumptions about future drivers of change (including targets) to generate the GEA pathways. Many of these drivers are specifi ed externally to the modeling frameworks and were provided by other chapters of the GEA report ( Table 17.3 ). The pathways thus also aim to integrate information (e.g., on resources, technologies, costs) provided elsewhere in the GEA.
Although the models were applied to develop the three illustrative pathways within each of the pathways groups, the assessment relies on the strengths of the individual models with respect to specifi c sensitivity analysis. For instance, both models explored the sensitivity of the results with respect to energy access; however, the assessment mostly builds upon simulations from IMAGE for detailed land use projections and mainly uses the MESSAGE model to explore supply-side fl exibility and to calculate pollutant emissions. The atmospheric chemistry and dispersion modeling for the assessment of health impacts from air pollution were conducted with the TM5 model hosted
IterationsParticipatory
Process forScenario
Taxonomy
GEA Indicators(targets)
Models:
IMAGE
MESSAGE
Inputs from otherChapters
(costs, potentials,
technology, etc..)
incl. uncertainties
GEA-Supply
GEA-Mix
GEA-Efficiency
qualitative
quantitative
quan + qual
GEA Pathways
Sensitivity AnalysisOn specific issues
IterationsPolicy Chapters
Figure 17.4 | The GEA scenario development process.

Chapter 17 Energy Pathways for Sustainable Development
1219
at the Joint Research Centre of the European Commission (Dentener et al., 2006 ; Stevenson, 2006 ; Kinne et al., 2006 ; Textor et al., 2007 ; Bergamaschi et al., 2007 ). As with any model-based assessment, any specifi c conclusions are conditional on the applied methods and assumptions.
Detailed scenario data for the individual GEA pathways are publicly available in the GEA database at www.iiasa.ac.at/web-apps/ene/geadb. The GEA database provides interactive features for data visualization and a user interface for the download of scenario information in different formats.
Table 17.3 | Model structure and assumptions used to generate GEA pathways.
Examples of externally specified or harmonized variables across models
Constraints on model outputs or “boundary conditions” for least-cost
model solutions
Examples of internally generated or “endogenous” model outcomes
Population growth Energy access target Diffusion of supply-side technology options and their shares in primary energyReference economic growth Environmental impact targets
Reference energy intensity improvements Energy security targets Demand-side portfolios and fuel consumption
Resource availability and costs Price-induced changes in energy demand
Technology availability and costs Changes in land use and land cover
Exposure to pollutant emissions
Energy system investments
Costs of alternative policy packages for energy access, environment, and security
Costs of emissions reductions
Carbon price
Because the GEA objectives are strongly normative, the targets are all designed to be ambitious. The elaborated GEA pathways suggest that all the targets can be reached, if appropriate policies are introduced and energy investments are scaled up considerably. Table 17.2 lists some gen-eral characteristics of the GEA pathways as influenced by each of the objectives.
The target of ensuring almost universal access to electricity and clean cooking by 2030 3 is driven by the current reliance of a large fraction of the population in developing countries on traditional biomass to sat-isfy basic energy needs. Their lack of access to electricity and to afford-able and clean fuels for cooking has vast impacts on human health, productivity, and land conservation. Section 17.4 presents a compre-hensive analysis of the combinations of policies that can achieve the GEA goal of universal access by 2030. Specific focus is given to micro-credits or grants to finance appliances as well as subsidies to improve the affordability of clean fuels for cooking. In addition, the same sec-tion assesses the need for infrastructure investments for transmissions
and distribution networks to connect the rural poor to the grid (see also Chapters 2 and 19 ).
The target of reducing air pollution in compliance with WHO (World Health Organization) air quality guidelines 4 by 2030 is explored in depth in Section 17.5.2 through a bottom-up, technology-based assessment of main measures across main pollutant emissions sources and sectors. Many countries around the world have adopted antipollution legislation and have specific plans for further implementation of legislation in the short term. As the analysis in Section 17.5.2 indicates, however, current legislative plans in the aggregate are not sufficient to achieve the GEA target. Hence, a major focus of that section is on identifying specific policy levers for individual sectors and regions, and the associated costs, to deliver further improvements consistent with the overall objective (see also Chapter 4 ).
3 The target is “almost universal access” because reaching the remotest rural populations is exceedingly expensive.
4 The WHO air quality guidelines are given for an annual PM2.5 concentration < 10 μg/m 3 . In the GEA pathways the majority of the population meets this guide-line by 2030, while the remaining populations stay well within the WHO Tier I-III levels of 15–35 μg/m 3 .

Energy Pathways for Sustainable Development Chapter 17
1220
With respect to climate change, the GEA adopts the target of limiting global average temperature change to 2 ° C above preindustrial levels with a likelihood of more than 50% . 5 This target is consistent with various scientific assessments of the increasing risk of climate-related impacts above that threshold (Smith et al., 2009 ) as well as with EU and UN policy recommendations (European Commission, 2007 ; United Nations Conference of the Parties, 2009 ). Such a global target calls for globally comprehensive and stringent GHG emissions reductions. Section 17.5.1 analyzes the required emissions pathways, measures to reduce emissions, costs, and equity implications of the transition (see also Chapter 3 ).
Last but not least, the GEA objective of improving energy security is achieved partly as a convenient co-benefit of decarbonization, which is illustrated in the GEA transition through two related objectives on limiting energy trade across major importing regions and increasing the diversity and resilience of energy supply . Although many different types of energy security indicators are summarized in the literature (e.g., Jansen et al., 2004 ; Scheepers et al., 2007 ; Kruyt et al., 2009 ; Sovacool, 2009 ; Sovacool and Brown, 2010 ), the GEA uses a relatively simple dual taxonomy to define security: sovereignty of the energy system based on the degree of energy trade, and resilience based on the degree of diversity of types of energy sources. The sovereignty dimension is incor-porated by limiting energy trade as a fraction of total primary energy at a regional scale (discussed in Section 17.7 ). Although the resilience dimension is not a direct limitation in the GEA pathways, the analysis in Section 17.6 shows that diversity increases in all energy subsystems (total primary energy supply, fuel supply for end uses, and regional mixes). Section 17.6 elaborates on these indicators and on the differ-ent strategies to improve energy security and their implications for the transition (see also Chapter 5 ).
Without policies to enable the sustainability transformation, the energy system would continue its heavy reliance on fossil fuels. This is illus-trated by the hypothetical no-policy baseline (counterfactual) of the GEA, which describes the evolution of the energy system in absence of any transformational policies to meet the GEA objectives. In the GEA counterfactual fossil fuels more than double their contribution by 2050 (reaching about 900 EJ). As a consequence greenhouse gas emissions would continue to grow at present rates for many decades to come, leading to an average global mean temperature change of about 5°C in the long term. Increasing use of fossil fuels would also increase import dependency and worsen energy security, particularly in resource poor regions in Asia. Lack of incentives to strengthen policies to control the emissions of air pollutants would result in an increase of outdoor air-
pollution induced health impacts from 23 million disability-adjusted life years (DALYs) lost globally in 2005 to more than 33–40 million by 2030. In addition, the lack of financing for clean cooking fuels and elec-tricity for the poor would leave the energy access problem unresolved, leading to health impacts from household fuel pollution of about 40 million DALYs by 2030.
Changing the energy system to support sustainable development requires thus dedicated policies so that all the GEA goals are met con-currently. Hence, a major focus of the assessment is to explore inte-grated and holistic solutions that take into account potential trade-offs and help to identify synergies from achieving all the different objectives simultaneously. These are discussed in detail in Section 17.7 .
17.3 The GEA Energy Transition Pathways
This section describes the main underlying dynamics and transforma-tional changes featured on both the demand and the supply side of the energy system. The pathways are described initially in a disaggre-gated way, separating out macro drivers, demand-side improvements, and supply-side transformations. Then the pathways are reintegrated using three illustrative pathways to provide comprehensive storylines of what the energy system transformation might look like if the over-arching GEA scenario is to be fulfilled. Once these “what” questions are answered, the chapter turns to questions of “how.” The section that follows sketches out an answer to the question of how such a transformation might come about, pointing the way to more detailed analysis later in this chapter as well as in the remainder of this report.
This part of the chapter is organized as follows. Section 17.3.1 describes the main socioeconomic and demographic trends common to all the GEA pathways. Section 17.3.2 covers changes in energy intensity and final energy demand and draws together evidence from other parts of the GEA on the potential for efficiency improvements in different end-use sectors. Based on this demand-side analysis, three groups of pathways are set up corresponding to low, high, and intermediate levels of demand: these are the GEA-Efficiency, GEA-Supply, and GEA-Mix pathways, respectively. Section 17.3.3 turns to the supply side of the energy system. The lowest-cost portfolio of supply-side transformations (assuming the full availabil-ity of all advanced future technologies on a large scale) is described, followed by an analysis of the importance of fuel and technology trans-formations in the transportation sector. This leads into a broader analysis of flexibility in supply-side portfolios and the potential for specific supply-side options to be either limited or omitted completely. Section 17.3.4 integrates the analysis of macro drivers, efficiency improvements, and supply transformations to present the GEA pathways in an integrated form. Initially, three illustrative pathways are explored in depth to estab-lish key characteristics, similarities, and differences. Then the full diversity of pathways is compared and contrasted, with particular emphasis on regional-level analysis and on the implications for land and food supply,
5 The likelihood of 50% refers to physical climate change uncertainties, including cli-mate sensitivity, aerosol forcing, and ocean diffusivity. It thus depicts the chances that a specifi c GHG pathway would stay below the 2°C temperature target. The like-lihood does not imply any probability of the political implementation of the targets, nor does it correspond to the likelihood of specifi c technologies becoming available in the future.

Chapter 17 Energy Pathways for Sustainable Development
1221
given bioenergy’s potential contribution to the transformation. Section 17.3.5 is concerned with how the pathways might be implemented. Two critical issues are addressed: costs and investments, and policies. Because the overarching GEA scenario is strongly normative, all the pathways analyzed within this scenario require strong interventions to induce and direct the energy system transformation.
17.3.1 Economic Growth and Demographic Change
The GEA pathways share a common median demographic projection whereby the global population increases from almost 7 billion today to about 9 billion by the 2050s before declining toward the end of the cen-tury (UN DESA, 2009 ). Figure 17.5 illustrates this population projection in the context of the full range of global demographic developments from a very low to an improbably high number of people by 2100. The median development path is a challenging one, as the global population will be aging rapidly through the century and concentrating ever more in urban areas.
The GEA pathways also share a median economic development path, expressed in terms of world GDP that allows for significant develop-ment in the 50 or so poorest countries in the world, while at the same time reflecting increased resource productivity and demand growth in the richest countries, dampened by changing consumption patterns and lifestyles. This GDP development path builds on the updated IPCC B2 scenario projection by Riahi et al., ( 2007 ); for details see also the GEA database at www.iiasa.ac.at/web-apps/ene/geadb. Main changes include updates of short-term trends and revisions of regional projec-tions consistent with the sustainability objectives of the GEA. The eco-nomic projection used in all the GEA pathways is illustrated in Figure 17.6 , which also shows the full range of economic trajectories for the global energy scenarios in the literature (Nakicenovic et al., 2006 ).
The socioeconomic development pathway is chosen to be consistent with global aspirations toward a sustainable future while also attaining this goal with a high degree of confidence. Global real per capita income in the GEA pathways grows at an annual average rate of 2% over the next 50 years, but with significant differences in the pace of develop-ment across regions. Today’s developing and emerging economies con-tinue to grow at a relatively rapid pace, with their combined economic output surpassing that of the industrialized world by around 2040 (see inset in Figure 17.6 ). This pathway is also consistent with other cen-tral projections in the literature (Nakicenovic et al., 2006 ) and hence provides a good reference point for placing the GEA energy pathways within a comparative context.
17.3.2 Energy Demand and Services
The adequate provision of energy services is a prerequisite for human well-being and productivity, and ultimately it is the demand for these
services that drives the energy system and its continuing expansion. Increasing affluence has historically been one of the major drivers of energy demand, and both the quantity and the quality of energy ser-vices determine in turn the magnitude of environmental and social impacts associated with the energy system. It is these impacts that are addressed by the normative objectives enshrined in the overarch-ing GEA scenario.
Energy services are typically provided by end-use technologies, which convert energy from a particular form (biomass, petroleum, natural gas, electricity, and so forth) into services useful to a final consumer (heating and cooking, mobility, industrial processing, entertainment, and others). Consequently, end-use technologies and the efficiency with which they convert energy into useful services are inseparably connected with the levels and types of energy services demand. As a result, one can identify three broad and interrelated approaches to tackling demand-side chal-lenges in the energy system:
1940 1960 1980 2000 2020 2040 2060 2080 2100
Wo
rld
po
pu
latio
n (b
illio
n)
0
2
4
6
8
10
12
14
16
18
2000 2020 2040 2060 2080 2100
Po
pu
latio
n (b
illio
n)
0
2
4
6
8
10
12
14
16
18
GEA Industrialized
GEA Developing
Figure 17.5 | Global population projections. The line indicates the median GEA devel-opment pathway and the fan indicates the range of population projections from the literature (Nakicenovic et al., 2006 ). The insert shows the median projections and ranges for the industrialized and developing regions separately.
1940 1960 1980 2000 2020 2040 2060 2080 2100
Wo
rld
GD
P (tr
illio
n U
S$
20
05
)
0
100
200
300
400
500
600
700
800
2000 2020 2040 2060 2080 2100
GD
P (tr
illio
n U
S$
20
05
)
0
100
200
300
400
500
GEA Industrialized
GEA Developing
Figure 17.6 | Global economic development projections. The line indicates the median GEA development pathway and the fan indicates the range of economic projections from the literature (Nakicenovic et al., 2006 ). The insert shows the median projections and ranges for the industrialized and developing regions separately.

Energy Pathways for Sustainable Development Chapter 17
1222
• improve technological efficiency , e.g., increase vehicle fuel efficiency;
• change the structure of energy services demand , e.g., substitute physical mobility with “virtual” mobility enabled by electronic com-munications; and
• reduce the level of energy services demand , e.g., reduce travel needs by living closer to work or amenities.
Although all three of these approaches are explored in the GEA path-ways as means of reducing final demand for energy, the emphasis throughout this section is on efficiency improvements. As a means for potentially decoupling energy demand from economic growth, energy efficiency represents a central lever for policy to target. Moreover, effi-ciency contributes to all the sustainability objectives. The degree to which efficiency improvements can limit energy demand growth is – by design – one of the main distinguishing characteristics of the GEA path-ways. It should be noted, however, that efficiency improvements can be offset by both rebound effects and scale effects (Greening et al., 2000 ; Birol and Keppler, 2000 ; Hanley et al., 2009 ). Rebound effects describe an increase in demand for energy services as improvements in efficiency lower their effective cost. These effects can be direct (the savings from greater efficiency are spent on the same energy service), indirect (the savings are spent on a different energy service), or economy-wide (the savings contribute to economic and income growth, which increases demand). Rebound effects can be mitigated by price and other policies, which are discussed further in Section 17.3.5 . Scale effects describe an increase in demand for energy services due to rising population or to rising economic output. Both rebound and scale effects make it impor-tant to consider the other approaches to demand-side transformation described above. Hence, both the structure and the level of energy serv-ices demand are also important parts of the GEA pathways described in this section.
The rest of this section is organized as follows. First, the headline trends in each group of pathways are discussed, covering the efficiency of the economy as a whole as well as on a per capita basis. Second, the GEA-Efficiency group of pathways is explored in more depth, sector by sec-tor, drawing on material from the corresponding chapters of this report. Third, similarities and differences in the structure of energy demand (e.g., its distribution between end-use sectors) are considered.
17.3.2.1 Energy Intensity Improvements
Energy intensity is energy used per unit of output, typically expressed in megajoules per US dollar (MJ/US$) of GDP or value added. Energy intensity metrics are widely used to represent the overall energy prod-uctivity of an economy or sector. The final energy intensity of the glo-bal economy has fallen historically at a rate of about 1.2%/year since the early 1970s. However, some regions have experienced substantially
more rapid reductions over certain periods. For example, China’s energy intensity declined at a rate of about 4%/year between 1990 and 2000 (followed by a slower decline in the subsequent period). The causes of the energy intensity declines are many. They include, first, technological improvements in individual energy end-use appliances and technologies combined with substitution among fuels, such as the replacement of fuelwood with electricity or liquefied petroleum gas (LPG) for cooking. They also include changing patterns of energy end use; urbanization, which is characterized by generally higher system efficiencies: changes in the structure of the economy, including shifts toward higher shares of the less energy-intensive services sector; and finally, changing lifestyles, which affect both the type and the level of energy services demanded. Although not every such change has resulted in declining energy inten-sities in the past, taken together the overall trend is persistent and per-vasive (Nakicenovic et al., 1998 ).
Energy intensity improvements can continue for a long time to come. Despite the energy efficiency and intensity improvements that have already been implemented to date, the efficiency of the energy system remains far from the theoretical potential. Although the full realization of this potential may never be possible, many estimates indicate that energy intensity reductions of a factor of 10 or more may be possible in the very long run (see Nakicenovic et al., 1993 ; Gilli et al., 1995 ; Nakicenovic et al., 1996 ).
The degree of energy intensity improvement is a crucial uncertainty for the future. All three groups of GEA pathways depict energy intensity futures that are driven by policies to improve energy efficiency, lead-ing to global energy intensity improvement rates at or above historical experience. This is partly a result of the increasing importance of some low-income regions with relatively high rates of intensity improvement, but it is also partially due to the assumed move away from inefficient traditional fuels in the developing world. Energy intensity improvements thus vary significantly at the regional level, with some regions also developing more slowly than the historical rate, particularly in the GEA-Supply and -Mix pathways. The resulting global average reduction in energy intensity varies across the GEA pathways between about 1.5% and 2.2% annually to 2050. The lower end of the range is slightly faster than the historical experience, whereas the higher end is roughly double that and corresponds to a reduction in energy intensity of 60% by 2050. Cumulatively, these intensity improvements lead to substantial differ-ences in per capita energy demand across the three pathway groups (see Figure 17.7 ).
Studies have shown that it is possible to improve energy intensity radically through a combination of behavioral changes and the rapid introduction of stringent efficiency regulations, technology standards, and environmental externality pricing, which mitigates rebound effects (see also Chapters 8 , 9 , and 10 ). The group of GEA-Efficiency pathways depicts such a development with a radical departure from historical trends. This group of pathways thus deliberately explores the conse-quences of demand-side interventions that lead to substantial declines
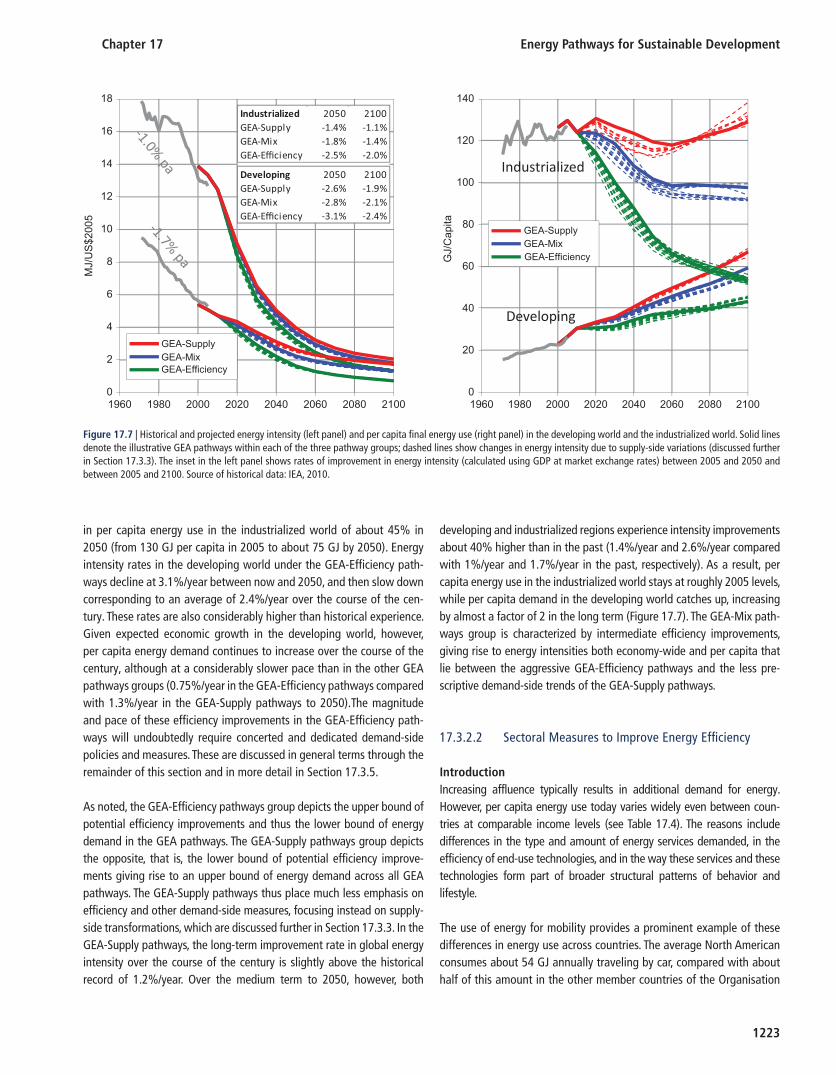
Chapter 17 Energy Pathways for Sustainable Development
1223
in per capita energy use in the industrialized world of about 45% in 2050 (from 130 GJ per capita in 2005 to about 75 GJ by 2050). Energy intensity rates in the developing world under the GEA-Efficiency path-ways decline at 3.1%/year between now and 2050, and then slow down corresponding to an average of 2.4%/year over the course of the cen-tury. These rates are also considerably higher than historical experience. Given expected economic growth in the developing world, however, per capita energy demand continues to increase over the course of the century, although at a considerably slower pace than in the other GEA pathways groups (0.75%/year in the GEA-Efficiency pathways compared with 1.3%/year in the GEA-Supply pathways to 2050).The magnitude and pace of these efficiency improvements in the GEA-Efficiency path-ways will undoubtedly require concerted and dedicated demand-side policies and measures. These are discussed in general terms through the remainder of this section and in more detail in Section 17.3.5 .
As noted, the GEA-Efficiency pathways group depicts the upper bound of potential efficiency improvements and thus the lower bound of energy demand in the GEA pathways. The GEA-Supply pathways group depicts the opposite, that is, the lower bound of potential efficiency improve-ments giving rise to an upper bound of energy demand across all GEA pathways. The GEA-Supply pathways thus place much less emphasis on efficiency and other demand-side measures, focusing instead on supply-side transformations, which are discussed further in Section 17.3.3 . In the GEA-Supply pathways, the long-term improvement rate in global energy intensity over the course of the century is slightly above the historical record of 1.2%/year. Over the medium term to 2050, however, both
developing and industrialized regions experience intensity improvements about 40% higher than in the past (1.4%/year and 2.6%/year compared with 1%/year and 1.7%/year in the past, respectively). As a result, per capita energy use in the industrialized world stays at roughly 2005 levels, while per capita demand in the developing world catches up, increasing by almost a factor of 2 in the long term ( Figure 17.7 ). The GEA-Mix path-ways group is characterized by intermediate efficiency improvements, giving rise to energy intensities both economy-wide and per capita that lie between the aggressive GEA-Efficiency pathways and the less pre-scriptive demand-side trends of the GEA-Supply pathways.
17.3.2.2 Sectoral Measures to Improve Energy Effi ciency
Introduction Increasing affluence typically results in additional demand for energy. However, per capita energy use today varies widely even between coun-tries at comparable income levels (see Table 17.4 ). The reasons include differences in the type and amount of energy services demanded, in the efficiency of end-use technologies, and in the way these services and these technologies form part of broader structural patterns of behavior and lifestyle.
The use of energy for mobility provides a prominent example of these differences in energy use across countries. The average North American consumes about 54 GJ annually traveling by car, compared with about half of this amount in the other member countries of the Organisation
1960 1980 2000 2020 2040 2060 2080 2100 1960 1980 2000 2020 2040 2060 2080 2100
MJ/U
S$
20
05
0
2
4
6
8
10
12
14
16
18
GEA-Supply
GEA-Mix
GEA-Efficiency
GJ/C
apita
0
20
40
60
80
100
120
140
GEA-Supply
GEA-Mix
GEA-Efficiency
Developing
Industrialized
Industrialized 2050 2100GEA-Supply -1.4% -1.1%GEA-Mix -1.8% -1.4%GEA-Efficiency -2.5% -2.0%
Developing 2050 2100GEA-Supply -2.6% -1.9%GEA-Mix -2.8% -2.1%GEA-Efficiency -3.1% -2.4%
Figure 17.7 | Historical and projected energy intensity (left panel) and per capita fi nal energy use (right panel) in the developing world and the industrialized world. Solid lines denote the illustrative GEA pathways within each of the three pathway groups; dashed lines show changes in energy intensity due to supply-side variations (discussed further in Section 17.3.3 ). The inset in the left panel shows rates of improvement in energy intensity (calculated using GDP at market exchange rates) between 2005 and 2050 and between 2005 and 2100. Source of historical data: IEA, 2010 .

Energy Pathways for Sustainable Development Chapter 17
1224
for Economic Co-operation and Development (OECD). Three main factors, in addition to the slightly higher per capita income in North America, explain the difference: the lower fuel economy of the typical individual vehicle (3 MJ/km in North America versus 2.6 MJ/km in the other OECD countries), longer distances traveled (as a result of both preferences and structural characteristics of urban form and land area), and more individ-ualized use of cars (average occupancy is about 1.3 passengers/vehicle in North America compared with up to 1.5 passengers/vehicle in Eastern Europe, for example). This illustrates well the combined effect of effi-ciency and of behavior and lifestyles (levels and types of energy service demanded) on fuel consumption (see also Chapter 9 ).
Similar differences in per capita energy use can be found between other regions of the world as well as for other sectors, such as residential and industry. Large-scale improvements in the energy intensity of an econ-omy therefore require a portfolio of measures that stimulate the adop-tion of highly efficient end-use technologies, complemented by policies to promote changes in energy services demand through behavioral and lifestyle shifts. In addition, structural changes in the economy play an important role.
The overarching finding from the sectoral analysis is that the rapid energy intensity improvements depicted by the GEA-Efficiency group of pathways are feasible with currently available technologies. The neces-sary magnitude of change, however, requires a fundamental shift in the way energy is used across all major sectors of the economy. The follow-ing sections summarize the nature of these shifts and the policies that might drive them in the GEA-Efficiency pathways.
The Residential and Commercial Sector in the GEA-Effi ciency Pathways In the residential sector, economic growth is expected to further increase the floor areas of dwellings by increasing living standards, particularly in developing countries. This will result in additional energy demand for space heating and cooling. As noted in Chapter 10 , however, the poten-tial for efficiency improvements in the use of energy for this purpose is
vast. In the GEA-Efficiency group of pathways, a large fraction of this potential is successfully tapped. Policies to improve thermal insulation as well as retrofits to advanced building types (passive house standards or lower) lead to improvements in energy use per unit of floor area by a factor of 4 in the industrialized world, from about 400–900 MJ/m 2 down to 100–230 MJ/m 2 by 2050 ( Table 17.5 ). Improvement rates are similar in the developing world, on the order of a factor of 2 to 3.
The potential efficiency gains from buildings in terms of energy use avoided are among the highest across all end-use sectors. Achieving these gains requires the rapid introduction of strict building codes and retrofit standards for almost the complete global building stock. The rate of retrofit would need to increase to about 3% annually to 2050, about three times the historical rate.
In the GEA-Efficiency pathways, demand for energy from centralized sources and grids is further reduced by the adoption of technologies that enable space heating and cooling with net zero use of centralized energy. These include solar water heating, solar heating, air-source or ground-source heat pumps powered by solar photovoltaics, and bio-mass-based heating. Combined with efficiency improvements to build-ing shells, these technologies would significantly reduce the need for centralized solutions for thermal comfort; centralized energy infrastruc-ture would largely provide the additional energy required for lighting, cooking, and appliances.
Per capita electricity use in the residential and commercial sector is expected to grow significantly because of rising incomes and the adop-tion of modern household appliances and other electric devices. This trend is particularly pronounced in the developing world. Despite high efficiency standards, electricity use in the developing world increases in the GEA-Efficiency pathways group by a factor of 3 to 8 by 2050 ( Table 17.5 ). The increase is more modest in the lower-income countries of the industrialized world, whereas in the higher-income countries of North America and Western Europe, per capita electricity use peaks and then declines toward 2050 to levels below that of 2005. Although overall demand for electricity continues to increase in the residential sector,
Table 17.4 | Final energy use and income per capita for Industrialized and Developing Regions, 2005 Actual and 2050 under GEA-Effi ciency and GEA-Supply.
20502005
Industrialized 1 Developing 2
Industrialized 1 Developing 2 GEA-Efficiency GEA-Supply GEA-Efficiency GEA-Supply
GDP per capita (2005 US$ at market exchange rates)
3487–40,050 671–4905 24,446–52,535 24,446–52,535 6029–19,829 6029–19,829
Total fi nal energy (GJ per capita)
73–219 7–46 62–98 104–156 28–50 32–71
1 Aggregated ranges of fi ve GEA regions representing the industrialized world: North America, Western Europe, Pacifi c OECD, Eastern Europe, and Former Soviet Union. For full regional defi nitions see the electronic appendix to this chapter.
2 Aggregated ranges of six GEA regions representing the developing world: Centrally Planned Asia and China, South Asia, Pacifi c Asia, Middle East and North Africa, sub-Saharan
Africa, and Latin America. For regional defi nitions see the electronic appendix to this chapter.

Chapter 17 Energy Pathways for Sustainable Development
1225
efficiency improvements significantly slow this growth. As a result, per capita consumption across all income groups is about 25–50% lower in the GEA-Efficiency pathways group than it would be without a con-certed emphasis on the demand-side transformation.
The Transportation Sector in the GEA-Effi ciency Pathways The slow growth of energy demand in the transportation sector in the GEA-Efficiency pathways results in part from efficiency improvements in the vehicle fleet, but also from structural shifts toward public transport (including rail and bus) and limits to car ownership, with implications for behavior and lifestyle (see also Chapter 9 ). In the GEA-Efficiency path-ways group, about half of the overall improvement in energy intensity by 2050 comes about through technical efficiency improvements across all modes of passenger transportation. The compound global effect of
these efficiency gains reduces fuel consumption from about 1.7 MJ/km in 2005 to 1.3 MJ/km by 2050. Gains are largest for vehicles, with some significant differences across world regions (the range is from 1.9 to 0.9 MJ/km). The other half of the overall intensity improvement is achieved by reducing demand for mobility as an energy service (e.g., by substituting travel with teleconferencing) and shifting demand for mobility to public transportation (e.g., trains and buses). Large differ-ences in modal split across countries already exist world-wide. Although demand is thus significantly lower in relative terms in the GEA-Efficiency pathways than in the GEA-Supply pathways, in absolute terms mobility continues to increase.
In the industrialized world, the proportion of total mobility (expressed in passenger-kilometers) provided by cars declines from about 60% in
Table 17.6 | Energy service indicators for the transportation sector in Industrialized and Developing Regions, 2005 Actual and 2050 under GEA-Effi ciency pathways.
2005, actual 2050, GEA-Efficiency
Industrialized 1 Developing Industrialized Developing
GDP per capita (2005 US$ at market exchange rates) 3487–40,050 671–4905 24,446–52,535 6029–19,829
Passenger-kilometers per capita 2 14,293 2499 15,925 3892CarBus and trainAviationOther 3
877828552274386
4041461198437
653933345579473
10091368795720
No. of light-duty vehicles per capita 0.46 0.03 0.52 0.11
Fuel use for mobility (GJ per capita) 30.8 2.4 24.0 4.6
Freight-kilometers per capita (thousands) 8219 1059 15,969 2774TruckRail
45443675
606453
69259044
13701404
Fuel use for freight (GJ per capita) 13.0 2.4 12.4 2.8
1 Industrialized and developing regions are defi ned as in Table 17.4 .
2 Estimates from Chapter 9 . Because of differences between the regional defi nitions used in that chapter and those used for the GEA scenarios, transport indicators are given as regional averages of the whole developing and industrialized world only.
3 Includes two- and three-wheeled vehicles.
Table 17.5 | Energy service indicators for the residential and commercial sector in Industrialized and Developing Regions, 2005 Actual and 2050 under GEA-Effi ciency pathways.
2005, actual 2050, GEA-Efficiency
Industrialized 1 Developing Industrialized Developing
GDP per capita (2005 US$ at market exchange rates) 3487–40,050 671–4905 24,446–52,535 6029–19,829
Floor area (m 2 per capita) 2 26–55 9–32 48–58 19–52
Share of buildings with advanced technology (%)Single-familyMultifamilyCommercial and public
<1<1<1
<1<1<1
74–8674–7981–92
75–8382–9185–96
Heating demand (MJ/m 2 )Single-familyMultifamilyCommercial and public
443–875443–781475–914
112–241112–277173–371
101–230104–198101–166
50–7947–6854–97
Residential and commercial electricity demand (GJ per capita) 3 11–45 1–6 22–33 8–15
1 Industrialized and developing regions are defi ned as in Table 17.4 .
2 Includes public and commercial buildings based on the bottom-up analysis in Chapter 10 .
3 Includes electric cooling and heating as well as lighting and appliances.

Energy Pathways for Sustainable Development Chapter 17
1226
2005 to 40% in the GEA-Efficiency pathways ( Table 17.6 ). Trends are different in the developing world, where a large fraction of the popu-lation already relies on public transportation. Increasing affluence will make cars more affordable and thus increase reliance on individual mobility. As a result, car ownership in the developing world is expected to increase by almost a factor of 5 even in the GEA-Efficiency pathways (from 2 to 11 cars per 100 people by 2050). Although this is a consid-erable increase, the expected growth in the absence of any policies to support public transportation and limit car ownership would be some 30% higher still. Also, despite this large increase, transportation by bus and train in 2050 in the GEA-Efficiency pathways covers a much larger fraction of total passenger transport demand in the developing world than in the industrialized world (35% versus 20%; see Table 17.6 ).
In addition to individual mobility, freight transport continues to be a strong driver of energy demand in the transportation sector. An impor-tant feature of the GEA-Efficiency pathways group is therefore the switch toward higher shares of railway transportation ( Table 17.6 ) combined with improvement in the overall efficiency of freight transportation by about a factor of 2 by 2050, from 1.3 MJ/t-km (tonne-kilometers) on aver-age in 2005 down to 0.7 MJ/t-km in 2050. In the industrialized world this leads to relatively constant per capita energy use for freight transporta-tion despite the near doubling of transport volume from 8,200 t-km per capita to about 16,000 t-km per capita by 2050. Although efficiency gains are of a similar order of magnitude in the developing world, increases in freight demand more than offset those gains, leading to an increase in per capita energy use for freight by about 20% to 2050. In absolute terms, however, by 2050 energy demand for this purpose in developing countries remains considerably below that of today’s industrialized countries.
The Industry Sector in the GEA-Effi ciency Pathways In the GEA-Efficiency pathways, energy efficiency in the industrial sector improves by about 1.5%/year, resulting in an overall demand of about 200 EJ in 2050. This is around 20% below what it would be in the absence of a concerted approach to demand-side transformation, and it equates to a 50% reduction in the overall energy intensity of industrial production (see Table 17.7 for related data in per capita terms).
The demand-side emphasis of the GEA-Efficiency pathways features a number of different measures in the industrial sector to improve energy efficiency, promote structural change, and optimize industrial systems design to reduce energy demand. These measures can be broadly split into the following categories:
widespread adoption of best available technology for new investments; •
retrofit of existing plants to improve energy efficiency; •
optimization of energy and material flows through systems design, qual- •ity improvements, lifecycle product design, and enhanced recycling; and
further electrification and a switch to renewable energy. •
The adoption of best available technology for industrial processes can yield an efficiency improvement of around 15% (IEA, 2007 ; Saygin et al., 2010 ). More systemic approaches to optimizing the use of com-bined heat and power, pumps, fans, compressed air and steam systems, and so on can yield another 15% (IEA, 2007 ; Price and McKane, 2009 ). Further reductions in energy intensity in the industrial sector can be achieved through the optimization of material flows and the wide-spread adoption of new high-efficiency technologies currently at niche scales (WBCSD/IEA, 2009 ). Moreover, a switch to 25% renewable energy throughout the manufacturing industry yields a 10% “efficiency” gain through electrification and reduced used of fossil resources, although this is balanced by a similar loss from widespread adoption of CCS (see Chapter 8 ). The efficiency potentials of the five most energy inten-sive industrial subsectors (iron and steel making, chemicals and pet-rochemicals, cement making, pulp and paper, and aluminum), which account for about two-thirds of industrial energy use, are discussed in more detail in the online electronic appendix to this chapter, as well as in Chapter 8 .
Energy Effi ciency by Sector in the GEA-Supply Pathways The sectoral analysis above provides some specific detail as to how the fundamental demand-side transformation represented by the GEA-Efficiency pathways can be achieved. Central to this effort is the rapid and pervasive introduction of energy efficiency measures throughout the world. However, technical measures alone will not be sufficient. They need to be complemented by measures to both shift and limit the underlying demand for energy services, build insti-tutional capacity (see Chapter 25 ), remove market and nonmarket barriers to increased energy efficiency (see Chapters 22 and 26), and mobilize the substantial investment needed (see Chapter 6 ). These policy and investment needs are discussed further in Section 17.3.5
Table 17.7 | Energy service indicators for the industry sector in Industrialized and Developing Regions, 2005 Actual and 2050 under GEA-Effi ciency pathways.
2005, actual 2050, GEA-Efficiency
Industrialized 1 Developing Industrialized Developing
GDP per capita (2005 US$ at market exchange rates)
3486–40,054 671–4905 24,446–52,535 5661–19,829
Final energy intensity (MJ/dollar of GDP)
1.2–10.7 3.0–9.8 0.7–1.3 0.9–2.5
Final energy (GJ per capita)
26–65 3–17 33–46 15–26
Process heat (all thermal)FeedstockOther (nonthermal, e.g., electric)
15–28
6–234–15
2–11
0.3–61–4
12–17
6–1412–16
8–13
1–75–9
1 Industrialized and developing regions are defi ned as in Table 17.4 .

Chapter 17 Energy Pathways for Sustainable Development
1227
but are emphasized here as an integral and essential feature of the GEA-Efficiency group of pathways.
The GEA-Supply pathways, in contrast, represent the extent of potential demand-side transformation without this concerted policy and invest-ment emphasis, and without many of the specific efficiency measures described in the sectoral analysis above. However, the GEA-Supply pathways group is not simply a business-as-usual continuation of his-torical trends. All the GEA-Supply pathways fulfill the sustainability objectives of the overarching GEA scenario set out in Section 17.2.3 . As noted, these pathways are implemented through the achievement of highly ambitious targets relating to energy access, environmental impacts, and energy security. Reaching these targets requires a raft of policy and other initiatives, discussed in detail in Sections 17.4 – 17.7 of this chapter, that lead to a transformation of the global energy system. Whereas the GEA-Efficiency pathways emphasize the transformative potential on the demand side, the GEA-Supply pathways concentrate on supply-side measures. However, the latter also impact energy demand, albeit indirectly. To take one simple example, a carbon tax implemented to reduce the share of fossil fuels in electricity generation might indirectly raise the cost of final energy and so reduce demand. The more general point is that the level of energy demand and energy intensity improvements in the GEA-Supply pathways shown in Figure 17.7 falls well below the upper bound of demand projections found in the scenario literature to represent business as usual. Compared with, for example, the extensive scenario database of the IPCC Fourth Assessment Report (IPCC AR4) (Fisher et al., 2007 ), energy intensity improvement rates in the GEA-Supply pathways correspond roughly to an intermediate demand projection close to the median of the scen-ario distribution by 2050. Compared with the upper 90th percentile of the full scenario set reviewed in the IPCC AR4, the GEA-Supply path-ways achieve more than double the intensity improvements by 2050 (1.5%/year compared with 0.6%/year in the scenarios reviewed by the IPCC).
Table 17.8 summarizes indicators of per capita energy use for the GEA-Efficiency and GEA-Supply groups of pathways in all end-use sectors: residential and commercial, transportation, and industrial. Projections for 2050 are compared with efficiencies of energy use as of 2005. The table combines information from the detailed bottom-up technology assessments of each sector in Chapters 8 – 10 with information from the global GEA pathways discussed in this chapter.
In the residential and commercial sector, floor area as an underlying determinant of energy services demand is the same in both pathway groups. However, the penetration of advanced buildings combining major efficiency improvements with decentralized energy technologies is minimal in the GEA-Supply pathways. Resulting heat demand per unit of floor space is consequently a factor of 2 to 3 higher, with per cap-ita consumption around double that in the GEA-Efficiency pathways in both industrialized and developing countries.
In the transportation sector, total passenger demand for mobility is around 20–30% higher in the GEA-Supply pathways, because the measures described above to limit and shift services demand in the context of the GEA-Efficiency pathways are not implemented. Car ownership is also around a factor of 7 higher than current levels, com-pared with the factor of 5 increase in the GEA-Efficiency pathways. Although levels of car ownership increase proportionally more in developing countries, they remain at far higher absolute levels in the industrialized world. Meanwhile, although overall demand for freight mobility is similar, the GEA-Supply pathways have a higher propor-tion of freight moving by road than rail, the opposite of the case in the GEA-Efficiency pathways. Together with lower efficiency gains in the vehicle fleet, this results in 15–20% higher per capita fuel use. Demand for aviation is assumed to be the same in both the GEA-Supply and the GEA-Efficiency pathways.
In the industrial sector, the absence of major new efficiency policies in the GEA-Supply pathways results in energy demand more than dou-bling, to 260 EJ, in 2050 compared with 210 EJ in the GEA-Efficiency pathways. Energy intensity does improve, by about 1%/year, but this is lower than the 1.5%/year improvements achievable from the con-certed demand-side transformation that occurs in the GEA-Efficiency pathways.
These large differences in efficiency improvements between the GEA-Supply and the GEA-Efficiency groups of pathways have major implica-tions for the required transformation of the supply side of the energy system. The higher level of demand in the GEA-Supply pathways means fewer degrees of freedom in terms of supply options. This interdepend-ency between the demand- and the supply-side features of the path-ways is discussed in detail in Section 17.3.4 .
17.3.2.3 The Structure of Final Energy Demand
Despite the large differences in efficiency improvements between the GEA-Efficiency and the GEA-Supply groups of pathways described in the previous section, certain structural characteristics of final energy use are remarkably consistent across all GEA pathways, including the group of GEA-Mix pathways. These relate to the provision of energy services using higher-quality forms of energy. All GEA pathways depict a demand-side transformation toward ever more flexible, more conven-ient, and cleaner forms of energy at the point of final use (see also Nakicenovic et al., 1998 ). Figure 17.8 presents the same findings graphi-cally by distinguishing the share of final energy provided by solid, liquid, and grid-based or on-site-generated forms of energy. The low variation across the three groups of GEA pathways is shown by the limited extent of cross-hatching or overlap.
A pervasive characteristic of all the GEA pathways is the continuing shift from energy used in its original, often solid form, exemplified by
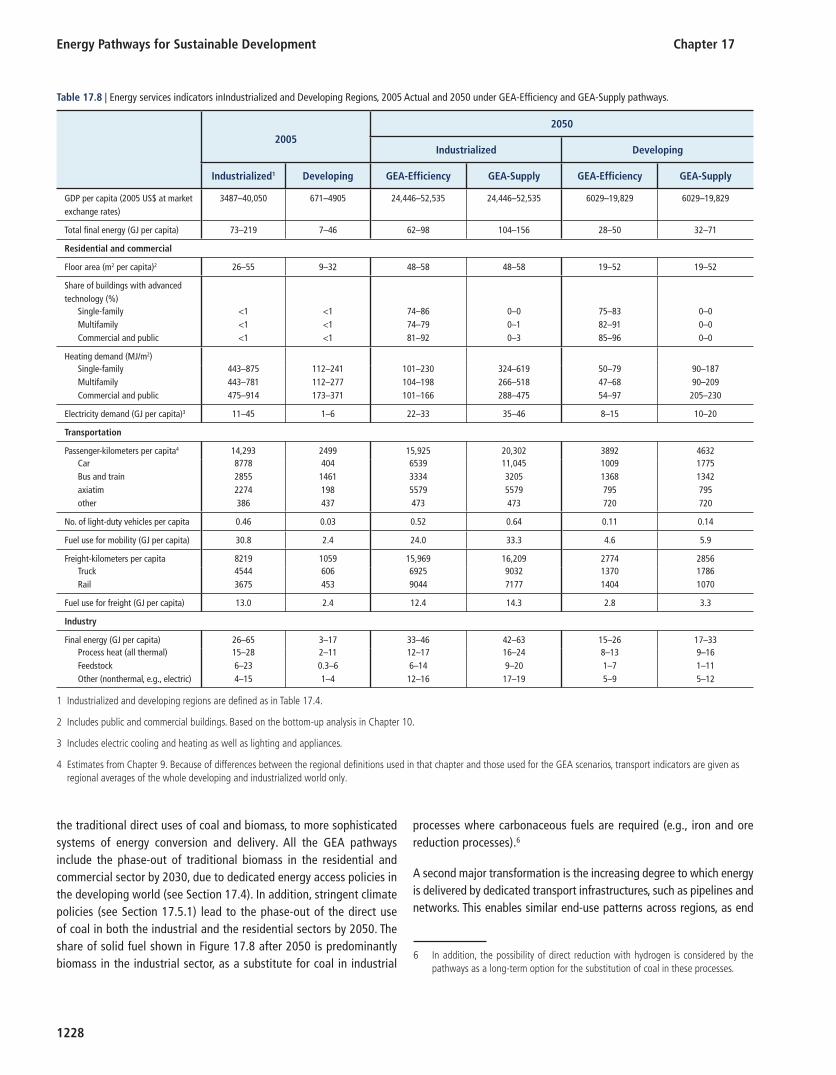
Energy Pathways for Sustainable Development Chapter 17
1228
the traditional direct uses of coal and biomass, to more sophisticated systems of energy conversion and delivery. All the GEA pathways include the phase-out of traditional biomass in the residential and commercial sector by 2030, due to dedicated energy access policies in the developing world (see Section 17.4 ). In addition, stringent climate policies (see Section 17.5.1 ) lead to the phase-out of the direct use of coal in both the industrial and the residential sectors by 2050. The share of solid fuel shown in Figure 17.8 after 2050 is predominantly biomass in the industrial sector, as a substitute for coal in industrial
processes where carbonaceous fuels are required (e.g., iron and ore reduction processes). 6
A second major transformation is the increasing degree to which energy is delivered by dedicated transport infrastructures, such as pipelines and networks. This enables similar end-use patterns across regions, as end
Table 17.8 | Energy services indicators inIndustrialized and Developing Regions, 2005 Actual and 2050 under GEA-Effi ciency and GEA-Supply pathways.
20502005
Industrialized Developing
Industrialized 1 Developing GEA-Efficiency GEA-Supply GEA-Efficiency GEA-Supply
GDP per capita (2005 US$ at market exchange rates)
3487–40,050 671–4905 24,446–52,535 24,446–52,535 6029–19,829 6029–19,829
Total fi nal energy (GJ per capita) 73–219 7–46 62–98 104–156 28–50 32–71
Residential and commercial
Floor area (m 2 per capita) 2 26–55 9–32 48–58 48–58 19–52 19–52
Share of buildings with advanced technology (%)
Single-familyMultifamilyCommercial and public
<1<1<1
<1<1<1
74–8674–7981–92
0–00–10–3
75–8382–9185–96
0–00–00–0
Heating demand (MJ/m 2 )Single-familyMultifamilyCommercial and public
443–875443–781475–914
112–241112–277173–371
101–230104–198101–166
324–619266–518288–475
50–7947–6854–97
90–18790–209205–230
Electricity demand (GJ per capita) 3 11–45 1–6 22–33 35–46 8–15 10–20
Transportation
Passenger-kilometers per capita 4 14,293 2499 15,925 20,302 3892 4632CarBus and trainaxiatimother
877828552274386
4041461198437
653933345579473
11,04532055579473
10091368795720
17751342795720
No. of light-duty vehicles per capita 0.46 0.03 0.52 0.64 0.11 0.14
Fuel use for mobility (GJ per capita) 30.8 2.4 24.0 33.3 4.6 5.9
Freight-kilometers per capita 8219 1059 15,969 16,209 2774 2856TruckRail
45443675
606453
69259044
90327177
13701404
17861070
Fuel use for freight (GJ per capita) 13.0 2.4 12.4 14.3 2.8 3.3
Industry
Final energy (GJ per capita) 26–65 3–17 33–46 42–63 15–26 17–33Process heat (all thermal)FeedstockOther (nonthermal, e.g., electric)
15–286–234–15
2–110.3–61–4
12–176–1412–16
16–249–2017–19
8–131–75–9
9–161–115–12
1 Industrialized and developing regions are defi ned as in Table 17.4 .
2 Includes public and commercial buildings. Based on the bottom-up analysis in Chapter 10 .
3 Includes electric cooling and heating as well as lighting and appliances.
4 Estimates from Chapter 9 . Because of differences between the regional defi nitions used in that chapter and those used for the GEA scenarios, transport indicators are given as regional averages of the whole developing and industrialized world only.
6 In addition, the possibility of direct reduction with hydrogen is considered by the pathways as a long-term option for the substitution of coal in these processes.

Chapter 17 Energy Pathways for Sustainable Development
1229
uses can be linked to fundamentally different and potentially distant primary energy supplies (see Section 17.3.3 for more details). An add-itional and related transformation, represented particularly in the GEA-Efficiency pathways, is the increasing development of on-site generation of both heat and electricity by renewable energy technologies.
These transformations in the use of final energy also involve changes in the economic structures that underpin the pathways. Continued industrialization of the developing world and increasing demand for industrial goods as incomes rise, result in comparatively larger shares of industrial energy demand in the future. This trend is most pronounced in the GEA-Efficiency group of pathways because aggressive efficiency programs in the residential and transportation sectors limit their shares of final energy demand, as shown in Figure 17.9 .
In sum, all the GEA pathways share some key features in terms of the structure of final energy demand: a shift away from traditional solid forms of energy; an increase in modern, cleaner, grid-delivered and on-site-generated forms of energy; and a rising share of industrial sector energy use as incomes rise. There is, however, one major point of diffe-rence among the GEA pathways. This relates to the nature of transform-ation in the transportation sector. The environmental and energy security objectives of the overarching GEA scenario necessitate a lower reliance on oil in all GEA pathways. By 2050, oil use in the transportation sector is reduced by 35–50% from 2005 levels. However, the substitution away from oil branches into alternative transportation systems, as described in Section 17.2.1 . Broadly speaking, these alternatives can be described as “conventional” and “advanced” transportation.
A future conventional transportation system would rely predominantly on liquid fuels (including some oil), biofuels, liquefied natural gas, and potentially the direct use of biogas and natural gas. This represents the least discontinuity from current trends in terms of both end-use tech-nologies and fuel supply and distribution infrastructure. In contrast, an advanced transportation system involves a more fundamental trans-formation, requiring largely new infrastructure systems in the case of hydrogen fuel cell vehicles, or new uses for existing infrastructure in the case of plug-in hybrids or fully electric vehicles.
Both these alternatives are feasible within all three of the GEA pathway groups. Their outcome is essentially one of choice and direction rather than necessity. This is why they are explicitly included as a branching point in the scenario taxonomy. The importance of this branching point stems from the magnitude of the implications on both the demand and the supply sides. On the demand side, for example, vehicle technologies would follow very different innovation and development paths, either reducing the costs and improving the reliability of fuel cells in the hydrogen-based Advanced Transportation system, or improving the flexibility of engines to use both biofuels and fossil-derived liquids in the Conventional Transportation sys-tem. However, the impacts of the transportation branching point are felt particularly strongly on the supply side, as they potentially reduce the flexibility of supply-side portfolios given the GEA sustainability objectives. Similarly, any changes on the supply side can have major implications for the choice of demand-side technologies. These interdependencies are dis-cussed further in the next section, which turns to consider the supply side of the energy system transformations represented in the GEA pathways.
17.3.3 Energy Supply
17.3.3.1 Introduction
The level of energy demand determines the flexibility of supply-side portfolios. This is particularly the case given the ambitiousness of the
Figure 17.8 | World fi nal energy shares of solid fuels, liquid fuels, and grids and on-site generation. Overlapping hatched areas indicate variations across the GEA-Effi ciency and the GEA-Supply pathways. The GEA-Mix pathways lie in between the two others.
0%
10%
20%
30%
40%
50%
60%
70%
80%
90%
100%
2000 2020 2040 2060 2080 2100
Supply
Efficiency
Mix
0%
10%
20%
30%
40%
50%
60%
70%
80%
90%
100%
2000 2020 2040 2060 2080 2100
Supply
Efficiency
Mix
Transport
Residential/commercial
Industry
Transport
Residential/commercial
Industry
Industrialized
Developing
Figure 17.9 | Shares of fi nal energy by sector in the three pathway groups in indus-trialized and developing countries.

Energy Pathways for Sustainable Development Chapter 17
1230
GEA sustainability objectives and the energy transition required to reach the associated targets. Across all the GEA pathways, energy access objectives constrain the use of traditional fuels in developing countries; energy security objectives limit the amount of energy trade and foster the increasing diversity of energy supply; climate change objectives con-strain the use of carbon-intensive energy forms in electricity generation; and so on. Within these already tight constraints, low energy demand allows a greater number of viable options for energy supply, whereas high energy demand reduces the choices available and makes it more difficult to limit or omit specific supply options. Similarly, the future fuel needs of the transportation sector have a further impact on the extent to which supply-side portfolios can be varied in response to political, resource, land, or other requirements.
Having established and analyzed the different levels of demand in the GEA-Efficiency, GEA-Supply, and GEA-Mix groups of pathways, this sec-tion explores variability in the corresponding supply-side transforma-tions, including transmission and distribution infrastructure. 7 The aim is twofold: to enrich the storylines represented by the GEA pathways in fulfilling the sustainability objectives, and to identify both the necessi-ties and the choices available on the supply side of the energy system if these sustainability objectives are to be met.
This section is organized using the branching point approach set out in Section 17.2.2 . First, the principal options on the supply side are set out, covering both energy forms and relevant technologies. Second, the viable portfolios of supply-side options across the GEA-Efficiency, GEA-Supply, and GEA-Mix groups of pathways are assessed, given the different levels of energy demand in each group – the first branching point. Third, the effect of alternative transportation system transformations, either Conventional or Advanced, is explored in terms of supply-side portfolio flexibility – the second branching point. Fourth, the potential for further limiting or omit-ting specific options from the supply-side portfolio is assessed through an extensive sensitivity analysis – the third branching point. Through this process, the three groups of GEA pathways become first 6 and then 60, although ultimately they are reduced to the 41 that are feasible. The feasi-bility analysis indicates how important certain supply-side options are for a the energy transition. However, the results should not be mistaken for pre-dictions. Rather, they can be interpreted as an assessment of the necessary technological changes, exploring the “option values” of different technol-ogy clusters that might, for example, guide future investment decisions.
17.3.3.2 Supply-Side Options and Portfolios
There is a large portfolio of options on the supply side to provide the energy needed to meet the demand for energy services. These options comprise different forms of energy and their attendant conversion
technologies: crude oil converted into petroleum products by refineries to provide transportation fuel and thus mobility, for example, or wind energy converted into electricity by wind turbines to provide lighting. Throughout this section, supply-side options are distinguished in terms of both the primary energy form (e.g., bioenergy, coal, solar energy) and the conversion or processing technology (e.g., biomass-to-liquids, biomass power generation, coal power generation with CCS, solar photovoltaic). Each option also has implications for the transmission and distribution infrastructure: rigs, pipelines, and filling stations in the case of the energy conversion chain from crude oil to mobility; electri-city grids and transformer stations in the case of conversion from wind energy to lighting. These, too, will be considered here.
In scenario studies (as well as historically), there are also a wide range of factors that shape and constrain the shares of final energy provided by different supply-side options. The clearest determining factors relate to cost, efficiency, and other performance attributes. Availability, based on the underlying resource potential, is another factor, although a detailed assessment of the bioenergy and other renewable, fossil, and uranium resources in the context of the GEA pathways show that none of these supply-side options face an absolute resource constraint at the global level (see Box 17.3 and the electronic appendix to this chapter on resource potentials). At the regional level, however, some resource categories could become scarce.
In the context of sustainability assessments like the GEA, other factors also come into play, including environmental impacts (e.g., air pollution, GHG emissions), social impacts (e.g., electrification and clean cooking), and geopolitical considerations (e.g., energy security). The supply-side options used in all the GEA pathways must allow the GEA sustainability objectives to be fulfilled within the timelines and to the extent set out by their associated targets (see Section 17.2.3 ). This means that cer-tain supply-side options are preferred over other options in the energy transition toward its objectives. For instance, technologies like bioen-ergy and other renewable energy sources, nuclear energy, and CCS have the potential to help meet the climate target. CCS can also be used in combination with bioenergy (BioCCS) to produce net negative carbon dioxide (CO 2 ) emissions (see Chapter 11 , Section 11.3 for more details about the technology). This is another potentially important option in the context of climate stabilization objectives.
An alternative option to reduce CO 2 emissions is carbon sink enhance-ment through afforestation. As both BioCCS and carbon sinks can sig-nificantly affect the magnitude and timing of emissions reductions on the energy supply side, both are included in this analysis.
Cost, performance, resource availability, and sustainability criteria are not the only factors influencing the projected success of these supply-side options. Some options require advanced technological knowledge, which is not universally available (and which has contributed to his-torical differences in primary energy supply patterns at the country or regional level). Other options face barriers to a rapid scaling up (Wilson,
7 The supply-side fl exibility analysis relies primarily on the MESSAGE modeling framework, but the fi ndings have been checked for consistency with the pathways generated with the IMAGE model.

Chapter 17 Energy Pathways for Sustainable Development
1231
2009 ). Integrating high proportions (e.g., 20% or more) of intermittent energy sources such as wind or solar in electricity grids is an example. Still other options face issues of public acceptance. Nuclear energy in some countries is an obvious example, but some forms of renewable energy, such as large-scale hydropower, bioenergy, on-shore wind, and CCS, are others. Some options, such as nuclear, entail also other societal risks due to accidents or proliferation of fissile material for weapons use. The overall conclusion of the GEA assessment on nuclear is thus that until the proliferation potential is better controlled and safer reactor designs are available, countries (especially those considering building their first nuclear power plants) should consider other climate-friendly power supply options first (for a further discussion, see Chapter 14 ). Finally, the requirements of some supply-side options in terms of new physical infrastructure and distribution systems are highly capital inten-sive but face initially low overall demand, and thus are often unattract-ive to both private investors and resource-limited public investors.
In light of all these potential issues, the approach taken here begins by elaborating the broadest possible decision space, or range of possibilities, in terms of supply-side portfolios in each of the three GEA pathway groups (GEA-Efficiency, GEA-Mix, and GEA-Supply). First, the full range of supply-side options is considered, subject to cost, performance, and system inte-gration constraints but always respecting the overarching need to comply with the GEA targets. As noted earlier, the level of demand has a signifi-cant impact on supply-side flexibility: the greater efficiency improvements
and reductions in energy services demand of the GEA-Efficiency group of pathways leave more options open on the supply side. Next, this max-imal decision space is reduced in stepwise fashion. The impacts of major changes in the transportation system on this unrestricted supply portfolio are explored. Finally, the impacts of specific restrictions or omissions of particular supply-side options are considered, to reflect the sensitivities or concerns surrounding their widespread deployment. These restricted supply portfolios, as well as the transportation analysis, provide a broad sensitivity analysis around the unrestricted supply portfolio, illustrating which options are “musts” and which others are choices.
17.3.3.3 Supply-Side Options under Different Levels of Demand
Figure 17.10 summarizes the result of the unrestricted supply port-folio analysis for the three levels of energy demand represented in the GEA-Efficiency, GEA-Mix, and GEA-Supply pathway groups. It compares the primary energy supply mix in 2030 and 2050 under each of the three groups with that in 2005. 8 Each future primary energy supply mix depicted can be interpreted as the least-cost portfolio subject to
EJ
0
200
400
600
800
1000
1200
2005 2030 2050
Geothermal
Solar
Wind
Hydro
Nuclear
Gas wCCS
Gas woCCS
Oil
Coal wCCS
Coal woCCS
Biomass wCCS
Biomass woCCS
Figure 17.10 | Composition of global primary energy supply in 2005, 2030, and 2050 across pathway groups under an unrestricted supply portfolio and Conventional Transportation setup.
8 A well-recognized problem with reporting primary energy supply is how to include noncombustible energy forms (e.g., nonbiomass renewables and nuclear energy). Here the substitution method is used to back-calculate primary energy by assigning a 35% effi ciency for electricity generation from noncombustible sources and an 85% effi ciency for heat generation (see Chapter 1 for details).

Energy Pathways for Sustainable Development Chapter 17
1232
the cost and performance characteristics of the different supply-side options and the need to fulfill the GEA objectives with respect to access, environment, and security.
The most striking difference across pathway groups is in the total demand provided by the energy system. In terms of supply-side options, the figure also shows the breadth of the supply portfolio needed to meet the GEA sustainability objectives: most if not all options contribute across all three pathway groups. Nuclear energy makes a greater proportional contribu-tion in the GEA-Supply pathways group than in the other groups, which has less flexibility in terms of portfolio restrictions. 9 Conversely, as will be explored further below, the GEA-Efficiency pathways group can tolerate the restriction or even omission of various individual supply-side options.
An equally important difference across pathway groups is the varying degree of urgency for change on the supply side in the medium term. With the ambitious effort on the demand side in the GEA-Efficiency path-way, the change from current supply-side structures can be less rapid. In 2030, with the exception of wind and solar (which grow considerably in absolute terms), the primary energy supply mix in the GEA-Efficiency pathway is only modestly different from that of today. In contrast, the GEA-Mix and, in particular, the GEA-Supply pathways require more radi-cal changes in energy supply. This includes a more rapid scaling up of all renewable supply options, and CCS, which by 2030 needs to remove up to 10% of CO 2 emissions from fossil fuel combustion in the GEA-Supply pathways, increasing to about 50% by 2050. The same is true for nuclear energy, which in the GEA-Efficiency pathway (with an unrestricted sup-ply portfolio) continues to contribute about the same amount of energy as today or less through 2050, whereas in the GEA-Mix and GEA-Supply pathways a two- to fivefold increase up to 2050 is observed. For path-ways with a nuclear phase-out see sections 17.3.3.5 and 17.3.4 .
17.3.3.4 Supply-Side Options under Different Transportation Systems
As noted in Section 17.3.2 , the structure of the transportation sector decisively influences the feasibility of supply-side portfolios. Therefore, the analysis below distinguishes between two sets of assumptions about the transportation sector transition, labeled Advanced Transportation and Conventional Transportation. The Advanced Transportation setup is characterized by a transition to electricity or hydrogen, or both, as main transportation fuels in the medium to long term. By 2050 these two fuels would have to deliver between roughly 20% and more than 60% of the transportation sector’s final energy, depending strongly on
overall transportation demand. This implies a massive buildup of new infrastructure over the coming decades. Whereas such a transition could proceed more gradually in the case of electrification, the transition to hydrogen is more challenging, because bulky investments in a new distribution infrastructure would need to be made. On the other hand, hydrogen would be more compatible with the existing refueling infra-structure and business model, which might have to change significantly in a largely electrified transport sector (Andersen et al., 2009 ). In con-trast, the Conventional Transportation story would stay mostly within current modes of operation, largely relying on liquid fuels and, in some regions, on gas. Still, a growing share of electricity would also be needed in this conventional world, reflecting a combination of a modal shift toward public transportation and some electrification of at least short-distance individual transport.
Two different interpretations of the Advanced Transportation setup are realized in the GEA scenario analysis: an electric route and a hydrogen route. These have in common that numerous additional energy sources (e.g., nonbiomass renewable energy, nuclear energy) become available to the transportation sector on a large scale. 10 The electric route leads to a substitution process, dominated by electric vehicles and plug-in hybrids in combination with biofuels. The alternative route, hydrogen, explores a transition toward a long-term transportation sector that is dominated by hydrogen fuel cell vehicles after 2050. In contrast, the Conventional Transportation setup tends to follow a regionally more diversified path, depicting the coevolution of a wide portfolio of fuels and technologies with similar shares, including hybrid vehicles, flexible cars using biofuels in conjunction with fossil liquids from natural gas (in combination with CCS to reduce carbon emissions), and direct use of biogas and natural gas. These alternative transportation sector configurations also have import-ant implications for the required technological innovation and improve-ments in vehicle engines. R&D and deployment incentives are needed in the Advanced Transportation setup to reduce costs and improve the reliability of either fuel cells or the next generation of batteries. The tran-sition under the Conventional Transportation setup relies more heavily on advanced and more flexible designs of internal combustion engines.
As illustrated by Figure 17.11 , the differences between the alternative transportation sector assumptions tend to play out more severely in the GEA-Mix and particularly the GEA-Supply groups of pathways, simply because demand is significantly higher by 2030 and still higher by 2050. Total primary energy supply is lower in an Advanced Transportation world than in a Conventional Transportation world, because the well-to-wheel efficiency of the electric and hydrogen routes is generally higher than that of the liquid route (van Vliet et al., 2010 ; 2011 ). A more subtle difference concerns the higher uptake of the available bioenergy potential under the Conventional Transportation option by 2030 across the three groups of
9 The main reasons for the high nuclear contribution in the GEA-Supply pathways is the high demand of energy, which reduces the fl exibility of supply (see Section 17.3.3.5 ) and thus results in comparatively higher prices for energy. The higher energy prices, in turn, increase the demand for more costly energy options, such as nuclear. Different phase-out pathways for nuclear, however, show that the transform-ation toward the sustainability objectives are in principle technically possible also in the GEA-Supply pathways ( Section 17.3.3.5 ).
10 The Advanced Transportation sector in the GEA-Supply pathways relies largely on hydrogen, whereas in the GEA-Effi ciency pathways the electric route is chosen. The GEA-Mix pathways rely to a greater extent on electricity in their MESSAGE interpret-ation and more on hydrogen in the IMAGE interpretation.

Chapter 17 Energy Pathways for Sustainable Development
1233
pathways. The different final energy patterns of the two transportation sec-tor configurations are shown in Figure 17.12 for the GEA-Mix pathway.
Given the ambitious goals of the energy transition, this difference in the transportation sector has profound implications for the supply-side
choices, particularly for the GEA-Mix and GEA-Supply groups of path-ways. The Advanced Transportation setup generally opens additional supply routes for transportation fuels such as electricity and hydrogen from non-biomass renewables or nuclear energy, whereas Conventional Transportation offers fewer routes, to a large extent relying on fossil
GE
A-E
ffic
iency
GE
A-M
ix
GE
A-S
upply
GE
A-E
ffic
iency
GE
A-M
ix
GE
A-S
upply
EJ
0
200
400
600
800
1000
1200
2005 2030 2050
Geothermal
Solar
Wind
Hydro
Nuclear
Gas wCCS
Gas woCCS
Oil
Coal wCCS
Coal woCCS
Biomass wCCS
Biomass woCCS
conventional transportation
advanced transportation
Figure 17.11 | Composition of global primary energy supply in 2005, 2030, and 2050 across pathway groups under an unrestricted supply portfolio and alternative transpor-tation sector assumptions.
2000 2020 2040 2060 2080 2100
%
0
20
40
60
80
100
Electricity
Hydrogen
Gases
Biofuels
Fossil Synfuels
Oil Products
Coal
2000 2020 2040 2060 2080 2100
(a) GEA-Mix Advanced Transportation (b) GEA-Mix Conventional Transportation
Figure 17.12 | Development of global fi nal energy fuel shares in the transportation sector under Advanced and Conventional assumptions for the GEA-Mix pathways group.

Energy Pathways for Sustainable Development Chapter 17
1234
fuels and bioenergy and leading to reduced flexibility on the supply side. The limited potential of sustainable bioenergy is the main deter-minant of the reduced number of feasible transition pathways under the Conventional Transportation assumption (see Section 17.3.4.3 for details), because bioenergy is one of the few remaining ways to reduce GHG emissions in the transportation sector and in selected other parts of the energy system (e.g., bioenergy feedstocks for nonenergy use; see Dornburg and Faaij, 2005 ).
17.3.3.5 Supply-Side Options under Different Portfolio Restrictions
Portfolio Restrictions as a Sensitivity Analysis The analysis presented here relies on a set of “restricted portfolio” pathways in which selected supply-side options are either limited or excluded completely, in order to focus on overall questions of feasibil-ity and on economic and resource implications. These pathways should therefore be interpreted as sensitivity analyses around the central case of the full or “unrestricted” portfolio for each of the three GEA pathway groups. 11 An important assumption underlying this restricted portfolio analysis is that the level of energy demand in each group of pathways is fixed. 12
In total, nine different restricted supply portfolios are explored for each of the six possible combinations of GEA-Efficiency, GEA-Mix, and GEA-Supply pathway groups and two transportation system transformations (Conventional and Advanced). Together with the unrestricted portfolios, this results in 60 different possible pathways (3 levels of demand × 2 transportation systems × 10 supply portfolios).
Issues, concerns, and potential constraints facing different supply-side options were the basis for the choice of restricted portfolios analyzed. Six supply-side options were either limited or excluded, either in isola-tion or in combination with other options. 13 These options and the cor-responding restricted portfolio pathways are shown in Table 17.9 . Also presented are summaries of the rationales for including these particular restricted portfolios.
Table 17.9 | Overview of restricted supply portfolios.
Supply-side option
Main rationales for restriction
Restricted portfolio pathways
Description
CO 2 capture and storage (CCS)
Storage availability Social acceptability Infrastructure requirements Environmental risks
No CCS 1 CCS excluded
Bioenergy with CCS (BioCCS)
See entries for CCS and bioenergy
No BioCCS 1 Bioenergy used only for co-fi ring in fossil CCS facilities (no dedicated BioCCS facilities)
Carbon sinks (afforestation)
Resource availability Land use impacts Political acceptability
No sinks No additional afforestation beyond baseline assumption of no net global deforestation from 2070 onward
Bioenergy Resource availability Land use impacts Food security risks Environmental risks
Limited bioenergy
Bioenergy potential reduced to 50% of central estimate to refl ect potential implementation issues for sustainable bioenergy
Nuclear energy Environmental risks Social acceptability Proliferation risk
No nuclear 1 No new nuclear power plants built after 2020, leading to full phase-out after 2060 (assuming 40-year plant lifetime)
Renewable energy
Systems integration Limited renewables
Intermittent renewables (wind, solar) restricted to 20% of fi nal electricity consumption
Combinations 2 Limited bioenergy + Limited renewables No nuclear 1 + No CCS 1 No BioCCS 1 + No sinks + Limited bioenergy
1 Option was fully excluded from the portfolio; for other options the restriction was implemented in terms of limited potentials.
2 See individual options for rationales and descriptions.
11 Similar analyses, mostly in the context of climate change mitigation, have been done in the ADAM (Edenhofer et al., 2010b ) and RECIPE (Edenhofer et al., 2010b ) modeling comparison studies and in several individual publications (Krey and Riahi, 2009 ).
12 Generally, excluding options from the supply portfolio leads to increased prices of energy services, because more expensive supply options have to be utilized. In this situation, standard economic theory suggests a price-induced demand response, which in this analysis is not considered, because by design the supply-side fl exibility is investigated given a fi xed level of demand for energy services.
13 An additional potential option would have been to limit the availability of unconven-tional fossil resources. This has not been implemented, however, since the stringent climate target allows unconventional resources no signifi cant role in the pathways (even if no restriction is assumed).
The results of the portfolio analyses are shown in Figure 17.13 for the 3 × 2 × 10 matrix of pathways. The 19 blank columns, each marked with an X, show those pathways that were not feasible given the portfolio restrictions.
A headline conclusion of the portfolio analysis is that the low level of energy demand in the GEA-Efficiency group of pathways makes it possible to reach the sustainability objectives in the absence of both nuclear energy and CCS. For the intermediate and high levels of energy demand under the GEA-Mix and GEA-Supply pathways, respectively, excluding either nuclear or CCS is typically possible, but in the high-demand case this requires transforming the transportation system away from liquid fuels. In the context of climate change mitigation, only a limited number of studies (e.g., Krewitt et al., 2009 ; Teske et al., 2010 ; Delucchi and Jacobson, 2011 ; F ø yn et al., 2011 ; Jacobson

Chapter 17 Energy Pathways for Sustainable Development
1235
Box 17.3 | Resource Potentials
Integrated Assessment Models like IMAGE and MESSAGE typically do not consider the full technical potential of energy resources but include additional criteria, such as sustainability or economic criteria, which are not fully captured within the models but which lead to a signifi cant reduction of the technical potential. For the GEA pathways, the ranges of these deployment potentials are summarized in Table 17.10 . The resource assumptions for all sources are within the ranges of resource uncertainties assessed in Chapter 7 (see also the electronic appendix to this chapter for more details).
and Delucchi, 2011 ) have looked at ambitious climate stabilization scenarios that exclude nuclear and CCS completely from the supply-side portfolio, thus relying exclusively on a combination of renewable energy and energy efficiency.
Another important insight from the portfolio analysis is that the low energy demand in the GEA-Efficiency pathways also enables an energy transition with limited contributions from bioenergy, without BioCCS and without relying on carbon sink management. All of these land use-related supply options have potentially adverse impacts and are contro-versial in the literature (see Section 17.3.4.7 and the electronic appendix to this chapter).
Table 17.10 | Fossil fuel resources and renewable energy potentials.
GEA pathways: Chapter 7
Energy source reserves and resources (ZJ) 1 Reserves (ZJ) Resources (ZJ)
Fossil fuels
CoalConventional oilUnconventional oilConventional gasUnconventional gas
259 – 3769.8– 11.18.9 – 23.011.6 –16.823.0– 96.4
17.3 –21.04.0 –7.63.8– 5.65.0 –7.1
20.1 – 67.1
291 –4354.2 –6.2
11.3– 14.9 2 7.2 –8.9
40.2 – 122
Deployment potential in 2050 (EJ/year) Technical potential (EJ/year)
Renewables
BioenergyHydroWindSolar photovoltaicCSPGeothermal
145–17018.7–28170–344
1650–1741990 3 23 4
160–27050–60
1250–225062,000–280,000
810–1400
Notes: The deployment potentials for noncombustible renewable energy sources in the pathways are specifi ed in terms of the electricity or heat that can be produced by specifi c technologies (secondary energy perspective). By contrast, technical potentials from Chapter 7 refer to the fl ow of energy that could become available as inputs for technology conversion (e.g., the technical potential for wind is given as the kinetic energy available for wind power generation, whereas the deployment potential as reported in this chapter gives the electricity that can be generated by wind turbines). In addition to the renewable energy potentials stated in this table, technology diffusion and systems integration constraints may apply in the pathways and prevent the potentials from being fully utilized. Note that elsewhere in Chapter 17 the substitution method is used to report primary energy from non-combustible sources and therefore primary energy numbers can exceed those reported as deployment potential in this table.
1 One zettajoule (ZJ) equals 1000 EJ, or 10 21 joules.
2 Estimates for unconventional oil that are not separated into reserves and resources reach signifi cantly higher values than reported in this summary from Chapter 7 (see Table 7.8a/b ).
3 The potential is from MESSAGE as the IMAGE modeling framework does not include CSP.
4 Geothermal energy is exogenously determined in the IMAGE scenarios; therefore no deployment potential can be specifi ed.
Furthermore, how the transportation sector is configured has profound implications for supply-side flexibility. Under the Advanced Transportation setup, the GEA-Supply group of pathways is still feasible if either BioCCS, carbon sink enhancement, nuclear energy, full bioenergy supply, or the large-scale deployment of other renewable energy is not considered an option. Under the Conventional Transportation setup, only nuclear energy can be excluded to keep the GEA sustainability targets within reach.
The situation is somewhat improved in the GEA-Mix group of pathways, where the Conventional Transportation setup still allows for the same choices as the Advanced Transportation setup under high energy demand. CCS turns out to be a crucial technology under these conditions, because

Energy Pathways for Sustainable Development Chapter 17
1236
in the absence of a major transition to electricity or hydrogen, or both, bio-fuels are the only alternative available to decarbonize the sector. As in the GEA-Supply groups of pathways, the limited sustainable bioenergy poten-tial is a constraining factor, and CCS is important to remove the carbon from bioenergy feedstocks that does not end up in the liquid biofuel itself.
In contrast, the strong focus on energy efficiency, to some extent com-bined with lifestyle changes (transportation demand is most affected;
see Section 17.3.2 on energy demand), in the GEA-Efficiency group of pathways allows the greatest flexibility on the supply side, essentially independent of the transportation sector assumptions – at least for the portfolio of options examined within this analysis.
Restrictions on CO 2 Capture and Storage Background to Restrictions – Although CCS has not been deployed in energy applications beyond the demonstration level, the scenario lit-erature indicates that it could play an important role as a bridge or transitional technology under stringent climate targets (Edenhofer et al., 2009 ; Krey and Riahi, 2009 ; Luderer et al., 2009 ; Edenhofer et al., 2010a ). 14 However, the use of CCS raises various issues. First, the deploy-ment potential is limited by storage capacity at both the global and the regional scale (see Section 17.3.4.4 on regional analysis). Second, even relatively low leakage rates (e.g., between 0.1% and 1%) can comprom-ise CCS as a climate stabilization option (van der Zwaan and Smekens, 2009 ). Third, upstream emissions from fossil fuel extraction (including of non-CO 2 gases) reduce the comparative effectiveness of fossil CCS as a low-carbon supply-side option. Fourth, in contrast to other low-carbon options, CCS is a single-purpose technology with limited or no ancil-lary benefits, and it imposes an energy penalty, thus increasing resource consumption (see also Section 17.7 on multiple benefits).
Results of Restrictions – Figure 17.13 shows the importance of CCS as a transitional supply-side option. For all pathways with high levels of energy demand (the GEA-Supply pathways group), including those with Advanced Transportation, the No CCS restricted supply portfolio is not feasible. The No CCS restriction is feasible for the GEA-Mix pathways group (with inter-mediate levels of energy demand), but only if the transportation system does move away from the currently dominant liquid fuels.
In other words, the supply-side analysis shows that CCS is a necessary supply option if the level of demand and the associated energy intensity improvements remain on current trajectories, and if the transportation sector remains more or less compatible with existing infrastructures and business models. These infrastructures can continue to serve a large frac-tion of energy demand, and the required decarbonization of the energy system is accomplished using CCS in an “end of the pipe” mode.
Restrictions on BioCCS and Sinks (Negative GHG Emissions Options) Background to Restrictions – Supply-side options that can produce con-siderable amounts of net negative GHG emissions include carbon sink enhancement and BioCCS (bioenergy in combination with CCS). Capture of CO 2 from the atmosphere (CO 2 air capture, artificial trees) is another option but is not addressed here (for details see, e.g., Baciocchi et al., 2006 ; Keith et al., 2006 ; Zeman, 2007 ). Although the current emphasis with CCS is on fossil fuel conversion technologies, large-scale biomass co-firing (practiced today in coal-fired power plants typically at the level of a few percent; see, e.g., De and Assadi, 2009 ) could become an attractive
EJ
0
200
400
600
800
1000
1200
2005
Savings
Geothermal
Solar
Wind
Hydro
Nuclear
Gas wCCS
Gas woCCS
Oil
Coal wCCS
Coal woCCS
Biomass wCCS
Biomass woCCS
EJ
0
200
400
600
800
1000
1200
2005
EJ
0
200
400
600
800
1000
1200
2005
GEA-Supply
GEA-Mix
GEA-Efficiency
Advanced transportation Conventional transportation
X X X X X X X XX X X X
X X X XX X X
*
*
Figure 17.13 | Composition of global primary energy supply in 2005 and 2050 for the three pathway groups under alternative transportation sector assumptions and sup-ply portfolios. See Table 17.9 for details of the restricted supply portfolios. Xs indicate infeasible pathways. Pathways marked with an asterisk are bordering on infeasibility, with carbon prices slightly higher than defi ned in the note below. Energy savings are calculated by comparison with a hypothetical case with energy intensity improve-ments compatible with historical trends and no additional climate and energy policies (see also Section 17.3.2.1).
Note: Feasibility is technically defi ned here as the inability of the supply side to deliver the (fi xed) useful energy demand. As uncertainties grow over time, modest undersup-ply of service demands of up to 5% beyond 2050 is still interpreted as feasible. As in other studies (e.g., Clarke et al., 2009), this concept is operationalized by declaring pathways with carbon prices higher than US$1000/tCO2 in 2012 (as a result of so-called demand backstop penetration) infeasible. This relaxation may lead to limited comparability of economic indicators (e.g., energy-related investments) across the restricted portfolio pathways after 2050.
14 CCS can also become economically feasible in non-intervention scenarios, because of the benefi ts of the captured CO 2 for use in enhanced oil and gas recovery, for example. However, the potential for these applications is limited, and therefore CCS deployment in baseline scenarios is typically constrained to a relatively low level compared with climate stabilization scenarios.

Chapter 17 Energy Pathways for Sustainable Development
1237
supply-side option, helping to reduce residual emissions from coal CCS toward zero without having to increase the capture rate to 100%, which currently appears to be economically unattractive. Once infrastructure has been built to transport CO 2 from its place of origin (e.g., a power plant or cement production plant) to a suitable storage location, the building of smaller-scale BioCCS plants may also become an option.
Results of Restrictions – As can be seen from Figure 17.13 , the No BioCCS and No Sinks restricted portfolio pathways produce fairly similar primary energy supply mixes by 2050, in particular within the GEA-Efficiency and GEA-Mix pathways groups. In both cases, cumulative negative carbon fluxes are similar. In contrast to BioCCS and atmospheric CO 2 capture, carbon sink enhancement is a supply option that is available immedi-ately, but large annual reductions in carbon emissions result only with relatively long lag times. Although their deployment occurs at scale only after 2050, the availability of net negative GHG emissions options is crucial for near-term targets, as they reduce the need for immediate GHG mitigation while still allowing the 2°C climate stabilization target to be reached by 2100. 15 So, in contrast to the other supply-side options considered here, these negative net emissions options affect the supply portfolio throughout the time period of the analysis.
The No BioCCS and No Sinks restrictions require a more aggressive deploy-ment of other low-carbon options in the first half of the century, in particu-lar nuclear energy and renewables ( Figure 17.13 ). In combination, however, with the additional restriction of Limited Bioenergy, this can only be achieved at low levels of energy demand (the GEA-Efficiency pathways).
Restrictions on Bioenergy Background to Restrictions – Bioenergy could play an important role in future energy systems and can contribute to multiple objectives, such as increased energy security (e.g., Brazilian ethanol program; (Goldemberg, 2007 )) and GHG mitigation. Biofuels in the transportation sector represent a relatively low cost alternative to fossil fuels that (unlike hydrogen, for example) also requires less additional infrastructure. Even in scenarios that aim to limit bioenergy use, it might still be attractive to use biofuels for specific transport modes (e.g., air traffic, shipping, or long-distance freight (LBST, 2008 ). In the power sector, bioenergy also represents a rela-tively low-cost option to reduce GHG emissions. Unlike other renewable energies, it does not pose intermittency challenges. In ambitious climate stabilization scenarios, bioenergy is particularly attractive because of the possible combination with CCS (see Section 17.3.3.5 ). Despite these potential benefits, however, if bioenergy production is not implemented in a sustainable way, multiple adverse effects can occur, including compe-tition with food production, net increases in GHG emissions from defor-estation, and biodiversity losses (Rajagopal and Zilberman, 2007 ; Wise et al., 2009 ); see also the electronic appendix to this chapter). Estimates
of bioenergy available in 2050 range as high as approximately 360 EJ, a sevenfold increase over current use (Dornburg et al., 2010 ). Under stricter sustainability criteria and less favorable assumptions about water scar-city and yield improvements, however, the estimated potential can be as low as 60–70 EJ in 2050 (van Vuuren et al., 2010 ).
Results of Restrictions – Limiting bioenergy in the supply portfolio is feasible in all but the GEA-Supply (high demand) pathways group with Conventional Transportation (see Figure 17.13 ). Limited bioenergy implies about 80 EJ/year of sustainable bioenergy, including agricultural residues, by 2050, and less than 125 EJ/year by 2100. The 2050 level would mean less than a doubling of total bioenergy use compared with today, taking into account a substitution of traditional biomass for clean forms of bioenergy as required by energy access objectives.
Restrictions on Nuclear Energy Background to Restrictions – Although nuclear energy can potentially contribute to energy security objectives (by reducing the imported share of primary energy) as well as to climate stabilization and air pollution objectives, it is a controversial supply-side option for various reasons, including the unresolved problem of long-term waste disposal, the risk of catastrophic accidents and the associated liabilities, and the possible prolif-eration of weapons-grade fissile material (see also the electronic appendix to this chapter). An additional concern at present is the imbalance of R&D portfolios in favor of nuclear energy, leading to a diversion of government resources from other important options. Compared with actual nuclear gen-eration capacity, R&D spending is, for instance, among the highest levels of government support across all supply-side options (Grubler and Riahi, 2010 ). The overall conclusion of the GEA assessment on nuclear is thus that until the proliferation potential is better controlled and safer reactor designs are available, countries (especially those considering building their first nuclear power plants) should consider other climate-friendly power supply options first. For a further discussion of risks and concerns, see Chapter 14 . 16 The extent to which nuclear energy can contribute to the GEA objectives is, given the risks and concerns described above, thus very uncertain at the global scale, and even more so at the regional or country level.
Results of Restrictions – The No Nuclear restricted portfolio pathway is feasible under all levels of demand and transportation system alterna-tives. Although Figure 17.13 shows a continued contribution of nuclear energy to the supply mix in 2050 in these pathways, after 2060 this has largely been reduced to zero as the last plants built in 2020 under the No Nuclear restrictions are retired. Most importantly, nuclear energy can in general be seen as a choice rather than a necessity. In other words, alternatives can substitute nuclear energy at a global scale with-out endangering a successful energy transition, which also implies that
15 The potential for future BioCCS to allow a postponement of more costly supply-side options (in present value terms) comes at a price in the form of a reduced likelihood of staying below a certain temperature threshold (see Section 17.5.1 on climate change for details).
16 It should be noted that following historical experience (see Grubler, 2010 ), all path-ways assume that the cost of nuclear power is at best stable or even increasing fur-ther over time. In response to addressing proliferation risks, the analysis is restricted to light water reactors, i.e., a plutonium fuel cycle including fast breeder reactors is not considered to be an option, which can have implications for uranium resource availability at some point (see electronic appendix to this chapter).

Energy Pathways for Sustainable Development Chapter 17
1238
different attitudes toward nuclear energy at the national or the regional level can be facilitated. Hence, the phaseout of nuclear is even possible under the relatively high energy demand projection of the GEA-Supply group of pathways (see Figure 17.13 and Figure 17.14 ). The phase-out of nuclear might lead, however, to somewhat higher costs (see, e.g., invest-ment needs of restricted portfolios in Section 17.3.5 , and IEA, 2010 ).
Restrictions on Other Renewable Energy Background to Restrictions – Like demand reductions, renewable energy can contribute to all the energy system objectives, including energy access (by decentralizing supply), climate stabilization, and energy security (by reducing energy imports and diversifying supply). Although the global renewable energy resource base (technical potential) vastly exceeds projected future primary energy use (see Box 17.3 ), harvesting renewable resources may be limited by factors including land compe-tition and systems integration. The latter issue is discussed further in Chapter 15 , Section 15.8 and in a number of wind energy integration studies, which conclude that penetrations of wind-generated electri-city of up to – and, in a limited number of cases, exceeding – 20% are technically feasible, but not without challenges (see, e.g., Gross et al., 2007 ; Smith et al., 2007 ; Holttinen et al., 2009 ; Milligan et al., 2009 ). In addition, institutional challenges to the expansion of transmission, including cost allocation and siting, can be substantial (Benjamin, 2007 ; Vajjhala and Fischbeck, 2007 ; Swider et al., 2008 ). In interpreting the results of this restriction, it needs to be taken into account that 20% of electricity from wind and solar would be a substantial increase from today’s level, which essentially only Denmark has reached.
Results of Restrictions – The Limited Renewables portfolio restriction reduces the contribution of wind and solar to electricity generation, and thus to the primary energy supply mix ( Figure 17.13 ). The effect is some-what less pronounced for solar energy, because solar thermal (e.g., solar rooftop collectors) and concentrating solar power (CSP) with thermal storage at the power plant level are affected less or not at all by systems integration issues. Restrictions on wind are intermediate in their impact, whereas the reduction of output is strongest for solar photovoltaic, as the curtailment of electricity generation from this source at peak hours
(around noon) can occur at a relatively low installed capacity compared with the system’s overall size. 17
A related and counterbalancing effect of the pathways that assume lim-ited potential of intermittent renewables is that dispatchable renewables (hydro, geothermal, and bioenergy) and other low-carbon electricity gen-eration sources (nuclear and fossil CCS) are deployed to a larger extent. 18
17.3.4 The GEA Pathways: Energy System Transformations
17.3.4.1 Introduction
The pathways analysis presented in the previous sections focused on several different dimensions of a successful energy transformation toward a more sustainable future. These dimensions correspond to the branching points of the scenario design process described in Section 17.2.2 . This analysis led to a total of 60 pathways, of which 41 were feasible alternative representations of an energy transition that fulfills the GEA objectives. The approach taken here is to use a selection of three illustrative GEA pathways, interpreted by two different modeling frameworks – IMAGE and MESSAGE – to integrate the demand-side analysis of Section 17.3.2 with the supply-side analysis of Section 17.3.3 . Narrowing the task down to these three pathways clarifies the important points of similarity and difference within the broader range of 41 pathways. Having firmly established the characteristics of these three illustrative pathways, the section turns in more detail to questions of supply-side flexibility and to regionally disaggregated findings.
17.3.4.2 Three Illustrative GEA Pathways
The three illustrative GEA pathways were selected to combine specific choices at the different branching points. They are not intended to be central cases, most likely cases, or even representative cases. Rather, their intent is to illustrate the types of options available throughout the energy system and to explore critical choices in terms of the magnitude and direction of policies, investments, and broader efforts to transform the energy system. 19
Geothermal
Solar
Wind
Hydro
Nuclear
Gas wCCS
Gas woCCS
Oil
Coal wCCS
Coal woCCS
Biomass wCCS
Biomass woCCS
BiomassCoal
RenewablesNuclearNuclear
OilGas
Geothermal
Solar
Wind
Hydro
Nuclear
Gas wCCS
Gas woCCS
Oil
Coal wCCS
Coal woCCS
Biomass wCCS
Biomass woCCS
1850 1900 1950 2000 2050
EJ
0
200
400
600
800
1000
1200Geothermal
Solar
Wind
Hydro
Nuclear
Gas wCCS
Gas woCCS
Oil
Coal wCCS
Coal woCCS
Biomass wCCS
Biomass woCCS
BiomassCoal
Nuclear
OilGas
BiomassCoal
RenewablesNuclear
OilGas
Figure 17.14 | Development of primary energy in the GEA-Supply pathway with a nuclear phaseout shortly after 2050.
17 The lower penetration of intermittent renewables in the Limited Renewables portfolio pathways also leads to reduced demand for technologies to address load manage-ment issues (such as backup generation capacities, hydrogen electrolyzers, pumped hydro, or compressed air storage).
18 There appear to be no insurmountable technical barriers to high penetration rates of renewables if ancillary changes to system management and infrastructure are implemented appropriately (see, e.g., the high penetration rates of renewables in the GEA pathways with unrestricted renewables).
19 The overarching criterion for the selection of illustrative cases is that they refl ect the main characteristics of each of the groups of GEA pathways (Effi ciency, Mix, Supply). In addition, the selection of illustrative cases is guided by the ranges of different energy options in the peer-reviewed scenario literature (eg the recent assessment by

Chapter 17 Energy Pathways for Sustainable Development
1239
The main distinguishing dimensions of the three illustrative GEA path-ways are as follows:
• Demand versus supply focus. While the assessment shows that a combination of supply- and demand-side measures is needed to transform the energy system, emphasis on either side is an impor-tant point of divergence between different policy choices. A critical factor is thus the extent to which changes in demand for energy services, together with demand-side efficiency measures, can reduce the amount of energy to provide mobility, housing, and industrial services and thus help meet the goals across virtually the whole range of sustainability objectives. This dimension is one of the main distinguishing characteristics, and it motivates the naming of the three illustrative pathways.
• Global dominance of certain energy options versus regional and technological diversity. Once technological change is initiated in a particular direction, it becomes increasingly difficult to change its course. Whether the transformation of the future energy system fol-lows a globally more uniform or a diverse path has thus important implications, given irreversibility, “lock-in,” and path dependency of the system. GEA-Efficiency and GEA-Supply depict worlds with glo-bal dominance of certain demand/supply options, while GEA-Mix is characterized by higher levels of regional diversity.
• Incremental versus radical new solutions. Given the ambitious sus-tainability objectives, transformational changes need to be introduced very rapidly across all GEA pathways. For instance, all pathways fea-ture decreasing shares of presently dominant fossil fuels. The pathways differ, however, with respect to the emergence of new solutions. Some rely more heavily on today’s advanced options and infrastructures
(such as biofuels in GEA-Mix), while others depict futures with radic-ally new solutions (such as hydrogen in GEA-Supply).
In terms of the supply mix that provides for overall levels of energy demand across the three illustrative pathways, Figure 17.15 shows the ongoing transition from primarily fossil fuels, which have dominated since the late 19th century (see Nakicenovic et al., 1998 ) to the low-carbon options – nuclear energy, renewable energies, and fossil energy with CCS – of the second half of the 21st century. 20 The two alterna-tive interpretations of these illustrative transition pathways have been harmonized to a great extent. They start from identical socio-economic assumptions, but the development of final energy is very close as a result of largely harmonized service demand levels (see Box 17.2 ). However, despite sharing many characteristics, there are three dimen-sions in which the interpretations are quite different, and this allows for important insights:
The counterfactuals (or business-as-usual scenarios) underlying these •successful transition pathways are considerably different, which mate-rializes in different levels of energy savings across the MESSAGE and IMAGE interpretation (as shown in Figure 17.15 ). While the MESSAGE counterfactual is more optimistic about the future availability of hydro-carbons and, consequently, many sectors will continue to rely on this option, the IMAGE counterfactual features a transition to coal and nuclear energy becoming the dominant primary energy sources and inducing a shift to synthetic fuels in, for example, the transport sector. Both share, however, similar characteristics when it comes to environ-mental problems, as well as an inability to successfully address energy access and security issues. This illustrates that a successful transition can be achieved from very different starting points.
While the demand-side changes, in particular the role of energy effi- •ciency, have been largely harmonized, the supply-side portfolios are different across the two interpretations of the illustrative GEA path-ways. The MESSAGE interpretations rely to a much greater extent on renewable energy, while in IMAGE, fossil CCS tends to be of greater importance, particularly over the second half of the century. 21 The role of nuclear energy is very similar in the GEA-Efficiency and GEA-Supply pathways in both frameworks while in the GEA-Mix pathway, MESSAGE foresees a significantly larger role for nuclear after 2050 than IMAGE.
the IPCC (2011)). Each of the illustrative cases represents a distinctly different path-way, and together they illustrate the different types of transformations that were explored in more detail through sensitivity analysis of the wider set of 41 feasible pathways. (1) The group of GEA-Effi ciency pathways is characterized by the highest degree of “supply-side fl exibility”. This is illustrated by sensitivity cases with respect to supply-side technology restrictions, all of which were found technologically pos-sible under the GEA-Effi ciency conditions. To illustrate this high degree of supply-side fl exibility and the feasibility to reach the GEA objectives under even restricted portfo-lios, a pathway with a restriction for nuclear was selected as illustrative for the GEA-Effi ciency group of pathways. (2) The group of GEA-Mix pathways is intermediate with respect to many pathway characteristics (eg, energy demand and the required pace for the upscaling of supply-side options). A major characteristic of the Mix path-ways, which distinguished this group from the others, is the diversity of options that contribute toward reaching the GEA objectives. This diversity is most pronounced in the GEA-Mix pathway that assumes restrictions for the electrifi cation of transport, and thus require a variety of “conventional transport” options to satisfy the increas-ing demand for mobility. Hence, this pathway was selected as the illustrative case for the group of GEA-Mix pathways. (3) The GEA sustainability goals become out of reach in most of the GEA-Supply sensitivity cases with restricted supply-side options. The GEA-Supply pathways are thus characterized by the least supply-side fl exibility, requiring the more rapid and pervasive upscaling of supply-side options compared to the other groups of pathways. To illustrate the limited supply-side fl exibility and the need of rapid upscaling of supply-side options, an unrestricted portfolio case that allows all options to penetrate the market was selected as the illustrative pathways for GEA-Supply.
20 The reporting convention for primary energy in the GEA follows the substitution method. It cannot be overemphasized that for transition pathways towards a sus-tainable energy future that imply fundamental change in the energy system, the accounting method can introduce a signifi cant perception bias. A more detailed dis-cussion of this issue can be found in Chapter 1 .
21 It should be noted that the representation of solar energy in the IMAGE modeling framework is restricted to solar photovoltaic, which leads to signifi cantly lower solar energy contributions in the IMAGE interpretation of the GEA pathways. For other forms of renewable energy, the differences between the IMAGE and MESSAGE inter-pretations are much less pronounced.

Energy Pathways for Sustainable Development Chapter 17
1240
2005 2020 2040 2060 2080 2100
EJ
0
500
1000
1500
2000
2500
2005 2020 2040 2060 2080 2100
EJ
0
500
1000
1500
2000
2500
2005 2020 2040 2060 2080 2100
EJ
0
500
1000
1500
2000
2500
2005 2020 2040 2060 2080 2100
EJ
0
500
1000
1500
2000
2500
Savings
Geothermal
Solar
Wind
Hydro
Nuclear
Gas wCCS
Gas woCCS
Oil
Coal wCCS
Coal woCCS
Biomass wCCS
Biomass woCCS
2005 2020 2040 2060 2080 2100
EJ
0
500
1000
1500
2000
2500
Savings
Geothermal
Solar
Wind
Hydro
Nuclear
Gas wCCS
Gas woCCS
Oil
Coal wCCS
Coal woCCS
Biomass wCCS
Biomass woCCS
2005 2020 2040 2060 2080 2100
EJ
0
500
1000
1500
2000
2500
Savings
Geothermal
Solar
Wind
Hydro
Nuclear
Gas wCCS
Gas woCCS
Oil
Coal wCCS
Coal woCCS
Biomass wCCS
Biomass woCCS
GE
A-E
ffic
iency
GE
A-M
ixG
EA
-Supply
MESSAGE IMAGE
Figure 17.15 | Development of primary energy supply in the three illustrative GEA pathways in both their MESSAGE (left-hand side) and IMAGE (right-hand side) interpretations.
Notes: Energy savings were calculated compared to hypothetical cases without climate or any other energy policies – the so-called counterfactuals – and are roughly compat-ible with historical energy intensity improvements.

Chapter 17 Energy Pathways for Sustainable Development
1241
The level of final energy use is very similar in the respective IMAGE •and MESSAGE interpretations of a particular GEA pathway, but due to the primary energy reporting convention adopted in this report – the substitution method (see Chapter 1 for details) – the resulting primary energy supply mix appears very different across the two interpretations.
Specific characteristics of the illustrative GEA pathways are summarized below, followed by a more detailed discussion of the commonalties and choices across all pathways in the next section.
The illustrative • GEA-Efficiency pathway features a strong emphasis on efficiency and a heavy reliance on renewable energy, with a share of between 50–90% of primary energy in the long term (2100). Nuclear is assumed to be phased out over the lifetime of existing capacities to reduce the proliferation risk, and CCS provides an optional bridge for the medium-term transition toward a renewables-based energy system. The strong emphasis on efficiency reduces the growth of energy demand over the course of the century by about a factor of 2 (see comparison of the GEA-Efficiency and GEA-Supply pathways in Figure 17.15 ). This corresponds to roughly doubling the energy intensity improvement rate over historical experience and requires policies in the buildings sector to improve by a factor of 4 by 2050 (a global retrofit rate of 3%/year); in the industry sector, it requires the rapid adoption of best available technology, retrofitting of exist-ing plants, enhanced recycling, and lifecycle product design; in the transportation sector, it requires reducing energy demand through both aggressive efficiency standards (in both freight and passenger transport) and behavioral and lifestyle changes (a switch to public transport and the reduction of demand for private mobility). Table 17.11 recalls the relative contributions of different demand-side transformations in the illustrative GEA-Efficiency pathway, whose absence in the GEA-Supply pathways explains the higher primary energy supply trend. Although efficiency improvements make the largest contributions toward the lower levels of demand in the GEA-Efficiency pathways, these are not viable without complementary policies and measures (including direct and indirect energy pricing) to mitigate demand for energy services.
The illustrative • GEA-Supply pathway has a major focus on the rapid upscaling of all supply-side options. The more modest emphasis on energy efficiency and conservation leads to energy intensity improvement rates slightly above historical experience. Massive upscaling of R&D and deployment investments leads to the emer-gence of new infrastructures and fuels (such as hydrogen vehicles in the transportation sector). Fossil CCS becomes an essential build-ing block to decarbonize fossil fuels, and new nuclear power plants gain a significant market share after 2030. 22 A prerequisite of the
GEA-Supply pathway is thus that the associated proliferation risks of weapons-grade fissile material are addressed successfully through, e.g., internationalization of the nuclear fuel cycle. Renewable energy contributes significantly in the long term, with bioenergy playing a more important role in the developing world while wind deployment is occuring in about half of today’s OECD countries. The role of other renewable energy sources is more heterogeneous in the two differ-ent interpretations by MESSAGE and IMAGE.
The illustrative • GEA-Mix pathway is intermediate with respect to many scenario characteristics, such as the focus on efficiency and the pace of supply transformation (i.e., upscaling of advanced and clean supply-side technologies). The main emphasis is on diversity of the energy supply mix, thus enhancing system resilience against innov-ation failures or technology shocks. Large differences in regional imple-mentation strategies reflect local choices and resource endowments. Whereas the absolute level of nuclear energy deployment is differ-ent between the MESSAGE and IMAGE interpretations, the regional focus of its deployment is Asia in both frameworks where more than two thirds of new capacity is commissioned. In the MESSAGE inter-pretation of the pathway, this results in the co-evolution of multiple fuels, particularly in the transport sector where, for example, second generation biofuels (in Latin America, Former Soviet Union, North America, and Pacific OECD), liquid fossil fuels with CCS (China and the Middle East), and electricity (which gains importance globally, although the generation portfolio differs significantly across regions)
22 In the illustrative GEA-Supply case nuclear energy grows to the level of 1850 GWe installed capacity, which is above the IAEA high projection of 1228 GWe, and the present (May 2011) level of 366 GWe of mostly relatively aged capacities. This
Table 17.11 | Approaches to reducing energy demand in the GEA-Effi ciency pathways.
Approach
Relative contribution to reducing energy demand
Residential and
commercial sector
Transport sector
Industrial sector
Improvements in technological effi ciency
High High High
Structural changes in the type of energy services demanded
Low Medium Low
Reductions in the level of energy services demanded
Low Medium Low
level of expansion might be increasingly diffi cult to achieve in the aftermath of the Fukushima accident. In the past, nuclear growth has been below the IAEA’s high pro-jection – and, until 2000, even below its low projections. The range of nuclear in the GEA pathways is similar to the ranges found in other studies in the peer-reviewed scenario literature. For example, the IPCC Report on Renewable Energy (Fischedick et al, 2011 ) has assessed the recent literature on mitigation scenarios. The nuclear deployment of the underlying scenarios was collated by Clarke and Krey (personal communication, 2012). An analysis of the underlying data shows that 25% of the 137 mitigation scenarios assessed by the IPCC Report on Renewable Energy have higher nuclear deployment by 2050 than the GEA-Supply pathway. The lower bound of the GEA is representative of other low nuclear pathways from the literature that explore GHG mitigation in case of a nuclear phase-out.

Energy Pathways for Sustainable Development Chapter 17
1242
gain importance in different regions. The same interpretation of the pathway using the IMAGE model shows less transport fuel diversi-fication and feeds into a hydrogen-dominated transportation sector much as in the GEA-Supply storyline. The IMAGE interpretation, in turn, shows a stronger diversification of electricity generation and hydrogen production, particularly in the long term.
17.3.4.3 Commonalities and Choices across the GEA Pathways
Introduction Despite major differences in the levels of energy demand and in the nature of transportation system transformation, the three illustrative GEA pathways share certain supply-side characteristics. All show a decarbonization of the supply mix away from conventional fossil fuels, particularly coal. All show an ever-increasing share of energy services demand being met by renewable energy, particularly by the end of the century. All show a substitution of traditional biomass for clean forms of bioenergy.
These commonalities are pervasive features of all the transition path-ways for the global energy system toward the sustainability objectives. They can be interpreted as “musts” – that is, required elements of the supply-side transformation if the access, environmental, and security objectives are to be fulfilled.
In other areas, the three illustrative pathways have major points of difference. The most obvious, and the most influential, is the level of energy demand, which distinguishes the pathways by design. Emphasis on demand-side transformation varies massively between the GEA-Efficiency pathways and the GEA-Supply pathways at the extremes. Another point of difference, again by design, is the nature of transform-ation in the transportation sector, either Conventional, with an ongoing reliance on liquid fuels, or Advanced, a more radical departure from his-torical trends and existing infrastructures and technologies.
These points of difference are analogous to broad, systemic choices about how and where to direct attention, investment, and policies in order to transform the energy system. None of the outcomes of these choices precludes a transition pathway that fulfills the GEA sustainabil-ity objectives: all are therefore feasible within these normative bounds. However, the interdependencies within the energy system mean that choices made in one part of the system have potentially major enabling or constraining effects elsewhere. This was most clearly demonstrated in the comparison of the illustrative GEA-Efficiency and GEA-Supply path-ways as to their degree of supply-side flexibility.
This section moves from an analysis of the three illustrative GEA path-ways using both IMAGE and MESSAGE to the full suite of pathways, including those 41 feasible pathways based on additional MESSAGE analysis, to establish further commonalities and choices. These are organized in six related sections: the first three relate to the major
energy conversion chains of electricity generation, the “other” conver-sion sector (mainly liquid and gaseous fuels), and the upstream sector that supplies fuels; the other three relate to supply-side decarboniza-tion, looking at low-carbon energy in general and CCS and bioenergy in particular.
Commonalities and Choices: Electricity Generation The commonalities in primary energy supply with respect to decarbon-ization also hold for electricity generation. First, across all GEA pathways, the fossil electricity generation technologies that dominate today’s sys-tem are on the retreat. Second, low-carbon alternatives, taken together, grow across the board. As a group of supply-side options, these low-carbon alternatives include fossil CCS, nuclear power, and renewable electricity generation.
Beyond these commonalities (which are largely intuitive given the chal-lenge of climate stabilization), electricity generation has three further common features across all GEA pathways. First, conventional coal power generation has to decrease very soon, and by 2030 should not supply more electricity than today. This implies that new construction of coal power plants without CCS must stop, and that some existing plants will have to be retired prematurely or, if possible, retrofitted with CCS (see Chapter 12 , Section 12.6.3 for a discussion of CCS retrofitting).
Second, gas power generation, mostly in combined-cycle configurations but also as gas turbines for load balancing, sees considerable growth until around 2030 and only thereafter faces a decline. This is also a commonality across most GEA pathways. In other words, whereas coal power without CCS must phase out rapidly, gas power can be consid-ered a short- to medium-term bridge or transitional technology until longer-term options become more available at scale.
Third, renewable power technologies show significant increases com-pared with the role they play in electricity generation today. This is clearly visible in Figure 17.16 . This finding is consistent with a recent large-scale analysis of renewable energy in long-term transition scenarios by Krey and Clarke (2011). The GEA pathways analysis did not consider scenarios that exclude renewables completely, but limitations of various options were explored. Under these constraints, relatively mature technologies such as hydropower and onshore wind experience strong growth to 2030 and to 2050, with limited variability between pathway groups. Solar photovoltaic and CSP 23 are more variable and show stronger deployment after 2030, although by 2020 the average deployment shows a multifold increase compared with today’s levels. Biomass and geothermal electri-city generation show much lower deployment levels on average com-pared with these other renewable technologies.
Three important points relating to these common trends in renewable power should be noted. First, even the lower end of market volumes
23 Note that IMAGE does not include CSP and therefore the above statement only refers to the MESSAGE interpretation of the pathways.

Chapter 17 Energy Pathways for Sustainable Development
1243
shown for 2020 will require effective and stable policy frameworks, extending those that are increasingly observed in the current situ-ation. Second, deployment levels vary greatly by region according to local resource potentials. This is discussed further in Section 17.3.4.4 . Third, increasing requirements of storage technologies are character-istic for pathways with very high deployments of intermittent sources (wind, solar photovoltaic, and to a lesser extent CSP).This trend is more pronounced in the medium and long term,, when renewable energy become the dominant source of energy supply in some of the regions. Storage can be supplemented with demand-side management and/or so-called smart-grids. These requirements also depend on the availabil-ity of negative carbon options (BioCCS and carbon sinks). If negative emissions technologies do not become available on large scale, more rapid early action, including larger contributions of wind and solar photovoltaic are needed. The same is true if nuclear power is excluded, with the slack taken up by intermittent renewable sources again. Like the renewables themselves, storage technologies are diverse, unevenly distributed (e.g., pumped storage hydropower), and in some cases less mature, more costly, and more dependent on new infrastructures (e.g., hydrogen electrolyzers and fuel cells) and business models.
Fossil CCS provides a bridge or transitional option for the power sector. However, in contrast to conventional gas power generation, this is not common to all pathways, as the most efficient pathways do not neces-sarily include CCS. The most attractive option to combine with CCS in power generation is natural gas, with its cleaner fuel supply chains, lower upstream GHG emissions, higher conversion efficiencies, and significantly lower capital intensity. However, this is not entirely consistent with cur-rent R&D activities, which are focused on coal power generation with CCS. The focus on coal is, in turn, driven by the relative cost and abundance of the resource, as well as concerns over dependence on imported gas. The
global preference for gas with CCS is particularly weak in coal-rich regions such as China. Although bioenergy with CCS plays an increasingly import-ant role under more stringent climate stabilization targets, the deploy-ment focus can be in either the electricity or the synthetic fuels sector, depending on the overall system configuration (on advanced designs of BioCCS technologies see also Chapter 11 , Section 11.3 ).
The major choice in terms of supply-side flexibility to emerge from the pathways analysis relates to nuclear power. Nuclear energy can become one of the central sources of electricity generation by 2050, and it is among the supply-side options with the highest deployment across all GEA pathways. Such a development can only materialize if effective technological, institutional, governance, and legal frameworks are intro-duced to avoid present risks of nuclear energy, including in particular the risk of proliferation. It is thus important to emphasize that in all path-ways nuclear power can also be fully phased out after 2060, with no new plants built after 2020. The global “choice” of excluding nuclear power from the supply mix has implications for energy costs, as do any of the other restricted portfolio options (as, by definition, the unrestricted port-folio has the lowest cost). This is discussed further in Section 17.3.5 .
Some of the trends observed between 2030 and 2050 in Figure 17.16 continue into the second half of the century, namely, considerable growth in electricity generation from solar and wind energy as well as nuclear power. On the other hand, fossil fuel-generated electricity with CCS tends to decline again toward the end of the century, because of non-negligible GHG emissions in the entire fuel supply chain.
Commonalities and Choices: Liquid and Gaseous Fuels Today the processing of liquid and gaseous fuels is a very different energy conversion chain than the generation of electricity from primary
Co
al w
/oC
CS
Co
al w
/CC
S
Ga
s w
/oC
CS
Ga
s w
/CC
S
Nu
cle
ar
Bio
ma
ss w
/oC
CS
Bio
ma
ss w
/CC
S
Hyd
ro
Win
d
So
lar
PV
So
lar
Th
erm
al
Ge
oth
erm
al
Sto
rag
e
0
20
40
60
80
2030E
J
Co
al w
/oC
CS
Co
al w
/CC
S
Ga
s w
/oC
CS
Ga
s w
/CC
S
Nu
cle
ar
Bio
ma
ss w
/oC
CS
Bio
ma
ss w
/CC
S
Hyd
ro
Win
d
So
lar
PV
So
lar
Th
erm
al
Ge
oth
erm
al
Sto
rag
e
0
20
40
60
80
2050
EJ
Coal w/oCCS
Coal w/CCS
Gas w/oCCS
Gas w/CCS
Nuclear
Biomass w/oCCS
Biomass w/CCS
Hydro
Wind
Solar PV
Solar Thermal
Geothermal
Storage
Figure 17.16 | Electricity supplied by different generation technologies in 2030 and 2050 in the GEA pathways. The boxes represent interquartile (25th-75th percentile) ranges, and the horizontal lines within boxes represent medians across all feasible GEA pathways from MESSAGE and IMAGE. Error bars indicate the full range across all feasible pathways.
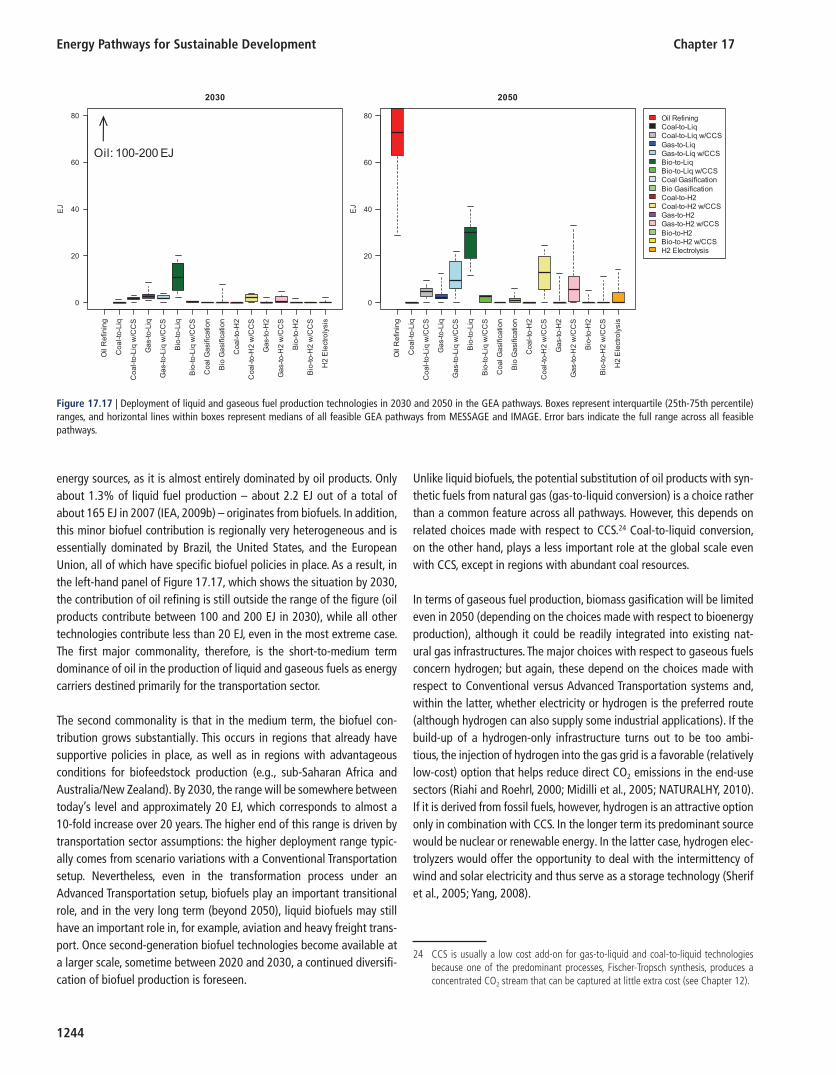
Energy Pathways for Sustainable Development Chapter 17
1244
energy sources, as it is almost entirely dominated by oil products. Only about 1.3% of liquid fuel production – about 2.2 EJ out of a total of about 165 EJ in 2007 (IEA, 2009b ) – originates from biofuels. In addition, this minor biofuel contribution is regionally very heterogeneous and is essentially dominated by Brazil, the United States, and the European Union, all of which have specific biofuel policies in place. As a result, in the left-hand panel of Figure 17.17 , which shows the situation by 2030, the contribution of oil refining is still outside the range of the figure (oil products contribute between 100 and 200 EJ in 2030), while all other technologies contribute less than 20 EJ, even in the most extreme case. The first major commonality, therefore, is the short-to-medium term dominance of oil in the production of liquid and gaseous fuels as energy carriers destined primarily for the transportation sector.
The second commonality is that in the medium term, the biofuel con-tribution grows substantially. This occurs in regions that already have supportive policies in place, as well as in regions with advantageous conditions for biofeedstock production (e.g., sub-Saharan Africa and Australia/New Zealand). By 2030, the range will be somewhere between today’s level and approximately 20 EJ, which corresponds to almost a 10-fold increase over 20 years. The higher end of this range is driven by transportation sector assumptions: the higher deployment range typic-ally comes from scenario variations with a Conventional Transportation setup. Nevertheless, even in the transformation process under an Advanced Transportation setup, biofuels play an important transitional role, and in the very long term (beyond 2050), liquid biofuels may still have an important role in, for example, aviation and heavy freight trans-port. Once second-generation biofuel technologies become available at a larger scale, sometime between 2020 and 2030, a continued diversifi-cation of biofuel production is foreseen.
Unlike liquid biofuels, the potential substitution of oil products with syn-thetic fuels from natural gas (gas-to-liquid conversion) is a choice rather than a common feature across all pathways. However, this depends on related choices made with respect to CCS. 24 Coal-to-liquid conversion, on the other hand, plays a less important role at the global scale even with CCS, except in regions with abundant coal resources.
In terms of gaseous fuel production, biomass gasification will be limited even in 2050 (depending on the choices made with respect to bioenergy production), although it could be readily integrated into existing nat-ural gas infrastructures. The major choices with respect to gaseous fuels concern hydrogen; but again, these depend on the choices made with respect to Conventional versus Advanced Transportation systems and, within the latter, whether electricity or hydrogen is the preferred route (although hydrogen can also supply some industrial applications). If the build-up of a hydrogen-only infrastructure turns out to be too ambi-tious, the injection of hydrogen into the gas grid is a favorable (relatively low-cost) option that helps reduce direct CO 2 emissions in the end-use sectors (Riahi and Roehrl, 2000 ; Midilli et al., 2005 ; NATURALHY, 2010 ). If it is derived from fossil fuels, however, hydrogen is an attractive option only in combination with CCS. In the longer term its predominant source would be nuclear or renewable energy. In the latter case, hydrogen elec-trolyzers would offer the opportunity to deal with the intermittency of wind and solar electricity and thus serve as a storage technology (Sherif et al., 2005 ; Yang, 2008 ).
Oil R
efin
ing
Co
al-
to-L
iq
Co
al-
to-L
iq w
/CC
S
Ga
s-t
o-L
iq
Ga
s-t
o-L
iq w
/CC
S
Bio
-to
-Liq
Bio
-to
-Liq
w/C
CS
Co
al G
asific
atio
n
Bio
Ga
sific
atio
n
Co
al-
to-H
2
Co
al-
to-H
2 w
/CC
S
Ga
s-t
o-H
2
Ga
s-t
o-H
2 w
/CC
S
Bio
-to
-H2
Bio
-to
-H2
w/C
CS
H2
Ele
ctr
oly
sis
0
20
40
60
80
2030
EJ
Oil R
efin
ing
Co
al-
to-L
iq
Co
al-
to-L
iq w
/CC
S
Ga
s-t
o-L
iq
Ga
s-t
o-L
iq w
/CC
S
Bio
-to
-Liq
Bio
-to
-Liq
w/C
CS
Co
al G
asific
atio
n
Bio
Ga
sific
atio
n
Co
al-
to-H
2
Co
al-
to-H
2 w
/CC
S
Ga
s-t
o-H
2
Ga
s-t
o-H
2 w
/CC
S
Bio
-to
-H2
Bio
-to
-H2
w/C
CS
H2
Ele
ctr
oly
sis
0
20
40
60
80
2050
EJ
Oil Refining
Coal-to-Liq
Coal-to-Liq w/CCS
Gas-to-Liq
Gas-to-Liq w/CCS
Bio-to-Liq
Bio-to-Liq w/CCS
Coal Gasification
Bio Gasification
Coal-to-H2
Coal-to-H2 w/CCS
Gas-to-H2
Gas-to-H2 w/CCS
Bio-to-H2
Bio-to-H2 w/CCS
H2 Electrolysis
Oil: 100-200 EJ
Figure 17.17 | Deployment of liquid and gaseous fuel production technologies in 2030 and 2050 in the GEA pathways. Boxes represent interquartile (25th-75th percentile) ranges, and horizontal lines within boxes represent medians of all feasible GEA pathways from MESSAGE and IMAGE. Error bars indicate the full range across all feasible pathways.
24 CCS is usually a low cost add-on for gas-to-liquid and coal-to-liquid technologies because one of the predominant processes, Fischer-Tropsch synthesis, produces a concentrated CO 2 stream that can be captured at little extra cost (see Chapter 12 ).

Chapter 17 Energy Pathways for Sustainable Development
1245
Commonalities and Choices: Fossil Resource Extraction Currently the upstream sector is dominated by fossil fuel extraction, most importantly oil but increasingly natural gas and coal, which has seen considerable expansion over the last several years, largely driven by significant price increases for hydrocarbons. Compared with these three groups of fossil fuels, renewable energy sources, such as purpose-grown bioenergy as well as agricultural residues and byproducts from other uses of biomass feedstock (e.g., in paper and pulp production), are small today.
However, it needs to be emphasized that the sustainability goals built into the GEA scenario, in particular the climate target, put limitations on the use of fossil fuels. This implies that resource limitations for fossil fuels are generally not a concern for the GEA pathways ( Figure 17.18 ). Therefore, the pathways in general show peak oil and gas behavior, however, not because of the assumed physical scarcity of hydrocarbons, but because of the limited carbon emission budgets under, for example, the 2°C target (see also Verbruggen and Al Marchohi, 2010 ).
The extraction of conventional hydrocarbons lies within a smaller range than that of the unconventional categories, 25 largely because they still play an important role during the energy transition over the coming decades. The largest part of the ranges in oil and gas extraction shown in Figure 17.18 is due to variations in the deployment of unconventional resources, which tend to play a significant role only under specific condi-tions because of their relatively more energy- and emissions-intensive extraction processes. Unconventional oil plays a limited role in the GEA-Efficiency group of pathways and in the unrestricted portfolio pathways with the Advanced Transportation option of both the GEA-Mix and the GEA-Supply pathway groups, because here the transition away from oil to other fuels is permissible at a steadier pace (see Section 17.3.3.3 ). In contrast, unconventional gas extraction is most relevant in the GEA-Mix and GEA-Supply groups of pathways under the No Nuclear and Limited Renewables pathways, where CCS is elevated in importance compared with the unrestricted supply portfolio.
Coal extraction declines significantly over the next couple of decades across almost all transition pathways. However, after 2030, when CCS could become available at a larger scale, two distinct developments are possible, leading to a very wide range of possible levels of coal extrac-tion by 2050. If CCS is excluded as a supply-side option, which is a possibility under the GEA-Mix and GEA-Efficiency groups of pathways, then coal extraction has to almost completely disappear by the middle of the century. On the other hand, if CCS can be successfully deployed at scale, a revival of coal extraction, reaching current levels and even going beyond, is an option. The absolute level depends on overall demand: in general, coal extraction is highest in the GEA-Supply group of pathways, followed by the GEA-Mix and the GEA-Efficiency groups.
Commonalities and Choices: Low-Carbon Energy Shares Figure 17.19 shows low-carbon energy shares for total primary energy supply, electricity generation, and final energy demand (overall and in the transportation sector) in 2020, 2030, and 2050 for the different energy demand levels of the three GEA pathway groups. At the primary energy level and in electricity generation, nuclear energy, renewables, and fossil with CCS are counted as low-carbon energy. At the final energy level, fuels without direct CO 2 emissions (i.e., electricity, district heat, and hydrogen) as well as solid biomass and biofuels are counted as low-carbon energy. 26
One important finding shown clearly by Figure 17.19 is that the low-carbon energy share is consistently lowest in the GEA-Efficiency group of pathways. From a climate perspective, what matters is not the share of GHG-emitting fuels but the absolute amount of emissions. Therefore, at a lower level of total energy demand, the share of GHG-emitting fuels can obviously be higher (see Section 17.5.1 on climate change).
A consequence is that the required speed of decarbonization is very ambitious under the GEA-Supply pathways with high energy demand; up to a doubling of the low-carbon energy share is needed within the decade to 2020. In the GEA-Efficiency pathways, a less aggressive decarbonization of global primary energy supply is permissible. Across all pathways, 60–90% of primary energy supply has to come from low-carbon sources by 2050. 27
By far the most complete decarbonization has to be achieved in elec-tricity generation; the threshold is in the range of 40–60% globally by 2020, starting from today’s share of around 35%, largely due to nuclear and hydropower. By 2050 almost full decarbonization of electricity gener-ation (80–100%) is required. This implies the need for a continued expan-sion of renewable electricity generation and of nuclear power, or a rapid commercial deployment of CCS, or both (see the discussion in Section 17.3.4.3 ). Financing for these mostly very capital intensive technologies ( Section 17.3.5 ) and technology transfer mechanisms to enable deploy-ment in developing countries ( Section 17.5.1.4 ) are major challenges.
At the final energy level, the transition appears less challenging, at least in the short term. However, traditional biomass is included as a low-carbon energy source, accounting for some 30 EJ or about 10% of final energy
25 The defi nition of conventional and unconventional hydrocarbon resources used here follows Rogner ( 1997 ). For a comprehensive discussion of the diffi culties in the distinc-tion of conventional and unconventional hydrocarbons see Chapter 7 , Section 7.2 .
26 Note that the latter defi nition implies the assumption that the generation of electricity, heat, and hydrogen is decarbonized to a large extent, although in a transition period (in particular 2020–2030) signifi cant carbon emissions in the conversion sector may be implied. In addition, it is noted that biomass and liquid biofuels cause direct CO 2 emis-sions, but if derived from sustainably grown biomass their lifecycle carbon emissions can become close to zero or even negative (in combination with CCS).
27 These values are comparable with those from a study conducted by O’Neill et al. ( 2010b ) that systematically analyzes mid-century targets for keeping long-term cli-mate stabilization options open. O’Neill et al. ( 2010b ) identify low-carbon primary energy shares above about 65% by 2050 to achieve a similar probability (>60% based on uniform prior climate sensitivity probability density function by Forest et al. ( 2002 )); see Section 17.5.1 on climate change for details on staying below 2°C warming by 2100 compared with preindustrial levels.

Energy Pathways for Sustainable Development Chapter 17
1246
0
2
4
6
8
10
0 5,000 10,000 15,000 20,000 25,000 30,000 35,000 [EJ]
Oil[$/GJ]
Chapter 7Reserves
Chapter 7Reserves + Resources
Cumula�ve use2005-2050
Cumula�ve use2005-2100
0
2
4
6
8
10
0 10,000 20,000 30,000 40,000 50,000 60,000 70,000 [EJ]
Gas[$/GJ]
Chapter 7 Reserves
Chapter 7Reserves + Resources
(72,500 - 205,100 EJ)
Cumula�ve use2005-2050
Cumula�ve use2005-2100
.
0
2
4
6
8
10
0 10,000 20,000 30,000 40,000 50,000 60,000 70,000 80,000 90,000 [EJ]
Coal[$/GJ]
Chapter 7Reserves + Resources(308,300 - 456,000 EJ)
Chapter 7 Reserves
Cumula�ve use2005-2100
Cumula�ve use2005-2050
Figure 17.18 | Cumulative global resource supply curves for oil, gas, and coal in the MESSAGE model. The double-headed arrows show the range of cumulative fuel extrac-tion across all feasible GEA pathways from MESSAGE and IMAGE between 2005 and 2050 and between 2005 and 2100. Vertical lines show the central reserve and resource estimates from Chapter 7 .

Chapter 17 Energy Pathways for Sustainable Development
1247
use in 2005. The energy access objective requires that traditional biomass be replaced with cleaner energy forms; in this light, the decarbonization challenge with respect to final energy demand becomes clearer.
In the transportation sector, the threshold level of a less than 10% low-carbon energy share to be reached by 2020 appears relatively modest compared with the low-carbon fuel shares in the other sectors, although it has to be kept in mind that the starting point is close to zero at pre-sent. Also, this required development is opposite to the historically observed downward trend in the share of public and rail-bound freight transport (see Chapter 18 , Section 18.6.3 ). By 2050, low-carbon energy shares in transport have to reach a range of 35–75%, depending on the demand level.
Commonalities and Choices: CO 2 Capture and Storage In those pathways that do not exclude CCS as an option, considerable amounts of CO 2 would need to be stored between 2020 and 2030, quickly rising to 2050, by which time cumulative storage needs to be no less than 55 GtCO 2 and closer to 250 GtCO 2 . The bulk of this would come from fossil CCS (see above); bioenergy in combination with CCS takes off only around 2040 but increases its contribution in the latter half of the century.
By mid-century, cumulative CO 2 storage is strongly determined by the demand level, with relatively little overlap across the high, intermediate, and low demand levels that are assumed in the GEA-Supply, GEA-Mix, and GEA-Efficiency pathway groups, respectively ( Figure 17.20 ). This observation accords well with the fact that under low demand, the need
20
20
20
20
20
20
20
30
20
30
20
30
20
50
20
50
20
50
0
20
40
60
80
100
Low Carbon Primary Energy Share (substitution)%
20
20
20
20
20
20
20
30
20
30
20
30
20
50
20
50
20
50
0
20
40
60
80
100
Low Carbon Electricity Share
%
GEA-Supply
GEA-Mix
GEA-Efficiency2
02
0
20
20
20
20
20
30
20
30
20
30
20
50
20
50
20
50
0
20
40
60
80
100
Low Carbon Final Energy Share
%
20
20
20
20
20
20
20
30
20
30
20
30
20
50
20
50
20
50
0
20
40
60
80
100
Low Carbon Transport Final Energy Share%
GEA-Supply
GEA-Mix
GEA-Efficiency
Figure 17.19 | Low-carbon shares in primary energy supply, electricity generation, total fi nal energy use, and transportation sector fi nal energy use by 2020, 2030, and 2050 across GEA pathways from MESSAGE and IMAGE. Boxes represent the interquartile (25th-75th percentile) range and error bars the full range across all feasible pathways in the indicated group. The black horizontal lines indicate low-carbon shares in 2005.
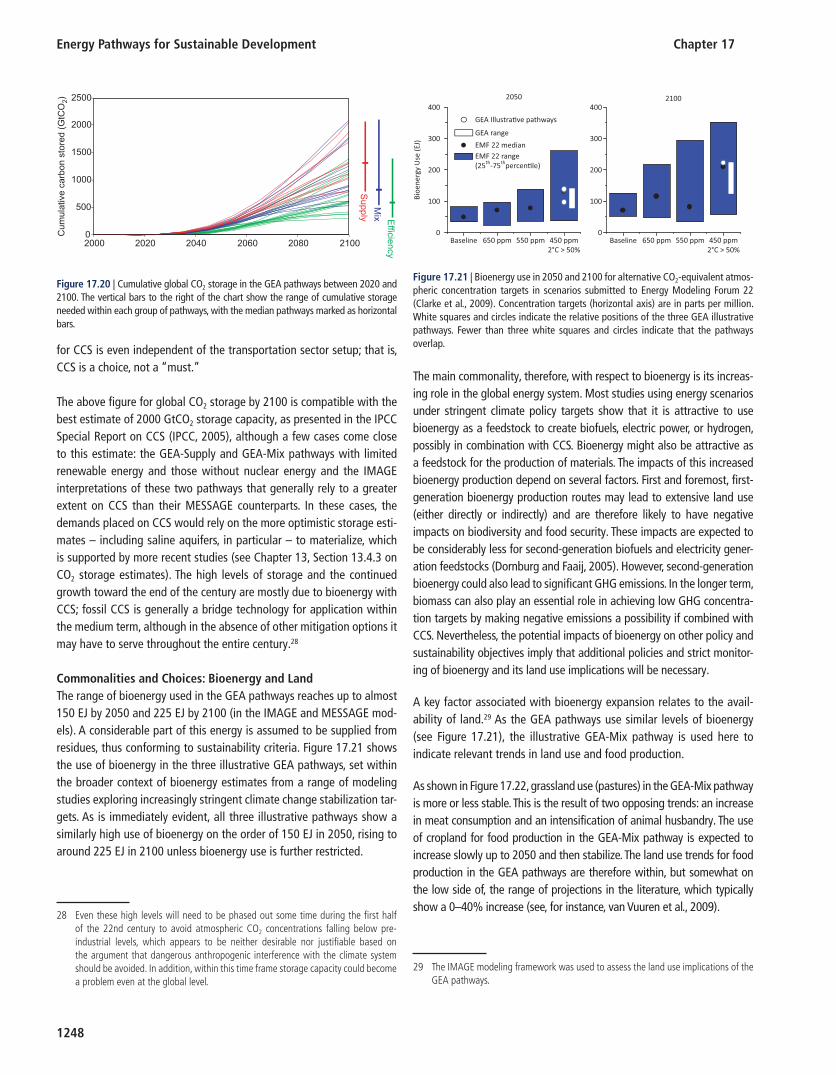
Energy Pathways for Sustainable Development Chapter 17
1248
for CCS is even independent of the transportation sector setup; that is, CCS is a choice, not a “must.”
The above figure for global CO 2 storage by 2100 is compatible with the best estimate of 2000 GtCO 2 storage capacity, as presented in the IPCC Special Report on CCS (IPCC, 2005 ), although a few cases come close to this estimate: the GEA-Supply and GEA-Mix pathways with limited renewable energy and those without nuclear energy and the IMAGE interpretations of these two pathways that generally rely to a greater extent on CCS than their MESSAGE counterparts. In these cases, the demands placed on CCS would rely on the more optimistic storage esti-mates – including saline aquifers, in particular – to materialize, which is supported by more recent studies (see Chapter 13 , Section 13.4.3 on CO 2 storage estimates). The high levels of storage and the continued growth toward the end of the century are mostly due to bioenergy with CCS; fossil CCS is generally a bridge technology for application within the medium term, although in the absence of other mitigation options it may have to serve throughout the entire century. 28
Commonalities and Choices: Bioenergy and Land The range of bioenergy used in the GEA pathways reaches up to almost 150 EJ by 2050 and 225 EJ by 2100 (in the IMAGE and MESSAGE mod-els). A considerable part of this energy is assumed to be supplied from residues, thus conforming to sustainability criteria. Figure 17.21 shows the use of bioenergy in the three illustrative GEA pathways, set within the broader context of bioenergy estimates from a range of modeling studies exploring increasingly stringent climate change stabilization tar-gets. As is immediately evident, all three illustrative pathways show a similarly high use of bioenergy on the order of 150 EJ in 2050, rising to around 225 EJ in 2100 unless bioenergy use is further restricted.
The main commonality, therefore, with respect to bioenergy is its increas-ing role in the global energy system. Most studies using energy scenarios under stringent climate policy targets show that it is attractive to use bioenergy as a feedstock to create biofuels, electric power, or hydrogen, possibly in combination with CCS. Bioenergy might also be attractive as a feedstock for the production of materials. The impacts of this increased bioenergy production depend on several factors. First and foremost, first-generation bioenergy production routes may lead to extensive land use (either directly or indirectly) and are therefore likely to have negative impacts on biodiversity and food security. These impacts are expected to be considerably less for second-generation biofuels and electricity gener-ation feedstocks (Dornburg and Faaij, 2005 ). However, second-generation bioenergy could also lead to significant GHG emissions. In the longer term, biomass can also play an essential role in achieving low GHG concentra-tion targets by making negative emissions a possibility if combined with CCS. Nevertheless, the potential impacts of bioenergy on other policy and sustainability objectives imply that additional policies and strict monitor-ing of bioenergy and its land use implications will be necessary.
A key factor associated with bioenergy expansion relates to the avail-ability of land. 29 As the GEA pathways use similar levels of bioenergy (see Figure 17.21 ), the illustrative GEA-Mix pathway is used here to indicate relevant trends in land use and food production.
As shown in Figure 17.22 , grassland use (pastures) in the GEA-Mix pathway is more or less stable. This is the result of two opposing trends: an increase in meat consumption and an intensification of animal husbandry. The use of cropland for food production in the GEA-Mix pathway is expected to increase slowly up to 2050 and then stabilize. The land use trends for food production in the GEA pathways are therefore within, but somewhat on the low side of, the range of projections in the literature, which typically show a 0–40% increase (see, for instance, van Vuuren et al., 2009 ).
2000 2020 2040 2060 2080 2100
Cu
mu
lative
ca
rbo
n s
tore
d (
GtC
O2)
0
500
1000
1500
2000
2500
Su
pp
ly
Mix
Effic
iency
Figure 17.20 | Cumulative global CO 2 storage in the GEA pathways between 2020 and 2100. The vertical bars to the right of the chart show the range of cumulative storage needed within each group of pathways, with the median pathways marked as horizontal bars.
28 Even these high levels will need to be phased out some time during the fi rst half of the 22nd century to avoid atmospheric CO 2 concentrations falling below pre-industrial levels, which appears to be neither desirable nor justifi able based on the argument that dangerous anthropogenic interference with the climate system should be avoided. In addition, within this time frame storage capacity could become a problem even at the global level.
Baseline0
100
200
300
400
0
100
200
300
4002050 2100
450 ppm2°C > 50%
550 ppm650 ppm Baseline 450 ppm2°C > 50%
550 ppm650 ppm
GEA Illustra�ve pathways
GEA range
EMF 22 medianEMF 22 range(25th-75thpercen�le)
Bioe
nerg
y U
se (E
J)
Figure 17.21 | Bioenergy use in 2050 and 2100 for alternative CO 2 -equivalent atmos-pheric concentration targets in scenarios submitted to Energy Modeling Forum 22 (Clarke et al., 2009 ). Concentration targets (horizontal axis) are in parts per million. White squares and circles indicate the relative positions of the three GEA illustrative pathways. Fewer than three white squares and circles indicate that the pathways overlap.
29 The IMAGE modeling framework was used to assess the land use implications of the GEA pathways.

Chapter 17 Energy Pathways for Sustainable Development
1249
The increase in modern bioenergy use in the GEA scenarios implies an increase in land use for bioenergy production. The exact amount of land used depends strongly on assumed yield increases (see the electronic appendix to this chapter) and the types of bioenergy that are used. Still, as most other studies (e.g., van Vuuren et al., 2010 ) have found, bioenergy remains a relatively small category compared with other forms of land use. At the same time, the increase in land for bioenergy production in the GEA pathways is about equal to the total increase in agricultural land use. This implies that increases in global land use will lead to some further biodiversity loss and land scarcity. In the context of the GEA sustainability objectives, it will thus be particularly important that policies be put in place that can avoid a strongly adverse impact on crop prices (or the risk of such impacts in a situation of sharply rising energy prices).
17.3.4.4 Regional Analysis of the GEA Pathways
Thus far, the discussion of the GEA pathways has focused predominantly on the transition at the global scale, with regional issues raised in only a few cases. The following sections present explicit regional detail. The starting point of the analysis is energy demand, which starts from a very heterogeneous basis and is tightly linked to economic develop-ment in the different regions. On the supply side, three different topics with important regional implications are highlighted: renewable energy deployment, bioenergy use and related land use issues, and CCS, which links fossil energy resources and geological CO 2 storage potential.
This regional analysis is limited in scope and usually remains at the level of illustrative examples rather than being fully comprehensive. Full regional detail of the quantitative GEA scenario analysis is, however, available in the web-based GEA scenario database at www.iiasa.ac.at/web-apps/ene/geadb (see also Box 17.2 on scenario development).
Regional Analysis of Energy Demand A core concern of the GEA transition pathways is to explore strategies to overcome the current, extremely inequitable distribution of incomes and the associated lack of access to clean and efficient energy services worldwide, while at the same time improving the environmental per-formance of energy end use and supply. This illustrates the compre-hensive nature of the GEA transition pathways under the three main dimensions of sustainability: economic, social, and environmental.
This discussion illustrates some generic patterns in the regional devel-opment of energy demand in the GEA transition pathways. In an ideal case, such an analysis would first of all concentrate on actual levels of energy services provided to people, as the ultimate driver of energy sys-tems. However, the diversity of energy end uses and their correspond-ingly different metrics (thermal comfort, distances traveled, industrial output, etc.) do not allow their aggregation into a commensurable uniform metric. Therefore, this section focuses on final energy demand, which has the advantage of being well covered by current statistics and available modeling and scenario methodologies.
Figure 17.23 summarizes per capita final energy demand as of 2005 as well as the situation in 2050 for the three illustrative GEA transition pathways. Final energy demand is disaggregated by major end-use application type: residential and commercial, industrial, and transportation. For the scen-ario projections to 2050, an additional efficiency (improvement) potential (grey shaded areas in the bottom panel of Figure 17.23 ) is shown, corre-sponding to the difference in final energy use between the lowest energy demand scenario, that of the illustrative GEA-Efficiency pathway, and the more supply-side-focused illustrative GEA-Supply pathway. All three GEA transition pathways achieve comparable levels of energy services provi-sion. Their different levels of final energy use do not represent a difference in energy demand proper, but rather a difference in the efficiency with which comparable levels of energy demand can be provided. These levels of efficiency of energy end use across pathways can be compared with current levels as ranging from efficient (GEA-Supply) to extremely effi-cient (GEA-Efficiency). For greater legibility, Figure 17.23 summarizes the scenarios for only six of the 11 GEA world regions.
The current disparities in income and energy use across low-income (Africa and South Asia), middle-income (Latin America), and high-income countries (Western Europe and North America) are immediately apparent, as are important differences in the structure of final energy use (a very low industry share in Africa versus a high share in China and Centrally Planned Asia) and the much greater importance of transport energy use in North America than in Latin America. The figure also dem-onstrates the importance of energy end-use efficiency: Western Europe and North America currently enjoy comparable levels of income, but Western Europe uses only about half as much final energy per capita.
The world in 2050 will look decidedly different from today when viewed through the lens of the GEA transition pathways. Current distinctions between low- and higher-income countries will be largely obsolete, as
0
20
40
60
1980 2000 2020 2040 2060 2080 2100
Are
a (1
06 km
2 )TotalGrass & fodderFood cropsBiofuel crops
Figure 17.22 | Land use in the illustrative GEA-Mix pathway.
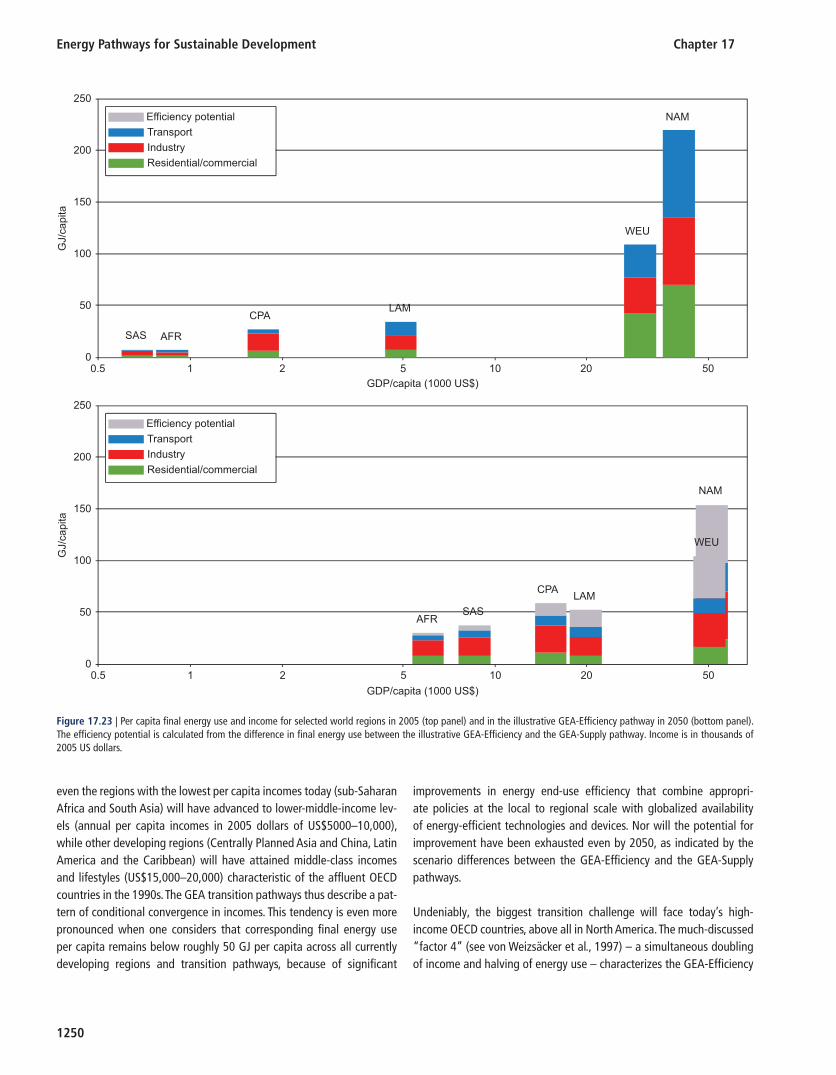
Energy Pathways for Sustainable Development Chapter 17
1250
even the regions with the lowest per capita incomes today (sub- Saharan Africa and South Asia) will have advanced to lower-middle-income lev-els (annual per capita incomes in 2005 dollars of US$5000–10,000), while other developing regions (Centrally Planned Asia and China, Latin America and the Caribbean) will have attained middle-class incomes and lifestyles (US$15,000–20,000) characteristic of the affluent OECD countries in the 1990s. The GEA transition pathways thus describe a pat-tern of conditional convergence in incomes. This tendency is even more pronounced when one considers that corresponding final energy use per capita remains below roughly 50 GJ per capita across all currently developing regions and transition pathways, because of significant
improvements in energy end-use efficiency that combine appropri-ate policies at the local to regional scale with globalized availability of energy-efficient technologies and devices. Nor will the potential for improvement have been exhausted even by 2050, as indicated by the scenario differences between the GEA-Efficiency and the GEA-Supply pathways.
Undeniably, the biggest transition challenge will face today’s high-income OECD countries, above all in North America. The much-discussed “factor 4” (see von Weizs ä cker et al., 1997 ) – a simultaneous doubling of income and halving of energy use – characterizes the GEA-Efficiency
GDP/capita (1000 US$)
0.5 1 2 5 10 20 50
GJ/c
apita
0
50
100
150
200
250
AFR
CPA
SAS
NAM
WEU
LAM
Efficiency potential
Transport
Industry
Residential/commercial
GDP/capita (1000 US$)
0.5 1 2 5 10 20 50
GJ/c
apita
0
50
100
150
200
250
AFR
CPA
SAS
NAM
WEU
LAM
Efficiency potential
Transport
Industry
Residential/commercial
Figure 17.23 | Per capita fi nal energy use and income for selected world regions in 2005 (top panel) and in the illustrative GEA-Effi ciency pathway in 2050 (bottom panel). The effi ciency potential is calculated from the difference in fi nal energy use between the illustrative GEA-Effi ciency and the GEA-Supply pathway. Income is in thousands of 2005 US dollars.

Chapter 17 Energy Pathways for Sustainable Development
1251
pathway for this region. Although challenging, such a major transition both is technologically feasible by 2050 (see Section 17.3.2.1 ), consider-ing historical rates of capital turnover, and entails significant benefits in terms of increasing energy security, improving local and regional envir-onments, and avoiding damages from climate change. Compared with these benefits, the required adjustments in energy end-use patterns and lifestyles (toward more energy- efficient, more compact vehicles and greater use of high-quality public transit) will be either modest or non-existent (e.g., in the case of zero-energy homes that do not compromise living space and comfort).
The biggest challenge revealed by the transition pathways faces not consumers, who can confidently expect expanded and improved levels of energy services in the future, but rather entrepreneurs and policy-makers. They need to embrace decidedly different views from those widely held today, focusing on energy services provision rather than mistakenly viewing technology- and policy-dependent levels of pri-mary energy use as immutable, given consumer demand. Policymakers must also embark on different policies that combine both carrots and sticks in order to include stricter building, appliance, and vehicle effi-ciency standards and changes in relative prices through taxes, sub-sidies, feed-in tariffs, and other measures. This would open up new business opportunities (e.g., for energy services companies), thereby creating new markets (e.g., for efficiency technologies) and leveraging the power of market forces to meet social concerns and public policy choices.
Regional Analysis of Renewable Energy Sources
Renewable energy sources play an important role in essentially all GEA transition pathways, as discussed at length in Section 17.3.3 . Even under the Limited Bioenergy and Limited Renewables pathways (see Table 17.9 ), renewable energy sources reach some 40% of total global primary energy supply by 2050. Regionally, however, the contribution of renewables varies considerably, as Table 17.12 illustrates for 2050. Several reasons deserve mentioning in this context. First, the resource supply curves (i.e., technical potential as well as resource quality) for the various renewable energy sources differ significantly across regions (see Box 17.3 and the electronic appendix to this chapter). Second, the availability of low-carbon supply-side alternatives (nuclear energy and fossil CCS), which ultimately determine the economic potential for renewable energy sources, is also strongly region dependent. Third, the tradability of renewable energies or of secondary energy carriers derived from them is very heterogeneous. Whereas liquid biofuels are easy to trade and can even rely on existing infrastructures, the scope for trading electricity (e.g., from wind, solar photovoltaic and CSP, and hydropower) at the global scale is much more limited, and for heat (e.g., solar thermal, geothermal), trade is not an option at all. This generally leads to higher exploitation rates of bioenergy potentials than of other renewables. For example, sub-Saharan Africa and Latin America, with the largest sustainable bioenergy potentials, export sig-nificant quantities of liquid biofuels starting after 2020 across almost all GEA pathways.
Table 17.12 | Ranges of renewable energy deployments across GEA Pathways, by region, 2050 (in Exajoules unless otherwise stated).
Region Bioenergy Hydropower Wind Solar 1 Geothermal All renewablesAll renewables as % of total
Sub-Saharan Africa 8.8–40.5 2.0–5.5 0.0–19.6 0.5–25.5 0.0–0.3 11.4–91.4 31–94
Centrally Planned Asia and China
6.9–24.7 9.7–10.3 3.7–8.8 0.9–40.1 0.0–0.3 21.2–84.2 24–50
Eastern Europe 1.3–2.8 0.8–1.0 0.7–5.0 0.2–6.1 0.0–0.3 2.9–15.3 23–85
Former Soviet Union 2.9–10.1 2.7–15.8 1.4–7.4 0.3–9.7 0.0–1.0 7.4–43.9 25–93
Latin America and the Caribbean
10.5–22.5 10.7–17.6 3.6–12.4 0.5–21.8 0.0–1.8 25.3–76.1 40–100
Middle East and North Africa
1.2–5.1 0.8–1.2 1.3–8.7 0.5–15.8 0.0–0.3 3.8–31.1 17–40
North America 10.0–21.5 7.2–7.9 2.6–36.7 1.2–41.6 0.0–3.4 21–111 38–89
Pacifi c OECD 3.4–11.3 1.4–1.7 0.6–4.9 0.2–5.4 0.1–0.8 5.7–24 26–89
Pacifi c Asia 5.0–11.9 1.9–7.2 1.0–2.0 0.4–14.5 0.2–1.3 8.6–36.9 15–63
South Asia 5.2–20.8 3.5–4.3 1.1–6.7 1.0–79.0 0.0–0.2 10.7–111 21–65
Western Europe 3.9–11.0 5.7–7.6 3.0–30.2 0.7–28.9 0.1–2.1 13.4–79.8 34–83
World 78.3–139 49.9–80.1 28.5–134 7–285 0.6–11.9 164–651 28–74
Note: Ranges include restricted supply portfolios and are calculated as primary energy supply using the substitution method.
1 The representation of solar energy in the IMAGE modeling framework is restricted to solar photovoltaic, which leads to signifi cantly lower solar energy contributions in the IMAGE interpretation of the GEA pathways that typically mark the lower end of solar deployment in this table.
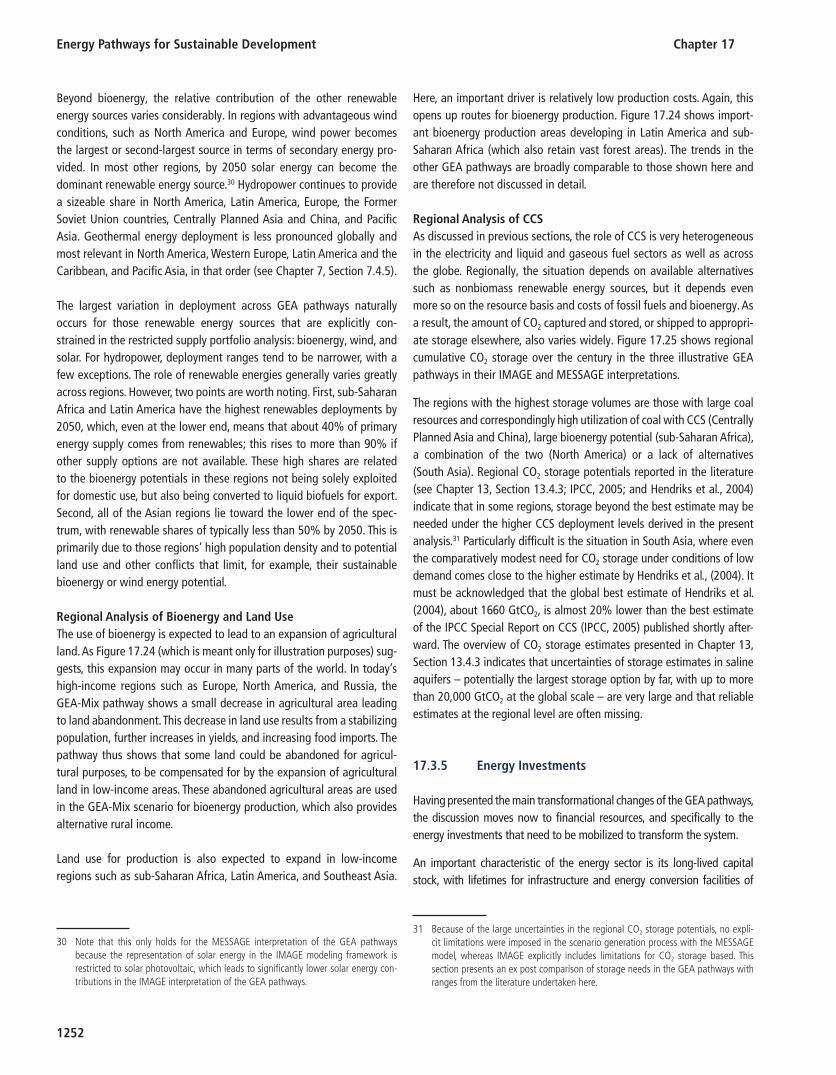
Energy Pathways for Sustainable Development Chapter 17
1252
Beyond bioenergy, the relative contribution of the other renewable energy sources varies considerably. In regions with advantageous wind conditions, such as North America and Europe, wind power becomes the largest or second-largest source in terms of secondary energy pro-vided. In most other regions, by 2050 solar energy can become the dominant renewable energy source. 30 Hydropower continues to provide a sizeable share in North America, Latin America, Europe, the Former Soviet Union countries, Centrally Planned Asia and China, and Pacific Asia. Geothermal energy deployment is less pronounced globally and most relevant in North America, Western Europe, Latin America and the Caribbean, and Pacific Asia, in that order (see Chapter 7 , Section 7.4.5 ).
The largest variation in deployment across GEA pathways naturally occurs for those renewable energy sources that are explicitly con-strained in the restricted supply portfolio analysis: bioenergy, wind, and solar. For hydropower, deployment ranges tend to be narrower, with a few exceptions. The role of renewable energies generally varies greatly across regions. However, two points are worth noting. First, sub-Saharan Africa and Latin America have the highest renewables deployments by 2050, which, even at the lower end, means that about 40% of primary energy supply comes from renewables; this rises to more than 90% if other supply options are not available. These high shares are related to the bioenergy potentials in these regions not being solely exploited for domestic use, but also being converted to liquid biofuels for export. Second, all of the Asian regions lie toward the lower end of the spec-trum, with renewable shares of typically less than 50% by 2050. This is primarily due to those regions’ high population density and to potential land use and other conflicts that limit, for example, their sustainable bioenergy or wind energy potential.
Regional Analysis of Bioenergy and Land Use The use of bioenergy is expected to lead to an expansion of agricultural land. As Figure 17.24 (which is meant only for illustration purposes) sug-gests, this expansion may occur in many parts of the world. In today’s high-income regions such as Europe, North America, and Russia, the GEA-Mix pathway shows a small decrease in agricultural area leading to land abandonment. This decrease in land use results from a stabilizing population, further increases in yields, and increasing food imports. The pathway thus shows that some land could be abandoned for agricul-tural purposes, to be compensated for by the expansion of agricultural land in low-income areas. These abandoned agricultural areas are used in the GEA-Mix scenario for bioenergy production, which also provides alternative rural income.
Land use for production is also expected to expand in low-income regions such as sub-Saharan Africa, Latin America, and Southeast Asia.
Here, an important driver is relatively low production costs. Again, this opens up routes for bioenergy production. Figure 17.24 shows import-ant bioenergy production areas developing in Latin America and sub-Saharan Africa (which also retain vast forest areas). The trends in the other GEA pathways are broadly comparable to those shown here and are therefore not discussed in detail.
Regional Analysis of CCS As discussed in previous sections, the role of CCS is very heterogeneous in the electricity and liquid and gaseous fuel sectors as well as across the globe. Regionally, the situation depends on available alternatives such as nonbiomass renewable energy sources, but it depends even more so on the resource basis and costs of fossil fuels and bioenergy. As a result, the amount of CO 2 captured and stored, or shipped to appropri-ate storage elsewhere, also varies widely. Figure 17.25 shows regional cumulative CO 2 storage over the century in the three illustrative GEA pathways in their IMAGE and MESSAGE interpretations.
The regions with the highest storage volumes are those with large coal resources and correspondingly high utilization of coal with CCS (Centrally Planned Asia and China), large bioenergy potential (sub- Saharan Africa), a combination of the two (North America) or a lack of alternatives (South Asia). Regional CO 2 storage potentials reported in the literature (see Chapter 13 , Section 13.4.3 ; IPCC, 2005 ; and Hendriks et al., 2004 ) indicate that in some regions, storage beyond the best estimate may be needed under the higher CCS deployment levels derived in the present analysis. 31 Particularly difficult is the situation in South Asia, where even the comparatively modest need for CO 2 storage under conditions of low demand comes close to the higher estimate by Hendriks et al., ( 2004 ). It must be acknowledged that the global best estimate of Hendriks et al. ( 2004 ), about 1660 GtCO 2 , is almost 20% lower than the best estimate of the IPCC Special Report on CCS (IPCC, 2005 ) published shortly after-ward. The overview of CO 2 storage estimates presented in Chapter 13 , Section 13.4.3 indicates that uncertainties of storage estimates in saline aquifers – potentially the largest storage option by far, with up to more than 20,000 GtCO 2 at the global scale – are very large and that reliable estimates at the regional level are often missing.
17.3.5 Energy Investments
Having presented the main transformational changes of the GEA pathways, the discussion moves now to financial resources, and specifically to the energy investments that need to be mobilized to transform the system.
An important characteristic of the energy sector is its long-lived capital stock, with lifetimes for infrastructure and energy conversion facilities of
30 Note that this only holds for the MESSAGE interpretation of the GEA pathways because the representation of solar energy in the IMAGE modeling framework is restricted to solar photovoltaic, which leads to signifi cantly lower solar energy con-tributions in the IMAGE interpretation of the GEA pathways.
31 Because of the large uncertainties in the regional CO 2 storage potentials, no expli-cit limitations were imposed in the scenario generation process with the MESSAGE model, whereas IMAGE explicitly includes limitations for CO 2 storage based. This section presents an ex post comparison of storage needs in the GEA pathways with ranges from the literature undertaken here.
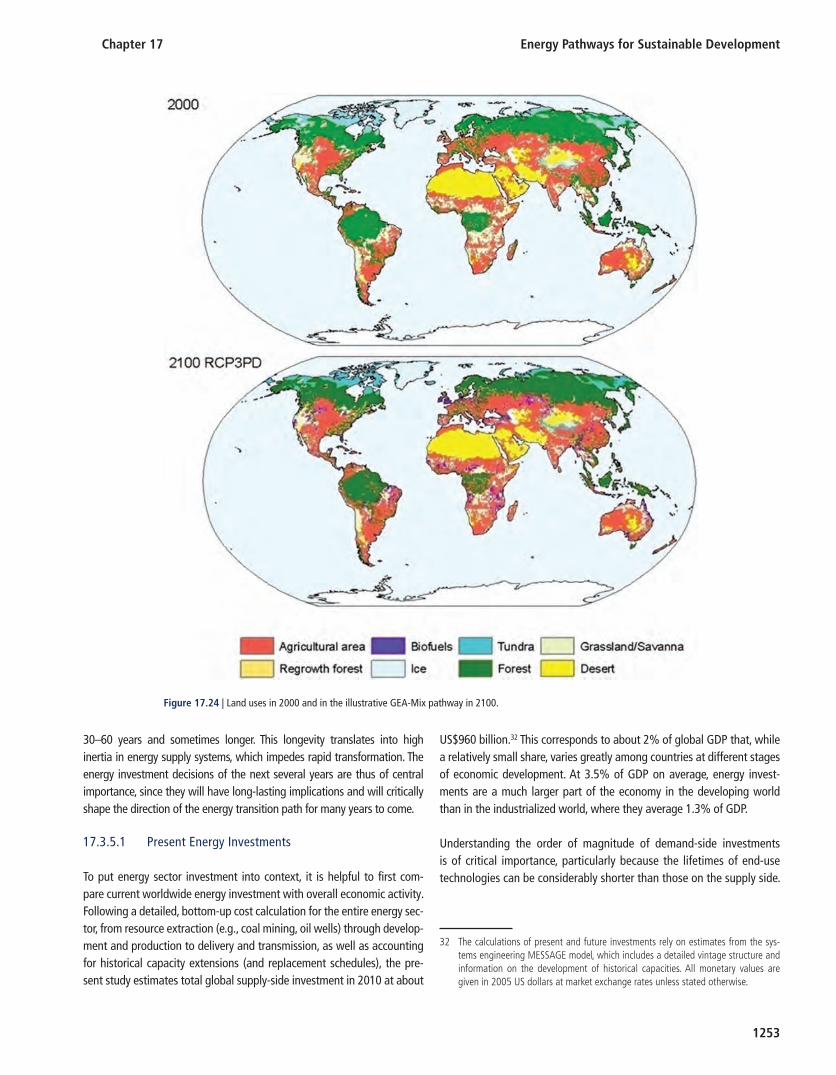
Chapter 17 Energy Pathways for Sustainable Development
1253
30–60 years and sometimes longer. This longevity translates into high inertia in energy supply systems, which impedes rapid transformation. The energy investment decisions of the next several years are thus of central importance, since they will have long-lasting implications and will critically shape the direction of the energy transition path for many years to come.
17.3.5.1 Present Energy Investments
To put energy sector investment into context, it is helpful to first com-pare current worldwide energy investment with overall economic activity. Following a detailed, bottom-up cost calculation for the entire energy sec-tor, from resource extraction (e.g., coal mining, oil wells) through develop-ment and production to delivery and transmission, as well as accounting for historical capacity extensions (and replacement schedules), the pre-sent study estimates total global supply-side investment in 2010 at about
US$960 billion. 32 This corresponds to about 2% of global GDP that, while a relatively small share, varies greatly among countries at different stages of economic development. At 3.5% of GDP on average, energy invest-ments are a much larger part of the economy in the developing world than in the industrialized world, where they average 1.3% of GDP.
Understanding the order of magnitude of demand-side investments is of critical importance, particularly because the lifetimes of end-use technologies can be considerably shorter than those on the supply side.
Figure 17.24 | Land uses in 2000 and in the illustrative GEA-Mix pathway in 2100.
32 The calculations of present and future investments rely on estimates from the sys-tems engineering MESSAGE model, which includes a detailed vintage structure and information on the development of historical capacities. All monetary values are given in 2005 US dollars at market exchange rates unless stated otherwise.

Energy Pathways for Sustainable Development Chapter 17
1254
Demand-side investments might thus play an important role in achiev-ing pervasive and rapid improvements in the system. Following the ana-lysis of Chapter 24 , around US$300 billion is additionally invested in energy components at the service level, such as engines in cars, boil-ers in building heating systems, and compressors, fans, and heating elements in large household appliances. Demand-side investments are, however, subject to considerable uncertainty due to a lack of reliable statistics and difficulties in clearly defining what constitutes a purely energy-related investment. Chapter 24 thus reports a relatively wide range of energy component investments on the demand side of about US$100 billion to US$700 billion. In addition, accounting for the full cost of demand-side energy technologies (not only the energy components) would increase investment (but also uncertainty) by about an order of magnitude, to about US$1700 billion (with a range of US$1000 billion to US$3500 billion; see Chapter 24 for more details).
Uncertainties are considerably smaller for total supply-side investment. The estimates presented here are, for instance, similar to those of the International Energy Agency (IEA, 2009b ). 33 There is nonetheless some
uncertainty about investment in specific technologies, such as nuclear power. The estimates used for this study include about US$5 billion of investment into approximately 2 GW of new nuclear capacity additions worldwide. In addition, proportional investment in ongoing construction of about 43 GW capacity and investments in fuel processing and life-time extensions are taken into account. These categories are subject to relatively more uncertainty, but they account for the bulk of total invest-ment in nuclear by up to US$40 billion.
Figure 17.26 summarizes present investment for individual supply-side sectors. Investments are most capital intensive in the power sector, which includes generation, transmission, and distribution. This sec-tor thus accounts for about 42% of total investment, with generation (US$270 billion) accounting for about the same share as transmission or distribution (US$260 billion). The remaining supply-side investment is dominated by the fossil fuels upstream sector: US$130 billion for natural gas, US$210 billion for oil, and US$33 billion for coal. 34 As men-tioned above, the uncertainties are particularly large for demand-side investments, which account for at least 24% of total investment (if only energy components are considered).
Figure 17.25 | Cumulative CO 2 storage by region until 2100 across the illustrative GEA pathways from MESSAGE and IMAGE. The fi gure also shows prospective areas in sedi-mentary basins where suitable saline formations, oil or gas fi elds, or coal beds may be found (prosperity map from Bradshaw and Dance, 2005 ).
33 Unfortunately, the IEA does not report all investment categories for the base year but focuses rather on cumulative numbers to 2030. The present analysis thus recon-structed the IEA base-year numbers for individual categories using activity numbers as proxies. Note also that the IEA investments are reported for 2008, whereas those reported here are for 2010. Hence, some of the difference might be due to the dif-ferent base years.
34 Upstream investments include investment in extraction as well as transportation and distribution and upstream conversion facilities (such as LNG terminals and refi ner-ies). They exclude, however, investment for fossil fuel exploration (on the order of about US$50 billion).

Chapter 17 Energy Pathways for Sustainable Development
1255
The composition of investment has been especially dynamic in the past few years. Renewable energy investment, in particular, grew at an unpre-cedented rate of more than 50% annually between 2004 and 2008, reach-ing US$83 billion in the latter year, and is presently about US$190 billion (of which US$160 billion goes into power generation). By comparison, investment in fossil power generation in 2010 was about US$110 billion.
17.3.5.2 Future Investment Needs for Transformational Change
Investments in energy supply and demand will be critical for achiev-ing virtually all energy objectives. Figure 17.27 shows the cumulative investment projection up to 2050 for each of the three illustrative GEA pathways. The figure indicates that achieving the GEA climate targets ( Section 17.5.1 ) while also improving energy security ( Section 17.6 ) and access and reducing pollution ( Section 17.4 ) will require a scaling up of investment by almost a factor of 2 compared with today. 35 This corresponds to average annual investment globally of between US$1.7 trillion and US$2.2 trillion, or about 1.8–2.3% of global GDP.
In addition to the need to scale up investment, all the GEA transform-ational pathways depict significant changes in the structure of the invest-ment portfolio. On the supply side, the transformation of the system is achieved through pronounced shifts of investment away from the upstream fossil fuel sector to downstream electricity generation and transmission. Consequently, the share of upstream fossil fuel-related
supply-side investment in total investment decreases from 30% at pre-sent to about 12–23% by 2050. At the same time, electricity investment increases its share on average from about 55% to up to 68% by 2050.
Among all supply-side options, the largest increase in investment needs is for renewable power generation, ranging from US$160 billion/year in pathways with restricted renewables penetration to US$800 bil-lion/year in pathways without CCS and nuclear power (compared with US$160 billion/year in 2010). Another priority for future investment is in building electricity transmission and distribution systems with suffi-cient operation and capacity reserves to increase reliability, as well as in power storage to allow the integration of intermittent renewables. Global average electricity grid investment (including storage) by 2050 thus increases to about US$310 billion to US$500 billion/year across the GEA pathways, compared with US$260 billion in 2010.
As discussed in the previous section, nuclear power and CCS play a prom-inent role in some of the GEA-Mix and GEA-Supply pathways, but the full portfolio also includes transformations excluding these options. The uncertainty ranges of these options are thus relatively wide. Investment in CCS ranges from zero to about US$65 billion/year, and investment in nuclear is between US$5 billion and US$210 billion/year. As Figure 17.28 indicates, the higher-bound estimates correspond to pathways in each GEA group that assume limited potential for other technologies.
Investment requirements for each pathway are the result of detailed, bottom-up cost calculations. Each technology of the energy system is characterized by a set of technical and economic parameters, one of which is investment cost measured in US dollars per kilowatt of installed capacity (US$/kW). In the long term, specific investment costs are not static. Innovation and technological learning tend to lower such costs,
Demand (energy components)
Oil
Gas
Coal
Electricity Transmission/Distr.
Fossil Electricity
Nuclear Renewable Electricity
Other conversion
Industrialized50%
Developing50%
UpstreamFossil Fuels
30%
Electricity 42%
Efficiency > 24%
Figure 17.26 | Composition of energy investment in 2010. Total supply-side investment, excluding investment in fossil fuel exploration, is about US$960 billion. In addition >300 billion investments are made into energy components at the demand level.
35 Note that future demand-side investments of the pathways consider only effi ciency-related investments at the margin. Comparable global investments into effi ciency improvements for the year 2010 are not available. Hence, for 2010 investments for the demand-side consider the full investments into energy components. Future investment needs compared to the year 2010 might thus be an underestimate.

Energy Pathways for Sustainable Development Chapter 17
1256
and future energy sector investment requirements will depend greatly on the degree to which innovation and learning improve specific invest-ment costs, efficiencies, emissions, and other performance characteristics (Nakicenovic et al., 1998 ; Roehrl and Riahi, 2000 ). Environmental regula-tion and resource depletion, on the other hand, tend to increase specific investment costs. In the past, innovation has more than compensated for depletion, and often for environmental regulation as well. The extent to which this trend continues in the future varies across pathways. The ranges of specific investment costs assumed for several key energy tech-nologies are presented in the electronic appendix to this chapter, as well as in the GEA database at www.iiasa.ac.at/web-apps/ene/geadb/.
Generally, the present analysis suggests that the transition pathways that focus on energy efficiency achieve the targets at more modest cost and thus represent the lower bound of the investment range ( Figures 17.27 and 17.28 ). One reason for this is the multiple benefits of effi-ciency measures (and behavioral and lifestyle changes) that limit energy demand and thus contribute to meeting virtually all energy objectives. By contrast, many supply-side measures, such as end-of-pipe pollution control, help improve the sustainability of the system with respect to one objective (local air pollution control) but do not necessarily contribute to others (e.g., climate change mitigation). The other reason why the effi-ciency pathways depict more modest costs has to do with the nonlinear-ity of the aggregate supply cost curve: the lower the demand, the less the need to deploy supply-side options with higher marginal costs.
Achieving high levels of efficiency enhancement is not, however, a free lunch. In the GEA-Efficiency pathways, about one-third of overall invest-ment is efficiency related ( Figures 17.27 and 17.28 ). Efficiency invest-ment is calculated using a top-down methodology and thus includes investments on the margin only. In other words, only the efficiency-increasing part of an investment that directly contributes to improving energy intensity compared with a counterfactual (baseline) is accounted for. We thus do not consider the full demand-side investments in end-use devices. 36 Considering the latter would increase overall investment considerably (see the previous section and Chapter 24 ), but would not change the main conclusion with respect to the economic effectiveness of the efficiency measures. 37
0
5
10
15
20
25
30F
ossi
l
Bio
mas
s
Coa
l
Oil/
Gas
Nuc
lear
Ren
ewab
le
T/D
(incl
.S
tora
ge)
Liqu
ids/
othe
r
Effi
cien
cy
Fos
sil
Bio
mas
s
Coa
l
Oil/
Gas
Nuc
lear
Ren
ewab
le
T/D
(incl
.S
tora
ge)
Liqu
ids/
othe
r
Effi
cien
cy
Trill
ion
$
GEA-supplycumulative investments: 87 trillion$ to 2050average annual investments: 2.2 trillion$ per year
0
5
10
15
20
25
30
Trill
ion
$
GEA-efficiencycumulative investments: 68 trillion$ to 2050average annual investments: 1.7 trillion$ per year
0
5
10
15
20
25
30
Fos
sil
Bio
mas
s
Coa
l
Oil/
Gas
Nuc
lear
Ren
ewab
le
T/D
(incl
.S
tora
ge)
Liqu
ids/
othe
r
Effi
cien
cy
Trill
ion
$
GEA-Mixcumulative investments: 82 trillion $ to 2050average annual investments:2.0 trillion$ per year
oil
gas
coalccs
ccs
Figure 17.27 | Cumulative energy investment over 2010–2050 for the three illustrative GEA pathways. Within the “effi ciency” category, only investments dedicated to improv-ing effi ciency are considered. Total demand-side investments for all energy components and appliances would be an order of magnitude larger.
36 The baseline assumes the continuation of energy intensity improvement at historical rates.
37 Effi ciency investments are calculated compared with a hypothetical case where the decline in the energy intensity of demand follows globally the historical trend of about 1%/year. For the accounting of macroeconomic feedbacks and price elasti-city effects, the present analysis uses a macroeconomic equilibrium model (MACRO) linked to the systems engineering model MESSAGE from which are derived internally consistent energy intensity improvement rates for the alternative pathways (Messner and Schrattenholzer, 2000 ). Effi ciency investments are then computed by assum-ing that, in equilibrium, the marginal investment to reduce demand would equal the marginal investment in supply. Effi ciency investments thus include only invest-ments that have been made to enhance the effi ciency of demand in order to offset supply-side investments. Calculated effi ciency investment thus does not represent all demand-side investments, including, for example, the component costs of appli-ances, which would be an order of magnitude larger (see Chapter 24 ).

Chapter 17 Energy Pathways for Sustainable Development
1257
As in earlier analysis of stringent climate change mitigation scenarios (e.g., Fisher et al., 2007 ), the present study finds that the effect of the different investment patterns on the macroeconomy is relatively small. Compared to the counterfactual without policy interventions to achieve the GEA objectives, the projected loss to consumption by 2050 ranges from 0.6% for the GEA-Efficiency pathways to 1.4% for the GEA-Mix pathways and up to about 2.0% for the GEA-Supply pathways. This should be compared with 200% growth in overall consumption over the same period. 38
17.3.5.3 Policies to Mobilize Financial Resources
Although the GEA pathways reveal considerable uncertainty about future needs for investment in specific technology options, they clearly illustrate that present investment in energy is neither sufficient nor com-patible in structure with a sustainable investment portfolio. Mobilizing the required financial resources for the transformation will thus be a major challenge.
Increasing investment in the energy system as depicted by the GEA pathways requires the careful consideration of a wide portfolio of policies in order to create the necessary financial incentives. The portfolio needs to include regulations and technology standards in sectors with relatively low price elasticity, in combination with exter-nality pricing, in order to avoid rebound effects, as well as targeted subsidies to promote specific “no-regrets” options while address-ing affordability. In addition, attention must be given to building an enabling technical, institutional, legal, and financial environment to complement traditional deployment policies (particularly in the developing world).
Table 17.13 identifies effective combinations of policies for specific technology options (see also Chapters 22 and 26) and puts these in the context of the required future investment needs. In addition, the costs and policies for different technology options are compared with those for promoting energy access (see Section 17.4 for further details). Different types of technologies and objectives will require different combinations of policy mechanisms to attract the necessary investment. Table 17.13 thus distinguishes among various mecha-nisms: “essential” policy mechanisms are those that must be included for a specific option to achieve the rapid energy system transform-ation; “desired” policy mechanisms are those that would help but are not a necessary condition; “uncertain” policy mechanisms are those where the outcome will depend on the policy emphasis and thus might favor or disfavor a specific option; and “complement” policies are those that are inadequate on their own but could com-plement other essential policies.
As the table illustrates, future investment needs are comparatively mod-est for some objectives, such as access, but a variety of different policy mechanisms including subsidies, regulation, and capacity building need to be in place. Regulation and standards are also essential for almost all the other options; externality pricing (e.g., a carbon tax to promote the diffusion of renewables, CCS, or efficiency) might also be necessary for capital-intensive technologies to achieve rapid deployment. Capital requirements for energy infrastructure are among the highest of the options listed in Table 17.13 . Thus, high priority needs to be given to future policies (including regulations) to address security and reliability aspects of the energy infrastructure. In addition, subsidies will need to ensure that customers can afford the reliability levels they value. For a more detailed discussion of implementation and policy issues, see Chapters 22 and 26.
trill
ion
US
$2
00
5
0
20
40
60
80
100
Eff iciency
Other conversion
Nuclear electricity
CCS other
CCS electricity
T/D (incl. storage)
Fossil electricity
Fossil extraction
Renewable electricity
Biomass extraction
trill
ion
US
$2
00
5
0
20
40
60
80
100
Eff iciency
Other conversion
Nuclear electricity
CCS other
CCS electricity
T/D (incl. storage)
Fossil electricity
Fossil extraction
Renewable electricity
Biomass extraction
trill
ion
US
$2
00
5
0
20
40
60
80
100
Eff iciency
Other conversion
Nuclear electricity
CCS other
CCS electricity
T/D (incl. storage)
Fossil electricity
Fossil extraction
Renewable electricity
Biomass extraction
Advanced transportation Conventional transportation
GEA-Supply
GEA-Mix
GEA-Efficiency
X X X X
X X X XX X X
X X X XX X X X
Figure 17.28 | Cumulative energy investment over 2010–2050 for all GEA pathways. Within the “effi ciency” category, only dedicated investments to improve effi ciency are considered. Total demand-side investments for all demand-side energy compo-nents and appliances would be an order of magnitude larger.
38 Note that macroeconomic losses are indicative and do not, for example, include costs of overcoming policy barriers, effects of effi ciency improvements, reduced losses from air pollution and climate change mitigation, and benefi ts of improved energy security.

Energy Pathways for Sustainable Development Chapter 17
1258
17.3.6 Key Features of the Energy Transition
Fulfilling the GEA objectives is an extremely ambitious task, but it is technically possible. The full suite of GEA pathways, grouped accord-ing to the aggressiveness with which energy demand can be reduced,
show the potential role for a range of energy conversion chains, from primary energy sources to conversion technologies to end-use tech-nologies. Although there are a number of choices available to direct the energy system transformation, there is also a large number of givens – nonnegotiable, nondiscretionary components of an energy transition
Table 17.13 | Energy investments needed to achieve GEA sustainability objectives and illustrative policy mechanisms for mobilizing fi nancial resources.
Investment (billions of US$/year) Policy mechanisms
2010 2010–2050 Regulation, standards Externality pricing Carefully designed subsidies
Capacity building
Effi ciency n.a. 1 290–800 2 Essential (elimination of less effi cient technologies every few years)
Essential (cannot achieve dramatic effi ciency gains without prices that refl ect full costs)
Complement (ineffective without price regulation, multiple instruments possible) 3
Essential (expertise needed for new technologies)
Nuclear 5–40 4 15–210 Essential (waste disposal regulation and,of fuel cycle, to prevent proliferation)
Uncertain (GHG pricing helps nuclear but prices refl ecting nuclear risks would hurt)
Uncertain (has been important in the past, but with GHG pricing perhaps not needed)
Desired (need to correct the loss of expertise of recent decades) 5
Renewables 190 260–1010 Complement (renewable portfolio standards can complement GHG pricing)
Essential (GHG pricing is key to rapid development of renewables)
Complement (feed-in tariff and tax credits for R&D or production can complement GHG pricing)
Essential (expertise needed for new technologies)
CCS <1 0–64 Essential (CCS requirement for all new coal plants and phase-in with existing)
Essential (GHG pricing is essential, but even this is unlikely to suffi ce in near term)
Complement (would help with fi rst plants while GHG price is still low)
Desired (expertise needed for new technologies) 5
Infrastructure 6 260 310–500 Essential (security regulation critical for some aspects of reliability)
Uncertain (neutral effect)
Essential (customers must pay for reliability levels they value)
Essential (expertise needed for new technologies)
Access 7 n.a. 36–41 Essential (ensure standardization but must not hinder development)
Uncertain (could reduce access by increasing costs of fossil fuel products)
Essential (grants for grid, microfi nancing for appliances, subsidies for cooking fuels)
Essential (create enabling environment: technical, legal, institutional, fi nancial)
1 Global investments into effi ciency improvements for the year 2010 are not available. Note, however, that the best-guess estimate from Chapter 24 for investments into energy components of demand-side devices is by comparison about 300$ billion per year. This includes, for example, investments into the engines in cars, boilers in building heating systems, and compressors, fans, and heating elements in large household appliances. Uncertainty range is between US$100 billion and US$700 billion annually for investments in components. Accounting for the full investment costs of end-use devices would increase demand-side investments by about an order of magnitude (see Chapter 24 for details).
2 Estimate includes effi ciency investments at the margin only and is thus an underestimate compared with demand-side investments into energy components given for 2010 (see note 1).
3 Effi ciency improvements typically require a basket of fi nancing tools in addition to subsidies, including, for example, low- or no-interest loans or, in general, access to capital and fi nancing, guarantee funds, third-party fi nancing, pay-as-you-save schemes, or feebates as well as information and educational instruments such as labeling, disclosure and certi-fi cation mandates and programs, training and education, and information campaigns.
4 Lower-bound estimate includes only traditional deployment investments in about 2 GW capacity additions in 2010. Upper-bound estimate includes, in addition, investments for plants under construction, fuel reprocessing, and estimated costs for capacity lifetime extensions.
5 Note the large range of required investments for CCS and nuclear in 2010–2050. Depending on the social and political acceptability of these options, capacity building may become essential for achieving the high estimate of future investments.
6 Overall electricity grid investments, including investments for operations and capacity reserves, back-up capacity, and power storage.
7 Annual costs for almost universal access by 2030 (including electricity grid connections and fuel subsidies for clean cooking fuels).

Chapter 17 Energy Pathways for Sustainable Development
1259
Table 17.14 | Targets for the four main energy challenges and illustrative examples of policies and investments quantifi ed by the GEA pathways.In addition to these targets, the GEA also adopted adequate energy services to support economic growth as a normative goal (see Chapter 6 ).
Objective/Goal Target and timeline Pathway characteristics Examples of policies and investments Further details
Improve energy access
Universal access to electricity and clean cooking by 2030
Diffusion of clean and effi cient cooking appliances
Extension of both high-voltage electricity grids and decentralized microgrids
Increased fi nancial assistance from industrialized countries to support clean energy infrastructure
Microcredits and grants for low-emission biomass and LPG stoves in combination with LPG and kerosene fuel subsidies for low-income populations
Estimated cost to provide clean cooking: US$17billion to US$22 billion per year to 2030
Grants for high-voltage grid extensions and decentralized microgrids
Estimated cost to provide rural grid connections: US$18.4 billion to US$19 billion per year to 2030
Section 17.4
Reduce air pollution and improve human health
Achieve global compliance with WHO air quality guidelines (PM2.5 concentration < 10 μg/m3) for the majority of the world population, and the remaining populations staying well within the WHO Tier I-III levels (15–35 μg/m3) by 2030
Tightening of technology standards across transportation and industrial sectors (e.g., vehicles, shipping, power generation, industrial processes)
Combined emissions pricing and quantity caps (with trading)
Fuel switching from traditional biomass to modern energy forms for cooking in developing countries
Vehicles: Euro 3–4 standards for vehicles in developing countries by 2030 (e.g,, -60% NO x , PM reductions by 2030)
Shipping: Revised MARPOL Annex VI and NO x Technical Code 2008 (-80% SO x , NO x reductions by 2030)
Industry/power: rapid desulfurization, de-NO x , and PM control around the world by 2030
Estimated cost to meet air pollution targets: US$200 billion to US$350 billion/year in 2030 (about 12% of energy costs); co-benefi ts of stringent climate mitigation policies reduce overall pollution control costs by about 50–65%
Section 17.5.2 Section 17.7
Avoid dangerous climate change
Limit global average temperature change to 2°C above preindustrial levels with a likelihood >50% by 2100
Widespread diffusion of zero- and low-carbon energy supply technologies, with substantial reductions in energy intensity
Energy-related CO 2 emissions peak by 2020 and are reduced to 30–70% by 2050 from 2000 levels
Globally comprehensive mitigation efforts covering all major emitters
Financial transfers from industrialized countries to support decarbonization
Combination of cap-and-trade and carbon taxes (with initial carbon price >US$30/tCO 2 , increasing over time)
Upscaling of investments into low-carbon technologies and effi ciency measures to >US$600 billion/year to 2050
Additional fi nancial transfers to developing countries of about 3–12% of total energy systems costs to 2050, depending on the domestic commitment of industrialized countries
Section 17.5.1
Improve energy security
Limit energy trade; increase diversity and resilience of energy supply (both by 2050)
Increase in domestic energy supply options (e.g., renewables to provide 30–75% of primary energy by 2050), and reduction of the share of oil in global energy trade.
Increase in diversity of energy supply as well as end-use sectors and regions by 2050.
Infrastructure expansion and upgrades to support interconnections and backup, including increased capacity reserves, stockpiles, and energy storage technologies.
Public procurement strategies and regulations to support local supplies (e.g., renewable obligations)
Interconnection and back-up agreements between energy network operators
Stockpiling of critical energy resources for coordinated release during acute market shortages
Estimated cost of infrastructure upgrades for the electricity grid: >US$310 billion/year by 2050, co-benefi ts of stringent climate mitigation policies reduce overall security costs (import dependency and diversity) by more than 75%.
Section 17.6 Section 17.7
Further details Section 17.2.3 Section 17.3.4 Section17.3.5 (overview) and Sections 17.4–17.6 (details)

Energy Pathways for Sustainable Development Chapter 17
1260
that must begin immediately. These commonalities across all pathways (previously referred to as “musts” or necessities) are summarized here:
improvements to at least the historical rate of energy intensity •reduction (more rapid improvements in energy intensity, and thus aggressive efforts to improve end-use efficiency, would increase the flexibility of supply as well as the overall cost-effectiveness of the energy system transformation);
a rapid shift from traditional biomass to widely accessible, clean, •flexible energy forms;
important regional constraints on availability of energy resources, •although such constraints do not limit deployment on an aggregated global scale;
a broad portfolio of supply-side options focusing on low-carbon •energy from renewables, bioenergy, nuclear, and CCS and including:
strong growth in renewable energy beginning immediately, and a –rising requirement for storage technologies to support the integra-tion of intermittent wind and solar power into electrical grids;
strong bioenergy growth in the medium term, with extensive use –of agricultural residues and nonagricultural feedstocks (second-generation bioenergy) to mitigate adverse impacts on land use and food production;
nuclear energy as an important part of the supply-side portfolio –in many transition pathways, although it is also feasible to phase out nuclear energy completely; and
CCS as an optional bridging or transitional technology in the –medium term unless energy demand is high, in which case CCS becomes necessary.
aggressive decarbonization in the electricity sector (especially in –the high-demand case), a rapid phase-out of conventional (i.e., without CCS) coal power, and natural gas power as a bridging or transitional technology in the short to medium term;
at least some electrification of the transportation sector, even in a •conventional liquid fuels-based system;
continued dominance of oil among liquid and gaseous fuels into •and beyond the medium term, strong growth in liquid biofuels in the medium term, and thereafter the mix of liquid and gaseous fuels depends on transportation system choices and technological breakthroughs;
substantial increases in investment on both the demand and the •supply side (including energy infrastructure); and
concerted and aggressive policies to support energy system trans- •formation, including strong regulation and standards and externality pricing.
The storylines of the required energy system transformations that are quantified and elaborated on in the GEA pathways are far richer than these commonalities suggest. Nevertheless, this collation of all the required features of an energy system transformation describes the trunk off of which the many choices and possibilities branch.
Many of these choices are strongly influenced by one or more of the GEA objectives with respect to energy access, air pollution, climate change, and energy security. These are the subject of the second half of this chapter. Table 17.14 provides a link from Sections 2 and 3 on the GEA pathways to Sections 4–7 on the GEA objectives. Some of the main characteristics of the pathways are summarized in the context of each objective. More detailed policy and investment requirements are then given to illustrate how these pathways might be driven, and are explored at length in Sections 4–7.
17.4 Access to Modern Energy Carriers and Cleaner Cooking
This section builds on issues highlighted in Chapters 2 and 19 concern-ing the need for and benefits of providing universal access to clean cooking and electricity by 2030. This section discusses possible future scenarios for improving access to clean cooking and electricity to meet household energy needs in developing countries. All GEA scenarios are consistent with meeting a target of almost universal access by 2030. 39 The section starts with the GEA-Mix pathway and provides a detailed breakdown of specific access policies and their impacts toward reach-ing the target for the period 2005–2030. The detailed access modeling presented here focuses on three key regions where lack of access is currently the most acute – sub-Saharan Africa, 40 South Asia, and Pacific Asia – and for which disaggregate data are available on energy choices and use in the household sector. The detailed results from these regions are used to inform the estimation of costs and impacts of alternative policies to improve access to clean cooking and electricity. The sec-tion distinguishes between, on the one hand, access to clean fuels and stoves for cooking and, on the other, access to electricity for lighting and appliances. Electricity, even when available, is rarely used for cooking in most developing country households. Therefore, access to modern fuels is as important as access to electricity, if not more so, for meeting the thermal energy needs of most households.
39 The target is “almost universal access” because reaching the remotest rural popula-tions is exceedingly expensive.
40 While Sudan is not included in the sub-Saharan Africa region in GEA, it is included in this region for the access analysis because Sudan has severe issues with energy access.

Chapter 17 Energy Pathways for Sustainable Development
1261
17.4.1 Access to Clean Cooking
There is enormous diversity in the types and amounts of fuels used for cooking in households in developing countries. The starting point for this analysis is data on existing energy choices and demands to meet cook-ing energy needs in each of the three regions considered. The estimates of energy choices and demand are based on bottom-up estimates using detailed household survey data for key nations in each of the regions (see Ekholm et al., 2010 , and Pachauri et al., forthcoming, for details regarding data sources and methods). Most rural and low-income urban households in developing nations still depend predominantly on bio-mass to meet their cooking energy needs. For the base year 2005, the total quantity of final energy used for cooking in households for the three regions depicted in Figure 17.29 amounted to 15.8 EJ, of which 13.6 EJ was from biomass (including charcoal). This estimate differs sub-stantially from that of the IEA for total residential sector biomass con-sumption: about 18.5 EJ for the same three regions in 2005. There are several reasons for this difference. Apart from the large uncertainties associated with biomass demand estimates globally, the IEA estimates are generally higher than most national estimates. This study bases its estimates of biomass demand on bottom-up estimates from national household surveys and corrects these for differences in biomass con-sumption patterns across nations within regions. The resulting estimates are then further compared with national estimates of biomass consump-tion, wherever available, and scaled up to derive the regional estimates of consumption. As can be seen from Figure 17.29 , in rural sub-Saharan Africa and South Asia, the share of biomass (including charcoal) in total final cooking energy was as high as 97–98% in 2005. Among house-holds in rural Pacific Asia, this share was about 60%. In urban centers of South and Pacific Asia, a larger share of kerosene and LPG is used for cooking. However, even in urban sub-Saharan Africa, about 87% of total final energy used for cooking is biomass (again including charcoal).
The GEA access scenarios also estimate the numbers of people depend-ent on biomass and other solid fuels. Since this study considers the total
population dependent on these fuels and not only the share of the popu-lation that uses them as their primary source of cooking energy, our esti-mates tend to be slightly higher than other global estimates from the United Nations Development Programme, WHO, and the IEA (IEA, 2006 ; UNDP and WHO, 2009 ; IEA, 2010 ). This study finds that including only populations that report biomass or other solid fuels to be their primary source of cooking energy tends to underestimate the total population consuming solid fuels. Often populations that use solid fuels as a supple-mentary fuel actually consume a significant amount of these fuels and meet a large proportion of their total cooking energy needs from them.
Past efforts to model residential sector energy demand for cooking have been limited, particularly in developing countries. The reason is that empirical data for the least developed countries and regions are sorely lacking. Even in emerging nations, finding reliable data for the household sector is a huge challenge. Given the heterogeneity of fuel choices and demand in the household sector, data at an aggregate scale is insufficient for such analysis. Besides the lack of data, uncertainties concerning socioeconomic and demographic trends in these countries add to the challenge of energy demand modeling. Other difficulties with modeling energy demand and choices in developing countries have to do with the special circumstances and conditions in these nations. These have been discussed in detail by Pandey ( 2002 ), Pachauri ( 2007 ), and van Ruijven et al. ( 2008 ).
The GEA access scenarios for residential cooking energy employ the MESSAGE-Access modeling framework (see Ekholm et al., 2010 , and Pachauri et al., forthcoming, for details of the model). The model has several novel features that capture some of the special circumstances prevailing in developing countries. Demand is disaggregated both by rural and urban region and for heterogeneous income or expenditure groups. Data from detailed household surveys for key nations in each region are used to calibrate the model.
Various scenarios simulating different combinations of policy packages are modeled within the MESSAGE-Access framework to determine their impact on access to cooking fuels in these regions. Although the specific choice of fuels and cooking technologies will certainly need to be con-text specific, for the GEA access scenarios this study considers a final transition to LPG as the fuel of choice for cooking for those who have access to and can afford it. This should not in any way be interpreted as an endorsement of LPG as the best of the available choices. Clearly, other alternative cooking fuels, such as biogas, natural gas, and other emer-ging sources such as ethanol gel and dimethyl ether, in combination with different stove technologies, might be better suited to certain regions or nations. In some regions, there might even be a transition to electricity for cooking. However, in order to quantify the costs and impacts of alter-native policies, this study uses LPG as a proxy for all clean cooking fuels.
The main policies considered to encourage a more rapid transition away from solid fuels for cooking include fuel subsidies, to reduce the cost of cleaner fuels, and grants or microlending, to make access to credit
Figure 17.29 | Composition of fi nal energy use for cooking in rural and urban households in three developing regions in 2005.

Energy Pathways for Sustainable Development Chapter 17
1262
easier and lower households’ cost of borrowing. This makes it cheaper and easier for households to purchase both the fuel and the end-use equipment (cook stoves). Purchasing the stoves that use cleaner fuels often involves a capital outlay beyond the reach of poor and rural households, which often have irregular cash inflows. Policy packages that combine different levels of subsidies with microfinance options are also modeled.
17.4.1.1 Populations Dependent on Solid Fuels for Cooking
The GEA cooking fuel access scenarios project that the total population dependent on solid fuels for cooking will rise from 2.2 billion to 2.4 bil-lion in South Asia, Pacific Asia, and sub-Saharan Africa between 2005 and 2030, in the absence of new policies to improve access. The popula-tion dependent on solid fuels is projected to decline marginally in South Asia and more significantly in Pacific Asia, whereas in sub-Saharan Africa the numbers rise during this period. In all regions the percentage of the population dependent on solid fuels decreases between 2005 and 2030. This decrease is significantly more rapid in urban centers than in rural regions ( Figure 17.30 ). However, in urban sub-Saharan Africa, population growth is projected to outstrip the decrease in the percent-age of population dependent on solid fuels, so that the total population dependent on these fuels continues to rise. These projections are based on outputs of the MESSAGE-Access model that account for changes in income level and distribution, urbanization, and population growth and for the consequent impact of these factors on the transition in cooking energy choices.
The impact of the alternative policy packages considered on the num-bers of people dependent on solid fuels varies across the different regions from slight to dramatic. Figure 17.31 depicts the impact of the policies on the number of people dependent on solid fuels for each region and for the urban and rural sectors separately. A subsidy policy that reduces the price of clean fuels by 20% below existing prices in each region would reduce the number of people dependent on solid fuels in all three regions from 2.4 billion, in the case with no new policies, to 1.9 billion. A policy that provides cheaper microfinance options for upfront costs and the purchase of end-use equipment would also reduce that number to 1.9 billion. In estimating the effect of the microfinance policy, it is assumed that the interest charged on loans is 15%/year. This is at the low end of the range estimated by Robinson ( 1996 ) for interest rates on loans by microfinance institu-tions to the poor in developing countries, and much lower than the internal discount rate of poor households in these nations. The sce-narios that combine a fuel subsidy with microfinance are more effect-ive in all regions in accelerating a shift away from solid fuels than either a subsidy-only policy or providing microfinance alone, as Figure 17.31 also shows. However, even the policy scenario that combines a subsidy of 50% on the existing price with microfinance leaves about 500 million people, virtually all of them in sub-Saharan Africa, reliant on solid fuels in 2030.
17.4.1.2 Costs of Policies to Reduce Dependence on Solid Fuels
The GEA access scenarios quantify the costs of reducing dependence on solid fuels for several of the different policy packages considered. The net present value of the costs is estimated for each policy scenario and compared with the impact of the policy in reducing the number of people dependent on solid fuels to determine the relative effectiveness of each scheme. The cost of microfinance schemes is estimated to be zero for governments, as it is assumed that microfinance companies are able to cover the costs of their operations through the interest payments they receive. If however, the capital costs of new stoves are met through some form of public grants, these obviously represent a police cost. Although the objective of all access policies is to accelerate the transi-tion away from the use of solid fuels to modern forms of liquid or gas-eous cooking fuels, not all policies are able to achieve this equally. For those households that remain dependent on solid fuels, an estimate was made of what it would cost to provide them with improved cook stoves. Chapter 19 provides information on a range of improved cook stove technologies developed around the globe. These vary tremendously in design, sophistication, cost, emissions, and performance. However, it is assumed that, given the rapid improvements in stove technology, future deployment of such stoves will meet a minimum standard in terms of both efficiency and emissions as defined in Chapter 2 . Table 17.15 pro-vides a breakdown of costs by region and type cumulatively between 2010 and 2030. Figure 17.32 relates the cost per person gaining access per year to the number of people gaining access up until 2030, to pro-vide an indication of the effectiveness of alternative policies in provid-ing improved access to clean fuels.
The costs of policies aimed at encouraging a more rapid transition to the use of clean cooking fuels depend on the combination of the policy instruments deployed and the extent of subsidy, as shown in Table 17.15 . Even a low-cost policy of providing easier access to credit through microfinance institutions is projected to substantially reduce
9888
92 85
82
31
6510
98
53
82
13
0.00.20.40.60.81.01.21.41.61.8
Rural Urban Rural Urban
2005 2030 No new policies
Popu
la�
on in
Bill
ions
Sub-Saharan Africa Pacific Asia South Asia
Figure 17.30 | Population relying on solid fuels in three developing regions in 2005 and in 2030 in the absence of new policies. Numbers on the bars are percentages of the total population in the indicated region and year.

Chapter 17 Energy Pathways for Sustainable Development
1263
dependence on solid fuels among urban populations and the richer rural households in South Asia and Pacific Asia by 2030. However, a policy that promotes microfinance alone leaves about 1.4 billion people still dependent on solid fuels in 2030. Such a policy, if combined with a
massive scale-up of improved cook stoves that are more efficient and less polluting than conventional stoves, along with better ventilation in cooking areas, might be a cost-effective interim solution for many rural households for whom a shift away from biomass may be out of reach in the short term. The financial requirements of such a policy are the lowest among the entire combination of policy scenarios assessed: on the order of US$1.1 billion to US$1.6 billion/year until 2030. A more stringent access target would require a combination of grants or micro-finance for the purchase of stoves with a fuel subsidy and would cost considerably more, about US$15.8 billion to US$17.0 billion/year until 2030. The wide range of uncertainty in the cost estimates reflects the high capital costs associated with the use of cleaner fuels. The lower range of the cost estimates assumes that the entire cost of the stoves is met through cheap loans provided by microfinance institutions that are able to recover their costs. The total spending required to meet an access target for clean cooking fuels and stoves would be higher if stove costs have to be funded through public grants.
Clearly, the choice of policies, the stringency of the targets, and the exact combination of clean fuels and end-use stove technologies promoted are likely to be specific to each country or region. However, the analysis presented here is indicative of the range of costs of different combin-ations of policies and their effectiveness in achieving different access targets. What is clear from this analysis is that, although fuel subsidies are necessary to increase access for the poorest households and regions, subsidies alone are likely to be less effective in accelerating a transition
0.0
0.6
1.2
1.8
2.4
3.0
3.6
4.2
Base 2005 No newpolicies 2030
20% FuelSubsidy 2030
50% FuelSubsidy 2030
Microfinance@15% only
2030
Microfinance@15% + 20%Fuel Subsidy
2030
Microfinance@15% + 50%Fuel Subsidy
2030
Popu
la�o
n in
Bill
ions
Solid Fuel Users Sub-Saharan Africa Solid Fuel Users Pacific Asia Solid Fuel Users South Asia
Liquid Fuel Users Sub-Saharan Africa Liquid Fuel Users Pacific Asia Liquid Fuel Users South Asia
Impr
oved
Acc
ess
to M
oder
n Fu
els
Solid
Fue
l Use
rs
Figure 17.31 | Impact of alternative policy scenarios on access to clean cooking fuels in three developing regions. Subsidies are relative to consumer price levels and are additional to existing subsidies.
0.0
0.4
0.8
1.2
1.6
2.0
2.4
2.8
3.2
0 3 6 9 12 15 18
Tota
l Pop
ula�
on g
aini
ng a
cces
s to
mod
ern
fuel
s �l
l 203
0 in
Bill
ions
Cost per person gaining access in US$ per year
Fuel Subsidy Only
Fuel Subsidy with Grants orMicrofinanace @ 15%
50% Subsidy
20% Subsidy
Figure 17.32 | Costs of alternative policy packages and their effectiveness in redu-cing dependence on solid fuels in three developing regions (sub-Saharan Africa, Pacifi c Asia, and South Asia) between 2010 and 2030.

Energy Pathways for Sustainable Development Chapter 17
1264
to the use of clean fuels for cooking than a policy that combines sub-sidies with improved access to credit through microfinance institutions. Such a policy would make it easier for households to cover the capital costs associated with a switch to cleaner fuels.
Fuel subsidies are considered controversial in many nations, and many developing countries already have generous subsidies on kerosene and LPG. Although such subsidies may be justified on social grounds, they have often resulted in market distortions, been appropriated largely by richer consumers, and led to poor economic returns for energy suppliers and distributors. Leakages to the black market from existing subsidies to households for kerosene in India have been estimated to be as high as 44% (Planning Commission, 2006 ). However, “smart” and targeted sub-sidy schemes and lifeline tariffs for poor customers can be designed and have proved successful, as in the case of the Bolsa Familia program in Brazil, which couples assistance to low-income families for the purchase of LPG fuel with mandatory child school attendance. Removing subsid-ies in a phased manner once incomes reach a level where households have the ability to pay can be challenging for governments, but this can be achieved if coupled with increased social spending in other areas. In other countries, such as many in sub-Saharan Africa, low-income
consumers face prices for modern fuels that are at times even higher than the competitive market prices of these fuels in Europe. This diffe-rence in prices often arises from nonmarket factors such as weak insti-tutions and safety and stability concerns, which urgently need to be addressed. For the design and implementation of more targeted subsidy schemes and removal of nonmarket barriers, additional enabling condi-tions will need to be created in these nations. This will require additional capacity building to strengthen the administration of governance sys-tems and local institutions. Chapter 25 , especially, addresses the issue of capacity building and concludes that good governance in the energy sector is especially critical for attracting investments in needed infra-structural development in the least developed and emerging nations, which face the greatest challenge to expanding energy access.
17.4.2 Access to Electricity
Improving access to electricity requires accelerating the pace of electri-fication in the least developed countries and regions. Decisions about setting targets for grid expansion are generally made by national gov-ernments or regional bodies. However, the literature shows that public or private utilities generally bear the financial responsibility for these programs as the executors of these decisions (Zomers, 2001 ; Kemmler, 2007 ; World Bank, 2008 ). In the best case, decisions about where to expand electrification are grounded in standards or criteria for electri-fication. In general, such criteria support electrification in places where it is cheapest. Thus, utilities often select projects that require the least infrastructure investment relative to demand. Villages or communities that are closest to existing grids, that have the highest population dens-ity, or where economic activity is greatest are generally connected to the grid first. Social criteria, including preferential selection of the poorest households or more remote rural regions, also influence the decision for grid expansion in some nations, but less so because these regions are not the logical choice from an economic perspective for electric util-ities or developing country governments. In general, one can expect that electrification will proceed most rapidly where the costs are lowest.
In many countries, households also have to pay a connection fee and have to make their own decision about whether or not to get an electricity connection. Factors that influence whether households opt for grid con-nection are the amount of the connection fee, whether payments can be spread over time, and the household’s understanding of the fees, tariffs, subsidies, and billing (Zomers, 2001 ; Gaunt, 2005 ; World Bank, 2008 ).
This section analyzes electrification using two separate model frame-works. Within the MESSAGE-Access and IMAGE models, rural electrifica-tion and grid infrastructure expansion are modeled in slightly different ways. As a starting point, both models take existing levels of electrifi-cation by nation, or by subpopulation within a nation, to calibrate the base year. For the purposes of quantification, two alternative levels of demand are assumed for household consumption within both models, corresponding to different electricity service levels:
Table 17.15 | Cumulative fi nancing required to provide access to clean cooking fuels and devices in developing Africa and Asia, 2010–2030 (in billions of US$).
Policy intervention
RegionFuel
subsidyNew LPG
stoves
Improved biomass
cook stoves
Total, all three
regions
20% fuel subsidy
Sub-Saharan Africa
7.54 0.43 8.98
59.6–67.2Pacifi c Asia 3.47 0.75 2.93
South Asia 27.56 6.41 9.11
50% fuel subsidy
Sub-Saharan Africa
91.71 3.60 6.93
202.2–214.3Pacifi c Asia 10.42 0.95 3.01
South Asia 81.49 7.55 8.60
Microfi nance only 1
Sub-Saharan Africa
0.00 2.19 9.66
21.6–31.2Pacifi c Asia 0.00 0.87 3.05
South Asia 0.00 6.54 8.92
Microfi nance + 20% fuel subsidy
Sub-Saharan Africa
9.04 0.89 8.72
85.0–100.0Pacifi c Asia 5.35 1.28 2.43
South Asia 50.87 12.88 8.56
Microfi nance + 50% fuel subsidy
Sub-Saharan Africa
130.67 6.52 5.20
315.2–339.4Pacifi c Asia 16.72 1.71 2.60
South Asia 152.65 15.97 7.36
1 It is assumed that no public costs are associated with microlending and that microfi nance institutions are able to recover their full costs from the interest charged. However, these can be considered costs if purchase of the stoves is fi nanced from public grants.

Chapter 17 Energy Pathways for Sustainable Development
1265
Low demand or minimal access: each household has one conven- •tional light bulb (40W), and one out of three households has a televi-sion set (60W); on the assumption that these are used for three hours a day, this amounts to approximately 65 kWh/household/year.
High demand or sustainable universal access: consumption is •assumed to be 250W for four hours per day for lighting and other applications, as in the Tanzanian reference study of Modi et al. ( 2005 ), amounting to 420 kWh/household/year.
Electrification is defined differently in the two models. Within the IMAGE model, access is defined as connection to the grid. Thus, once the grid has been extended to reach a certain region, all households in that region are considered connected. The MESSAGE-Access model defines electri-fication in terms of whether a household’s electricity demand exceeds an amount considered the basic minimum required to meet household needs: 65 kWh/year in the low-demand case and 420 kWh/year in the high-demand case.
Future rates of electrification in both models are driven by future income growth. However, within the IMAGE framework, in the base case a regres-sion model is developed first by regressing national electrification levels on GDP per capita (in US dollars at purchasing power parity) in order to project what the future electrification level by region will be, based on future income (see the appendix for details of the methodology). Within the MESSAGE-Access model, future electrification in the base case is determined by income growth and distribution across rural and urban income groups. Thus, the MESSAGE-Access model incorporates a greater degree of heterogeneity on the demand side. By contrast, the IMAGE model takes into account a much finer degree of spatial resolution on the supply side, determining investment needs for rural electrification at the level of 0.5 × 0.5 degree grid cells. Each cell is considered to have either complete access to electricity or no access at all. Within a world region, grid cells are electrified over time, starting with those with the lowest levelized transmission and distribution costs.
17.4.2.1 Rural Populations with Access to Electricity
Figure 17.33 shows rates of access by region in the base year and pro-jections to 2030 for both models in two separate cases: one with no additional new policies or resources for improving the rate of electrifica-tion, and another with universal access. Differences are observed across the two models both in base-year rural access and in progress with elec-trification across time for the two scenarios. Rural electrification levels differ in the base year across the two models in part because of differ-ences in regional definitions in the IMAGE and MESSAGE models. For sub-Saharan Africa and South Asia, differences in regional composition across the two models are minor, and thus rural electrification levels are fairly similar. However, the regional definition for the Pacific Asia region differs significantly across the two models, as does the base-year electri-fication level. Differences in the sources of data used in the two models
also account for part of the variation in base-year electrification levels. Thus, for instance, in the MESSAGE-Access model, base-year electrifi-cation levels for Pacific Asia are based in large part on bottom-up esti-mates of access levels across rural income quintile groups in Indonesia. In contrast, in the IMAGE model, electrification levels in Pacific Asia are determined by estimates of rural electrification levels published in IEA ( 2006 ) and UNDP and WHO ( 2009 ). Progress with rural electrification in the two scenarios differs across the two models because of differences in base-year electrification levels and in methodology.
In sub-Saharan Africa, rural electrification in 2005 covers less than 10% of households in both models. Following a trend with increasing GDP per capita, in the no new policies scenario, this is projected to increase to 31% in 2030 according to the IMAGE model, but only to 15% according to the MESSAGE-Access model. In South Asia, the projected increase under the no new policies case is the largest, from 47% in 2005 to 77% in 2030 according to the IMAGE projections, and from 51% to 82% according to the MESSAGE-Access model. Thus, the shortfall with respect to universal access in 2030 is largest in sub-Saharan Africa. In other developing regions such as Latin America, rural electrification levels are already relatively high and are expected to reach over 90% by 2030 under the no new policies projections. For this reason, rural electrification is not modeled here for regions other than South Asia, Pacific Asia, and sub-Saharan Africa, which remain the regions where the gap between the no new policies scenario and the universal electrification scenario remains widest.
17.4.2.2 Investments for Improving Access to Electricity
The amount of investment required to increase electrification levels depends on the assumptions made about the costs of transmission and distribution, but also on population density. Costs rise as required cap-acity expands to meet rural household electricity demand. For example, regions with relatively high population density, such as South Asia, have lower costs per unit of capacity than less densely populated regions such
Figure 17.33 | Rural population with electricity in three developing regions in 2005 and in 2030 under business-as-usual and universal access scenarios. Numbers on the bars are percentages of the total rural population in the indicated region and year. Rural elec-trifi cation level in the MESSAGE model refers to the 420 kW/household scenario.

Energy Pathways for Sustainable Development Chapter 17
1266
as sub-Saharan Africa. Levelized transmission and distribution costs for electrification within both models are determined in the following way. Within the IMAGE model, costs are based on the required increase in capacity and the distance over which transmission is required. Thus, costs are determined by spatial factors such as population density and distance from an existing electricity network at the grid cell level. In the MESSAGE-Access model, a simple three-step, region-specific technol-ogy cost curve differentiated by grid capacity is used to estimate costs. Given the least-cost optimization approach of the MESSAGE-Access model, the low-cost grid technology deploys first and the high-cost grid technology next as electricity demand increases. Both models estimate the costs of almost universal power supply in a given region through grid connection by estimating the total cost of extending transmission and distribution to all populated parts of the region. Decentralized tech-nology alternatives such as mini-grids, off-grid, or stand-alone options might be more economic in some circumstances, but the present ana-lysis does not include these.
Figure 17.34 shows, for each region, the additional connection capacity and total cumulative investment needed until 2030 to achieve rural elec-trification and compares results across the two models. The largest invest-ment needs, not surprisingly, are in sub-Saharan Africa, where cumulative investment to achieve universal access amounts to an additional US$230
billion between 2010 and 2030. In the low demand scenario, where min-imal access is assumed, the cost is significantly lower – about US$37 billion in the case of sub-Saharan Africa. However, this may not be con-sidered sufficient and sustainable electricity access in the longer term. In general, the range in estimates depicted in the figure reflects the diffe-rence between the results from the two alternative models used. In Pacific Asia and South Asia, the majority of investment takes place in the no new policies case, so that the additional investment needed is relatively lower. This implies that additional investment for universal access in the three regions of sub-Saharan Africa, South Asia, and Pacific Asia is estimated at about US$300 billion cumulatively between 2010 and 2030.
17.4.3 Impacts of Access Policies on Energy Demand and Greenhouse Gas Emissions
The impacts of alternative policies for improving access to electricity and clean fuels for cooking are relatively modest in comparison with changes in demand in other sectors. As seen in Figure 17.35 , compared with the base year 2005, energy demand in 2030 is projected to almost double in the case where no new access policies are implemented, from 17.7 EJ to 33.2 EJ, with most of this rise accounted for by additional LPG demand for cooking and kerosene and electricity for lighting and appli-ances. In an access scenario with no fuel subsidy but easier access to credit through microfinance and minimal electricity access, total energy demand in the low electricity demand case in 2030 is lower than in the no new policies case, but LPG and electricity demand are higher. In this scenario, in addition to improved microfinance, if it is assumed that all households dependent on solid fuels are provided with improved biomass stoves that double the efficiency of combustion, then biomass demand in this scenario could be cut in half, from 10 EJ, as shown in Figure 17.35 , to about 5 EJ. Finally, in the case where a 50% fuel subsidy is combined with improved microfinance and high electricity demand with universal access, total energy demand actually drops to 16.8 EJ. This is explained by a rapid shift away from biomass to more efficient LPG for cooking and a substitution away from kerosene to electricity for lighting. Total LPG demand in this scenario is projected to rise from 1.1 EJ in the base year to 9.4 EJ in 2030; biomass demand declines from 13.4 EJ to 1.7 EJ over the same period. This increase in LPG demand over the entire projection period for the three developing regions amounts to less than half of energy use in 2005 in the Western European transpor-tation sector alone. Electricity demand rises in this scenario from 1.7 EJ in 2005 to 5.7 EJ by 2030, displacing about 6.6 EJ of kerosene.
The changes in final energy demand due to various access policies also have implications for GHG emissions. Figure 17.35 presents the impacts of various access policies on total GHG emissions relative to the base year of 2005. The grey columns (scale on the right axis) depict total emis-sions, assuming that all biomass consumption is sustainably harvested, and the error bars indicate emissions in the case where 20% of biomass consumption is assumed to be harvested unsustainably. Without any access policy, total GHG emissions increase by 65%, to 4.7 gigatonnes
Figure 17.34 | Additional connection capacity and cumulative investment required to achieve almost universal rural electrifi cation in three developing regions. Additional connection capacity equates to additional generation capacity of approximately 2 GW for the low case and 22 GW for the high case in the MESSAGE-Access model.

Chapter 17 Energy Pathways for Sustainable Development
1267
of carbon dioxide-equivalent (GtCO 2 -eq.) in 2030 compared with 2.9 GtCO 2 -eq. in 2005. As a consequence of implementing access polices, GHG emissions decline marginally, having a negligible impact overall.
17.4.4 Summary of the Costs and Impacts of Access Policies
The previous subsections have highlighted the level of existing access to both clean cooking and electricity in developing countries, the policies and measures required to accelerate access, and the relative costs and effectiveness of these policies and measures in achieving access goals and targets. Detailed assessments and scenarios were constructed for the three major regions of the world where the lack of access is most acute, namely, South Asia, Pacific Asia, and sub-Saharan Africa. These regions account for over 85% of the total global population without access to electricity and over 70% of the global population still dependent on solid fuels. Extrapolating the cost estimates for these three key regions to arrive at a global estimate of the costs of access policies suggests that between US$36 billion and US$41 billion will need to be spent annually until 2030 to ensure that almost universal access to clean cooking and electricity is achieved. For the high end of the estimate, about half of this amount will need to be spent on improving access to electricity and the rest on improving access to clean cooking. The largest share of this spending (more than a third of the total cost to achieve clean cooking access and two-thirds of the electrification bill) will need to occur in sub-Saharan Africa. The wide range in estimated costs is a consequence of whether the cost of stoves (LPG and improved biomass stoves) is included in the estimates or assumed to be provided through microfinance instruments that recover these costs. However, even the high end of this estimate is less than 5% of global energy sector investment today.
Spending on policies and measures to achieve access goals by 2030 will improve the welfare of those benefiting in several ways. Health impacts
from improved household air quality are quantified in Section 17.5.2.3. Access policies will result in averting between 0.6 million and 1.8 mil-lion premature deaths, on average, every year until 2030, or a savings of over 24 million DALYs annually. Additional benefits that are likely to be substantial include time savings for women and children and the poten-tial for improved livelihood opportunities.
17.5 Energy and the Environment
17.5.1 Climate Change
The ultimate goal of international climate change policy, as stated in Article 2 of the United Nations Framework Convention on Climate Change, is to “avoid dangerous anthropogenic interference with the climate system.” This goal has motivated a wide array of analyses of potentially dangerous climate change impacts and of mitigation strategies that might limit GHG concentrations or global average temperature increases. (For an overview see, for example, Smith et al., 2009 , or the report by IPCC AR4 Working Group II, IPCC, 2007 ). Political attention has increasingly focused on limit-ing global average warming to 2°C above preindustrial levels, as reflected most recently in the acknowledgment by the Copenhagen Accord of the scientific basis for such a limit (O’Neill et al, 2010b ).
The 2°C limit on warming has also been adopted by the GEA as one of the main sustainability objectives. This target is one of the fundamental drivers of the demand- and supply-side transformations portrayed in Sections 17.3.2 and 17.3.3 , respectively. The sequel of this section will focus on the consequences of the transformation for the required reduc-tions of GHG emissions, the pace at which the energy system will need to decarbonize, associated costs, and finally, some potential implica-tions with respect to the regional equity of the solutions.
17.5.1.1 Probability of Staying below 2°C Temperature Change
The relationship among future GHG emissions, resulting changes in GHG concentrations in the atmosphere, and the ultimate effect in terms of temperature change is subject to large uncertainty. Major reasons for this uncertainty include the limited present understanding of important carbon cycle feedbacks and, in particular, the uncertainty surrounding the so-called climate sensitivity, defined as the increase in global mean temperature resulting from a doubling of the GHG concentration in the atmosphere.
Implications of this uncertainty are manifold. First, climate change needs to be seen within the context of an adaptive risk management problem. That is, the risks of exceeding future thresholds for specific impacts need to be viewed in the context of measures undertaken today and in the future to reduce those risks, and the costs of those measures. Second, targets such as the 2°C limit need to be studied in a probabilistic context.
2.5
3.0
3.5
4.0
4.5
5.0
0
5
10
15
20
25
30
35
2005 2030 No new policies
2030 Microfinance
@15% +Universal Electrifica�on (L)
2030 50% Subsidy + Microfinance@ 15% + Universal
Electrifica�on (H)
Tota
l GH
G E
mis
sion
s [G
t CO
2-eq
]
Hou
seho
ld F
inal
Ene
rgy
in E
JBiomass Coal Kerosene LPG Electricity GHG Emissions
Figure 17.35 | Household fi nal energy demand and total GHG emissions in three developing regions (sub-Saharan Africa, South Asia, and Pacifi c Asia) in 2005 and in 2030 under alternative access policy scenarios. GHG emissions include those on both the supply and the demand side. Error bars represent additional emissions on the assumption that 20% of biomass consumption in households is not sustainably harvested.

Energy Pathways for Sustainable Development Chapter 17
1268
In other words, one has to define the likelihood with which a certain temperature target can be achieved to properly define the objective.
The GEA pathways aim at an ambitious target that maximizes the chances of keeping the global temperature increase below 2°C, while at the same time providing sufficient flexibility in the system to allow for multiple pathways to reach the target. Setting an ambitious target is important for limiting the risk of dangerous interference with the climate system with high likelihood. Flexibility of solutions is central for identifying decarbonization strategies that are robust against multiple uncertainties due, for example, to potential technological failure and the associated risks (see also the discussion about flexibility in Section 17.3.3 ). An extensive sensitivity analysis was therefore conducted to assess the “maximum” likelihoods under a range of assumptions for the stringency of emissions reductions. (For an illustration of likelihood esti-mates of different emissions pathways, see, for example, Figure 17.53 .) Probabilistic assessment of the relationship between GHG emissions and global temperature change has been studied by den Elzen and van Vuuren, ( 2007 ), Keppo et al. ( 2007 ), Meinshausen ( 2006 ), Meinshausen et al. ( 2009 ) and O’Neill et al. ( 2010a ). Like these earlier studies, the pre-sent analysis finds that under very stringent emissions reductions, the 2°C target can be achieved with a likelihood exceeding 50% (maximum likelihoods found in the analysis were around 67%). 41
Exact numerical values for the likelihood of meeting the 2°C target differ slightly across the individual GEA pathways. In principle, however, all GEA-Efficiency, GEA-Mix, and GEA-Supply pathways stay below the 2°C target with a probability between 50% and 67%.
17.5.1.2 GEA Emissions Pathways
The target of limiting temperature change to 2°C with a probability above 50% translates into very stringent emissions reductions, comparable to the lowest emissions scenarios that have been developed so far with integrated assessment models. This section focuses on CO 2 emissions, as these make up the largest share of greenhouse gas emissions from energy and industry by far. For non-CO 2 emissions of the GEA pathways, see the online GEA database: www.iiasa.ac.at/web-apps/ene/geadb.
Figure 17.36 compares the total global CO 2 emissions pathways of the GEA with selected scenarios from the literature, including the most stringent climate change mitigation scenarios assessed by the IPCC AR4 (category I, Fisher et al., 2007 ) as well as high-emissions scenarios assuming no interventions or climate policies in the future (Nakicenovic and Swart, 2000 ). As the figure illustrates, total CO 2 emissions (from land use, energy, and industry) in the GEA pathways follow a trajec-tory comparable to those of the most stringent IPCC scenarios. In these
low-emissions pathways, emissions may continue to increase for a very short period but have to peak and decline rapidly thereafter to reach zero to negative emissions in the long term.
The low-emissions pathways of the GEA and the IPCC category I scenarios are compatible with long-term atmospheric CO 2 concentrations below 400 parts per million (ppm). In fact, most of the GEA pathways reduce CO 2 concentrations to around today’s concentration of about 390 ppm. 42 These low concentrations are the result of achieving globally negative emissions due to enhancements of the terrestrial sink potential (e.g., afforestation and reforestation) in combination with BioCCS in the late 21st century. Further details on emissions mitigation options are provided below. Accounting for the direct and indirect effects of non-CO 2 GHG emissions and other radiatively active substances results in long-term concentration levels under the GEA scenarios of 440–450 ppm CO 2 -equivalent.
The CO 2 emissions of the GEA pathways are driven by stringent GHG mitigation policies to reduce emissions intensities across all sectors and sources (see Section 17.5.1.3 ). The magnitude of the challenge is huge, as Figure 17.36 illustrates by comparing the GEA emissions pathways with scenarios without any future climate change mitigation policies. Although, again, emissions in the absence of climate policies are subject to relatively large uncertainties, the GEA pathways depict reductions of about 70–85% by 2050 compared with scenarios without any policy interference.
Arguably, a more informative indicator of the necessary emissions reductions is obtained by comparing future emissions with today’s lev-els. For this purpose, Figure 17.37 considers CO 2 emissions from energy and industrial sources only. The corresponding emissions profiles of the GEA pathways feature three major characteristics for the short, medium, and long term:
41 For the estimation of likelihoods of temperature outcomes, the probability distribu-tion of the climate sensitivity of Forest et al. ( 2002 ) was used. The methodology is described in detail in O’Neill et al. ( 2010a ) and Keppo et al. ( 2007 ).
1850 1900 1950 2000 2050 2100
Glo
ba
l C
O2 e
mis
sio
ns (
GtC
O2)
-20
0
20
40
60
80
100
120
140IPCC Category I
A2r
B1
GEA - Supply
GEA - Mix
GEA - Efficiency
Figure 17.36 | Actual global CO 2 emissions, 1850–2000, and projections of the GEA pathways for 2000–2100. Solid lines in red, blue and green denote emissions under the three illustrative GEA pathways, and dashed lines those for individual pathways in the full set. Shaded area indicates the 90th percentile range of emissions under the most stringent mitigation scenarios of the IPCC AR4 (category I). Brown and grey lines of the A2r and B1 scenarios show the approximate range of nonintervention scenarios in the literature (Nakicenovic and Swart, 2000 ), assuming no implementa-tion of climate policies.
42 As reported by the Mauna Loa observatory (www.esrl.noaa.gov/gmd/ccgg/trends/#mlo).

Chapter 17 Energy Pathways for Sustainable Development
1269
rapid introduction of climate change mitigation measures over the •next decade to stop emissions growth, resulting in a peaking of emissions by about 2020;
further strengthening of climate policies over the medium term to •achieve CO 2 emissions reductions of about 30–70% by 2050 com-pared with 2000; and
net negative emissions by the end of the century in the majority of •pathways (particularly those that allow for BioCCS).
The relatively wide range of emissions reductions by 2050 reflects uncertainties with respect to emissions reduction potentials in the long and the short term. It is derived from the comprehensive sensitivity ana-lysis across the transformation pathways and reflects choices as well as uncertainties with respect to policy implementation and technological development on both the demand and supply sides of the energy sys-tem (see Sections 17.3.2 and 17.3.3 ). Generally, pathways that have restricted supply-side portfolios (e.g., limited potential for renewables, or no CCS) require more rapid emissions reductions early in the cen-tury, to compensate for the loss of mitigation potential in the long term. For example, in the absence of bioenergy and CCS, emissions from the energy sector cannot become negative in the long term and thus need to be reduced comparatively more early in the century. A later subsec-tion revisits the issue of how technology assumptions may influence the emissions profile.
The stringency of the emissions reductions becomes apparent when reviewing the cumulative emissions budgets of the GEA pathways. Given the cumulative nature of climate change, aggregate emissions over the full century represent one of the central boundary conditions for staying below the 2°C target. In the GEA pathways, the allowable emissions budget is on average around 1180 GtCO 2 between 2010 and 2100 (full range is 940–1460 GtCO 2 ). At today’s rate of emissions, this “headroom” would be spent on average in about 38 years (full range between 30–45 years). With continuing growth in emissions in the absence of any new climate policies, the headroom would shrink further to about 27 years (full range between 22–32 years) before the overall objective for the full century would become out of reach.
Table 17.16 summarizes the characteristics of the GEA pathways and compares them with the lowest emissions scenarios assessed by the IPCC (category I). In addition to the IPCC scenarios, this analysis consid-ers the three main recent studies that have looked into the relationship between short- and medium-term emissions characteristics of a wide set of scenarios. Van Vuuren and Riahi ( 2011 ) have conducted a survey of recent scenarios and updated the IPCC assessment with a wider set of new scenarios published since that assessment (collated from dif-ferent sources). In addition, the results of studies by den Elzen and van Vuuren ( 2007 ) and O’Neill et al. ( 2010b ) are shown, since they explicitly analyze short-term emissions reductions in the context of long-term temperature and GHG concentration targets.
The results across the studies are relatively similar, and all studies sug-gest the need for very ambitious short-term emissions reductions if CO 2 concentrations are to be kept below 400 ppm (corresponding to the 2°C target with a likelihood exceeding 50%). However, both the most recent studies and the GEA pathways indicate that there might be slightly greater flexibility for emissions reductions than indicated by the IPCC assessment. As noted by van Vuuren and Riahi ( 2011 ), a main reason for this difference is that a large number of new scenario studies have been published since the IPCC AR4 (IPCC, 2007 ), especially for very low long-term concentration levels. For instance, global emissions peak around 2020 in the GEA pathways as well as in the recent literature, which is around five years later than reported by the IPCC. Similarly, 2050 emis-sion reductions in the least reduction scenarios are about 30% in the GEA pathways, compared to 50% at the time of the IPCC assessment. Studies that explicitly explored emissions thresholds that, if surpassed, would make the lowest long-term targets infeasible suggest even less stringent emissions reductions (O’Neill, 2010b ). This latter conclusion depends, among other things, on assumptions about the future avail-ability of technology and the feasibility of negative emissions in the second half of the century, which is reviewed next.
Impact of Technology Assumptions on Required Short-Term Emissions Reductions As indicated earlier, the trajectory of emissions in the GEA pathways depends strongly on assumptions about technologies, the portfolio of abatement options considered, and their potentials. Crucial technological options include energy efficiency-enhancing technologies, renewables, CCS, and nuclear energy, as well as technologies that would allow for negative emissions later in the century, such as carbon plantations and BioCCS. For a discussion of the deployment of these options and how they shape the energy transformation, see Sections 17.3.2 and 17.3.3 .
The full set of GEA pathways explores alternative combinations of the above options, including pathways with restricted supply-side portfo-lios ( Section 17.3.3.5 ). These restrictions have significant implications for the short-term emissions pathway. Generally, pathways that assume limits on the potential of individual options in the long term require stronger short-term emissions reductions in order to stay within the cumulative emissions budget (dictated by the stringent climate change
2000 2020 2040 2060 2080 2100
Glo
ba
l C
O2
em
issio
ns (
GtC
O2)
–20
–10
0
10
20
30
40
GEA-Supply
GEA-Mix
GEA-Efficiency
Peak by 2020
Reductions of 31-71% by 2050
almost zero or negative in the long term
Figure 17.37 | Projected global CO 2 emissions from energy and industry in the GEA pathways. Solid lines denote emissions under the three illustrative GEA pathways, and dashed lines those for individual pathways in the full set.

Energy Pathways for Sustainable Development Chapter 17
1270
objective). Although this is the case for all restricted pathways and tech-nology combinations that were analyzed, Figure 17.38 shows the order of magnitude of this effect by using BioCCS as an illustrative example. The figure compares results of the scenario survey of van Vuuren and Riahi ( 2011 ) with the GEA pathways both for cases with BioCCS and for cases assuming that BioCCS does not become available in the future.
In general, pathways that include BioCCS allow for more mod-est emissions reductions in 2020 and 2050. Despite the fact that
BioCCS is rather a long-term option (see Section 17.3.3.5 ), the dif-ferences across pathways with respect to emissions are already rela-tively large by 2020 ( Figure 17.38 ). From a systems perspective, the results thus also illustrate the path dependency of the energy system and the importance of long-term planning for short-term decisions. In addition, this finding highlights the importance of the branch-ing point concept and the restricted portfolio analysis of the GEA for deriving robust policy conclusions for the short term (see next section).
2000 2020 2040 2060 2080 2100
Glo
ba
l C
O2 e
mis
sio
ns (
GtC
O2)
-20
-10
0
10
20
30
40
without BECCS
with BECCS
Em
issio
ns (
com
pare
d to 2
000)
0.0
0.5
1.0
1.5
with BECCS
wo BECCS
Em
issio
ns (
co
mp
are
d t
o 2
00
0)
0.0
0.5
1.0
1.5
GEA I II III GEA I II III
2020 Emissions 2050 Emissions
Figure 17.38 | Future CO 2 emissions with and without BioCCS. Left panel shows projected CO 2 emissions in the GEA pathways with and without BioCCS. Shaded areas show the corresponding ranges of the lowest (category I) mitigation scenarios in the literature. Middle and right panels compare average emissions in the GEA pathways by 2020 and 2050 with estimates from the scenario literature (van Vuuren and Riahi, 2011 ), with and without BioCCS. Error bands indicate 15–85% percentile range across the scenarios. “I” summarizes scenarios from the literature corresponding to similar targets as the GEA (category I of the IPCC, <400 ppm CO 2 ); “II” corresponds to scenarios of category II (400–440 ppm CO 2 ), and “III” corresponds to scenarios of category III (440–480 ppm CO 2 ).
Table 17.16 | Emissions trends in the GEA pathways and in the literature.
StudyYear of peak
emissions
Emissions reduction in 2050 from 2000
level (%) No. of scenarios
Cumulative emissions (GtCO 2 ) 4
2000–2050 2000–2100
Van Vuuren and Riahi (2011)
Before 2020 -85 to -40 27 807–1357 807–1522
IPCC (2007, category I) 1 2000 –2015 -85 to -50 6 n/a n/a
O’Neill et al. ( 2010b ) 2 Before 2030 -85 to -15 9 1393–1760 770–1503
Den Elzen and van Vuuren (2007)
Before 2020 -65 to -40 12 1144–1320 1364–1723
GEA (illustrative pathways) 3 Before 2020 -45 to -35 3 1290–1350 1490–1520
GEA (full set) Before 2020 -70 to -30 41 980–1400 1230–1540
1 IPCC AR4 ranges refer to the 90th percentile of the scenario distribution.
2 Includes scenarios down to 415 ppm CO 2 -eq. by the end of the century.
3 Ranges across the three illustrative GEA pathways for GEA-Supply, GEA-Mix, and GEA-Effi ciency.
4 CO 2 emissions from fossil energy and industry.
n/a, not available.
Source: den Elzen and van Vuuren, 2007 ; van Vuuren and Riahi, 2011 ; IPCC, 2007 ; O’Neill et al., 2010b .

Chapter 17 Energy Pathways for Sustainable Development
1271
Comparison with Present Pledges Having reviewed the emissions under the GEA pathways, this section turns to how they compare with present plans for GHG emissions reductions.
Various countries have made commitments to mitigation actions in the context of the Copenhagen Accord. The compound effect of these pledges on global GHG emissions is subject to uncertainty. Estimates differ between studies that have collated individual country pledges and translated them into global emissions levels due to different assumptions about, for example, the business-as-usual scenario, national actions, the use of offsets included in other countries’ targets, particular emissions categories, and the role of land use change (UNEP, 2010 ). Rogelj et al. ( 2010 ), for example, estimate that the present pledges are likely to lead to global emissions of 47.9–53.6 GtCO 2 -eq. by 2020, and UNEP ( 2010 ) estimates a range between 48.8–51.2 GtCO 2 -eq. by that year.
Figure 17.39 compares the range of emissions expected to result from the pledges by 2020 with the emissions reductions under the GEA pathways. As the figure illustrates, even the most optimistic assumptions about future implementation of pledges lead to emissions levels at around the upper bound of the GEA pathways. Present commitments are therefore not sufficient and thus inconsistent with the vast majority of the GEA pathways, which aim at limiting global temperature increase to 2°C com-pared with preindustrial times (with a likelihood of above 50%).
The gap between the present pledges and the GEA pathways ranges between none (a slight overlap of around 2 GtCO 2 -eq.) to as large as
11 GtCO 2 -eq. The pathways with no gap combine the most optimistic assumptions about the emissions reductions resulting from present pledges with the highest emissions estimate from all 41 feasible GEA pathways in 2020. However, as discussed earlier, the GEA pathways with the highest emissions in the short term coincide with those cases that employ the most optimistic assumptions about the future availability of technology, and in which the full portfolio of all mitigation options can expand pervasively and successfully. Any restriction to the portfolio of mitigation options requires greater emissions reductions over the short term in order to compensate for the loss of emissions reduction poten-tial in the long term. The gap between present pledges and the GEA pathways is therefore small only if one combines both the most opti-mistic assumptions about pledges with the most optimistic assumptions for the full portfolio of all mitigation options. The likelihood of the gap actually being small is thus rather low, especially if one considers the history of technology failure as well as the past performances of some countries in terms of emissions reductions.
The Price of CO 2 Figure 17.39 also shows, for each of several groups of GEA pathways, the CO 2 price that would need to be introduced globally to achieve the required reductions in emissions by 2020. According to this study’s estimates, CO 2 prices would need to be on the order of US$15–45 per tonne of CO 2 to keep emissions in 2020 between 2005 and 2010 levels. As discussed in Section 17.3.5 , however, higher carbon prices will need to be complemented by regulation and technology standards to mobil-ize the required investments and to act against, for example, rebound effects or barriers to implementation. In addition, the stringency of the mitigation policies needs to increase over time, leading to CO 2 prices increasing at about the pace of the discount rate (5%/year in the pre-sent analysis). In the most stringent emissions pathways, emissions need to drop to below the level of 2000 by 2020. The global CO 2 price corresponding to such stringent reductions is above US$110/tonne of CO 2 , a value comparable with average gasoline taxes in Western Europe today.
17.5.1.3 Emissions Mitigation in the Energy Sector
As discussed earlier in this section, the objective to limit temperature cha-nge to below 2 ̊ C with a likelihood greater than 50% translates into strin-gent emissions reduction targets for virtually all GHG-emitting sectors.
The abatement of GHG emissions can be achieved through a wide port-folio of measures in the energy, industry, agriculture, and forestry sectors, which are the principal sources of emissions and thus of global warm-ing. Measures to reduce CO 2 emissions range from structural changes to the energy system and the replacement of carbon-intensive fossil fuels with cleaner alternatives on the supply side (such as a switch from coal power generation to the enhanced use of nuclear and renewable energy) to demand-side measures geared toward energy conservation and effi-ciency improvements. In addition, CCS provides an “add-on” end-of-pipe
20
25
30
35
40
45
50
55
2000 2005 2010 2015 2020 2025 2030 2035 2040
Present pledges (2020)
Scenario literature 2020 range for 2C
GtC
O2-
eq.
Figure 17.39 | Short-term GHG emissions in the GEA pathways compared with the range of emissions resulting from present pledges by 2020. The lower error bar gives the 90th percentile range of 2020 emissions from low-mitigation scenarios in the literature (van Vuuren and Riahi, 2011 ). The GEA pathways are grouped according to ranges of CO 2 prices by 2020.

Energy Pathways for Sustainable Development Chapter 17
1272
approach for the decarbonization of hydrocarbon fuels. Other important options for GHG emissions reductions encompass the enhancement of forest sinks through afforestation and reforestation activities, as well as non-CO 2 emissions reductions in the agricultural sector.
Section 17.3.2.2 provides a comprehensive discussion of specific meas-ures to improve efficiency on the demand side. In addition, structural changes on the energy supply side of the GEA pathways are illustrated in detail in Section 17.3.3 . This section primarily explores the GHG emissions implications of those transformations, with a specific focus on the resultant pace of the decarbonization of energy supply as well as on the demand-side sectors (industry, residential and commercial, and transport).
At present, roughly 50% (14 GtCO 2 ) of global CO 2 emissions from energy are due to supply-side conversion processes, including electricity and heat generation and refining, but also losses during the transmis-sion and distribution of fuels ( Figure 17.40 ). The other half of emissions come from the direct use of fossil fuels in the end-use sectors: industry (5.6 GtCO 2 ), transportation (6.1 GtCO 2 ), and residential and commercial (3.6 GtCO 2 ). 43 In addition, about 2.2 GtCO 2 are contained in industry feedstocks and about 2.7 GtCO 2 -eq. of non-CO 2 GHGs are emitted by the energy and industrial sectors (for example, methane from coal extrac-tion and long-lived gases such as sulfur hexafluoride and hydrofluoro-carbons in industrial processes).
The stringent climate objective of the GEA pathways requires cutting CO 2 emissions from energy and industrial sources by about half in 2050 from 2000 levels (the full range across pathways is 30–70%). The bulk of these emissions reductions are achieved through decarbonization of supply, reducing its share of energy-related emissions from 50% today to between about 25–45% by 2050 (with exception of pathways assum-ing limited intermittent renewables assessed in Section 17.3 ). However, integration of supply and demand remains essential, since one of the main reasons for the comparatively rapid decarbonization of supply is the increasing quality and flexibility of fuels demanded by consumers (e.g., electricity). Higher fuel quality requires more elaborate conversion processes and thus permits decarbonization through both fuel switching (e.g., from coal power plants to renewable power) and end-of-pipe (CCS) solutions. The latter option is economic only in large centralized systems and is thus not applicable in the context of dispersed and heterogeneous demand-side sources (except for some industrial applications, such as CCS from cement production, which is considered in this analysis).
The enormous speed of supply-side decarbonization in the GEA path-ways is also illustrated by the build-up rates of low-carbon power plants (nuclear, renewable, or fossil power plants with CCS), which reach a share of around 75–98% of global power generation by 2050. By
comparison, the low-carbon share of primary energy increases to (still impressive but lower) shares of about 65–85% over the same period (see Section 17.3.4.3 for further details).
The decarbonization of the demand side is equally ambitious, although by mid-century significant amounts of fossil fuels continue to play a role in the final energy mix in most of the GEA pathways. Emissions reductions on the demand side are primarily due to fuel switching away from direct use of fossil fuels, as well as increased efficiency of end-use devices. 44 At the aggregate global level, emissions from the end-use sectors are reduced by about 45% in most of the GEA pathways by 2050 compared with 2000 ( Figure 17.40 ). These reductions are achieved despite increases in energy services levels. The low-carbon share of final energy fuels for services thus needs to increase significantly, from about 30% today to 60–70% by 2050 (see Section 17.3.4.3 for further details). The GEA-Efficiency pathways, which aim at limiting demand as one of the principal measures to attain the GEA sustainability targets, show more flexibility with respect to the rate of decarbonization and structural changes and are thus obviously at the lower bound of the ranges for low-carbon shares (for final and primary energy as well as electricity shares). Efforts to reduce emissions differ significantly across regions and are generally higher in today’s industrialized world than in the developing world (see Figure 17.40 and the GEA web database, at www.globalenergyassessment.org, for further regional detail).
17.5.1.4 Regional Perspectives and Equity Issues
Achieving emissions reductions, especially such drastic ones as those depicted by the GEA pathways, is a formidable task, considering that developing countries require increases in energy services and other activities that result in GHG emissions. The salient questions are how such reductions might be achieved and by whom, and what the effects (economic, distributive, etc.) might be. In other words, how is the burden of global emissions reduction going to be shared, and what might be the criteria for such burden sharing?
Of crucial importance in this context is the large disparity between indus-trialized and developing countries. The former are responsible for about 40% of global energy-related emissions but account for only 20% of the world population. The more industrialized countries are also respon-sible (some more than others) for the bulk of the historical increase in anthropogenic GHG concentrations. Conversely, developing countries will become more important contributors to GHG emissions in the future, almost independent of how high or low global GHG emissions actually turn out to be (Grubler and Nakicenovic, 1994 ; Riahi et al., 2007 ).
Regional disparities with respect to today’s per capita emissions are illustrated in Figure 17.41 . Differences between regions up to an order
43 Estimates from the industry sector include also process emissions (e.g., from cement production) and emissions related to nonenergy feedstocks (e.g., asphalt and lubricants).
44 The latter effect of reduced energy demand decreases emissions throughout the system and thus also contributes to the supply-side emissions reductions discussed above in this section.

Chapter 17 Energy Pathways for Sustainable Development
1273
of magnitude are seen: all the high-income regions of the industrialized world are significantly above the world average, whereas most develop-ing regions are considerably below the average.
The results of the GEA transition pathways clearly indicate the need for emissions reductions across virtually all regions in order to halve global per capita emissions by 2050 ( Figure 17.41 ). Given the stringency of the GEA target and the implied magnitude of emissions reductions, today’s industrialized countries must contribute proportionally greater reductions in per capita emissions. In the aggregate, this results in more equitable per capita emissions distributions in 2050 than today. Nevertheless, as Figure 17.41 illustrates, some of today’s most emissions-intensive regions (e.g., North America and the former Soviet Union) continue to emit more than the world average in 2050, while the poorest regions (e.g., South Asia and sub-Saharan Africa) stay considerably below the world average.
It is important to emphasize that the vast majority of model-based mitiga-tion analyses employ a cost-effectiveness approach. This means that emis-sions reductions are implemented globally when and where they are most cost-effective. The GEA scenarios are no exception in this respect. The GEA pathways address the question of when and how to spatially allocate, for
0
5
10
15
20
25
30
35
40
45
50
2005 GEA Supply GEA Mix GEA Efficiency
2050
GH
G e
mis
sion
s (G
tCO
2-eq
/yr)
World
Non-Energy (all GHGs)Energy (non-CO2)Res/Com (CO2)Industry (CO2)Transport (CO2)Supply (CO2)
0
5
10
15
20
25
30
2005 GEA Supply GEA Mix GEA Efficiency
GH
G e
mis
sion
s (G
tCO
2-eq
/yr)
Industrialized
Non-Energy (all GHGs)Energy (non-CO2)Res/Com (CO2)Industry (CO2)Transport (CO2)Supply (CO2)
0
5
10
15
20
25
30
2005 GEA Supply GEA Mix GEA Efficiency
GH
G e
mis
sion
s (G
tCO
2-eq
/yr)
Developing
Non-Energy (all GHGs)Energy (non-CO2)Res/Com (CO2)Industry (CO2)Transport (CO2)Supply (CO2)
Figure 17.40 | GHG emissions from energy supply and from demand-side sectors in 2005 and in the three illustrative GEA pathways in 2050. Dashed lines indicate additional GHG emissions from the non-energy sector. Error bars show the range across all GEA pathways within each pathway group.
0
5
10
15
20
25
Sub-
Saha
ran
Afr
ica
Cent
rally
Pla
nned
A
sia
and
Chin
a
Cent
ral a
nd
East
ern
Euro
pe
Form
er S
ovie
t U
nion
La�n
Am
eric
a an
d th
e Ca
ribb
ean
Mid
dle
East
and
N
orth
Afr
ica
Nor
th A
mer
ica
Paci
fic O
ECD
Oth
er P
acifi
c A
sia
Sout
h A
sia
Wes
tern
Eur
ope
Per-
capi
ta G
HG
em
issi
ons
(tCO
2 -e
q/ye
ar)
2010 World average
2050 World average
2010
2050
Figure 17.41 | Regional per capita GHG emissions. The full height of each bar rep-resents per capita emissions in the indicated region in 2010, and the lower section per capita emissions in the illustrative GEA pathways by 2050. The upper section thus indicates per capita emissions reductions between 2010 and 2050. The dashed hori-zontal line denotes world average per capita emissions in 2010 and the solid line the range across the three illustrative GEA pathways in 2050.
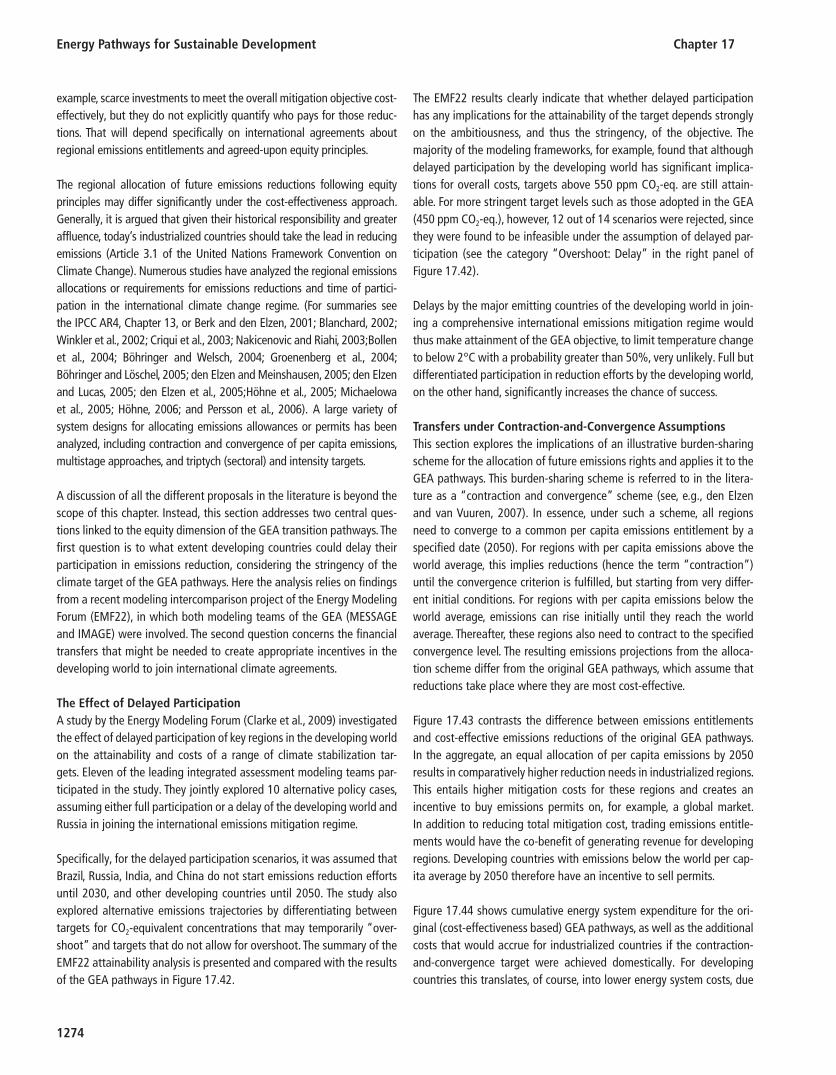
Energy Pathways for Sustainable Development Chapter 17
1274
example, scarce investments to meet the overall mitigation objective cost-effectively, but they do not explicitly quantify who pays for those reduc-tions. That will depend specifically on international agreements about regional emissions entitlements and agreed-upon equity principles.
The regional allocation of future emissions reductions following equity principles may differ significantly under the cost-effectiveness approach. Generally, it is argued that given their historical responsibility and greater affluence, today’s industrialized countries should take the lead in reducing emissions (Article 3.1 of the United Nations Framework Convention on Climate Change). Numerous studies have analyzed the regional emissions allocations or requirements for emissions reductions and time of partici-pation in the international climate change regime. (For summaries see the IPCC AR4, Chapter 13 , or Berk and den Elzen, 2001 ; Blanchard, 2002 ; Winkler et al., 2002 ; Criqui et al., 2003 ; Nakicenovic and Riahi, 2003 ;Bollen et al., 2004 ; B ö hringer and Welsch, 2004 ; Groenenberg et al., 2004 ; B ö hringer and L ö schel, 2005 ; den Elzen and Meinshausen, 2005 ; den Elzen and Lucas, 2005 ; den Elzen et al., 2005 ;H ö hne et al., 2005 ; Michaelowa et al., 2005 ; H ö hne, 2006 ; and Persson et al., 2006 ). A large variety of system designs for allocating emissions allowances or permits has been analyzed, including contraction and convergence of per capita emissions, multistage approaches, and triptych (sectoral) and intensity targets.
A discussion of all the different proposals in the literature is beyond the scope of this chapter. Instead, this section addresses two central ques-tions linked to the equity dimension of the GEA transition pathways. The first question is to what extent developing countries could delay their participation in emissions reduction, considering the stringency of the climate target of the GEA pathways. Here the analysis relies on findings from a recent modeling intercomparison project of the Energy Modeling Forum (EMF22), in which both modeling teams of the GEA (MESSAGE and IMAGE) were involved. The second question concerns the financial transfers that might be needed to create appropriate incentives in the developing world to join international climate agreements.
The Effect of Delayed Participation A study by the Energy Modeling Forum (Clarke et al., 2009 ) investigated the effect of delayed participation of key regions in the developing world on the attainability and costs of a range of climate stabilization tar-gets. Eleven of the leading integrated assessment modeling teams par-ticipated in the study. They jointly explored 10 alternative policy cases, assuming either full participation or a delay of the developing world and Russia in joining the international emissions mitigation regime.
Specifically, for the delayed participation scenarios, it was assumed that Brazil, Russia, India, and China do not start emissions reduction efforts until 2030, and other developing countries until 2050. The study also explored alternative emissions trajectories by differentiating between targets for CO 2 -equivalent concentrations that may temporarily “over-shoot” and targets that do not allow for overshoot. The summary of the EMF22 attainability analysis is presented and compared with the results of the GEA pathways in Figure 17.42 .
The EMF22 results clearly indicate that whether delayed participation has any implications for the attainability of the target depends strongly on the ambitiousness, and thus the stringency, of the objective. The majority of the modeling frameworks, for example, found that although delayed participation by the developing world has significant implica-tions for overall costs, targets above 550 ppm CO 2 -eq. are still attain-able. For more stringent target levels such as those adopted in the GEA (450 ppm CO 2 -eq.), however, 12 out of 14 scenarios were rejected, since they were found to be infeasible under the assumption of delayed par-ticipation (see the category “Overshoot: Delay” in the right panel of Figure 17.42 ).
Delays by the major emitting countries of the developing world in join-ing a comprehensive international emissions mitigation regime would thus make attainment of the GEA objective, to limit temperature change to below 2°C with a probability greater than 50%, very unlikely. Full but differentiated participation in reduction efforts by the developing world, on the other hand, significantly increases the chance of success.
Transfers under Contraction-and-Convergence Assumptions This section explores the implications of an illustrative burden-sharing scheme for the allocation of future emissions rights and applies it to the GEA pathways. This burden-sharing scheme is referred to in the litera-ture as a “contraction and convergence” scheme (see, e.g., den Elzen and van Vuuren, 2007 ). In essence, under such a scheme, all regions need to converge to a common per capita emissions entitlement by a specified date (2050). For regions with per capita emissions above the world average, this implies reductions (hence the term “contraction”) until the convergence criterion is fulfilled, but starting from very differ-ent initial conditions. For regions with per capita emissions below the world average, emissions can rise initially until they reach the world average. Thereafter, these regions also need to contract to the specified convergence level. The resulting emissions projections from the alloca-tion scheme differ from the original GEA pathways, which assume that reductions take place where they are most cost-effective.
Figure 17.43 contrasts the difference between emissions entitlements and cost-effective emissions reductions of the original GEA pathways. In the aggregate, an equal allocation of per capita emissions by 2050 results in comparatively higher reduction needs in industrialized regions. This entails higher mitigation costs for these regions and creates an incentive to buy emissions permits on, for example, a global market. In addition to reducing total mitigation cost, trading emissions entitle-ments would have the co-benefit of generating revenue for developing regions. Developing countries with emissions below the world per cap-ita average by 2050 therefore have an incentive to sell permits.
Figure 17.44 shows cumulative energy system expenditure for the ori-ginal (cost-effectiveness based) GEA pathways, as well as the additional costs that would accrue for industrialized countries if the contraction-and-convergence target were achieved domestically. For developing countries this translates, of course, into lower energy system costs, due

Chapter 17 Energy Pathways for Sustainable Development
1275
Figure 17.42 | Carbon emissions reductions from industrial and fossil sources in 2050 from 10 integrated assessment models. Dots outside the fi gure range indicate scenarios that were found to be infeasible under the specifi ed criteria.
Figure 17.43 | Projected GHG emissions in the case of contraction-and-convergence allocation of emissions entitlements compared with cost-effective emissions reductions in the GEA-Mix illustrative pathway. Shaded areas in the left panel show the resulting demand for permit trade in North America and Western Europe. Shaded areas in the right panel show the resulting emissions surplus for permit sales in South Asia and sub-Saharan Africa.
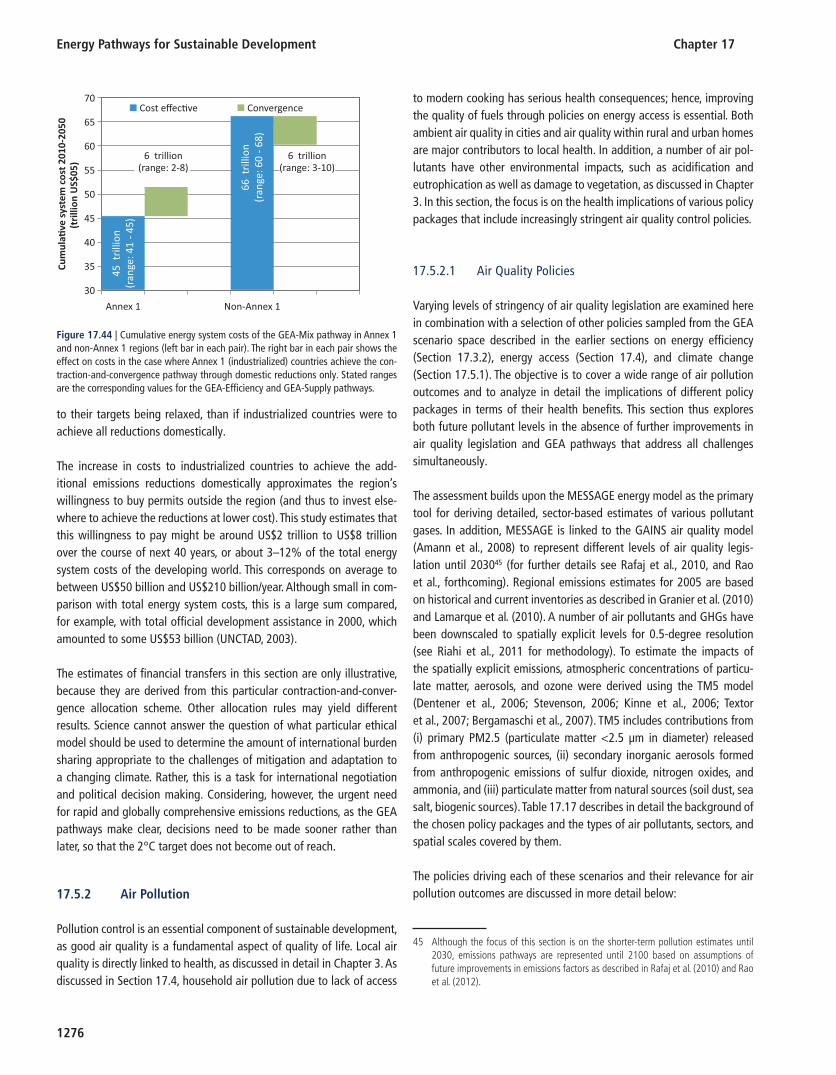
Energy Pathways for Sustainable Development Chapter 17
1276
to their targets being relaxed, than if industrialized countries were to achieve all reductions domestically.
The increase in costs to industrialized countries to achieve the add-itional emissions reductions domestically approximates the region’s willingness to buy permits outside the region (and thus to invest else-where to achieve the reductions at lower cost). This study estimates that this willingness to pay might be around US$2 trillion to US$8 trillion over the course of next 40 years, or about 3–12% of the total energy system costs of the developing world. This corresponds on average to between US$50 billion and US$210 billion/year. Although small in com-parison with total energy system costs, this is a large sum compared, for example, with total official development assistance in 2000, which amounted to some US$53 billion (UNCTAD, 2003 ).
The estimates of financial transfers in this section are only illustrative, because they are derived from this particular contraction-and-conver-gence allocation scheme. Other allocation rules may yield different results. Science cannot answer the question of what particular ethical model should be used to determine the amount of international burden sharing appropriate to the challenges of mitigation and adaptation to a changing climate. Rather, this is a task for international negotiation and political decision making. Considering, however, the urgent need for rapid and globally comprehensive emissions reductions, as the GEA pathways make clear, decisions need to be made sooner rather than later, so that the 2°C target does not become out of reach.
17.5.2 Air Pollution
Pollution control is an essential component of sustainable development, as good air quality is a fundamental aspect of quality of life. Local air quality is directly linked to health, as discussed in detail in Chapter 3 . As discussed in Section 17.4 , household air pollution due to lack of access
to modern cooking has serious health consequences; hence, improving the quality of fuels through policies on energy access is essential. Both ambient air quality in cities and air quality within rural and urban homes are major contributors to local health. In addition, a number of air pol-lutants have other environmental impacts, such as acidification and eutrophication as well as damage to vegetation, as discussed in Chapter 3 . In this section, the focus is on the health implications of various policy packages that include increasingly stringent air quality control policies.
17.5.2.1 Air Quality Policies
Varying levels of stringency of air quality legislation are examined here in combination with a selection of other policies sampled from the GEA scenario space described in the earlier sections on energy efficiency ( Section 17.3.2 ), energy access ( Section 17.4 ), and climate change ( Section 17.5.1 ). The objective is to cover a wide range of air pollution outcomes and to analyze in detail the implications of different policy packages in terms of their health benefits. This section thus explores both future pollutant levels in the absence of further improvements in air quality legislation and GEA pathways that address all challenges simultaneously.
The assessment builds upon the MESSAGE energy model as the primary tool for deriving detailed, sector-based estimates of various pollutant gases. In addition, MESSAGE is linked to the GAINS air quality model (Amann et al., 2008 ) to represent different levels of air quality legis-lation until 2030 45 (for further details see Rafaj et al., 2010 , and Rao et al., forthcoming ). Regional emissions estimates for 2005 are based on historical and current inventories as described in Granier et al. ( 2010 ) and Lamarque et al. ( 2010 ). A number of air pollutants and GHGs have been downscaled to spatially explicit levels for 0.5-degree resolution (see Riahi et al., 2011 for methodology). To estimate the impacts of the spatially explicit emissions, atmospheric concentrations of particu-late matter, aerosols, and ozone were derived using the TM5 model (Dentener et al., 2006 ; Stevenson, 2006 ; Kinne et al., 2006 ; Textor et al., 2007 ; Bergamaschi et al., 2007 ). TM5 includes contributions from (i) primary PM2.5 (particulate matter <2.5 μ m in diameter) released from anthropogenic sources, (ii) secondary inorganic aerosols formed from anthropogenic emissions of sulfur dioxide, nitrogen oxides, and ammonia, and (iii) particulate matter from natural sources (soil dust, sea salt, biogenic sources). Table 17.17 describes in detail the background of the chosen policy packages and the types of air pollutants, sectors, and spatial scales covered by them.
The policies driving each of these scenarios and their relevance for air pollution outcomes are discussed in more detail below:
45 Although the focus of this section is on the shorter-term pollution estimates until 2030, emissions pathways are represented until 2100 based on assumptions of future improvements in emissions factors as described in Rafaj et al. ( 2010 ) and Rao et al. ( 2012 ).
30
35
40
45
50
55
60
65
70
Annex 1 Non-Annex 1
Cum
ula�
ve s
yste
m c
ost 2
010-
2050
(tri
llion
US$
05)
Cost effec�ve Convergence
66 t
rilli
on
(r
ange
: 60
- 68)
45 t
rilli
on
(r
ange
: 41
- 45)
6 trillion(range: 2-8)
6 trillion(range: 3-10)
Figure 17.44 | Cumulative energy system costs of the GEA-Mix pathway in Annex 1 and non-Annex 1 regions (left bar in each pair). The right bar in each pair shows the effect on costs in the case where Annex 1 (industrialized) countries achieve the con-traction-and-convergence pathway through domestic reductions only. Stated ranges are the corresponding values for the GEA-Effi ciency and GEA-Supply pathways.

Chapter 17 Energy Pathways for Sustainable Development
1277
• No sustainability policies (FLE) : This policy package assumes that no specific policies on sustainability are implemented. There is no change in future air pollution policies relative to 2005. Energy demand in this scenario is higher than in the GEA-Supply illustrative scenario, as no climate change policies are implemented, and therefore no feed-back on energy demand from such policies is assumed. There is also no implementation of policies on improving energy access, although increasing economic growth leads to a slow decline in the use of solid fuels for cooking and heating in developing regions. As a result of the “frozen legislation” (FLE) assumptions, pollution levels in this scenario are the highest among the scenarios described.
• Moderate air pollution policies (CLE1) : This scenario is identical to the FLE case in terms of energy structure and lack of specific poli-cies on climate change and energy access. However, it assumes full implementation of all current and planned air pollution legislation (CLE) worldwide until 2030. (See Table 17.18 for details of the types of measures undertaken.) Thus, this scenario provides a measure of the impact of current and planned air pollution policies in the absence of any specific climate or energy access policy.
• Moderate air pollution, stringent climate, and moderate energy access policies (CLE2) : This scenario is based on the illustrative scen-ario of the GEA-Efficiency pathways group described earlier in this chapter in terms of energy demand and use and the implementation of a stringent climate policy corresponding to a global temperature target of 2°C maximum warming. In addition, it assumes a moderate energy access policy, corresponding to availability of microfinance and a 20% fuel subsidy (as described in Section 17.4.1.2 ), as well as full implementation of all current and planned air quality legislation until 2030 as in the previous scenario. Thus, this scenario explicitly provides an indication of the multiple benefits of combining moder-ate policies on climate change, energy access, and air pollution.
• Stringent air pollution, stringent climate, and moderate energy access policies (SLE1) : This scenario differs from the previous one in that it assumes global implementation of extremely stringent pollution pol-icies until 2030 (see Table 17.18 for details). These policies are much more aggressive than the currently planned legislation assumed in the previous two cases, but are less aggressive than the so-called maximum feasible reduction (MFR) level, which describes the techno-logical frontier in terms of possible air quality control strategies by 2030 (for further details on CLE and MFR, see Amann et al., 2004 ).
• Stringent air pollution, stringent climate, and universal energy access policies (SLE2) : This is a variant of the previous scenario that includes in addition the universal access policy described in Section 17.4 , and investigates specifically how stringent policies on energy access in developing regions, combined with stringent air pollution legislation, can affect emissions levels and associated health impacts.
Table 17.18 describes in detail the types of air pollution control tech-nologies and policies adopted in the CLE and SLE cases. The information is derived and summarized from a number of GAINS-related publica-tions including Cofala et al. (2007) and Kupiainen and Klimont ( 2004 ).
Policy Impacts on Pollutant Emissions Anthropogenic sources are major contributors to outdoor air pollution, with the energy system alone contributing around 60% of PM2.5 emis-sions in 2005. A number of policies to control air pollution have been implemented, especially in the industrialized countries, in the past two decades: global air pollution control costs in 2005 are estimated at US$195 billion. However, more than 80% of the world’s population is estimated to be exposed to PM2.5 concentrations exceeding WHO air quality standards (annual mean) of 10 μ g/m 3 in 2005 (see Rao et al., 2012 , for details). Future air pollution levels will depend on the future development of the energy system and the types of policies that are
Table 17.17 | Policy matrix and coverage.
Policy packagePolicies
Air pollution Climate change Energy efficiency Energy access
FLE No improvement in air quality legislations beyond 2005
No climate change policy Annual energy intensity reduction of 1.5% until 2050
No specifi c energy access policy; slow improvement in quality of cooking fuels
CLE1 All current and planned air quality legislations until 2030
No climate change policy Annual energy intensity reduction of 1.5% until 2050
No energy access policy; medium improvement in quality of cooking fuels
CLE2 All current and planned air quality legislations until 2030
Limit on temperature change to 2°C in 2100
Annual energy intensity reduction of 2.6% until 2050
Moderate energy access policy
SLE1 Stringent air quality legislations globally
Limit on temperature change to 2°C in 2100
Annual energy intensity reduction of 2.6% until 2050
Moderate energy access policy
SLE2 Stringent air quality legislations globally
Limit on temperature change to 2°C in 2100
Annual energy intensity reduction of 2.6% until 2050
Policies to ensure global access to clean energy by 2030
Note: Sectors included in all policy packages are power plants, industry (combustion and process), road transport, international shipping and aviation, agricultural waste burning, biomass burning (deforestation, savannah burning, and vegetation fi res). GHGs and air pollutants gridded include methane, sulfur dioxide, nitrogen oxides, carbon monoxide,volatile organic compounds, black carbon, organic carbon, and PM2.5; gridding is based on spatial allocation maps (using the dataset described in Lamarque et al. ( 2010 ) and methods from Riahi et al. ( 2011 )).

Energy Pathways for Sustainable Development Chapter 17
1278
Table 17.18 | Policies and measures for air pollution control.
Transport Industry and power plantsInternational
shippingOther
Current legislation (CLE)
Sulfur dioxide (SO 2 ) OECD: Directives on the sulfur content in liquid fuels; Non-OECD: National legislation on the sulfur content in liquid fuels
OECD: Emission standards for new plants from the Large Combustion Plant Directive (LCPD) (OJ 1988) Non-OECD: increased use of low-sulfur coal, increasing penetration of fl ue gas desulfurization (FGD) after 2005 in new and existing plants
MARPOL Annex VI regulations
Reduction in gas fl aring, reduction in agricultural waste burning
Nitrogen oxides (NO x )
OECD: Emission controls for vehicles and off-road sources up to the EURO-IV/ EURO-V standard Non-OECD: National emission standards equivalent to approximately EURO III-IV standards (vary by region)
OECD: Emission standards for new plants and emission ceilings for existing plants from the LCPD (OJ 1988). National emission standards on stationary sources– if stricter than in the LCPD Non-OECD: Primary measures for controlling of NO x
Revised MARPOL Annex VI regulations
Reduction in gas fl aring, reduction in agricultural waste burning
Carbon monoxide (CO)
As above for NO x Reduction in gas fl aring, reduction in agricultural waste burning
Volatile organic compounds (VOC)
End-of-pipe measures as described above for NO x
Solvent Directive of the EU (COM(96)538, 1997); 1999 UNECE Gothenburg Protocol to Abate Acidifi cation, Eutrophication and Ground-level Ozone
Reduction in gas fl aring, reduction in agricultural waste burning
Ammonia (NH 3 ) End-of-pipe controls in industry (fertilizer manufacturing)
Substitution of urea fertilizers
PM2.5 1 EU and national legislation on power plants and industrial sources limiting stack concentrations of PM
Reduction in gas fl aring, reduction in agricultural waste burning
Stringent legislation (SLE)
SO 2 As in CLE High-effi ciency fl ue gases desulfurization (FGD) on existing and new large boilers Use of low-sulfur fuels and simple FGD techniques for smaller combustion sectors High-effi ciency controls on process emission sources
Revised MARPOL Annex VI and NO x Technical Code 2008
Cessation of gas fl aring, reduction in agricultural waste burning
NO x As in CLE Selective catalytic reduction at large plants in industry and in the power sector Combustion modifi cations for smaller sources in industry and in the residential and commercial sectors High-effi ciency controls on process emission sources
Revised MARPOL Annex VI and NO x Technical Code 2008
Cessation of gas fl aring, reduction in agricultural waste burning
CO As in CLE Cessation of gas fl aring, reduction in agricultural waste burning
VOC As in CLE Regular monitoring, fl aring, as well as control of the evaporative loses from storage Solvent use: full use of potential for substitution with low-solvent products in both “do it yourself” and industrial applications, modifi cation of application methods and introduction of solvent management plans
Cessation of gas fl aring, reduction in agricultural waste burning
NH 3 End-of-pipe controls in industry (fertilizer manufacturing)
Substitution of urea fertilizers, rapid incorporation of solid manure, low nitrogen feed and biofi ltration
PM2.5 (including BC and OC)
High-effi ciency electrostatic precipitators, fabric fi lters, new boiler types, fi lters, good practices
Revised MARPOL Annex VI regulations
Good practices in agriculture production, ban on agricultural waste burning
1 Legislation is for PM2.5 only, but black carbon and organic carbon emissions can be expected also to decline as a result.

Chapter 17 Energy Pathways for Sustainable Development
1279
implemented. The impacts of specific policies described in Table 17.17 on pollutant emissions in 2030 are examined below.
The absence of significant future legislation on air quality, combined with a lack of policies on energy efficiency and energy access (the FLE scenario), is seen to lead to a significant increase in all categories of emissions to more than 30% above 2005 levels and added deterioration in air quality, with 90% of the world’s population exposed to PM2.5 concentration levels above WHO air quality standards – an increase of 10 percentage points compared with 2005.
Currently planned air quality legislation (the CLE1 scenario) is seen to curb the growth of emissions, especially in OECD countries. However, emissions continue to increase in non-OECD countries because of the overall high energy demand and very little or nonexistent air quality legislation in many countries (e.g., in Africa). Sulfur dioxide emissions decrease globally by only 2% in 2030 compared with 2005, in spite of a 30% decrease in OECD countries. Nitrogen oxide emissions increase globally to 115 Mt, a 15% increase over 2005 levels, again mainly due to increasing emissions – in particular, from the transportation and power sectors – in non-OECD countries, particularly in Asia. Globally, PM2.5 emissions decrease by around 2–3%, mainly from shifts in cooking fuels in the residential sector, currently the largest source of emissions (around 50% of the total, almost 90% of which is in non-OECD coun-tries), as well as assumed legislation that establishes stronger controls on power plants, industry, and road transport. More than 80% of the world’s population continues to be exposed to levels above the man-dated WHO standards, the same as in 2005. This clearly indicates that, even if currently legislated air pollution control policies were globally implemented, only modest declines in pollutants would be expected. This occurs mainly because of increasing growth in emissions in devel-oping countries in spite of the significant technological shifts that can be expected in many parts of the world in the next two decades. 46
Emissions decline when air pollution policies are combined with add-itional policies on climate change, energy access, and energy effi-ciency. The effects of such combined policies are determined by the stringency of the individual policies assumed. A policy package of currently legislated air quality controls, together with policies on cli-mate change, energy access, and energy efficiency (the CLE2 scen-ario), results in emissions reductions on the order of 50% for sulfur dioxide (SO 2 ), 35% for nitrogen oxides (NO x ), and 30% for PM2.5. Most of these reductions (up to 80%) occur in non-OECD countries, thus indicating that the co- benefits of combined policies are the high-est there. Comparing the panels of Figure 17.45 , transport and indus-trial sectors in particular are seen to be the most important sources of
reductions (a 28% reduction in NO x and a 35% reduction in PM2.5), as these sectors offer significant opportunities for combined policies that can tap the co-benefits of GHG mitigation and air pollution con-trol. 47 In the residential sector, moderately stringent policies on access to modern energy forms in developing countries have a significant impact on pollutant emissions (a 60% reduction in SO 2 and 30–40%
46 Emissions from international shipping, however, show a signifi cant decline (80% reduc-tion in SO 2 and 20% reduction in NO x ) despite increasing fuel use in this sector. This is because of the stringent international policies that are expected to govern this sector.
47 NO X emissions from the power sector, although decreasing in the short term, may increase in the longer term because of the increase of overall electricity demand.
0
50
100
150
2005 FLE CLE1 CLE2 SLE1 SLE2
Mt S
O2 /
year Domes�c sector
Industry
Transport
Energy sector
0
50
100
150
2005 FLE CLE1 CLE2 SLE1 SLE2
Mt N
Ox /
year Domes�c sector
Industry
Transport
Energy sector
0
20
40
60
2005 FLE CLE1 CLE2 SLE1 SLE2
Mt P
M 2
.5 /
year Domes�c sector
Industry
Transport
Energy sector
Figure 17.45 | Global energy-related pollutant emissions by sector in 2005 and under alternative policy packages in 2030.
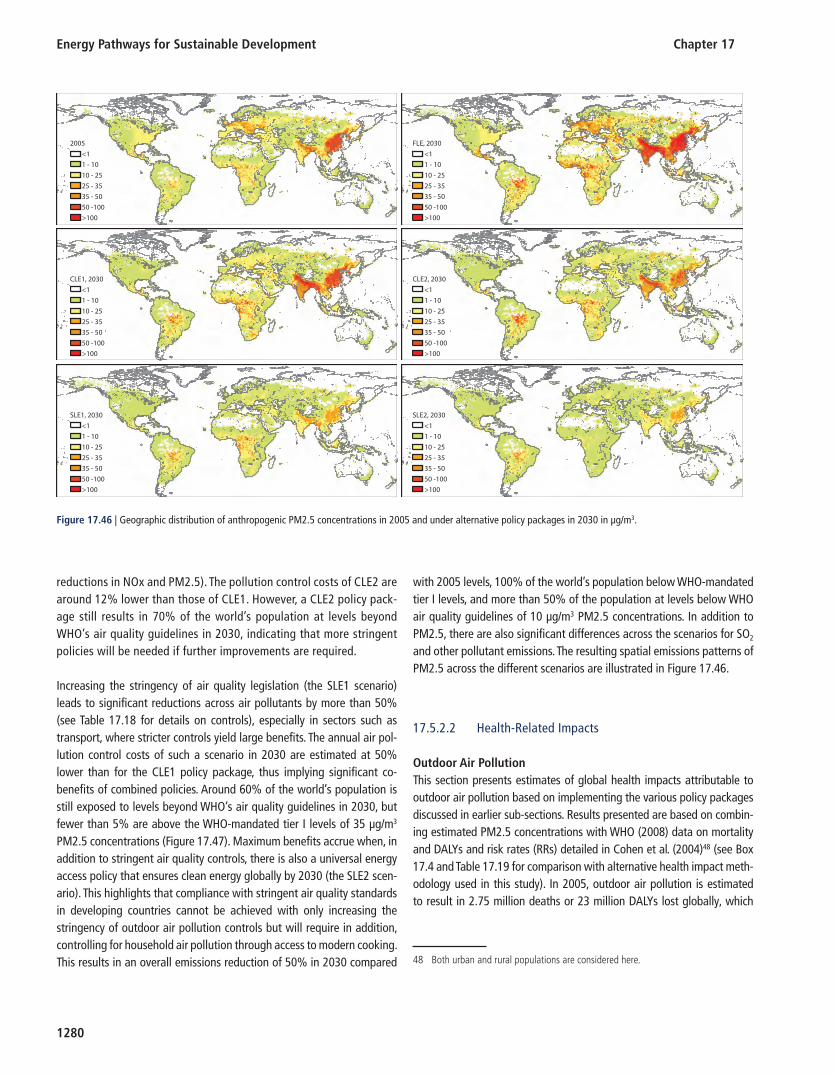
Energy Pathways for Sustainable Development Chapter 17
1280
reductions in NOx and PM2.5). The pollution control costs of CLE2 are around 12% lower than those of CLE1. However, a CLE2 policy pack-age still results in 70% of the world’s population at levels beyond WHO’s air quality guidelines in 2030, indicating that more stringent policies will be needed if further improvements are required.
Increasing the stringency of air quality legislation (the SLE1 scenario) leads to significant reductions across air pollutants by more than 50% (see Table 17.18 for details on controls), especially in sectors such as transport, where stricter controls yield large benefits. The annual air pol-lution control costs of such a scenario in 2030 are estimated at 50% lower than for the CLE1 policy package, thus implying significant co-benefits of combined policies. Around 60% of the world’s population is still exposed to levels beyond WHO’s air quality guidelines in 2030, but fewer than 5% are above the WHO-mandated tier I levels of 35 μ g/m3
PM2.5 concentrations ( Figure 17.47 ). Maximum benefits accrue when, in addition to stringent air quality controls, there is also a universal energy access policy that ensures clean energy globally by 2030 (the SLE2 scen-ario). This highlights that compliance with stringent air quality standards in developing countries cannot be achieved with only increasing the stringency of outdoor air pollution controls but will require in addition, controlling for household air pollution through access to modern cooking. This results in an overall emissions reduction of 50% in 2030 compared
with 2005 levels, 100% of the world’s population below WHO-mandated tier I levels, and more than 50% of the population at levels below WHO air quality guidelines of 10 μ g/m3 PM2.5 concentrations. In addition to PM2.5, there are also significant differences across the scenarios for SO 2 and other pollutant emissions. The resulting spatial emissions patterns of PM2.5 across the different scenarios are illustrated in Figure 17.46 .
17.5.2.2 Health-Related Impacts
Outdoor Air Pollution This section presents estimates of global health impacts attributable to outdoor air pollution based on implementing the various policy packages discussed in earlier sub-sections. Results presented are based on combin-ing estimated PM2.5 concentrations with WHO ( 2008 ) data on mortality and DALYs and risk rates (RRs) detailed in Cohen et al. ( 2004 ) 48 (see Box 17.4 and Table 17.19 for comparison with alternative health impact meth-odology used in this study). In 2005, outdoor air pollution is estimated to result in 2.75 million deaths or 23 million DALYs lost globally, which
SLE2, 2030
<1
1 - 10
10 - 25
25 - 35
35 - 50
50 -100
>100
SLE1, 2030
<1
1 - 10
10 - 25
25 - 35
35 - 50
50 -100
>100
CLE1, 2030
<1
1 - 10
10 - 25
25 - 35
35 - 50
50 -100
>100
CLE2, 2030
<1
1 - 10
10 - 25
25 - 35
35 - 50
50 -100
>100
2005
<1
1 - 10
10 - 25
25 - 35
35 - 50
50 -100
>100
FLE, 2030
<1
1 - 10
10 - 25
25 - 35
35 - 50
50 -100
>100
Figure 17.46 | Geographic distribution of anthropogenic PM2.5 concentrations in 2005 and under alternative policy packages in 2030 in μg/m3.
48 Both urban and rural populations are considered here.

Chapter 17 Energy Pathways for Sustainable Development
1281
represents around 5% of all deaths, 2% of all DALYs and around 12% of the total burden that can be attributed to cardiovascular, respiratory, and lung cancer (for further discussion see Rao et al., 2012 ). More than 70% of this burden is felt in Asia alone.
Failure to implement further air pollution control policies beyond 2005 levels (the FLE scenario) is seen to result in a global increase of close to 50% in DALYs (and deaths) in 2030 as compared to 2005 (shown in Table 17.19 ), indicating that the implementation of air pollution pol-icies is an absolute must for controlling the health-related impacts of air pollution in the future. However, an air pollution control-only policy, as in the CLE1 scenario, still leads to an increase in health impacts by more than 30% between 2005 and 2030 49 with the share of the outdoor air pollution related in the total burden increasing slightly from 2005 levels. This is mainly due to the large increases in emissions in many developing regions, particularly South Asia and Africa, where currently legislated policies do not lead to emissions declines in the future, as dis-cussed earlier. In addition, a growing population in these regions means that the future population over 30 years of age at risk for air pollution
0
2
4
6
8
FLE CLE1 CLE2 SLE2 SLE2
peop
le, b
illio
n
> 10 μg/m3
> 15 μg/m3
> 25 μg/m3
> 35 μg/m3
2005 2030
Figure 17.47 | Global population exposed to fi ne particulate matter concentrations exceeding WHO air quality targets in 2005 and under alternative policy packages in 2030. The rightmost bar indicates the compliance with WHO Tier 1 level of 35 μ g/m3
PM2.5, representing the global target of the GEA pathways for the environmental and health objective by 2030. Bars to the left indicate a comparison to lower (more stringent) WHO Tier levels with the leftmost bar corresponding to the lowest WHO AQG of 10 μ g/m3.
Table 17.19 | Health impacts of outdoor air pollution in millions of DALYs (millions of population integrated YOLLs).
Region 20052030
FLE CLE1 CLE2 SLE1 SLE2
World 23 (3865) 40 (12292) 33.6 (7366) 23 (4891) 14.4 (2947) 13.4 (2375)
OECD and Reform Countries 4.3 (867) 5.3 (1525) 2.2 (717) 0.95 (456) 0.5 (322) 0.5 (322)
Middle East and Africa 1.5 (265) 4.3 (1043) 3.1 (744) 1.8 (560) 1.1 (443) 0.9 (232)
Latin America and Caribbean 0.3 (91) 0.6 (234) 0.3 (137) 0.2 (122) 0.1 (97) 0.1 (97)
Asia 17 (2643) 30 (9490) 28 (5768) 20.2 (3753) 12.7 (2085) 11.8 (1725)
Source: Chapter 9 and 17.
49 This is comparable to fi ndings in the World Energy Outlook 2009 of the IEA ( 2009a ), which estimates a 70% growth of emissions in selected regions for the baseline scenario in spite of current air quality legislation.
Box 17.4 | Alternative Methodology for Calculating Health Impacts
In addition to the standard approach for calculating DALYs, an alternative methodology is also applied in the outdoor air pollution related health impact estimations. This methodology, which is based on Mechler et al. ( 2002 ) and used in World Energy Outlook 2009 (IEA, 2009a ), calculates absolute changes in life expectancy based on modifi cation of survival functions for population over 30 years of age. The end point is the statistical years of life lost (YOLLs) over the remaining lifetime of the entire population. The main features in this approach include:
Risk rates are assumed to be linear from 5 μ g/m3 until 200 μ g/m3; all cause risk rates are used as opposed to a cause specifi c one (RR of 1.04 is used for developing countries and RR of 1.06 for developed countries); and baseline mortality data are derived from UN Department of Economic and Social Affairs (UN DESA, 2009 ) and include all non-accidental mortality, i.e., not distinguished by cause of death. Country-specifi c life tables were used to refl ect different mortality levels.
The YOLLs calculated from this approach are available in Table 17.19 (and Table 17.25 in Section 7).
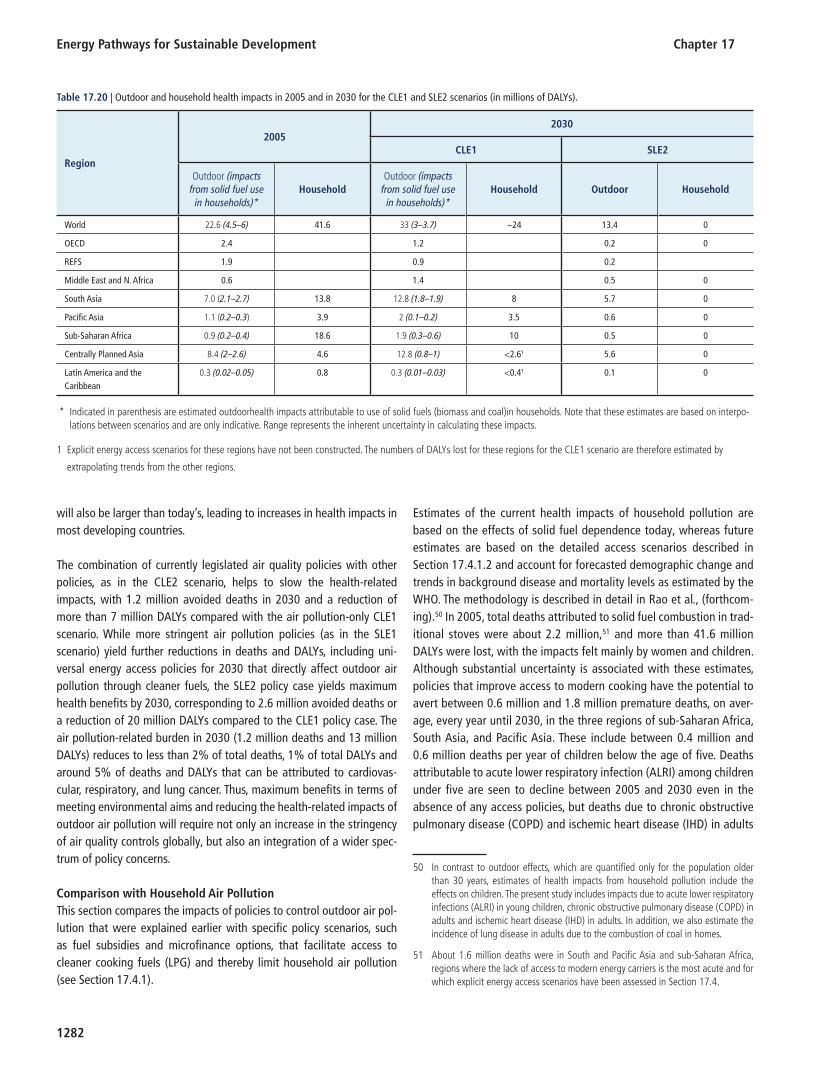
Energy Pathways for Sustainable Development Chapter 17
1282
will also be larger than today’s, leading to increases in health impacts in most developing countries.
The combination of currently legislated air quality policies with other policies, as in the CLE2 scenario, helps to slow the health-related impacts, with 1.2 million avoided deaths in 2030 and a reduction of more than 7 million DALYs compared with the air pollution-only CLE1 scenario. While more stringent air pollution policies (as in the SLE1 scenario) yield further reductions in deaths and DALYs, including uni-versal energy access policies for 2030 that directly affect outdoor air pollution through cleaner fuels, the SLE2 policy case yields maximum health benefits by 2030, corresponding to 2.6 million avoided deaths or a reduction of 20 million DALYs compared to the CLE1 policy case. The air pollution-related burden in 2030 (1.2 million deaths and 13 million DALYs) reduces to less than 2% of total deaths, 1% of total DALYs and around 5% of deaths and DALYs that can be attributed to cardiovas-cular, respiratory, and lung cancer. Thus, maximum benefits in terms of meeting environmental aims and reducing the health-related impacts of outdoor air pollution will require not only an increase in the stringency of air quality controls globally, but also an integration of a wider spec-trum of policy concerns.
Comparison with Household Air Pollution This section compares the impacts of policies to control outdoor air pol-lution that were explained earlier with specific policy scenarios, such as fuel subsidies and microfinance options, that facilitate access to cleaner cooking fuels (LPG) and thereby limit household air pollution (see Section 17.4.1 ).
Estimates of the current health impacts of household pollution are based on the effects of solid fuel dependence today, whereas future estimates are based on the detailed access scenarios described in Section 17.4.1.2 and account for forecasted demographic change and trends in background disease and mortality levels as estimated by the WHO. The methodology is described in detail in Rao et al., ( forthcom-ing ). 50 In 2005, total deaths attributed to solid fuel combustion in trad-itional stoves were about 2.2 million, 51 and more than 41.6 million DALYs were lost, with the impacts felt mainly by women and children. Although substantial uncertainty is associated with these estimates, policies that improve access to modern cooking have the potential to avert between 0.6 million and 1.8 million premature deaths, on aver-age, every year until 2030, in the three regions of sub-Saharan Africa, South Asia, and Pacific Asia. These include between 0.4 million and 0.6 million deaths per year of children below the age of five. Deaths attributable to acute lower respiratory infection (ALRI) among children under five are seen to decline between 2005 and 2030 even in the absence of any access policies, but deaths due to chronic obstructive pulmonary disease (COPD) and ischemic heart disease (IHD) in adults
50 In contrast to outdoor effects, which are quantifi ed only for the population older than 30 years, estimates of health impacts from household pollution include the effects on children. The present study includes impacts due to acute lower respiratory infections (ALRI) in young children, chronic obstructive pulmonary disease (COPD) in adults and ischemic heart disease (IHD) in adults. In addition, we also estimate the incidence of lung disease in adults due to the combustion of coal in homes.
51 About 1.6 million deaths were in South and Pacifi c Asia and sub-Saharan Africa, regions where the lack of access to modern energy carriers is the most acute and for which explicit energy access scenarios have been assessed in Section 17.4 .
Table 17.20 | Outdoor and household health impacts in 2005 and in 2030 for the CLE1 and SLE2 scenarios (in millions of DALYs).
Region
20052030
CLE1 SLE2
Outdoor (impacts from solid fuel use
in households)* Household
Outdoor (impacts from solid fuel use
in households)* Household Outdoor Household
World 22.6 (4.5–6) 41.6 33 (3–3.7) ~24 13.4 0
OECD 2.4 1.2 0.2 0
REFS 1.9 0.9 0.2
Middle East and N. Africa 0.6 1.4 0.5 0
South Asia 7.0 ( 2.1–2.7) 13.8 12.8 (1.8–1.9) 8 5.7 0
Pacifi c Asia 1.1 ( 0.2–0.3 ) 3.9 2 (0.1–0.2) 3.5 0.6 0
Sub-Saharan Africa 0.9 (0.2–0.4) 18.6 1.9 (0.3–0.6) 10 0.5 0
Centrally Planned Asia 8.4 (2–2.6) 4.6 12.8 (0.8–1) <2.6 1 5.6 0
Latin America and the Caribbean
0.3 (0.02–0.05) 0.8 0.3 (0.01–0.03) <0.4 1 0.1 0
* Indicated in parenthesis are estimated outdoorhealth impacts attributable to use of solid fuels (biomass and coal)in households. Note that these estimates are based on interpo-lations between scenarios and are only indicative. Range represents the inherent uncertainty in calculating these impacts.
1 Explicit energy access scenarios for these regions have not been constructed. The numbers of DALYs lost for these regions for the CLE1 scenario are therefore estimated by
extrapolating trends from the other regions.

Chapter 17 Energy Pathways for Sustainable Development
1283
are expected to increase during the same period. These trends are in line with those reported by Bailis et al. ( 2005 ), who find that the observed decline in childhood ALRI mortality over time is a result of additional factors, 52 whereas the upward trend in adult incidence of COPD is mainly due to population aging. Alternatively, in the absence of any new policies to enhance access to modern cooking fuels or devices, it is estimated that in 2030 there could still be over 24 million DALYs lost due to household air pollution. See Rao et al., ( forthcoming ) for details on disease-specific impacts.
Table 17.20 lists the health impacts in DALYs from outdoor and house-hold air pollution for 2005 and for an air pollution-only policy (CLE1) compared with a combined policy (SLE2). There are significant health benefits from a combination of stringent outdoor air pollution policies and a policy that ensures universal access to clean cooking by 2030. These are especially effective in developing countries that face the dual problems of outdoor air pollution due to a growing motorized fleet combined with household pollution from poor quality cooking fuels and devices. Thus, such policies can have multiple benefits both for human well-being and for the environment (as highlighted in Chapter 19 and Section 17.4 ), including major health gains.
17.6 Energy Security
17.6.1 Introduction
Energy security has been a major concern for energy systems for dec-ades, and therefore needs to be addressed in the transition pathways presented in this chapter. As reviewed in detail in Chapter 5 , energy security has multiple dimensions, which are not easily combined into a holistic concept or single indicator. Therefore, the concept of energy security is not used as a quantitative target or a technical modeling constraint in the GEA pathway scenarios described here. Instead, this section draws on the conceptual and quantitative framework developed in Chapter 5 to illustrate the implications of the GEA transition path-ways for energy security. Section 17.7 then extends the discussion to the multiple benefits of the transition pathways, considering especially the synergistic effects between other energy development objectives and energy trade. 53
Chapter 5 summarized the present main energy security concerns as follows:
• Oil and transport: volatility in the global oil market coupled with the geographic concentration of oil production; rapidly increasing
demand under potentially constrained production capacities; grow-ing dependence of an increasing number of countries on imported oil from ever fewer producing countries, with low-income countries often facing unaffordable costs of imports; and the dominance of oil in the transportation sector, where easily-available substitutes are lacking.
• Natural gas: dependence of a number of countries on imported natural gas, often procured from a single supplier and delivered through a limited number of potentially vulnerable routes and infrastructure.
• Electricity: vulnerability of electricity systems associated with low diversity of power generation options, aging infrastructure, inad-equate generation capacity, and rapid demand growth.
• Energy export revenue: volatility and uncertain sustainability of energy export revenue (“energy demand” security) in countries where energy is a vital economic sector.
• Total primary energy supply vulnerabilities: overall energy vulner-ability of a number of individual countries that face several of the above concerns simultaneously.
Chapter 5 established a framework for analyzing the energy security-related vulnerabilities of energy systems associated with fuels, end-use sectors (including electricity as a carrier), and individual countries. For each of these three subsystems, that chapter identified three dimen-sions of energy security concerns: sovereignty (the degree of control that national governments have over energy systems), resilience (the ability of energy systems to respond to disruptions), and robustness (the risks related to the physical state of energy resources and infrastruc-ture). This section adopts the same framework, but considers different energy subsystems to reflect game-changing developments in the tran-sition pathways. The section analyzes not only the globally traded fuels that dominate today (oil, gas, and coal) but also those of the future (biofuels and hydrogen). The main energy end-use sectors (transporta-tion, industry, residential and commercial) and electricity generation are also analyzed. Finally, since the modeling frameworks do not provide detail on individual countries, the analysis is applied at the world and regional level.
Table 17.21 summarizes the energy security perspectives and indicators analyzed in this section. The analysis relates to sovereignty and resili-ence concerns. The robustness concerns could not be addressed at this aggregated level.
This analytical framework is applied to the three illustrative GEA transi-tion pathways (GEA-Supply, GEA-Mix, and GEA-Efficiency) but consid-ers both of the transportation cases for each, because the transportation sector is a key policy concern, given the limited alternatives to the use
52 These include increased coverage and effi cacy of pneumonia case management using antibiotics; increased awareness and practice of breastfeeding, which increases child immunity and survival; and other economic and technological factors.
53 The energy security analysis of the GEA pathways relies on the MESSAGE interpret-ations of the GEA pahtways, including the alternative transportation sector setups and reduced supply-side portfolios.

Energy Pathways for Sustainable Development Chapter 17
1284
of oil in internal combustion vehicles. The analysis focuses on changes between now and 2050, because this is the longest time horizon under which energy security concerns are considered in present policies. The analysis first considers the energy security concerns associated with fuels, then examines the future vulnerabilities of end-use sectors, and concludes with an examination of the energy security of individual GEA regions.
17.6.2 Fuels
Under the GEA transition pathways, the vulnerabilities of globally traded fuels in the aggregate as well as of individual fuels decrease over time in terms of both sovereignty and resilience.
A proxy measure of the sovereignty aspects of energy security is global trade in energy. Absolute volumes of traded energy and the share of traded energy in overall energy use (the latter referred to here as “trade intensity”) indicate the extent to which regions rely on fuels produced in other regions, raising sovereignty concerns.
Figure 17.48 shows both trade volumes and trade intensity under the six GEA pathways considered here. The global aggregate energy trade vol-umes among the 11 GEA regions (estimated at some 104 EJ in 2005) peak in 2030 or 2040, and trade intensities peak in 2020 or 2030. Thereafter both indicators decline, so that by 2050 the intensity of trade is lower than at present but the absolute amount of trade remains higher than present values under the GEA-Supply scenarios. The decline in absolute trade volumes after 2030 is most pronounced in the Advanced Transport GEA-Mix and -Efficiency pathways and least pronounced in the high-demand, supply-dominated GEA transition pathways.
Concerning individual fuels, the analysis shows the following trends. In all the GEA pathways considered, oil is phased out in the long term. It accounts for between 9% and 15% of global primary energy sup-ply by 2050 and declines to less than 1% by the end of the century
(Table 17.22). As a result, trade volumes of oil for all pathways peak at about 100 EJ (compared with approximately 83 EJ today 54 ) between 2020 and 2030 and decline thereafter.
Present energy security concerns associated with oil drastically diminish in the GEA pathways because of their comparatively modest demand growth, which is due to efficiency improvements and a more diversified supply mix. No other fuel assumes a dominant role similar to that which oil plays today, accounting for 36% of primary energy supply world-wide. 55 Moreover, no “new oil” emerges in the global energy arena. Table 17.22 summarizes the characteristics of the globally traded fuels in 2050 as compared with oil today. Figure 17.49 shows the shares of different fuels in global primary energy supply, indicating a more diver-sified supply portfolio. Figure 17.50 illustrates how trade volumes and the geographic concentration of production of oil, gas, and coal change across the GEA pathways. 56 Biofuels, hydrogen, and electricity are traded in much smaller volumes (a maximum of 50 EJ for hydrogen in the GEA-Supply pathway with Advanced Transportation) and with greater geo-graphic diversity of producers than is the case with oil today.
At the same time, by 2050 natural gas trade exhibits some of the characteristics of oil trade today under certain pathways. By 2050 gas accounts for about 20% of primary energy and 36–51 EJ of trade per year (compared with oil’s current 83 EJ). Additionally, gas production stays at its current level of geographic concentration until about 2050, which is comparable to the geographic concentration of oil production, and becomes even more concentrated than current oil production under most pathways thereafter, as shown by its decreasing Shannon-Wiener diversity index in Figure 17.50 . Although natural gas is a potentially more risky fuel, the overall resilience of energy systems, as measured
54 BP ( 2009 ) estimates a total volume of country-to-country oil trade of some 110 EJ in 2005. Thus, the GEA interregional model representation covers some 75% of actual oil trade fl ows at the country level.
55 Although electricity comes to dominate fi nal energy use, it is not, strictly speaking, a “fuel,” as it is produced from a variety of sources. Moreover, global trade in electricity is minimal in all pathways, never accounting for more than 2% of total electricity supply.
56 The geographic concentration of production is measured by the Shannon-Wiener Diversity Index (SWDI), described below.
Table 17.21 | Indicators for analyzingenergy security across subsystems and security perspectives.
SubsystemsSecurity perspectives
Sovereignty Resilience
Upstream
Fuels (total fuel supply and globally traded fuels)
Volume and intensity of trade (by fuel and total)
Global diversity of the primary energy system; dominance of a single fuel
Downstream
Carriers (electricity) and end uses (transport, residential and commercial, industry)
Reliance of carrier or end-use sector on insecure fuels
Diversity of fuels used in the carrier or end-use sector
Regional Import dependency (and export fl ows)
Diversity of primary energy supply in the region
Table 17.22 | Characteristics of globally traded fuels in 2050 compared with oil in 2005.
CharacteristicOil,
2005Gas, 2050
Coal, 2050
Biofuels, 2050
Predominance (% of primary energy supply)
34 19–22 8–10 6–8
Trade volume (EJ/year) 83 35–54 10–20 7–14
Geographic concentration of production (diversity index) 1
1.0 0.9–1.0 1.3–1.4 1.2–1.5
1 See text for defi nition of the diversity index.
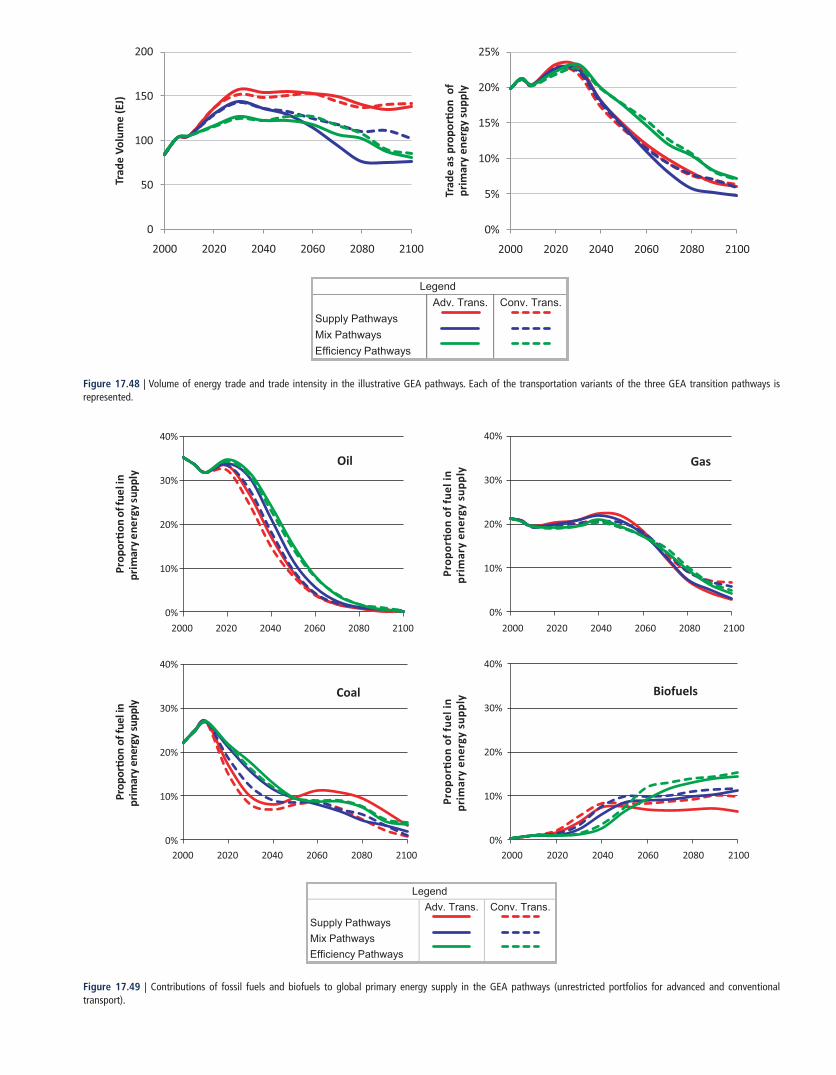
0
50
100
150
200
2000 2020 2040 2060 2080 2100
Trad
e Vo
lum
e (E
J)
0%
5%
10%
15%
20%
25%
2000 2020 2040 2060 2080 2100
Trad
e as
pro
por�
on o
fpr
imar
y en
ergy
sup
ply
Adv. Trans. Conv. Trans.
Supply Pathways
Mix Pathways
Efficiency Pathways
Legend
Figure 17.48 | Volume of energy trade and trade intensity in the illustrative GEA pathways. Each of the transportation variants of the three GEA transition pathways is represented.
0%
10%
20%
30%
40%
2000 2020 2040 2060 2080 2100
Prop
or�
on o
f fu
el in
prim
ary
ener
gy s
uppl
y
0%
10%
20%
30%
40%
2000 2020 2040 2060 2080 2100
Prop
or�o
n of
fuel
inpr
imar
y en
ergy
sup
ply
0%
10%
20%
30%
40%
2000 2020 2040 2060 2080 2100
Prop
or�
on o
f fu
el in
prim
ary
ener
gy s
uppl
y
0%
10%
20%
30%
40%
2000 2020 2040 2060 2080 2100
Prop
or�
on o
f fue
l in
prim
ary
ener
gy s
uppl
y
Adv. Trans. Conv. Trans.
Supply Pathways
Mix Pathways
Efficiency Pathways
Legend
Oil Gas
BiofuelsCoal
Figure 17.49 | Contributions of fossil fuels and biofuels to global primary energy supply in the GEA pathways (unrestricted portfolios for advanced and conventional transport).

Energy Pathways for Sustainable Development Chapter 17
1286
0
20
40
60
80
100
2000 2020 2040 2060 2080 2100
Voul
me
of T
rade
(EJ)
0
20
40
60
80
100
2000 2020 2040 2060 2080 2100
Voul
me
of T
rade
(EJ)
0.0
0.5
1.0
1.5
2.0
2000 2020 2040 2060 2080 2100
Shan
non-
Wie
ner I
ndex
of
Geo
grap
hica
l Div
. of P
rod.
0.0
0.5
1.0
1.5
2.0
2000 2020 2040 2060 2080 2100
Shan
non-
Wie
ner I
ndex
of
Geo
grap
hica
l Div
. of P
rod.
Adv. Trans. Conv. Trans.
Supply Pathways
Mix Pathways
Efficiency Pathways
Legend
Oil
Gas
Coal
0
20
40
60
80
100
120
2000 2020 2040 2060 2080 2100
Voul
me
of T
rade
(EJ)
0.0
0.5
1.0
1.5
2.0
2000 2020 2040 2060 2080 2100
Shan
non-
Wie
ner I
ndex
of
Geo
grap
hica
l Div
. of P
rod.
Volume of Oil Trade (2005)
Volume of Oil Trade (2005)
Diversity of Oil Produc�on (2005)
Diversity of Oil Produc�on (2005)
Volume of TradeGeographic Diversity
of Producers
Figure 17.50 | Volume of trade and geographic diversity of production of globally traded fuels in the GEA pathways (unrestricted portfolios for advanced and conventional transport).

Chapter 17 Energy Pathways for Sustainable Development
1287
by the diversity of primary energy supply, increases under all transition pathways.
The Shannon-Wiener diversity index (SWDI; see Shannon and Weaver, 1963 ) is frequently applied as a measure of energy security of supply (see, e.g., Jansen et al., 2004 ; APERC, 2007) and electricity generation (Stirling, 1994 ). The index is calculated as follows:
SWDI = – ∑(pi ∗ ln(pi))i
(1)
where p i is the share of primary energy i in total primary energy supply. In the GEA pathways, the global SWDI rises (supply diversification increases) from the current level of 1.6 to 2.0 by 2050, before falling to between 1.3 and 1.6 in the latter half of the century. 57
Measures of global energy trade (reflecting sovereignty concerns) and diversity (reflecting resilience concerns) can be aggregated into a single index called a compound SWDI. This compound indicator differs from the simple SWDI in that it does not count globally traded fuels as contribut-ing to the overall diversity of primary energy supply. 58 It is calculated by excluding the imported energy in a nation’s or region’s diversity index:
Compound SWDI = – ∑(1 – mi) ∗ (pi ln (pi))i
(2)
where p i is again the share of primary energy resource i in total primary energy supply, and m i is the share of primary energy resource i that is supplied by net imports.
This indicator shows a trend similar to that of the simple SWDI ( Figure 17.51 ), increasing from 1.4 in 2000 to about 1.7 in 2050 before falling slightly to about 1.5 in the second half of the century. 59
17.6.3 End-Use Sectors
The diversity of fuels used in a sector is generally considered an indi-cator of the resilience of energy supply for the sector. Sectoral diver-sity indexes are shown in Figure 17.52 . The increase in diversity in the transportation sector is particularly pronounced in the GEA pathways, whereas the improvement is more gradual in the other end-use sectors and in electricity generation.
Although this pattern of increasing diversity of the energy mix in indi-vidual end-use sectors is relatively homogeneous across regions, there is some regional variation. In some regions, the rise in diversity is more rapid and pronounced, whereas in others, individual fuels (particularly gas) come to dominate certain sectors in certain periods. These regional deviations are discussed in the next section.
57 It is important to note that the diversity index strongly depends on the primary energy accounting convention used. In GEA, a consistent substitution-equivalent accounting of primary energy is applied across all chapters to ensure comparability. Under this accounting convention, diversity indicators drop in the latter half of the century with the strong decarbonization of the energy system. Thus, it is also import-ant to consider the sectoral or end-use diversity indices, discussed below.
58 This index was fi rst used in Jansen et al. ( 2004 ) as a measure of long-term energy security.
1
1.2
1.4
1.6
1.8
2
2.2
2000 2020 2040 2060 2080 2100
Shan
non-
Wie
ner
Div
ersi
y In
dex
1.0
1.2
1.4
1.6
1.8
2.0
2000 2020 2040 2060 2080 2100
Com
poun
d D
iver
siy
Inde
x
Adv. Trans. Conv. Trans.
Supply Pathways
Mix Pathways
Efficiency Pathways
Legend
Figure 17.51 | Primary energy supply diversifi cation in the GEA pathways (unrestricted portfolios for advanced and conventional transport). See text for defi nitions of the indexes.
59 See also the electronic appendix to this chapter for further illustrative examples of diversity indicators for specifi c regions.
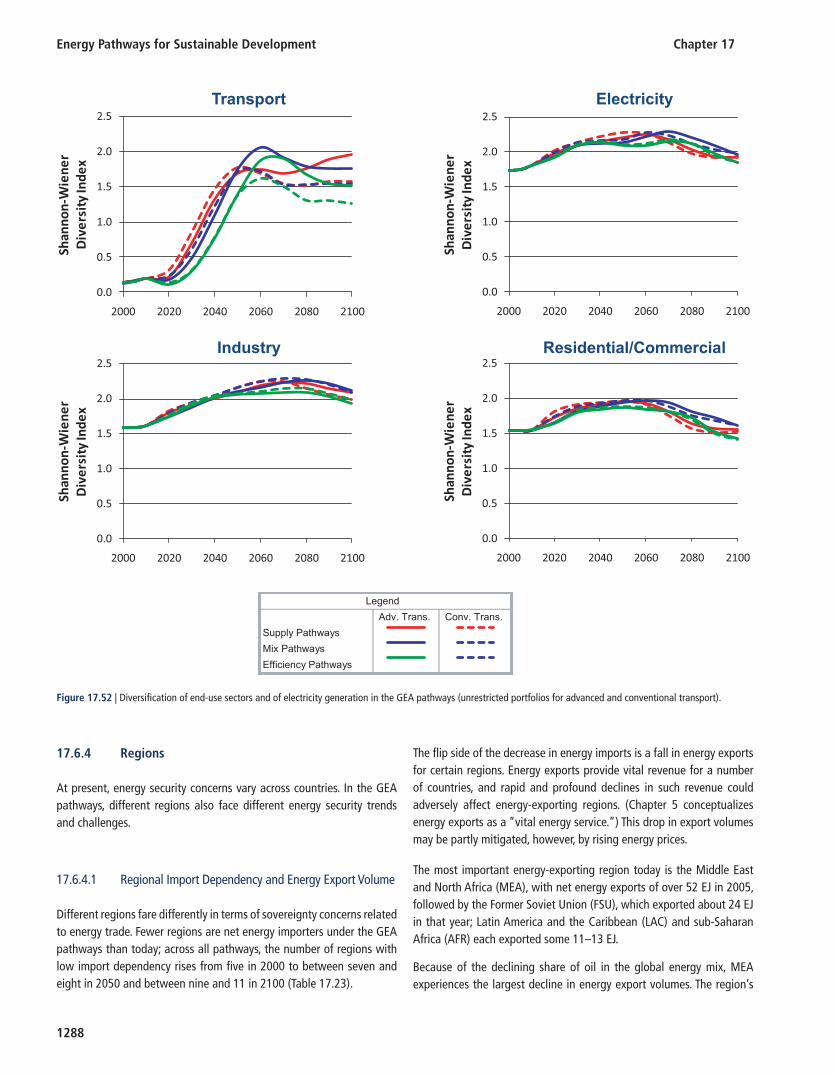
Energy Pathways for Sustainable Development Chapter 17
1288
17.6.4 Regions
At present, energy security concerns vary across countries. In the GEA pathways, different regions also face different energy security trends and challenges.
17.6.4.1 Regional Import Dependency and Energy Export Volume
Different regions fare differently in terms of sovereignty concerns related to energy trade. Fewer regions are net energy importers under the GEA pathways than today; across all pathways, the number of regions with low import dependency rises from five in 2000 to between seven and eight in 2050 and between nine and 11 in 2100 ( Table 17.23 ).
The flip side of the decrease in energy imports is a fall in energy exports for certain regions. Energy exports provide vital revenue for a number of countries, and rapid and profound declines in such revenue could adversely affect energy-exporting regions. ( Chapter 5 conceptualizes energy exports as a “vital energy service.”) This drop in export volumes may be partly mitigated, however, by rising energy prices.
The most important energy-exporting region today is the Middle East and North Africa (MEA), with net energy exports of over 52 EJ in 2005, followed by the Former Soviet Union (FSU), which exported about 24 EJ in that year; Latin America and the Caribbean (LAC) and sub-Saharan Africa (AFR) each exported some 11–13 EJ.
Because of the declining share of oil in the global energy mix, MEA experiences the largest decline in energy export volumes. The region’s
0.0
0.5
1.0
1.5
2.0
2.5
2000 2020 2040 2060 2080 2100
Shan
non-
Wie
ner
Div
ersi
ty In
dex
0.0
0.5
1.0
1.5
2.0
2.5
2000 2020 2040 2060 2080 2100
Shan
non-
Wie
ner
Div
ersi
ty In
dex
0.0
0.5
1.0
1.5
2.0
2.5
2000 2020 2040 2060 2080 2100
Shan
non-
Wie
ner
Div
ersi
ty In
dex
0.0
0.5
1.0
1.5
2.0
2.5
2000 2020 2040 2060 2080 2100
Shan
non-
Wie
ner
Div
ersi
ty In
dex
Transport
Industry Residential/Commercial
Electricity
Adv. Trans. Conv. Trans.
Supply Pathways
Mix Pathways
Efficiency Pathways
Legend
Figure 17.52 | Diversifi cation of end-use sectors and of electricity generation in the GEA pathways (unrestricted portfolios for advanced and conventional transport).

Chapter 17 Energy Pathways for Sustainable Development
1289
exports peak at between 80 and 90 EJ/year in 2030 before falling to 43–55 EJ/year in 2050 (slightly higher for the GEA-Efficiency pathways) and to less than 15 EJ/year in the second half of the century. Similarly, LAC’s exports approximately double to about 20 EJ/year between now and 2030 or 2040 before dropping to between 7 and 10 EJ/year by the end of the century. Exports from AFR also drop, although not as pro-foundly, stabilizing in some pathways at approximately the present lev-els in the second half of the century.
The major export “winner” under all the pathways is FSU, which experi-ences a dramatic rise in its energy exports due to the increasing demand for gas. The region’s energy exports rise from the 2005 level of some 24 EJ/year to between 47 and 52 EJ/year in 2050, and then experience a continued rise through 2070 or 2080 to between 50 and 65 EJ/year. Three other regions –Centrally Planned Asia (dominated by China), North America, and Pacific OECD – also see a rise in export volumes over all the GEA pathway analysed, although their increases are not as pronounced and differ across pathways and time horizons.
17.6.4.2 Regional Resilience and Diversity
As noted above, global energy supply becomes more diverse in the GEA pathways both as a whole and within individual end-use sec-tors, especially the transport sector. This increase in diversity is also observed across all GEA regions ( Table 17.24 ), with a generally smaller
rise in MEA (a consequence of the region’s exceptional oil and gas resource endowment).
The fuel diversity of electricity generation increases in all pathways in five out of the 11 GEA regions. In five other regions, diversity increases in at least some pathways. Only in Western Europe does electricity pro-duction diversity decrease compared with the current (relatively high) level.
In general, the GEA regions may be divided into three broad groups. The first group includes such industrialized regions as the Pacific OECD, Latin America and the Caribbean, North America, and Western Europe, which generally follow the global trends with respect to fuels and end-use sectors. Transitions in their energy systems are primarily driven by global factors, including the switch away from fossil fuels, increases in efficiency, and the diversification of transport technologies. Since all these transitions generally improve energy security by increasing resili-ence and sovereignty, energy security in these regions also improves significantly.
The second group includes Sub-Saharan Africa and Centrally Planned Asia, in which the global energy transitions provide a context for mas-sive growth in regional energy systems. The expansion of energy systems in Sub-Saharan Africa to extend energy access to all, and in Centrally Planned Asia (dominated by China) to keep up with rapidly growing economies, results in dramatically altered configurations of energy sys-tems, leapfrogging the inherited energy systems inertia of the industrial-ized world. As a result, many energy security indicators in these regions improve much more rapidly and dramatically than in the rest of the world, as their energy systems become more diverse and more reliant on regional rather than global resources.
The third group includes those regions that, because of their geography and either fossil fuel resource endowments (the Former Soviet Union, the Middle East and North Africa) or resource scarcity (Eastern Europe and South Asia), have more limited options for radical systemic change. The diversity of energy supply, especially in specific sectors in these regions, may be below the global average. For example, their transpor-tation and electricity sectors may become dominated by natural gas, a fuel of choice in the middle of the century.
17.6.5 Conclusions on Energy Security
Under the GEA pathways, energy security improves in the world as a whole and in the majority of regions. The diversity of energy sources increases, whereas the volume and the intensity of trade decline in most pathways. No individual fuel is likely to cause energy security concerns similar to those caused by oil at present. The one exception is natural gas, which, as a transition fuel, experiences growth to some 30% of global pri-mary energy supply (compared with oil’s 36% share today) in 2050, with increasing trade flows and a decrease in the diversity of production.
Table 17.23 | Import dependency of GEA regions in the GEA pathways.
Imports as share of primary energy supply
No. of regions
2005 2050 2100
Low 1 (<16%) 5 (AFR, CPA, FSU, LAC, MEA)
7–8 (AFR, CPA, FSU, LAC, MEA, NAM, PAO, PAS 2 )
9–11 (AFR, CPA, FSU, EEU, LAC, MEA, NAM, PAO, PAS, 3 SAS, 4 WEU)
Medium (16–34%) 3 (NAM, PAS, SAS)
1–3 (EEU, PAS, 2 , SAS, WEU 5 )
0–2 (PAS, 3 SAS, 4 )
High (>34%) 3 (EEU, PAO, WEU)
0–1 (WEU 5 )
0
Note: AFR (Africa); CPA (Centrally Planned Asia); FSU (Former Soviet Union); EEU (Eastern Europe); LAC (Latin America and the Caribbean); MEA (Middle East and North Africa); NAM (North America); PAO (Pacifi c OECD); PAS (Pacifi c Asia); SAS (South Asia); WEU (Western Europe).
1 Includes net energy exporters.
2 Has medium import dependency (~25%) under the GEA-Effi ciency pathways.
3 Has medium import dependency (~32%) under the GEA-Effi ciency pathways.
4 Has medium import dependency (17–20%) under the GEA-Mix and GEA-Effi ciency pathways with Conventional Transportation.
5 Has medium import dependency (17–30%) under the GEA-Mix pathways and GEA-
Supply pathways with Advanced Transportation.

Energy Pathways for Sustainable Development Chapter 17
1290
In the GEA pathways, individual end-use sectors generally use a more diverse mix of energy sources than today. The transportation sector, pres-ently associated with major energy security concerns, achieves diversity similar to that in other end-use sectors. No end-use sector relies on a single fuel to the extent that transport relies on oil today.
Each of the 11 world regions generally follows the global trend toward improved energy security. Some experience a more rapid and pronounced increase in diversity and self-sufficiency of their energy systems. At the same time, some regions with more limited energy options may experience continued reliance on particular fuels (primarily natural gas) in specific sec-tors (transportation and electricity generation) under certain pathways.
The next section examines, among other issues, the impact of the other energy objectives for energy security, including global energy trade and primary energy source diversity.
17.7 Synergies and Multiple Benefits of Achieving Different Energy Objectives Simultaneously
The previous sections have illustrated a variety of energy futures in which the objectives of climate change mitigation, air quality, health,
access, and security could be achieved simultaneously. These pathways show that a dramatic transformation of the energy system is technically possible, and that if society truly values sustainability across all dimen-sions, such a transformation is indeed necessary. Transitions of this kind would likely lead to enormous synergies between objectives – synergies that are, at the moment, not fully understood by decisionmakers, or often overlooked, because the analysis is complex and requires an inte-grated, holistic perspective.
This section builds upon the main findings of an analysis conducted at IIASA in support of the GEA (McCollum et al., 2011 ), which attempts to illuminate the major synergies and, to a lesser extent, the trade-offs among the various energy objectives and the requisite policy choices and outcomes. In so doing, the analysis takes a slightly different approach from the core illustrative GEA pathways described so far in the chapter. Here the GEA-Mix scenario is used as a starting point for generating a wide array of scenarios that attempt to cover a large portion of the full scenario space across several different dimensions. Within this space, many of the scenarios are unsustainable by GEA standards, as each meets (or fails to meet) the different energy objectives to varying degrees. The analysis uses these less stringent scenarios as counterfactuals and for comparison purposes, in order to show how certain objectives and policy choices push in the same direction, while others are in conflict.
Table 17.24 | Regional trends in diversity and import dependency, 2005 and 2050.
Import Dependency*Diversity
Compound diversity index
Electricity Transport Primay Energy Supply
Region 2005 2050 2005 2050 2005 2050 2005 2050 2005 2050
AFR −8% −7% 1.01 1.64–1.89 0.07 1.24–1.73 1.40 1.66–1.83 1.4 1.51–1.73
CPA 4% 8%–14% 0.74 1.72–1.85 0.21 1.06–1.77 1.17 1.87–1.97 1.05 1.56–1.73
EEU 36% 28%–34% 1.2 1.43–1.60 0.16 1.38–1.76 1.53 1.86–1.94 0.99 1.32–1.50
FSU −54% −56% 1.4 1.34–1.51 0.42 1.36–1.70 1.37 1.68–1.97 1.37 1.68–1.97
LAM −34% −13% 1.26 1.38–1.68 0.31 1.41–1.73 1.44 1.71–1.94 1.44 1.71–1.94
MEA −187% −46% 1 1.12–1.47 0.03 1.09–1.23 0.95 1.22–1.56 0.87 1.17–1.49
NAM 21% 2%–8% 1.46 1.55–1.80 0.08 1.28–1.76 1.54 1.87–2.04 1.34 1.71–1.91
PAO 41% −22% 1.55 1.64–1.95 0.09 1.46–1.79 1.48 1.87–2.07 0.99 1.70–1.81
PAS 28% 10%–28% 1.47 1.53–1.88 0.02 1.28–1.72 1.50 1.96–2.04 1.2 1.45–1.74
SAS 20% 29%–32% 1.22 1.68–1.82 0.11 0.92–1.55 1.46 1.69–1.84 1.16 1.03–1.25
WEU 40% 31%–36% 1.64 1.52–1.73 0.16 1.48–1.75 1.61 1.84–1.93 1.1 1.27–1.34
World 20% 13%–16% 1.54 1.79–1.92 0.15 1.38–1.77 1.62 1.94–2.05 1.36 1.64–1.77
L E G E N D
Import Dependency* Diversity Compound diversity
low (<16%) High (>1.5) High (>1.5)
medium (16–34%) Medium (1.0–1.5) Medium (1.0–1.5)
high (>34%) Low (<1.0) Low (<1.0)
* Import dependency values are reported as negative if a region is a net energy exporter. World import dependency is the proportion of primary energy that is traded.

Chapter 17 Energy Pathways for Sustainable Development
1291
17.7.1 Characterization of the Full Scenario Space
In this section, the feasible scenario space is represented by several hun-dred distinct scenario pathways. These scenarios stretch the potential development of the energy system in several dimensions, each fulfilling the individual GEA objectives with respect to climate change, air pollu-tion and health, and energy security to varying levels of satisfaction. For instance, some scenarios push climate change mitigation while ignor-ing security and air pollution, whereas other scenarios prioritize security only while ignoring the climate objective. Notably, the access objective is taken as a given in this analysis, as all scenarios have been developed to meet the access targets of the GEA, including even the correspond-ing counterfactual (baseline) scenario. 60 This simplification was made because energy access, compared with other objectives, has the lowest impact on energy use and GHG emissions (see Section 17.4 ). For further methodological details on how the full scenario ensemble was devel-oped, see the electronic appendix.
As discussed earlier in this chapter, satisfaction of each of the individ-ual GEA objectives can be measured in their own unique way: climate change in terms of the probability of limiting global temperature rise to 2°C ( Section 17.5.1 ), pollution and health impacts in terms of DALYs ( Section 17.5.2 ), and energy security in terms of a compound diversity indicator ( Section 17.6 ). The use of such different metrics, although necessary given the far-ranging impacts of the energy system, tends to complicate the comparison of scenarios that meet certain objectives but not others. For this reason, this section adopts a simple framework to describe the scenario space across all three objectives; at the same time, it allows for ready comparison with the previous discussions in this chapter. The framework, summarized in Table 17.25 , defines three levels of satisfaction – Weak, Intermediate, and Stringent – for each of the
three energy objectives. Specific numerical ranges are given for what constitutes each of these levels in terms of the relevant indicators. (Note that health impacts are also presented in terms of YOLLs, the method-ology for which is described in Section 17.5.2 .) Importantly, within a given scenario, the fulfillment of each objective is independent of the fulfillment of another (except for some important synergies, discussed later in this section). Therefore, a given scenario could, for example, ful-fill the climate objective at the Weak level while at the same time satisfy the pollution and health objective and the energy security objective at the Intermediate level. By sharp contrast, all of the core GEA pathways described up to this point in the chapter (GEA-Efficiency, GEA-Mix, and GEA-Supply, along with their variants) have been designed to fulfill all of the objectives simultaneously at the Stringent level. In fact, the min-imum allowable indicator values corresponding to the Stringent level are derived from the originally stated targets of the GEA (see Cluster I of the report and Section 17.2.3 ).
Figure 17.53 illustrates the full scenario space across all three dimen-sions: climate, pollution and health, and energy security. The degree to which each scenario (or rather, class of scenarios) fulfills the individual objectives is indicated in the figure by the shaded Weak, Intermediate, and Stringent regions. For instance, the top panel illustrates ranges of GHG emissions trajectories for all scenarios in the large ensemble that correspond to probabilities of reaching the 2°C target. The base-line scenario, which assumes no new climate, pollution and health, or energy security policies, sees the largest growth in emissions through-out the century and is therefore at the upper bound of the Weak region. Annual emissions in the baseline scenario climb from 49 GtCO 2 -eq. in 2010 to 84 GtCO 2 -eq. in 2050. 61 Emissions then peak near 100 Gt in the later part of the century. All other scenarios achieve emissions reduc-tions compared with the baseline, and hence have comparatively higher probabilities of meeting the 2°C target. In the most stringent climate scenarios (lower bound on the Stringent region), emissions in 2050 are just 18.6 Gt. As discussed more fully in Section 17.5.1 , reaching the 2°C target with greater than 50% probability (Stringent region) requires that emissions peak in 2020 at levels only marginally higher than today and then be reduced significantly in the decades that follow. If, however, the climate objective is of lower priority (i.e., if probabilities of meeting the 2°C target at less than 50% are acceptable), the permissible peak in emissions could certainly be greater and could even be delayed far beyond 2020. In the case of such weak and intermediate fulfillment of the climate objective, emissions reductions in the middle to late part of the century would not need to be nearly as drastic. For example, annual GHG emissions in 2050 for the Intermediate region (corresponding to a 20–50% probability of meeting the target) range from levels approxi-mately the same as today to levels up to 45% lower. Comparing the latter case with the former, the emissions peak must occur almost two
Table 17.25 | Indicators for climate change, pollution and health, and energy security and levels of satisfaction within the weak-intermediate-stringent framework.
Fulfillment
Climate Change
[probability of staying within 2ºC warming
limit]
Pollution and Health
[million DALYs (YOLLs), 2030]
Energy security
[compound diversity
indicator, 2030]
Weak <20% >33 (7300) <1.40
Intermediate 20–50% 15–33 (2700 – 7300) 1.40–1.50
Stringent >50% <15 (2700) >1.50
60 Importantly, the baseline scenario referred to here differs from that discussed else-where in the chapter. Here, the baseline corresponds to a variation of the GEA-Mix pathway (thus including intermediate effi ciency focus to limit energy demand), in which the policy constraints are relaxed to business-as-usual conditions. The coun-terfactual referred to in other sections builds upon the GEA-Supply storyline, and a corresponding baseline depicting future developments in the absence of any of GEA sustainability policies at levels of relatively higher demand.
61 Note that these GHG estimates include all well-mixed Kyoto greenhouse gases (CO 2 , methane, nitrous oxide, sulfur hexafl uoride, tetrafl uoromethane, and halocarbons).

Energy Pathways for Sustainable Development Chapter 17
1292
decades earlier in order to preserve the feasibility of achieving the 2°C target with near 50% probability.
The middle panel of Figure 17.53 illustrates the full space of the scenario ensemble in the combined air pollution and health dimension by show-ing PM2.5 emissions trajectories and resulting DALYs. Particulate mat-ter is chosen as a representative pollutant for this discussion because,
as discussed in Section 17.5.2 and Chapter 4 , of all types of air pol-lutant emissions, PM2.5 causes some of the most serious impacts on human health. 62 The emissions trajectories shown in the figure corres-pond to multiple pathways for energy system development under dif-ferent portfolios of air pollution control policies. These policy packages are described more fully in Section 17.5.2 , where further details on the assumed types of controls are provided. Moreover, whereas that section focuses in detail on the impacts of the different air pollution policies in terms of health and other environmental benefits, this section spe-cifically examines the economic implications of combined policies. In Figure 17.53 , the shaded Weak, Intermediate, and Stringent regions cor-respond to DALYs at the global level (the aggregate of all world regions) that would be expected in 2030 by following the ranges of PM2.5 emis-sions trajectories shown. The important point here is that by making a more concerted effort to control air pollution throughout the world over the next two decades, especially in the densely populated urban centers of rapidly developing countries, the collective health of the glo-bal population can be significantly improved and DALYs can be reduced quite substantially. And although these reductions might be achieved by more stringent pollution control policies and measures (i.e., end-of-pipe technologies), they may also be achieved, to some extent, through decarbonization of the energy system in response to strong climate policy. The latter point touches upon an important synergy between the climate objective and the air pollution and health objective that, although not immediately evident in Figure 17.53 , is discussed in more detail later in this section. In short, by driving the energy system toward zero-carbon, emissions-free technologies, stringent climate (and indeed energy security) policies can play an important role in reducing air pol-lutant emissions, even under an otherwise weak pollution policy regime. In other words, fulfillment of the pollution and health objective at the Weak, Intermediate, or Stringent level depends on measures for both pollution and climate control.
The scenarios also cover a broad space in the energy security dimension, as illustrated by the bottom panel of Figure 17.53 . This analysis meas-ures energy security using the compound diversity indicator introduced in Section 17.6 (see also Chapter 5 ). This indicator takes into account the diversity of primary energy resources at the global level, as well as where those resources are sourced – that is, whether from imports or domestic production. The diversity indicator rises with increasing diver-sity of the energy system but falls at higher levels of import depend-ency (see further details in Section 17.6 and the electronic appendix). In this sense, the higher the diversity indicator for a given country or region, the more secure its energy system. Figure 17.53 shows how glo-bal energy system diversity develops over time in all of the scenarios of the full ensemble, with the Weak, Intermediate, and Stringent regions grouping together scenarios that fulfill the security objective to a similar degree, as outlined in Table 17.25 . The lower bound of the Weak region
0
5
10
15
20
25
30
35
40
45
50
55
2005 2015 2025 2035 2045 2055 2065 2075 2085 2095
MtP
M2.5
Weak
Intermediate
Stringent
1.20
1.30
1.40
1.50
1.60
1.70
1.80
1.90
2.00
2005 2015 2025 2035 2045 2055 2065 2075 2085 2095
Compo
undDiversity
Indicator(I 2)
Weak
Intermediate
Stringent
Pollution/Health:PM2.5 emissions and
resulting DALYs
Energy Security:Compound diversity indicator for
resilience and dependency
0
20
40
60
80
100
120
2005 2015 2025 2035 2045 2055 2065 2075 2085 2095
GtCO2-eq
Weak
Intermediate
Stringent
Climate Change:GHG emissions and
Likelihood of <2 ºC
Figure 17.53 | Trajectories for global GHG emissions, PM2.5 emissions, and the com-pound energy diversity indicator for the full scenario ensemble. See Table 17.25 for defi nitions of Weak, Intermediate, and Stringent fulfi llment of objectives.
62 Note that in addition to PM 2.5, each scenario of the large ensemble possesses unique emissions trajectories for sulfur dioxide, nitrogen oxides, volatile organic compounds, carbon monoxide, black carbon, organic carbon, and ammonia.

Chapter 17 Energy Pathways for Sustainable Development
1293
is represented by the baseline scenario, which is obviously one of the least desirable in terms of diversity. (Nor does the baseline meet any of the other sustainability targets of the GEA, lying within the Weak region in all cases.) Compared with the baseline, virtually every other scenario, whether motivated by security or by climate policy, achieves a greater diversification of the global energy mix over time. As discussed more fully in Section 17.6 , fulfilling the GEA targets for near-term energy security (the Stringent region in the figure) necessitates a global energy system that transitions to a broader portfolio of energy sources over the coming decades, while at the same time individual countries and regions (e.g., North America) come to rely less on imported energy commodities and more on domestic supplies. However, given the combination of the dominance of fossil energy in today’s energy mix and the uneven distri-bution of fossil resource deposits around the globe, increasing energy diversity, and thus security, essentially requires that countries and regions move away from fossil energy and instead toward renewable energy sources such as biomass, wind, solar, and geothermal. Indeed, this is what emerges from the illustrative GEA pathways described pre-viously in this chapter, as well as from the scenarios represented by
the Stringent and Intermediate regions in Figure 17.53 . Section 17.7.2.2 discusses this point further.
Because the individual scenarios in the ensemble vary so greatly along the dimensions of climate change, pollution and health, and energy security, total energy system costs naturally span a fairly wide range as well. This is illustrated in Figure 17.54 , where each bar represents the costs of a single scenario, and the scenarios are sorted in order of increasing costs. Included in these costs is the cumulative sum between 2010 and 2050 (discounted at 5% annually) of energy system investments (including supply and demand as well as climate change mitigation, energy secur-ity, and pollution control investments), operation and maintenance, fuel, and nonenergy mitigation costs. 63 Total system costs for each scenario are then related to the cumulative discounted sum of global GDP over the same time period. The least costly scenario in the ensemble is the base-line, since it assumes no climate change mitigation, pollution control, or energy security policies other than what is already planned over the next
0.0%
0.5%
1.0%
1.5%
2.0%
2.5%
3.0%
3.5%
4.0%
4.5%
Tota
l Cos
ts (
% o
f GD
P)
Individual Scenarios
Clim
ate
Chan
ge
Pollu
�on
/Hea
lth
Ener
gy S
ecur
ity
Cost ranges for achieving individual objec�ve
Stri
ngen
tIn
term
edia
teW
eak
Figure 17.54 | Cumulative discounted total energy system costs for all scenarios in the full ensemble (2010–2050). Bars at right illustrate the ranges of total cost that corres-pond to Weak, Intermediate, and Stringent fulfi llment of the climate, pollution and health, and energy security objectives.
63 For the investment intensity of GDP, see also Section 17.3.5 .

Energy Pathways for Sustainable Development Chapter 17
1294
few years. Fulfillment of the GEA objectives (to any level of satisfaction) then adds to energy system costs to a certain degree. If one thinks of the multiple objectives as societal targets that the energy system should attempt to satisfy (i.e., scenario inputs), then total costs are an embodi-ment (i.e., scenario outputs) of the system-wide transformations that must take place in order to meet those objectives (e.g., increased utilization of advanced technologies and alternative fuels). The resulting total cost of a given scenario depends entirely on how far it goes toward satisfying each individual objective, as shown by the bars on the right side of Figure 17.54 , which illustrate the ranges of scenarios, from a cost perspective, that correspond to Weak, Intermediate, and Stringent fulfillment of the climate, pollution and health, and energy security objectives. The least costly scenarios – those yielding little or no improvement in the objectives, such as the baseline – lie within the Weak region, whereas scenarios that achieve one or all of the objectives at the Intermediate or the Stringent level obviously incur costs in the middle or the upper end of the range, respectively. Notably, total costs range from 3.1–4.2% of GDP for the class of scenarios that achieves stringent fulfillment of all three objectives simultaneously. By comparison, energy system costs in the counterfactual baseline are about 2.1% of GDP over the same time period.
An important caveat to the cost analysis shown here is that it performs only a partial economic accounting. The analysis attempts to capture mul-tiple benefits in terms of avoided or reduced costs for climate change miti-gation, energy security, and pollution control. However, given the inherent difficulties in valuing human life in the economic sense, and given the vast uncertainties with respect to the economic valuation of, for example, climate-related damages, the analysis does not attempt to value other benefits of pursuing these three objectives (for a discussion of other ben-efits see Chapters 3 , 4 , and 5 ). For instance, the analysis does not consider the avoided costs of climate change (e.g., more frequent extreme wea-ther events, impacts on global agriculture and food production), nor does it capture the avoided costs of adaptation to climate change (e.g., construc-tion of sea walls, relocation of coastal populations). Similarly, the benefits accruing from reduced health expenditure and increased life expectancies have not been quantified here. Hence, the conclusions on multiple eco-nomic benefits presented in this section relate to “mitigation” costs only; they would become larger if other benefits were assigned an economic value as well.
17.7.2 Synergies between Objectives
The discussions above have already begun to show the inherent syn-ergies, and to a lesser extent the trade-offs, among the various energy objectives and how these complex interdependencies can be illumi-nated through analysis of a large ensemble of possible energy futures. Among energy planners and decision makers, however, these relation-ships are not well enough understood. Cost trade-offs are obviously the more familiar: the greater society’s aspiration for achieving the energy objectives, the larger the costs for the energy system. However, for such questions as, “How much extra might it cost to achieve each add-itional objective?” and “How can costs be reduced by pursuing multiple
objectives?” the answers are much less clear. The discussion that fol-lows highlights the main findings of one of the few attempts in the scenario literature to explore the important relationships among climate change mitigation, energy security, and reduced air pollution and health impacts (for further reading, see van Vuuren et al., 2006 ; Cofala et al., 2009 ; Cofala et al., 2010 ; Bollen et al., 2010 ; McCollum et al., 2011 ). 64
17.7.2.1 Climate Change Mitigation and Pollution and Health
Section 17.5.1 discussed in detail how decarbonization of the global energy system, combined with energy and conservation efforts, may be instrumental in limiting climate change to safer levels. This section takes the analysis a step further, showing that climate change mitiga-tion can also help to reduce air pollutant emissions and their corre-sponding impacts on human health. Put more directly, climate change mitigation can be an important entry point for achieving society’s pollu-tion- and health-related goals. This is illustrated clearly in Figure 17.55 , which relates global PM2.5 emissions in the near term (to 2030) to the probability of staying below a 2°C maximum temperature rise over the course of the century. Each data point in the figure represents values for a single scenario in the ensemble. The specific combination of pollution and climate policy stringency is what distinguishes the scenarios from one another. In particular, the different levels of air pollution control policy, indicated by the varying shapes of the data points, correspond to the scenario assumptions discussed previously in the pollution section (FLE, CLE, and SLE; see Section 17.5.2 ).
What one first notices in Figure 17.55 is that as the energy system is decarbonized and increasing shares of zero-carbon, pollution-free tech-nologies are utilized, the probability of meeting the 2°C target increases, and pollutant emissions are significantly reduced. Moreover, the spread between the pollution control levels narrows as climate change mitiga-tion becomes more of a priority. (The shaded areas in the figure help to illuminate this effect.) This last point is important, as it shows how the impacts of pollution control policy are much less variable as zero-carbon technologies penetrate the market and fossil technologies are forced out. This result stems from pollution control being applicable to fewer technologies (e.g., power plants, factories, vehicles) when there is less fossil energy in the system. A final observation is that climate change mitigation measures alone can yield pollutant emissions reductions on the order of currently planned legislation for pollution control.
Figure 17.55 also illustrates the extent to which each scenario ful-fills the climate and pollution and health objectives, utilizing the Weak-Intermediate-Stringent framework discussed in Section 17.7.1 .
64 As a supplement to the GEA, an interactive web-based scenario development tool has been developed at IIASA, which allows members of the public to improve their understanding of how different policy choices (i.e., prioritization of certain object-ives above or below others) could potentially impact the development of the global energy system over the next several decades, in terms of resources, technologies, fuels, investments and the corresponding impacts on human health and the envir-onment. To experiment with the Multi-criteria Analysis tool, see www.iiasa.ac.at/web-apps/ene/GeaMCA.
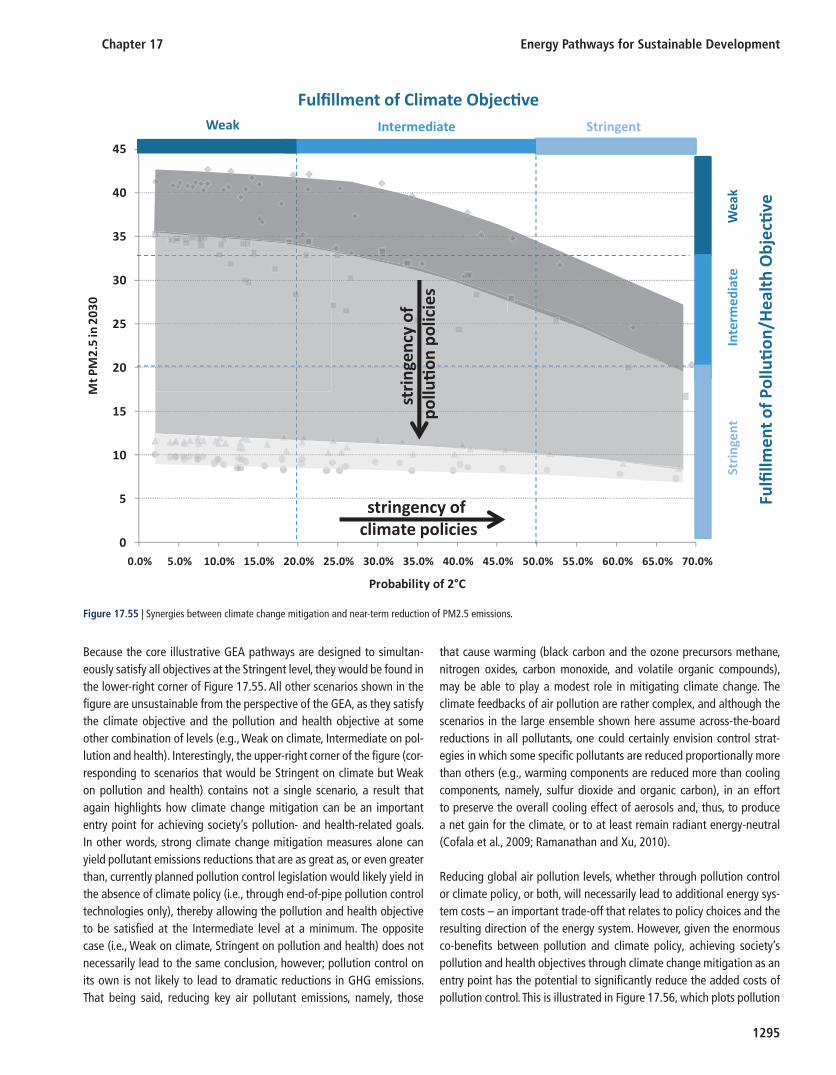
Chapter 17 Energy Pathways for Sustainable Development
1295
Because the core illustrative GEA pathways are designed to simultan-eously satisfy all objectives at the Stringent level, they would be found in the lower-right corner of Figure 17.55 . All other scenarios shown in the figure are unsustainable from the perspective of the GEA, as they satisfy the climate objective and the pollution and health objective at some other combination of levels (e.g., Weak on climate, Intermediate on pol-lution and health). Interestingly, the upper-right corner of the figure (cor-responding to scenarios that would be Stringent on climate but Weak on pollution and health) contains not a single scenario, a result that again highlights how climate change mitigation can be an important entry point for achieving society’s pollution- and health-related goals. In other words, strong climate change mitigation measures alone can yield pollutant emissions reductions that are as great as, or even greater than, currently planned pollution control legislation would likely yield in the absence of climate policy (i.e., through end-of-pipe pollution control technologies only), thereby allowing the pollution and health objective to be satisfied at the Intermediate level at a minimum. The opposite case (i.e., Weak on climate, Stringent on pollution and health) does not necessarily lead to the same conclusion, however; pollution control on its own is not likely to lead to dramatic reductions in GHG emissions. That being said, reducing key air pollutant emissions, namely, those
that cause warming (black carbon and the ozone precursors methane, nitrogen oxides, carbon monoxide, and volatile organic compounds), may be able to play a modest role in mitigating climate change. The climate feedbacks of air pollution are rather complex, and although the scenarios in the large ensemble shown here assume across-the-board reductions in all pollutants, one could certainly envision control strat-egies in which some specific pollutants are reduced proportionally more than others (e.g., warming components are reduced more than cooling components, namely, sulfur dioxide and organic carbon), in an effort to preserve the overall cooling effect of aerosols and, thus, to produce a net gain for the climate, or to at least remain radiant energy-neutral (Cofala et al., 2009 ; Ramanathan and Xu, 2010 ).
Reducing global air pollution levels, whether through pollution control or climate policy, or both, will necessarily lead to additional energy sys-tem costs – an important trade-off that relates to policy choices and the resulting direction of the energy system. However, given the enormous co-benefits between pollution and climate policy, achieving society’s pollution and health objectives through climate change mitigation as an entry point has the potential to significantly reduce the added costs of pollution control. This is illustrated in Figure 17.56 , which plots pollution
0
5
10
15
20
25
30
35
40
45
0.0% 5.0% 10.0% 15.0% 20.0% 25.0% 30.0% 35.0% 40.0% 45.0% 50.0% 55.0% 60.0% 65.0% 70.0%
Mt P
M2.
5 in
203
0
Probability of 2°C
Stri
ngen
t
Wea
k
Stringent Intermediate Weak
Fulfillment of Climate Objec�ve
Fulfi
llmen
t of P
ollu
�on
/Hea
lth
Obj
ec�
ve
stri
ngen
cy o
f po
llu�
on p
olic
ies
stringency of climate policies
Inte
rmed
iate
Figure 17.55 | Synergies between climate change mitigation and near-term reduction of PM2.5 emissions.
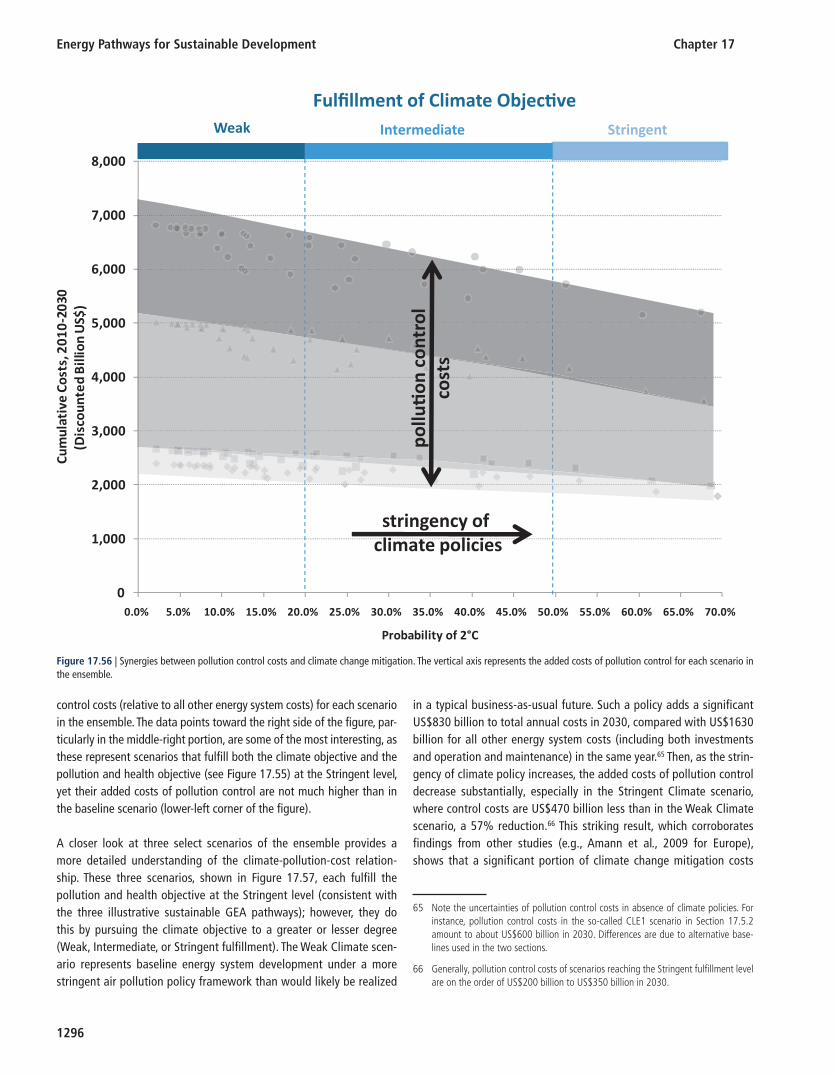
Energy Pathways for Sustainable Development Chapter 17
1296
control costs (relative to all other energy system costs) for each scenario in the ensemble. The data points toward the right side of the figure, par-ticularly in the middle-right portion, are some of the most interesting, as these represent scenarios that fulfill both the climate objective and the pollution and health objective (see Figure 17.55 ) at the Stringent level, yet their added costs of pollution control are not much higher than in the baseline scenario (lower-left corner of the figure).
A closer look at three select scenarios of the ensemble provides a more detailed understanding of the climate-pollution-cost relation-ship. These three scenarios, shown in Figure 17.57 , each fulfill the pollution and health objective at the Stringent level (consistent with the three illustrative sustainable GEA pathways); however, they do this by pursuing the climate objective to a greater or lesser degree (Weak, Intermediate, or Stringent fulfillment). The Weak Climate scen-ario represents baseline energy system development under a more stringent air pollution policy framework than would likely be realized
in a typical business-as-usual future. Such a policy adds a significant US$830 billion to total annual costs in 2030, compared with US$1630 billion for all other energy system costs (including both investments and operation and maintenance) in the same year. 65 Then, as the strin-gency of climate policy increases, the added costs of pollution control decrease substantially, especially in the Stringent Climate scenario, where control costs are US$470 billion less than in the Weak Climate scenario, a 57% reduction. 66 This striking result, which corroborates findings from other studies (e.g., Amann et al., 2009 for Europe), shows that a significant portion of climate change mitigation costs
65 Note the uncertainties of pollution control costs in absence of climate policies. For instance, pollution control costs in the so-called CLE1 scenario in Section 17.5.2 amount to about US$600 billion in 2030. Differences are due to alternative base-lines used in the two sections.
66 Generally, pollution control costs of scenarios reaching the Stringent fulfi llment level are on the order of US$200 billion to US$350 billion in 2030.
0
1,000
2,000
3,000
4,000
5,000
6,000
7,000
8,000
0.0% 5.0% 10.0% 15.0% 20.0% 25.0% 30.0% 35.0% 40.0% 45.0% 50.0% 55.0% 60.0% 65.0% 70.0%
0 1 0 2 , s t s o C e v i t a l u m
u C
- 203
0
(Dis
coun
ted
Bill
ion
US$
)
Probability of 2°C
Stringent Intermediate Weak
Fulfillment of Climate Objec�ve
pollu
�on
con
trol
co
sts
stringency of c limate policies
Figure 17.56 | Synergies between pollution control costs and climate change mitigation. The vertical axis represents the added costs of pollution control for each scenario in the ensemble.
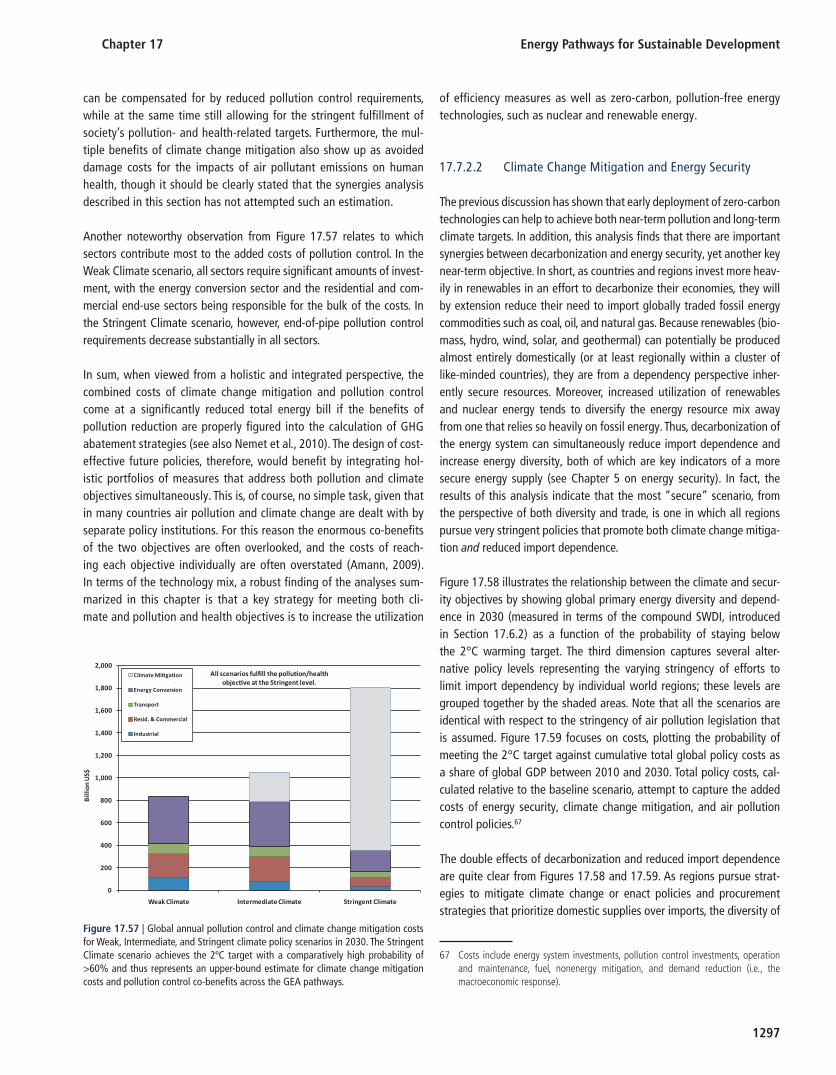
Chapter 17 Energy Pathways for Sustainable Development
1297
can be compensated for by reduced pollution control requirements, while at the same time still allowing for the stringent fulfillment of society’s pollution- and health-related targets. Furthermore, the mul-tiple benefits of climate change mitigation also show up as avoided damage costs for the impacts of air pollutant emissions on human health, though it should be clearly stated that the synergies analysis described in this section has not attempted such an estimation.
Another noteworthy observation from Figure 17.57 relates to which sectors contribute most to the added costs of pollution control. In the Weak Climate scenario, all sectors require significant amounts of invest-ment, with the energy conversion sector and the residential and com-mercial end-use sectors being responsible for the bulk of the costs. In the Stringent Climate scenario, however, end-of-pipe pollution control requirements decrease substantially in all sectors.
In sum, when viewed from a holistic and integrated perspective, the combined costs of climate change mitigation and pollution control come at a significantly reduced total energy bill if the benefits of pollution reduction are properly figured into the calculation of GHG abatement strategies (see also Nemet et al., 2010 ). The design of cost-effective future policies, therefore, would benefit by integrating hol-istic portfolios of measures that address both pollution and climate objectives simultaneously. This is, of course, no simple task, given that in many countries air pollution and climate change are dealt with by separate policy institutions. For this reason the enormous co-benefits of the two objectives are often overlooked, and the costs of reach-ing each objective individually are often overstated (Amann, 2009 ). In terms of the technology mix, a robust finding of the analyses sum-marized in this chapter is that a key strategy for meeting both cli-mate and pollution and health objectives is to increase the utilization
of efficiency measures as well as zero-carbon, pollution-free energy technologies, such as nuclear and renewable energy.
17.7.2.2 Climate Change Mitigation and Energy Security
The previous discussion has shown that early deployment of zero-carbon technologies can help to achieve both near-term pollution and long-term climate targets. In addition, this analysis finds that there are important synergies between decarbonization and energy security, yet another key near-term objective. In short, as countries and regions invest more heav-ily in renewables in an effort to decarbonize their economies, they will by extension reduce their need to import globally traded fossil energy commodities such as coal, oil, and natural gas. Because renewables (bio-mass, hydro, wind, solar, and geothermal) can potentially be produced almost entirely domestically (or at least regionally within a cluster of like-minded countries), they are from a dependency perspective inher-ently secure resources. Moreover, increased utilization of renewables and nuclear energy tends to diversify the energy resource mix away from one that relies so heavily on fossil energy. Thus, decarbonization of the energy system can simultaneously reduce import dependence and increase energy diversity, both of which are key indicators of a more secure energy supply (see Chapter 5 on energy security). In fact, the results of this analysis indicate that the most “secure” scenario, from the perspective of both diversity and trade, is one in which all regions pursue very stringent policies that promote both climate change mitiga-tion and reduced import dependence.
Figure 17.58 illustrates the relationship between the climate and secur-ity objectives by showing global primary energy diversity and depend-ence in 2030 (measured in terms of the compound SWDI, introduced in Section 17.6.2 ) as a function of the probability of staying below the 2°C warming target. The third dimension captures several alter-native policy levels representing the varying stringency of efforts to limit import dependency by individual world regions; these levels are grouped together by the shaded areas. Note that all the scenarios are identical with respect to the stringency of air pollution legislation that is assumed. Figure 17.59 focuses on costs, plotting the probability of meeting the 2°C target against cumulative total global policy costs as a share of global GDP between 2010 and 2030. Total policy costs, cal-culated relative to the baseline scenario, attempt to capture the added costs of energy security, climate change mitigation, and air pollution control policies. 67
The double effects of decarbonization and reduced import dependence are quite clear from Figures 17.58 and 17.59 . As regions pursue strat-egies to mitigate climate change or enact policies and procurement strategies that prioritize domestic supplies over imports, the diversity of
67 Costs include energy system investments, pollution control investments, operation and maintenance, fuel, nonenergy mitigation, and demand reduction (i.e., the macroeconomic response).
0
200
400
600
800
1,000
1,200
1,400
1,600
1,800
2,000
Weak Climate Intermediate Climate Stringent Climate
Bill
ion
US$
Climate Mi�ga�on
Energy Conversion
Transport
Resid. & Commercial
Industrial
All scenarios fulfill the pollu�on/health objec�ve at the Stringent level.
Figure 17.57 | Global annual pollution control and climate change mitigation costs for Weak, Intermediate, and Stringent climate policy scenarios in 2030. The Stringent Climate scenario achieves the 2ºC target with a comparatively high probability of >60% and thus represents an upper-bound estimate for climate change mitigation costs and pollution control co-benefi ts across the GEA pathways.
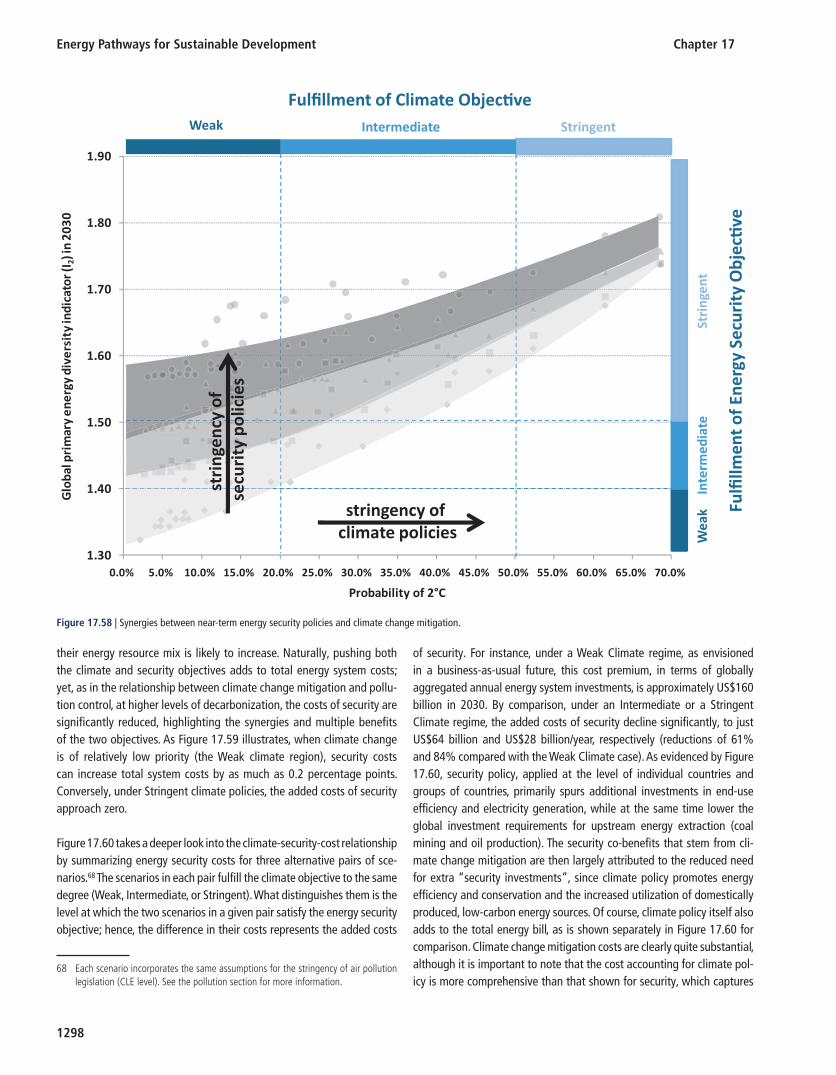
Energy Pathways for Sustainable Development Chapter 17
1298
their energy resource mix is likely to increase. Naturally, pushing both the climate and security objectives adds to total energy system costs; yet, as in the relationship between climate change mitigation and pollu-tion control, at higher levels of decarbonization, the costs of security are significantly reduced, highlighting the synergies and multiple benefits of the two objectives. As Figure 17.59 illustrates, when climate change is of relatively low priority (the Weak climate region), security costs can increase total system costs by as much as 0.2 percentage points. Conversely, under Stringent climate policies, the added costs of security approach zero.
Figure 17.60 takes a deeper look into the climate-security-cost relationship by summarizing energy security costs for three alternative pairs of sce-narios. 68 The scenarios in each pair fulfill the climate objective to the same degree (Weak, Intermediate, or Stringent). What distinguishes them is the level at which the two scenarios in a given pair satisfy the energy security objective; hence, the difference in their costs represents the added costs
of security. For instance, under a Weak Climate regime, as envisioned in a business-as-usual future, this cost premium, in terms of globally aggregated annual energy system investments, is approximately US$160 billion in 2030. By comparison, under an Intermediate or a Stringent Climate regime, the added costs of security decline significantly, to just US$64 billion and US$28 billion/year, respectively (reductions of 61% and 84% compared with the Weak Climate case). As evidenced by Figure 17.60 , security policy, applied at the level of individual countries and groups of countries, primarily spurs additional investments in end-use efficiency and electricity generation, while at the same time lower the global investment requirements for upstream energy extraction (coal mining and oil production). The security co-benefits that stem from cli-mate change mitigation are then largely attributed to the reduced need for extra “security investments”, since climate policy promotes energy efficiency and conservation and the increased utilization of domestically produced, low-carbon energy sources. Of course, climate policy itself also adds to the total energy bill, as is shown separately in Figure 17.60 for comparison. Climate change mitigation costs are clearly quite substantial, although it is important to note that the cost accounting for climate pol-icy is more comprehensive than that shown for security, which captures
68 Each scenario incorporates the same assumptions for the stringency of air pollution legislation (CLE level). See the pollution section for more information.
1.30
1.40
1.50
1.60
1.70
1.80
1.90
0.0% 5.0% 10.0% 15.0% 20.0% 25.0% 30.0% 35.0% 40.0% 45.0% 50.0% 55.0% 60.0% 65.0% 70.0%
I( rotacidni ytisrevid ygrene yramirp labol
G2)
in 2
030
Probability of 2°C
Stri
ngen
t
Inte
rmed
iate
W
eak
Stringent Intermediate Weak
Fulfillment of Climate Objec�ve
Fulfi
llmen
t of E
nerg
y Se
curi
ty O
bjec
�ve
stri
ngen
cy o
f se
curi
ty p
olic
ies
stringency of climate policies
Figure 17.58 | Synergies between near-term energy security policies and climate change mitigation.
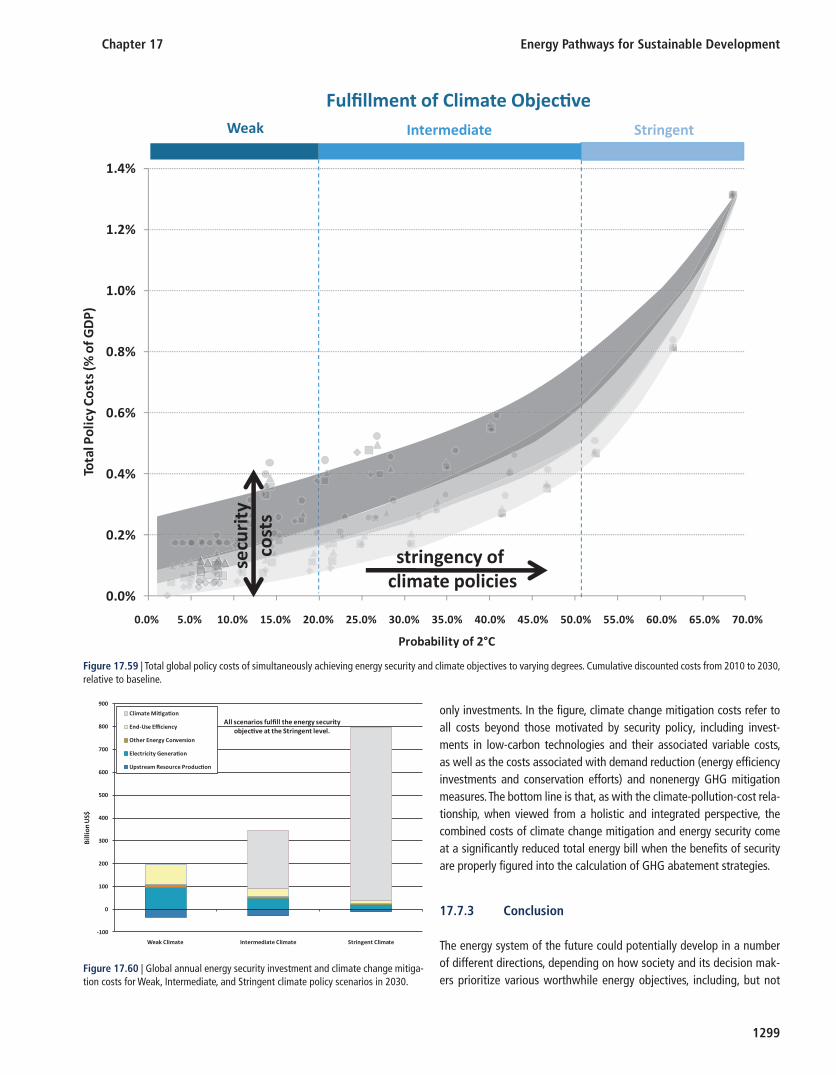
Chapter 17 Energy Pathways for Sustainable Development
1299
only investments. In the figure, climate change mitigation costs refer to all costs beyond those motivated by security policy, including invest-ments in low-carbon technologies and their associated variable costs, as well as the costs associated with demand reduction (energy efficiency investments and conservation efforts) and nonenergy GHG mitigation measures. The bottom line is that, as with the climate-pollution-cost rela-tionship, when viewed from a holistic and integrated perspective, the combined costs of climate change mitigation and energy security come at a significantly reduced total energy bill when the benefits of security are properly figured into the calculation of GHG abatement strategies.
17.7.3 Conclusion
The energy system of the future could potentially develop in a number of different directions, depending on how society and its decision mak-ers prioritize various worthwhile energy objectives, including, but not
0.0%
0.2%
0.4%
0.6%
0.8%
1.0%
1.2%
1.4%
Tota
l Pol
icy
Cost
s (%
of G
DP)
Probability of 2°C
Stringent Intermediate Weak
Fulfillment of Climate Objec�ve
secu
rity
co
sts
stringency of c limate policies
0.0% 5.0% 10.0% 15.0% 20.0% 25.0% 30.0% 35.0% 40.0% 45.0% 50.0% 55.0% 60.0% 65.0% 70.0%
Figure 17.59 | Total global policy costs of simultaneously achieving energy security and climate objectives to varying degrees. Cumulative discounted costs from 2010 to 2030, relative to baseline.
-100
0
100
200
300
400
500
600
700
800
900
Weak Climate Intermediate Climate Stringent Climate
Bill
ion
US$
Climate Mi�ga�on
End-Use Efficiency
Other Energy Conversion
Electricity Genera�on
Upstream Resource Produc�on
All scenarios fulfill the energy security objec�ve at the Stringent level.
Figure 17.60 | Global annual energy security investment and climate change mitiga-tion costs for Weak, Intermediate, and Stringent climate policy scenarios in 2030.
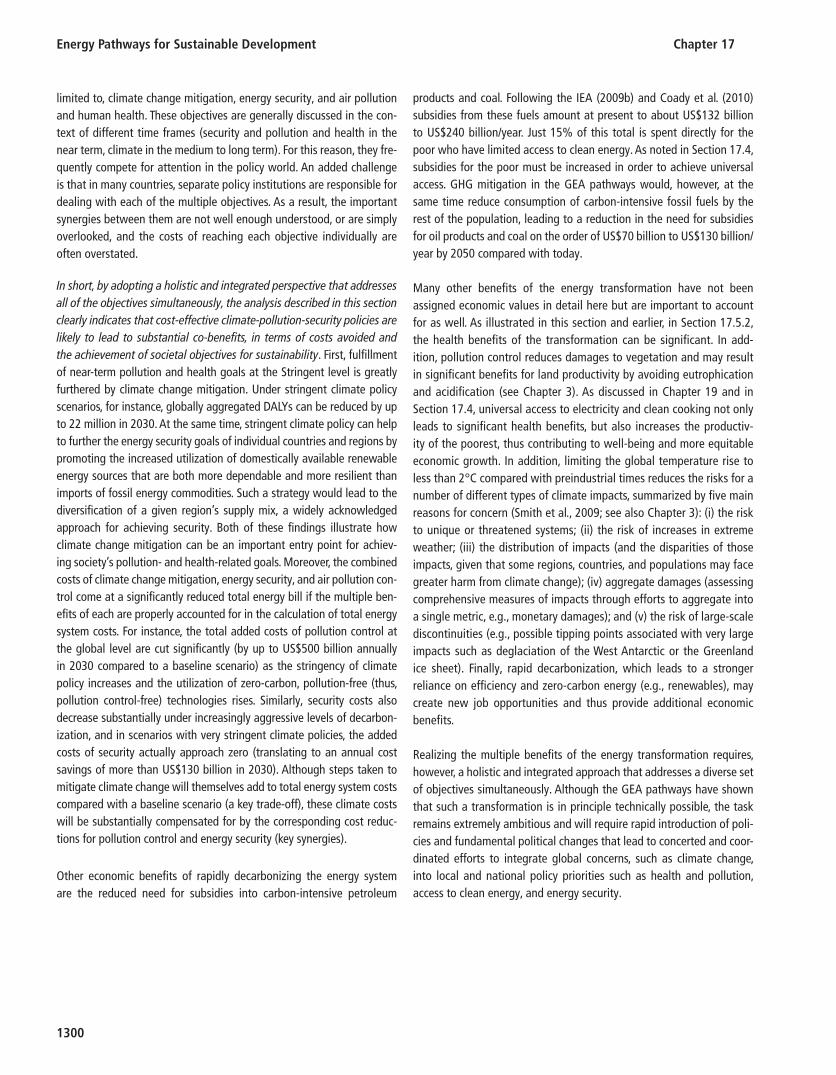
Energy Pathways for Sustainable Development Chapter 17
1300
limited to, climate change mitigation, energy security, and air pollution and human health. These objectives are generally discussed in the con-text of different time frames (security and pollution and health in the near term, climate in the medium to long term). For this reason, they fre-quently compete for attention in the policy world. An added challenge is that in many countries, separate policy institutions are responsible for dealing with each of the multiple objectives. As a result, the important synergies between them are not well enough understood, or are simply overlooked, and the costs of reaching each objective individually are often overstated.
In short, by adopting a holistic and integrated perspective that addresses all of the objectives simultaneously, the analysis described in this section clearly indicates that cost-effective climate-pollution-security policies are likely to lead to substantial co-benefits, in terms of costs avoided and the achievement of societal objectives for sustainability . First, fulfillment of near-term pollution and health goals at the Stringent level is greatly furthered by climate change mitigation. Under stringent climate policy scenarios, for instance, globally aggregated DALYs can be reduced by up to 22 million in 2030. At the same time, stringent climate policy can help to further the energy security goals of individual countries and regions by promoting the increased utilization of domestically available renewable energy sources that are both more dependable and more resilient than imports of fossil energy commodities. Such a strategy would lead to the diversification of a given region’s supply mix, a widely acknowledged approach for achieving security. Both of these findings illustrate how climate change mitigation can be an important entry point for achiev-ing society’s pollution- and health-related goals. Moreover, the combined costs of climate change mitigation, energy security, and air pollution con-trol come at a significantly reduced total energy bill if the multiple ben-efits of each are properly accounted for in the calculation of total energy system costs. For instance, the total added costs of pollution control at the global level are cut significantly (by up to US$500 billion annually in 2030 compared to a baseline scenario) as the stringency of climate policy increases and the utilization of zero-carbon, pollution-free (thus, pollution control-free) technologies rises. Similarly, security costs also decrease substantially under increasingly aggressive levels of decarbon-ization, and in scenarios with very stringent climate policies, the added costs of security actually approach zero (translating to an annual cost savings of more than US$130 billion in 2030). Although steps taken to mitigate climate change will themselves add to total energy system costs compared with a baseline scenario (a key trade-off), these climate costs will be substantially compensated for by the corresponding cost reduc-tions for pollution control and energy security (key synergies).
Other economic benefits of rapidly decarbonizing the energy system are the reduced need for subsidies into carbon-intensive petroleum
products and coal. Following the IEA ( 2009b ) and Coady et al. ( 2010 ) subsidies from these fuels amount at present to about US$132 billion to US$240 billion/year. Just 15% of this total is spent directly for the poor who have limited access to clean energy. As noted in Section 17.4 , subsidies for the poor must be increased in order to achieve universal access. GHG mitigation in the GEA pathways would, however, at the same time reduce consumption of carbon-intensive fossil fuels by the rest of the population, leading to a reduction in the need for subsidies for oil products and coal on the order of US$70 billion to US$130 billion/year by 2050 compared with today.
Many other benefits of the energy transformation have not been assigned economic values in detail here but are important to account for as well. As illustrated in this section and earlier, in Section 17.5.2 , the health benefits of the transformation can be significant. In add-ition, pollution control reduces damages to vegetation and may result in significant benefits for land productivity by avoiding eutrophication and acidification (see Chapter 3 ). As discussed in Chapter 19 and in Section 17.4 , universal access to electricity and clean cooking not only leads to significant health benefits, but also increases the productiv-ity of the poorest, thus contributing to well-being and more equitable economic growth. In addition, limiting the global temperature rise to less than 2°C compared with preindustrial times reduces the risks for a number of different types of climate impacts, summarized by five main reasons for concern (Smith et al., 2009 ; see also Chapter 3 ): (i) the risk to unique or threatened systems; (ii) the risk of increases in extreme weather; (iii) the distribution of impacts (and the disparities of those impacts, given that some regions, countries, and populations may face greater harm from climate change); (iv) aggregate damages (assessing comprehensive measures of impacts through efforts to aggregate into a single metric, e.g., monetary damages); and (v) the risk of large-scale discontinuities (e.g., possible tipping points associated with very large impacts such as deglaciation of the West Antarctic or the Greenland ice sheet). Finally, rapid decarbonization, which leads to a stronger reliance on efficiency and zero-carbon energy (e.g., renewables), may create new job opportunities and thus provide additional economic benefits.
Realizing the multiple benefits of the energy transformation requires, however, a holistic and integrated approach that addresses a diverse set of objectives simultaneously. Although the GEA pathways have shown that such a transformation is in principle technically possible, the task remains extremely ambitious and will require rapid introduction of poli-cies and fundamental political changes that lead to concerted and coor-dinated efforts to integrate global concerns, such as climate change, into local and national policy priorities such as health and pollution, access to clean energy, and energy security.

Chapter 17 Energy Pathways for Sustainable Development
1301
References
Amann , M. , R. Cabala , J. Cofala , C. Heyes , Z. Klimont , W. Sch ö pp, L. Tarrason ,
D. Simpson , P. Wind and J. E. Jonson , 2004 : The “Current Legislation” and
the “Maximum Technically Feasible Reduction” cases for the CAFE baseline
emission projections . CAFE Working Group on Target Setting and Policy Advice.
Laxenburg, IIASA 39
Amann , M. , L. H ö glund Isaksson , W. Winiwarter , A. Tohka , F. Wagner , W. Sch ö
pp, I. Bertok and C. Heyes , 2008 : Emission scenarios for non-CO 2 greenhouse
gases in the EU-27. Mitigation potentials and costs in 2020. IIASA, Laxenburg.
Amann , M. , 2009 : Air pollutants and greenhouse gases – Options and benefi ts from
co-control. In Air Pollution & Climate Change – Two Sides of the Same Coin?
H. Pleijel, P. E. Karlsson and D. Simpson, (eds.), Swedish Environmental Protection
Agency, Stockholm pp.99–108.
Amann , M. , I. Bertok , J. Borken-Kleefeld , J. Cofala , C. Heyes , L. Hoeglund
Isaksson , Z. Klimont , P. Purohit , P. Rafaj , W. Schoepp , G. Toth , F. Wagner
and W. Winiwarter , 2009 : Potentials and Costs for Greenhouse Gas Mitigation
in Annex I Countries: Methodology Proceedings of the National Academy of
Sciences of the United States of America, International Institute for Applied
Systems Analysis (IIASA), Laxenburg.
Andersen , P. H. , J. A. Mathews and M. Rask , 2009 : Integrating private transport
into renewable energy policy: The strategy of creating intelligent recharging
grids for electric vehicles. Energy Policy , 37 (7):2481–2486.
APERC , 2007 : A Quest for Energy Security in the 21st Century – Resources and Constraints .
Institute of Energy Economics, Asia Pacifi c Energy Research Centre (APERC).
Baciocchi , R. , G. Storti and M. Mazzotti , 2006 : Process design and energy require-
ments for the capture of carbon dioxide from air. Chemical Engineering and
Processing , 45 (12):1047–1058.
Bailis , R ., M. Ezzati and D. M. Kammen , 2005 : Mortality and greenhouse gas impacts
of biomass and petroleum energy futures in Africa. Science , 308 (5718):98–103.
Benjamin , R. , 2007 : Principles for interregional transmission expansion. The
Electricity Journal , 20 (8):36–47.
Bergamaschi , P. , C. Frankenberg , J. F. Meirink , M. Krol , F. Dentener , T. Wagner ,
U. Platt , J. O. Kaplan , S. K ö rner , M. Heimann , E. J. Dlugokencky and
A. Goede , 2007 : Satellite chartography of atmospheric methane from
SCIAMACHY on board ENVISAT: 2. Evaluation based on inverse model simula-
tions Journal of Geophysical Research Atmospheres , 112 (D02304):26.
Berk , M. M. and M. G. J. den Elzen , 2001 : Options for differentiation of future com-
mitments in climate policy: how to realise timely participation to meet stringent
climate goals? Climate Policy , 1 (4):465–480.
Birol , F. and J. H. Keppler , 2000 : Prices, technology development and the rebound
effect. Energy Policy , 28 (6–7):457–469.
Blanchard , O. , 2002 : Scenarios for differentiating commitments. In Options for pro-
tecting the climate . K. A. Baumert, O. Blanchard, S. Llose and J. F. Perkaus, (eds.),
World Resources Institute, WRI, Washington DC.
B ö hringer , C. and H. Welsch , 2004 : Contraction and Convergence of carbon emis-
sions: an intertemporal multi-region CGE analysis. Journal of Policy Modeling ,
26 :21–39.
B ö hringer , C. and A. L ö schel , 2005 : Climate Policy Beyond Kyoto: Quo Vadis? A
Computable General Equilibrium Analysis Based on Expert Judgments. KYKLOS ,
58 (4):467–493.
Bollen , J. , C , A. J. G. Manders and P. J. J. Veenendaal , 2004 : How much does a 30%
emission reduction cost? Macroeconomic effects of post-Kyoto climate policy in
2020 . Netherlands Bureau for Economic Policy Analysis, The Hague.
Bollen , J. , C. , S. Hers and v. d. B. Zwaan , 2010 : An integrated assessment
of climate change, air pollution, and energy security policy. Energy Policy ,
38 (8):4021–4030.
Bouwman , L. , T. Kram and K. Klein-Goldewijk , 2006 : Integrated Modelling
of Global Environmental Change. An Overview of IMAGE 2.4. Netherlands
Environmental Assessment Agency , Bilthoven.
BP , 2009 : Statistical Review of World Energy . BP, London, UK.
Bradshaw , J. and T. Dance , 2005 : Mapping geological storage prospectivity of CO2 for
the world’s sedimentary basins and regional source to sink matching . Proceedings
of the 7th International Conference on Greenhouse Gas Control Technologies .
Carpenter , S. and P. Pingali , 2005 : Millennium Ecosystem Assessment – Scenarios
Assessment. Island Press, Washington DC.
Clarke , L. , J. Edmonds , V. Krey , R. Richels , S. Rose and M. Tavoni , 2009 :
International climate policy architectures: Overview of the EMF 22 international
scenarios. Energy Economics , 31 (Supplement 2):S64-S81.
Coady , D. , R. Gillingham , R. Ossowski , J. Piotrowski , S. Tareq and J. Tyson , 2010 :
Petroleum Product Subsidies: Costly, Inequitable, and Rising . International
Monetary Fund (IMF).
Cofala , J. , M. Amann , Z. Klimont , K. Kupiainen and L. Hoeglund Isaksson , 2007 :
Scenarios of global anthropogenic emissions of air pollutants and methane until
2030. Atmospheric Environment , 41 (38):8486–8499.
Cofala , J. , P. Rafaj , W. Schoepp , Z. Klimont and M. Amann , 2009 : Emissions of Air
Pollutants for the World Energy Outlook 2009 Energy Scenarios . IIASA, Laxenburg.
Cofala , J. , M. Amann , W. Asman , I. Bertok , C. Heyes , L. Hoeglund Isaksson ,
Z. Klimont , W. Schoepp and F. Wagner , 2010 : Integrated assessment of air
pollution and greenhouse gases mitigation in Europe. Archives of Environmental
Protection , 36 (1):29–39.
Cohen , A. , R. Anderson , Bart Ostro , K. D. Pandey , M. Krzyzanowski , N. K ü nzli , K.
Gutschmidt , A. C. Pope III , I. Romieu , J. M. Samet and K. R. Smith , 2004 :
Urban Air Pollution. In Comparative quantifi cation of health risks:global and
regional burden of disease attributable to selected major risk factors. E. M. e. al,
(ed.), World Health Organization, Geneva pp.1353–1434.
Criqui , P. , A. Kitous , M. M. Berk , M. G. J. den Elzen , B. Eickhout , P. Lucas , D. P.
van Vuuren , N. Kouvaritakis and D. van Regemorter , 2003 : Greenhouse
gas reduction pathways in the UNFCCC Process upto 2025 – Technical Report .
CNRS-IEPE, Grenoble, France.
De , S. and M. Assadi , 2009 : Impact of cofi ring biomass with coal in power plants – A
techno-economic assessment. Biomass and Bioenergy , 33 (2):283–293.
Delucchi , M. A. and M. Z. Jacobson , 2011 : Providing all global energy with wind,
water, and solar power, Part II: Reliability, system and transmission costs, and
policies. Energy Policy .
den Elzen , M. G. J. and P. Lucas , 2005 : The FAIR model: a tool to analyse environ-
mental and costs implications of climate regimes. Environmental Modeling and
Assessment , 10 (2):115–134.
den Elzen , M. G. J. , P. Lucas and D. P. Van Vuuren , 2005 : Abatement costs of post-
Kyoto climate regimes. Energy Policy , 33 (16):2138–2151.
den Elzen , M. G. J. and M. Meinshausen , 2005 : Meeting the EU 2°C climate
target: global and regional emission implications . Netherlands Environmental
Assessment Agency (MNP), Bilthoven, the Netherlands.
Energy Pathways for Sustainable Development Chapter 17
1302
den Elzen , M. G. J. and D. P. van Vuuren , 2007 : Peaking profi les for achieving
long-term temperature targets with more likelihood at lower costs. Proceedings
of the National Academy of Sciences of the United States of America ,
104 (46):17931–17936.
Dentener , F. , J. Drevet , J. F. Lamarque , I. Bey , B. Eickhout , A. M. Fiore , D.
Hauglustaine , L. W. Horowitz , M. Krol , U. C. Kulshrestha , M. Lawrence , C.
Galy-Lacaux , S. Rast , D. Shindell , D. Stevenson , T. Van Noije , C. Atherton ,
N. Bell , D. Bergman , T. Butler , J. Cofala , B. Collins , R. Doherty , K. Ellingsen ,
J. Galloway , M. Gauss , V. Montanaro , J. F. M ü ller , G. Pitari , J. Rodriguez ,
M. Sanderson , S. Strahan , M. Schultz , F. Solmon , K. Sudo , S. Szopa and O.
Wild , 2006 : Nitrogen and sulphur deposition on regional and global scales: a
multi-model evaluation. Global Biogeochemical Cycles , GB4003 :21.
Dornburg , V. and A. P. C. Faaij , 2005 : Cost and CO2-Emission Reduction of Biomass
Cascading: Methodological Aspects and Case Study of SRF Poplar. Climatic
Change , 71 (3):373–408.
Dornburg , V. , D. van Vuuren , G. van de Ven , H. Langeveld , M. Meeusen , M.
Banse , M. van Oorschot , J. Ros , G. van den Born , H. Aiking , M. Londo ,
H. Mozaffarian , P. Verweij , E. Lysen and A. Faaij , 2010 : Bioenergy revis-
ited: Key factors in global potentials of bioenergy. Energy Environment Science ,
3 (3):258–267.
Edenhofer , O. , C. Carraro , J.-C. Hourcade , K. Neuhoff , G. Luderer , C. Flachsland ,
M. Jakob , A. Popp , J. Steckel , J. Strohschein , N. Bauer , S. Brunner , M.
Leimbach , H. Lotze-Campen , V. Bosetti , E. d. Cian , M. Tavoni , O. Sassi , H.
Waisman , R. Crassous-Doerfl er , S. Monjon , S. Dr ö ge , H. v. Essen , P. d. R í o
and A. T ü rk , 2009 : The Economics of Decarbonization – Report of the RECIPE
project. , Potsdam Institute for Climate Impact Research, Potsdam.
Edenhofer , O. , B. Knopf , T. Barker , L. Baumstark , E. Bellevrat , B. Chateau , P.
Criqui , M. Isaac , A. Kitous , S. Kypreos , M. Leimbach , K. Lessmann , B.
Magne , Å . Scrieciu , H. Turton and D. P. Van Vuuren , 2010a : The economics of
low stabilization: Model comparison of mitigation strategies and costs. Energy
Journal , 31 (Special):223–241.
Edenhofer , O. , B. Knopf , T. Barker , L. Baumstark , E. Bellevrat , B. Chateau , P.
Criqui , M. Isaac , A. Kitous , S. Kypreos , M. Leimbach , K. Lessmann , B.
Magne , Å . Scrieciu , H. Turton and D. P. Van Vuuren , 2010b : The economics of
low stabilization: Model comparison of mitigation strategies and costs. Energy
Journal 31 (Special):223–241.
Ekholm , T. , V. Krey , S. Pachauri and K. Riahi , 2010 : Determinants of household
energy consumption in India. Energy Policy , 38 (10):5696–5707.
European Commission , 2007 : Limiting Global Climate Change to 2 degrees Celsius:
The way ahead for 2020 and beyond . Communication from the Commission
to the Council, the European Parliament, the European Economic and Social
Committee and the Committee of the Regions, Brussels.
Fischedick , M. , R. Schaeffer , A. Adedoyin , M. Akai , T. Bruckner , L. Clarke , V.
Krey , I. Savolainen , S. Teske , D. Ü rge-Vorsatz , R. Wright , 2011 : Mitigation
Potential and Costs. In IPCC Special Report on Renewable Energy Sources and
Climate Change Mitigation. O. Edenhofer, R. Pichs-Madruga, Y. Sokona, K.
Seyboth, P. Matschoss, S. Kadner, T. Zwickel, P. Eickemeier, G. Hansen, S. Schl ö mer,
C. von Stechow (eds), Cambridge University Press, Cambridge, United Kingdom
and New York, NY, USA.
Fisher , B. S. , N. Nakicenovic , K. Alfsen , J. Corfee Morlot , F. de la Chesnaye , J.-
C. Hourcade , K. Jiang , M. Kainuma , E. La Rovere , A. Matysek , A. Rana , K.
Riahi , R. Richels , S. Rose , D. van Vuuren and R. Warren , 2007 : Issues related
to mitigation in the long term context. In Climate Change 2007: Mitigation.
Contribution of Working Group III to the Fourth Assessment Report of the Inter-
governmental Panel on Climate Change . B. Metz, O. R. Davidson, P. R. Bosch, R. Dave
and L. A. Meyer, (eds.), Cambridge University Press, Cambridge, UK pp.169–250.
Forest , C. E. , P. H. Stone , A. P. Sokolov , M. R. Allen and M. D. Webster , 2002 :
Quantifying uncertainties in climate system properties with the use of recent
climate observations. Science , 295 (5552):113–117.
F ø yn , T. H. Y. , K. Karlsson , O. Balyk and P. E. Grohnheit , 2011 : A global renew-
able energy system: A modelling exercise in ETSAP/TIAM. Applied Energy ,
88 (2):526–534.
Gaunt , C. T. , 2005 : Meeting electrifi cation’s social objectives in South Africa, and
implications for developing countries. Energy Policy , 33 (10):1309–1317.
Gilli , P. V. , N. Nakicenovic and R. Kurz 1995 : First- and second-law effi ciencies of
the global and regional energy systems . Preceedings of the 16th World Energy
Congress, Tokyo, Japan.
Goldemberg , J. , 2007 : Ethanol for a Sustainable Energy Future. Science ,
315 (5813):808–810.
Granier , C. , B. Bessagnet , T. Bond , A. D’Angiola , H. G. v. d. Gon , G. Frost , A.
Heil , M. Kainuma , J. Kaiser , S. Kinne , Z. Klimont , S. Kloster , J. F. Lamarque ,
C. Liousse , T. Matsui , F. Meleux , A. Mieville , T. Ohara , J. C. Raut , K. Riahi ,
M. Schultz , S. Smith , A. M. Thomson , J. v. Aardenne , G. v. d. Werf and D.
v. Vuuren , 2010 : Evolution of anthropogenic and biomass burning emissions
at global and regional scales during the 1980–2010 period. Climatic Change ,
Submitted, under review .
Greening , L. , D. L. Greene and C. Difi glio , 2000 : Energy effi ciency and consump-
tion – the rebound effect – a survey. Energy Policy , 28 (6–7):389–401.
Groenenberg , H. , K. Blok and J. P. van der Sluijs , 2004 : Global Triptych: a bot-
tom-up approach for the differentiation of commitments under the Climate
Convention. Climate Policy , 4 :153–175.
Gross , R. , P. Heptonstall , M. Leach , D. Anderson , T. Green and J. Skea , 2007 :
Renewables and the grid: understanding intermittency. Energy , 160 (1):31–41.
Grubler , A. and N. Nakicenovic , 1994 : International burden sharing in greenhouse
gas reduction . International Institute for Applied Systems Analysis (IIASA),
Laxenburg, Austria.
Grubler , A. , 2010 : The costs of the French nuclear scale-up: A case of negative learn-
ing by doing. Energy Policy , 38 (9):5174–5188.
Grubler , A. and K. Riahi , 2010 : Do governments have the right mix in their energy
R&D portfolios? Carbon Management , 1 (1):79–87.
Hanley , N. , P. G. McGregor , J. K. Swales and K. Turner , 2009 : Do increases in
energy effi ciency improve environmental quality and sustainability? Ecological
Economics , 68 (3):692–709.
Hendriks , C. , W. Graus and F. van Bergen , 2004 : Global carbon dioxide storage
potential and costs . Ecofys, Utrecht.
Hirschberg , S. , C. Bauer , P. Burgherr , R. Dones , W. Schenler , T. Bachmann and
D. Gallego Carrera , 2007 : Environmental, Economic and Social Criteria and
Indicators for Sustainability Assessment of Energy Technologies . New Energy
Externalities Developments for Sustainability (NEEDS), Rome, Italy.
H ö hne , N. , D. Phylipsen , S. Ullrich and K. Blok , 2005 : Options for the second com-
mitment period of the Kyoto Protocol, research report for the German Federal
Environmental Agency . ECOFYS Gmbh, Berlin.
H ö hne , N. , 2006 : What is Next After the Kyoto Protocol? Assessment of Options for
International Climate Policy Post 2012. Techne Press, Amsterdam.

Chapter 17 Energy Pathways for Sustainable Development
1303
Holttinen , H. , P. Meibom , A. Orths , F. van Hulle , B. Lange , A. Tiedemann , M.
O’Malley , J. Perik , B. Ummels , J. Tande , A. Estanqueiro , M. Matos , E. Gomez ,
L. Soder , G. Strbac , A. Shakoor , J. Smith and M. Milligan , 2009 : Design
and operation of power systems with large amounts of wind power: Phase one
2006–2008 . VTT Technical Research Centre of Finland, Espoo, Finland.
IEA , 2006 : World Energy Outlook 2006 . Hrsg., (ed.) International Energy Agency (IEA)
of the Organisation for Economic Co-operation and Development (OECD), Paris,
France.
IEA , 2007 : Tracking Industrial Energy Effi ciency and CO2 Emissions . International
Energy Agency (IEA), OECD, Paris, France.
IEA , 2009a : World Energy Outlook 2009 . International Energy Agency (IEA), Paris,
France.
IEA , 2009b : Energy Technology Transitions for Industry . International Energy Agency
(IEA), Paris, France.
IEA , 2010 : Energy Technology Perspectives 2010 . International Energy Agency (IEA),
Paris, France. International Energy Agency IEA, 2009: Energy Balances of Non-
OECD Countries
IPCC , 2005 : Special Report on CO 2 capture and storage . B. Metz, O. R. Davidson,
H. de Coninck and L. M. Meyer, (eds.), Intergovernmental Panel on Climate
Change (IPCC), Cambridge, UK.
IPCC , 2007 : Climate Change 2007: Impacts, Adaptation and Vulnerability Working
Group II contribution to the Fourth Assessment Report of the Intergovernmental
Panel on Climate Change (IPCC) . Intergovernmental Panel on Climate Change
(IPCC), Cambridge, UK.
Jacobson , M. Z. and M. A. Delucchi , 2011 : Providing all global energy with wind,
water, and solar power, Part I: Technologies, energy resources, quantities and
areas of infrastructure, and materials. Energy Policy , 39: 1154–1169.
Jansen , J. C. , W. G. van Arkel and M. G. Boots , 2004 : Designing indicators of long-
term energy supply security . ECN, Petten, Netherlands.
Keith , D. , M. Ha-Duong and J. Stolaroff , 2006 : Climate strategy with CO2 capture
from the air. Climatic Change , 74 (1–3):17–45.
Kemmler , A. , 2007 : Factors infl uencing household access to electricity in India.
Energy for Sustainable Development , 11 (4):13–20.
Keppo , I. , B. C. O’Neill and K. Riahi , 2007 : Probabilistic temperature change pro-
jections and energy system implications of greenhouse gas emission scenarios.
Technological Forecasting and Social Change , 74 (7):936–961.
Kinne , S. , M. Schulz , C. Textor , S. Guibert , Y. Balkanski , S. E. Bauer , T. Berntsen , T.
F. Berglen , O. Boucher , M. Chin , W. Collins , F. Dentener , T. Diehl , R. Easter ,
J. Feichter , D. Fillmore , S. Ghan , P. Ginoux , S. Gong , A. Grini , J. Hendricks ,
M. Herzog , L. Horowitz , I. Isaksen , T. Iversen , A. Kirkev å g , S. Kloster , D.
Koch , J. E. Kristjansson , M. Krol , A. Lauer , J. F. Lamarque , G. Lesins , X.
Liu , U. Lohmann , V. Montanaro , G. Myhre , J. Penner , G. Pitari , S. Reddy , O.
Seland , P. Stier , T. Takemura , and X. Tie , 2006 : An AeroCom initial assess-
ment – optical properties in aerosol component modules of global models.
Atmos. Chem. Phys. , 6 :1815–1834.
Krewitt , W. , S. Teske , S. Simon , T. Pregger , W. Graus , E. Blomen , S. Schmid and
O. Sch ä fer , 2009 : Energy [R]evolution 2008 – a sustainable world energy per-
spective. Energy Policy , 37 (12):5764–5775.
Krey , V. and K. Riahi , 2009 : Implications of delayed participation and technology
failure for the feasibility, costs, and likelihood of staying below temperature
targets – greenhouse gas mitigation scenarios for the 21st century. Energy
Economics , 31 (Supplement 2):S94-S106.
Krey , V. and L. Clarke , 2011: Role of renewable energy in climate mitigation: a syn-
thesis of recent scenarios. Climate Policy , 11 (4): 1131–1158.
Kruyt , B. , D. P. van Vuuren , H. J. M. de Vries and H. Groenenberg , 2009 : Indicators
for energy security. Energy Policy , 37 (6):2166–2181.
Kupiainen , K. and Z. Klimont , 2004 : Primary emissions of submicron and
carbonaceous particles in Europe and the potential for their control . International
Institute for Applied Systems Analysis Interim Report, Laxenburg, Austria.
Lamarque , J. F. , T. C. Bond , V. Eyring , C. Granier , A. Heil , Z. Klimont , D. Lee ,
C. Liousse , A. Mieville , B. Owen , M. G. Schultz , D. Shindell , S. J. Smith ,
E. Stehfest , J. Van Aardenne , O. R. Cooper , M. Kainuma , N. Mahowald ,
J. R. McConnell , V. Naik , K. Riahi and D. P. Van Vuuren , 2010 : Historical
(1850–2000) gridded anthropogenic and biomass burning emissions of reactive
gases and aerosols: Methodology and application. Atmospheric Chemistry and
Physics Discussions , 10 (2):4963–5019.
LBST , 2008 : European Hydrogen Energy Roadmap Hyways.
Leggett , J. , W. Pepper and R. J. Swart , 1992 : Emissions Scenarios for the IPCC:
an Update. In Climate Change 1992. The Supplementary Report to the IPCC
Scientifi c Assessment . J. T. Houghton, B. A. Callander and S. K. Varney, (eds.),
Cambridge University Press, Cambridge pp.71–95.
Luderer , G. , V. Bosetti , J. Steckel , H. Waisman , N. Bauer , E. Decian , M. Leimbach ,
O. Sassi and M. Tavoni , 2009 : The Economics of Decarbonization – Results
from the RECIPE model intercomparison. RECIPE Working Paper, Potsdam
Institute for Climate Impact Research, Potsdam.
McCollum , D. , Krey, V. , Riahi K. , 2011 : An integrated approach to energy sustain-
ability. Nature Climate Change, 1(9): 428–429.
Mechler , R. , M. Amann and W. Schoepp , 2002 : A Methodology to Estimate
Changes in Statistical Life Expectancy Due to the Control of Particulate Matter
in Air Pollution . International Institute for Applied Systems Analysis (IIASA),
Laxenburg, Austria.
Meinshausen , M. , 2006 : What Does a 2°C Target Mean for Greenhouse Gas
Concentrations? A Brief Analysis Based on Multi-Gas Emission Pathways and
Several Climate Sensitivity Uncertainty Estimates. In Avoiding Dangerous
Climate Change . H. J. Schellnhuber, W. Cramer, N. Nakicenovic, T. Wigley and G.
Yohe, (eds.), Cambridge University Press, Cambridge, UK.
Meinshausen , M. , N. Meinshausen , W. Hare , S. C. B. Raper , K. Frieler , R. Knutti ,
D. J. Frame and M. R. Allen , 2009 : Greenhouse-gas emission targets for limit-
ing global warming to 2 degrees C. Nature , 458 (7242):1158–1162.
Messner , S. and M. Strubegger , 1995 : User’s guide for MESSAGE III . IIASA,
Laxenburg, Austria.
Messner , S. and L. Schrattenholzer , 2000 : Linking an Energy Supply Model with a
Macroeconomic Model and Solving It Interactively. Energy , 25 :267–282.
Michaelowa , A. , K. Tangen and H. Hasselknippe , 2005 : Issues and Options for
the Post-2012 Climate Architecture – An Overview. International Environmental
Agreements , 5 (1):5–24.
Midilli , A. , M. Ay , I. Dincer and M. A. Rosen , 2005 : On hydrogen and hydrogen
energy strategies: I: current status and needs. Renewable and Sustainable
Energy Reviews , 9 (3):255–271.
Milligan , M. , D. J. Lew , D. Corbus , P. Piwko , N. Miller , K. Clark , G. Jordan , L.
Freeman , B. Zavadil and M. Schuerger , 2009 : Large-Scale Wind Integration
Studies in the United States: Preliminary Results . Bremen, Germany.
Modi , V. , S. McDade , D. Lallement and J. Saghir , 2005 : Energy Services for the
Millennium Development Goals . Energy Sector Management Assistance

Energy Pathways for Sustainable Development Chapter 17
1304
Programme (ESMAP), United Nations Development Programme (UNDP), UN
Millennium Project, and World Bank, New York.
Nakicenovic , N. , A. Gr ü bler , A. Inaba , S. Messner , S. Nilsson , Y. Nishimura , H.-H.
Rogner , A. Sch ä fer , L. Schrattenholzer , M. Strubegger , J. Swisher , D. Victor
and D. Wilson , 1993 : Long-term strategies for mitigating global warming.
Energy – The International Journal , 18 (5):401–609.
Nakicenovic , N. , A. Gr ü bler , H. Ishitani , T. Johansson , G. Marland , J.-R. Moreira
and H.-H. Rogner , 1996 : Energy primer. In Climate Change 1995: Impacts,
Adaptations and Mitigation of Climate Change: Scientifi c-Technical Analyses . R.
T. Watson, M. C. Zinyowera and R. H. Moss, (eds.), Contribution of Working Group
II to the Second Assessment Report of the Intergovernmental Panel on Climate
Change, Cambridge University Press, Cambridge and New York pp.77–92.
Nakicenovic , N. , A. Gr ü bler and A. McDonald , 1998 : Global energy perspectives.
Cambridge University Press, Cambridge, UK.
Nakicenovic , N. and R. Swart , (eds.), 2000 : IPCC Special Report on Emissions
Scenarios . Cambridge University Press, Cambridge.
Nakicenovic , N. and K. Riahi , 2003 : Model runs with MESSAGE in the Context
of the Further Development of the Kyoto-Protocol . IIASA, WBGU – German
Advisory Council on Global Change, Berlin.
Nakicenovic , N. , P. Kolp , K. Riahi , M. Kainuma and T. Hanaoka , 2006 : Assessment
of emissions scenarios revisited. Environmental Economics and Policy Studies ,
7 (3):137–173.
NATURALHY , 2010 : Preparing for the hydrogen economy by using existing natural
gas systems as a catalyst . Final publishable activity report, N.V. Nederlandse
Gasunie.
Nemet , G. F. , T. Holloway and P. Meier , 2010 : Implications of incorporating air
quality co benefi ts into climate change policymaking. Environmental Research
Letters , 5 (1):1–9.
O’Neill , B. C. , Dalton , M. , Fuchs , R. , Jiang , L. , Pachauri , S. , Zigovad , K. , 2010a :
Global demographic trends and future carbon emissions. Proceedings of the
National Academy of Sciences , 107 (41):17521–17526.
O’Neill , B. C. , K. Riahi , and I. Keppo , 2010b : Mitigation implications of mid- century
targets that preserve long-term climate policy options. Proceedings of the
National Academy of Sciences , 107 (3):1011–1016.
Pachauri , S. , Y. Nagai and K. Riahi , Options for and Impacts of Achieving the
Household Energy Access Challenge by 2030 . Forthcoming .
Pachauri , S. , 2007 : An Energy Analysis of Household Consumption – Changing
Patterns of Direct and Indirect Use in India. Springer , Dordrecht, Netherlands.
Pandey , R. , 2002 : Energy policy modelling: agenda for developing countries. Energy
Policy , 30 (2):97–106.
Pepper , W. , J. Leggett , R. Swart , J. Watson , J. Edmonds and I. Mintzer , 1992 :
Emission scenarios for the IPCC. An update: assumptions, methodology and
results. IPCC, Geneva, Switzerland.
Persson , T. A. , C. Azar and K. Lindgren , 2006 : Allocation of CO2 emission permits –
economic incentives for emission reductions in developing countries. Energy
Policy , In Press .
Planning Commission , 2006 : Integrated Energy Policy, Report of the Expert
Committee . Kirit Parikh Expert Committee on Integrated Energy Policy,
Government of India, Planning Commission, New Delhi.
Price , L. and A. McKane , 2009 : Policies and Measures to realize Industrial Energy
Effi ciency and mitigate Climate Change . UN Energy (UNIDO, LBNL, IAEA),
Vienna.
Rafaj , P. , S. Rao , Z. Klimont , P. Kolp and W. Sch ö pp, 2010 : Emissions of air pol-
lutants implied by global long-term energy scenarios . International Institute for
Applied Systems Analysis (IIASA), Laxenburg, Austria.
Rajagopal , D. and D. Zilberman , 2007 : Review of Environmental, Economic and
Policy Aspects of Biofuels . Sustainable Rural and Urban Development Team,
Development Research Group, The World Bank, Washington, DC.
Ramanathan , V. and Y. Xu , 2010 : The Copenhagen Accord for limiting global warm-
ing: Criteria, constraints, and available avenues. Proceedings of the National
Academy of Sciences , 107 (18):8055–8062.
Rao , S. , V. Chirkov , F. Dentener , R. Van Dingenen , S. Pachauri, P. Purohit, M.
Amann , C. Heyes , P. Kinney, P. Kolp, Z. Klimont, K. Riahi and W. Schoepp ,
2012: Environmental modeling and methods for – estimation of the global
health impacts of air pollution. Environmental Modeling and Assessment
(2012): 1–10.
Riahi , K. and R. A. Roehrl , 2000 : Greenhouse gas emissions in a dynamics-as-usual
scenario of economic and energy development. Technological Forecasting and
Social Change , 63 (2–3):175–205.
Riahi , K. , A. Gr ü bler and N. Nakicenovic , 2007 : Scenarios of long-term socio-
economic and environmental development under climate stabilization.
Technological Forecasting and Social Change , 74 (7):887–935.
Riahi , K. , S. Rao , V. Krey , C. Cho , V. Chirkov , G. Fischer , G. Kindermann ,
N. Nakicenovic and P. Rafaj , 2011 : RCP 8.5 – A scenario of comparatively high
greenhouse gas emissions. Climatic Change , 109: 33–57.
Robinson , M. S. , 1996 : Addressing some key questions on fi nance and poverty.
Journal of International Development , 8 (2):153–161.
Roehrl , R. A. and K. Riahi , 2000 : Technology dynamics and greenhouse gas emis-
sions mitigation: A cost assessment. Technological Forecasting and Social
Change , 63 (2–3):231–261.
Rogelj , J. , J. Nabel , C. Chen , W. Hare , K. Markmann , M. Meinshausen ,
M. Schaeffer , K. MacEy and N. H ö hne , 2010 : Copenhagen Accord pledges are
paltry. Nature , 464 (7292):1126–1128.
Rogner , H. H. , 1997 : An Assessment of World Hydrocarbon Resources. Annual Review
of Energy and the Environment , 22 (1):217–262.
Saygin , D. , M. Patel and D. Gielen , 2010 : Global benchmarking for the indus-
trial sector-fi rst steps in application and analysis of competitiveness . UNIDO, in
Preparation, Vienna.
Scheepers , M. J. J. , A. J. Seebregts , J. J. de Jong and J. M. Maters , 2007 : EU
Standards for Energy Security of Supply – Updates on the Crisis Capability Index
and the Supply/Demand Index Quantifi cation for EU-27 Energy Research Centre
of the Netherlands (ECN), Clingendael International Energy Programme (CIEP),
Petten.
Schwartz , P. , 1991 : The Art of the Longview: Three Global Scenarios to 2005.
Doubleday Publications , New York, NY.
Shannon , C. E. and W. Weaver , 1963 : The mathematical theory of communication.
University of Illinois Press, Urbana.
Sherif , S. A. , F. Barbir and T. N. Veziroglu , 2005 : Wind energy and the hydrogen
economy – review of the technology. Solar Energy , 78 (5):647–660.
Smith , J. B. , S. H. Schneider , M. Oppenheimerd , G. W. Yohee , W. Haref , M. D.
Mastrandreac , A. Patwardhang , I. Burtonh , J. Corfee-Morloti , C. H. D.
Magadzaj , H.-M. F ü sself , A. B. Pittockk , A. Rahmanl , A. Suarezm and J.-P.
v. Yperselen , 2009 : Assessing dangerous climate change through an update of
the Intergovernmental Panel on Climate Change (IPCC) “reasons for concern”.

Chapter 17 Energy Pathways for Sustainable Development
1305
Proceedings of the National Academy of Sciences of the United States of
America , 106 (11):4133–4137.
Smith , J. C. , M. R. Milligan , D. E.A. and B. Parsons , 2007 : Utility wind integra-
tion and operating impact state of the art. IEEE Transactions on Power Systems ,
22 (2):900–908.
Sovacool , B. and M. A. Brown , 2010 : Competing dimensions of energy security:
An international perspective. Annual Review of Environment and Resources ,
35 (1):77–108.
Sovacool , B. K. , 2009 : Rejecting renewables: The socio-technical impediments to
renewable electricity in the United States. Energy Policy , 37 (11):4500–4513.
Stevenson , D. S. e. a. , 2006 : Multi-model ensemble simulations of present-
day and near-future tropospheric ozone. Journal of Geophysical Research ,
111 (D08301):23.
Stirling , A. , 1994 : Diversity and ignorance in electricity supply investment: Addressing
the solution rather than the problem. Energy Policy , 22 (3):195–216.
Swider , D. J. , L. Beurskens , S. Davidson , J. Twidell , J. Pyrko , W. Pr ü ggler , H. Auer ,
K. Vertin and R. Skema , 2008 : Conditions and costs for renewables electricity
grid connection: Examples in Europe. Renewable Energy , 33 (8):1832–1842.
Teske , S. , T. Pregger , S. Simon , T. Naegler , W. Graus and C. Lins , 2010 : Energy [R]
evolution 2010 – a sustainable world energy outlook. Energy Effi ciency :1–25.
Textor , C. , M. Schulz , S. Guibert , S. Kinne , Y. Balkanski , S. Bauer , T. Berntsen ,
T. Berglen , O. Boucher , M. Chin , F. Dentener , T. Diehl , J. Feichter , D. Fillmore ,
P. Ginoux , S. Gong , A. Grini , J. Hendricks , L. Horowitz , P. Huang , I. S. A.
Isaksen , T. Iversen , S. Kloster , D. Koch , A. Kirkev å g , J. E. Kristjansson ,
M. Krol , A. Lauer , J. F. Lamarque , X. Liu , V. Montanaro , G. Myhre , J. E. Penner ,
G. Pitari , M. S. Reddy , Ø . Seland , P. Stier , T. Takemura , and X. Tie , 2007 :
The effect of harmonized emissions on aerosol properties in global models – an
AeroCom experiment. Atmospheric Chemistry and Physics , 7 :4489–4501.
UN DESA , 2009 : World Population Prospects: The 2008 Revision Database . Working
Paper No. ESA/P/WP.210, United Nations Department of Economic and Social
Affairs (UN DESA), New York.
UNCTAD , 2003 : World Investment Report . United Nations, New York and Geneva.
UNDP and WHO , 2009 : The Energy Access Situation in Developing Countries:
A Review Focusing on the Least Developed Countries and Sub-Saharan Africa.
United Nations Development Programme (UNDP), New York, NY, USA and the
World Health Organization (WHO), Geneva, Switzerland.
UNEP , 2010 : The Emissions Gap Report Are the Copenhagen Accord Pledges Suffi cient
to Limit Global Warming to 2° C or 1.5° C? United Nations Environment
Programme (UNEP), Nairobi, Kenya.
United Nations Conference of the Parties , 2009 : Copenhagen Accord FCCC/
CP/2009/L.7. Conference of the Parties , 7–18 December 2009, Copenhagen.
Vajjhala , S. P. and P. S. Fischbeck , 2007 : Quantifying siting diffi culty: A case study
of U.S. transmission line siting. Energy Policy , 35 (1):650–671
van der Zwaan , B. and K. Smekens , 2009 : CO 2 capture and storage with leak-
age in an energy-climate model. Environmental Modeling and Assessment ,
14 (2):135–148.
van Ruijven , B. , F. Urban , R. Benders , H. Moll , J. van der Sluijs , B. de Vries and
D. van Vuuren , 2008 : Modeling energy and development: An evaluation of
models and concepts. World Development , 36 (12):2801–2821.
van Vliet , O. P. R. , A. S. Brouwer , T. Kuramochi , M. van den Broek and A. P.
C. Faaij , 2011 : Energy use, cost and CO 2 emissions of electric cars. Journal of
Power Sources , 196(4): 2298–2310 .
van Vliet , O. P. R. , T. Kruithof and A. P. C. Faaij , 2010 : Techno-economic com-
parison of series hybrid, fuel cell and regular cars. Journal of Power Sources ,
195 (19):6570–6585.
van Vuuren , D. and K. Riahi , 2011 : The relationship between short-term emissions
and long-term concentration targets. Climatic Change , 104 (3–4):793–801.
van Vuuren , D. P. , J. Cofala , H. E. Eerens , R. Oostenrijk , C. Heyes , Z. Klimont ,
M. G. J. den Elzen and M. Amann , 2006 : Exploring the ancillary benefi ts of the
Kyoto Protocol for air pollution in Europe. Energy Policy , 34 (4):444–460.
van Vuuren , D. P. , J. van Vliet and E. Stehfest , 2009 : Future bio-energy potential
under various natural constraints. Energy Policy , 37 (11):4220–4230.
van Vuuren , D. P. , E. Bellevrat , A. Kitous and M. Isaac , 2010 : Bio-energy use and
low stabilization scenarios. The Energy Journal , 31 (Special):192–222.
Vera , I. and L. Langlois , 2007 : Energy indicators for sustainable development
Energy , 32 (6):875–882.
Verbruggen , A. and M. Al Marchohi , 2010 : Views on peak oil and its relation to
climate change policy. Energy Policy , 38 (10):5572–5581.
von Weizs ä cker , E. U. , A. B. Lovins and L. H. Lovins , 1997 : Factor Four: Doubling
Wealth – Halving Resource Use. Earthscan, London.
WBCSD/IEA , 2009 : Cement Technology Roadmap 2009: Carbon emissions reductions
up to 2050 . World Business Council for Sustainable Development (WBCSD)/
International Energy Agency (IEA), Geneva.
WHO , 2008 : The Global Burden of Disease: 2004 update . World Health Organization
(WHO).
Wigley , T. M. L. and S. C. B. Raper , 2001 : Interpretation of high projections for
global-mean warming. Science , 293 (5529):451–454.
Wilson , C. , 2009 : Meta-analysis of unit and industry level scaling dynamics in energy
technologies and climate change mitigation scenarios . International Institute for
Applied Systems Analysis (IIASA), Laxenburg, Austria.
Winkler , H. , R. Spalding-Fecher and L. Tyani , 2002 : Comparing developing coun-
tries under potential carbon allocation schemes. Climate Policy , 2 (4):303–318
(316).
Wise , M. , K. Calvin , A. Thomson , L. Clarke , B. Bond-Lamberty , R. Sands , S. J.
Smith , A. Janetos and J. Edmonds , 2009 : Implication of limiting CO 2 concen-
tration for land use and energy. Science , 29 (324:5931):1183 – 1186.
World Bank , 2008 : The Welfare Impact of Rural Electrifi cation: A Reassessment of
the Costs and Benefi ts . World Bank, Washington D.C.
Yang , C. , 2008 : Hydrogen and electricity: Parallels, interactions, and convergence.
International Journal of Hydrogen Energy , 33 (8):1977–1994.
Zeman , F. , 2007 : Energy and material balance of CO 2 capture from ambient air.
Environmental Science & Technology , 41 (21):7558–7563
Zomers , A. , 2001 : Rural Electrifi cation, Utilities’ Chafe or Challenge? Faculty of
Technology and Management, University of Twente, Enschede.