Energy Math Challenge
21
e Energy Math Challenge A group activity to enhance math skills and reinforce energy knowledge. I nt Subject Areas: Language Arts Intermediate Social Studies S ec Secondary Grade Levels: Math Elementary E lem
Transcript of Energy Math Challenge

e
Energy Math ChallengeA group activity to enhance math skills and reinforce energy knowledge.
Pri
Ele
IntSec
Subject Areas:
Language Arts
Intermediate
Social Studies
Pri
Ele
IntSec Secondary
Grade Levels:
Math
ElementaryElem

2 Energy Math Challenge
Printed on Recycled Paper
NEED Mission StatementThe mission of The NEED Project is to promote an energy conscious and educated society by creating effective networks of students, educators, business, government and community leaders to design and deliver objective, multi-sided energy education programs.
Permission to CopyNEED curriculum is available for reproduction by classroom teachers only. NEED curriculum may only be reproduced for use outside the classroom setting when express written permission is obtained in advance from The NEED Project. Permission for use can be obtained by contacting [email protected].
Teacher Advisory Board In support of NEED, the national Teacher Advisory Board (TAB) is dedicated to developing and promoting standards-based energy curriculum and training.
Energy Data Used in NEED MaterialsNEED believes in providing teachers and students with the most recently reported, available, and accurate energy data. Most statistics and data contained within this guide are derived from the U.S. Energy Information Administration. Data is compiled and updated annually where available. Where annual updates are not available, the most current, complete data year available at the time of updates is accessed and printed in NEED materials. To further research energy data, visit the EIA website at www.eia.gov.
1.800.875.5029www.NEED.org
© 2012
Teacher Advisory BoardShelly BaumannRockford, MI
Constance BeattyKankakee, IL
Amy Constant - SchottRaleigh, NC
James M. BrownSaratoga Springs, NY
Nina CorleyGalveston, TX
Regina DonourWhitesburg, KY
Linda FonnerNew Martinsville, WV
Samantha Forbes
Vienna, VA
Michelle Garlick
Bob Hodash
DaNel HoganTucson, AZ
Greg HolmanParadise, CA
Matthew InmanSpokane, WA
Barbara LazarAlbuquerque, NM
Robert LazarAlbuquerque, NM
Leslie LivelyPorters Falls, WV
Jennifer Mitchell - Winterbottom Pottstown, PA
Mollie MukhamedovPort St. Lucie, FL
Don Pruett Jr.Sumner, WA
Joanne SpazianoCranston, RI
Tom SpencerChesapeake, VA
Jennifer Trochez MacLeanLos Angeles, CA
Wayne YonkelowitzFayetteville, WV
Jen VarrellaFort Collins, CO
Robert GriegolietNaperville, IL
Erin GockelFarmington, NY
Long Grove, IL

© 2012 The NEED Project 8408 Kao Circle, Manassas, VA 20110 1.800.875.5029 www.NEED.org 3
Table of Contents �Correlations 4
�Teacher Guide 5
�Answer Key 7
�Elementary Math Challenge 8
� Intermediate Math Challenge 12
�Secondary Math Challenge 16
�Evaluation 20
Energy Math Challenge
e

4 Energy Math Challenge
Standards Correlation Informationwww.NEED.org/curriculumcorrelations
Next Generation Science Standards � This guide effectively supports many Next Generation Science Standards. This material can satisfy performance expectations, science and engineering practices, disciplinary core ideas, and cross cutting concepts within your required curriculum. For more details on these correlations, please visit NEED’s curriculum correlations website.
Common Core State Standards � This guide has been correlated to the Common Core State Standards in both language arts and mathematics. These correlations are broken down by grade level and guide title, and can be downloaded as a spreadsheet from the NEED curriculum correlations website.
Individual State Science Standards � This guide has been correlated to each state’s individual science standards. These correlations are broken down by grade level and guide title, and can be downloaded as a spreadsheet from the NEED website.

© 2012 The NEED Project P.O. Box 10101, Manassas, VA 20108 1.800.875.5029 www.NEED.org 5© 2012 The NEED Project 8408 Kao Circle, Manassas, VA 20110 1.800.875.5029 www.NEED.org 5
e Teacher GuideA group activity to enhance math skills and reinforce energy knowledge.
&BackgroundEnergy Math Challenge encourages students to problem solve in groups using current energy data.
ElementaryThere are four elementary questions for students to answer in groups of three.
Intermediate and SecondaryThe questions are organized in rounds. In the first round, students working together in small groups solve four different math problems. The same types of problems are repeated in rounds two and three. In the fourth round, groups of students solve a Mega-Question that incorporates the four skills targeted in the first three rounds.
TimeOne 60-minute class period
MaterialsElementary
�One copy of each question (pages 7-10) for each group of three students �Measuring tool for each group
Intermediate and Secondary �One set of Round 1 (page 11 or 15) and Round 2 (page 12 or 16) math problems for each group �One set of Round 3 (page 13 or 17) math problems for each student �One Mega-Question (page 14 or 18) for each group �Scrap paper �Calculators (optional)
2PreparationElementary
�Divide the class into groups of three students. Each group should have one strong math student.
�Duplicate a set of the four questions on pages 7-10 for each group.
�Decide what measuring tool you want the students to use in Problem 4. Cuisenaire rods are recommended if available.
Intermediate and Secondary �Divide students into small groups.
�Duplicate a set of questions for each group for Round 1 (page 11 or 15) and Round 2 (page 12 or 16), as well as the Mega-Question (page 14 or 18).
�Duplicate a set of questions for each student for Round 3 (page 13 or 17).
�For Rounds 1 and 2, cut each sheet into quarters. Clip together each set of four math problems for Rounds 1 and 2. Provide scrap paper for each group. Decide if you want the students to write their answers on the math problems or on scrap paper. Decide if you will allow students to use calculators.

6 Energy Math Challenge
ProcedureElementaryPlace students in groups of three and give them one question at a time, or one question a day for four days. For Problem 4, explain the method of measurement before the students begin. Discuss each question with the students after completion.
Intermediate and SecondaryOnce students are in their groups, give each group a set of the Round 1 problems. Begin the activity by giving the groups the following instructions:
I have given each group four Energy Math Challenge problems for Round 1. Each of the four problems will require your group to use a different problem solving skill. I will review the math problems with you after each of the four rounds. Your group will receive 10 points for each problem solved correctly during Round 1. In Round 2, each problem will be worth 15 points, and in Round 3, each problem will be worth 20 points. Groups can receive 100 points in the final round.
Round 1 will last 10 minutes. Round 2 will last eight minutes, and Round 3 will last 10 minutes. Before we start the third round, I will give your group 10 minutes to review the problems from the first two rounds. During this study session, make sure everyone knows how to do all four types of problems correctly.
In the third round, every student must solve the four problems independently, with no help from his or her group members. Therefore, it is important that your group works together during Rounds 1 and 2 and during the study session. The group’s average score in the third round will be added to the points earned in the previous two rounds.
In the fourth round, you will work as a group to solve a Mega-Question using the math skills you concentrated on in the first three rounds. Your group will have 15 to 20 minutes to solve the Mega-Question.
Let’s review some energy unit terms before we begin.
Btu One British thermal unit is the heat energy needed to raise the temperature of one pound of water one degree Fahrenheit. A single Btu is quite small. A wooden kitchen match, if allowed to burn completely, would give off one Btu of energy. Every day, the average American uses 844,000 Btu to energy.
MBtu An MBtu is equal to one million (1,000,000) Btu. The average American family consumes 983 MBtu of energy a year.
Quad Quads are used to measure very large quantities of energy. A quad is equal to one quadrillion (1,000,000,000,000,000) Btu. The United States uses about one quad of energy every 3.75 days.
kWh A kilowatt-hour is the amount of electricity used in one hour at a rate of 1,000 watts. Just as we buy gasoline in gallons and wood in cords, we buy electricity in kilowatt-hours. Utility companies charge their customers for the kilowatt-hours they use during a month. The average monthly electricity use in the United States is 908 kWh.
bkWh A bkWh is one billion (1,000,000,000) kilowatt-hours. The U.S. consumes over 4,000 billion kilowatt-hours (bkWh) of electricity a year.

© 2012 The NEED Project 8408 Kao Circle, Manassas, VA 20110 1.800.875.5029 www.NEED.org 7
e Answer Key
Elementary Answers
1 2 3 4 5 Bonus
Problem 1 Petroleum 8% 92% 83% 92% —
Problem 2 Jan 11 Apr 11 Aug 10 100 kWh 12,000 kWh —
Problem 3 Hybrid Midsize Pick-Up 70 mi 81 mi 2 gal 500 miles
Problem 4 3 gal 3 gal 3 gal No, it needs 8 gal 4 gal 6.5 gal
Intermediate AnswersRound 1: 1. 420 MBtu 2. 1/15
3. 9.6 MBD 4. 19.6%
Round 2: 1. 16.2 quads 2. 3/20
3. 810 liters 4. 4.4%
Round 3: 1. 364.25 million barrels 2. 1/20
3. 1.20 Q 4. 46.2%
Mega-Question: The totals for the 2010 list: Renewable—8 quads, Nonrenewable—89.8 quads, and Total—97.8 quads. The total for the 2035 list is 117.5 quads. There are no right or wrong answers for the 2035 pie chart as long as the numbers add up to 117.5 quads.
Secondary AnswersRound 1: 1.19.6% 2. 65 million units
3. 840 units 4. 981 bkWh
Round 2: 1. 42% 2. 7.8 quads
3. 425 million barrels 4. 4.4 quads
Round 3: 1. 36% 2. 442 MBtu
3. 0.65 bkWh 4. 1.99 or 2 quads
Mega-Question: The total for the 2035 list of sources is 117.5 quads. There are no right or wrong answers for the 2035 pie chart as long as the numbers add up to 100%.
Uranium
Biomass
Hydropower
PropaneOther
Petroleum
Coal Natural Gas

8 Energy Math Challenge
e Problem 1: Energy Source Use Circle Graph
DirectionsUsing the data below, label the sections of the circle graph.
DirectionsUsing the graph and what you know about energy sources, answer these questions.
1. Which energy source provides the most energy?
2. What percentage are renewable energy sources?
3. What percentage are nonrenewable energy sources?
4. What percentage of the energy sources are fossil fuels?
5. What percentage of the energy sources are found underground?
Petroleum 35%Natural Gas 25%Coal 21%Uranium 9%Biomass 4%Hydropower 3%Propane 2%Other
(Solar, Wind, Geothermal)1%

© 2012 The NEED Project 8408 Kao Circle, Manassas, VA 20110 1.800.875.5029 www.NEED.org 9
e Problem 2: Electricity Use Chart
This is a graph of the Smith Family’s electricity use for 2010 and part of 2011 by month. The Smiths have an all-electric house.
DirectionsUsing the graph, answer these questions.
1. In what month and year did the family use the most electricity?
2. In what month and year did the family use the least electricity?
3. What summer month and year do you think was the hottest?
4. How much more electricity did the family use in Jan. 2011 than in Jan. 2010?
5. How many kWh of electricity did the family use in 2010?
0
400
200
600
800
1000
1200
1400
Jan-
10
Feb-
10
Mar
-10
May
-10
Jun-
10
Jul-1
0
Aug-
10
Sep-
10
Oct
-10
Nov
-10
Dec
-10
Jan-
11
Feb-
11
Mar
-11
Apr
-11
Months
kWh
of E
lect
ricity
Apr
-10

10 Energy Math Challenge
e Problem 3: Fuel Economy Chart
This is a graph of the best gasoline mileage of different types of cars.
DirectionsUsing the graph, answer these questions.
1. What type of car gets the most miles per gallon?
2. What type of car gets the fewest miles per gallon?
3. How many miles can a compact car travel on two gallons of gasoline?
4. How many miles can a large car travel on three gallons of gasoline?
5. If a midsize car travels 60 miles, how many gallons of gas will it use?
BONUS: If the gas tank of a minivan can hold 20 gallons of gas, how far can it travel on a full tank of gasoline?
0
10
5
15
25
35
45
20
30
40
50
Types of Cars
Mile
s pe
r Gal
lon
Subc
ompa
ct C
ar
Hyb
rid C
ompa
ct C
ar
Com
pact
Car
Hyb
rid M
idsi
ze C
ar
Mid
size
Car
Larg
e Ca
r
Mid
size
Sta
tion
Wag
on
Min
ivan
Hyb
rid S
port
Util
ity
Vehi
cle
Spor
t Util
ity V
ehic
le
Hyb
rid P
ick-
Up
Truc
k
Pick
-Up
Truc
k

© 2012 The NEED Project 8408 Kao Circle, Manassas, VA 20110 1.800.875.5029 www.NEED.org 11
e Problem 4: All Around the County
Below is a map of your county and three vehicles that can travel the distance shown on 1 gallon of gas.
DirectionsUsing the graph, answer these questions.
1. How many gallons of gas will the truck use to go from the school to the ski lodge?
2. How many gallons of gas will the car use to go from the ski lodge to your home?
3. How many gallons of gas will the van use to go from your home to the campground?
4. Can a truck go from your home to your cousin’s home on six gallons of gas?
5. How many gallons of gas will the van use to go from the fair grounds to the lake, then back to the fair grounds?
BONUS: How much gas would the car use to go to every place in the county?
* * *
* *
Your Home School
Campground
Ski Lodge
Cousin’s Home
Lake
Fair Grounds
*
*
Truck Van Car
12 Energy Math Challenge
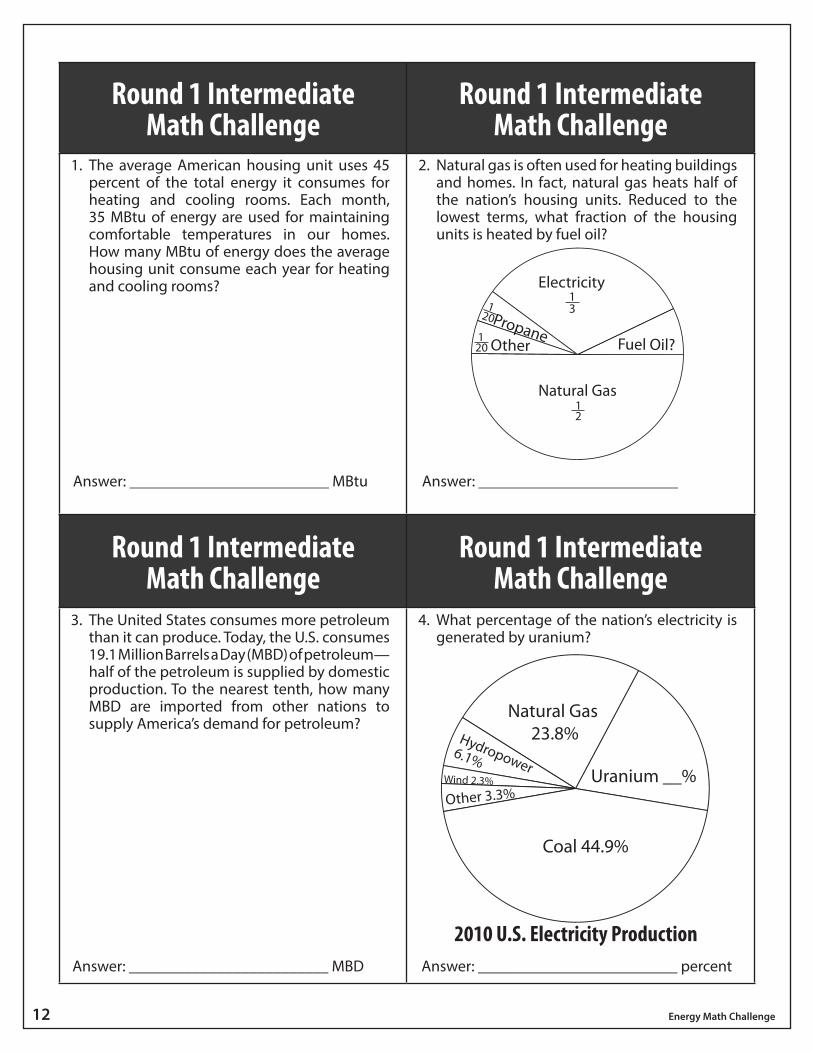
Round 1 Intermediate Math Challenge
Round 1 Intermediate Math Challenge
1. The average American housing unit uses 45 percent of the total energy it consumes for heating and cooling rooms. Each month, 35 MBtu of energy are used for maintaining comfortable temperatures in our homes. How many MBtu of energy does the average housing unit consume each year for heating and cooling rooms?
2. Natural gas is often used for heating buildings and homes. In fact, natural gas heats half of the nation’s housing units. Reduced to the lowest terms, what fraction of the housing units is heated by fuel oil?
Round 1 Intermediate Math Challenge
Round 1 Intermediate Math Challenge
3. The United States consumes more petroleum than it can produce. Today, the U.S. consumes 19.1 Million Barrels a Day (MBD) of petroleum—half of the petroleum is supplied by domestic production. To the nearest tenth, how many MBD are imported from other nations to supply America’s demand for petroleum?
4. What percentage of the nation’s electricity is generated by uranium?
Answer: _________________________ MBtu Answer: _________________________
Answer: _________________________ MBD Answer: _________________________ percent
Natural Gas
Electricity
Other
13
12
Propane
120
120 Fuel Oil?
Coal 44.9%
Uranium __%
Natural Gas 23.8%Hydropower
6.1%Wind 2.3%
Other 3.3%
2010 U.S. Electricity Production

© 2012 The NEED Project 8408 Kao Circle, Manassas, VA 20110 1.800.875.5029 www.NEED.org 13
Round 2 Intermediate Math Challenge
Round 2 Intermediate Math Challenge
1. Hydropower is a renewable source of energy. Hydropower provided 3.3 percent of the 98 quads of energy we consumed in 2010. Energy experts predict hydropower production will remain relatively constant during the next five years. How many total quads of energy will hydropower provide the nation during the next five years?
2. Renewables provide the nation with about eight percent of the energy the U.S. consumes. The use of renewable energy sources to generate electricity accounts for half of their use. Reduced to the lowest terms, what fraction of the nation’s renewables is used for transportation?
Round 2 Intermediate Math Challenge
Round 2 Intermediate Math Challenge
3. Propane is 270 times more compact in its liquid state than it is as a gas. This makes propane a very portable source of heat energy. How many liters of propane gas would a three liter pressurized tank hold for your next camping trip?
4. From the graph, what percentage of total energy consumption is provided by biomass?
Answer: _________________________ quads Answer: _________________________
Answer: _________________________ liters Answer: _________________________
Industry
Electricity Production
14
Transportation
Home &Commerce
?
12
110
Petroleum35.1%
Natural Gas25.2%
Coal21.3% Uranium
8.6% Hydropower 2.6%Biomass ?
Propane 1.6%
Solar, Wind, Geothermal& Other 1.2%

14 Energy Math Challenge
Round 3 Intermediate Math Challenge
Round 3 Intermediate Math Challenge
1. The United States imports about half of its petroleum from other countries. The average daily import is 11.75 million barrels. How many barrels of petroleum would the nation import during the month of March?
2. Coal generates almost half the nation’s electricity. Uranium, hydropower, and natural gas produce significant amounts, too. Reduced to the lowest terms, what fraction of electricity is provided by the other energy sources?
Round 3 Intermediate Math Challenge
Round 3 Intermediate Math Challenge
3. About 6/7 of the energy given off by the splitting of uranium atoms is due to the motion of the splitting atoms. The other 1/7 of the heat energy is a result of the radiation released. Uranium provides the nation with 8.44 quads of energy a year. How many quads of energy are the result of the radiation released by the splitting uranium atoms?
4. From the graph, what percentage of the nation’s consumption of biomass energy is provided by wood and wood waste?
Answer: _________________________ barrels Answer: _________________________
Answer: _________________________ quads Answer: _________________________ percent
Uranium
Coal
Hydropower
Natural Gas
Other ?
920
15
730
115
Biofuels43.2%
Garbage & Farm Waste
Wood & Wood Waste
10.6%

© 2012 The NEED Project 8408 Kao Circle, Manassas, VA 20110 1.800.875.5029 www.NEED.org 15
Almost all the energy we use in the United States comes from nonrenewable energy sources. Using the circle graph below, determine how many total quads of energy we used in 2010, and how many quads are provided by renewable and nonrenewable sources. Write your answers in the spaces below.
By 2035, experts predict that the United States will use 20 percent more energy than we did in 2010. Calculate how many total quads of energy the United States will use and write it in the space below.
Will we use the same sources to provide that energy or will we use different sources? As a team, discuss how the energy picture will change by 2035. Fill in the blank circle graph using your team’s predictions. The blank circle graph is 20 percent larger to show you what this increase looks like. How many quads of renewable energy do you think we will use? How many quads of nonrenewable energy? Add up the figures on your graph and fill in the total amounts.
2010 Consumption
2035 Consumption
e Math ChallengeMega-Question Intermediate
2010
Renewable: quads
Nonrenewable: quads
Total energy use: quads
2035
Renewable: quads
Nonrenewable: quads
Total energy use: quads
Petroleum34.4 Q
Natural Gas24.6 Q
Coal20.8 Q
Uranium 8.4 Q
Hydropower 2.5 Q
Biomass 4.3 Q
Propane 1.6 QSolar, Wind, Geothermal& Other 1.2 Q

16 Energy Math Challenge
Round 1 SecondaryMath Challenge
Round 1 Secondary Math Challenge
1. The United States consumes about 4,120 billion kilowatt-hours (bkWh) of electricity a year. Uranium fuels about 807 bkWh of this electrical power generation. To the nearest tenth of a percent, calculate the percentage of the nation’s electricity that is generated by uranium in nuclear power plants.
2. Approximately 57% of the nation’s 114 million housing units are heated by natural gas. To the nearest million, how many housing units in the nation are heated by natural gas?
Round 1 Secondary Math Challenge
Round 1 Secondary Math Challenge
3. Today’s power plants convert about one-third of the energy stored in fuels into electricity. During these conversions, most of the energy is transformed into heat rather than electricity. A certain electric power plant consumes 360 units of energy every day. How many units of electricity would the plant actually generate in a week?
4. The U.S. consumes about 4,120 billion kilowatt-hours (bkWh) of electricity a year. To the nearest bkWh, how many billion kilowatt-hours of electricity does natural gas provide?
Answer: _________________________ percent Answer: _________________________ units
Answer: _________________________ units Answer: _________________________ bkWh
Coal 44.9%
Natural Gas23.8%
Other 3.3%
Hydropower 6.1%
Wind 2.3%
Uranium 19.6%
2010 U.S. Electricity Production

© 2012 The NEED Project 8408 Kao Circle, Manassas, VA 20110 1.800.875.5029 www.NEED.org 17
Round 2 Secondary Math Challenge
Round 2 Secondary Math Challenge
1. The United States consumes about 19.1 million barrels of petroleum a day. Gasoline, the number one product produced by the refining of petroleum, consumes 8.0 million barrels of the petroleum. To the nearest percent, calculate the percentage of petroleum that is refined into gasoline.
2. Hydropower, biomass, wind, and solar energy are all a result of the sun’s rays striking the Earth. Geothermal energy, which provides 2.6 percent of the nation’s renewable energy, is the only renewable source resulting from energy found below the Earth’s surface. All five renewable sources of energy provide the nation with about 8 quads of energy. To the nearest tenth of a quad, how many quads of energy are a result of the sun’s rays striking the Earth’s surface?
Round 2 Secondary Math Challenge
Round 2 Secondary Math Challenge
3. A 42 gallon barrel of petroleum is refined into kerosene, jet fuel, heating oil, and gasoline (the number one product). About 19.4 gallons per barrel are refined into gasoline. A tanker containing 920 million barrels of petroleum has unloaded its cargo at the refinery. To the nearest million, how many barrels of petroleum from the tanker will be refined into gasoline?
4. The U.S. consumes about 98 quads of energy a year. How many quads of energy does biomass provide the United States?
Answer: _________________________ percent Answer: _________________________quads
Answer: _________________________ barrels Answer: _________________________ quads
Petroleum35.1%
Natural Gas25.2%
Coal21.3% Uranium
8.6% Hydropower 2.6%Biomass ?Propane 1.6%Solar, Wind, Geothermal& Other 1.2%

18 Energy Math Challenge
Round 3 Secondary Math Challenge
Round 3 Secondary Math Challenge
1. To generate electricity, a fossil fuel power plant consumes 72 units of chemical energy stored in the fossil fuel. Only 26 units of electrical energy are actually produced and sent out over the transmission lines. This loss occurs because a large amount of the energy stored in a fossil fuel is changed into thermal (heat) energy during the generation of electrical power. To the nearest whole percent, calculate the efficiency of this power plant at converting chemical energy into electrical energy.
2. The average American family consumes approximately 983 million Btu (MBtu) of energy a year. Heating and cooling rooms accounts for 54 percent of total household energy use, operating appliances and lights accounts for 37 percent, and heating water accounts for 18 percent. To the nearest MBtu, how many MBtu of energy are consumed by the average household for heating and cooling rooms in one year?
Round 3 Secondary Math Challenge
Round 3 Secondary Math Challenge
3. When uranium atoms are split, they give off heat. This heat produces high pressure steam that turns a turbine in a nuclear power plant. Each year, the nation’s 104 nuclear reactors generate about 807 bkWh of electricity—20 percent of total U.S. electricity production. To the nearest hundredth of a bkWh, how many bkWh of electricity does the average U.S. nuclear reactor generate a month?
4. Biomass provides the nation with 4.3 quads of energy. How many quads of biomass energy are provided by wood and wood waste?
Answer: _________________________ percent Answer: _________________________MBtu
Answer: _________________________ bkWh Answer: _________________________quads
Biofuels43.2%
Garbage & Farm Waste
Wood & Wood Waste
10.6%

© 2012 The NEED Project 8408 Kao Circle, Manassas, VA 20110 1.800.875.5029 www.NEED.org 19
e Math ChallengeMega-Question Secondary
Energy experts predict the nation’s total annual energy use will increase by 20 percent by the year 2035. Which energy sources will provide that additional energy? Will all of them change at the same rate as consumption, or will some sources increase more, while others remain unchanged? Some sources may even decline in consumption.
Below is a circle graph showing the contribution each of the energy sources provided the nation in 2010. As a team, discuss what role each of the sources will play in 2035. After your discussion, complete the blank 2035 circle graph. To show you what 20 percent more looks like, the 2035 blank circle graph is 20 percent larger than the circle from 2010. Make sure you include your reasons for selecting the number of quads each source will provide in 2035.
2010 Consumption
2035 Consumption
1. Petroleum 34.49 quads2. Natural Gas 24.46 quads3. Coal 20.84 quads4. Uranium 8.44 quads5. Biomass 4.30 quads6. Hydropower 2.51 quads7. Propane 1.60 quads8. Other 1.23 quads
TOTAL 97.92 quads
Petroleum35.1%
Natural Gas25.2%
Coal21.3%
Uranium 8.6%
Hydropower 2.6%
Biomass 4.4%
Propane 1.6%
Solar, Wind, Geothermal& Other 1.2%
1. quads2. quads3. quads4. quads5. quads6. quads7. quads8. quads
TOTAL quads

20 Energy Math Challenge
State: ___________ Grade Level: ___________ Number of Students: __________
1. Did you conduct the entire unit? Yes No
2. Were the instructions clear and easy to follow? Yes No
3. Did the activities meet your academic objectives? Yes No
4. Were the activities age appropriate? Yes No
5. Were the allotted times sufficient to conduct the activities? Yes No
6. Were the activities easy to use? Yes No
7. Was the preparation required acceptable for the activities? Yes No
8. Were the students interested and motivated? Yes No
9. Was the energy knowledge content age appropriate? Yes No
10. Would you teach this unit again? Yes No Please explain any “no” statements below
How would you rate the unit overall? excellent good fair poor
How would your students rate the unit overall? excellent good fair poor
What would make the unit more useful to you?
Other Comments:
Please fax or mail to:
Energy Math ChallengeEvaluation Form
The NEED Project8408 Kao Circle Manassas, VA 20110 FAX: 1-800-847-1820
e

National Sponsors and Partners
Air Equipment Company
Albuquerque Public Schools
American Electric Power
Arizona Public Service
Armstrong Energy Corporation
Barnstable County, Massachusetts
Robert L. Bayless, Producer, LLC
BP America Inc.
Bellefonte Area School District
Blue Grass Energy
Boys and Girls Club of Palm Beach County
Cape Light Compact–Massachusetts
Central Falls School District
Chugach Electric Association, Inc.
Citgo
Clean Energy Collective
Columbia Gas of Massachusetts
ComEd
ConEdison Solutions
ConocoPhillips
Constellation
David Petroleum Corporation
Desk and Derrick of Roswell, NM
Direct Energy
Dominion
Dominion Nuclear
Donors Choose
Duke Energy
East Kentucky Power
Elba Liquifaction Company
E.M.G. Oil Properties
Encana Cares Foundation
Energy Future Holdings
Energy Market Authority – Singapore
Escambia County Public School Foundation
Eversource
Exelon Foundation
First Roswell Company
Foundation for Environmental Education
FPL
The Franklin Institute
Government of Thailand–Energy Ministry
Green Power EMC
Guilford County Schools – North Carolina
Gulf Power
Gerald Harrington, Geologist
Harvard Petroleum
Hawaii Energy
Houston Museum of Natural Science
Idaho National Laboratory
Illinois Clean Energy Community Foundation
Independent Petroleum Association of New Mexico
James Madison University
Kentucky Department of Energy Development and Independence
Kentucky Power – An AEP Company
Kentucky Utilities Company
Kinder Morgan
Leidos
Linn County Rural Electric Cooperative
Llano Land and Exploration
Louisville Gas and Electric Company
Massachusetts Division of Energy Resources
Mississippi Development Authority–Energy Division
Mojave Environmental Education Consortium
Mojave Uni�ed School District
Montana Energy Education Council
The Mountain Institute
National Fuel
National Grid
National Hydropower Association
National Ocean Industries Association
National Renewable Energy Laboratory
New Mexico Oil Corporation
New Mexico Landman’s Association
NextEra Energy Resources
NEXTracker
Nicor Gas
Nisource Charitable Foundation
Noble Energy
Nolin Rural Electric Cooperative
Northern Rivers Family Services
North Carolina Department of Environmental Quality
North Shore Gas
NRG Energy, Inc.
NRG Battle of the Regions Donors
O�shore Technology Conference
Ohio Energy Project
Opterra Energy
Paci�c Gas and Electric Company
PECO
Pecos Valley Energy Committee
Peoples Gas
Pepco
Petroleum Equipment and Services Association
Phillips 66
PNM
Providence Public Schools
Read & Stevens, Inc.
Renewable Energy Alaska Project
Rhode Island O�ce of Energy Resources
Robert Armstrong
Roswell Geological Society
Salt River Project
Salt River Rural Electric Cooperative
Saudi Aramco
Schlumberger
C.T. Seaver Trust
Secure Futures
Shell
Shell Chemicals
Sigora Solar
Society of Petroleum Engineers
Society of Petroleum Engineers – Middle East, North Africa and South Asia
Solar City
David Sorenson
Tennessee Department of Economic and Community Development–Energy Division
Tesoro Foundation
Tri-State Generation and Transmission
TXU Energy
United Way of Greater Philadelphia and Southern New Jersey
University of North Carolina
University of Tennessee
U.S. Department of Energy
U.S. Department of Energy–O�ce of Energy E�ciency and Renewable Energy
U.S. Department of Energy–Wind for Schools
U.S. Energy Information Administration
Yates Petroleum Corporation
©2016 The NEED Project 8408 Kao Circle, Manassas, VA 20110 1.800.875.5029 www.NEED.org