Energy Harvesting with Solar Cells for Wireless Alarm ... document/5412_full... · An energy...
73
Industrial Electrical Engineering and Automation CODEN:LUTEDX/(TEIE-5412)/1-72(2018) Energy Harvesting with Solar Cells for Wireless Alarm Nodes Tobias Olofsson Division of Industrial Electrical Engineering and Automation Faculty of Engineering, Lund University
Transcript of Energy Harvesting with Solar Cells for Wireless Alarm ... document/5412_full... · An energy...

Ind
ust
rial E
lectr
ical En
gin
eerin
g a
nd
A
uto
matio
n
CODEN:LUTEDX/(TEIE-5412)/1-72(2018)
Energy Harvesting with Solar Cells for Wireless Alarm Nodes
Tobias Olofsson
Division of Industrial Electrical Engineering and Automation Faculty of Engineering, Lund University


Energy Harvesting with Solar Cells for Wireless Alarm Nodes
Tobias Olofsson
Division of Industrial Electrical Engineering and Automation
Faculty of Engineering
Lund University
2018
Supervisor: Gunnar Lindstedt
Assisting supervisor: Jonas Johannesson
Examiner: Johan Björnstedt


Abstract The power consumption of electronic devices is decreasing at the same time as the performance of
solar cells is increasing. Solar cells based on new technologies with lower costs are becoming
commercially available, creating new opportunities for use in small electronic products. The concept
of capturing ambient energy, such as light, and using it to power small electronic devices is known as
energy harvesting. Modern home alarm systems consist of wireless nodes with different power
requirements and which are placed in different locations with different light conditions. One
common wireless alarm node is the magnet contact, which is often placed on windows or on doors.
The window location is very interesting as it provides good conditions for harvesting energy with
solar cells.
This thesis investigates the three subsystems which are typically part of an energy harvesting system;
solar cells, energy storage and power electronics. Different options for the three subsystems are
considered and compared keeping the application in mind, harvesting energy for wireless alarm
nodes. The literature studies are complemented by investigations of the market to get a rough
estimate of the cost of each system. Measurements on three types of solar cells are made both in a
home environment and in a lab environment to estimate the amount of energy that can be
harvested in natural and artificial light. Finally, the concept of harvesting energy with solar cells for
wireless alarm nodes is demonstrated by building a prototype for the magnet contact alarm node.
The result from the investigation shows that there are many ways to design an energy harvesting
system, and that the solution very much depends on the maximum acceptable cost. The functionality
of the prototype is demonstrated, although further tests are required to assess the year-round
behavior.
Sammanfattning Energiförbrukningen i elektronikprodukter minskar samtidigt som prestandan för solceller hela tiden
ökar. Nya solcellstyper med lägre priser skapar nya möjligheter för använding även i små
elektronikprodukter. Att samla energi från omgivningen, t.ex. från ljuset i ett rum, och använda det
för att driva små elektronikprodukter kallas i ett vidare begrepp för ”energy harvesting” (SV:
energiskördning). Moderna larmsystem består av trådlösa larmnoder, med olika energiförbrukning,
som installeras på olika platser med olika ljusförhållanden. En vanligt förekommande trådlös larmnod
är magnetkontakten, vilken ofta installeras i fönster och på dörrar. Fönsterläget är särskillt intressant
eftersom där finns goda ljusförhållanden, vilket ökar potentialen i användning av solceller.
Denna avhandling behandlar de tre delsystemen som typiskt ingår i ett ”energy harvesting”-system;
solceller, batterier och kraftelektronik. Olika alternativ för de tre delsystemen övervägs och jämförs,
med applikation för trådlösa larmnoder i åtanke. Litteraturstudier kompletteras med undersökningar
av marknaden för att estimera vad de olika systemen kan kosta. Mätningar på tre typer av solceller
görs både i hemmiljö och i labbmiljö för att estimera hur mycket energi som kan skördas i naturligt
och artificiellt ljus. Slutligen demonstreras konceptet av att skörda energi till larmnoder genom att
bygga en prototyp för magnetkontakten.
Resultatet från undersökningen visar att det går att bygga ett ”energy-harvesting”-system på många
sätt och att valet av lösning starkt beror på hur mycket lösningen får kosta. Funktionaliteten av
prototypen demonstreras, men fortsatta tester krävs för att avgöra hur den beter sig året runt.


Abbreviations AM1.5 = air mass 1.5
AREF = analog reference
a-Si = amorphous silicon
CAD = computer-aided design
CCCV = constant current constant voltage
CdTe = cadmium telluride
CFL = compact fluorescent lamp
CIGS = copper indium gallium selenide
c-Si = crystalline silicon
DC = direct current
DoD = depth of discharge
DSSC = dye-sensitized solar cell
EDLC = electrochemical double-layer capacitor
ESR = equivalent series resistance
F.OCV = fractional open-circuit voltage
GaAs = gallium arsenide
IC = integrated circuit
IR = infrared
I-V = current-voltage
ku = 1000 units
LED = light-emitting diode
Li-ion = lithium-ion
low-E = low emissivity
MPP = maximum power point
MPPT = maximum power point tracking
NiMH = nickel metal hydride
NREL = National Renewable Energy Laboratory
OCV = open-circuit voltage
OSC = organic solar cell

PC = personal computer
PCB = printed circuit board
PSC = perovskite solar cell
QDSC = quantum dot solar cell
SCC = short-circuit current
SMHI = Swedish Meteorological and Hydrological Institute
STC = standard test conditions
USB = universal serial bus
UV = ultraviolet

Table of Contents
1 Introduction ..................................................................................................................................... 1
1.1 Background .............................................................................................................................. 1
1.2 Problem formulation ............................................................................................................... 1
1.3 Limitations ............................................................................................................................... 1
1.4 Report outline.......................................................................................................................... 1
2 Method ............................................................................................................................................ 3
3 Solar cells ......................................................................................................................................... 4
3.1 Basic operation ........................................................................................................................ 4
3.2 Light ......................................................................................................................................... 6
3.2.1 Light sources .................................................................................................................... 6
3.2.2 Predicting solar cell output power by measuring light ................................................... 8
3.3 Solar cell technologies ............................................................................................................. 9
3.3.1 Crystalline silicon (c-Si) .................................................................................................. 10
3.3.2 Amorphous silicon (a-Si) ................................................................................................ 10
3.3.3 Organic (OSC)................................................................................................................. 11
3.3.4 Dye-sensitized (DSSC) .................................................................................................... 11
3.3.5 Market investigation ..................................................................................................... 12
4 Energy storage ............................................................................................................................... 14
4.1 Requirements ........................................................................................................................ 14
4.2 Types of storage .................................................................................................................... 14
4.2.1 Capacitors ...................................................................................................................... 14
4.2.2 Supercapacitors ............................................................................................................. 15
4.2.3 Rechargeable batteries .................................................................................................. 16
4.2.4 Market investigation ..................................................................................................... 17
5 Power electronics .......................................................................................................................... 20
5.1 Maximum power point tracking ............................................................................................ 20
5.2 Energy harvesting chips ......................................................................................................... 21
5.2.1 bq255XX series from Texas Instruments ....................................................................... 21
5.2.2 Market investigation ..................................................................................................... 21
5.3 Solutions without MPPT ........................................................................................................ 22
6 Measurements .............................................................................................................................. 24
6.1 Solar cell modules for evaluation .......................................................................................... 24
6.2 Measurements in home environment .................................................................................. 24

6.2.1 Window location ........................................................................................................... 25
6.2.2 Front door location ........................................................................................................ 27
6.2.3 Comparison of sunny and cloudy day ........................................................................... 29
6.3 Measurements in lab environment ....................................................................................... 32
6.3.1 Performance in artificial light ........................................................................................ 32
7 Prototype ....................................................................................................................................... 35
7.1 Magnet contact ..................................................................................................................... 35
7.2 Solar cell module ................................................................................................................... 36
7.2.1 Energy harvestable in natural light ............................................................................... 37
7.2.2 Energy harvestable in artificial light .............................................................................. 38
7.3 Energy storage ....................................................................................................................... 38
7.4 Power electronics .................................................................................................................. 38
7.5 PCB design ............................................................................................................................. 39
7.6 Estimation of cost .................................................................................................................. 40
7.7 Results ................................................................................................................................... 42
8 Discussion ...................................................................................................................................... 45
8.1 Solar cell technologies ........................................................................................................... 45
8.2 Energy storage ....................................................................................................................... 45
8.3 Power electronics .................................................................................................................. 46
8.4 Measurements ...................................................................................................................... 47
8.5 Prototype ............................................................................................................................... 48
8.6 Prolonging battery life ........................................................................................................... 49
9 Conclusions and future work ......................................................................................................... 50
Acknowledgements ............................................................................................................................... 51
References ............................................................................................................................................. 52
Appendix A: Portable setup for measuring I-V curves .......................................................................... 57
Appendix B: Schematic and layout of the prototype board .................................................................. 59
Appendix C: Energy harvestable for magnet contact ............................................................................ 61

1
1 INTRODUCTION
1.1 BACKGROUND Modern home alarm systems consist of wireless alarm nodes with different functionality and power
demands installed at different locations throughout the house. Most of the alarm nodes are powered
by batteries while the alarm panel of the system is often powered with the help of a wall adapter.
With the decreasing power consumption of electronics and the decreasing price and increasing
capabilities of solar cells, it is interesting to investigate what energy harvesting can do for wireless
alarm nodes and if it can reduce the need for batteries.
1.2 PROBLEM FORMULATION The main goal of this thesis is to investigate the possibilities of using solar cells to power wireless
alarm nodes. The concept is demonstrated by building a prototype of an alarm node powered by
solar cells.
The following questions are treated:
1. Available energy: How much energy can be harvested at locations typical for the wireless
alarm nodes?
2. Solar cells: How does different solar cells compare with respect to relevant parameters such
as efficiency and price?
3. Power electronics: What power electronics is required to make the energy harvesting
solution efficient and what are the consequences in cost?
4. Energy storage: Which types of storage can be used for storing the harvested energy and
how do they compare?
5. Prolonged battery life: How can energy harvesting with solar cells be used to prolong the
battery life of primary batteries (non-rechargeable batteries)?
1.3 LIMITATIONS The investigation of available energy is focused around the typical locations for the magnet contact
alarm node and is therefore limited to windows and doors (a “magnet contact” is an alarm sensor
that is normally put on windows and doors). The measurements are limited to the geographical
location of southern Sweden.
The work is focused on the electrical aspects of using solar cells for energy harvesting, and less
focused on topics such as mechanical integration and design.
The prototype energy harvesting system designed in this thesis includes the use of primary batteries
(non-rechargeable batteries) but does not consider the different types of primary batteries that are
available.
1.4 REPORT OUTLINE Chapter 1 describes the subject of the thesis, defines the questions that should be answered and the
limitations of the work.
Chapter 2 describes the methodology used to reach the goal of the thesis.

2
Chapters 3-5 treat the three subsystems of an energy harvesting solution; solar cells, energy storage
and power electronics. These chapters are based on information collected through literature and
from market investigations.
Chapter 6 includes a description and the results from measurements made on solar cells in both a
home environment and in a lab environment.
Chapter 7 describes the design process and evaluation of a prototype of a solar cell driven magnet
contact alarm node.
Chapter 8 discusses the information that was collected throughout the thesis and how it applies to
wireless alarm nodes.
Chapter 9 concludes the report with conclusions and suggestions for future work.
3
2 METHOD
The first question regarding the amount of energy that is available in a home is treated by first
reading literature to understand how the output power of solar cells depend on the incident light
and then studying different light sources and their spectral content. Measurements are then done on
different solar cells in light from different sources to understand how they contribute to the total
amount of energy that can be harvested. The energy that can be harvested from natural light is
investigated in a home environment at two locations which are typical for the magnet contact alarm
node. A lab environment is used to find out how much power the solar cells can harvest in different
types of artificial light.
The questions which concern the three subsystems of an energy harvesting system; solar cells,
energy storage and power electronics (questions 2-4) are treated by collecting information from
literature and from market investigations. The options for solar cells, energy storage and power
electronics are then discussed with the application in mind to deduce if they are viable, the pros and
cons of the different alternatives and when feasible discuss when to use one over the other.
Question 5 regarding how energy harvesting can prolong the battery life of primary batteries is
treated by showing how an electrical solution for harvesting energy can automatically switch to using
backup batteries when the rechargeable storage is depleted. It is discussed how this solution can be
used to achieve the goal of prolonging battery life.
When the five main questions have been treated, a prototype is built around the magnet contact
alarm node to test the concept and to learn more about the challenges of implementing an energy
harvesting system.
4
3 SOLAR CELLS
This chapter introduces the basics of solar cells; how they operate and how different solar cells can
be compared. Common light sources and the spectrums of their emitted light are explained next.
Finally, this chapter presents different types of solar cells and their respective properties.
3.1 BASIC OPERATION Solar cells produce a voltage and a current when they are exposed to incident light. They are both
used in large scale power generation and in smaller products to reduce the need for batteries e.g.
pocket calculators.
Traditional crystalline silicon based solar cells consist of a p-n junction which is formed when two
oppositely doped semiconductor materials are brought together. When light with sufficient energy
hits the semiconductor material, electrons are excited forming hole-electron pairs. The hole-electron
pairs are separated with the help of the internal electric field which forms naturally at the p-n
junction. Depending on which side the pair was formed on, the electron or the hole then travels
across the p-n junction while the other travels through an external load connected to the solar cell.
When the electron and hole finally meet again at the other side, they recombine, and the electron
returns to a lower energy band. [1] [2]
Since the p-n junction effectively separates the hole-electron pairs into electrons on one side and
holes on the other side, a difference in electrical charge exists on the two sides. This difference in
electrical charge creates a difference in potential between the two sides. This is known as the
photovoltaic effect and is a fundamental part of how solar cells work. When the load connected to
the solar cell is of low electrical resistance, the charges can easily leave the solar cell and travel
through the load. The charge buildup at the electrodes is then small and the voltage across the solar
cell is therefore also small. When the resistance of the load is large, fewer charges can leave the cell
and the voltage across the solar cell is therefore greater than for a low resistance load. [3]
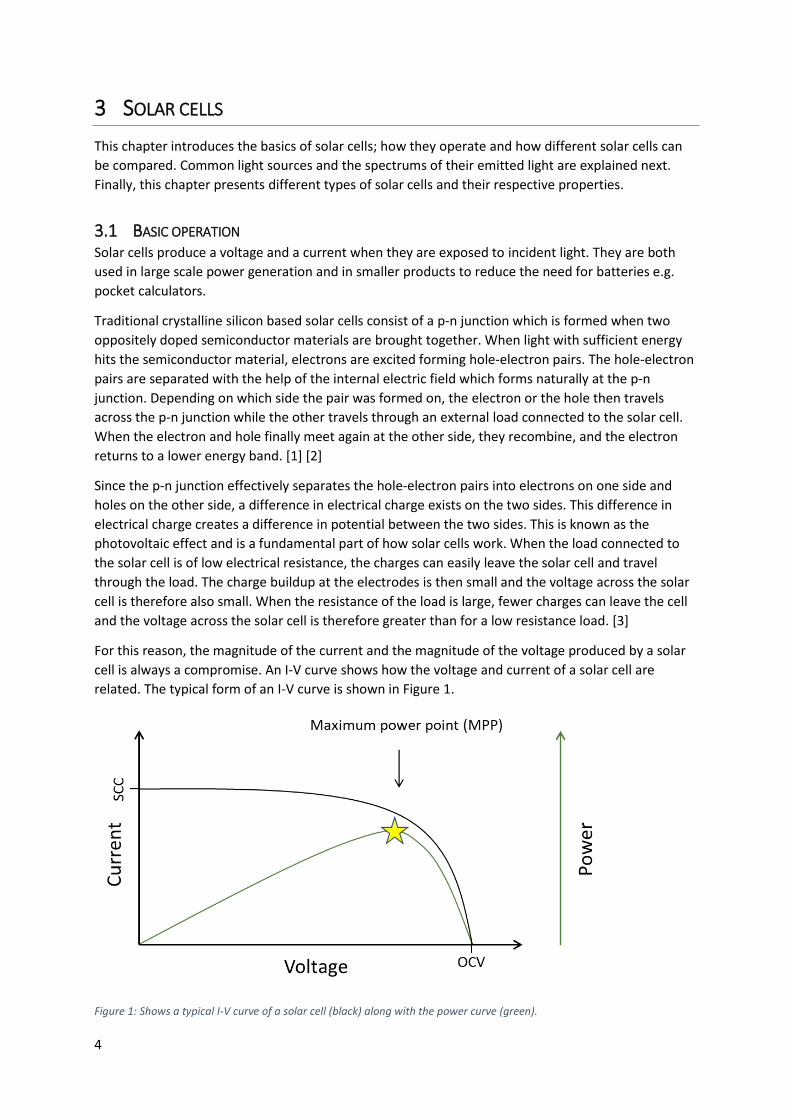
For this reason, the magnitude of the current and the magnitude of the voltage produced by a solar
cell is always a compromise. An I-V curve shows how the voltage and current of a solar cell are
related. The typical form of an I-V curve is shown in Figure 1.
Figure 1: Shows a typical I-V curve of a solar cell (black) along with the power curve (green).

5
The power curve that is seen in Figure 1 can be obtained by multiplying the voltage by the current at
each point. As can be seen in the graph the power curve has a maximum point at a specific voltage
level. This operating point which results in maximum power is called the maximum power point
(MPP). To work at maximum efficiency the solar cells should stay at the MPP, which can be achieved
by matching the load impedance to the impedance of the MPP, a process which is further explained
in chapter 5.1.
As shown in Figure 1, at the point on the I-V curve where the current is zero, the voltage is called the
open-circuit voltage (OCV). At the point at which the voltage is zero the current is called the short-
circuit current (SCC). [3]
A common way to compare solar cells is to compare their efficiency. The efficiency is a measurement
of how much of the power Pin of the incident light that can be extracted when working at the MPP
(Pmax), as defined by equation (1). [4]
𝜂 =
𝑃𝑚𝑎𝑥
𝑃𝑖𝑛
(1)
The efficiency of a solar cell is usually measured under standard test conditions (STC), which assume
a temperature of 25° C, an irradiance of 1000 W/m2 and the AM1.5 spectrum (air mass 1.5). AM1.5
implies that the incident light has a spectrum which is equivalent to the spectrum of sunlight when
the light has travelled a certain distance in the Earth’s atmosphere and thus lost a certain amount of
the intensity of each wavelength due to atmospheric absorption and other effects. AM1 implies that
the light has travelled a distance in the atmosphere which is equivalent to when the sun is directly
overhead, while AM1.5 implies that the light has travelled a distance that is 1.5 times as long
corresponding to a zenith angle of 48.2° for the Sun (zenith angle is the angle between a line going
directly upwards and the Sun). [4] [5] [6]
The short-circuit current increases linearly with the intensity of the light that is incident on the solar
cell. The open-circuit voltage also increases with the light intensity, but with a much slower rate. An
illustration of how the I-V curve changes with the light intensity is shown in Figure 2. [7]
Figure 2: Shows how the I-V curve of a solar cell changes with changing light intensity.
The current produced by a solar cell is not only dependent on the light intensity, but also on the
wavelengths of the incident light. Different wavelengths contribute in different proportions to the

6
current that is produced. One way to state the dependence of wavelength for a particular solar cell is
through the quantum efficiency. The quantum efficiency is the ratio between the hole-electron pairs
which are successfully separated at the p-n junction to the number of incident photons of a specific
wavelength. [8]
The wavelengths for which the quantum efficiency is high varies between different types of solar
cells. When choosing solar cell, the spectrum of the light that it will placed in should therefore be
considered and the quantum efficiency window should preferably match it well.
Traditional semiconductor based solar cells have a temperature dependence which decreases the
OCV and increases the SCC when the temperature of the solar cell increases. The decrease of the
OCV is the dominating effect resulting in a lower power output as the temperature increases.
Temperature dependence of a solar cell is often stated as the temperature coefficient for both
voltage and current in units of [% / °C] which can be used to calculate how the voltage and current
deviates from the rated values. [9]
The current from the solar cell is proportional to the area of the solar cell. To increase the current
and in turn the power, the area of the cell can be increased or many solar cells can be put in parallel.
To increase the voltage, which also increases the power, many cells can be put in series. When many
solar cells are connected together the whole package is referred to as a solar cell module.
3.2 LIGHT This chapter introduces the most common sources of light and discusses how the output power of a
particular solar cell in a particular light condition can be found.
3.2.1 Light sources
A fundamental way to classify a light source is through its spectral content. Different sources of light
emit light with different wavelengths. The Sun emits light with a wide range of wavelengths while the
light from a LED lamp is mostly visible light, which includes wavelengths in the 400-700 nm range.
3.2.1.1 The Sun
The spectrum of the solar radiation is close to the theoretical spectrum of a blackbody at 5800 K [10],
for which the spectral radiance is shown in Figure 3. The spectrum of the sunlight experienced on the
Earth is however not exactly that of an ideal blackbody. Different gases in the Earth’s atmosphere
absorb light of specific wavelengths. These gases include water vapor, carbon dioxide and ozone [11].
This results in a spectrum at the Earth which has lower levels of irradiance for the same wavelengths.

7
Figure 3: Spectral radiance for a blackbody at 5800 K (representing the Sun).
When sunlight shines through the windows of a building it also loses some of its energy. Glass
windows typically block UV radiation [12]. Furthermore, to reduce the heat loss through radiation
from a building some windows have a coating which reflects IR light (infrared radiation, IR, includes
wavelengths from 700 nm to 1 mm). These windows are known as low-emissivity windows (low-E
windows).
3.2.1.2 Artificial light sources
Three common artificial light sources and the wavelengths of the light they emit are described in this
chapter, including LED lamps, fluorescent lamps and halogen lamps.
LED lamps are today very popular for all kinds of applications due to their low power consumption
and long lifetime. By themselves LED lamps have a very narrow range of emitted wavelengths, but
together with a phosphor they can be made to emit white light which includes all the visible colors.
The wavelengths of the emitted light are mostly inside the range of visible light (400-700 nm).
A fluorescent lamp has a tube which contains a gas of argon or mercury which is excited to emit UV-
light. The gas is excited when a high voltage is applied at the ends of the tube, which then forces a
current through the gas. The inside of the tube is coated with a phosphor which emits light in the
visible range when hit by the UV-light (400-700 nm). [13]
In an incandescent lamp a thin wire is heated to a high temperature so that it emits radiation in the
visible spectrum [13]. The spectrum of the emitted light is close to that of a blackbody with the same
temperature as the wire (usually 2700 K). This means that a big part of the emitted energy consists of
longer wavelengths which are not visible to the human eye, as shown in Figure 4. Since a lot of power
to heat the wire is radiated as light outside of the visible spectrum, this lamp has a low efficiency.
This has led to regulations in the European Union to the point where these types of lamps are not
used so much anymore [13], and they may therefore be less relevant to investigate for the purpose
of energy harvesting for alarm systems in personal homes. A more efficient version of the
incandescent lamp is the halogen lamp.

8
Figure 4: Spectral radiance for a blackbody at 2700 K (representing an incandescent lamp).
3.2.2 Predicting solar cell output power by measuring light
A common way of quantifying light is by expressing the illuminance in units of lux, for which a
number can be easily obtained with the help of a lux meter, which exist as portable handheld
devices.
The illuminance is a quantity which expresses the luminous flux 𝜙𝑣 per unit area A, as shown in
equation 2-3. The luminous flux 𝜙𝑣 is formed by weighting the power of the different wavelengths in
the spectrum of the incident light by the luminosity function. The result is a number which is
representative for the perceived brightness of the human eye, thus the luminosity function only
takes into account the wavelengths in the visible range (approximately 400-700 nm). Because
different light conditions can produce the same illuminance even though they have different spectral
content the illuminance is not a good measurement for predicting the output power of solar cells, as
the output power of solar cells is highly dependent on the spectral content. [14]
𝐸𝑣 =
𝜙𝑣
𝐴= [𝑙𝑢𝑥]
(2)
𝜙𝑣 = "spectral content weighted by the luminosity function" = [𝑙𝑚] (3)
A more sophisticated approach for quantifying light and predicting the output power of solar cells is
to use a spectrometer to measure the intensity of each wavelength in the incident light. However,
spectrometers are expensive, usually not very portable and would produce large data volumes if they
would be set up to log how the light changes over time. When the light spectrum has been captured
it is also required that the spectral response of the solar cell is available, that is the relation used to
translate the spectrum of the incident light to the current produced by the solar cell. [14]
A more practical way to find out how much power a solar cell can produce is to perform
measurements directly on the solar cells in the light conditions that are of interest. It is then required
to have an analog circuit which varies the load experienced by the solar cell such that the I-V curve
can be captured to find the maximum power. This is the approach that is used in this thesis and
specifically used for the measurements that are presented in chapter 6.
9
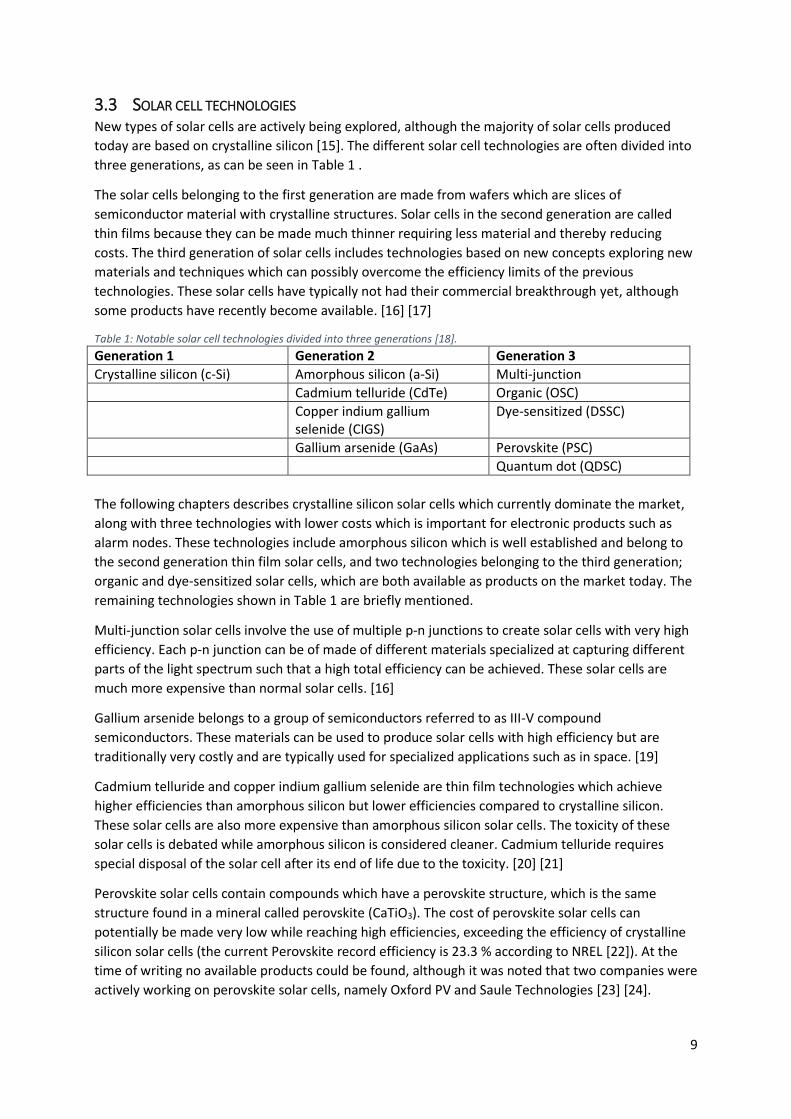
3.3 SOLAR CELL TECHNOLOGIES New types of solar cells are actively being explored, although the majority of solar cells produced
today are based on crystalline silicon [15]. The different solar cell technologies are often divided into
three generations, as can be seen in Table 1 .
The solar cells belonging to the first generation are made from wafers which are slices of
semiconductor material with crystalline structures. Solar cells in the second generation are called
thin films because they can be made much thinner requiring less material and thereby reducing
costs. The third generation of solar cells includes technologies based on new concepts exploring new
materials and techniques which can possibly overcome the efficiency limits of the previous
technologies. These solar cells have typically not had their commercial breakthrough yet, although
some products have recently become available. [16] [17]
Table 1: Notable solar cell technologies divided into three generations [18].
Generation 1 Generation 2 Generation 3
Crystalline silicon (c-Si) Amorphous silicon (a-Si) Multi-junction
Cadmium telluride (CdTe) Organic (OSC)
Copper indium gallium selenide (CIGS)
Dye-sensitized (DSSC)
Gallium arsenide (GaAs) Perovskite (PSC)
Quantum dot (QDSC)
The following chapters describes crystalline silicon solar cells which currently dominate the market,
along with three technologies with lower costs which is important for electronic products such as
alarm nodes. These technologies include amorphous silicon which is well established and belong to
the second generation thin film solar cells, and two technologies belonging to the third generation;
organic and dye-sensitized solar cells, which are both available as products on the market today. The
remaining technologies shown in Table 1 are briefly mentioned.
Multi-junction solar cells involve the use of multiple p-n junctions to create solar cells with very high
efficiency. Each p-n junction can be of made of different materials specialized at capturing different
parts of the light spectrum such that a high total efficiency can be achieved. These solar cells are
much more expensive than normal solar cells. [16]
Gallium arsenide belongs to a group of semiconductors referred to as III-V compound
semiconductors. These materials can be used to produce solar cells with high efficiency but are
traditionally very costly and are typically used for specialized applications such as in space. [19]
Cadmium telluride and copper indium gallium selenide are thin film technologies which achieve
higher efficiencies than amorphous silicon but lower efficiencies compared to crystalline silicon.
These solar cells are also more expensive than amorphous silicon solar cells. The toxicity of these
solar cells is debated while amorphous silicon is considered cleaner. Cadmium telluride requires
special disposal of the solar cell after its end of life due to the toxicity. [20] [21]
Perovskite solar cells contain compounds which have a perovskite structure, which is the same
structure found in a mineral called perovskite (CaTiO3). The cost of perovskite solar cells can
potentially be made very low while reaching high efficiencies, exceeding the efficiency of crystalline
silicon solar cells (the current Perovskite record efficiency is 23.3 % according to NREL [22]). At the
time of writing no available products could be found, although it was noted that two companies were
actively working on perovskite solar cells, namely Oxford PV and Saule Technologies [23] [24].

10
Quantum dot solar cells are not treated in this report because they appear to be more far from
commercialization compared to the other third generation solar cells.
3.3.1 Crystalline silicon (c-Si)
Solar cells based on crystalline silicon constitute the majority of the production of solar cells (93 %
share of worldwide production as of 2016) [15]. In crystalline silicon the atoms are fixed in crystal
structures, and hence it is referred to as crystalline silicon. In monocrystalline silicon the silicone
atoms form a single crystal structure and in polycrystalline silicone the atoms forms multiple crystal
structures. Monocrystalline silicon is more expensive to produce but produces solar cells with higher
efficiencies. [25] [26]
The efficiencies of commercialized crystalline silicon solar cells are between 16-21% [17] while record
efficiencies in research environments reach 26.1 % [22]. Solar cells based on mono or poly- crystalline
silicon require thick layers of silicon to absorb most of the light, in contrary to thin-film solar cells [17]
[5].
The bandgap of crystalline silicon is approximately 1.1 eV [27], which means that photons up to a
wavelength of approximately 1150 nm can excite the electrons of the silicon atoms. Solar cells based
on crystalline silicon can therefore utilize a good amount of the IR part of the spectrum of sunlight.
In the production of crystalline silicon solar cells the cost of the silicon ingot which includes the
growth of the fine crystal structures makes up 40-50 % of the total cost of a solar cell module. The
more pure the silicon crystal is, the more expensive it is to make. The price of crystalline silicon solar
cells can potentially be sensitive to shortage of silicon production in the future. [27] [5]
The lifetime of a solar cell is usually measured as the time before the solar cell output power drops to
80 % of its original value (referred to as T80). Crystalline silicon solar cells have long lifetimes usually
between 25 and 30 years. [28]
3.3.2 Amorphous silicon (a-Si)
In amorphous silicon the silicon atoms do not form crystal structures, but are instead located in an
irregular random order. While the atoms in crystalline silicon have four bonds to the atoms that
surround them, the atoms of amorphous silicon sometimes have broken bonds which are impurities
where recombination between an electron and a hole can occur. To reduce the number of broken
bonds amorphous silicon is “passivated” with hydrogen atoms and the material is then called
hydrogenated amorphous silicon. [27]
Amorphous silicon based solar cells have lower efficiencies compared to those based on crystalline
silicon, reaching 14 % record efficiency in research environments [22] and 8-11 % for commercial
cells [17]. One of the main advantages of amorphous silicon solar cells is that they are cheaper
compared to crystalline silicon solar cells. Another advantage is that they require less amount of
silicon and can be made thinner and mechanically flexible [27]. They can also be made in different
shapes which is one of the reasons to why they are used in small electronics such as pocket
calculators and watches [29].
The bandgap of amorphous silicon is between 1.6 eV to 1.85 eV [27], and hence amorphous silicon
based solar cells cannot capture the same wide range of wavelengths as crystalline silicon. The
bandgap levels correspond to a maximum wavelength of approximately 750 nm, which is similar to
the upper limit of the human eye. Amorphous silicon solar cells therefore cannot utilize the IR part of
the spectrum of the energy from the sun, as compared to crystalline silicon.

11
The output power of amorphous silicon solar cells is less affected by the temperature compared to
solar cells based on crystalline silicon. The voltage temperature coefficient is typically half of the
temperature coefficient of crystalline silicon solar cells or less. [27]
The lifetime of amorphous silicon solar cells is often reported to be around 15 years. [28]
3.3.3 Organic (OSC)
Organic solar cells consist of organic materials such as polymers, fullerenes and others [30]. An
exciton is formed when an electron of an organic donor material is excited by light. In contrary to
inorganic semiconductors such as silicon, the electron cannot move freely but is stuck together with
the hole (together they are called an exciton). The electron and hole are separated with the help of
an organic acceptor material and can then move through the external load to provide an electric
current. [5] [27]
The cost of organic solar cells can be made very low since the materials are cheap and because the
solar cells can be produced at high volumes in a roll-to-roll process [30]. Other attractive features of
organic solar cells include the fact that they are thin, mechanically flexible and that the color can be
tuned [27] [5]. Organic solar cells also perform very well in low light or indoor conditions and some
sources report that they perform better than amorphous silicon solar cells in fluorescent light [31]
[32].
They perform well in indoor light because the quantum efficiency is usually high for wavelengths
between 350 and 750 nm [31] [27]. The quantum efficiency can however be adapted to different
wavelengths by tuning the organic molecules used. For this reason there exist many different types
of organic solar cells which have different properties [32]. Organic solar cells have typically not
utilized IR wavelengths, but it is actively being researched and some solar cells have been
demonstrated to have high quantum efficiencies up in the 800 nm range. [27] [30]
Organic solar cells are reported to have a slightly positive temperature coefficient, meaning that they
perform slightly better as the temperature increases [33].
The efficiency of organic solar cells is low compared to the traditional solar cells, although as of 2016
the efficiency had been doubled in the last five years [30]. The current record efficiency of organic
solar cells is 12.6 % in research environments according to NREL [22]. The efficiency of the
commercially available organic solar cells from infinityPV, a Danish manufacturer of organic solar
cells, is stated to be between 1.5-7 % for their demonstrator product and between 2-4 % for their
“solar foil” [34].
Organic solar cells typically have shorter lifetimes compared to traditional silicon based solar cells
because they suffer from different kinds of degradation and may therefore be better suited for
products with an intended lifetime of a few years [30]. The degradation is reported to be especially
high in outdoor conditions and is worse during the summer compared to the winter because of the
increased UV radiation during the summer. The encapsulation of the solar cell is an important factor
which determines how resistant the solar cell is to degradation. [33]
3.3.4 Dye-sensitized (DSSC)
Dye-sensitized solar cells contain organic dye molecules in which electrons are excited by incident
light. In the excited state the electrons move to a nearby titanium dioxide (TiO2) molecule which has
a conduction band with a lower energy level. By conduction through the TiO2 molecules the electrons
reach the negative electrode and travel through the external circuit. In the meantime the missing
electrons in the dye molecules have been replenished through redox reactions with an electrolyte

12
containing iodide (I-). The iodide later regains the electron at the cathode when the original electron
has travelled through the load. [27] [35]
This type of solar cell show very similar properties to organic solar cells even though the solar cells
work in different ways [32]; they can be produced at low cost, can be made thin, mechanically
flexible, and in different form factors and their color can be tuned. As with organic solar cells they are
reported to perform relatively better in low light conditions and at higher temperatures compared to
other solar cells [27]. The output power does also not decrease as much when the incident light has a
high angle, as compared to amorphous solar cells. [35] [36]
Dye-sensitized solar cells typically have good quantum efficiency for visible light, as is also the case
with organic solar cells. The dye can be optimized so that the quantum efficiency is better at utilizing
certain wavelengths. A dye-sensitized solar cell can for example be better at absorbing indoor light or
outdoor light, e.g. a dye from Dyenamo can utilize wavelengths up to 822 nm and can thereby
capture some IR wavelengths. [36] [17] [37]
As with organic solar cells, dye-sensitized solar cells also suffer from different degradation
mechanisms and hence the lifetime is shorter compared to silicon based solar cells. According to an
article on website SolarEnergyForUs the lifetime of dye-sensitized solar cells is around 6 years, while
G24 Power which is a manufacturer of dye-sensitized solar cells reports 3 years for their customized
solar cells [28] [38]. [32]
The record efficiency for dye-sensitized solar cells in research environments is 11.9 % according to
NREL [22].
3.3.5 Market investigation
To get an initial rough estimate for the cost of small solar cells, the price per area was calculated for
all solar cells with an area less than 250 cm2 available on DigiKey, a well-known electronic
components distributor. The solar cell modules that were found include 23 monocrystalline silicon
modules, 1 polycrystalline silicon module and 18 amorphous silicon modules from a total of 7
manufacturers. It should be noted that the price per area was calculated from the data for price per
unit in combination with the area of each solar cell. While this can work as an initial estimate of the
price, it must be remembered that the solar cells are sold at unit prices and that the price for a solar
cell with a custom shape and area probably has a higher cost. On the other hand the unit prices are
valid for a quantity of 1000 units, and could be lower for a higher quantity. The result from the price
investigation is presented in Figure 5.

13
Figure 5: Result from price investigation for solar cells available on DigiKey SE on the 22nd of August 2018.
From the results it can be seen that amorphous silicon solar cells are available from approximately
0.11 USD/cm2 and monocrystalline silicon solar cells from 0.16 USD/cm2 (this reflects the prices for
Panasonic AM-1816 and Seeed Technology 313070005). These particular solar cells have an area of
approximately 55 cm2 and 80 cm2 respectively, and it can be seen that the prices are higher for solar
cells with smaller areas.
For the third generation solar cells like organic and dye-sensitized solar cells the price is generally not
publicly available since they are not sold by distributors but must be bought directly from the
manufacturer.

14
4 ENERGY STORAGE
The power that is required by the load does not always match the power that is harvested by an
energy harvesting system at every instant. This is the fundamental reason for using a rechargeable
storage. If daylight is the primary source of light for a solar cell harvester then this is especially true
since energy must often be stored during the day for consumption during the night. One can also
imagine a system where it is acceptable to use a primary battery during the night, but to have a
storage which can hold enough energy to supply the load when passing clouds block the sun for short
periods of time. If the instantaneous power from the energy harvester is not enough, storage can
also be required to supply power during periodic load peaks such as during radio transmission, which
is common for wireless alarm nodes.
4.1 REQUIREMENTS The following list presents important parameters for the energy storage in an energy harvesting
system for wireless alarm nodes:
• Energy density - Alarm nodes are typically made with minimalistic designs to not be too
obtrusive in a home environment. Depending on the amount of energy that is going to be
stored, it is important that the energy storage has a high energy density (energy per volume).
• Power density – To handle the current peaks that typically occur in wireless products when
they transmit data the energy storage should be able to supply enough current without the
voltage dropping too low.
• Self-discharge – Alarm nodes usually have limited surface areas and are often placed in
environments that are not necessarily well-lit, and hence the energy storage should have a
low leakage current to not waste the already scarce energy. This is especially true if the
energy should be stored for longer periods such as over the night or for multiple days.
• Lifetime – The energy storage should not have to be replaced within the lifetime of the
product itself as this would effectively increase the cost of the product and in the end for the
customer. It would also introduce a cost of having a service team go out to customers to
replace the aged storage elements or create an inconvenience for the customer if they have
to replace it by themselves.
• Energy efficiency – All types of energy storage has losses. Energy efficiency is defined as the
ratio between the energy that is retrieved from discharging the storage and the energy that
was used to charge the storage.
• Price – The total cost of the energy harvesting solution must be reduced as much as possible
if it should be an attractive alternative to using primary batteries.
4.2 TYPES OF STORAGE This chapter presents three common types of energy storage including capacitors, supercapacitors
and batteries. Regular capacitors are typically used for storing only small amounts of energy while
batteries can store large amounts for long periods. A supercapacitor has a higher energy density than
normal capacitors and can tolerate more charge and discharge cycles compared to a battery [39].
4.2.1 Capacitors
A capacitor consists of two conductive plates separated by an insulating dielectric. When a capacitor
is being charged, holes are collected on one side and electrons on the other. This creates a difference
in potential and an electric field between the two plates. [40]

15
Capacitance is a measurement of the charge per voltage between the two sides, as shown in
equation (4). The capacitance is proportional to the relative dielectric constant 𝜀𝑟 of the dielectric
medium. The dielectric is polarized when exposed to an electric field, which in turn reduces the same
electric field. The polarization of the dielectric is the primary way that energy is stored in a capacitor.
[41]
𝐶 =
𝑄
𝑉∝ 𝜀𝑟
(4)
The energy stored in an ideal capacitor is related to the capacitance and the voltage as described by
equation (5) [40].
𝐸 =
1
2𝐶𝑉2
(5)
Capacitors have a maximum voltage rating at which the dielectric separating the two plates breaks
down and starts conducting [40]. The maximum voltage rating together with the capacitance sets the
limit for the amount of energy that can be stored in a capacitor.
Capacitors have very low energy densities compared to supercapacitors and batteries but can charge
and discharge more quickly giving them higher power densities [41] [39]. A single capacitor can only
be used for storing a small amount of energy since they are normally available in the order from pF
to mF range. Due to the low energy densities of capacitors it is interesting to look at supercapacitors
which have higher energy densities compared to capacitors and can tolerate more charge and
discharge cycles compared to batteries. [39]
4.2.2 Supercapacitors
Supercapacitors, also known as electrochemical double-layer capacitors (EDLCs), have much higher
energy densities compared to normal capacitors, but also conform to equation (5) relating energy,
capacitance and voltage. They exist with a capacitance range of 100 mF to over 1000 F allowing large
amounts of energy to be stored [39]. The energy density of supercapacitors is lower than the energy
density of batteries, but they make up for it by tolerating more charge and discharge cycles and
having higher power density [39].
When a voltage is applied across the terminals of a supercapacitor, ions in the electrolyte separating
the electrodes attract to the electrodes and form electric double-layers at the interfaces between
electrode and electrolyte. The double-layers at these two interfaces form the capacitance in a
supercapacitor. [42]
Supercapacitors can also store energy through what is known as pseudo-capacitance which involves
electrochemical redox reactions between ions and the electrodes. This is more similar to how
batteries store energy and can provide a higher capacitance than the electric double-layer. [41] [43]
Different ratios between double-layer capacitance and pseudo-capacitance can be achieved by
choosing different materials in the design of the capacitor. Based on this ratio supercapacitors are
divided into double-layer capacitors, pseudo-capacitors and asymmetric capacitors. A double-layer
capacitor has a high double-layer capacitance while a pseudo-capacitor has a high pseudo-
capacitance. The asymmetric capacitor, also called hybrid capacitor, has one electrode with a high
double-layer capacitance and the other side with a high pseudo-capacitance. [43]

16
Double-layer capacitors have a breakdown voltage in the range of 2.5-3V while the breakdown
voltage for hybrid capacitors can reach up to 3.8 V [42], although many cells can be put in series to
allow higher voltages.
An advantage with supercapacitors is that the state of charge and the remaining energy can easily be
estimated by using equation (5), something which can be challenging to do for batteries. [44] [43]
Although supercapacitors can tolerate many more charge cycles than batteries, they do also suffer
from ageing effects. When a supercapacitor ages the equivalent series resistance (ESR) increases and
the capacitance drops. Higher temperatures and higher operating voltages both increase the ageing
rate of supercapacitors. Therefore, a supercapacitor should ideally not work close to its maximum
voltage rating. According to CAP-XX, a supercapacitor manufacturer, their supercapacitors have a
lifetime of approximately 50,000 hours with an unlimited number of charge and discharge cycles
whereas batteries can tolerate between 150 and 1500 charge/discharge cycles. [45] [46] [39]
It is common to find the leakage current of supercapacitors stated in the datasheets as maximum
leakage current after some amount of time, e.g. 72 hours. This is because the leakage current of the
supercapacitor, as measured by measuring the current required to keep the supercapacitor at a
constant voltage, decreases over time and eventually stabilizes [41]. The leakage current is in the
range of µA/F [41] and the higher the capacitance is the higher the leakage current. The self-
discharge of supercapacitors can be of significance if put in relation to the average current
consumption of small wireless alarm nodes.
4.2.3 Rechargeable batteries
Rechargeable batteries are more formally known as secondary batteries while non-rechargeable
batteries are known as primary batteries. A battery consists of a single or multiple electrochemical
cells which may be connected in series or parallel to get the desired energy and power capacity [47].
The electrochemical cell consists of two electrodes, the anode and cathode, separated by an
electrolyte. When the cell is being discharged, an oxidation reaction takes place in the anode which
releases free electrons and positively charged ions. The ions can move through the electrolyte while
the electrons need to take an external path through the load to end up at the cathode. In the
cathode a reduction reaction takes place and the electrons are accepted. When the cell is being
charged, electrons and ions instead move from the cathode to the anode. [43]
Rechargeable batteries have higher energy densities compared to supercapacitors, but lower power
capacities. A disadvantage with batteries is that the capacity is reduced more quickly with the
number of charge cycles compared to supercapacitors. [41] While a supercapacitor can be fully
discharged to 0 V, a battery should not be discharged below a certain voltage. Batteries need to be
kept within its voltage limits to operate safely and to maintain an acceptable lifetime [43]. The
number of cycles that a battery can tolerate falls exponentially with the depth of discharge (DoD),
which is a measure of how much of the capacity of a battery that is used in each charge/discharge
cycle. The capacity of a battery should be large such that the DoD can be kept small enough to
maintain a long lifetime.
Batteries generally achieve a much lower self-discharge compared to supercapacitors [48] [49] [50],
and are therefore be more suited for storing energy over long periods of time. The self-discharge of
lithium-ion batteries can be as low as 2 % of the full capacity per month [51].

17
The voltage of a battery decreases as it is discharged, but the voltage is generally more flat compared
to the voltage of a capacitor. Different types of batteries are made of different materials which result
in different cell voltages.
Lithium-ion batteries (Li-ion) are the most common rechargeable batteries used in consumer
electronics [43] [50]. They are attractive because of their high cell voltage, usually between 3-4 V,
and because of their high energy density. The cell voltage is more constant compared to other
battery types for which the cell voltage can vary more widely depending on the state of charge. [43]
Before lithium-ion batteries became the dominant battery type, nickel metal-hydride (NiMH)
batteries were commonly used in portable electronics. They are still widely used, but are being
replaced by more energy dense lithium-ion batteries. The cell voltage of nickel metal-hydride
batteries is lower compared to lithium-ion batteries, at approximately 1.2 V. The voltage of nickel
metal-hydride batteries can decrease if the battery is repeatedly partially charged, a phenomenon
known as voltage depression. The capabilities of the battery can however be restored by occasionally
doing a full discharge of the battery. [43] Considering the use of NiMH in energy harvesting
applications where the battery can be repeatedly partially charged depending on the intermittence
of light, this property should be considered.
Batteries have a more narrow operating temperature than supercapacitors (-20 to +65°C for
batteries vs -40 to +85°C for supercapacitors according to [39]), and must be kept within its limits to
maintain safety and minimize ageing and damage to the battery. For wireless alarm nodes which may
be placed in window locations or in houses with no temperature regulation the maximum and
minimum ambient temperature needs to be considered for the whole year and for the different
geographical regions where the product is used. Lithium based batteries are especially sensitive to
temperature and temperature monitoring is often used to ensure safe operation. [43]
When batteries are charged the current should be limited to not cause overcharging, which can
happen when the charging rate is faster than the chemical reactions. Charging too fast can cause a
rise in temperature, damage to the cell or a loss of energy. The charger should be able to charge the
battery at a good rate but within the limits and know when to stop charging the battery. Different
methods for charging exist and a common one is the CCCV method (constant current constant
voltage). The CCCV method achieves a high charging rate with the constant current phase but
prevents charging the battery too much with the constant voltage phase in which the charging
current gradually decreases. [43]
The energy efficiency of both lithium-ion batteries and supercapacitors reach high values, often
between 85-100 %. The efficiency typically varies depending on how fast the medium is charged or
discharged, lower charging rates achieving higher efficiencies. Supercapacitors are often reported to
reach higher efficiencies compared to lithium-ion batteries. [52] [53] [54]
4.2.4 Market investigation
The webshop of DigiKey was scanned for supercapacitors in the range of 0-5 F to collect prices for
such capacitors. Table 2 presents the results of the price scan for the range of capacitances divided
into five intervals. The price is shown both for capacitors with a lower voltage rating and for
capacitors with a higher voltage rating achieved by packing two cells into a single module.

18
Table 2: Prices of supercapacitors between 0.1-5 F collected from DigiKey1.
Capacitance (F) Available from, price per unit (USD) / 1 ku
Calculated price per energy capacity2 (USD/Wh)
Rated voltage 2.5-3 V
Rated voltage 5.0-5.5 V
Rated voltage 2.5-3 V
Rated voltage 5.0-5.5 V
0.1-0.99 F 0.42 0.73 339.39-4834.4 175.51-2102.4
1-1.99 F 0.33 1.15 132.66-380.16 137.54-331.2
2-2.99 F 0.41 1.44 109.70-236.16 114.63-207.36
3-3.99 F 0.50 2.02 100.25-192 120.50-193.2
4-5 F 0.71 3.23 113.6-232.56 153.76-232.56
A similar price scan for rechargeable batteries was made on DigiKey, although it was found that the
price varies widely amongst products of the same technology and of the same capacity. It is likely
necessary to contact manufacturers directly to get more usable information about their selection and
prices. Table 3 shows a list of different batteries and battery-like devices and their respective cost.
1 Price from DigiKey US, https://www.digikey.com/, accessed 21th of August 2018. 2 Energy capacity calculated by assuming an operating voltage between 0 V and the rated voltage.

19
Table 3: Prices of a selection of rechargeable batteries collected from DigiKey3 US on the 21th of August 2018.
Product Type Nominal capacity (mAh)
Nominal voltage (V)
Typical current
Available from, price per unit (USD) / 1 ku
Calculated price per energy capacity (USD/Wh)4
Various lithium coin cells 23-30 mm diameter
Lithium 30-100 3 µA 2.04 6.80-22.67
SparkFun 18650
Lithium-ion 2600 3.7 mA to A 5.95 0.62
FDK America HR-3U-2500 AA
NiMH 2300 1.2 mA to A 3.30 1.20
Murata UMAC Lithium-ion based (unconventional [55])
3 2.3 µA to mA 3.24 469.57
Murata UMAL Lithium-ion based (unconventional [55])
24 2.3 µA to mA 12.46 225.72
Panasonic Pin-type CG-320A
Lithium-ion 15 3.8 µA to mA 4.315 75.61
When comparing the price per energy capacity for supercapacitors and batteries it can be seen that
the price of supercapacitors is generally higher compared to batteries. The exception seems to be for
the Murata UMAC and UMAL devices, which are on par or more expensive compared to
supercapacitors, although it is for these devices questionable if they can be counted as batteries or
not, see reference [55].
An investigation based on another dataset was made to see how the energy density of
supercapacitors and batteries compared. The energy density of 18 supercapacitors of three different
brands in the range of 0.1-15 F was found to be between 0.3 Wh/L and 4.1 Wh/L when assuming that
the supercapacitor could be used in the whole voltage interval from 0 V up to the rated voltage. A
similar investigation was made of 10 different batteries of three different brands in the range of 3-
2350 mAh capacity, and it was found that the energy density was in between 45 Wh/L and 500 Wh/L.
This suggests that the energy density for li-ion batteries and supercapacitors can differ by a factor of
100.
3 Price from DigiKey US, https://www.digikey.com/, accessed 21th of August 2018. 4 Energy capacity estimated as nominal voltage (V) multiplied by nominal capacity (Ah). 5 Price from Octopart, for seller Rutronik, accessed 21th of August 2018.

20
5 POWER ELECTRONICS
A typical energy harvesting system for solar cells includes two voltage converters; one at the input
and one at the output [56], as shown in Figure 6. The DC-DC converter at the input is used to charge
the rechargeable storage and to make the solar cells operate at the MPP of the I-V curve. The latter is
known as maximum power point tracking (MPPT) and is further explained in the following
subchapter. The second stage where a voltage converter is typically used is between the
rechargeable storage and the load. If the rechargeable storage is a capacitor the voltage varies with
the state of charge and a regulated DC-DC converter is required to stabilize the voltage across the
load. Even batteries that work at a fairly constant voltage can require a DC-DC converter if there is a
mismatch between the battery voltage and the voltage requirements of the load, but also to have
the load work at the optimal voltage which minimizes power consumption.
Figure 6: Typical energy harvesting system with solar cells as input source.
5.1 MAXIMUM POWER POINT TRACKING For the solar cells to operate in the MPP and extract maximum power, it is as previously mentioned
required to match the load impedance to the impedance of the solar cell in the MPP. Since the
current and voltage from a solar cell depends on the light conditions, the load impedance matching
needs to be done continuously. Making the solar cells operate in the MPP is achieved through
maximum power point tracking (MPPT).
The DC-DC converter between the solar cell module and the rechargeable storage is usually a
switched buck or boost converter [56]. A boost converter is used if the solar cell module has a lower
voltage than the rechargeable storage. If instead the solar cell module has a higher voltage than the
rechargeable storage a buck converter is used as it steps down the voltage. By controlling the duty
cycle of the converter the ratio between the voltage at the input and the voltage at the output of the
converter can be changed. The output voltage is fixed by the voltage of the rechargeable storage and
so the duty cycle can be used to control the input voltage which is the voltage across the solar cell
module. In this way it is possible to control the operating point of the solar cell.
A simple way to perform MPPT is to assume that the voltage at the MPP is a constant fraction of the
open-circuit voltage, a method which is known as the Fractional Open Circuit Voltage method
(F.OCV) [57]. The fraction of the OCV at which the MPP is located differs between different types of
solar cells, therefore chips which use this type of MPPT often makes it possible to set the fraction e.g.
through a voltage division resistor network. The bq25504 energy harvesting IC from Texas
Instruments which implements this method periodically measures the OCV by temporarily
disconnecting the solar cell module from the load [58].
Another group of methods are the hill climbing power point trackers. These methods have in
common that they adjust the load in steps and measure how the output power is affected. The goal
is to move along the I-V curve until the MPP is found. Two common methods in this category are the
Perturb & Observe (P&O) and the Incremental Conductance (IC) methods. [57]

21
5.2 ENERGY HARVESTING CHIPS There are integrated circuits which contains the necessary functionality that is typically required in
an energy harvesting system. Common functionality of such chips includes:
• Charging of rechargeable storage
• MPPT
• Output voltage regulation
• Automatic switching to backup battery
The next section gives a description of the bq255xx series energy harvesting chips from Texas
Instruments to show a more concrete example of the functionality of such chips. Next a list of prices
of energy harvesting chips with MPPT is presented to show what the typical price is.
5.2.1 bq255XX series from Texas Instruments
The bq255XX series from Texas Instruments includes three integrated circuits with boost converters
and battery management for ultra-low power energy harvesting applications [59]. MPPT is achieved
through the F.OCV method and the fraction is programmable by choosing the values of resistors in a
voltage division network. The controller samples the OCV every 16 s by temporarily disconnecting
the solar cells. [58]
When a discharged rechargeable storage is connected to the IC, the circuit operates in cold-start
mode which means that the boost converter is unregulated and works at a lower efficiency. When
the storage is charged to approximately 1.7 V, the circuit enters the main mode and the boost
converter can work according to the MPPT scheme with a high efficiency. The voltage interval in
which the rechargeable storage is connected to the load is programmed by a set of resistors forming
another voltage division network. [58]
The integrated circuit comes in three variants with slightly different functionality, the bq25504 being
the most basic model includes the functionality described above. The bq25505 also includes two gate
drivers which can be connected to the gates of two transistor switches to automatically switch to a
backup battery when the voltage of the rechargeable storage decreases below the programmed
level. The bq25570 has in addition to the features of the bq25504 a buck converter on the output to
provide a regulated output voltage. [60] [61]
5.2.2 Market investigation
To get a range for the price of energy harvesting chips with MPPT functionality, prices were collected
from the respective website of three manufacturers and presented in Table 4. The table is made for
the purpose of getting a rough estimate of the price of energy harvesting chips and is not made for
comparing the functionality of different chips.

22
Table 4: Prices of energy harvesting chips with MPPT functionality.
Manufacturer Product name Price per unit (USD)
Texas Instruments bq25504 2.05 USD / 1 ku6
bq25505 2.25 USD / 1 ku6
bq25570 3.20 USD / 1 ku6
Analog Devices ADP5090 1.99 USD / 1 ku7
ADP5091 2.49 USD / 1 ku7
ADP5092 2.49 USD / 1 ku7
LTC3105 2.70 USD / 1 ku7
LTC3106 2.94 USD / 1 ku7
STMicroelectronics SPV1040 3.10 USD / 1 ku8
SPV1050 2.99 USD / 1 ku9
From Table 4 it is seen that the price for the chips lie roughly in the range of 2-3 USD per unit for a
quantity of 1000 units, not counting the external components that are required. The external
components that are required generally include an inductor for the switched converter, capacitors
and resistors. A breakdown of the cost of an energy harvesting solution based on the bq25505 can be
found in chapter 7.6.
5.3 SOLUTIONS WITHOUT MPPT While MPPT ensures that the solar cells operate in the MPP it increases the cost of the product and
introduces losses in the system via the converter and control logic. It should also be considered if it is
possible to get good efficiency from the system through a design where the solar cells and
rechargeable storage are carefully selected such that they naturally work at an acceptable level of
efficiency without MPPT.
If the energy storage medium has a fairly constant voltage, which is the case for many batteries, the
solar cell and battery can be selected such that the battery voltage is close the MPP of the solar cell
[50]. This does not guarantee that the solar cells operate at MPP in the same way as MPPT does since
it does not react to changing light conditions, but with a good design it can provide good efficiency at
a reduced cost.
An example of an energy harvesting solution with a backup battery but without MPPT is shown in
Figure 7. The solar cell module charges the C1 capacitor which is used as rechargeable storage. When
the C1 capacitor is charged above 3 V plus a diode drop, the D1 diode is forward biased and the D2
diode is blocking, and so the rechargeable storage is used to power the load. If the C1 capacitor has
not been charged enough, the D1 diode is blocking and the D2 diode is forward biased so that the
backup battery powers the load. A voltage regulator is put on the output to get a stable voltage
across the load. The maximum voltage that the C1 capacitor is charged to is defined by the OCV of
the solar cell module. Since there is no boost converter between the solar cell module and the
rechargeable storage, the solar cell must have a high OCV to be able to store sufficient energy in the
capacitor without requiring a too high capacitance.
6 Price from Texas Instruments, http://www.ti.com/power-management/battery-management/energy-harvesting/products.html, accessed 2018-07-10. 7 Price from Analog Devices, http://www.analog.com/en/parametricsearch/11503, accessed 2018-07-10. 8 Price from STMicroelectronics, https://www.st.com/content/st_com/en/products/power-management/photovoltaic-ics/mppt-dc-dc-converters/spv1040.html#samplebuy-scroll, accessed 2018-07-10. 9 Price from STMicroelectronics, https://www.st.com/content/st_com/en/products/power-management/photovoltaic-ics/mppt-dc-dc-converters/spv1050.html#samplebuy-scroll, accessed 2018-07-10.

23
Figure 7: Energy harvesting solution with backup battery but without MPPT. 10
An estimate of the cost of the energy harvesting solution in Figure 7 excluding the rechargeable
storage is shown in Table 5. As can be seen in the table the cost of this solution is at least 10 times
lower compared to an energy harvesting chip, not even counting the external components that are
required by the energy harvesting chip.
Table 5: Estimate of the cost of the energy harvesting circuit in Figure 7.
Designator(s) Part Quantity Price per unit (USD)
Energy harvesting circuit 0.30
D1, D2 ON Semiconductor BAT43XV2
2 0.02 / 200 ku11
Voltage regulator Torex Semiconductor Ltd XC6201P302PR-G10
1 0.26 / 1 ku11
10 Based on schematic provided by engineer with experience with solar cells. 11 Price from DigiKey SE, https://www.digikey.se/, accessed 2018-07-17.
24
6 MEASUREMENTS
To evaluate the potential of using solar cells it is desirable to measure the output power in the
environment where they will be used, particularly since it can be hard to estimate the output power
based on the information found in datasheets.
Measurements were done in a home environment at two typical locations for the magnet contact
alarm node; in windows and at the inside of front doors. The home environment measurements
were made with sunlight as the only source of light. These measurements are supplemented by
separate measurements made in a lab environment investigating how much power the solar cells
produce in artificial light.
The goal of the measurements is to compare the performance of different solar cells in different
locations, mounting directions and with different light sources. The aim is also to make a rough
estimation of the amount of energy that can be harvested.
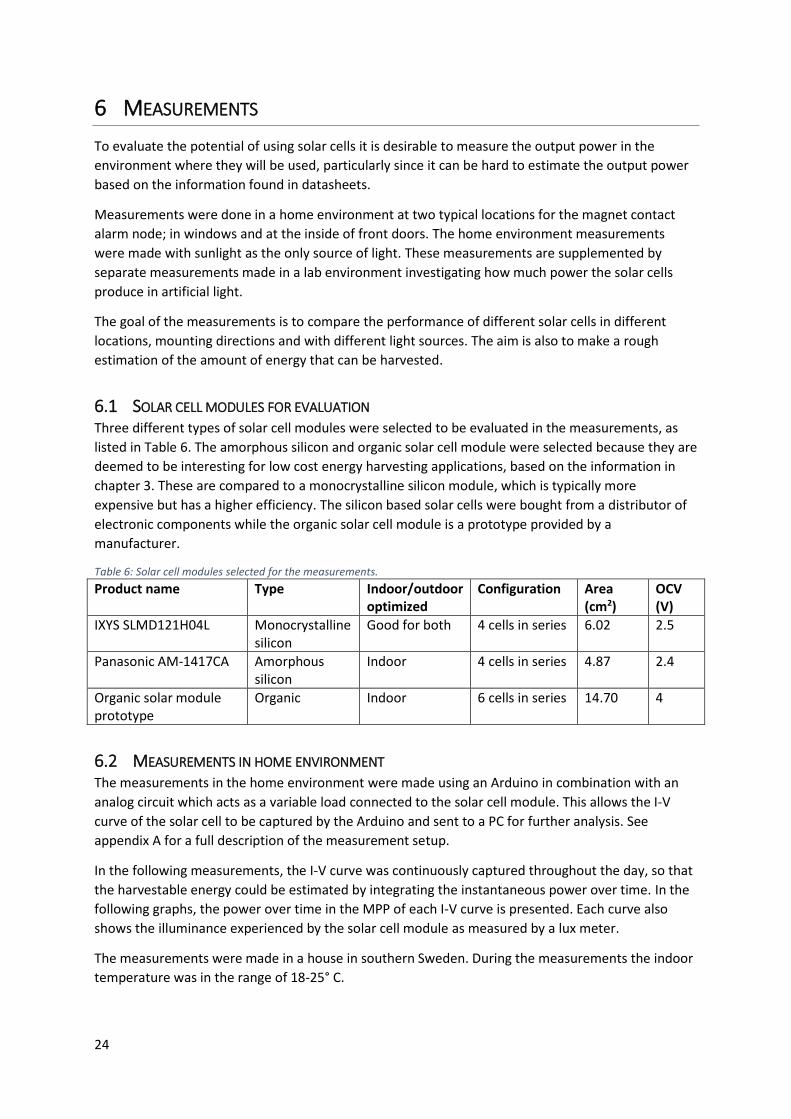
6.1 SOLAR CELL MODULES FOR EVALUATION Three different types of solar cell modules were selected to be evaluated in the measurements, as
listed in Table 6. The amorphous silicon and organic solar cell module were selected because they are
deemed to be interesting for low cost energy harvesting applications, based on the information in
chapter 3. These are compared to a monocrystalline silicon module, which is typically more
expensive but has a higher efficiency. The silicon based solar cells were bought from a distributor of
electronic components while the organic solar cell module is a prototype provided by a
manufacturer.
Table 6: Solar cell modules selected for the measurements.
Product name Type Indoor/outdoor optimized
Configuration Area (cm2)
OCV (V)
IXYS SLMD121H04L Monocrystalline silicon
Good for both 4 cells in series 6.02 2.5
Panasonic AM-1417CA Amorphous silicon
Indoor 4 cells in series 4.87 2.4
Organic solar module prototype
Organic Indoor 6 cells in series 14.70 4
6.2 MEASUREMENTS IN HOME ENVIRONMENT The measurements in the home environment were made using an Arduino in combination with an
analog circuit which acts as a variable load connected to the solar cell module. This allows the I-V
curve of the solar cell to be captured by the Arduino and sent to a PC for further analysis. See
appendix A for a full description of the measurement setup.
In the following measurements, the I-V curve was continuously captured throughout the day, so that
the harvestable energy could be estimated by integrating the instantaneous power over time. In the
following graphs, the power over time in the MPP of each I-V curve is presented. Each curve also
shows the illuminance experienced by the solar cell module as measured by a lux meter.
The measurements were made in a house in southern Sweden. During the measurements the indoor
temperature was in the range of 18-25° C.

25
6.2.1 Window location
The three solar cell modules were evaluated in two windows, one facing approximately north-west
and the other facing south-east. The windows are normal glass windows and have not been designed
to block IR wavelengths (the windows are not low-E windows). Since the magnet contact alarm node
has different surfaces facing different directions and due to the fact that it can be mounted in
different locations in a window, two ways of mounting the solar cell modules were tested in the
measurements, as shown in Figure 8.
Figure 8: The two ways the solar cell modules are mounted in the window measurements.
The layout of the room and the position of the windows are shown in Figure 9.
Figure 9: Layout of the room where the window measurements are done.
The conditions for the measurements are listed in Table 7.
Table 7: Conditions for the measurements on the 24th of May 2018.
Date Sunrise and sunset (CEST)
Weather conditions
I-V curve sampling interval (min)
Current sense resistor (Ω) (see appendix A)
2018-05-24 04:41, 21:28 Cloud free (sunny)
60 Varied between 100 and 1463

26
The maximum power over time in the north-west window can be seen in Figure 10 for a 90°
mounting angle and in Figure 11 for a 180° mounting angle. The equivalent measurements in the
south-east window are shown in Figure 12 and Figure 13.
Figure 10: Maximum power per area over time for NW window with solar cell mounted at a right angle from the window (90°).
Figure 11: Maximum power per area over time for NW window with solar cell mounted behind the window frame (180°).
Figure 12: Maximum power per area over time for SE window with solar cell mounted at a right angle from the window (90°).
Figure 13: Maximum power per area over time for SE window with solar cell mounted behind the window frame (180°).
Note that the different curve forms seen in the figures above is the result of them being located in
different windows facing different directions and because they are oriented in different ways. For
example Figure 10 shows peaks in the morning and evening since it is facing north-west while Figure
12 shows a single peak at the middle of the day since it is facing south-east. Reflections in window
board, furniture and other objects also seem to play a big role, which can be seen by the difference
in scale of the curves in Figure 11 and Figure 13 which both shows cases for when the solar cells
where facing inwards towards the room, but for different windows. The proximity of the neighboring
houses also plays a role since they cover the Sun at different times and also provide a good amount
of reflection depending on the paint of the houses.

27
The maximum harvestable energy for the whole day calculated by integrating the maximum power
over time can be found in Table 8 for both windows and mounting angles.
Table 8: Maximum harvestable energy per area on the 24th of May 2018.
Window Mounting angle
Maximum harvestable energy per area for the whole day (Ws/cm2)
Organic solar cell module
Amorphous solar cell module
Monocrystalline solar cell module
North-west 90° 0.8596 2.6855 4.2367
North-west 180° 0.1034 0.2079 0.5113
South-east 90° 1.9562 13.7092 76.6322
South-east 180° 0.7640 2.3066 5.6297
6.2.2 Front door location
The three solar cell modules are also evaluated on the inside of two front doors of the house. Again,
the magnet contact can be mounted in different ways. The magnet contact alarm node is most often
placed on the door frame and the permanent magnet is often placed on the door itself, however the
opposite is also possible. When the sensor is placed on the door frame, the largest plane of the
sensor is facing a direction perpendicular to the plane of the door, from here on referred to as the
“frame plane”. If the sensor is instead placed on the door, the largest plane of the sensor is instead
facing the same direction as the door plane. The direction that the sensors largest plane faces for the
two cases is shown in Figure 14.
Figure 14: Shows the direction that the main plane of the sensor is facing when the sensor is placed on the door and on the frame.
The conditions for the measurements are listed in Table 9.
Table 9: Conditions for the measurements on the 9th of May 2018.
Date Sunrise and sunset (CEST)
Weather conditions
I-V curve sampling interval (min)
Current sense resistor (Ω) (see appendix A)
2018-05-09 05:08, 21:01 Cloud free (sunny)
60 4550

28
The two front doors where the measurements took place are referred to as front door 1 and front
door 2. The layout of the room with front door 1 is shown in Figure 15 and the layout of the room
with front door 2 in Figure 16.
Figure 15: Layout of the room with front door 1.
Figure 16: Layout of the room with front door 2 and layout of connecting room showing that the door is in parallel with a window.
The maximum power over time at front door 1 is shown in Figure 17 when the solar cell modules are
mounted on the door plane and Figure 18 when mounted on the frame plane. The equivalent
measurements for front door 2 are shown in Figure 19 and Figure 20.

29
Figure 17: Maximum power per area over time for front door 1 at the door plane.
Figure 18: Maximum power per area over time for front door 1 at the frame plane.
Figure 19: Maximum power per area over time for front door 2 at the door plane.
Figure 20: Maximum power per area over time for front door 2 at the frame plane.
The maximum harvestable energy for the whole day calculated by integrating the maximum power
over time can be found in Table 10 for both front doors and both mounting planes.
Table 10: Maximum harvestable energy per area on the 9th of May 2018.
Front door Mounting plane
Maximum harvestable energy per area for the whole day (Ws/cm2)
Organic solar cell module
Amorphous solar cell module
Monocrystalline solar cell module
1 Door 0.0388 0.0852 0.0955
1 Frame 0.0312 0.0727 0.0797
2 Door 0.0387 0.0828 0.1398
2 Frame 0.0228 0.0519 0.1019
6.2.3 Comparison of sunny and cloudy day
Two earlier measurements made on the organic solar cells mounted in the two already described
windows at 90° mounting angle is presented here to show the difference between a sunny and a
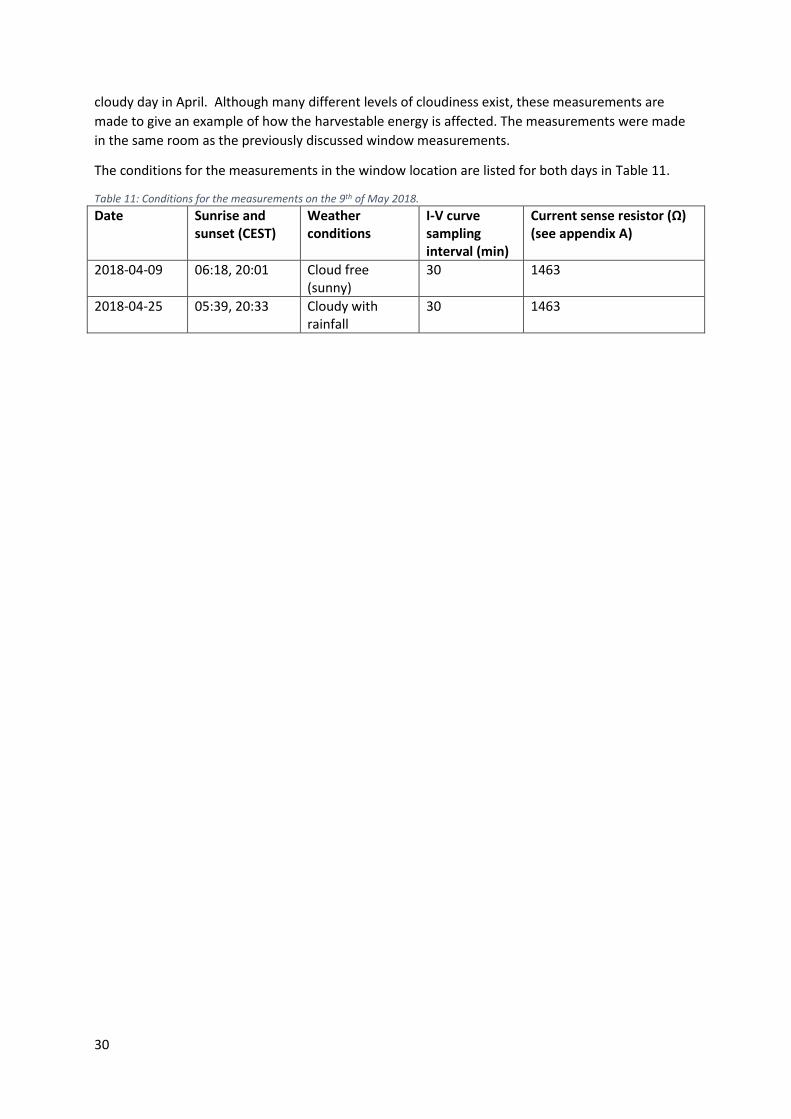
30
cloudy day in April. Although many different levels of cloudiness exist, these measurements are
made to give an example of how the harvestable energy is affected. The measurements were made
in the same room as the previously discussed window measurements.
The conditions for the measurements in the window location are listed for both days in Table 11.
Table 11: Conditions for the measurements on the 9th of May 2018.
Date Sunrise and sunset (CEST)
Weather conditions
I-V curve sampling interval (min)
Current sense resistor (Ω) (see appendix A)
2018-04-09 06:18, 20:01 Cloud free (sunny)
30 1463
2018-04-25 05:39, 20:33 Cloudy with rainfall
30 1463

31
The measurements on the sunny day 9th of April for the north-west window are shown in Figure 21
and for the south-east window in Figure 22.
Figure 21: Maximum power per area over time for the NW window on the sunny day 9th of April 2018 (90° mounting angle).
Figure 22: Maximum power per area over time for the SE window on the sunny day 9th of April 2018 (90° mounting angle).
The measurements on the cloudy day 25th of April for the north-west window are shown in Figure 23
and for the south-east window in Figure 24.
Figure 23: Maximum power per area over time for the NW window on the cloudy day 25th of April 2018 (90° mounting angle).
Figure 24: Maximum power per area over time for the SE window on the cloudy day 25th of April 2018 (90° mounting angle).
The maximum harvestable energy for each day calculated by integrating the maximum power over
time can be found in Table 12.
Table 12: Harvestable energy on the sunny day 9th of April 2018 and the cloudy day 25th of April 2018 when working at MPP.
Weather condition Maximum harvestable energy per area for the whole day (Ws/cm2)
NW window SE window
Sunny day (9th of April 2018) 1.1631 2.2330
Cloudy day (25th of April 2018) 1.2014 0.9611

32
6.3 MEASUREMENTS IN LAB ENVIRONMENT The measurements in the lab environment were made using the N6705 DC Power Analyzer from
Keysight Technologies. The I-V curves for the solar cell modules were measured by programming the
N6705 to increase the current linearly while measuring the voltage and current. When the I-V curves
were captured they were transferred to a PC and the MPP of each I-V curve was found. The voltage
measurements were made with an accuracy of ≤ 2.45 mV while the current measurements were
made with an accuracy of ≤ 10.4 µA for currents above 1 mA and an accuracy of ≤ 350 nA for currents
below 1 mA.
6.3.1 Performance in artificial light
The three solar cell modules were tested in the light from the three sources of artificial lighting which
are listed in Table 13. All measurements were performed in a room which had an illuminance of 0.01
lux when the artificial light source was turned off, which was considered dark enough to not affect
the measurements. The ambient temperature in the lab room was measured to 24.5° C. The distance
between the solar cell modules and the light source was varied, effectively varying the illuminance at
the solar cell modules, so that graphs showing the maximum power as a function of illuminance
could be created. Because the lamps were connected to a 50 Hz wall outlet, the captured IV curves
had to be filtered with a moving average filter before the MPP could be found. The illuminance was
measured using a lux meter.
Table 13: LED, CFL and Halogen lamps used in the experiment.
Lamp Type Color temperature Lumen (lm) Power rating
Ledsavers Globlampa E27
LED 2700 K 806 9 W (≈ 60 W)
Osram Duluxstar E27
CFL 2700 K 825 11 W (≈ 60 W)
Osram Classic Superstar E27
Halogen 2700 K 700 46 W (≈ 60 W)
The measurement results showing the maximum power for the three solar cells for the three types of
artificial lights are shown in Figure 25, Figure 26 and Figure 27.

33
Figure 25: Maximum output power of the three solar cell modules in the light from a LED lamp.
Figure 26: Maximum output power of the three solar cell modules in the light from a CFL lamp.
Figure 27: Maximum output power of the three solar cell modules in the light from a halogen lamp.
The distance between the solar cell modules and the light source is shown for each level of
illuminance in Table 14.
Table 14: Distances between lamp and solar modules for each level of illuminance for all three lamps.
Illuminance (lux) Distance between lamp and solar cell module (cm)
LED lamp CFL lamp Halogen lamp
100 105.5 94.5 125.0
250 60.0 56.5 65.5
500 42.0 39.0 43.5
1000 30.5 28.0 30.5
By assuming that the lamps are turned on for 24 hours a day, the energy that can be harvested each
day is calculated by multiplying the measured power by 24 hours. This energy is presented in Figure
28, Figure 29 and Figure 30.

34
Figure 28: Maximum harvestable energy for 24h in the light of a LED lamp.
Figure 29: Maximum harvestable energy for 24h in the light of a CFL lamp.
Figure 30: Maximum harvestable energy for 24h in the light of a halogen lamp.

35
7 PROTOTYPE
To demonstrate how solar cells can be used to power a wireless alarm node a prototype was built for
Verisure’s existing magnet contact node. The magnet contact has low power consumption and is
used on windows which provide good light conditions.
The solution for harvesting energy was built based on the bq25505 energy harvesting chip from
Texas Instruments. The solution includes a supercapacitor used for storing energy that is harvested
during the day so that it can be consumed during the night. To make sure that the alarm node can
function even during times when the harvested energy is not enough, the solution also includes a
primary battery which is used for backup power (CR2025 lithium coin cell battery). An organic solar
cell module manufactured to fit the plastic casing of the magnet contact node was used for
harvesting light.
The energy harvesting solution was then connected to the power terminals of a magnet contact,
which is otherwise normally powered by two AAA batteries. A system overview of the prototype can
be seen in Figure 31.
Figure 31: Overview of the energy harvesting system built for the prototype.
The following chapters include a description of the magnet contact node and a more in depth
description of the prototype that was built.
7.1 MAGNET CONTACT The magnet contact node is used on windows or doors to detect if the window/door is closed or
open. The detection mechanism consists of a permanent magnet placed on either the window/door
itself or on the frame which is fixed to the walls of the house. The magnet contact sensor is then
placed on the opposite option, either the window/door or on the frame. When the window/door is
opened the magnetic field sensed by the magnet contact sensor changes, and the detection
mechanism is achieved.
The approximate shape of Verisure’s magnet contact sensor along with the area of each surface is
shown in Figure 32.

36
Figure 32: Approximate shape of Verisure’s magnet contact sensor.
The average power consumption of the magnet contact is less than 50 µW, which means that the
device consumes less than 4.32 Ws per day. Two AAA batteries connected in series are normally used
to power the device. The alarm circuit contains a voltage regulator on the input to control the
voltage over the rest of the circuit. While the average power consumption of the device is low, the
current drawn by the device increases substantially during radio transmission which occurs
periodically.
7.2 SOLAR CELL MODULE Both the long side and the front side of the magnet contact sensor were considered when deciding
which surface to put the solar cells on. When the magnet contact sensor is mounted on a window,
the front side forms a 180° angle to the window such that the front side surface faces towards the
room away from the window. The long side instead forms a 90° angle to the window which means
that the surface can be illuminated by direct sunlight. From the measurement results presented in
chapter 6 it was seen that putting solar cells in a 90° angle to the window was the better orientation
for harvesting energy. Depending on the thickness of the frame that is attached to the window there
might however be some cases when the long side of the magnet contact sensor is shaded, in which
case the advantage is lost. Because of this fact and because the front side has a larger surface area, it
was decided to put solar cells on the front side of the magnet contact sensor.
It was decided to go for organic solar cells since they are projected to be cheap and because of the
recent improvements in efficiency, as discussed in chapter 3.3.3. An organic solar cell module is also
a good fit for the product since they are thin and because a module with a custom shape can easily
be manufactured. The effective area of the solar cell module ended up being 16 cm2 as some margins
were left to the edges of the surface of the magnet contact sensor (for a final product the margins
can be reduced).
The number of cells in series in the organic solar cell module was selected with the bq25505 energy
harvesting chip in mind. When the voltage of the supercapacitor is below approximately 1.7 V the
bq25505 chip will work in cold-start mode. In this mode the chip will clamp the voltage across the
solar cell module to 0.3 V. For the chip to be able to charge the supercapacitor at a good rate in the
cold-start mode it is therefore important that the solar cell module can deliver a high current at 0.3
V. For this reason the solar cell module was manufactured with only a few cells in series such that the
OCV was approximately 1.3 V.
It was noted that the efficiency of the boost converter which is part of the bq25505 chip is highly
dependent on the voltage and current. To optimize the prototype further it would therefore be
necessary to test different solar cell modules with different number of cells in series to find a balance
between high efficiency and the ability to leave cold-start mode.

37
7.2.1 Energy harvestable in natural light
A rough estimation of the amount of energy that can be harvested per day for the different months
of the year was made. The estimation was made by extrapolating values measured in May, as
presented in chapter 6.2.1, using data from the Swedish Meteorological and Hydrological Institute
(SMHI).
The extrapolation was based on the harvestable energy per area per day as measured in May for the
case when the organic solar cell module was mounted at a 180° angle to the window (values from
Table 8). It was first assumed that the measurements were made in June, since they were actually
made in late May on the 24th, as to not overestimate the energy. The harvestable energy per area
was calculated for each month by scaling the value for June with the ratio between global irradiance
in June and for each month, as found in the data from SMHI (normal values of global irradiance for
1961-1990 in Lund, southern Sweden12).
The extrapolated values for harvestable energy per area were then multiplied by 16 cm2 to get
absolute values for the energy that can be harvested per day with the solar cell module used in the
prototype. The results of this estimation can be seen in Figure 33. It should be noted that the
extrapolation is based on the measurements made in May on a mostly cloud-free day, and that a
more realistic estimation would instead have to be based on an average of cloud-free and cloudy
days.
Figure 33: Estimated energy harvestable per day for each month of the year (16 cm2 organic solar cell, 180° angle to window).
From Figure 33 it can be seen that the energy that can be harvested in north-west facing windows is
not enough to supply the energy consumed by the magnet contact (4.32 Ws). For a south-east facing
window the graph shows that there is an abundance of energy from March to September.
Appendix C shows the same energy estimations, made for all three solar cell types tested in chapter
6, assuming instead a solar cell module of 20 cm2 corresponding to the full front side area of the
magnet contact node.
12 Based on monthly data for global irradiance in Lund from SMHI 2017-files (normal values for 1961-1990). Available at: https://data.smhi.se/met/climate/time_series/month/vov_pdf/, accessed 2018-04-26.

38
7.2.2 Energy harvestable in artificial light
An estimation of the amount of energy that can be harvested in the light from LED, CFL and halogen
lamps was also made. The estimation was based on the measurement results for organic solar cells
presented in chapter 6.3.1.
The estimation was made for a total of four different cases; two different levels of illuminance and
two different values for the number of hours that the lamps are turned on per day. The two levels of
illuminance were 100 and 250 lux and the number of hours were 6 and 12 hours. The levels for
illuminance were selected as the two levels for which data had been collected in 6.3.1 which were
closest to the level of illuminance recommended for general lightning in a living room (100-200 lux
according to a guide by lamp retailer Beacon Lighting Commercial [62]). During winter time it was
considered reasonable to have lamps turned on for 6 hours or more if you get home from work at 6
pm and go to sleep at 12 pm. Having the lamps turned on for 12 hours per day was included as an
extreme case.
Table 15: Estimated energy harvestable in artificial light (16 cm2 organic solar cell module, percent of magnet contact daily energy consumption shown in parenthesis).
Number of hours per day with lamps turned on (h)
Illuminance (lux)
Energy harvestable in light from LED lamp (Ws)
Energy harvestable in light from CFL lamp (Ws)
Energy harvestable in light from halogen lamp (Ws)
6 100 0.33 (7.6 %) 0.29 (6.7 %) 0.60 (13.8 %)
250 0.98 (22.6 %) 0.86 (19.9 %) 1.56 (36.1 %)
12 100 0.66 (15.3 %) 0.58 (13.4 %) 1.20 (27.7 %)
250 1.96 (45.3 %) 1.72 (39.8 %) 3.12 (72.2 %)
Appendix C shows the same energy estimations, made for all three solar cell types tested in chapter
6, assuming instead a solar cell module of 20 cm2 corresponding to the full front side area of the
magnet contact node.
7.3 ENERGY STORAGE It was decided to have a rechargeable storage with enough energy capacity to power the magnet
contact during the night. The choice fell on a supercapacitor because they were easily obtainable and
because of their looser requirements for operating safely.
By taking into account the power consumption of the magnet contact and the maximum leakage
current of a particular supercapacitor of 1 F it was found that it would be able to power the magnet
contact for 10.7 hours in the worst-case scenario. The leakage current of the selected supercapacitor
was stated to be at max 6 µA after 72 hours [46]. By assuming that this level of leakage occurs at for
example 3 V, the leakage power can be estimated as 3 𝑉 ∙ 6 µ𝐴 = 18 µ𝑊, which shows that the
leakage can be quite large in comparison to the average power consumption of 50 µW for the
magnet contact.
7.4 POWER ELECTRONICS It was decided to use an energy harvesting chip since the functionality they provide is convenient for
the application. The particular chip that was selected is the bq25505 from Texas Instruments. This
chip was selected since it is well documented, can automatically switch to a backup battery and
because it did not include a voltage regulator on the output (which the magnet contact already has
on the input).

39
A 3 V lithium CR2025 coin cell battery was used as backup battery such that bq25505 connects it to
the output node when the voltage of the supercapacitor drops too low. The coin cell battery was not
seen as the ideal backup battery, but was selected for the prototype because it could easily fit into
the plastic casing of the magnetic contact without a mechanical redesign. The limitations of the coin
cell battery include the fact that the capacity is fairly low, which makes it possible that the battery
would have to be replaced after a while. Another limitation is that the voltage will drop substantially
when drawing high currents, which the magnet contact periodically does. To prevent the voltage
drop two big capacitors of 1.5 mF each had to be incorporated in the design.
7.5 PCB DESIGN A two layer PCB was designed in a CAD program, basing the schematic and layout on the
recommendations found in the datasheet of the bq25505 and the bq25505 evaluation module. The
resistors in the resistor divider networks where chosen such that the voltage of the supercapacitor
stayed within the acceptable voltage range of the voltage regulator of the magnet contact circuit (the
chosen interval was approximately 2.4 V to 3.8 V). When the voltage of the supercapacitor falls
below 2.4 V the bq25505 will then automatically switch to using the backup battery.
A battery holder was included on the bottom side of the PCB to be able to conveniently connect the
backup battery. Pads were put on the board such that wires could be soldered to make all the
external connections (supercapacitor, solar cell module and magnet contact alarm circuit).
The board was designed to fit inside the plastic casing of the magnet contact sensor and the final
dimensions ended up being approximately 33x19 mm. Pictures of the 3D model for the board can be
seen in Figure 34 and Figure 35. The full schematic and PCB layout can be seen in appendix B.
Figure 34: Top view of the PCB designed for the prototype.
Figure 35: Bottom view of the PCB designed for the prototype.

40
7.6 ESTIMATION OF COST An estimation of the cost of the energy harvesting solution was made and the results can be seen in
Table 16. The cost of the solar cell module is based on the lowest price per area of amorphous silicon
solar cells as found in chapter 3.3.5 since the price of the organic solar cell module was not available.
The cost of the backup battery, battery holder and the C5 and C6 capacitors is not included since
these components are a result of the choice of primary battery. Because the particular battery was
only selected based on the criteria of easily fitting inside the plastic casing of the magnet contact it
was not relevant to include the cost.
The cost of the C3 and C4 capacitors are also not included in the table since they are not required in a
final design. They were put on the board only to be able to test the functionality of the circuit
without connecting the supercapacitor.

41
Table 16: Estimated cost of the energy harvesting solution built for the prototype.
Designator(s) Part description Quantity Price per unit (USD)
Solar cell module 1.76
Connected to TP3 and TP4
Organic solar cell module, 16 cm2
1 Not available
Only used for estimating price of a solar cell module (not used in design)
Amorphous silicon solar cell module, 16 cm2 (price per area for Panasonic AM-1816)13
- 1.76 / 1 ku
Energy harvesting circuit 3.49
U1 TI bq25505 1 2.25 / 1 ku14
L1 Coilcraft LPS4018-223 1 0.58 / 2 ku15
Q1, Q2 Rohm US6J11TR 2 P-channel
2 0.22 / 3 ku16
C1 Cap 4.7 µF 0805 X7R 10 V 1 0.039 / 3 ku16
C9 Cap 4.7 µF 0603 X7R 6.3 V 1 0.021 / 4 ku16
C2, C10 Cap 100 nF 0402 X5R 10 V 2 0.006 / 10 ku16
C7 Cap 10 nF 0402 X7R 1 0.02 / 5 ku16
R1-R13 Various resistors 13 ~0.01 / 100 ku16
C3, C4 Cap 47 µF 1206 X5R 6.3 V 2 Not included in cost
C5, C6 Kemet T520H158M006ATE055 1.5 mF
2 Not included in cost
J1 Keystone 1058TR coin cell battery holder
1 Not included in cost
Rechargeable storage 1.81
Connected to TP1 and TP2
AVX Corporation SCMR18C105MRBA0 1 F
1 1.81 / 5 ku16
Backup battery
Placed in battery holder
3 V lithium coin cell CR2025
1 Not included in cost
TOTAL COST 7.06
It should be noted that the prices are valid for quantities of a few thousand units and that lower
prices can usually be expected for larger quantities.
13 This particular amorphous solar cell module was found to have the lowest price per area in the investigation described in chapter 3.3.5 (0.11 USD/cm2). 14 Price from Texas Instruments, http://www.ti.com/power-management/battery-management/energy-harvesting/products.html, accessed 2018-07-06. 15 Price from Mouser, https://www.mouser.se/, accessed 2018-07-17. 16 Price from DigiKey SE, https://www.digikey.se/, accessed 2018-07-17.

42
7.7 RESULTS The PCB that had been designed was ordered from a manufacturer and the components were
soldered onto it by hand. The functionality of the circuit was first tested in a lab environment to see
that everything was working. It was verified both that the supercapacitor stayed under its maximum
voltage limit and that the backup battery was being connected to the output node when the voltage
of the supercapacitor dropped too low.
A first prototype was built by putting the supercapacitor and circuit board inside the plastic casing of
the magnet contact. Inside the casing the circuit board was connected to both the magnet contact
alarm circuit and to the supercapacitor. Since it was difficult to solder directly onto the electrodes of
the solar cell module it was decided to drill hole through the electrodes and through the plastic
casing of the magnet contact. Metal screws were then put through each hole, and next a washer and
nut was put on each screw on the inside of the casing. Small wires were put between the casing and
each washer before tightening the screws such that electrical contact was achieved between the
solar cell module and the wires. The other end of each wire was then connected to the circuit board
such that electrical contact was established between the board and the solar cell module.
The first prototype was tested, but it was quickly found that the supercapacitor was only being
charged at a very slow rate and only for a few hours each day. This lead to the belief that the solar
cell module was either damaged from the drilling or that the electrical contact between the circuit
board and the solar cell module was bad. A second prototype was therefore built, this time leaving
all components outside of the plastic casing of the alarm node (except for the alarm circuit itself). An
identical solar cell module was then connected to the circuit board, this time using crocodile clips to
connect to the electrodes.
The two prototypes were then tested simultaneously while positioned in the same window board
and having the alarm nodes connected to the same alarm system. The alarm nodes were oriented
such that the solar cells formed a 90° angle to the window, which is a more advantageous orientation
compared to the real orientation in which it would be normally mounted. An Arduino Mega was then
used to continuously log the electrical potential in the important nodes of the two prototypes (10
min intervals). It was confirmed that both magnet contact nodes transmitted the correct wireless
data packets by monitoring the logs of the alarm panel to which they were connected. The results
showed that the supercapacitor in the second prototype was charged at a much higher rate
compared to the first prototype, confirming that the first prototype had a damaged solar cell module
or a bad electrical connection. The test setup can be seen in Figure 36 and the measurement results
can be seen in Figure 37.

43
Figure 36: Test setup for the simultaneous measurements on the two prototypes.
Figure 37: Result of the measurements made on the two prototypes (between the 14th and 16th of August 2018, south-east facing window, Malmö, Sweden).
It can be seen that prototype 2 is always using the supercapacitor as energy source when supplying
the alarm node with power, since the dashed output voltage curve follows the supercapacitor curve.
For prototype 1 it can be seen that the dashed output voltage curve does not always follow the
supercapacitor curve, meaning that the output node of the PCB is connected to the 3 V lithium coin
cell battery when the voltage of the supercapacitor is too low. For Wednesday it can be seen that the
supercapacitor in prototype 2 stops being charged at a specific voltage, which corresponds well to
the voltage limit which it was programmed to respect. On Thursday close to the end of the
measurements, the curve of the supercapacitor voltage for prototype 2 shows that it exceeds 4 V,
which is higher than the limit that was set. It can however be seen that there is a sudden jump in all

44
of the voltage curves, which lead to the belief that there was something wrong with the
measurements. A multimeter was then used to confirm that 1) the voltage of the supercapacitor was
in fact 3.68 V, which is under the voltage limit and 2) that the analog reference pin of the Arduino
was at 4.57 V, whilst it was expected to be at 5 V (AREF pin). Recalculating the correct voltage values
with the factor 4.57
5 showed that the voltage of the supercapacitor was in fact below the maximum
voltage limit. Since the Arduino Mega was powered over a USB cable, it was tested to instead power
it with a wall power adapter and it was found that the analog reference pin would then rise to 5 V. It
is believed that the anomaly at the end of the measurements was caused by a sudden change in
voltage output by the USB socket.
The voltage over the solar cell modules can be seen to be approximately 0.6 V when the
supercapacitors are being charged which corresponds to the programmed 50 % OCV fraction for the
reference of the MPPT regulator. On Wednesday the solar cell module for prototype 2 went up to a
higher voltage, a bit under 1.5 V, which corresponds to the OCV of the solar cell module. This voltage
level was seen when prototype 2 stopped charging because the voltage of the supercapacitor had
reached the limit.
From the results it can be seen that the supercapacitor is large enough to power the magnet contact
throughout the night if it is fully charged.

45
8 DISCUSSION
This chapter discusses the results of the measurements and the information that was collected about
the different questions that this thesis investigates.
8.1 SOLAR CELL TECHNOLOGIES Crystalline silicon was found to be the solar cell type which dominates the market today. While this
type of solar cell can harvest much more energy compared to e.g. amorphous silicon solar cells, their
use in wireless alarm nodes may be less favored due to their higher cost. Amorphous silicon solar
cells are more favorable in this aspect since they are cheaper and have proven use in smaller
electronic products. They can possibly be easier to integrate mechanically because they can be made
thinner and mechanically flexible. While the lifetime cannot compete with that of crystalline silicon
solar cells, the lifetime of 15 years should be enough since the alarm system by then most likely has
been replaced due to other factors such as outdated technology.
Organic and dye-sensitized solar cells which belong to the third generation solar cells are interesting
contestants to the more established amorphous silicon solar cells. They show good potential for the
use in smaller electronics products since they can be produced cheaply, because they are thin and
flexible and because they work well in low light environments. Literature reports that they can
sometimes harvest more power in indoor light conditions compared to amorphous silicon solar cells,
such as in fluorescent light. This could however not be confirmed by the measurements described in
chapter 6. The lifetime is reported to be much shorter compared to amorphous silicon solar cells and
could possibly be a problem for the use in wireless alarm nodes. More data about the gradual loss of
power capacity is required to deduce if the lifetime is a problem or if the capacity that is lost during
the lifetime of the product is acceptable.
Another aspect which may become more important in the future is the use of low-E windows.
Because low-E windows increase the energy efficiency of a house since heat does not escape as
easily it reasonable that they will become more popular over time. Low-E windows attenuate the IR
wavelengths and can thus reduce the benefit of using solar cells such as crystalline silicon solar cells
which have low bandgaps.
A direct price comparison among different solar cells could not be made since there was a lack of
publicly available price data for the new technologies. From the prices collected from DigiKey it was
found that amorphous silicon solar cells were available from 0.11 USD/cm2. It can be argued that
solar cells in the third generation need to compete with this price considering that they generally still
have lower efficiencies and lifetimes compared to amorphous silicon solar cells.
8.2 ENERGY STORAGE Three different types of energy storage devices have been investigated in this report; capacitors,
supercapacitors and batteries.
The energy capacity of normal capacitors is generally too low to store enough energy for supplying
wireless alarm nodes with power for more than short periods of time. Depending on the physical
constraints of the product it may not be possible to put in multiple capacitors to reach high energy
capacities due to their low energy density. The main use for capacitors is as voltage stabilizers to
prevent the voltage of batteries from dropping too low when there is a peak in load current.

46
The main advantages with supercapacitors are that they have higher energy densities compared to
normal capacitors and that they can generally survive more charge and discharge cycles compared to
batteries. A disadvantage with supercapacitors is that they have high leakage currents which can be
of such order of magnitude that it is comparable to the power consumption of small wireless alarm
nodes. If the power that can be harvested from the solar cells is scarce, the high leakage current can
be very prominent, especially so if the supercapacitor is meant to store energy for longer periods of
time.
If the goal with harvesting energy is to store enough energy to power alarm nodes over weeks or
months it can be necessary to use batteries if physical space is scarce. The low leakage current
compared to the leakage in supercapacitors is also favorable if the energy is stored for long periods.
The operation of batteries usually needs more control compared to a supercapacitor to operate
safely and to maintain a good lifetime. The lifetime of a battery is also usually shorter compared to a
supercapacitor, and the design must consider how much the capacity will fade during the lifetime of
the product.
Many batteries have fairly flat voltage characteristics whereas the voltage of capacitors varies widely
with the state of charge. Since the voltage of batteries is more fixed it can be easier to design an
electrical solution which works at a good efficiency compared to when the voltage is varying over a
wide range. With clever design and matching between the MPP of the solar cells and the nominal
voltage of the battery it might be possible to work close to the MPP without the use of an MPPT chip
and thereby reduce the cost of the solution.
In chapter 4.2.4 it was found that the price of supercapacitors is generally higher compared to the
price of batteries when talking about the price per capacity. For a more accurate price calculation for
an individual application it would however be required to consider if the supercapacitor is never used
below a certain voltage and if the battery is used with a DoD less than 100 %.
8.3 POWER ELECTRONICS To extract maximum power from solar cells it generally a requirement to have a power converter
that is controlled according to a MPPT scheme. The exception is if the solar cell is made to charge a
battery with a flat voltage profile and a nominal voltage close to the MPP of the solar cell, in which
case the same functionality is achieved through good design.
When working with energy storage devices it is required that the electrical solution keeps the
storage within the correct voltage limits. For a capacitor the limit is a maximum voltage while
batteries have both a maximum and a minimum limit. Special chips targeted for energy harvesting
implement both MPPT and limit the voltage of the storage element. Some of these chips also include
the functionality to switch to a backup battery at times when the voltage of the rechargeable storage
is too low and some include a voltage regulator at the output. The disadvantage with these chips is
that they come with a cost of 2-3 USD which can be a substantial amount of the total cost of the
energy harvesting solution. When using an energy harvesting chip the designer should also consider
how the efficiency of the power converters depends on the operating point of the solar cells.
Solar cells can also be used without MPPT by letting them freely charge a capacitor, although the
power output from the solar cell will then vary widely depending on the state of charge of the
capacitor. The advantage of such a solution is that it can be made very cheap and the disadvantage is
that it will extract less power. To fully understand how the amount of power extracted compares to
the power extracted for a system with MPPT it will be necessary to perform simulations or tests in

47
which the capacitance, power consumption of the load and how the incident light naturally varies
must be accounted for.
8.4 MEASUREMENTS The measurements have shown that the there is a large difference between the amount of energy
that can harvested in window locations and at the inside of front doors and among the different
types of solar cells. For the front door measurements it was found that the energy that could be
harvested would cover 65 % of the daily energy consumption of the magnet contact at best.
The monocrystalline silicon module outperformed the other modules by far when it was placed in
the south-east window at a 90° angle to the window. When placed at front door 1 the amorphous
silicon module could compete with the crystalline silicon module, harvesting approximately the same
amount of energy. This can possibly be explained by the fact that front door 1 never received direct
sunlight and that the light that reached this location was mostly from reflection from walls. It can be
the case that the material and paint of the walls reflect the visible light better compared to the IR
waves, although this was not investigated deeper.
The organic solar cell module could harvest up to approximately half the amount of energy
compared to the amorphous silicon module. Although no data for the efficiency of the investigated
modules was available, if an assumption is made that the amorphous silicon module worked at 10 %
that would put the organic solar cell module at approximately 5 %. The difference in performance
between the two modules was bigger when they were placed such that they received direct sunlight.
It should be noted that the particular amorphous silicon module that was tested has a thick glass
substrate while the organic solar cell is a thin plastic film. The amorphous silicon solar cell is also
available as a thin film, but wasn’t obtainable from DigiKey and hence was not tested. From
comparing the rated maximum power of amorphous silicon modules with glass substrates for
outdoor applications and general purpose amorphous silicon modules in thin films, both from
Panasonic, it was found that the glass substrate cells had a rated power per area that was
approximately 25 % higher17. The difference indicates that a thin film version of the amorphous solar
cell can harvest less energy than the glass substrate version, however this could not be deduced with
certainty since there can be other differences between the versions that were compared. For a fair
comparison between amorphous and organic solar cells it would however be required to get hold of
a thin film amorphous solar cell.
The measurements have shown that window locations are interesting for harvesting energy for the
magnet contact alarm node. Depending on the choice of solar cell, mounting angle and time of the
year it can be expected to harvest a good amount of energy in relation to the energy consumption of
the magnet contact alarm node which is often positioned in such locations. As is expected, it was
found that there is a big difference between the amount of energy that can be harvested in a north-
west facing window and in a south-east facing window. In Figure 33 it was seen that the energy
harvestable by the prototype in the north-west window was never enough to fully sustain the
magnet contact. This fact means that the product will need to have a large backup battery, which will
be more utilized in the north-west window compared to the south-east window. The difference
between windows appears to be eliminated on cloudy days on which most of the light is diffuse and
17 Based on comparison of average rated output power per area of AM-5613, AM-5608 and AM-5605 to average rated output power per area of AT-7665, AT-7664 and AT-7666 for both “100 mW/cm2” conditions and “SS-50k lux (Initial)” conditions. The values for the rated power of each product were found in the datasheet available at: https://media.digikey.com/pdf/Data%20Sheets/Sanyo%20Energy/Amorphous_Br.pdf (accessed 2018-08-27).
48
no direct sunlight is incident on the solar cells (as seen in chapter 6.2.3). The measurements also
showed that much more energy can be harvested if the solar cell is mounted in a 90° angle to the
window compared to if it is mounted at a 180° angle. For the case of the magnet contact alarm node
it would therefore be beneficial if the mechanical casing of the product could be modified to allow
the solar cells to face the optimal angle, which lies somewhere in between 0° and 90° between the
solar cell and window.
In the end the measurements that were made in the home environment should only be used as
rough estimates since they do not investigate the average weather conditions. For the prototype a
year round extrapolation of the harvestable energy was made based on values measured on sunny
days. For a better estimation it would be desirable to make measurements over longer periods of
time, e.g. a full month, and then calculate the average harvestable energy per day. This value could
then be extrapolated to all months of the year using the same method, but likely resulting in a more
accurate prediction.
It must also be considered if the AREF pin of the Arduino might have experienced similar voltage
drops as seen in chapter 7.7. By measuring the AREF voltage of the same setup used for the home
environment measurements it was found that it was approximately 4.95 V. It can however not be
concluded with certainty that the USB socket voltage didn’t drop lower during the home
environment measurements as the minimum acceptable voltage according to the USB 2.0 standards
is 4.4 V [63]. If a worst-case scenario of 4.4 V is assumed it would mean that all measured currents
and voltages would need to be multiplied with 4.4
5= 0.88, which means that the calculated output
power of the solar cells should be multiplied by 0.882 = 0.77. This suggests that the energy
harvested by the solar cells can be up to 23 % lower compared to what was presented in chapter 6.2.
The measurements that were made in artificial lights showed that the energy that can be harvested
per day is fairly low if the solar cells are not placed very close to the light source. During winter time
when there is not as many hours of daylight and artificial lighting is heavily relied on in the northern
latitudes the artificial lighting does play a more important role compared to summer time. Basing the
estimation of harvestable energy on artificial light is however not very reliable since there are no
guarantees that an alarm node will be in the vicinity of a lamp and that the lamp is on. In settings
such as industrial warehouses the artificial lighting is more predictable as compared to personal
homes and one could possibly rely more on this type of light when estimating the amount of
harvestable energy.
For the prototype it was shown that lamp light could supply between 6.7 % and 22.6 % of the daily
energy consumption of the magnet contact for 6 h of light from a LED or CFL lamp with light levels
typical for a living room. For 12 hours of light, the same values were between 13.4 % and 45.3 %,
although it is believed that it is unrealistic to keep the lights on for such a long period of time. The
same values for halogen lamps were significantly higher, reaching up to 36.1 % for 6 hours and 72.2
% for 12 hours, although this lamp type also consumes more energy and is probably not used as
much. The levels shown are not enough to fully sustain the magnet contact alarm node, although it
does help especially during winter time when there is less natural light.
8.5 PROTOTYPE A prototype of a solar cell driven magnet contact alarm node was built and tested. The prototype
was built to demonstrate the concept and to better understand the challenges. From the test that
was performed it was found that the prototype seems to be working functionality wise, but will
require further investigations such as measuring the efficiency of the circuit and assessing the light
49
conditions that are required for the supercapacitor to sustain its voltage level when the load is
connected.
The choice of a coin cell battery as backup battery was made since the battery could easily be fitted
into the product. The choice of this type of battery is however not optimal due to its low current
capabilities and energy capacity. Tests must be carried out to find out how long a coin cell battery
can sustain the device before it is depleted, and to assess if this is long enough to have the product
survive its lifetime. The large capacitors of 1.5 mF each that were incorporated in the design because
of the low current capabilities of the battery were electrolyte based capacitors. Such capacitors have
a high current leakage which can further increase losses in the device. If large capacitors are still used
in a future design another type of capacitor should be considered.
All components in the electrical solution must be selected to have as low losses as possible. Some
possible component candidates of the prototype had to be declined due to having a footprint which
made it hard to solder by hand. For a final design each component should be compared to
alternatives with lower losses.
The PCB of the prototype takes up a considerable amount of space in the casing of the magnet
contact alarm node. It is believed that the size can be reduced with a tighter PCB design, but that the
solution will still take up a considerable amount of space in the product. This limits the type of
backup battery which can be used if the current mechanical design should be conserved.
The cost of the prototype was found to be 7.06 USD by considering 16 cm2 of amorphous solar cells
instead of the organic solar cells (as no price data was available for the organic solar cells). This cost
does not include the cost of the components related to the backup battery which is the C5 and C6
capacitors, the battery holder, the coin cell battery itself and does also not include the C3 and C4
capacitors which are not needed in a final design.
As a comparison, the two AAA batteries that are normally used to power the device are available
from approximately 0.2 USD/unit for a quantity of 1000 units18. This suggests that using batteries is a
cheaper option compared to harvesting energy with solar cells, although it must be remembered
that the solution that was built for the prototype uses an energy harvesting chip and that it is
possible to build cheaper solutions but with lower efficiencies (as described in chapter 5.3).
8.6 PROLONGING BATTERY LIFE An energy harvesting solution does not necessarily have to replace the primary batteries that are
typically used to power the alarm nodes, but could instead be used as an addition to increase the
battery life of the same batteries. By not including any rechargeable storage, except for very small
capacitors to act as voltage stabilizers, the energy harvesting system can be made much cheaper. The
solar cell module will then only harvest as much power as is consumed by the alarm node at every
instant. When trying to estimate how much energy the solar cells will provide it is no longer possible
to rely on the energy tables in chapter 6, since these are only valid under the assumption that the
solar cells can always output maximum power. The electrical solution for prolonging battery life
could look like the solution shown in chapter 5.3 (Figure 7). The backup battery, as shown in the
schematic, would then be the primary batteries that are used to power the alarm nodes today. The
primary batteries would then only be used when the solar cells cannot provide enough power, which
effectively achieves the goal of prolonging battery life.
18 Price from DigiKey SE, https://www.digikey.se/, accessed 2018-08-29.

50
9 CONCLUSIONS AND FUTURE WORK
This thesis has investigated how solar cells can be used to harvest energy for wireless alarm nodes.
The different subsystems of an energy harvesting solution have been investigated and discussed with
the application in mind. It can be concluded that there exist many ways to design such a system and
that the choice of design is very dependent on how much the solution is allowed to cost.
The measurements of the amount of energy that can be harvested showed that there is a big
difference between different solar cells, locations and orientations. For a south-east facing window
you can fully power the magnet contact alarm node for a good part of the year. This is however not
true for north-west facing windows and front doors. The same alarm product can therefore be
expected to be working under very different conditions depending on where it is installed in the
house. As a result, the batteries of some alarm nodes will need to be changed more often compared
to others. The worst locations in which the alarm nodes are installed in a house will then decide how
often a service to change batteries is needed. The potential cost savings from reducing the servicing
frequency, which could be one of the major benefits of using solar cells, is therefore limited by this
fact.
The prototype that was built demonstrated a particular solution for harvesting energy for the magnet
contact alarm node. From the short evaluation that was made it could be concluded that the system
is working functionality wise and that it can supply the alarm node with enough power on cloud free
summer days in southern Sweden.
The following list contains suggestions of further studies that can be made on the subject of this
thesis:
• To improve the estimation of the amount of energy that can be harvested in home
environments it would be beneficial to make further measurements to increase the dataset.
The measurements should be made over a longer period of time, continuously logging the
MPP of the solar cells and in multiple houses. This would give more information about the
average harvestable energy which could then be extrapolated for a more accurate year-
round estimate compared to the one presented in this report.
• An energy harvesting solution which does not use MPPT should be built and benchmarked
against a solution which does use MPPT (solutions without MPPT were discussed in chapter
5.3). This would show how the efficiency achieved by clever design and voltage matching
compares to the efficiency achieved by using MPPT. The results should then be put in
relation to the cost of the MPPT functionality, e.g. the cost of an energy harvesting chip like
bq25505.
• The temperature dependence of the different solar cell technologies was briefly mentioned,
but to fully understand how they behave it would have to be tested in a climate chamber.
For organic and dye-sensitized solar cells it is extra important that this test should be made
on the specific product of interest since there are a large number of different “blends” with
different properties.

51
ACKNOWLEDGEMENTS
My thanks go to the people at Verisure Innovation who came up with the idea for the project and
presented the opportunity to work on this thesis. Jonas Johannesson, who was my main contact at
Verisure Innovation, was always available for discussing ideas or problems related to the thesis. His
guidance was superb in every way and I am very thankful for his support and humoristic mood. I
thank also his many colleagues in the hardware department who supported me with everything from
PCB design to answering questions about their products.
I also want to thank Gunnar Lindstedt and Johan Björnstedt at the Division of Industrial Electrical
Engineering and Automation, Faculty of Engineering, Lund University. Gunnar who was my supervisor
provided excellent support and guided me through the process of writing this thesis. Johan had the
role as examiner and showed great interest in the project.
Further thanks go to the solar cell manufacturer who provided the organic solar cells used for the
measurements and for the prototype. They also provided many useful ideas and enthusiastically
shared their experience in the field.

52
REFERENCES
[1] "Solar Cell Structure," [Online]. Available: https://www.pveducation.org/pvcdrom/solar-cell-
structure. [Accessed 06 03 2018].
[2] "Light Generated Current," [Online]. Available: https://www.pveducation.org/pvcdrom/solar-
cell-operation/light-generated-current. [Accessed 06 03 2018].
[3] "The photovoltaic effect," [Online]. Available: https://www.pveducation.org/pvcdrom/solar-
cell-operation/the-photovoltaic-effect. [Accessed 06 03 2018].
[4] "Solar Cell Efficiency," [Online]. Available: https://www.pveducation.org/pvcdrom/solar-cell-
operation/solar-cell-efficiency. [Accessed 24 04 2018].
[5] P. P. Kumavat, D. S. Dalal and P. Sonar, "An overview on basics of organic and dye sensitized
solar cells, their mechanism and recent improvements," Renewable & Sustainable Energy
Reviews, vol. 78, pp. 1262-1287, 2017.
[6] "Measurement of Solar Cell Efficiency," [Online]. Available:
https://www.pveducation.org/pvcdrom/characterisation/measurement-of-solar-cell-efficiency.
[Accessed 24 08 2018].
[7] "Effect of Light Intensity," [Online]. Available: https://www.pveducation.org/pvcdrom/solar-cell-
operation/effect-of-light-intensity. [Accessed 24 04 2018].
[8] "Quantum Efficiency," [Online]. Available: https://www.pveducation.org/pvcdrom/solar-cell-
operation/quantum-efficiency. [Accessed 24 04 2018].
[9] "Effect of Temperature," [Online]. Available: https://pveducation.org/pvcdrom/solar-cell-
operation/effect-of-temperature. [Accessed 21 08 2018].
[10] P. A. Tiples and G. Mosca, Physics for Scientists and Engineers, New York: W.H. Freeman and
Company, 2008, pp. 684-685, 1080.
[11] "Atmospheric Absorption & Transmission," [Online]. Available:
http://gsp.humboldt.edu/olm_2016/Courses/GSP_216_Online/lesson2-1/atmosphere.html.
[Accessed 26 03 2018].
[12] H. Bülow-Hübe, "Fönsterfysik och energitransport genom fönster," [Online]. Available:
http://www.lth.se/fileadmin/energi_byggnadsdesign/images/Utbildning/ABK100/F8_PM_f_nst
erfysik.pdf. [Accessed 26 03 2018].
[13] M. Alaküla, L. Gertmar and O. Samuelsson, Elenergiteknik, Lund: Divison of Industrial Electrical
Engineering and Automation, Faculty of Engineering, Lund University, 2011, pp. 115, 117.
[14] X. Ma, S. Bader and B. Oelmann, "Characterization of Indoor Light Conditions by Light Source
Classification," IEEE Sensors Journal, vol. 17, no. 12, pp. 3884-3891, 2017.
[15] "Fraunhofer ISE: Fraunhofer Photovoltaics Report, updated: 26 February 2018," 2018.

53
[16] M. A. Green, "Third generation photovoltaics: solar cells for 2020 and beyond," Physica E: Low-
dimensional Systems and Nanostructures, vol. 14, no. 1-2, pp. 65-70, 2002.
[17] A. Kaminski-Cachopo, "Solar cells for energy harvesting," [Online]. Available:
https://www.nereid-h2020.eu/system/files/files/workshops/DWS/slides/DWS_WP42-2016-10-
19-02Kaminski_NEREID_public.pdf. [Accessed 03 05 2018].
[18] "Solar cells - the three generations," [Online]. Available: http://plasticphotovoltaics.org/lc/lc-
solarcells/lc-introduction.html. [Accessed 25 08 2018].
[19] NREL, "Low Cost III-V Solar Cells," [Online]. Available: https://www.nrel.gov/pv/low-cost-iii-v-
solar-cells.html. [Accessed 03 08 2018].
[20] "Types of thin film solar panels," EnergySage, 20 03 2018. [Online]. Available:
https://www.energysage.com/solar/101/about-solar-panels/thin-film-solar-panels-amorphous-
cadmium-telluride-and-cigs/. [Accessed 21 08 2018].
[21] D. H. Nguyen, "Toxic Chemical in Solar Panels," 30 04 2018. [Online]. Available:
https://sciencing.com/toxic-chemicals-solar-panels-18393.html. [Accessed 21 08 2018].
[22] National Renewable Energy Laboratory, "Efficiency Chart | Photovoltaic Research (NREL),"
[Online]. Available: https://www.nrel.gov/pv/. [Accessed 25 07 2018].
[23] "Oxford PV," [Online]. Available: https://www.oxfordpv.com. [Accessed 25 08 2018].
[24] "Saule Technologies," [Online]. Available: http://www.sauletech.com. [Accessed 25 08 2018].
[25] "Single Crystalline Silicon," [Online]. Available:
https://www.pveducation.org/pvcdrom/manufacturing/single-crystalline-silicon. [Accessed 03
05 2018].
[26] "Multi Crystalline Silicon," [Online]. Available:
https://www.pveducation.org/pvcdrom/manufacturing/multi-crystalline-silicon. [Accessed 03
05 2018].
[27] A. McEvoy, T. Markvart and L. Castañer, Practical Handbook of Photovoltaics: Fundamentals and
Applications, Academic Press, 2012, pp. 86-87, 212, 216, 223, 233, 497-499, 535-536, 544, 548-
549, 554, 560.
[28] K. Patel, "Solar panel efficiency and lifespan," 21 09 2016. [Online]. Available:
https://www.solarenergyforus.com/solar-panel-efficiency-lifespan/. [Accessed 27 08 2018].
[29] "Amorphous Silicon," [Online]. Available: http://www.solar-facts-and-advice.com/amorphous-
silicon.html. [Accessed 25 07 2018].
[30] N. Marinova, S. Valero and J. L. Delgado, "Organic and perovskite solar cells: Working principles,
materials and interfaces," Journal of Colloid And Interface Science, vol. 488, pp. 373-389, 2017.
[31] Y. Aoki, "Photovoltaic performance of Organic Photovoltaics for indoor energy harvester,"
Organic Electronics, vol. 48, pp. 194-197, 2017.

54
[32] K. Ghaffarzadeh, "Organic photovoltaics or dye sensitised solar cells - which will win?," 14 08
2012. [Online]. Available: https://www.idtechex.com/research/articles/organic-photovoltaics-
or-dye-sensitised-solar-cells-which-will-win-00004647.asp. [Accessed 22 08 2018].
[33] N. Bristow and J. Kettle, "Outdoor performance of organic photovoltaics: Diurnal analysis,
dependence on temperature, irradiance and degradation," Journal of Renewable & Sustainable
Energy, vol. 7, no. 1, pp. 1-12, 2015.
[34] infinityPV, "Organic Solar Cells," [Online]. Available: https://solarenergyforus.com/solar-panel-
efficiency-lifespan/. [Accessed 27 08 2018].
[35] N. Tanabe, "Fujikura: Dye-Sensitized Solar Cell for Energy Harvesting," 2013. [Online]. Available:
http://www.fujikura.co.jp/eng/rd/gihou/backnumber/pages/__icsFiles/afieldfile/2013/05/23/4
2e_30.pdf. [Accessed 22 08 2018].
[36] "Dye sensitized solar cell," Fujikura, [Online]. Available:
https://www.fujikura.co.uk/products/energy-and-environment/dye-sensitized-solar-cell/.
[Accessed 22 08 2018].
[37] "Organic sensitizing dyes," Dyenamo, [Online]. Available:
https://www.dyenamo.se/dyenamo_dyes.php. [Accessed 27 08 2018].
[38] "Customized Solar Cells," GCell, [Online]. Available: https://www.gcell.com/gcell-
products/custom-solar-cell. [Accessed 27 08 2018].
[39] "Energy Storage Technologies," CAP-XX, [Online]. Available: https://www.cap-
xx.com/resource/energy-storage-technologies/. [Accessed 12 07 2018].
[40] A. R. Hambley, Electrical Engineering: Principles and Applications (6th edition), Pearson
Education Limited, 2013, pp. 143, 148, 154.
[41] A. Yu, V. Chabot and J. Zhang, Electrochemical Supercapacitors for Energy Storage and Delivery,
Boca Raton: Taylor & Francis, 2013, pp. 6-7, 9, 11, 99.
[42] "No, a supercapacitor is not a capacitor," [Online]. Available:
https://www.supercaptech.com/no-supercapacitor-is-not-a-capacitor. [Accessed 18 04 2018].
[43] H. Berg, Batteries for Electric Vehicles: materials and electrochemistry, Cambridge University
Press, 2015, pp. 7-10, 62-66.
[44] M. Hassanalieragh, T. Soyata, A. Nadeau and G. Sharma, "Solar-supercapacitor harvesting
system design for energy-aware applications," in IEEE International System-on-chip Conference
(SOCC), Las Vegas, 2014.
[45] O. Bohlen, J. Kowal and D. U. Sauer, "Ageing behaviour of electrochemical double layer
capacitors. Part I. Experimental study and ageing model," Journal of Power Sources, vol. 172, no.
1, pp. 468-475, 2007.
[46] AVX, "SCM Series: Series-Connected SuperCapacitor Modules," [Online]. Available:
http://datasheets.avx.com/AVX-SCM.pdf. [Accessed 20 07 2018].

55
[47] "BU-302: Series and Parallel Battery Configurations," 16 04 2018. [Online]. Available:
http://batteryuniversity.com/learn/article/serial_and_parallel_battery_configurations.
[Accessed 17 04 2018].
[48] "How does a supercapacitor work?," Battery University, [Online]. Available:
http://batteryuniversity.com/learn/article/whats_the_role_of_the_supercapacitor. [Accessed
19 07 2018].
[49] "Battery VS Supercapacitor," SupercapTech.com, 21 05 2016. [Online]. Available:
https://www.supercaptech.com/battery-vs-supercapacitor. [Accessed 19 07 2018].
[50] A. E. Ostfeld, "Printed and Flexible Systems for Solar Energy Harvesting," University of California,
Berkeley, 2016.
[51] "BU-802b: What does Elevated Self-Discharge Do?," 04 04 2017. [Online]. Available:
https://batteryuniversity.com/learn/article/elevating_self_discharge. [Accessed 21 08 2018].
[52] "BU-808c: Coulombic and Energy Efficiency with the Battery," 25 10 2017. [Online]. Available:
http://batteryuniversity.com/learn/article/bu_808c_coulombic_and_energy_efficiency_with_th
e_battery. [Accessed 12 07 2018].
[53] H. Ibrahim, A. Ilinca and J. Perron, "Energy storage systems - Characteristics and comparisons,"
Renewable and Sustainable Energy Reviews, vol. 12, pp. 1221-1250, 2008.
[54] V. Musolini and E. Tironi, "A Comparison of Supercapacitor and High-Power Lithium Batteries,"
in Electrical Systems for Aircraft, Railway and Ship Propulsion (ESARS), Bologna, 2010.
[55] S. Bush, "Tiny energy storage cell for IoT nodes lasts for years," 14 09 2016. [Online]. Available:
https://www.electronicsweekly.com/news/products/power-supplies/tiny-energy-storage-cell-
iot-nodes-lasts-years-2016-09/. [Accessed 21 08 2018].
[56] W. K. Ko, W. Xinhui, S. Dasgupta, W. J. Wong, R. Kumar and S. Panda, "Efficient solar energy
harvester for wireless sensor nodes," in IEEE International Conference on Communication
Systems, Singapore, 2010.
[57] J. Hernandez II, "How to implement maximum power point tracking for solar charging," Texas
Instruments, [Online]. Available: https://training.ti.com/how-implement-maximum-power-
point-tracking-solar-charging. [Accessed 12 04 2018].
[58] "bq25504 Ultra Low-Power Boost Converter With Battery Management for Energy," [Online].
Available: http://www.ti.com/lit/ds/symlink/bq25504.pdf. [Accessed 12 04 2018].
[59] "Energy Harvesting & Solar Charging," Texas Instruments, [Online]. Available:
http://www.ti.com/power-management/battery-management/energy-
harvesting/overview.html. [Accessed 12 04 2018].
[60] "bq25505 Ultra Low-Power Boost Charger With Battery Management and Autonomous,"
[Online]. Available: http://www.ti.com/lit/ds/symlink/bq25505.pdf. [Accessed 12 04 2018].
[61] "bq25570 Nano Power Boost Charger and Buck Converter," [Online]. Available:

56
http://www.ti.com/lit/ds/symlink/bq25570.pdf. [Accessed 12 04 2018].
[62] Beacon Lighting Commercial, "Lux levels guide: Domestic applications," 22 07 2014. [Online].
Available: https://www.beaconlightingtradeclub.com.au/media/Assets/LUX_Levels_Chart.pdf.
[Accessed 29 08 2018].
[63] "USB 2.0 Specification," 27 04 2000. [Online]. Available:
http://www.usb.org/developers/docs/usb20_docs/. [Accessed 05 09 2018].
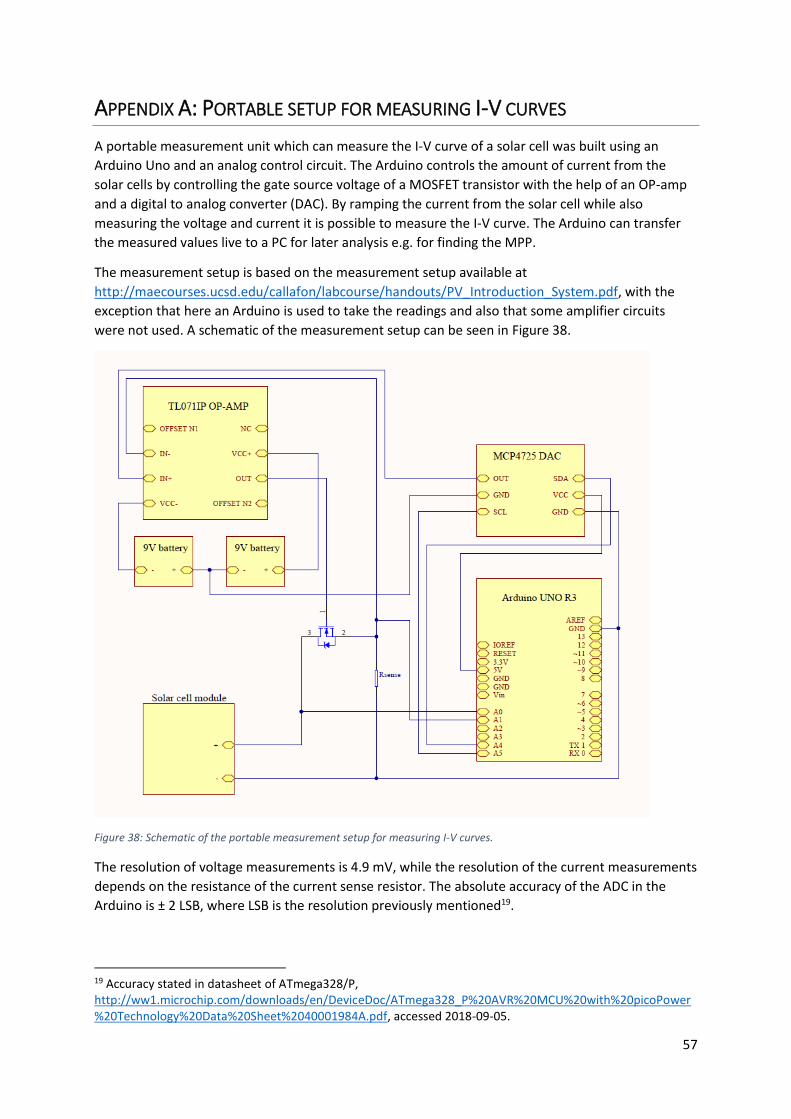
57
APPENDIX A: PORTABLE SETUP FOR MEASURING I-V CURVES
A portable measurement unit which can measure the I-V curve of a solar cell was built using an
Arduino Uno and an analog control circuit. The Arduino controls the amount of current from the
solar cells by controlling the gate source voltage of a MOSFET transistor with the help of an OP-amp
and a digital to analog converter (DAC). By ramping the current from the solar cell while also
measuring the voltage and current it is possible to measure the I-V curve. The Arduino can transfer
the measured values live to a PC for later analysis e.g. for finding the MPP.
The measurement setup is based on the measurement setup available at
http://maecourses.ucsd.edu/callafon/labcourse/handouts/PV_Introduction_System.pdf, with the
exception that here an Arduino is used to take the readings and also that some amplifier circuits
were not used. A schematic of the measurement setup can be seen in Figure 38.
Figure 38: Schematic of the portable measurement setup for measuring I-V curves.
The resolution of voltage measurements is 4.9 mV, while the resolution of the current measurements
depends on the resistance of the current sense resistor. The absolute accuracy of the ADC in the
Arduino is ± 2 LSB, where LSB is the resolution previously mentioned19.
19 Accuracy stated in datasheet of ATmega328/P, http://ww1.microchip.com/downloads/en/DeviceDoc/ATmega328_P%20AVR%20MCU%20with%20picoPower%20Technology%20Data%20Sheet%2040001984A.pdf, accessed 2018-09-05.

58
Different current sense resistors where used depending on the light conditions. When measurements
are done in a well-lit area, such as in a window, a small resistor must be used to not limit the portion
of the I-V curve that can be captured. In darker areas a larger resistor could be used to increase the
resolution of the measurements. An example of an I-V curve captured for a monocrystalline solar cell
is shown in Figure 39.
Figure 39: Example of an I-V curve captured by the Arduino based measurement setup.

59
APPENDIX B: SCHEMATIC AND LAYOUT OF THE PROTOTYPE BOARD
The schematic of the prototype board is shown in Figure 40 and the layout of the board is shown in
Figure 41.
Figure 40: Electrical schematic of the prototype board.
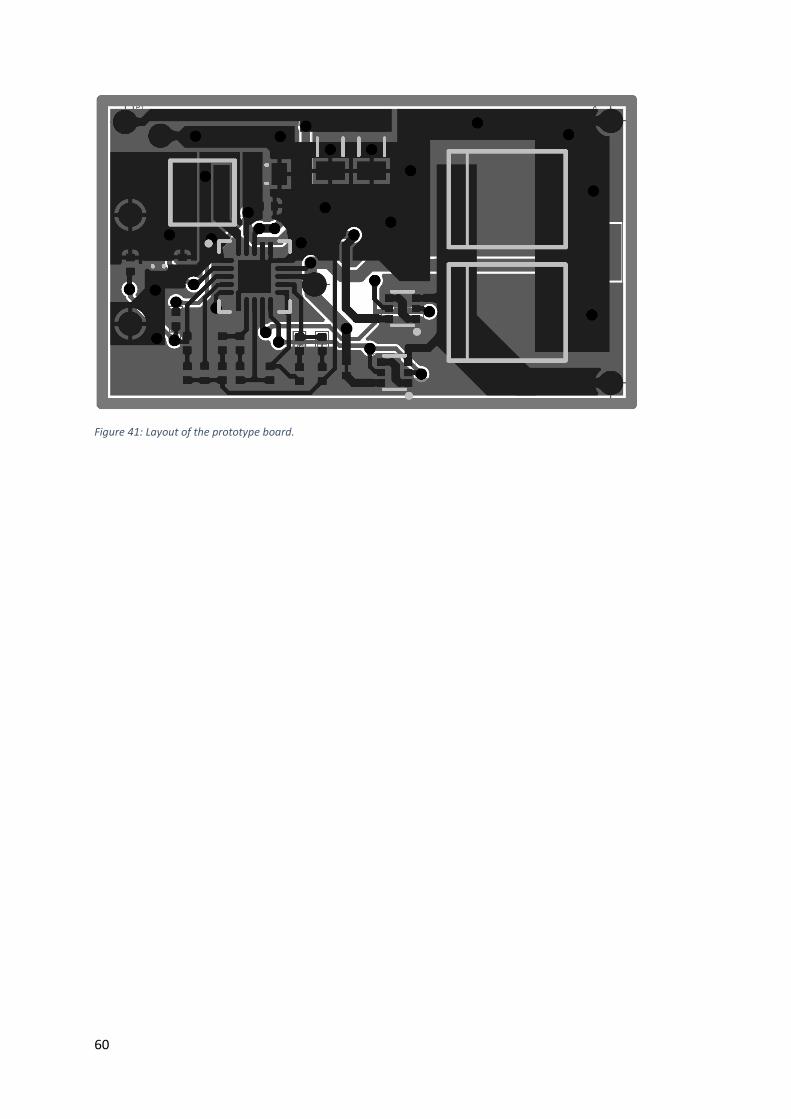
60
Figure 41: Layout of the prototype board.
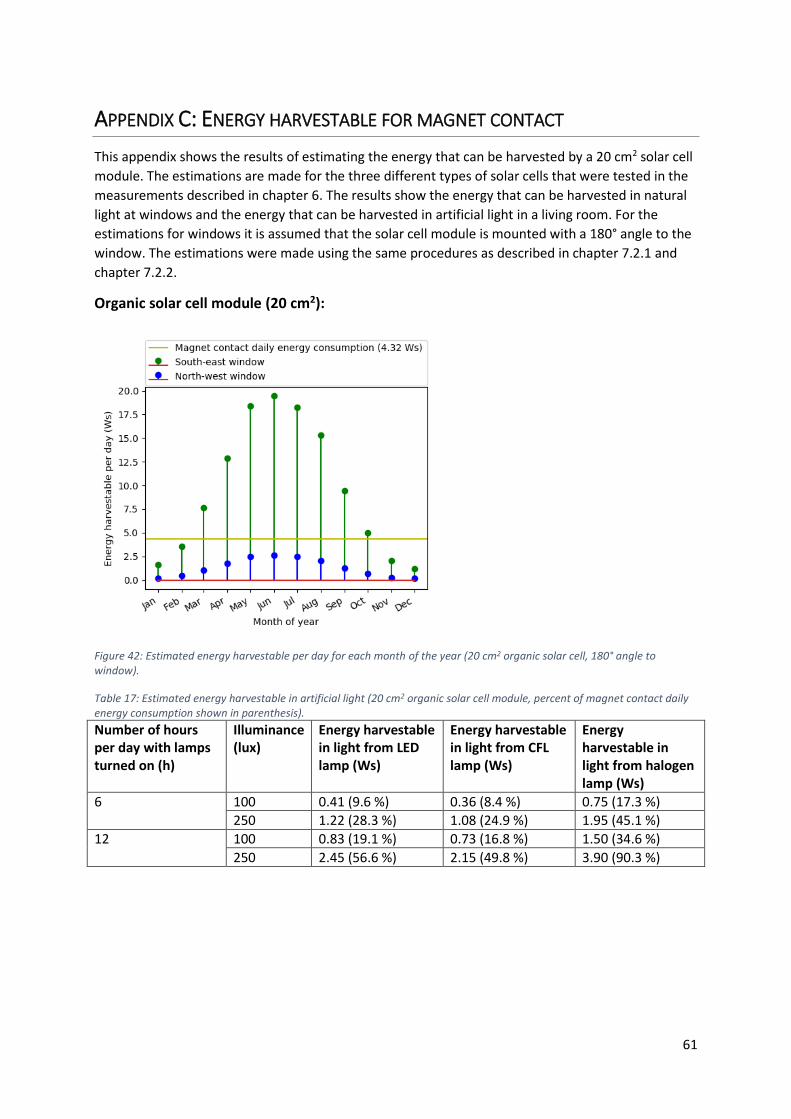
61
APPENDIX C: ENERGY HARVESTABLE FOR MAGNET CONTACT
This appendix shows the results of estimating the energy that can be harvested by a 20 cm2 solar cell
module. The estimations are made for the three different types of solar cells that were tested in the
measurements described in chapter 6. The results show the energy that can be harvested in natural
light at windows and the energy that can be harvested in artificial light in a living room. For the
estimations for windows it is assumed that the solar cell module is mounted with a 180° angle to the
window. The estimations were made using the same procedures as described in chapter 7.2.1 and
chapter 7.2.2.
Organic solar cell module (20 cm2):
Figure 42: Estimated energy harvestable per day for each month of the year (20 cm2 organic solar cell, 180° angle to window).
Table 17: Estimated energy harvestable in artificial light (20 cm2 organic solar cell module, percent of magnet contact daily energy consumption shown in parenthesis).
Number of hours per day with lamps turned on (h)
Illuminance (lux)
Energy harvestable in light from LED lamp (Ws)
Energy harvestable in light from CFL lamp (Ws)
Energy harvestable in light from halogen lamp (Ws)
6 100 0.41 (9.6 %) 0.36 (8.4 %) 0.75 (17.3 %)
250 1.22 (28.3 %) 1.08 (24.9 %) 1.95 (45.1 %)
12 100 0.83 (19.1 %) 0.73 (16.8 %) 1.50 (34.6 %)
250 2.45 (56.6 %) 2.15 (49.8 %) 3.90 (90.3 %)

62
Amorphous silicon solar cell module (20 cm2):
Figure 43: Estimated energy harvestable per day for each month of the year (20 cm2 amorphous silicon solar cell, 180° angle to window).
Table 18: Estimated energy harvestable in artificial light (20 cm2 amorphous silicon solar cell module, percent of magnet contact daily energy consumption shown in parenthesis).
Number of hours per day with lamps turned on (h)
Illuminance (lux)
Energy harvestable in light from LED lamp (Ws)
Energy harvestable in light from CFL lamp (Ws)
Energy harvestable in light from halogen lamp (Ws)
6 100 1.01 (23.4 %) 0.90 (20.8 %) 1.35 (31.2 %)
250 2.53 (58.5 %) 2.34 (54.2 %) 3.18 (73.5 %)
12 100 2.02 (46.8 %) 1.80 (41.7 %) 2.69 (62.3 %)
250 5.06 (117.0 %) 4.68 (108.3 %) 6.35 (147.0 %)

63
Monocrystalline silicon solar cell module (20 cm2):
Figure 44: Estimated energy harvestable per day for each month of the year (20 cm2 monocrystalline silicon solar cell, 180° angle to window).
Table 19: Estimated energy harvestable in artificial light (20 cm2 monocrystalline silicon solar cell module, percent of magnet contact daily energy consumption shown in parenthesis).
Number of hours per day with lamps turned on (h)
Illuminance (lux)
Energy harvestable in light from LED lamp (Ws)
Energy harvestable in light from CFL lamp (Ws)
Energy harvestable in light from halogen lamp (Ws)
6 100 0.27 (6.4 %) 0.22 (5.1 %) 7.11 (164.6 %)
250 1.10 (25.4 %) 0.91 (21.0 %) 19.97 (462.2 %)
12 100 0.55 (12.7 %) 0.44 (10.2 %) 14.22 (329.2 %)
250 2.20 (50.8 %) 1.81 (41.9 %) 39.94 (924.4 %)