
Energy Guide
12
-
Upload
christos-liatas -
Category
Documents
-
view
226 -
download
0
Transcript of Energy Guide

8/2/2019 Energy Guide
http://slidepdf.com/reader/full/energy-guide 1/12

8/2/2019 Energy Guide
http://slidepdf.com/reader/full/energy-guide 2/12
03 ene rgy - it’s more mana gea
04 why save ene rgy?
05 how much electricity do yo
06 monitor your energy use
07 how to read your electricity
09 wireless electricity monitors
10 how to use e fergy
12 electricity data logger
13 making the most of a porta
14 change your habits
15 the walk around
16 got a question?17 money saving
20 energy sa ving c hart
21 electricity data logger
22 elink software
contents...welcome...
This b ooklet conta ins information a nd idea s you will need to de velop and
implement an ene rgy efficiency s trategy.
We believe that targets of between 10 and 20% reduction in electricity use
can b e ac hieved by understanding how we use energy. We take energy
efficiency very serious ly and we want to he lp you s ave energy wherever poss ible.
We hope you find this guide us eful and toge ther with your Efergy Wireles s
Electricity Monitor you can cut back on the amount of electricity you use around
the ho me o r office .
Save ene rgy, save mo ney and he lp s ave the p lanet

8/2/2019 Energy Guide
http://slidepdf.com/reader/full/energy-guide 3/12
Energy is a controllable cost!
In order to implement energy saving me asures and manage your energyconsumption, you need to understand how and where your energy is being
used.
Energy monitoring with easy-to-use electricity displays can help you maximise
energy efficiency and achieve savings of up to 20%
Create understanding... Save energy
Everyone needs to know why energy efficiency is important. Understanding
energy use c an b e the most c ost-effective way to s ave energy.
energy... it’s more manageable
than you think
why save e nerg
Good for the home
Energy savings can have significanas it means money saved. The ev
fuel is becoming a growing probl
years fuel prices have incre
making us much more cons cious
Good for the environmentMost of the carbon dioxide a nd ot
releas ed in the UK come from ene

8/2/2019 Energy Guide
http://slidepdf.com/reader/full/energy-guide 4/12
The amount of electricity consumed varies hugely according to size of home,
location, house type and the number of occupants. There are many variables
so it is often difficult to understand what you should be using and whether
what you use is very high o r low.
Do Som e res ea rch - Consult the Internet or a sk your
su pplier ho w mu ch you pa y for your fuel, and work
out your yea rly cos t. You the n have a b as e num be r
to work ag ainst.
Often your electricity bill doesn’t make it easy to predict how much you are
spending on electricity. Make a note of your daily average consumption and
estimate your yearly cost.
how muc h e lec tricity do you us e?
Energy and monitoring are at
manageme nt: you need the inform
where you’re sa ving m one y.
By monitoring your energy use
cos ts, be haviour difference s, a nd s
know b efore. The Wireles s Elec tric
to ma ke this proces s eas ier to s ee
can save energy and will lead
Play with your Efergy
Use the portable display to show
Look at how much electricity you
you can turn off which wont eff
Lea ving lights on o r devices your up over the course of a day, we
monitor your en

8/2/2019 Energy Guide
http://slidepdf.com/reader/full/energy-guide 5/12
Power consumption is gauged by measuring in Watts (W) the amount of energy
a device consumes per hour, expressed in kilowatt hours (kWh).
For example a 100W incandes cent light bulb switched o n for ten hours wouldconsume 100W x 10Hrs will equal 1,000 watt-hours, or 1kWh.
Is your me ter reliab le?
Meter readings are used to calculate your bill. Therefore, before installation, all
meters mus t meet s tringent ac curacy requirements.
Once installed, meters are periodically chec ked by your supplier to ensure they
continue to give accurate readings. Meters are very rarely inaccurate.
how to read your electricity me ter
Read your meter
To rea d a single rate me ter, sim
numbers shown from left to right. Bany zeros, including any at the start
any red figures.
To find ou t how many units you h
las t reading, subtract the previous
one.
Kee p an electricity log
We recommend that you keep a l
use . This helps you gain a full u
consumption pattern over time.
We have attached a template at t
to help you log your energy co

8/2/2019 Energy Guide
http://slidepdf.com/reader/full/energy-guide 6/12
how to use e fer
Efergy, your Wireless Electricity M
to see where your electricity is b
much you are s pending and relate
If you regularly use 300W of electday where is the usage coming fro
Analyse your energy co nsum
• Use the electricity usage monitor
where energy consumption has in
reading a nd investigate different r
appliances on and off. It will also
your energy saving strategy has b
• Use the history mode to look for
day to day or week to week.
• Read your electric meters at lea
the readings. Se nd thes e to your
wireless electricity monitors
Knowing how much e lec tricity you a re us ing a nd having the information in front
of you can make a rea l difference . Insta nt fee dba ck lets you ad just your
be haviour to suit. It is worth looking at how many watts an a pp lianc e us es ,
but more important how you might adjust your behaviour to sa ve money us ingthat device.
You c an us e the electricity usa ge m onitor to quickly estimate ho w much
electricity any de vice is us ing. For example, whe n you switch the kettle on,
within a few seconds you will see the instant power consumption displayed
jump up (typica l kett le wo uld co ns ume 2kW). This inc rea se will reflec t the
consumption of the kettle. Typically, a kettle might be turned on four times a
day for a two-minute b oil. That's only eight minutes a d ay, which me ans a tota l
daily consumption of 0.27kWh (2kW x 8min x 1hour / 60min = 0.27kWh).
A PC that's used for home entertainment and internet browsing might be
turned on for many hours at 12 0W. PC can be typically switched on for 40
hours a week or more, which works out at 4.8KWh per week. Unfortunately,
computing and home -entertainment eq uipment is not tagge d with the s ame
eas y-to-understand energy labe ls. For example, many wides creen p las ma TVs
consume more power than a fridge-freezer.
8/2/2019 Energy Guide
http://slidepdf.com/reader/full/energy-guide 7/12
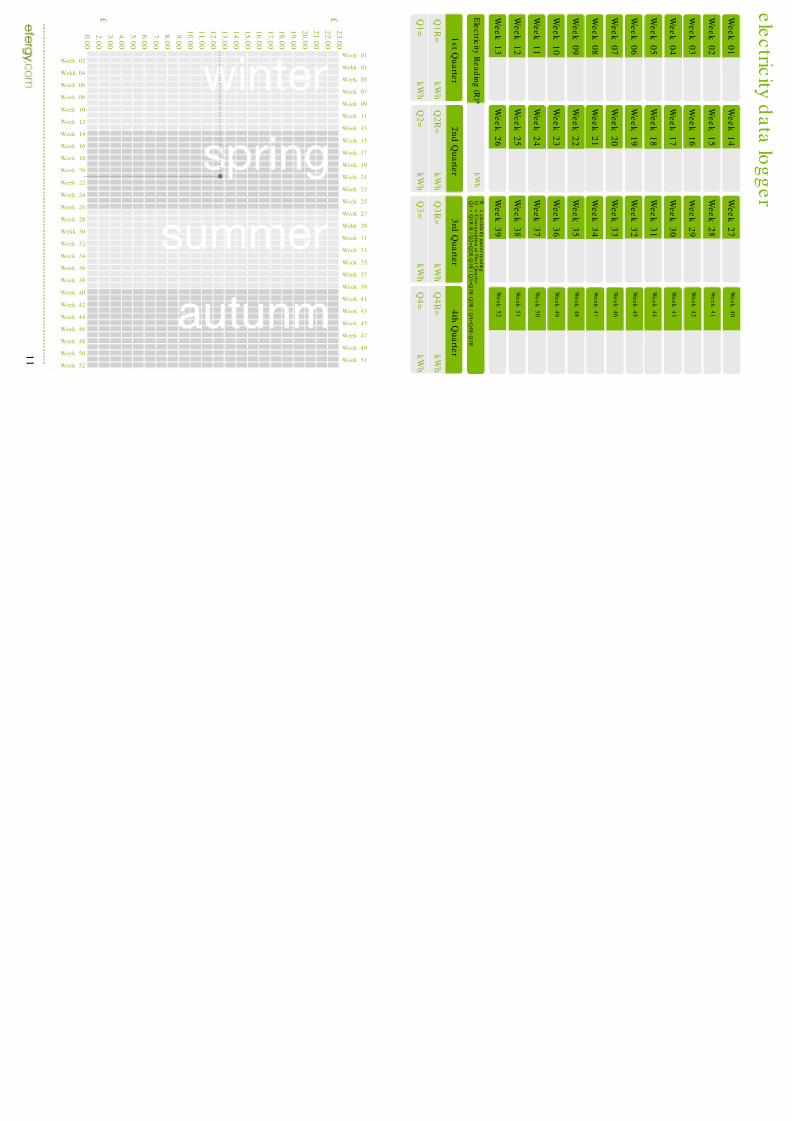
R
= e l e c t r i c i t ym e t e r r e a d i n g
Q
= C on s um p t i on a t F i r s t Q u
a r t e r
Q1 = Q1 R-R / Q2 = Q2 R- Q1 R / Q 3 = Q 3 R- Q2 R / Q4 = Q4 R- Q 3 R
W e e k 1 0
W e e k 1 1
W e e k 1 2
W e e k 1 3
W e e k
2 3
W e e k
2 4
W e e k
2 5
W e e k
2 6
W e e k 3 6
W e e k 3 7
W e e k 3 8
W e e k 3 9
W e e k 4 9
W e e k 5 0
W e e k 5 1
W e e k 5 2
E l e c t r i c i t yR e a d i n g ( R ) *
k Wh
1 s t Q u a r t e r k
Wh
k Wh
Q1 R=
Q1 =
2
n d Q u a r t e r k
Wh
k Wh
Q2 R=
Q2 =
3 r d Q u a r t e r k
Wh
k
Wh
Q 3 R=
Q 3 =
4 t h Q u a r t e r k
Wh
k Wh
Q4 R=
Q4 =
Week 02
Wekk 04
Week 06
Week 08
Week 10
Week 12
Week 14
Week 16
Week 18
Week 20
Week 22
Week 24
Week 26
Week 28
Wekk 30
Week 32
Week 34
Week 36
Week 38
Week 40
Week 42
Week 44
Week 46
Week 48
Week 50
Week 52
Week 01
Wekk 03
Week 05
Week 07
Week 09
Week 11
Week 13
Week 15
Week 17
Week 19
Week 21
Week 23
Week 25
Week 27
Wekk 29
Week 31
Week 33
Week 35
Week 37
Week 39
Week 41
Week 43
Week 45
Week 47
Week 49
Week 51
2 3 . 0 0
2 2 . 0 0
2 1 . 0 0
2 0 . 0 0
1 9 . 0 0
1 8 . 0 0
1 7 . 0 0
1 6 . 0 0
1 5 . 0 0
1 4 . 0 0
1 3 . 0 0
1 2 . 0 0
1 1 . 0 0
1 0 . 0 0
9 . 0 0
8 . 0 0
7 . 0 0
6 . 0 0
5 . 0 0
4 . 0 0
3 . 0 0
2 . 0 0
0 . 0 0
£ £
1
1
8/2/2019 Energy Guide
http://slidepdf.com/reader/full/energy-guide 8/12
cha nge your ha
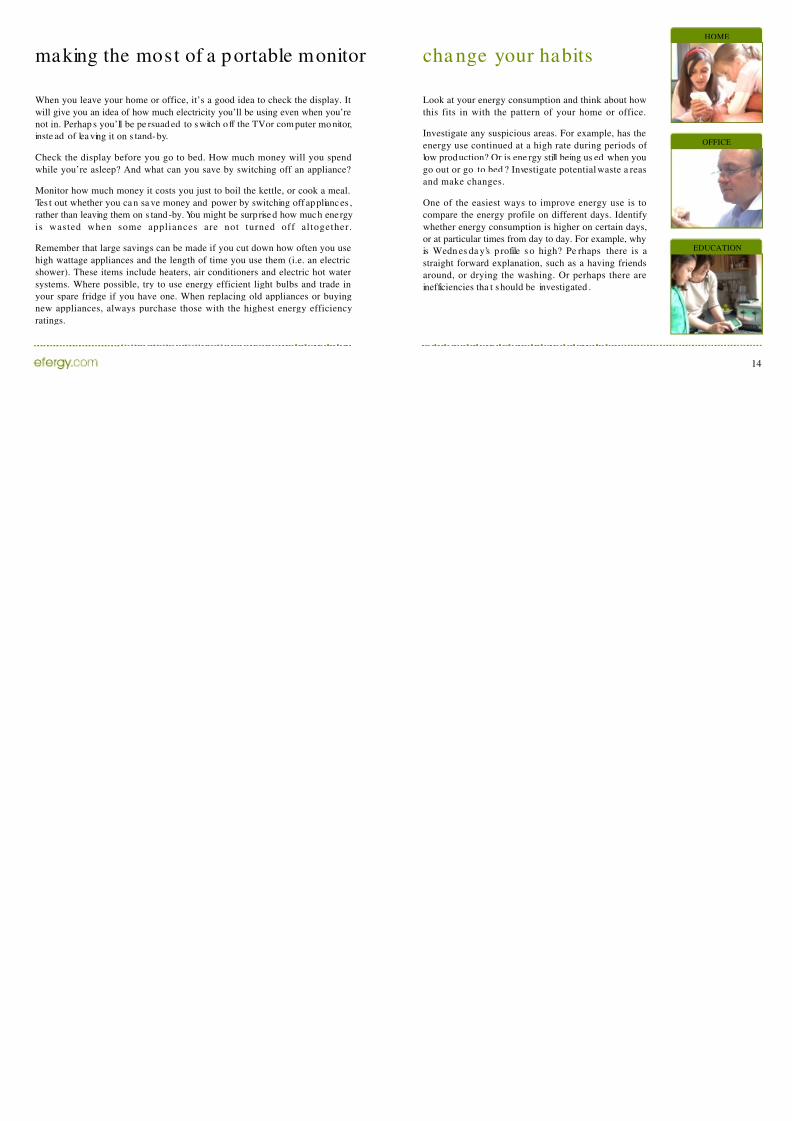
Look at your energy consumption
this fits in with the pattern of y
Investigate any suspicious areas.
energy use continued at a high ra
low production? Or is ene rgy still
go out or go to bed ? Investigate p
and make changes.
One of the easiest ways to impr
compare the energy profile on dif
whether energy consumption is hi
or at particular times from day to d
is Wedn es da y’s p rofile s o high?
straight forward explanation, such
around, or drying the washing. Oinefficiencies tha t s hould be invest
When you leave your home or office, it’s a good idea to check the display. It
will give you an idea of how much electricity you’ll be using even when you’re
not in. Perhap s you’ll be pe rsuad ed to s witch o ff the TV or com puter mo nitor,
inste ad of lea ving it on s tand- by.
Check the display before you go to bed. How much money will you spend
while you’re asleep? And what can you save by switching off an appliance?
Monitor how much money it costs you just to boil the kettle, or cook a meal.
Tes t out whether you ca n sa ve money and power by switching off applianc es ,
rather than leaving them on s tand -by. You might be surprise d how much energy
is wasted when some appliances are not turned off al together.
Remember that large savings can be made if you cut down how often you use
high wattage appliances and the length of time you use them (i.e. an electric
shower). These items include heaters, air conditioners and electric hot water
systems. Where possible, try to use energy efficient light bulbs and trade in
your spare fridge if you have one. When replacing old appliances or buying
new appliances, always purchase those with the highest energy efficiency
ratings.
making the most of a portable monitor
8/2/2019 Energy Guide
http://slidepdf.com/reader/full/energy-guide 9/12
A ba sic physical walk around of your hom e c ould
open your eyes t o a l l k inds o f ene rgy sav ing
opportunities.Try and lower the readings on the electricity usage monitor down to as low
a reading as you can, and then watch the numbers increase as you switch
devices back on. This will help you identify which devices use the most
electricity.
You might find that the se t of down- lights in the kitche n us es far more electricity
than you realised. This might be the incentive needed to switching them off.
A digibox may only use 50W of electricity, but if this is left on over 24 hours,
this adds up to 1,200W over 24 hours - 10% of your total daily use.
the walk around
Here a re some simple q ues tio
• Are lights switched off if there’s
the rooms?
• Are lights switched off when y
• Are you still using traditional, i
bulbs?
• Are your floor or ta ble lamp s in t
Lamps in a corner are more ef
glow reflects off the walls.
• Are compute rs left on o vernigh
• Are compute r monitors switchuse, such as during lunch brea
got a ques tion?
8/2/2019 Energy Guide
http://slidepdf.com/reader/full/energy-guide 10/12
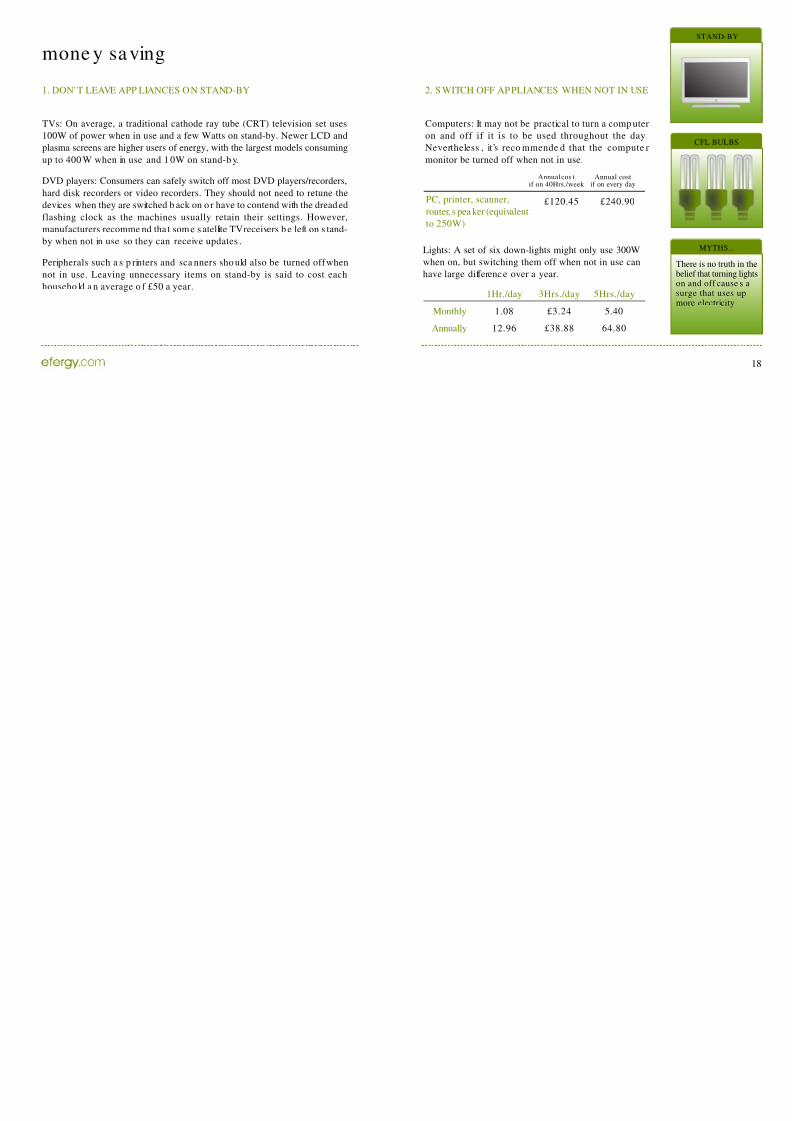
1. DON' T LEAVE APP LIANCES O N STAND-BY
TVs: On average, a traditional cathode ray tube (CRT) television set uses
100W of power when in use and a few Watts on stand-by. Newer LCD andplasma screens are higher users of energy, with the largest models consuming
up to 400 W when in use and 1 0W on stand-b y.
DVD players: Consumers can safely switch off most DVD players/recorders,
hard disk recorders or video recorders. They should not need to retune the
devices when they are switched b ack on o r have to contend with the dreaded
flashing clock as the machines usually retain their settings. However,
manufacturers recomme nd tha t som e s atellite TV receivers b e left on s tand-
by when not in use so they can receive updates .
Peripherals such a s p rinters and sca nners sho uld also be turned off when
not in use. Leaving unnecessary items on stand-by is said to cost eachhouseho ld a n average o f £50 a year.
mone y saving
2. S WITCH OFF APPLIANCES
Computers: It may not be practic
on and off if it is to be used Nevertheless , it’s reco mmende
monitor be turned off when not in
£12
Annualif on 40Hr
Lights: A set of six down-lights m
when on, but switching them off w
have large differenc e over a year.
Monthly
Annually
1Hr./day
1.08
12.96
3Hrs.
£3.
£38
PC, printer, scanner,
router, s pea ker (equivalent
to 250W)

8/2/2019 Energy Guide
http://slidepdf.com/reader/full/energy-guide 11/12
3. REPLACE OLDER S TYLE BULBS WITH LOW ENERGY BULBS
More than 90% of the ene rgy that s tandard incandesc ent light bulbs use
is lost as heat. The next time a 60W incand esc ent bulb burns out, c onsider
using a 15W CFL (Compact Fluorescent Lamp). It provides the same
amount of light, yet uses about 75% less energy.
Six incande sce nt
bulbs of 60W
Six CFL bulbs of
15W
Savings
Equivalent to
360W
Equivalent to
90W
270W
£4.80
£1.20
£3.60
£57.80
£14.50
£43.30
Monthlycosts
Annualcosts
*Bulbs switched on for four hours/d ay. Price: £0 .11/kWh
£0.01/Hr.=90W
£0.02/Hr.=180W
£0.04/Hr.=360W
£0.05/Hr.=450W
£0.10/Hr.=900W
£0.15/Hr.=1.4kW
£0.20/Hr.=1.8kW
£0.25/Hr.=2.3kW
Cut yourpower use by:
Monthly
Annually
Monthly
Annually
Monthly
Annually
Monthly
Annually
Monthly
Annually
Monthly
Annually
Monthly
Annually
Monthly
Annually
ene rgy sa ving c

8/2/2019 Energy Guide
http://slidepdf.com/reader/full/energy-guide 12/12
In the middle od this guide you will find the data logging chart. Down both
sides of the chart you will find week numbers. Week 1, for example, represents
the first wee k in J anua ry. Week 30 (2008) would rep rese nt the week s tarting
July 21.
Use the Wireless Electricity Monitor to scroll through how much electricity
you have been using each week by looking at the history information mode.
Go to the weekly history mode. Push the
Mode Button to display weekly costs. Mark
on the table how much money you have
spe nt with the c orresp onding week number.
The week number displayed in the top right
hand c orner. Example: week 21 has been
faintly marked on the table as an example.
You s hould find your electricity usa ge is highe rin winter than other times of the year. If you
are on holiday, what happens to your
electricity use ? Does your electricity use go
down as you look at how you use electricity?
electricity data logger
See example
If you have p urschas ed a Wireles
our elink software from www.e
dimension of energy manag emen
Collect, se t
You will be a
• Look at y
• Find ou t w
• Disco ver


