ENERGY GEOTECHNOLOGY · ENERGY GEOTECHNOLOGY Mixed Fluid Conditions UNSAT 2010 - Barcelona J....
76
ENERGY GEOTECHNOLOGY Mixed Fluid Conditions UNSAT 2010 - Barcelona J. Carlos Santamarina and Jaewon Jang
Transcript of ENERGY GEOTECHNOLOGY · ENERGY GEOTECHNOLOGY Mixed Fluid Conditions UNSAT 2010 - Barcelona J....
ENERGY GEOTECHNOLOGY
Mixed Fluid Conditions
UNSAT 2010 - Barcelona
J. Carlos Santamarina and Jaewon Jang
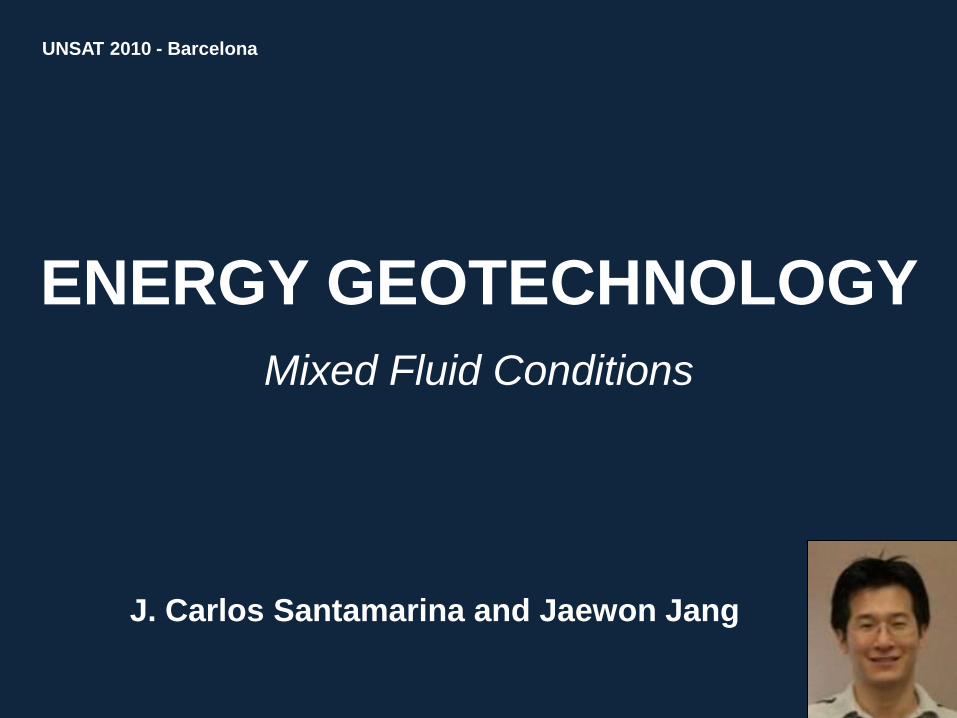
energy geotechnology

Explosion: 4/20/10 (@10 pm) Deepwater Horizon
Sinks: 4/22/10 (~10 am) Oil slick: 5/6/10
Energy in the News
0.0
0.2
0.4
0.6
0.8
1.0
0.01 0.10 1.00 10.00
Hu
ma
n D
ev
elo
pm
en
t In
de
x
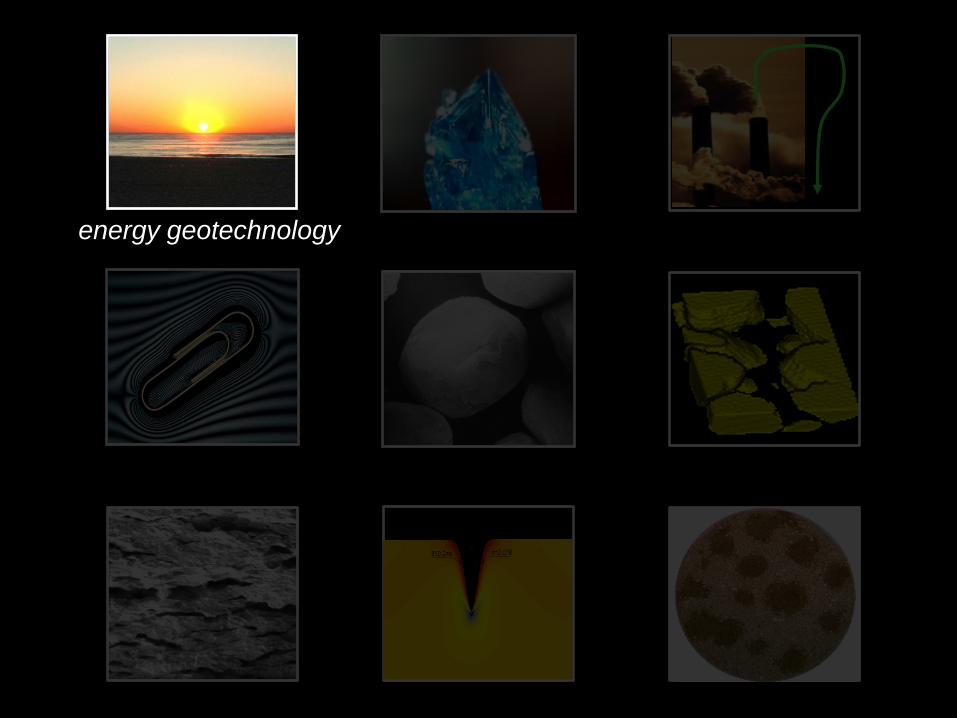
Total power per person [kW/person]
Energy and Life
CIA, UN, EIA
(Global: 2008)

0.0
0.2
0.4
0.6
0.8
1.0
0.01 0.10 1.00 10.00
Hu
ma
n D
ev
elo
pm
en
t In
de
x
Total power per person [kW/person]
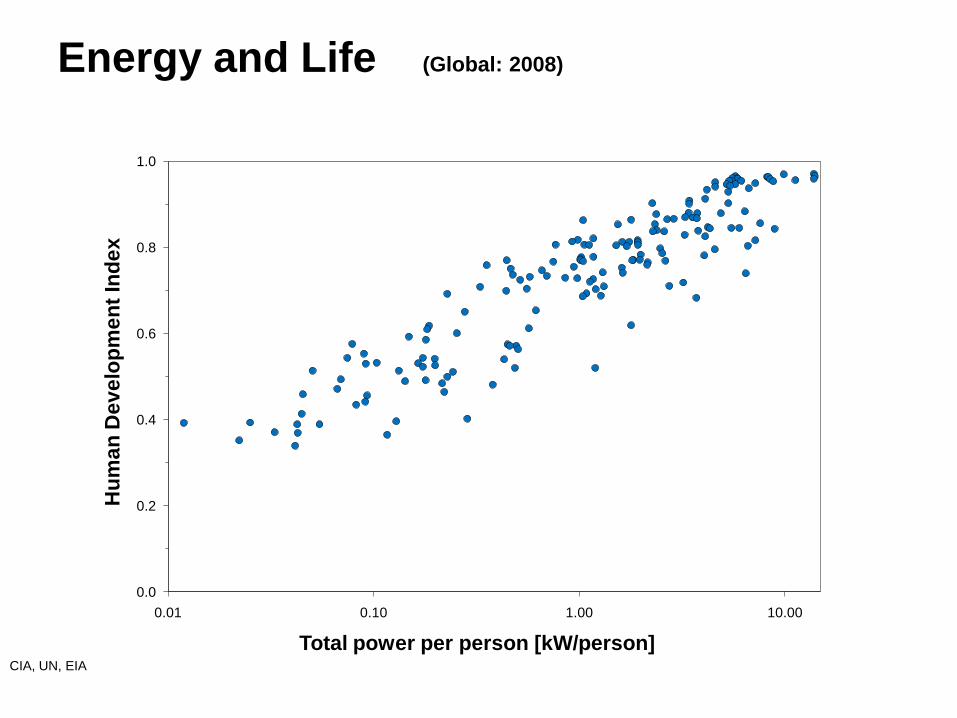
Countries following the same trend: P HDI
India
China
Brazil
Russia
USA
1 billion
Energy and Life (Global: 2008 – BRIC trends: 1980-2007)
CIA, UN, EIA

Sources – Case: USA 2008 LLNL – DOE
Units: [QUADS]
Efficiency in geotechnology? crushing<5% tunneling<< ants!

1 By
4.5 B
2 By 3 By 4 By 0
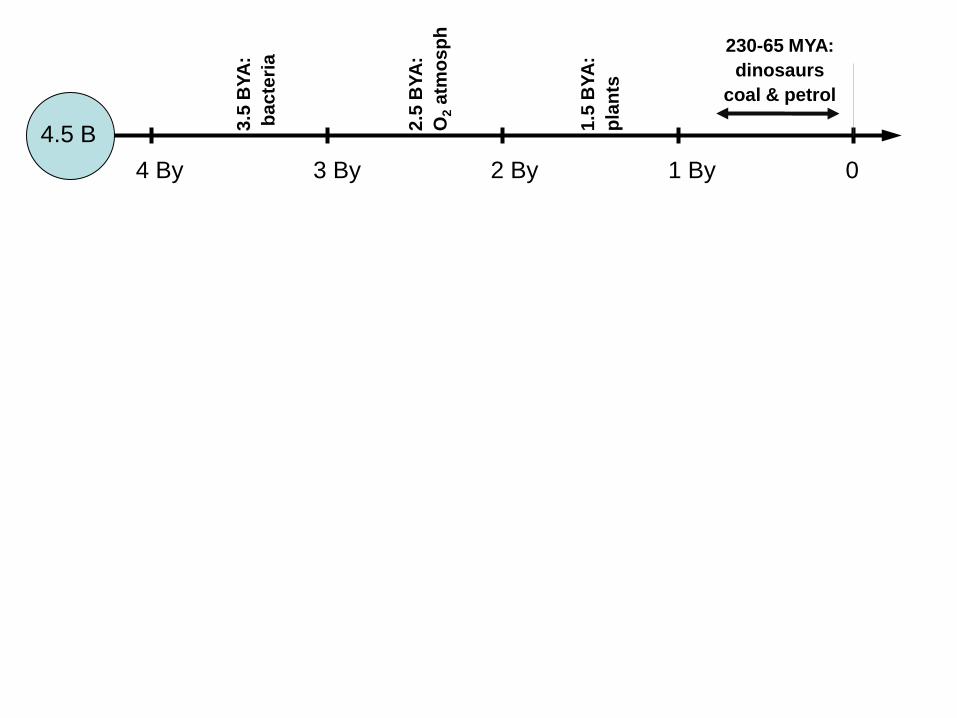
Geo-Centered Perspective: Time Scale
1 By
4.5 B
2 By 3 By 4 By 0
3.5
BY
A:
ba
cte
ria
2.5
BY
A:
O2 a
tmo
sp
h
1.5
BY
A:
pla
nts
230-65 MYA:
dinosaurs
coal & petrol

0 My 2 My 4 My 6 My 8 My 10 My
1 By
4.5 B
2 By 3 By 4 By 0

0 My 2 My 4 My 6 My 8 My 10 My
1 By
4.5 B
2 By 3 By 4 By 0
400k 300k 200k 100k 0k
Fedorov et al 2006
8 o
C 220
300
380
T
CO2

0 My 2 My 4 My 6 My 8 My 10 My
1 By
4.5 B
2 By 3 By 4 By 0
0 2000 yr -2000 yr -4000 yr -6000 yr
History of fossil fuels: a -function

200
300
400
500
1000 1200 1400 1600 1800 2000
Year
CO
2 (
pp
m)
-0.5
0
0.5
1
1.5
2
2.5
Te
mp
an
om
aly
(o
C)
2050
0 2000 yr -2000 yr -4000 yr -6000 yr
Global implications

C
CO2
Fossil Fuel: ~90%
Geo-Centered Perspective: Spatial Scale
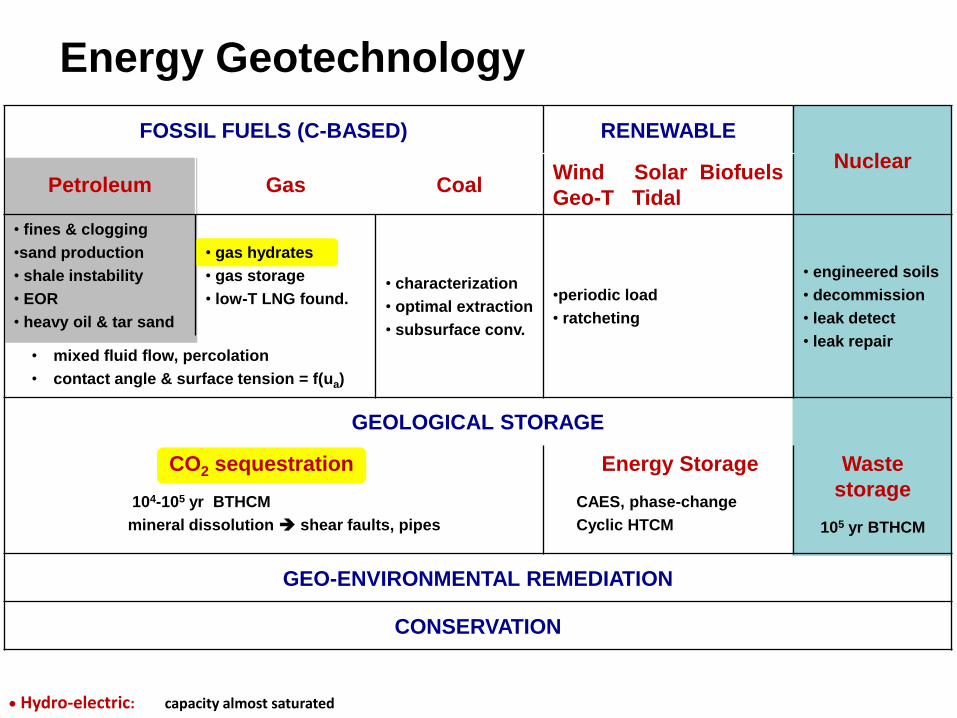
FOSSIL FUELS (C-BASED) RENEWABLE
Nuclear Petroleum Gas Coal
Wind Solar Biofuels
Geo-T Tidal
• fines & clogging
•sand production
• shale instability
• EOR
• heavy oil & tar sand
• gas hydrates
• gas storage
• low-T LNG found. • characterization
• optimal extraction
• subsurface conv.
•periodic load
• ratcheting
• engineered soils
• decommission
• leak detect
• leak repair • mixed fluid flow, percolation
• contact angle & surface tension = f(ua)
GEOLOGICAL STORAGE
CO2 sequestration
104-105 yr BTHCM
mineral dissolution shear faults, pipes
Energy Storage
CAES, phase-change
Cyclic HTCM
Waste
storage
105 yr BTHCM
GEO-ENVIRONMENTAL REMEDIATION
CONSERVATION
Hydro-electric: capacity almost saturated
Energy Geotechnology

Energy Geotechnology: Phases
Gas water vapor
CO2
CH4
Liquid water
CO2
oil
Solid mineral
ice
CO2 hydrate
CH4 hydrate
supercritical CO2
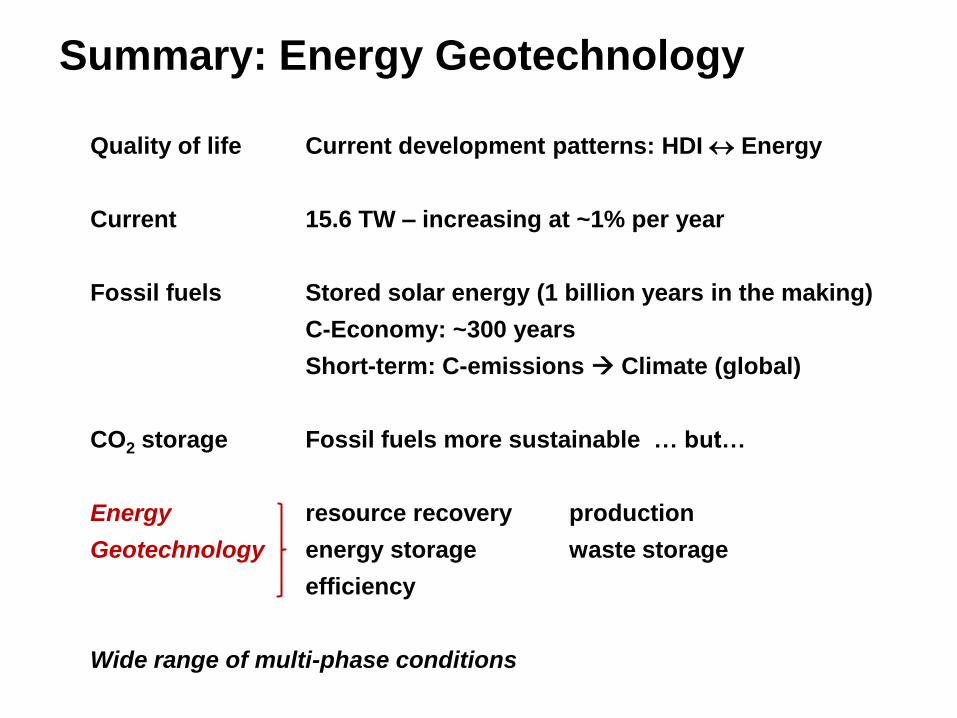
Summary: Energy Geotechnology
Quality of life Current development patterns: HDI Energy
Current 15.6 TW – increasing at ~1% per year
Fossil fuels Stored solar energy (1 billion years in the making)
C-Economy: ~300 years
Short-term: C-emissions Climate (global)
CO2 storage Fossil fuels more sustainable … but…
Energy resource recovery production
Geotechnology energy storage waste storage
efficiency
Wide range of multi-phase conditions

CH4 hydrates
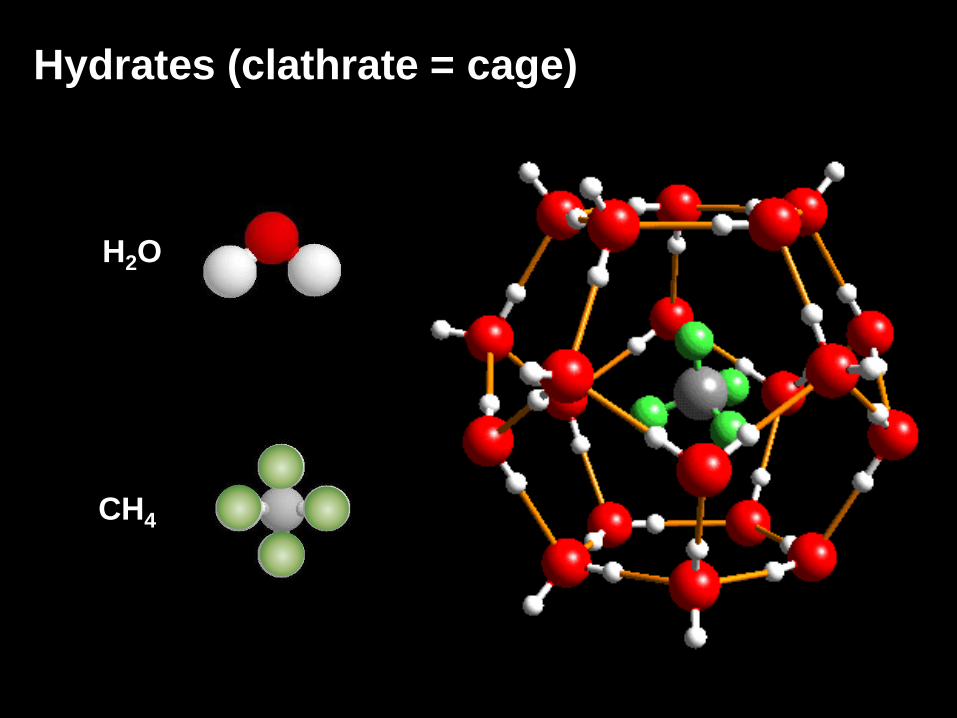
Hydrates (clathrate = cage)
H2O
CH4
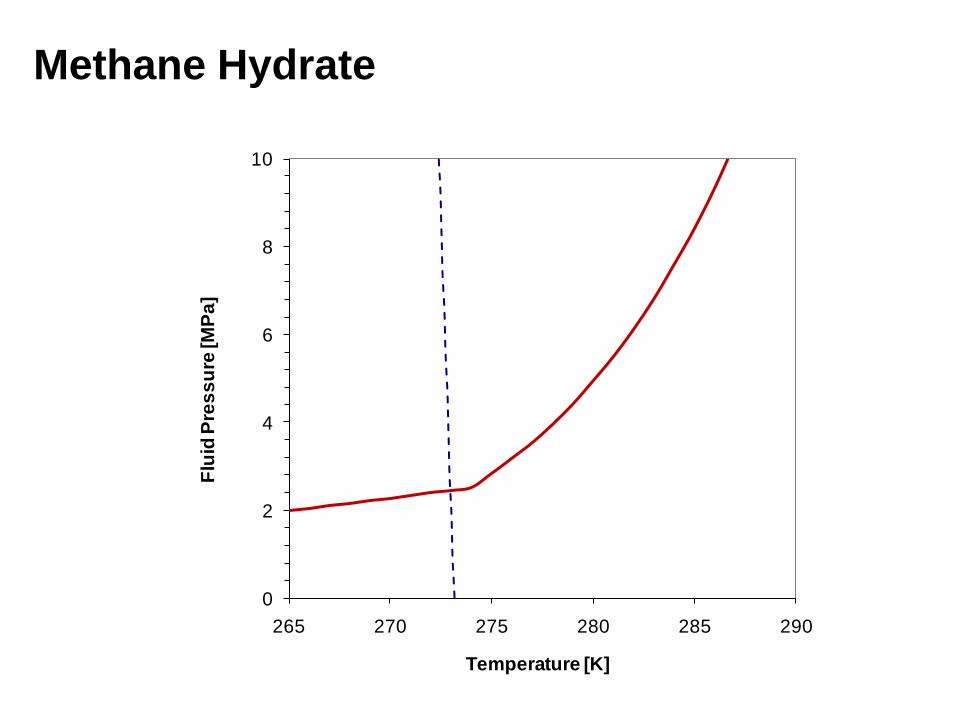
Methane Hydrate
0
2
4
6
8
10
265 270 275 280 285 290
Flu
id P
res
su
re [M
Pa
]
Temperature [K]

Methane Hydrate
0
2
4
6
8
10
265 270 275 280 285 290
Flu
id P
res
su
re [M
Pa
]
Temperature [K]
W+G I+G
H+W
H+G
H+I
H+G
I+G
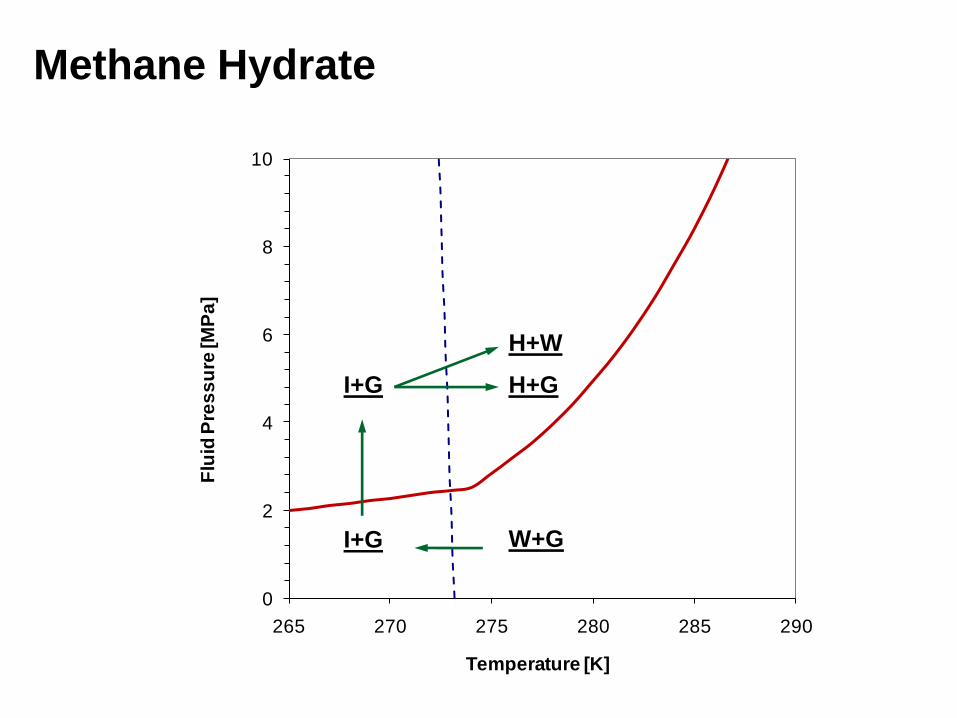
Methane Hydrate
0
2
4
6
8
10
265 270 275 280 285 290
Flu
id P
res
su
re [M
Pa
]
Temperature [K]
W+G I+G
I+G
H+W
H+G

Methane Hydrate
0
2
4
6
8
10
265 270 275 280 285 290
Flu
id P
res
su
re [M
Pa
]
Temperature [K]
W+G
H+W
H+G
H+I
H+G
I+G
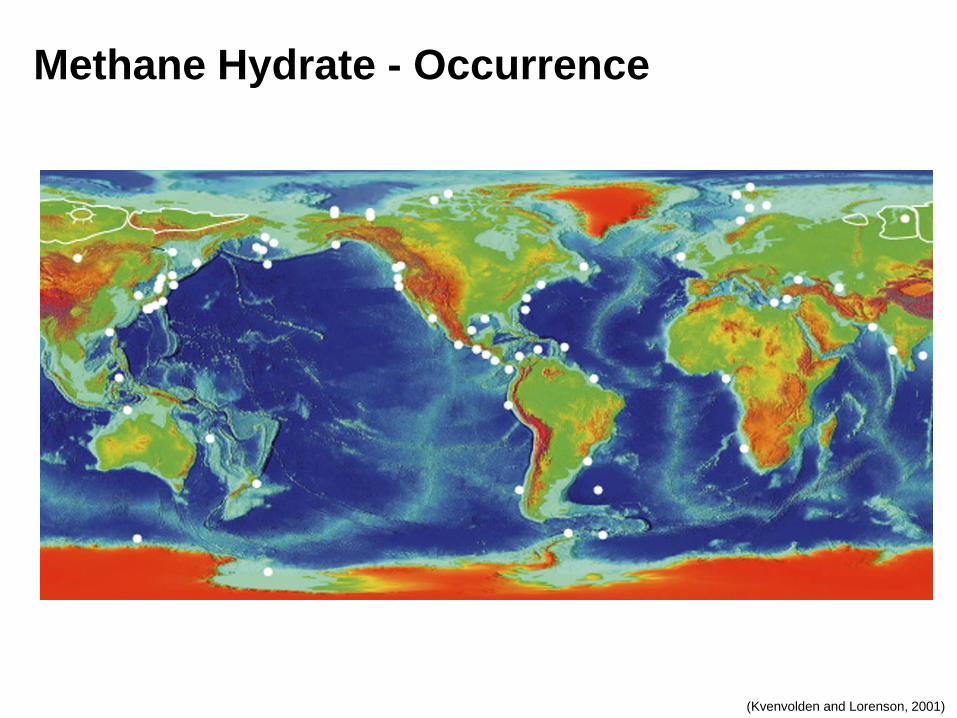
Methane Hydrate - Occurrence
(Kvenvolden and Lorenson, 2001)
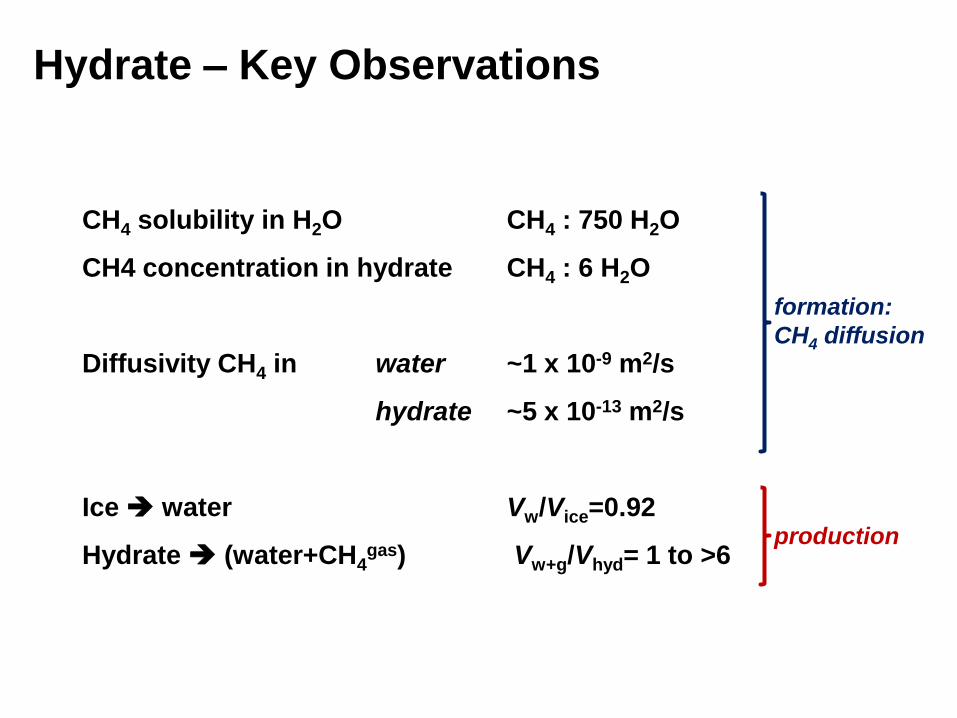
Hydrate – Key Observations
CH4 solubility in H2O CH4 : 750 H2O
CH4 concentration in hydrate CH4 : 6 H2O
Diffusivity CH4 in water ~1 x 10⁻⁹ m2/s
hydrate ~5 x 10-13 m2/s
Ice water Vw/Vice=0.92
Hydrate (water+CH4gas) Vw+g/Vhyd= 1 to >6
formation:
CH4 diffusion
production
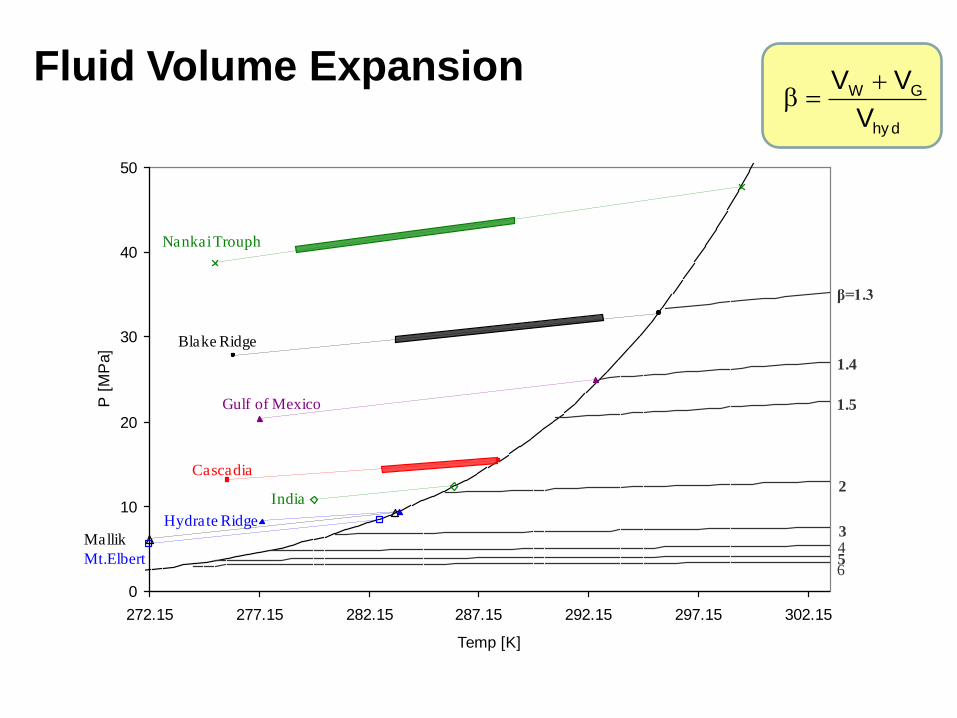
0
10
20
30
40
50
272.15 277.15 282.15 287.15 292.15 297.15 302.15
Temp [K]
P [
MP
a]
India
Cascadia
Hydrate Ridge
Gulf of Mexico
Mallik
Mt.Elbert
β=1.3
1.4
1.5
2
34
6
Nankai Trouph
Blake Ridge
5
Fluid Volume Expansion
hy d
GW
V
VV
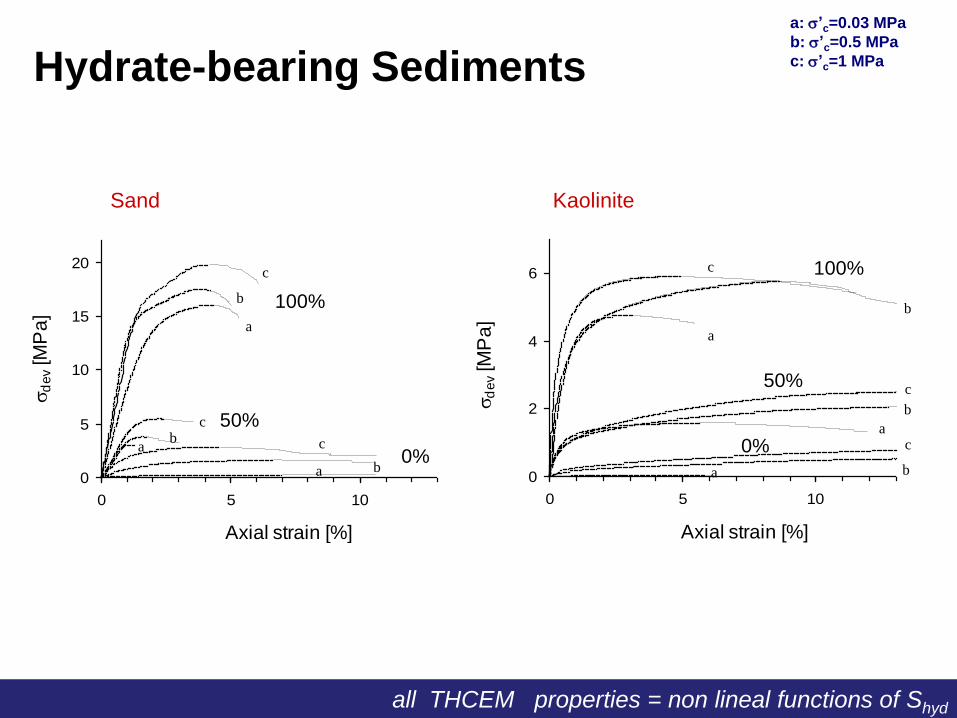
Sand Kaolinite
Hydrate-bearing Sediments
a: ’c=0.03 MPa
b: ’c=0.5 MPa
c: ’c=1 MPa
0
5
10
15
20
0 5 10
Axial strain [%]
0
2
4
6
0 5 10
d
ev
[MP
a]
d
ev
[MP
a]
Axial strain [%]
50%
0%
a
b
c
ab
c
a
c
b
100%
50%
0%
a
a
a
b
b
b
c
c
c
100%
all THCEM properties = non lineal functions of Shyd

Summary: Methane Hydrates
Relevance: C-reserves climate change instability
Formation PT history dependent
Shyd is CH4-limited (typically)
Multi-phase Hydrate Water Gas Ice Mineral (not all at once)
Pore habit Patchy (coarse grained sediments)
Lenses (fine grained sediments)
THCEM properties Non linear functions of Shyd
Gas Production Endothermic (may be heat-limited)
Very large volume expansion
Production from sands? from clayey sediments?
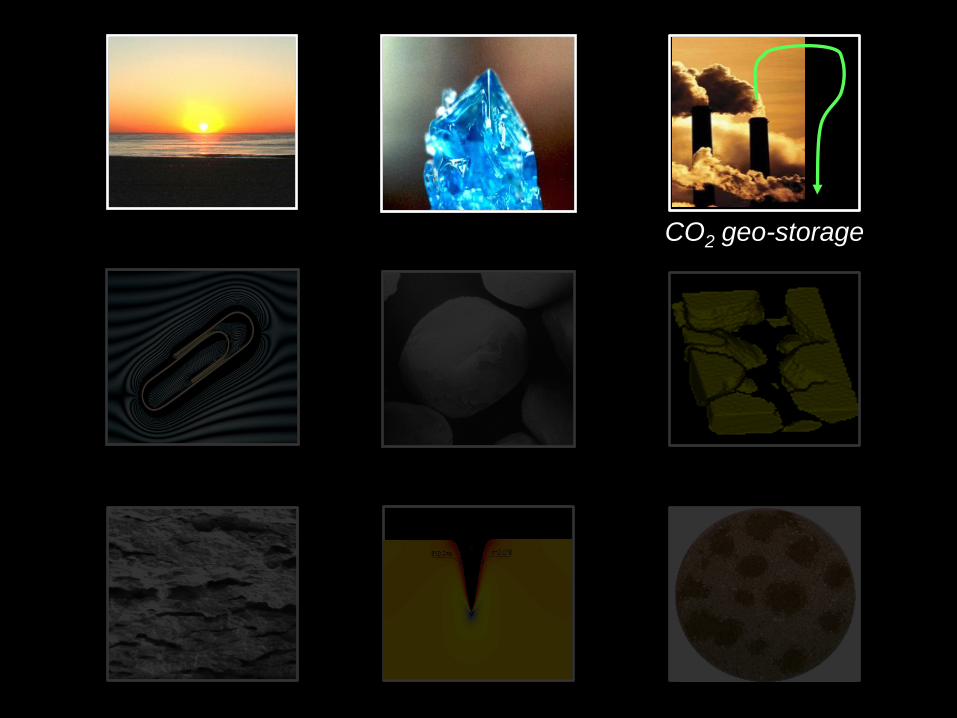
CO2 geo-storage

Geological Storage of CO2
Deep Saline Aquifer
z=0.7~3.5 km
Depleted Hydro-
Carbon Reservoir
z=1.7~4.5 km
Oil Reservoir
z=0.5~3.7 km
Coal seams
z=0.3~1.1 km
Hydrate Stability Z
z=0.3~0.8 km
Cap rock
Cap rock
Cap rock
Cap rock

CO2 Properties
0.1
1
10
100
1000
-100 -60 -20 20 60 100 140
Temperature [°C]
Pre
ssure
[M
Pa]
Supercritical CO2
CO2 LiquidCO2 Solid
CO2 Gas
CO2
Hydrate
0.1
1
10
100
1000
-100 -60 -20 20 60 100 140
Temperature [°C]
Pre
ssure
[M
Pa]
Supercritical CO2
CO2 LiquidCO2 Solid
CO2 Gas
CO2
Hydrate
supercritical
CO2
Cap rock

Water and Liquid CO2 Properties
Property [units] CO2 liquid H2O liquid
Heat capacity cp [kJ·kg-1·K-1] 2.3 4.2
Thermal cond. [W·m-1·K-1] ~0.13 0.56
Thermal Diff. [m2s-1] 6.1×10⁻⁸ 1.3×10⁻⁷
Viscosity μ [Pa·s] (2-to-8)×10-5 ~1.5×10⁻³
Density ρ [kg·m-3] ~938-to-800 1003
Bulk Modulus [GPa] 0.1-to-0.3 2.1-to-2.3
VP [m/s] ~400-to-600 1450-to-1520
Electrical cond. [S/m] < 0.01 f(c) - seawater: ~5
Dielectric permit. [ ] ~ 1.5 ~79

Diffusion of CO2 in H2O
Water diffusion into liquid CO2: D~10-7 m2/s

Solubility of CO2 in Water - pH
(1) change in surface charge change in fabric (2) mineral dissolution
0
0.2
0.4
0.6
0.8
1
1.2
1.4
0 5 10 15 20
So
lub
ilit
y o
f C
O2
[mo
l/L
]
Fluid pressure [MPa]
in 1 mol NaCl solution
0.0
0.2
0.4
0.6
0.8
1.0
1.2
1.4
3.0 3.5 4.0 4.5
Dis
so
lved
CO
2[m
ol/
L]
pH
T= 30C
60C
90C
120C
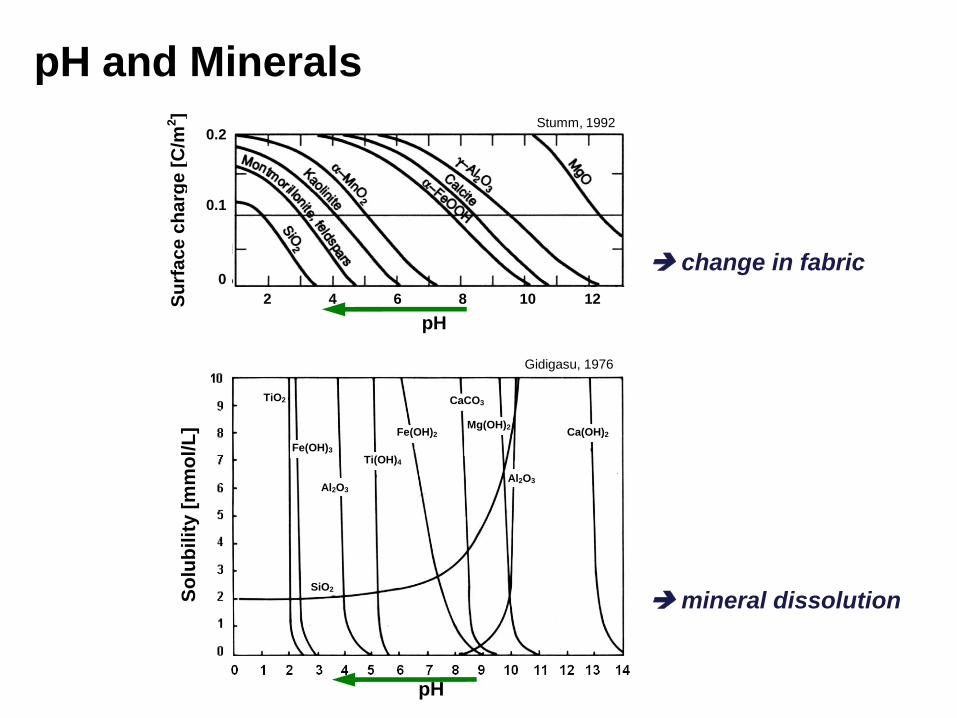
pH and Minerals
2 4 6 8 10 12
pH
Su
rface c
harg
e [
C/m
2]
0.2
0.1
0
-0.1
change in fabric
Stumm, 1992
TiO2
SiO2
pH
So
lub
ilit
y [
mm
ol/
L]
Fe(OH)3
Al2O3
Ti(OH)4
Fe(OH)2
CaCO3
Ca(OH)2 Mg(OH)2
Al2O3
Gidigasu, 1976
mineral dissolution
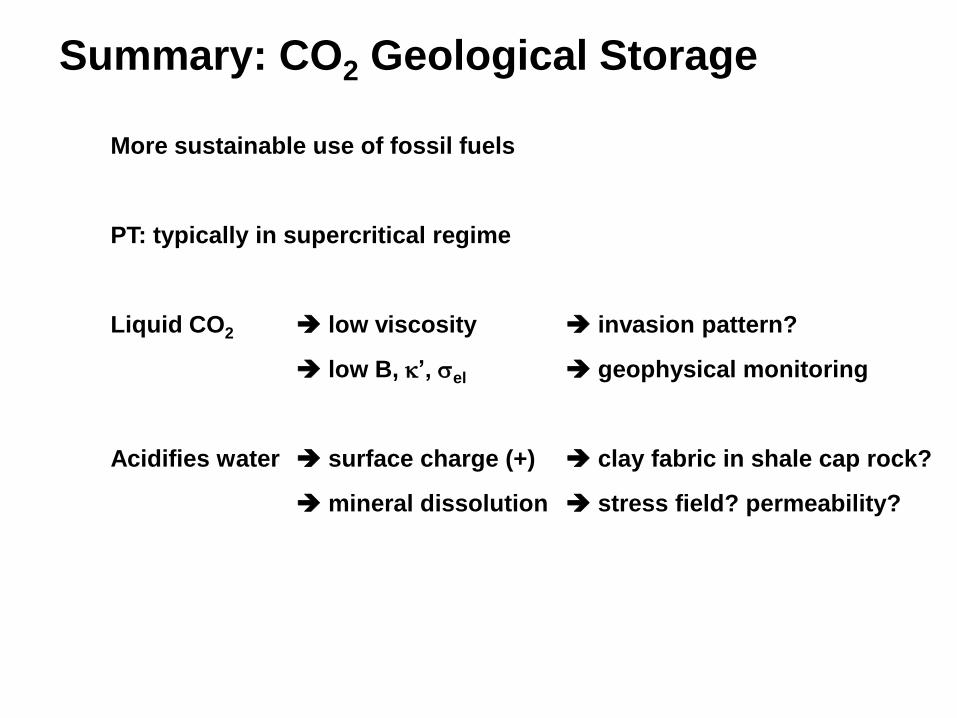
Summary: CO2 Geological Storage
More sustainable use of fossil fuels
PT: typically in supercritical regime
Liquid CO2 low viscosity invasion pattern?
low B, ’, el geophysical monitoring
Acidifies water surface charge (+) clay fabric in shale cap rock?
mineral dissolution stress field? permeability?
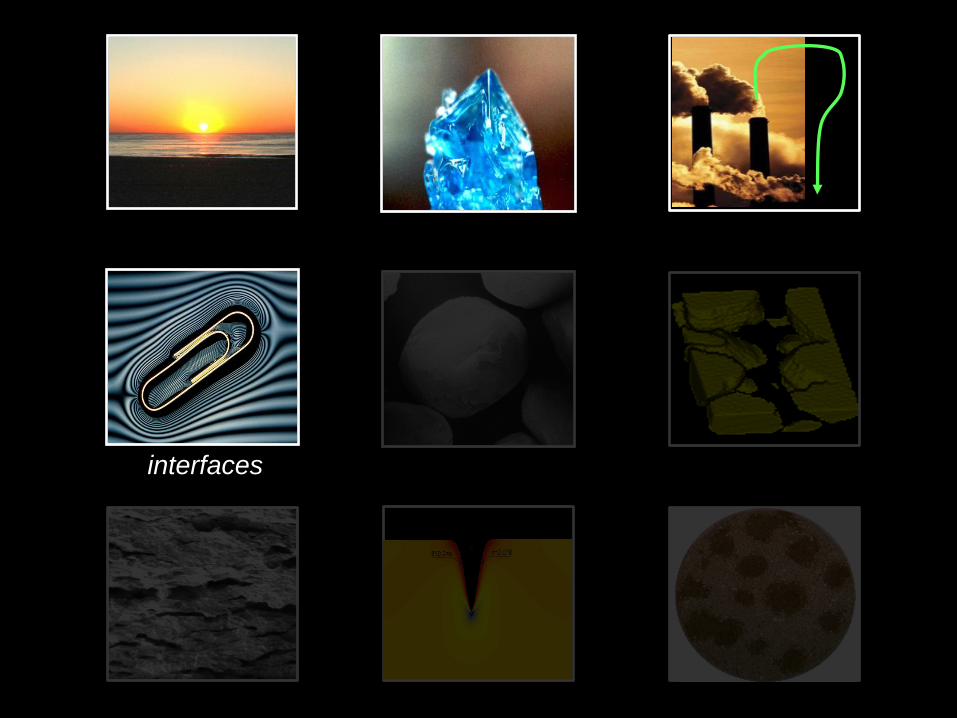
interfaces

BBC News In pictures Visions of Science.jpg
Surface Tension

Low P High P
CO2-H2O: Interfacial Interaction
(1) mutual diffusion of CO2-H2O (2) interfacial tension=f(P)

Surface Tension and Contact Angle
Water droplet in
CO2 gas
CO2 liquid
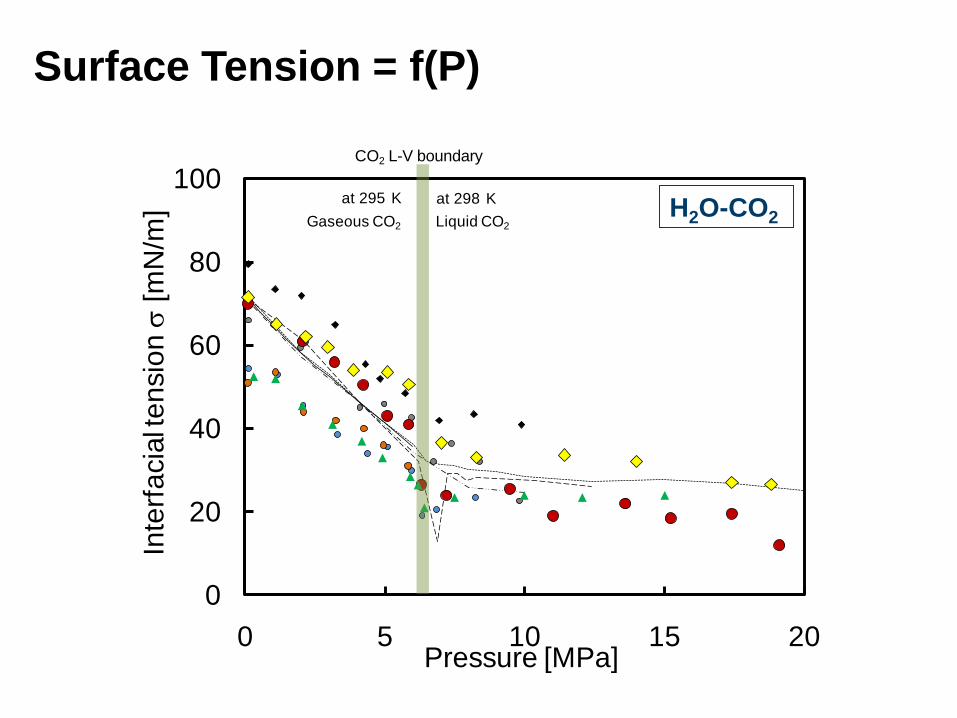
Surface Tension = f(P)
0
20
40
60
80
100
0 5 10 15 20
Inte
rfa
cia
l te
nsio
n
[mN
/m]
Pressure [MPa]
CO2 L-V boundary
at 298 Kat 295 K
Gaseous CO2 Liquid CO2
H2O-CO2
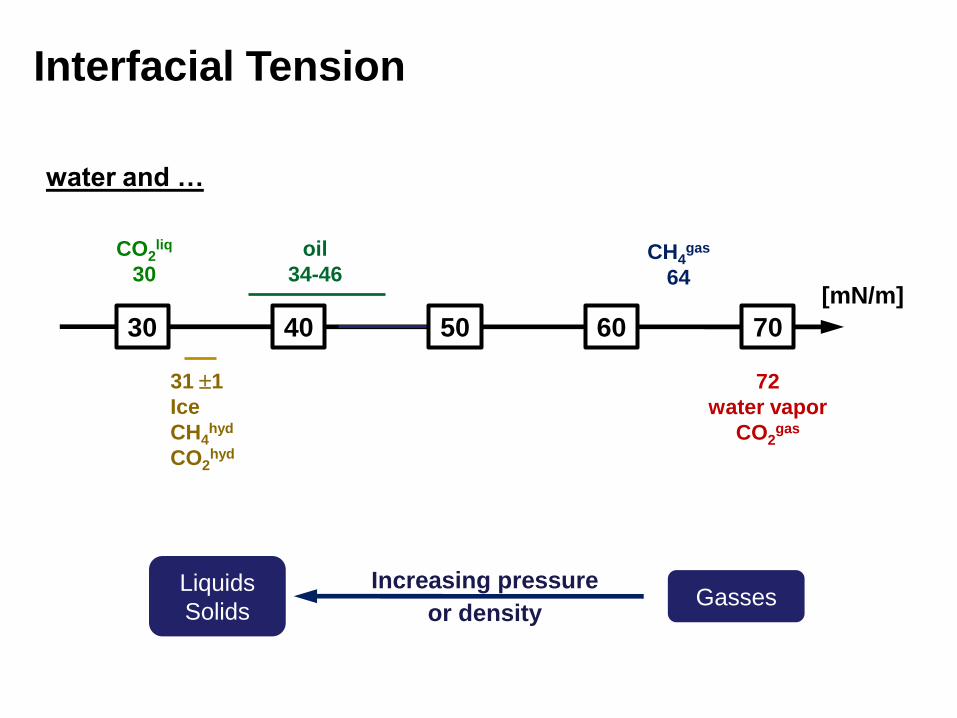
Interfacial Tension
30
72
water vapor
CO2gas
31 1
Ice
CH4hyd
CO2hyd
oil
34-46 CH4
gas
64
70 40 50 60
CO2liq
30 [mN/m]
water and …
Gasses Liquids
Solids
Increasing pressure
or density
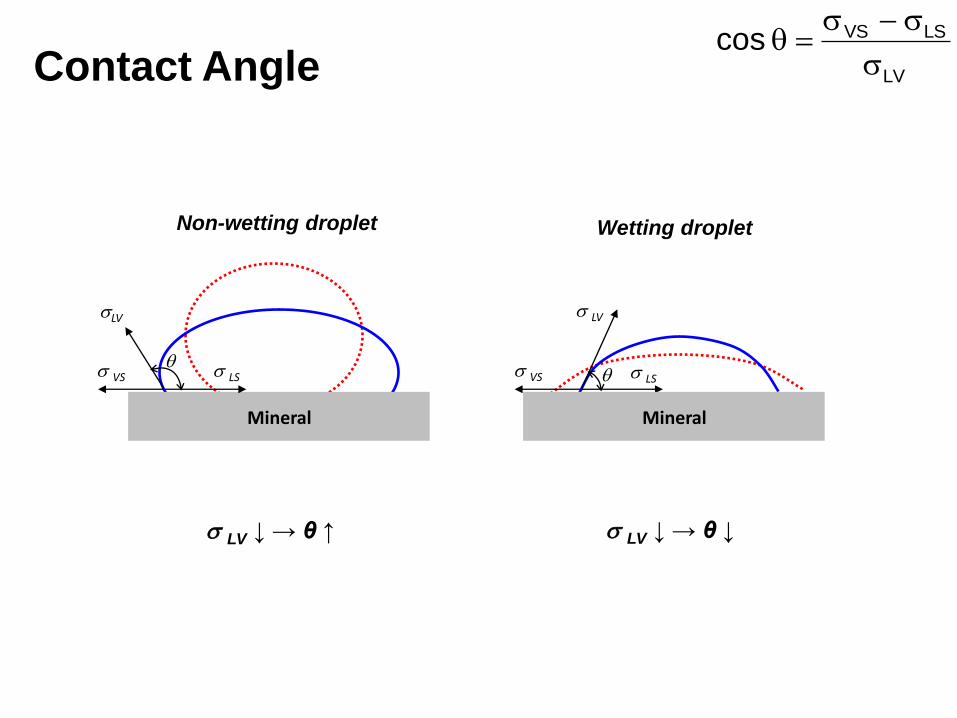
VS LS
LV
q VS LS
LV
q
Mineral
Non-wetting droplet Wetting droplet
LV ↓ → θ ↑ LV ↓ → θ ↓
Mineral
Contact Angle LV
LSVScos
q

Contact Angle = f(Pgas) LV
LSVScos
q

Alveola size S
urf
ace tensio
n
Air
Other Effects - Surfactants
30 mN/m
hydrophobic hydrophilic
Surfactant Surface tension = f(pore size) S-u data interpretation
Pulmonary self-regulation:
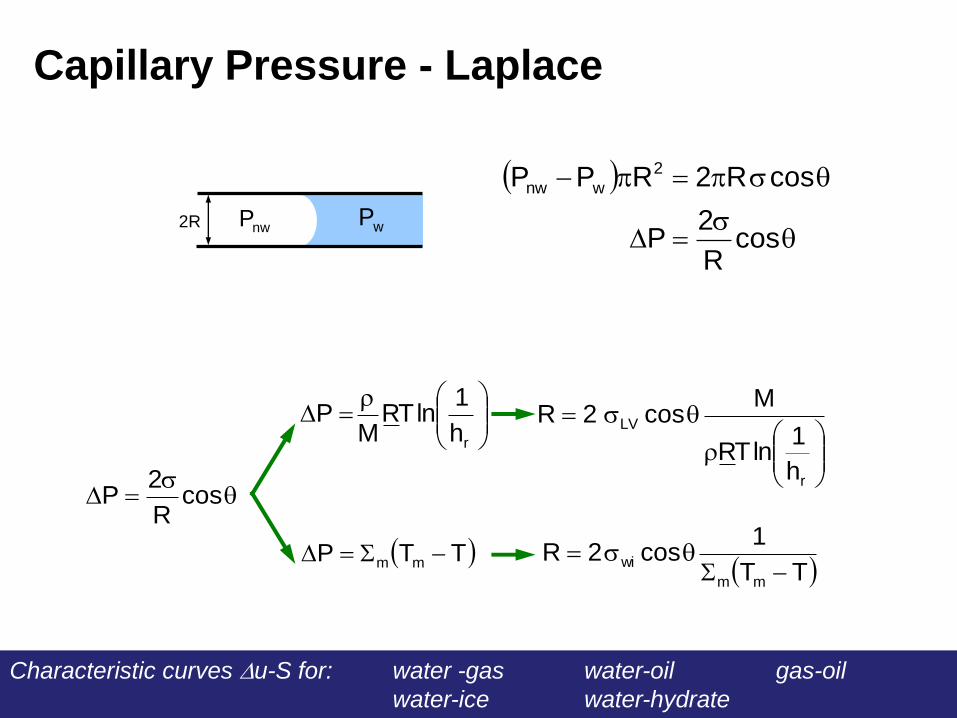
2R nwP wP
q
q
cosR
2P
cosR2RPP 2
wnw
Capillary Pressure - Laplace
q
cosR
2P
rh
1lnTR
MP
TTP mm
q
r
LV
h
1lnTR
Mcos2R
TT
1cos2R
mm
wi
q
Characteristic curves u-S for: water -gas water-oil gas-oil
water-ice water-hydrate

Summary: Interfacial Phenomena
Interfacial tension: participating molecules and PT (or density)
Contact angle: varies with interfacial tensions
Implications: capillarity
characteristic curves
resource recovery
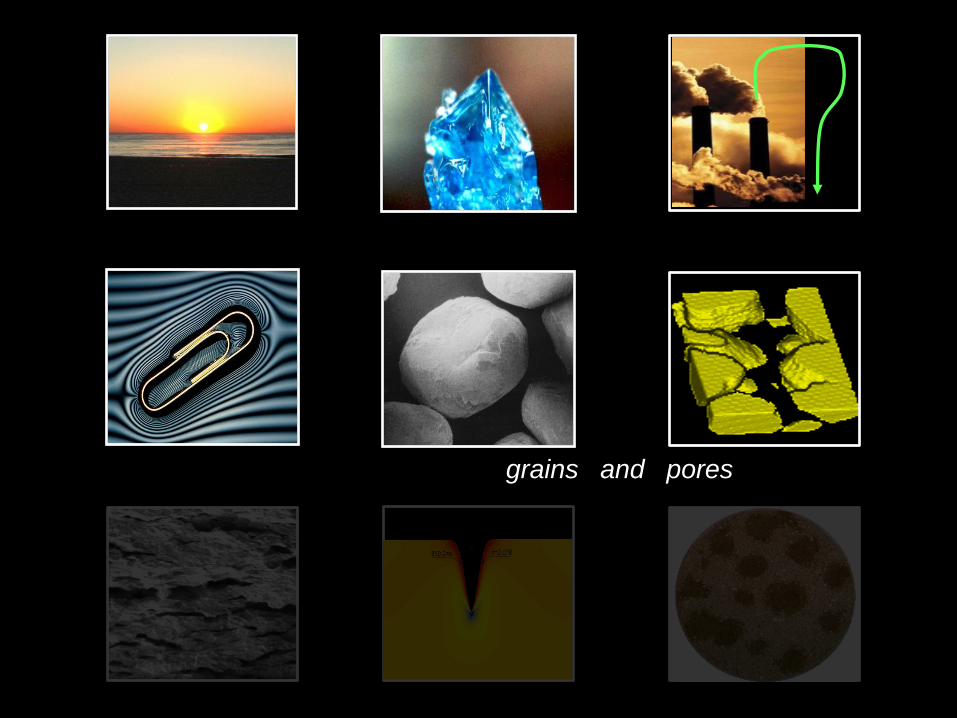
grains and pores

Critical fines
Content FC*
finecoarse
coarse
total
fine*
ee1
e
M
MFC
Grain Size Distribution: The Role of Fines
Sediment e1kPa FC*
Silt ~0.7 ~ 25 %
Kaolinite ~1.5 ~ 20 %
Illite ~3.7 ~ 11 %
Montmorillonite ~5.4 ~ 8 %
(for mechanical properties …)

Critical fines
Content FC*
Fines Migration and Clogging
fines migration
& clogging
Volout = 20cc Volout = 40cc Volout = 70cc Volout = 100cc
early Q after large Q
J. Valdez

Grains and Pores: Clays
L
dpore
t
s
poreS
e2d
'
1kPa ce e C log1kPa
Sediment compaction
Sediment e1kPa CC S [m2/g] mean dpore P [Mpa]
Silt ~0.7 0.02-0.09 0.045-1 5 m 0.05
Kaolinite ~1.5 0.19-0.3 10-20 0.5 m 0.5
Illite ~3.7 0.5-1.1 65-100 0.05 m 5
Montmorillonite ~5.4 1-2.6 300-780 0.005 m 50
MEAN PORE SIZE
@ ’=100 kPa LV=70 mN/m

0.01
0.10
1.00
10.00
100.00
0.10 1.00 10.00 100.00 1000.00
Mean of d [micron]
Sta
nd
ard
de
via
tio
n o
f d
[m
icro
n]
(σd/μd) σln(dpore)
d
d
0.4
Pore Size Distribution
Log (dpore/micron)

Network Models – Upscaling
Mass Balance at Nodes
c0 q
Poiseuille’s Eq. PL
Rq
8
4
a a c b b c r r c l l c0 P P P P P P P P
a a b b r r l l
c
a b r l
P P P PP
L
R
8
4
Pl
Pb
Pc
Pa
Pr
System of Equations
1B AP then P A B
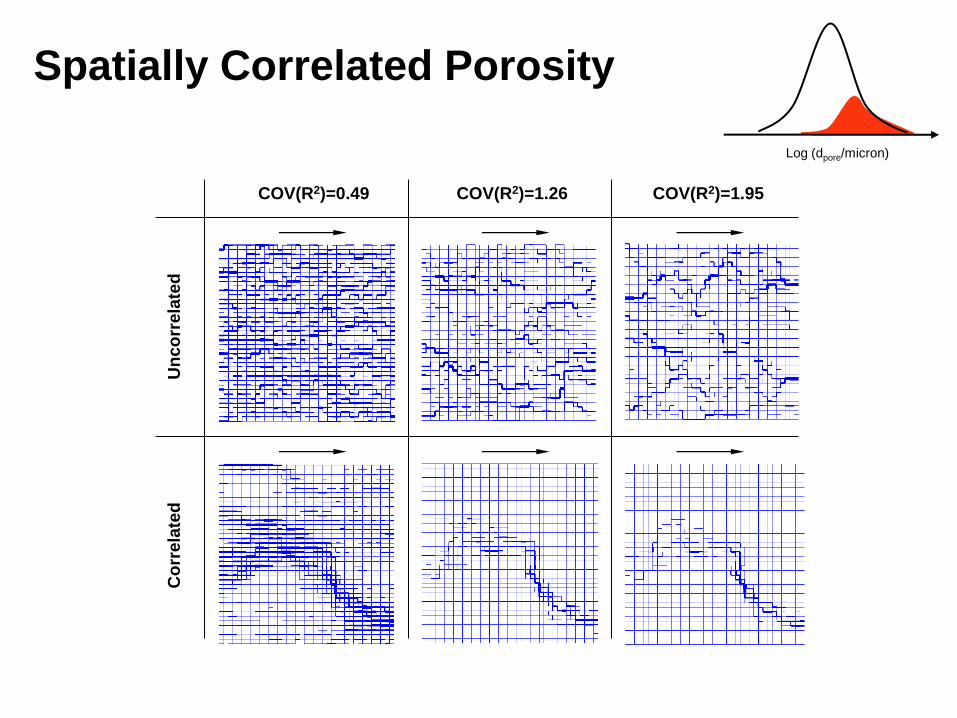
COV(R2)=0.49 COV(R2)=1.26 COV(R2)=1.95 U
nc
orr
ela
ted
C
orr
ela
ted
Spatially Correlated Porosity
Log (dpore/micron)
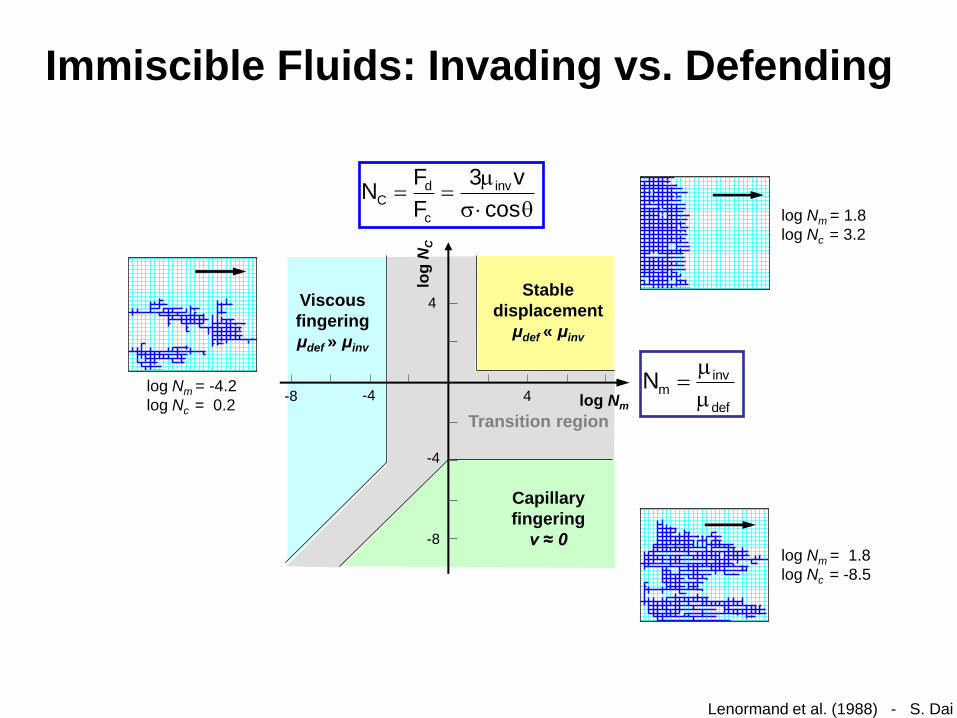
log Nm
log
NC
4 -4 -8
-4
-8
4 Viscous
fingering
μdef » μinv
Stable
displacement
μdef « μinv
Capillary
fingering
v ≈ 0
Transition region
Lenormand et al. (1988) - S. Dai
5 10 15 20 25 30
5
10
15
20
25
30
log Nm = -4.2
log Nc = 0.2
5 10 15 20 25 30
5
10
15
20
25
30
log Nm = 1.8
log Nc = -8.5
5 10 15 20 25 30
5
10
15
20
25
30
log Nm = 1.8
log Nc = 3.2
Immiscible Fluids: Invading vs. Defending
q
cos
v3
F
FN inv
c
dC
def
invmN

invasion nucleation
Gas Invasion vs. & Gas Nucleation

0.0
0.2
0.4
0.6
0.8
1.0
1 2 3 4 5 6 7 8 9 10
Gas r
eco
ve
ry e
ffic
ien
cy E
10%
5%
30%
Expansion factor β
20%
Sh
40%
15%
μ(Rp)= 1μm
Gas
Water
Pore
Throat
Characteristic Curve Recovery Efficiency
Methane Hydrates

Summary: Grains and Pores
CAUTION fines content !
Invasion pore size distribution and connectivity
patterns: flow velocity and rel. viscosities
Gas invasion Gas nucleation
similar characteristic curve
different relative permeabilities
Characteristic curve Recovery efficiency

positive feedback in coupled THCM processes localizations

Drainage
Pressure
transducer
Pressure
port
Microscope
/ Digital camera
100 mm
40
mm
Sediment
(water)
Invading
fluid (oil)
Forced Immiscible Fluid Invasion - Device

Time
Suction
wate
r co
nte
nt
a b c d e
a
b
c
d
e
Evolution

Forcing Gas Into Sediment
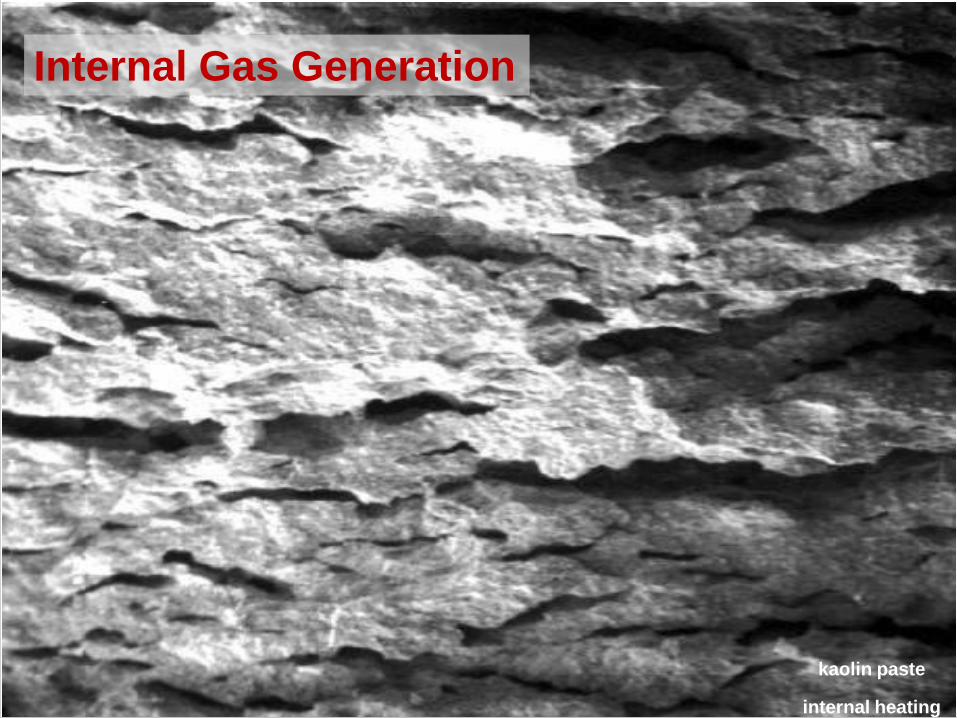
kaolin paste
internal heating
Internal Gas Generation

Ice Lenses

Ice Lens Formation Under Stress Boundary
Compression
Tension
Tension /
compression
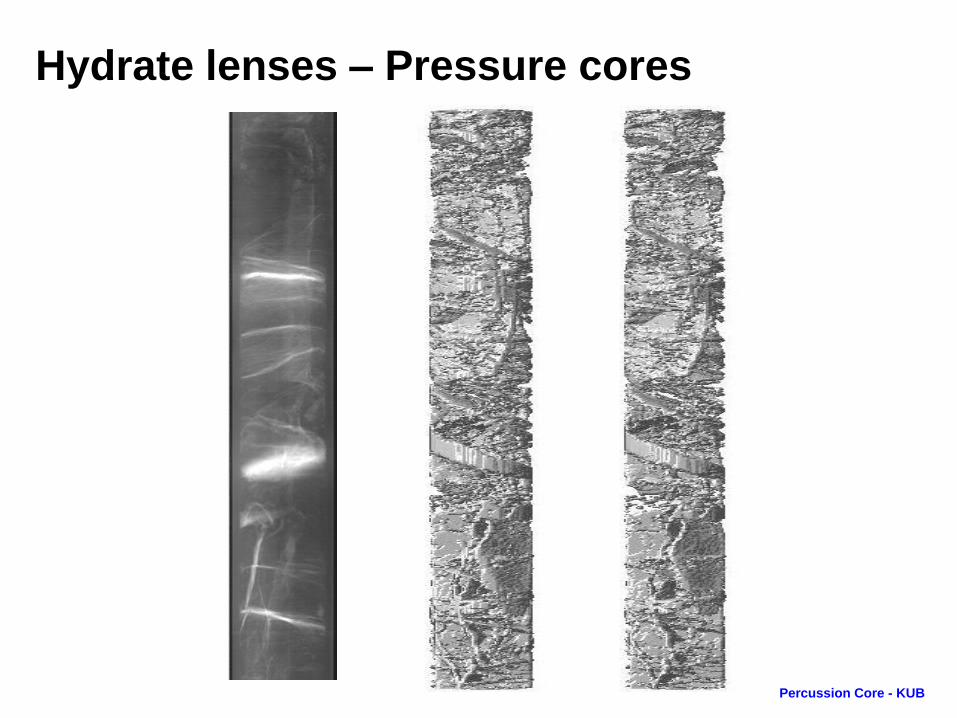
Percussion Core - KUB
Hydrate lenses – Pressure cores

Tip Conditions e
SρP ss
Sediment in compression EVERYwhere

Gas-Driven Fracture

1.0 10 0.1
LOCALIZATION
Lenses
Fractures
Hyd.: lenses
INVASION
Fluid invasion
Crystal growth in pores
Hyd.: patchy saturation d'
2
N
F LVc
fine grained soils
low effective stress
coarse grained soils
high effective stress
Invasion vs. Localization
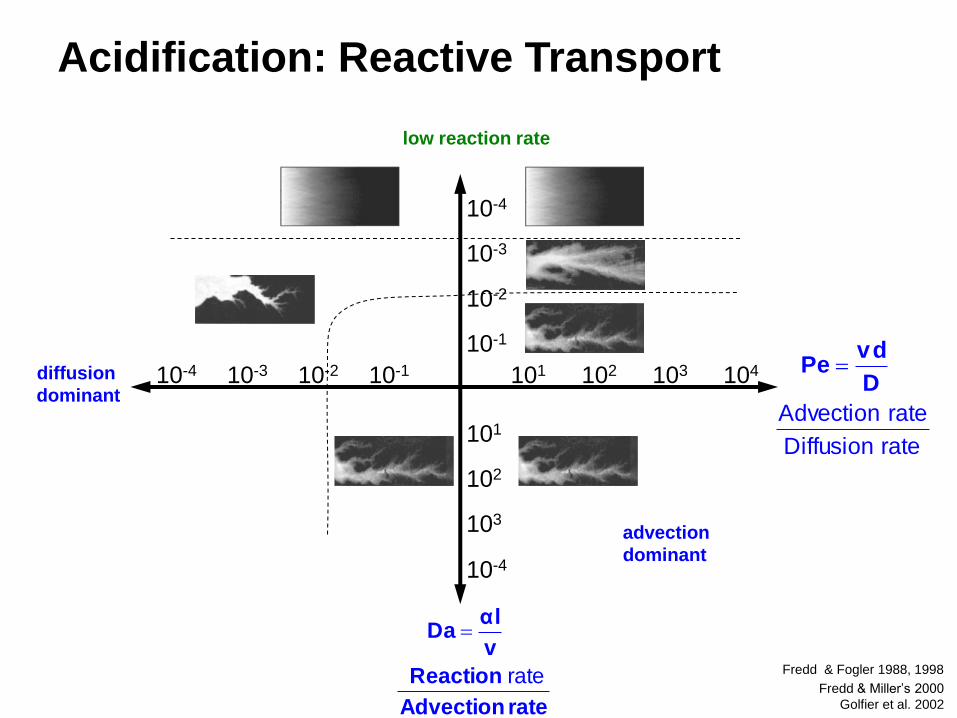
Acidification: Reactive Transport
rateDiffusion
rateAdvection
D
dvPe
rate Advection
Reaction
v
lαDa
rate
diffusion
dominant
advection
dominant
low reaction rate
Fredd & Fogler 1988, 1998
Fredd & Miller’s 2000
Golfier et al. 2002
10-4 10-3 10-2 101 102 103 104 10-1
103
102
101
10-1
10-2
10-3
10-4
10-4

Dissolution + k + q : Localized Flow

0.3
0.4
0.5
0.6
0.7
0 1000 2000
Time (sec)
La
tera
l s
tre
ss
co
eff
icie
nt,
k
0.00
0.02
0.04 Ve
rtic
al s
tra
in 90% glass bead + 10% NaCl
Dissolution ko
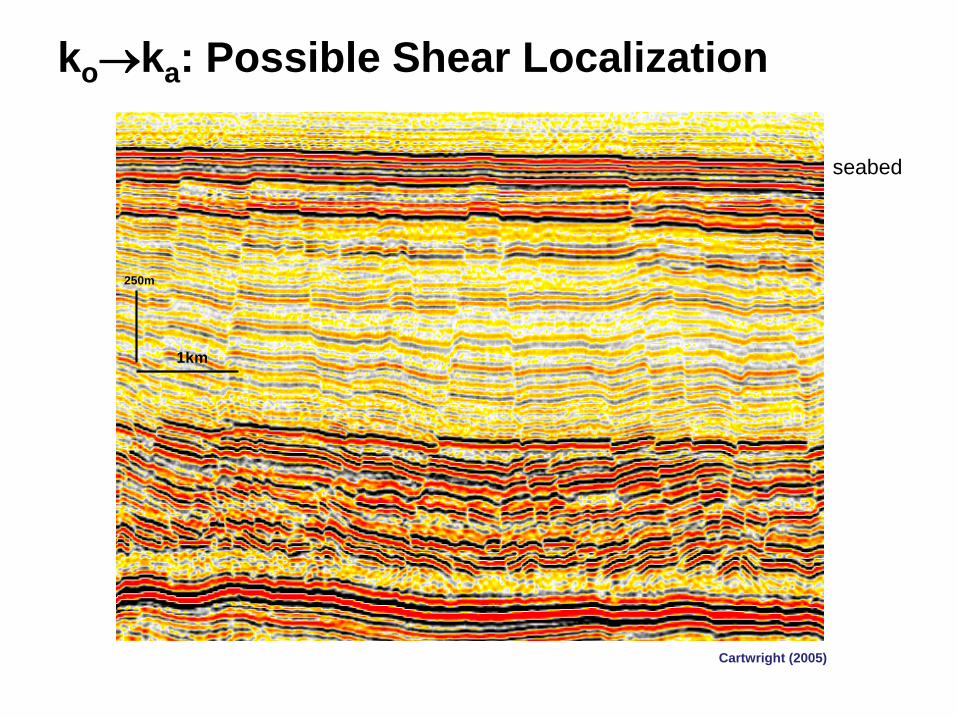
1km
250m
Cartwright (2005)
seabed
koka: Possible Shear Localization
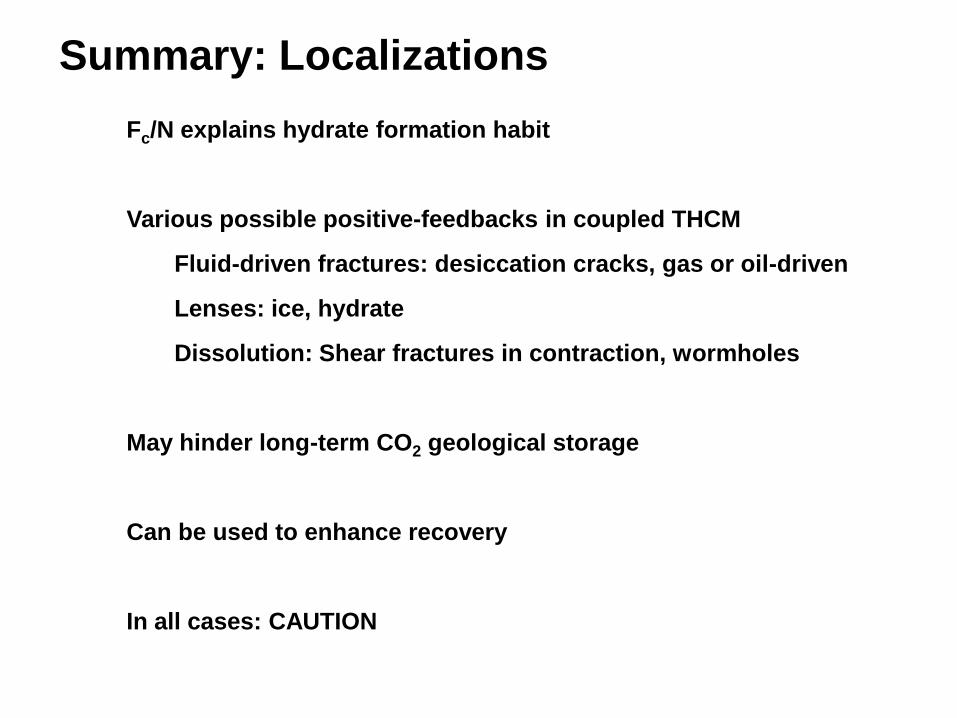
Summary: Localizations
Fc/N explains hydrate formation habit
Various possible positive-feedbacks in coupled THCM
Fluid-driven fractures: desiccation cracks, gas or oil-driven
Lenses: ice, hydrate
Dissolution: Shear fractures in contraction, wormholes
May hinder long-term CO2 geological storage
Can be used to enhance recovery
In all cases: CAUTION

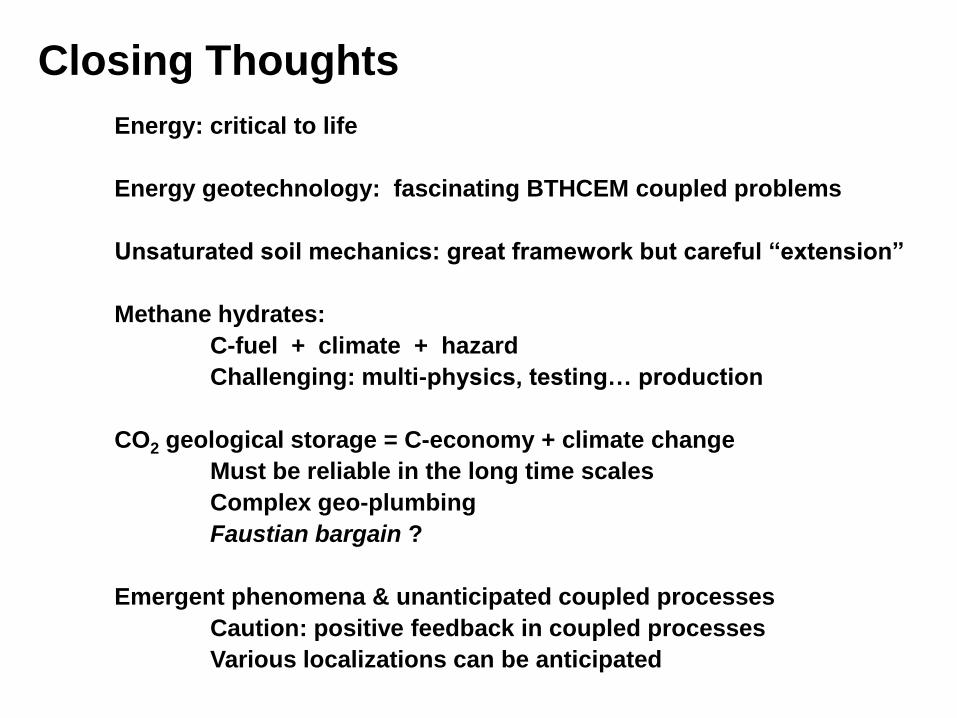
Closing Thoughts
Energy: critical to life
Energy geotechnology: fascinating BTHCEM coupled problems
Unsaturated soil mechanics: great framework but careful “extension”
Methane hydrates:
C-fuel + climate + hazard
Challenging: multi-physics, testing… production
CO2 geological storage = C-economy + climate change
Must be reliable in the long time scales
Complex geo-plumbing
Faustian bargain ?
Emergent phenomena & unanticipated coupled processes
Caution: positive feedback in coupled processes
Various localizations can be anticipated
J.W. Jung P. Taboada H. Shin N. Espinoza
F. Francisca J.Y. Lee A.I. Martin T.S. Yun D. Cortes T.H. Kwon
C.H. Lee S. Dai
C. Ruppel USGS
C Tsouris ORNL and team
M. Sanchez Texas A&M
G.C. Cho KAIST
K. Soga Cambridge U.
JS Lee Korea U.