Energy from Biomass - Ministerio Economía · Energy from Biomass Work Supported BY MNRE P. J. Paul...
56
MICINN‐DST Joint Workshop on Renewable Energy Energy from Biomass Work Supported BY MNRE P. J. Paul Combustion, Gasication and Propulsion Laboratory, Department of Aerospace Engineering, Indian Institute of Science Indian Institute of Science, Bangalore 560012
Transcript of Energy from Biomass - Ministerio Economía · Energy from Biomass Work Supported BY MNRE P. J. Paul...

MICINN‐DST Joint Workshop on Renewable Energy
Energy from Biomass
Work Supported BY MNRE
P. J. PaulCombustion, Gasication and Propulsion Laboratory,
Department of Aerospace Engineering,Indian Institute of ScienceIndian Institute of Science,
Bangalore 560012

OverviewOverview
• Biomass and its potential for power generationg
• Types of biomass
T h l f bi ili i• Technology for biomass utilization– Biomass conversion technologies
– Biomass gasification
– Engines– Engines
Climate changeClimate change
• Increase in green house gases emission possibly leading to global warming and climate change
• Fossil fuels play a very important role in the economies and lifestyles of people throughouteconomies and lifestyles of people throughout the world
C th l b l b d i• Can the global economy can be powered in ways that might have less impact on the environment b h di h l b di id ?because they discharge less carbon dioxide?
How do biofuels reduce green house gas emissions?
• Bi f l ll f il f l l b di id t th• Biomass fuels as well as fossil fuels release carbon dioxide to the atmosphere when burnt.
• Fossil fuels produce CO2 from carbon which was stored in the earth l illi fover several millions of years
• if the biomass is produced sustainably, the growing trees and other plants remove carbon dioxide from the atmosphere during h t th i d t th b i l t t tphotosynthesis and store the carbon in plant structures.
• When the biomass is burned, the carbon released back to the atmosphere will be recycled into the next generation of growing lplants.
• When biomass is used as fuel instead of fossil fuel, the carbon contained in the fossil fuels remain in ground instead of being released to the atmosphere.
• Fast‐growing trees can recycle carbon rapidly and will displace fossil‐fuel use with every cycle.
Can CO2 growth rate be arrested by afforestation alone?
h h d d i• Forests that are not harvested does not continue to accumulate carbon indefinitely.
• In mature forests photosynthesis nearly balances the carbon that is released to the atmosphere by respiration, oxidation of dead organic matter, and fires and pests.
• If fossil fuels are to be used continuously, then ever expanding afforestation would be needed to prevent increasing levels of carbon dioxide in the atmosphere.

What is biomass?What is biomass?
i i id f l i l• Biomass is any residue from plant or animal matter.
• Sources– Agricultural residues– Energy plantation– Biofuels– Wastes from Argo industries– Domestic and urban wastes
• Many of these will generate CO2 and other green house gases even if left unutilized.g

Types of biomassTypes of biomass
Biomass Components– SugarsOils– Oils
– Starch– CelluloseCellulose– Hemi‐cellulose– Ligninf b l ll l hLeafy biomass – Mostly cellulosic + some starch +
some ligninWoody biomass 50 % cellulose + 25 % hemiWoody biomass – 50 % cellulose + 25 % hemi‐cellulose + 25 % lignin
Seeds – Starch and/or oilsSeeds Starch and/or oils

Sources of biomassSources of biomass
• Kitchen wastes – fruits/vegetables/some starchy stuff • Market wastes – similar to the above ‐ Contain large
amount of sugars/starchamount of sugars/starch.• Sewage – contains starch/more complex biodegradable
matter b lid i bi d d bl• Urban solid wastes – contains some biodegradable
matter and a larger amount of matter that can be converted only by thermo chemical means (lignaceous, l ti t )plastics, etc)
• Agricultural wastes – contains a large amount of matter that can be converted by thermo‐chemical ymeans
• Plantation residues – same as above• Energy plantation/ wild growth• Energy plantation/ wild growth

Energy plantationEnergy plantation
F t i t l b idl d ill• Fast‐growing trees can recycle carbon rapidly and will displace fossil‐fuel use with every cycle.
• There plantations, either managed or not managed, p , g g ,existing in India.
• Eucalyptus and casuarinas plantations for fuel wood and paper and pulp industries are examples of managedpaper and pulp industries are examples of managed plantations.
• Prosopis Juliflora is being utilized as biomass fuel in several p gparts of the country — an example of utilization of wild growth.
• Bamboo under intensive cultivation can generate biomass• Bamboo, under intensive cultivation, can generate biomass at a rate of more then 100 ton/ha/yr (Growmore Biotech, Hosur, Tamil Nadu)

Availability of Bioamass in IndiaAvailability of Bioamass in India
i l l id• Agricultural residues– Total Area: 143 M ha– Crop production: 500 M T/ yr– Residue generation: > 500 MT/ yrg / y– Surplus residues: 150 MT /yr– Power potential: 20000 MWPower potential: 20000 MW
• Other residuesF t id– Forest residues
– Waste land

National National Biomass Resource Atlas of IndiaBiomass Resource Atlas of India
A l t i tl f I di f bi t bl• An electronic atlas of India for excess biomass to enable obtain local power potential
• Partners:• Partners:
– Ministry of Agriculture (MoA, GOI) – their data base– RRSSC (Regional Remote Sensing Centers of ISRO)RRSSC (Regional Remote Sensing Centers of ISRO)– Consultants and Apex Institutions appointed by MNRE, GOI– Other institutions like Coir Board, Agricultural Universities, etc
•IISc National Focal Point for acquiring assessing and processing•IISc – National Focal Point for acquiring, assessing and processing the data from various sources into digital maps on a GIS format to be used by industrialists, planners and others

l k d
Remote SensingData
Taluka andDistrict Level
Surveys
MOA, OtherGov. Sources
(ISRO-RRSSC)Project Partners
The Scheme The Scheme of the Workof the Work
StatisticalDatabase
NFP,CGPL, IISc
Discussion,
Census, OtherBoards &Ageences
GIS B d
InteractiveMeetings with AIs,
Consultants
g
GIS BasedInteractive
Package
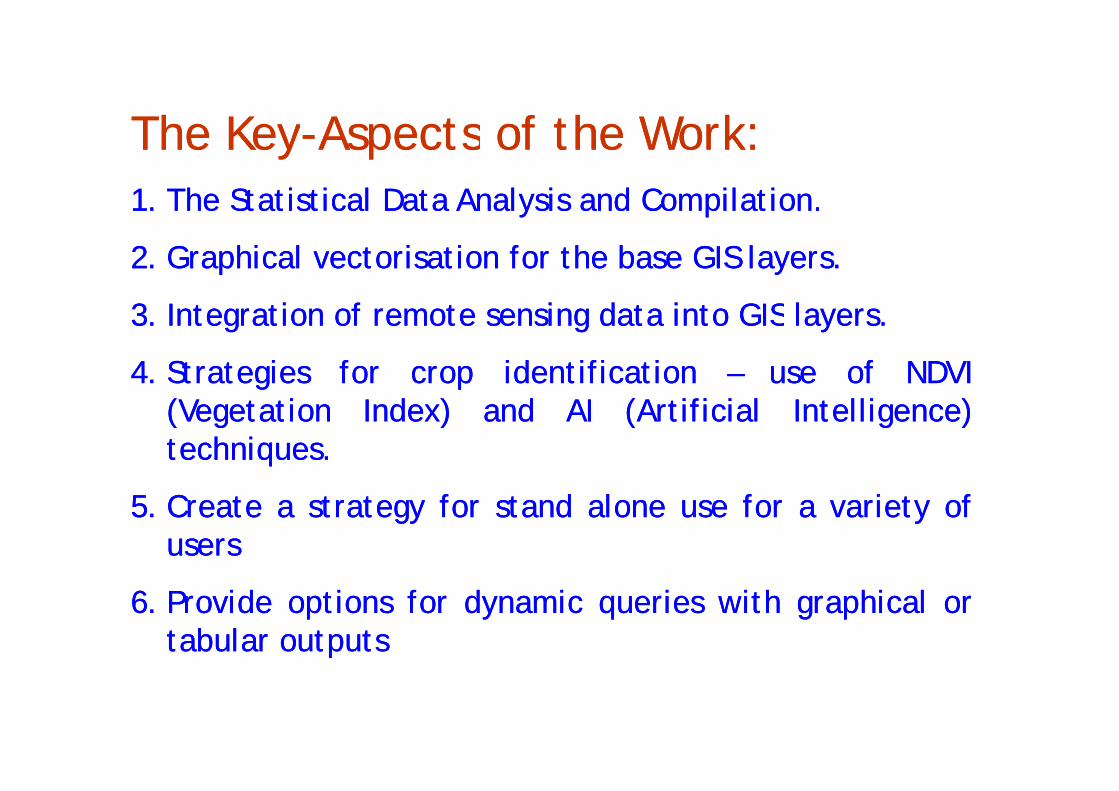
TheThe KeyKey AspectsAspects ofof thethe WorkWork::TheThe KeyKey--AspectsAspects ofof thethe WorkWork::1.1. TheThe StatisticalStatistical DataData AnalysisAnalysis andand CompilationCompilation..yy pp
2.2. GraphicalGraphical vectorisationvectorisation forfor thethe basebase GISGIS layerslayers..
33 I t tiI t ti ff tt ii d td t i ti t GISGIS ll3.3. IntegrationIntegration ofof remoteremote sensingsensing datadata intointo GISGIS layerslayers..
4.4. StrategiesStrategies forfor cropcrop identificationidentification –– useuse ofof NDVINDVI(Vegetation(Vegetation Index)Index) andand AIAI (Artificial(Artificial Intelligence)Intelligence)techniquestechniques..
5.5. CreateCreate aa strategystrategy forfor standstand alonealone useuse forfor aa varietyvariety ofofusersusers
6.6. ProvideProvide optionsoptions forfor dynamicdynamic queriesqueries withwith graphicalgraphical orortabulartabular outputsoutputs

The Main Features of the PackageThe Main Features of the Packagegg•• StatisticalStatistical DataData onon crops,crops, residuesresidues andand estimateestimate ofof surplussurplus
residuesresidues takingtaking accountaccount ofof thethe sociallysocially essentialessential usageusage areareembeddedembedded asas dynamicdynamic datadata..
•• AboutAbout 4040 cropscrops allall overover thethe country,country, severalseveral ofof themthem havinghavingpp y,y, ggmultiplemultiple residuesresidues areare accountedaccounted forfor..
•• InIn aa quickquick summary,summary, 540540 millionmillion tons/yeartons/year ofof residueresidueInIn aa quickquick summary,summary, 540540 millionmillion tons/yeartons/year ofof residueresidueleadingleading toto anan excessexcess ofof 120120 toto 140140 millionmillion tons/yeartons/year withwithpowerpower potentialpotential ofof 1515,,000000±±10001000 MWeMWe isis estimatedestimated havinghaving aascopescope ofof distributeddistributed generationgeneration inin 11––66 MWeMWe rangerange..
•• UsersUsers cancan obtainobtain thethe datadata fromfrom thethe Atlas,Atlas, thethe naturenature ofof,,crops,crops, residues,residues, powerpower potentialpotential ofof eacheach districtdistrict overover thethecountrycountry andand alsoalso thethe estimateestimate forfor thethe talukastalukas..
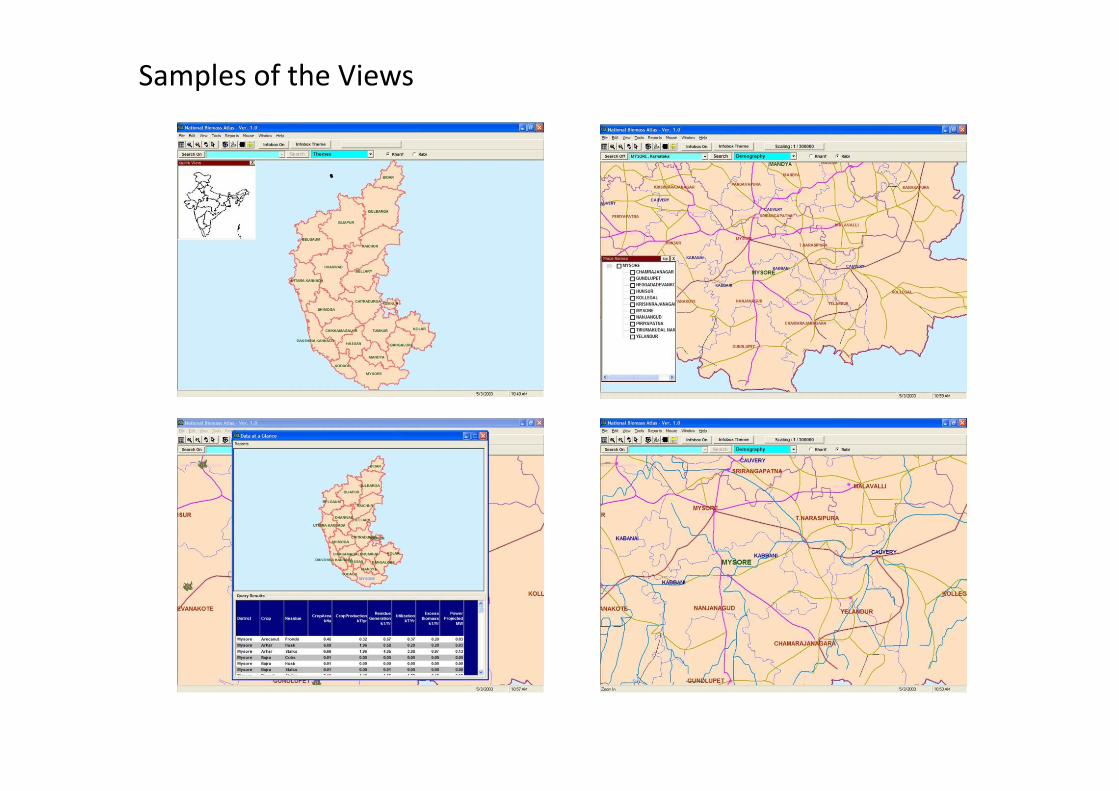
Samples of the Views


Main Achievements of the ProjectMain Achievements of the ProjectMain Achievements of the ProjectMain Achievements of the Project
• A method of seamless integration of the data from all essential sources to generate a single electronic document toessential sources to generate a single electronic document to be used as biomass resource atlas is developed and demonstrated.
• Methods for Crop Identification from land‐use data and remote sensing data for deriving coefficients from survey data and obtaining assessment of biomass resource spatially areand obtaining assessment of biomass resource spatially are developed and used.
• The atlas available at http://lab.cgpl.iisc.ernet.in/Atlas/• Also at MNRE web site

Biomass conversion technologiesBiomass conversion technologies
• Efficient utilization of biomass for energy
• Conversion of biomass to suitable forms ofConversion of biomass to suitable forms of fuel
Di C b i h l• Direct Combustion to generate thermal energy
• Advanced energy conversion devicesgy

Technology Routes for Biomass ConversionTechnology Routes for Biomass Conversion
Biomass characteristics are relevant for conversionBiomass characteristics are relevant for conversion• Biomethanation – Biogas• Gasification Producer gas• Gasification ‐ Producer gas• Direct combustion• Liquid Fuels – Non edible oil from trees• Liquid Fuels – Non‐edible oil from trees
Alcohols from sugarcane and biomassPyrolitic oil through fast pyrolisisPyrolitic oil through fast pyrolisis.Liquid fuels through FT synthesis from PG
• Reciprocating engines and gas turbines with• Reciprocating engines and gas turbines with liquid fuels, biogas and producer gas

BiomethanationBiomethanation
•Sugars + starch easily digested by bacteria (without orwith air)with air)
• Vegetable and leafy wastes digested by bacteriaeven though not so completely or easily (timerequirement) again, without or with air.
•Woody wastes difficult to be digested by bacteria• Lignin requires fungi for digestionLignin requires fungi for digestion

Biomethanation route is well known for cattle dung and both Chinaand India have vary large number of plants for domestic anda d d a a e a y a ge u be o p a ts o do est c a dcommunity applications, The design is simple - a feed system anda extraction system – hydraulic residence time of 30 to 40 days atambient temperature. This functions well at tropical conditions withliquid temperatures 25 to 35 Cliquid temperatures ~ 25 to 35 C.
Biomethanation plants for liquid residues, such as sewage and agro-industrial effluents are well established
At lower temperatures, performance goes down.High rate Biomethanation techniques (35 and 55 C operations) canimprove the performance These have not been attempted withimprove the performance. These have not been attempted withbovine dung since the market cannot sustain the capital investmentcosts.
In the above cases the solids content is about 10 %.
Other processes with lower content of water is also available.

• 1 kg of solids with 4 to 9 times the water will produceabout 50 to 120 g (30 to 70 liters) of gas.
• The composition of the gas is: 50 to 55 % Methane, ~ 1000to 5000 ppm Hydrogen sulfide and the remaining amount~ 47 % carbondioxide47 % carbondioxide
• For distillery effluents one uses anaerobic digestiontechnique to reduce the BOD/COD of the effluent. Theseq /plants use generally high rate biomethanation processes.
• The composition of the gas is 60 to 65 % Methane, 2 to 5% H d lfid d i i 33 % CO% Hydrogen sulfide and remaining ~ 33 % CO2.
• The gas has a calorific value of 18 to 22MJ/m3.• A number of institutions are involved in research in this• A number of institutions are involved in research in this
area (eg. Agharkar Research Institute, IISc

Liquid Fuels from biomassLiquid Fuels from biomass
N dibl il f t• Non-edible oil from trees• Alcohols from sugarcane and other biomass containing
largely cellulose/ sugarlargely cellulose/ sugar• Pyrolitic oil through thermal degradation process• A large number of trees store in their seeds, starch orA large number of trees store in their seeds, starch or
oils. Some of these are non-edible. They can be used forpower generation.Th R d il J h J j b M h S l• These are Rape seed oil, Jatropha, Jojoba, Mohua, Sal,Pongemia, Cashew, Neem, Anderouba, Soumarouba.
• Indian government in collaboration with public sector• Indian government, in collaboration with public sectorundertaking and private partners, is taking initiative inincreasing the bio-oil production.

Biomass utilization for energy(Thermal root)
Biom ass Utilisation for Energy
Thermal Power Amb. Pr. High Pr.
Boiler Steam turbine Gasifie r
R/c engine Gas turbine
Mechanical Electricity W ater pum ping
Stoves Large Gasifier Combustors
Domestic Industrial Gas Burner

Thermochemical conversion TechnologiesSolidsSolids
(Combustion)• Use combustion process on a grate/ fluidized bed• Use combustion process – on a grate/ fluidized bed –
to provide hot gases to be used to raise high pressuresteam and then extract power from steam turbine –generator route (standard)generator route (standard).
• The calorific value of dry biomass is 16 MJ/kg.• The air-to-biomass ratio at stoichiometry is about 6.The air to biomass ratio at stoichiometry is about 6.
(note for reference, the calorific value of fossil fuels isabout 42 MJ/kg and the stoichiometric air-to-fuel ratiois 15)is 15)
• Several projects have been implemented with mixedresults
L k f h i f ll ti d di t ib ti f bi– Lack of mechanism for collection and distribution of biomassresidues
• Cost of energy critically depends on the biomass price.

Cogeneration potential in IndiaCogeneration potential in India
India has several industries which has potential for cogeneration. (ref: Teri report)g ( p )
Industry Cogeneration potential (MW)
Sugar 5000Sugar 5000
Paper 600
Cotton 500
Non‐agro‐industries 1400
Sugar industry is one large potential for cogeneration.

Cogeneration in Sugar Industries in India
• Sugar industry is one of the industries having large potential for cogeneration.g p g
• The fuel for power generation is generated in‐househouse.
• The potential for power generation in sugar industries in India is about 5000 MW
• The achieved potential is about 1000 MW• The achieved potential is about 1000 MW

Gasification
• For power levels less than 2 MWe, the cost can be cut down byi ifi ti t h l i d i th i i tiusing gasification technologies and using the gas in reciprocating
engines.• Gasification of solid biomass occurs because of thermo-chemical
reactions at sub-stoichiometric conditions.• Gas composition: CO = 20 %, H2 = 18 %,CH4 = 2 %, CO2 = 12 %,
H2O = 2 %, Rest =N22 2• This gasification process captures between 78 to 82 % of the energy
in Biomass. Every kg of dry biomass generates 2.6 m3 of gas. Thegas has a calorific value of 4.5 to 5 MJ/m3. The stoichiometric air-to-gfuel ratio is 1.3 [note: 1 kg biomass needs 6 kg of air for combustion.This is the same as the above calculation as follows: Biomassrequires 1.8 kg air for gasification. 2.8 kg of gas requires 2.8 times1.4 kg air = 3.92 kg air – thus the total air required for combustion is1.8 + 3.92 = 5.72, a value close to 6.0]

Gasification contdGasification – contd.
• When used in dual fuel mode in diesel engines,the dry biomass and diesel required are about0 9 t 1 k d 60 t 75 l kWh0.9 to 1 kg and 60 to 75 ml per kWh.
• When used in producer gas engines, the drybi i d i b t 0 8 t 1 3 k /kWhbiomass required is about 0.8 to 1.3 kg/kWh.

The Gasification ProcessThe Gasification Process
Biomass when heated looses volatiles leaving fixedBiomass when heated looses volatiles leaving fixed carbon (about 20–25 %)The volatile matter reacts with air providing energy for b h d h f
p g gybiomass heating and to raise the temperature of gases to about 1200–1400°C.The hot gases thus produced, which contains CO2 andThe hot gases thus produced, which contains CO2 and H2O react further with the fixed carbon to generate CO and H2.These are endothermic reduction reactions and bringsThese are endothermic reduction reactions and brings down the temperature to about 600–700°C.The IISc open top reactor has a second stage of id ti d ti t i i i th t i thoxidation‐reduction process to minimize the tar in the
product gases and to improve the carbon conversion.

Work at IIScWork at IISc
N l t d iNovel reactor designAir is drawn from the top and from the air nozzles –• Uniform distribution
Air (~ 50-70%)Biomass
Broader high temperature zoneEnough residence time B
A
A
Stratification (upwardpropagation of flame front)
Broader than inclosed-top.
Grate B
Air
Hot gases (700 - 800 C)o1200 - 1400 Co
• Consistent high quality gas over the turn down ratio• Varying biomass quality – can accept a variety of agro residues
The ratio of air flow rate from the nozzle to the top depends on the fuel properties – size, density; the char consumption rate, etc

Gas cleaning processGas cleaning ‐ process• Gas has to be cooled and cleaned for end use application• Gas has to be cooled and cleaned for end use application
T and P levels of 100 T and P levels of 100 ppmppm and 1000 and 1000 ppmppm respectively in the raw gas at 350 respectively in the raw gas at 350 –– 650650°°CC
– Cooling and cleaning is achieved by using a number of components– These are cyclones and cooling devices by spraying water in scrubbers– Further cleaning is achieved using chilled scrubbersFurther cleaning is achieved using chilled scrubbers
With this gas cleaning process it is possible to restrict the With this gas cleaning process it is possible to restrict the contaminants to ppb levelscontaminants to ppb levelscontaminants to ppb levelscontaminants to ppb levels
• Water is the only medium used for cooling and cleaning process Water treatment processcleaning process. Water treatment process enables reusing of water

Gasification ElementsGasification Elements
11 5544 66
22
88
33 1100
77 99 12121111
Components• The reactor
N li d l i t• Necessary cooling and cleaning system- to meet the end use requirements

Comparison of steam and gasification root for electricity generation
Steam Gasification
Elements Boiler steam turbine Gasifier IC engineElements Boiler, steam turbine Gasifier, IC engine
Technology Well established Reasonably matured
Skills required for operation
Low to medium Mediumoperation
Installation cost 4 – 4.5 crores/ MWe 5 ‐ 6 crores/ MWe
Efficiency Reasonably high at several 100 MW level, but low at lower power
High efficiency can be achieved at low power levelsbut low at lower power
levelslevels

Research on gasification processResearch on gasification process
• Single particle behaviour in various atmospheresp
• Behaviour of packed beds
G ifi d li• Gasifier modeling
• Gas cleaning processesg p
• Water treatment

Research on Gasification process –Single particle
1Reactants : (a) CO2 (b) H2O (c) air (d) O2
t ~ db 01.03 CO2
Kinetic anddiffusiondependence
2
2
CO
H O
10-1
3 m
/kg)
dependence
t ~ db 01.2 -1.3 H2O
Kinetic anddiffusiondependence
2O
air
T = 1273 K
10-2ct / (
sρ t ~ db 0
1.9 air diffusion limited
t ~ db 02 O2 diffusion limited
1 10
0
10-3
d (mm)
b 0
Conversion time for char reaction with
1. CO2 is 3-4 times that of H2O
2. H2O is comparable to air at dp > 8mm

Basic Research – packed bedBasic Research packed bed
With increase in mass flux the front velocity initially increases and then reduces‐ This fixes the turn down ratio of the gasification system‐ Superficial mass flux and ash properties are used as design parameters
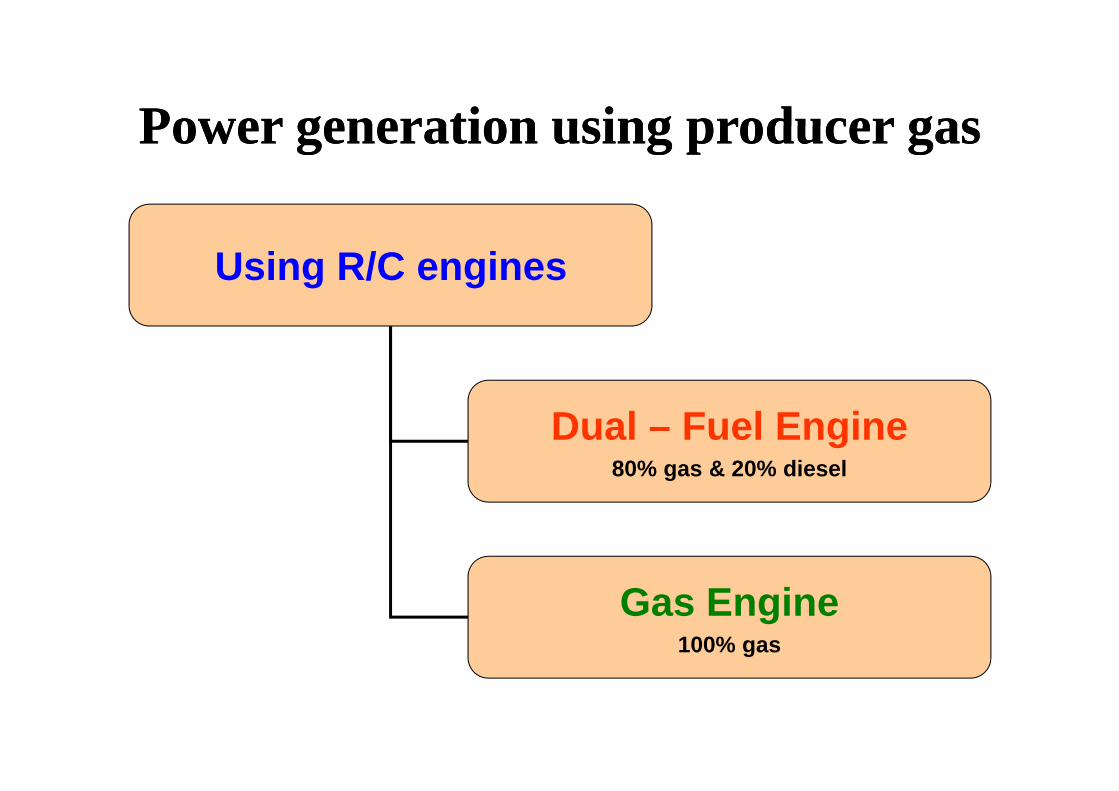
Power generation using producer gasPower generation using producer gasPower generation using producer gasPower generation using producer gas
Using R/C engines
Dual – Fuel Engine80% gas & 20% diesel
Gas Engine100% gas

Research on EnginesResearch on Engines
•• Basic Research Basic Research –– Experimental & ModelingExperimental & Modeling•• Development of gas carburetion systemDevelopment of gas carburetion systemp g yp g y•• Reliability tests Reliability tests -- Long duration trails Long duration trails •• Collaborative work with Cummins IndiaCollaborative work with Cummins India•• Collaborative work with Cummins IndiaCollaborative work with Cummins India
–– Adaptation of Natural gas enginesAdaptation of Natural gas engines–– Laboratory trails & Field monitoringLaboratory trails & Field monitoring
•• Collaborative work with engine manufacturersCollaborative work with engine manufacturers

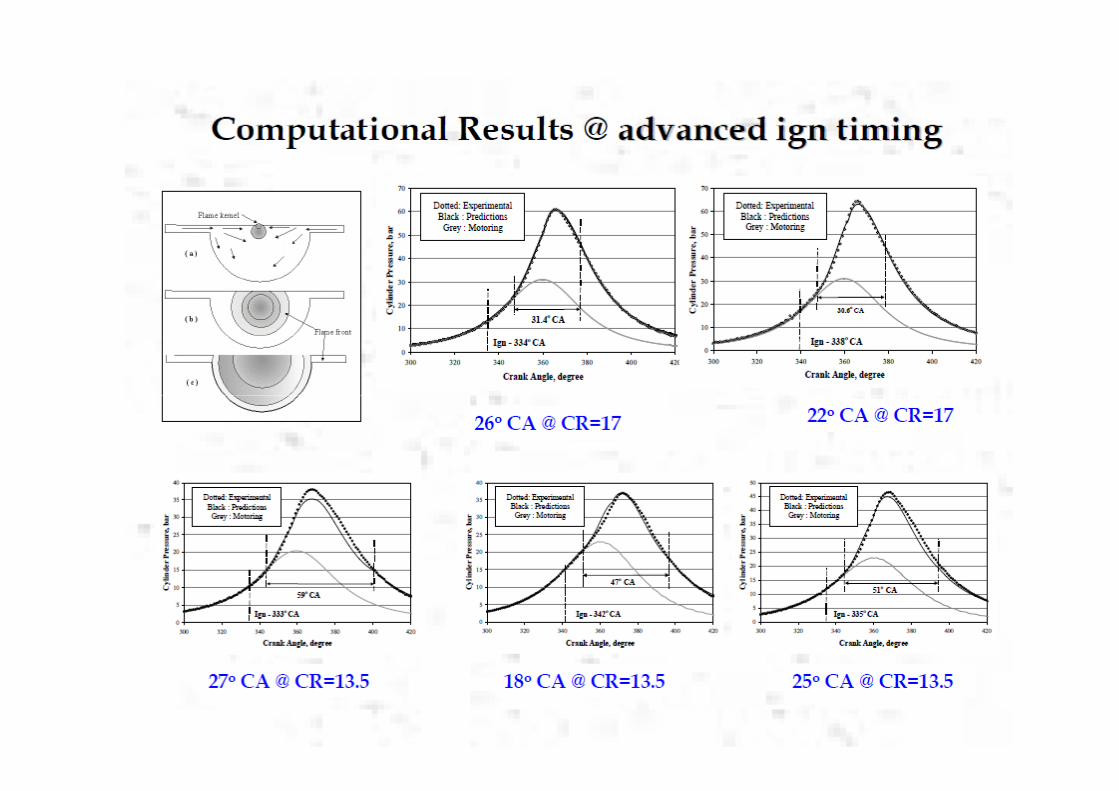
How is PG different from NG in engine?
Th i t f l ti f PG i 1 3 1 h f• The air-to-fuel ratio of PG is 1.3:1, whereas for NG it is 17:1 – this calls for a different carburetor
• PG has higher octane rating therefore can be sed• PG has higher octane rating, therefore can be used in engines with higher Compression ratio
• The flame speed of PG is higher 20%; calls for• The flame speed of PG is higher ~ 20%; calls for a different ignition timing setting
• The energy density of PG is lower ~ 20% this• The energy density of PG is lower ~ 20%, this causes de-rating of the engine power
• The flame temperature is lower by about 300 KThe flame temperature is lower by about 300 K, implies different operating condition in the engine cylinder and turbochargery g

Analysis of Producer Gas EngineAnalysis of Producer Gas Enginey gy gReasons for
de-rating with PG
Energy density Sub-optimal –R t t P d t
Properties of Gaseous Fuel
gy yPG < NG
by 20 - 23%
pTurbocharger Reactant:Product
< 12%
pΦ, Limit SL (Limit),
cm/s Fuel + Air
Fuel LCV, MJ/kg
Air/Fuel @ (Φ =1)
Mixture, MJ/kg
Lean Rich Lean Rich
SL Φ =1, cm/s
Peak Flame
Temp, K
Product/ Reactant
Mole Ratio H2
121
34 4
3 41
0 01
7 17
65
75
270
2400
0 67 H2 121 34.4 3.41 0.01 7.17 65 75 270 2400 0.67
CO
10.2
2.46
2.92
0.34
6.80
12
23
45
2400
0.67
CH4
50.2
17.2
2.76
0.54
1.69
2.5
14
35
2210
1.00
C3H8 46.5 15.6 2.80 0.52 2.26 - - 44 2250 1.17 C4H10
45.5
15.4
2.77
0.59
2.63
-
-
44
2250
1.20
PG
5.00
1.35
2.12
0.47
1.60
b
10.3
12
50
1800
d
0.87
a b c d
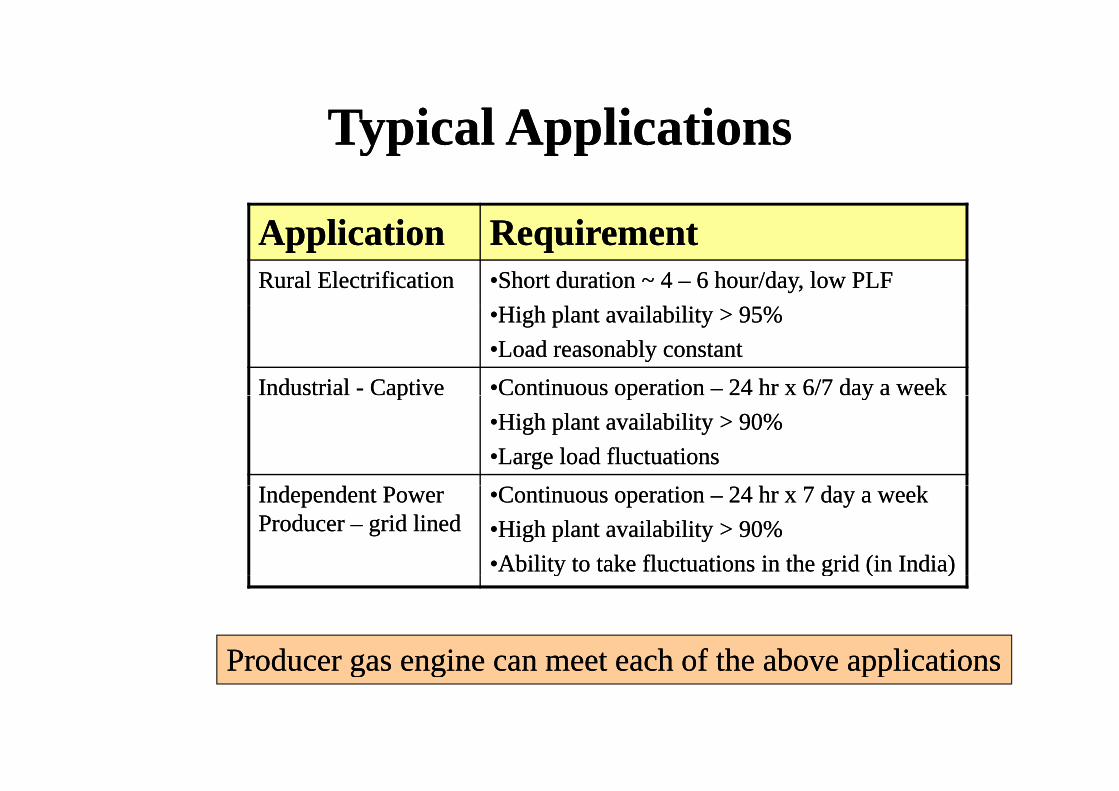
Typical ApplicationsTypical ApplicationsTypical ApplicationsTypical Applications
ApplicationApplication RequirementRequirementRural ElectrificationRural Electrification ••Short duration ~ 4 Short duration ~ 4 –– 6 hour/day, low PLF6 hour/day, low PLF
i h l il bilii h l il bili••High plant availability > 95%High plant availability > 95%••Load reasonably constant Load reasonably constant
Industrial Industrial -- CaptiveCaptive ••Continuous operation Continuous operation –– 24 hr x 6/7 day a week24 hr x 6/7 day a weekpp pp yy••High plant availability > 90%High plant availability > 90%••Large load fluctuations Large load fluctuations
Independent Power Independent Power Producer Producer –– grid linedgrid lined
••Continuous operation Continuous operation –– 24 hr x 7 day a week24 hr x 7 day a week••High plant availability > 90%High plant availability > 90%••Ability to take fluctuations in the grid (in India) Ability to take fluctuations in the grid (in India) y g ( )y g ( )
Producer gas engine can meet each of the above applicationsProducer gas engine can meet each of the above applicationsProducer gas engine can meet each of the above applicationsProducer gas engine can meet each of the above applications
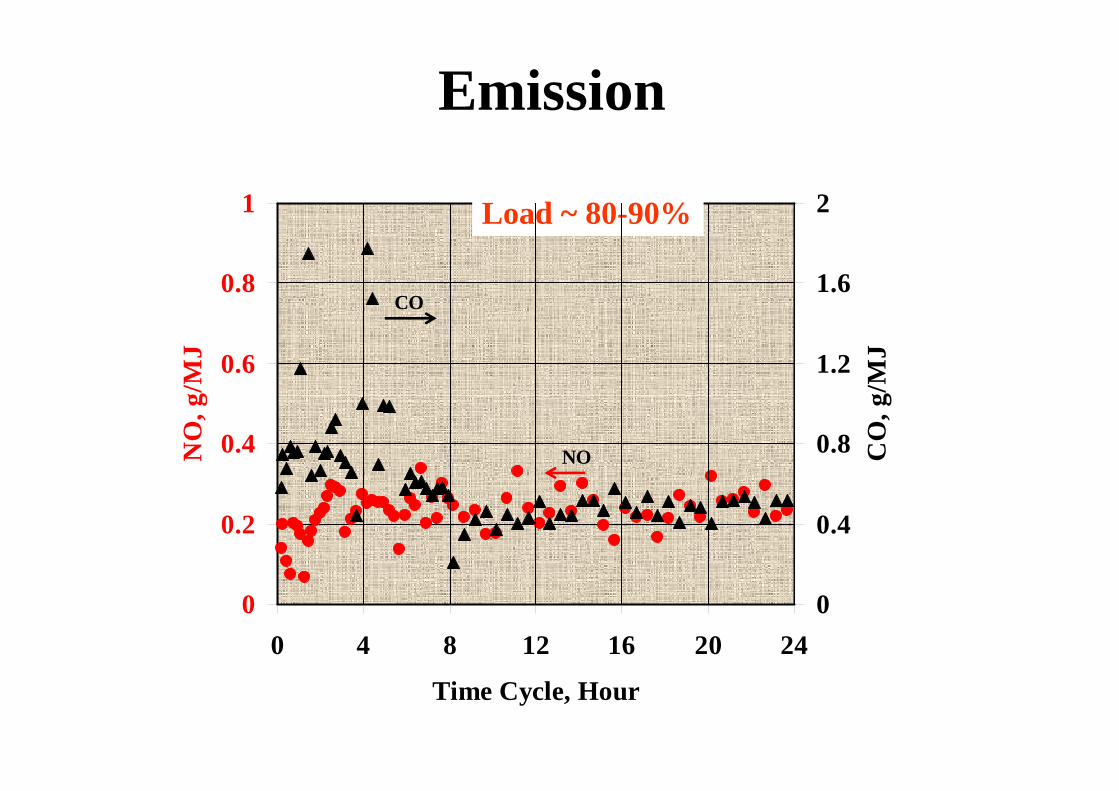
Emission
1 2Load ~ 80-90%
0.8 1.6CO
Load ~ 80-90%
0.6
g/M
J 1.2
g/M
J
CO
0.4NO
, g
0.8 CO
, g
NO
0.2 0.4
00 4 8 12 16 20 24
0
Time Cycle, Hour

Engine modelingEngine modeling


Some Case StudiesSome Case Studies
• Gasification technology is commercially deployed in India with mixed performance in the field
• A few manufacturers in India provides gasifiersfor industrial usefor industrial use
• While it has been proved in the field on i l ti ti l till t bcommercial operations, optimal use still to be
achieved
• Biomass collection and distribution still to be developedp

Grid connected 100 kWe biomass gasification power plant in Karnataka0 8 f ifi i l d• 0.8 MWe of gasification power plant connected to the grid in Karnataka as a part of Biomass E f R l I di dEnergy for Rural India a program under GoK/UNDP/MNRE
• The project is being implemented in five village clusters with a total of 26 villages in the state of K k I diKarnataka, India
• The project had six gasifier based power plants composed of two 100 kWe and one 200 kWe in different villages

Performance detailsPerformance details

Beach Mineral Corporation –Tamil Nadu 1.5 MW

PerformancePerformance
• In the last 12 months the system has operated for 14500 hours (~ 7250 each) of operation
b ll f lgenerating about 4.0 million units of electricity using about 5500 tons of biomass.

Heat treatment Tahafet HosurHeat treatment –Tahafet, Hosur
• Eight furnaces and temperatures vary from 600 C to 1000 C
• Each furnace is fitted with two burners having air to fuel ratio control and also a PIDair to fuel ratio control and also a PID controller to oversee the operations. The
h h f f bindustry operates on three shifts for about 6 days in a week
• Typical LDO consumption per day = 1500‐2000

Heat treatment contdHeat treatment .. contd
300 k /h it i t ll d• 300‐kg/hr capacity installed• All the eight furnaces are connected to the gasifierconnected to the gasifierusing WESMAN make dual‐fuel burner. The temperatures i th i di id l fin the individual furnaces are maintained independently.
• With 8 furnaces connectedWith 8 furnaces connected presently to gasifier saving is about 2000 litres/day.
• Average fuel consumed per day 5.2 ton of coconut shells, woodchipswoodchips
• Total operating hours ~35000

5 MW th for heat application5 MW th for heat application

Performance using briquetted fuelsPerformance using briquetted fuels
• Agro residue briquettes tested at 20 % ash– Same gasification system can handle 1 to 20 % ashg y
– Gas quality acceptable for engine
SFC consumption similar on ash free basis– SFC consumption similar on ash free basis
• Fuel quality requirement– Thermal stability of the briquette important
– Density and binding an important propertyDensity and binding an important property
Future Directions and possible areas of cooperation
l ll f i d ffi i• Fuel cells for increased efficiency– High temperature fuel cells operating directly on
dproducer gas.
• Liquid fuel generation (FT process) for generation i f ltransportation fuels.
– Work in progress at IISc and IIT Guahati
• Hydrogen from biomass– Generation of hydrogen rich syngas and hydrogen separation.
– Work in progress at IISc