ENERGY-EFFICIENT ELECTRIC LIGHTING FOR...
48
Helsinki University of Technology Department of Electronics, Lighting Unit Espoo 2009 Report 52 ENERGY-EFFICIENT ELECTRIC LIGHTING FOR BUILDINGS IN DEVELOPED AND DEVELOPING COUNTRIES Pramod Bhusal Dissertation for the degree of Doctor of Science in Technology to be presented with due permission of the Faculty of Electronics, Communications and Automation for public examination and debate in Auditorium S4 at Helsinki University of Technology (Espoo, Finland) on the 16 th of January, 2009, at 12 noon. Helsinki University of Technology Faculty of Electronics, Communications and Automation Department of Electronics, Lighting Unit
Transcript of ENERGY-EFFICIENT ELECTRIC LIGHTING FOR...

Helsinki University of Technology
Department of Electronics, Lighting Unit
Espoo 2009 Report 52
ENERGY-EFFICIENT ELECTRIC LIGHTING FOR BUILDINGS IN DEVELOPED AND DEVELOPING COUNTRIES Pramod Bhusal Dissertation for the degree of Doctor of Science in Technology to be presented with due permission of the Faculty of Electronics, Communications and Automation for public examination and debate in Auditorium S4 at Helsinki University of Technology (Espoo, Finland) on the 16th of January, 2009, at 12 noon.
Helsinki University of Technology
Faculty of Electronics, Communications and Automation
Department of Electronics, Lighting Unit

2
Helsinki University of Technology Faculty of Electronics, Communications and Automation Department of Electronics, Lighting Unit P.O. Box 3340 FIN-02015 TKK http://www.ele.tkk.fi http://www.lightinglab.fi Tel. +358 9 4514971 Fax +358 9 4514982 E-mail: [email protected] © Pramod Bhusal and Helsinki University of Technology
ISBN 978-951-22-9637-8
ISBN 978-951-22-9638-5 (pdf) ISSN 1797-4178 ISSN 1797-4186 (pdf) Multiprint Oy Espoo 2009

3
AB
ABSTRACT OF DOCTORAL DISSERTATION HELSINKI UNIVERSITY OF TECHNOLOGY P.O. BOX 1000, FI-02015 TKK http://www.tkk.fi
Author: Pramod Bhusal
Name of the dissertation
Energy-Efficient Electric Lighting for Buildings in Developed and Developing Countries
Manuscript submitted 15.08.2008 Manuscript revised 17.10.2008
Date of the defence 16.01.2009
Monograph Article dissertation (summary + original articles)
Faculty: Electronics, Communications and Automation
Department: Electronics
Field of research: Illuminating Engineering
Opponent(s): Prof. Dave Irvine-Halliday
Supervisor: Prof. Liisa Halonen
Instructor: Dr. Eino Tetri
Abstract As energy is a fundamental service for human development and economic growth, the demand for it is constantly on the rise worldwide. Lighting energy use makes a significant contribution to the total energy consumption of buildings. The use of energy efficiency measures can reduce this kind of energy consumption. The main objectives of this work were to review different aspects of lighting quality and energy efficiency and to test the existing technologies for efficient lighting. An additional aim of the work was to examine the new opportunities provided by LED technology in providing lighting in rural areas of developing countries and to compare LED lighting with existing fuel-based lighting. Three different lighting control systems in office rooms were compared for energy efficiency and the quality of lighting by means of measurements. The results of the measurements showed a significant potential for saving energy by the use of daylight-based dimming and occupancy control. The renovation of an auditorium with a new lighting installation resulted in higher illuminance levels and better colour rendering, while reducing energy consumption. This work also presents a calculation of lighting energy use in office rooms using two different calculation methods and discusses the different parameters used for the calculation. A comparison of the calculated values with the measured values confirmed the accuracy of the calculation methods. The work presents a study and evaluation of traditional pine stick lighting and new white LED-based lighting used in rural Nepali villages. The use of different renewable energy sources in combination with efficient lighting technology is found to be a realistic and sustainable option to provide clean and efficient lighting services in developing countries.
Keywords Lighting efficiency, office lighting, solid state lighting, fuel based lighting, renewable energy
ISBN (printed) 978-951-22-9637-8 ISSN (printed) 1797-4178
ISBN (pdf) 978-951-22-9638-5 ISSN (pdf) 1797-4186
Language English Number of pages 48 p. + app. 80 p.
Publisher Department of Electronics, Helsinki University of Technology
Print distribution Department of Electronics, Helsinki University of Technology
The dissertation can be read at http://lib.tkk.fi/Diss/2009/isbn9789512296385

4
PrefacePrefacePrefacePreface I would like to acknowledge and thank several people and organisations who supported me during this research. This work would not have been possible without their help and generous support. This work has been carried out at the Lighting Unit in Helsinki University of Technology. Part of the work was carried out in the international project IEA Annex 45, funded by the Finnish Funding Agency for Technology and Innovation (Tekes), Helvar Oy, Senate Properties and Philips Oy Luminaries. Another part of the work was achieved in the ENLIGHTEN project funded by the European Commission’s Asia-Link Programme. The work was also partly carried out in the national project Aktiivivalo funded by Senate Properties, Helvar Oy, Philips Oy Luminaires and Tekes. The Academy of Finland has also funded the work through a national project DAMEX. I would like to thank all these institutions for their support. I would like to gratefully acknowledge the enthusiastic and inspirational supervision of Professor Liisa Halonen during this work. I would also like to express my gratitude to my instructor Dr. Eino Tetri for good advice, support, and guidance. The critical comments of Dr. Marjukka Eloholma during the revision of papers and final draft of the thesis have been invaluable, for which I am extremely grateful. My special thanks to the preliminary examiners, Professor Julian Aizenberg and Professor Nils Svendenius. I thank Dr. Paulo Pinho, Martti Paakkinen and Toni Anttila for creating the amusing environment in office as well as in lunches and coffees we had together. Thanks go to all the staff members of the Lighting Unit for their assistance and company. Finally, and most importantly, I want to express my gratitude to my parents, my sister, my brother and my wife for their constant love, care and encouragement. Pramod Bhusal Espoo, October 2008

5
List of publicationsList of publicationsList of publicationsList of publications I Bhusal P., Accuracy of the lighting energy calculation method, Light &
Engineering, Vol. 14, No. 1, pp. 39-47, 2006. II Bhusal P., Tetri E., Halonen L., Quality and efficiency of office lighting,
Proceedings of the 4th European Conference on Energy Performance and Indoor Climate in Building and the 27th International Conference AIVC, Lyon, France, 2006, pp. 535-540.
III Bhusal P., Tetri E., Halonen L., Energy-Efficient and Photometric Aspects in
Renovation of Auditorium, Proceedings of the 4th European Conference on Energy Performance and Indoor Climate in Building and the 27th International Conference AIVC, Lyon, France, 2006, pp. 867-872.
IV Bhusal P., Zahnd A., Eloholma M., Halonen L., Replacing Fuel-Based Lighting
with Light-Emitting Diodes in Developing Countries: Energy and Lighting in Rural Nepali Homes, LEUKOS, The Journal of the Illuminating Engineering Society of North America, Vol. 3, No. 4, 2007, pp. 277-291.
V Bhusal P., Zahnd A., Eloholma M., Halonen L., Energy-Efficient Innovative
Lighting and Energy Supply Solutions in Developing Countries, International Review of Electrical Engineering (I.R.E.E.), Vol. 2, No 5, 2007, pp. 155-158.
VI Bhusal P., Tetri E., Halonen L., Lighting and Energy in Buildings, Report 47,
Helsinki University of Technology, Department of Electronics, Lighting Unit, 2008, 23 pp.
The author played a major role in all aspects of the work presented in this thesis. He was the responsible author of all the publications. The author was responsible for the calculation, measurements, and data analysis presented in publications [I], [II], and [III]. The author planned, carried out measurements, analysed the results, and carried out the economic analysis presented in publications [IV] and [V]. The author was the responsible author of publication [VI].

6
List ofList ofList ofList of abbreviations abbreviations abbreviations abbreviations ASHRAE American Society of Heating, Refrigeration, and Air-conditioning
Engineers’ CCT correlated colour temperature CFL compact fluorescent lamp CIBSE Chartered Institution of Building Services Engineers CIE Commission Internationale de l’Eclairage (International
Commission on Illumination) CRI colour-rendering index DALI digital addressable lighting interface EPBD Energy Performance in Building Directive EU European Union HID high intensity discharge IEA International Energy Agency IECC International Energy Conservation Code IESNA Illuminating Engineering Society of North America LCC life cycle cost LED light emitting diode LFL linear fluorescent lamp LPD lighting power density LUTW Light Up the World Foundation OECD organisation for economic co-operation and development OIDA optoelectronics industry development assiciation PC personal computer PG pedal generator PPN Pico Power Nepal PV photo voltaic RIDS-Nepal Rural Integrated Development Services - Nepal UGR unified glare rating US United States

7
List of symbolsList of symbolsList of symbolsList of symbols Am largest controlled surface area that is dimmed by one sensor in the
room Ar,r floor area of the room Af,r_art floor area of the artificial light area in the room Af,r_dlgt floor area of the daylight sector in the room fc constant illuminance factor fD daylight dependency factor fm_ar factor for the modulation control system in the artificial light area fm_dl factor for the modulation control system in the daylight area fo occupancy dependency factor fsw factor for the switching control system kWh/m2 annual lighting energy intensity [kWh/m2] Td number of daytime operating hours per year Tn number of night time operating hours per year tD operating hours during daylight time per year tem operating hours during which the emergency lighting batteries are
being charged tN operating hours during non-daylight time per year ty time taken for one standard year to pass Plgt_r calculation value for power for lighting in the room Pctr_on power of control equipment during the operating hours Pctr_out power of control equipment outside the operating hours Pem total installed charging power of the emergency lighting luminaries
in the room Ppc total installed parasitic power of the controls in the room Pn total installed lighting power in the room W/m2 lighting power density [W/m2] W_ar annual electricity consumption in the artificial light area of the
room W_dl annual electricity consumption in the daylight area of the room W_ctr annual electricity consumption of the control system and sensors WEN 15193 calculated annual lighting energy consumption per square metre
of the room based on European standard calculation method Winst installed power for lighting per square metre of room Wlgt-r/m2 calculated annual lighting energy consumption per square metre
of the room based on Belgian calculation method Wmes measured value of annual lighting energy consumption per square
metre of the room W_p,t estimate of the parasitic energy for lighting control

8
ContentsContentsContentsContents
Abstract.............................................................................................................................3
Preface..............................................................................................................................4
List of publications ..........................................................................................................5
List of abbreviations.........................................................................................................6
List of symbols..................................................................................................................7
Contents ...........................................................................................................................8
1 Introduction..........................................................................................................10 1.1 Background....................................................................................................... 10 1.2 Objectives of the work ...................................................................................... 11
2 State of the art .......................................................................................................12 2.1 Electric lighting in buildings ........................................................................... 12 2.2 Fuel-based lighting ........................................................................................... 16
3 Improvement in lighting quality and energy savings using modern technology .17 3.1 Office lighting quality ...................................................................................... 17 3.2 Energy-efficient lighting................................................................................... 18 3.3 Renovation of auditorium ................................................................................ 19
3.3.1 Introduction........................................................................................ 19 3.3.2 Measurements .................................................................................... 20 3.3.3 Results................................................................................................. 20
3.4 Efficient lighting in offices............................................................................... 21 3.4.1 Measurements in the office rooms..................................................... 21 3.4.2 Results................................................................................................. 23
3.5 Accuracy of the lighting energy calculation method....................................... 24 3.5.1 EU directive on energy performance of buildings............................. 24 3.5.2 Lighting energy calculation procedures ............................................ 24 3.5.3 Calculation, measurement, and results ............................................. 25
3.6 Conclusions...................................................................................................... 28
4 Energy-efficient lighting in developing countries ................................................30 4.1 Defining basic lighting needs in remote villages in developing countries...... 30 4.2 Lighting in rural Nepali villages ...................................................................... 30
4.2.1 Introduction........................................................................................ 30 4.2.2 Fuel-based lighting............................................................................. 31 4.2.3 Solid state lighting.............................................................................. 32 4.2.4 Measurements and results .................................................................. 33 4.2.5 Technical and economic aspects of solar-powered LED lighting..... 35
4.3 Energy supply solutions in developing countries ............................................ 37 4.3.1 Renewable energy systems ................................................................. 37 4.3.2 Life cycle cost analysis........................................................................ 39
4.4 Conclusions...................................................................................................... 40

9
5 Discussion and conclusions ..................................................................................42
References.......................................................................................................................44

10
1111 Introduction Introduction Introduction Introduction
1.11.11.11.1 BackgroundBackgroundBackgroundBackground
Energy is an essential commodity in our lives. The world’s demand for energy is
constantly growing with technological and industrial development and urbanisation. A
substantial part of the future growth in energy demand will be in developing countries, for
the improvement of people’s living standards. The total global primary energy
consumption in 2004 was 446.442 quadrillion (1015) British thermal units (BTUs) (1 BTU
= 1055.1 joules) (EIA 2004). The increase in energy consumption between 1994 and
2004 continued at an average annual rate of 2.2%. More than half of global energy
consumption takes place in America and Europe, resulting in a very uneven distribution
of worldwide energy consumption.
The building sector, consisting of residential, commercial, and institutional buildings, is
the highest energy user among the three energy-using sectors: transportation, industry, and
buildings. In the EU, the building sector represents more than 40% of the total energy
demand (COM 2001). The global energy demand in the building sector has been
increasing at an average of 3.5% per year since 1970 (DOE 2006). The growth of energy
use in buildings is expected to continue over the long term as a result of population
growth and also of urbanisation.
Lighting is a large and rapidly growing source of energy demand. Lighting is a substantial
energy consumer, and a major component of the service costs in many buildings. The
International Energy Agency (IEA), which is the energy forum for 27 developed
countries, conducts a broad programme of energy research, data compilation, and
publications. According to an IEA study, global grid-based electric lighting consumed
about 2650 TWh of electricity in 2005, the equivalent of 19% of total global electricity
consumption (IEA 2006). Currently, more than 50% of the electricity used for lighting is
consumed in IEA member countries, but it is expected that this will change in the near
future because of an increase in the use of electricity for lighting in non-IEA countries.
The demand for electric lighting in developing countries is increasing as a result of rising
average illuminance levels, as a result of increasing household income in those countries,
and also because of the new electrification of regions with no electric lighting at the
moment.
The rapid growth of energy consumption has raised concerns about the energy security
and environmental impact of the use of energy worldwide. For example, the United States
and Europe together consume almost 40% of the world’s energy supply, although they
produce only 23% of it. Europe is dependent on imports for about half of its total energy
needs. With the current trend in energy use, the EU expects 65% of its energy needs to
be fulfilled by imports, which poses critical challenges in the sphere of energy security
(Belkin 2007).

11
The acceleration of the increase in the concentration of greenhouse gases in the
atmosphere has caused the warming of the globe by more than half a degree Celsius
during the last century and it will lead to warming of at least a half a degree more over the
next few decades (Stern 2006). Energy is the main factor in climate change, contributing
the major portion of greenhouse gas emissions (IPCC 2007). Developed nations are the
source of most greenhouse gas emissions, but this may change in the future as developing
countries drive their economic development with fossil energy.
Energy efficiency is one of the most effective solutions in solving the adverse effects and
challenges of rising energy demands. Increasing energy efficiency can bring opportunities
to limit the rate of increase of electric power consumption, to reduce the need for capital-
intensive supply investments, and to mitigate climate change. As electric lighting is one of
the major consumers of electricity in buildings, energy-efficient lighting can make a
substantial contribution to the overall energy efficiency of buildings.
There is a large range of technological options available to achieve energy savings in
electric lighting. These include the use of more efficient lamps and ballasts, luminaires
with a high light output ratio, the use of lighting control systems, and the increased use of
daylight in indoor lighting. The replacement of incandescent lamps by fluorescent lamps
in the residential sector can bring substantial energy savings. In commercial buildings,
savings can be achieved by replacing the old T8 fluorescent lamps with T5 fluorescent
lamps in combination with electronic ballast. The introduction of new innovative LED
light sources is expected to accelerate savings in the future. (Publication VI)
1.21.21.21.2 OOOObjectives of the workbjectives of the workbjectives of the workbjectives of the work
The first objective of the work was to review different aspects of lighting quality and
energy efficiency and to find out ways to improve the efficiency of electric lighting in
buildings. The second objective was to test the existing technologies for efficient lighting
and to evaluate the existing codes and standards. This was done through photometric and
electrical measurements conducted in office and classroom environments. The third
objective of the work was to examine the new opportunities provided by LED technology
in lighting in developing countries and to compare LED lighting with the existing fuel-
based lighting. This included an assessment of different renewable energy sources for
rural lighting in developing countries.

12
2222 State of the artState of the artState of the artState of the art
2.12.12.12.1 Electric lighting in buildingsElectric lighting in buildingsElectric lighting in buildingsElectric lighting in buildings
Electric lighting continues to be a major source of electricity consumption in buildings
(IEA 2006). On the basis of a compilation of estimates for 41 countries representing
approximately 63% of the world’s population, Mills (2002) estimated that national
lighting electricity use in developed countries ranges from 5% to 15% of their total
electricity use, while in developing countries the value can be as high as 86% (Tanzania).
The amount of electricity used for lighting in buildings differs according to the type of
building. In some buildings, lighting constitutes the biggest single category of electricity
use. According to Mills (2002), lighting is the main component of electricity consumption
in the service sector in IEA member countries, consuming from 39% to 61% of the total
service sector electricity use. Bertoldi and Atanasiu (2006) conducted a query for national
energy efficiency experts in EU countries and reported that the share of lighting
consumption of the total electricity consumption in residential buildings in EU member
states ranges between 6% and 18% but the share is as high as 35% in one of the newest
member states (Romania). In industrial buildings, the share of lighting electricity of the
total electricity consumption is quite low, because of the large amount of electricity
consumed in industrial processes. The worldwide consumption of lighting electricity out
of total electricity consumption in industrial buildings was 8.7% in 2005 (IEA 2006).
In the residential sector, the dominant light source is still the incandescent lamp with low
luminous efficiency. Incandescent lamps had a per household average share of 75% in
domestic lighting in IEA countries in 2005 (IEA 2006). The share of incandescent lamps
out of all lamps in domestic lighting varies from country to country. In residential
buildings in the United States, incandescent lamps constituted 86% of the 4.6 billion
lamps used and they consumed 90% of the total residential lighting electricity in 2001
(Navigant 2002). Australian/New Zealand households have a similar trend of dominance
by incandescent lamps. In Japan, the most used light source in the residential sector is the
fluorescent lamp, with a 65% share. In Russia, on the other hand, incandescent lamps
provide almost all of the residential lighting. This is not very common for the residential
lighting of other non-OECD countries, where the proportion of fluorescent lamps relative
to other lamp types is relatively high (IEA 2006). A survey of household energy use in five
major Chinese cities in 1999 (Brockett et al. 2000) reported that incandescent lighting
accounted for 56% of residential lighting electricity use; the rest was distributed between
fluorescent lamps and compact fluorescent lamps (CFLs). The average lamp luminous
efficiency is low in those countries dominated by incandescent lamps compared to the
countries where fluorescent lamps possess a larger share.
Fluorescent lamps are the most common light sources in commercial buildings (e.g.
offices, educational buildings, hospitals, libraries, shopping malls etc). Fluorescent lamps
13
are commonly used in open space facilities such as open spaces for work or shopping.
Fluorescent lamps provided 76.5% of the total lighting in OECD commercial buildings
in 2005 (IEA 2006). Similarly, fluorescent lamps were the major consumer of US
commercial lighting electricity in 2001 (Navigant 2002), accounting for 56% of lighting
energy use, while incandescent lamps consumed 32% and high intensity discharge (HID)
lamps 12%. The share of fluorescent lamps of the total lumen output was 78%, while
incandescent and HID lamps provided only 8% and 14%, respectively. European office
buildings mainly use fluorescent lamps, and linear fluorescent lamps (LFLs) are the
dominant type. However, in a comparison of existing office lighting with new installations
in three European countries (Belgium, Germany, and Spain), it is found that the existing
installations in Belgium and Spain still have sizeable numbers of other than fluorescent
lamp luminaires (Tichelen 2007). In the non-OECD commercial sector, the share of
incandescent lamps is even lower than that of the OECD commercial sector. The
estimated share of incandescent and halogen lamps in non-OECD commercial lighting
was only 4.8% in 2005 (IEA 2006).
The average luminous efficacy of light sources in industrial buildings and industrial plants
is highest among the residential, commercial, and industrial lighting sectors. The reason
is the high level of use of energy-efficient fluorescent lamps and HID lamps in industrial
lighting. According to IEA (2006), 490 TWh of electricity was consumed in 2005 to
produce 38.5 Plmh for global industrial lighting at an average light source luminous
efficacy of 79 lm/W. Similarly, the average light source luminous efficacy of the Canadian
and US industrial lighting sector was estimated to be 80.4 lm/W and that for OECD
European countries 81.9 lm/W. Fluorescent lamps account for about 62% of OECD
industrial lighting, HID lamps for 37%, and other lighting sources for 1%. The US
industrial sector has a similar trend to other OECD countries in the distribution of lamps
used for industrial lighting, with fluorescent and HID lamps accounting for 67% and 31%
respectively and only 2% of lamps being incandescent (Navigant 2002). Similarly,
Australian industrial lighting is dominated by fluorescent lamps, which account for 55%,
and the majority of the remaining 45% is accounted for by HID lamps (IEA 2006).
Outside OECD countries, Chinese industrial lighting has a similar combination of lamps
to Europe. The use of T5 fluorescent lamps in industrial lighting is higher in China than
in Europe. In Russia, HID lamps dominate in industrial lighting. In Russian industrial
buildings, only 36.5% of lighting is provided by fluorescent lamps, while 56.3% is
provided by mercury vapour HID lamps and the rest by other HID lamps and
incandescent lamps. As a result of the poor quality of the lamps used, the average
luminous efficacy of light sources in Russian industrial lighting was 61 lm/W in 2000,
which is far behind the average values in Europe and America. (IEA 2006)
The lighting energy intensity (kWh/m2) in buildings depends not only on the
characteristics of the lamps used, but also on the occupancy patterns and lighting levels
provided. Residential buildings often use the least efficient light sources but they
consume the lowest energy per square metre of area per year because of the short average

14
operating times. The lighting practices of each country and region also have a great effect
on the lighting energy intensity in buildings. For example, the average luminous efficacy
of lamps in Japanese households was the highest among OECD countries in 2005 but the
lighting electricity consumption per square metre was not among the lowest as a result of
long burning hours and high average illuminance levels (IEA 2006). Among commercial
buildings, the average electricity consumption for lighting per square metre is highest in
healthcare buildings, because of their long operating periods. Commercial buildings in
Europe have quite short operating hours, while the operating hours of North American
commercial buildings are longer than in Europe, Japan/Korea, and Oceania. The average
lighting energy intensity in commercial buildings in the United States was 60.9 kWh/m2
in 2001 and in Canada 80.2 kWh/m2 in 2003 (Navigant 2002, IEA 2006). Non-OECD
commercial buildings consume electricity for lighting with the lowest average among all
the regions, the average consumption being 24.1 kWh/m2 in 2005 (IEA 2006).
The main idea of energy-efficient lighting is to reduce the amount of electricity used
without compromising on the quality of lighting. Savings can be achieved by increasing
the efficiency of the lighting system components, and also by using the right amount of
light when it is needed and where it is needed. Technological options are available to
achieve energy savings in lighting. These options include the use of more efficient lamps,
more efficient ballasts, efficient luminaires, the use of lighting control systems, and greater
use of daylight. The introduction of new innovative LED light sources is expected to
accelerate savings in lighting. The technological potential of savings can only be
transformed into practice if the application of technology is economically viable.
In the residential sector, replacing incandescent lamps with fluorescent lamps (LFL or
CFL) has the largest potential for energy savings. This is due to the higher luminous
efficacies of fluorescent lamps compared to incandescent lamps. The metering campaign
conducted in French households before and after the replacement of the majority of
incandescent lamps with CFLs showed that the consumption of electricity for lighting
was reduced by an average of 74% (ECODROME 1998).
In office lighting, substantial electricity savings can be achieved by substituting
halophosphate fluorescent lamps with triphosphor fluorescent lamps and by using energy-
efficient ballasts with dimming control (Tichelen 2007). A 35% improvement has been
presented in the efficiency of a T5 fluorescent lamp luminaire using a mirror louvre
fixture over an equivalent T8 mirror louvre fixture while using high-frequency ballast and
a standard aluminium reflector. The corresponding improvement in efficiency shown
over a luminaire of the same type with conventional magnetic ballast was about 65%
(Govén 1997). Jennings et al. (2000) compared the energy savings and effectiveness of
various combinations of occupant detection and the integration of artificial light and
daylight in office buildings. They found that occupancy sensors, which turned the lights
off after a 15-20-minute period of no occupancy, achieved lighting energy savings of 20-

15
26% compared to manual switching. An additional saving of about 20% was achieved with
a daylight-linked lighting control system.
The lighting upgrading carried out through the European GreenLight programme in a
wide range of buildings (schools, offices, airports, supermarkets, etc.) showed cost-effective
saving potential in existing buildings (EC 2007). Substantial potential for saving energy
using the available technology has been reported in the EU SAVE project (Novem 1999).
It was found that upgrading old European office lighting systems to the current typical
lighting technology would give energy savings of between 20% and 47%, and upgrading to
the current best practice lighting would give savings from 45% to 68%, depending on the
country. In schools, the upgrading of all existing old lighting to typical current practice
systems would result in energy savings of 30% across the European Union.
Codes and legislation on energy efficiency have been introduced in different countries to
encourage the efficient use of lighting energy. The most common codes that provide the
guidelines for designing and installing lighting systems in buildings set the maximum
allowable installed lighting power density. Energy codes for commercial buildings in US
states are usually based on the American Society of Heating, Refrigeration, and Air-
Conditioning Engineers’ (ASHRAE) codes or the International Energy Conservation
Code (IECC), but California has its own code, called Title 24 (Title24 2007). ASHRAE
and the Illuminating Engineering Society of North America (IESNA) developed a
voluntary building code for lighting in commercial buildings in the United States
(ASHRAE 2004). The ASHRAE code specifies maximum lighting power density (LPD)
limits in terms of watts per square metre. For example, the maximum permissible LPD for
office buildings is 10.8 W/m2 in the ASHRAE 90.1-2004 code. Title 24 considers the
luminous efficacy of lighting systems (lm/W) in defining efficient lighting. The 2005
version of the Title 24 code for residential lighting requires the efficacy of a lighting
system to be more than 40 lm/W for lamps rated less than 15 W, more than 50 lm/W for
those of 15-40 W, and more than 60 lm/W for those higher than 40 W. United Kingdom
building codes for both domestic and commercial lighting evaluate efficiency as the
luminous efficacy of a lighting system, whereas Mexico and China have building codes
for lighting energy performance specifying the requirements in LPD limits expressed in
watts per square metre (IEA 2006).
In addition to lighting power density limits, the control of time of use and the utilisation
of daylight are important factors influencing lighting energy use. The metric that
incorporates all these elements and represents the lighting system’s performance is the
annual energy intensity, expressed in annual energy consumption per unit area (kWh/m2
per year). The International Energy Conservation Code (IECC) 2003 for commercial
buildings specifies that lighting controls are required for each area, and each area must
have dimming control and automatic lighting scheduling (DOE 2005). The most recent
versions of the ASHRAE and IECC codes, which are followed by most US states, also
include lighting control and daylight utilisation in their requirements. Four European

16
countries (Flanders-Belgium, France, Greece, and the Netherlands) used a detailed
calculation procedure for lighting dimensioning even before the adoption of the
European Union’s Energy Performance in Building Directive (EPBD), each calculation
procedure estimating the overall average energy consumption for the lighting in buildings
(ENPER-TEBUC 2003). The EPBD directs member countries to use a comprehensive
method to calculate the energy consumption of buildings and incorporate mandatory
minimum energy efficiency requirements for all building types (EC 2002).
2.22.22.22.2 FuelFuelFuelFuel----based lightingbased lightingbased lightingbased lighting
There are still more than 1.6 billion people who lack access to an electricity network and
hence have to use fuel-based lighting to fulfil their lighting needs (IEA 2002, Mills 2002).
Almost all of these people live in the developing countries, with four out of five living in
rural areas (IEA 2002).
Electricity networks in most developing countries are limited mainly to urban areas. In
the rural areas of sub-Saharan countries, only 2%-5% of the population is supplied with
electrical networks. Grid connectivity is somewhat higher in countries such as Brazil,
Bangladesh, India, Morocco, and South Africa, with 20%-30% of the rural population
having access to electrical networks (Martinot 2002). Less than 40% of urban households
in Africa are supplied with electricity (ABB 2005). The electrification rate in developing
countries has been increasing continuously. However, the number of households without
electricity is also growing because of population growth. Between 1970 and 1990, 18
million people in sub-Saharan Africa were newly supplied with electricity, but the total
population growth at the same time was 118 million (Douglas 1997). Furthermore, even
if houses are electrified, many homes have only intermittent access to power as electricity
blackouts are frequent, hence creating a need for alternative energy sources. For example,
in the Indian state of Madhya Pradesh, over 90% of electrified rural households use
kerosene as a backup fuel for lighting (IEA 2002).
Fuel-based light sources include candles, oil lamps, ordinary kerosene lamps, pressurised
kerosene lamps, biogas lamps, propane lamps, resin-soaked twigs, etc. The most widely
used fuel-based light sources in developing countries are ordinary wick-based kerosene
lamps. For example, nearly 80 million people in India alone light their houses using
kerosene as the primary lighting medium (Shailesh 2006). In addition to providing poor
lighting quality, fuel-based lighting is inefficient, expensive, and causes respiratory and
cardiac problems as a result of the smoke produced (IEA 2006). IEA (2006) estimates that
the average per capita light consumption (lumen hour/ person) of people with access to
electricity is more than 500 times higher than that of people without access to electricity.

17
3333 Improvement in lighting quality and eImprovement in lighting quality and eImprovement in lighting quality and eImprovement in lighting quality and energy savingsnergy savingsnergy savingsnergy savings using using using using
modern technologymodern technologymodern technologymodern technology
3.13.13.13.1 Office lOffice lOffice lOffice lighting qualityighting qualityighting qualityighting quality
Lighting quality has various aspects and it involves much more than just visibility. The
proposal of Veitch &Newsham (1996) defines lighting quality as the degree to which the
luminous environment supports the following requirements of the people who will use
the space:
• visual performance;
• post-visual performance (task performance and behavioural effects);
• social interaction and communication;
• mood state (happiness, alertness, satisfaction, preference);
• health and safety;
• aesthetic judgments (assessments of the appearance of the space).
According to this definition, lighting quality is not directly measurable, but it focuses on
the interaction between the lit environment and the person in that environment. Lighting
quality is dependent not only on the properties of the light but also how that light is
delivered to the space. The main lighting quality issues considered in lighting design are
glare, uniformity of luminance, colour temperature, and colour rendering. Good lighting
quality is characterised by luminance uniformity, the absence of glare, and the ability to
give a pleasant colour appearance. (Publication II)
The illuminance level in office lighting has to be sufficient to provide a comfortable and
efficient working environment. Many studies investigating the acceptability of different
illuminance levels in offices have shown a trend of increased satisfaction with higher light
levels, followed by a decrease in satisfaction at the highest light levels. Katzev (1992)
measured subject behaviour in a variety of computer-presented tasks in four different sets
of lab conditions. Most of the subjects preferred illuminance levels between 450 lx and
550 lx, showing dissatisfaction when exposed to higher light levels (1000 lx). In a meta-
analysis of several studies, Gifford, Hine, and Vietch (1997) showed that there is a
relationship between rising illuminance levels and the performance of office-type tasks. A
high illuminance level may allow better visual performance, but at the same time create
visual discomfort (Muck and Bodmann 1961). High luminances can produce discomfort
glare. The European standard (EN12464-1 2002) recommends that the CIE Unified
Glare Rating (UGR) value should be less than 19 for general offices. The same upper
value for UGR is given in the CIBSE (1997) code for interior lighting. Luminance ratios
of no more than 3:1 (i.e. task brighter than surround) for close objects and 10:1 for distant
objects in office lighting are given in the IESNA recommendation (Rea 2000). The
European standard recommends a luminance uniformity of greater than 0.7 around task
areas and greater than 0.5 for the immediate surrounding areas (EN12464-1 2002).

18
The choice of light source colour temperature, which describes the colour appearance, is
a matter of psychology, aesthetics, and of what is considered to be natural (EN12464-1
2002). In warm climates a cooler light colour appearance is generally preferred, whereas
in cold climates a warmer light colour appearance is preferred. Lamps with a higher
colour-rendering index (CRI) make people and objects appear more natural and bright.
Lower illuminances are required from lamps with good colour rendering properties to
achieve judgements of equivalent brightness (Kanaya 1979).
Through the discovery of a novel photoreceptor cell in the eye (Berson et al. 2002), it is
expected that light entering the human eye also has non-visual biological effects on the
human body. When the biological effects are taken into consideration, the rules for good
and healthy design can be different from those for conventional design. The increasing
knowledge of the non-visual effects of light may result in new design rules for good-quality
lighting. However, the present understanding of these effects is not yet sufficient.
3.23.23.23.2 EnergyEnergyEnergyEnergy----efficient lightingefficient lightingefficient lightingefficient lighting
Energy-efficient lighting involves a reduction in the amount of energy used for lighting
while keeping the lighting quality the same or even better. Energy-efficient measures for
lighting involve a reduction in the amount of electricity consumed by the lighting
equipment and providing the right amount of light where it is needed and when it is
needed. (Publication II)
Through the more efficient use of lighting energy it is possible to limit the rate of increase
of electric power consumption, reduce the economic and social costs resulting from
constructing new generating capacity, and reduce the emissions of greenhouse gases and
other pollutants. At the moment fluorescent lamps dominate in office lighting. Compared
to traditional halophosphate fluorescent lamps, tri-phosphor fluorescent lamps provide
more light using less energy, while offering improved colour rendering, and the
distribution of light is uniform for more effective illumination of the task area. The
consumption of energy is further reduced if these lamps are used with electronic ballasts.
Employee health benefits can be realised from electronic ballasts, which have less flicker
and noise, reducing the risks of time lost as a result of headaches and stress. (Publications
II, and III)
The use of occupancy sensors, manual dimming, automatic switching, and dimming
according to daylight enables energy savings to be made by minimising the unnecessary
use of artificial lighting. A study of seven different open-plan office buildings equipped
with modern lighting equipment and controls suggested that the energy savings associated
with user control are not achieved at the expense of comfort. The occupants of those
buildings with efficient lighting installations had positive perceptions of the lighting
quality (Moore et al. 2003).

19
Veitch and Newsham (1997) examined the relationship between lighting quality and
energy efficiency and found that energy-efficient lighting and good-quality lighting can be
compatible. People preferred low-energy lighting designs, even designs with lighting
power densities below energy code levels. They also found a clear pattern of evidence that
supports the adoption of energy-efficient electronic ballasts. Task performance and visual
performance were better with electronic ballasts than magnetic ballasts.
Katzev (1992) measured people’s behaviour during varied computer-presented tasks to
investigate productivity, preferences, and the affective impact of energy-efficient lighting
systems. The participants were exposed to four different sets of lighting conditions during
a normal working day, spending over an hour and a half in each set of lighting conditions.
At the end of the task in each set of lighting conditions they were asked to adjust the
lighting level to their most preferred and acceptable setting. The findings indicate that it
is possible to introduce more energy-efficient lighting systems into contemporary office
environments that will both appeal to office employees and maintain high levels of visual
performance.
3.33.33.33.3 Renovation of auditoriumRenovation of auditoriumRenovation of auditoriumRenovation of auditorium
3.3.1 Introduction
The lighting installations in the auditoria of the Department of Electrical and
Communications Engineering of Helsinki University of Technology, which were almost
40 years old, were renovated in 2006. The old lighting installations consisted of
luminaires with T12 lamps driven by electromagnetic ballasts. The nominal voltage of the
ballasts was 220 V but the nominal supply voltage nowadays is 230 V. Hence they were
working on an overvoltage, resulting in thermal losses. The dimming was performed with
voltage variation. A separate cathode heating transformer was provided to maintain full
cathode heating of the lamps at all times the circuit was on, resulting in additional power
losses.
The study was carried out in one of the auditoria where the old luminaires were replaced
with new T5 lamp luminaires with electronic ballasts. The new luminaires were Office
NOVA 240TCS 2xTL5-49W, optics D6 by Idman Philips. The dimmable electronic
ballast was Helvar 2x49si. The Digidim lighting control system uses the DALI protocol.
In addition to the “normal” lighting, additional luminaires with Philips ActiViva lamps
were installed. The lighting can thus be provided by the 4000 K lamps or by ActiViva with
17,000 K, or as a mixture of these two lamps. All the luminaires are dimmable, so the
colour temperature of the mixed lighting can vary between 4000 K and 17,000 K.
(Publication III)

20
3.3.2 Measurements
Photometric and electrical measurements were taken before and after the renovation. The
measured quantities were illuminance (lx) on the desks, luminance distribution through
the room (cd/m2) measured from the lecturer’s point of view, unified glare ratio (UGR),
power consumption, and luminaire output ratio.
Illuminances were measured with an illuminance metre “LMT Pocket Lux 2” while
luminances and UGR were measured with a luminance mapping system called Photolux.
Photolux consists of a digital camera with a fish-eye lens and software. The camera is
calibrated in luminance and the Photolux software integrates the calibration results and
produces luminance maps (Dumortier et al. 2005). The luminous flux of the lamps and
luminaires was measured in an integrating sphere. The spectral power distributions were
measured with an Ocean Optics High Resolution Spectrometer HR 4000.
3.3.3 Results
Table 1 shows the results of the photometric and electrical measurements. Illuminance
was measured in both cases (before and after renovation) when the lamps were at full
power. The luminous fluxes of the old lamps and luminaire were measured separately.
The luminaire output ratio was then calculated by dividing the flux from the luminaire by
the sum of the fluxes of the individual lamps of the luminaire. The calculated value of the
luminaire output ratio for the old luminaire was 0.39. The luminaire output ratio of the
new luminaire was 0.74, according to the manufacturer. As a result of the efficient design
and improved materials for the reflectors, the new luminaires have a much higher
luminaire output ratio (Publication III).
Table 1. Photometric and electrical values of the lighting installation measured before
and after the renovation (Publication III).
Before After
Photometric values
Illuminance (lx) 428 974
Luminaire output ratio 0.39 0.74
Average luminance (cd/m2) 45 103
UGR 14 21
Electrical values
Power (W) 10,571 7,383
The illuminance was more than doubled after the renovation and at the same time the
power consumption was reduced by 30%. The European standard (EN12464-1 2002)
recommends that the illuminance in lecture halls should be 500 lx and UGR value
should be less than 19. The preset value for the luminaires during an ordinary lecture is
that they are dimmed to 80% power level. This will increase the energy savings, but is not
considered in the power consumption of Table 1. The surface brightness of a T5 lamp is

21
higher than that of a T12 lamp. Therefore the UGR calculated from the lecturer’s point
of view is above the recommended level after the renovation. (Publication III)
The correlated colour temperature (CCT) of the old lamps was about 4000 K and the
colour rendering index (CRI) was 63. The colour rendering index of the new lamps is
CRI>80. The total power consumption of the old luminaire was 121 W at a 230 V supply
voltage and 111 W at a 220 V supply voltage. The luminous fluxes were 2142 lm and
2062 lm, respectively.
The spectral power distributions of the new installed lighting are shown in Figure 1. One
curve is with ordinary lamps with a correlated colour temperature of 4000 K, and the
other when ActiViva lamps with a colour temperature of 17,000 K are used. The colour
rendering index is CRI>80 in both cases.
0.0
0.2
0.4
0.6
0.8
1.0
400 500 600 700 800
Wavelength (nm)
Irra
dia
nce
µ
W/c
m2
4000 K 17 000 K
Figure 1. Spectral power distributions of the lighting measured on the desk in front of the
auditorium for the 4000 K and 17,000 K lamps (Publication III).
3.43.43.43.4 EfficEfficEfficEfficient lighting in officesient lighting in officesient lighting in officesient lighting in offices
3.4.1 Measurements in the office rooms
A study of lighting electricity use was carried out in the office rooms of an extension
building of the Department of Electrical and Communication Engineering at Helsinki
University of Technology. This four-storey building, occupied by the Lighting Laboratory
(later Lighting Unit), was built as a demonstration building for lighting research. The
rooms of the building are equipped with a variety of lighting control systems including
both manual systems and the newest technologies for the integration of artificial and
natural lighting.
22
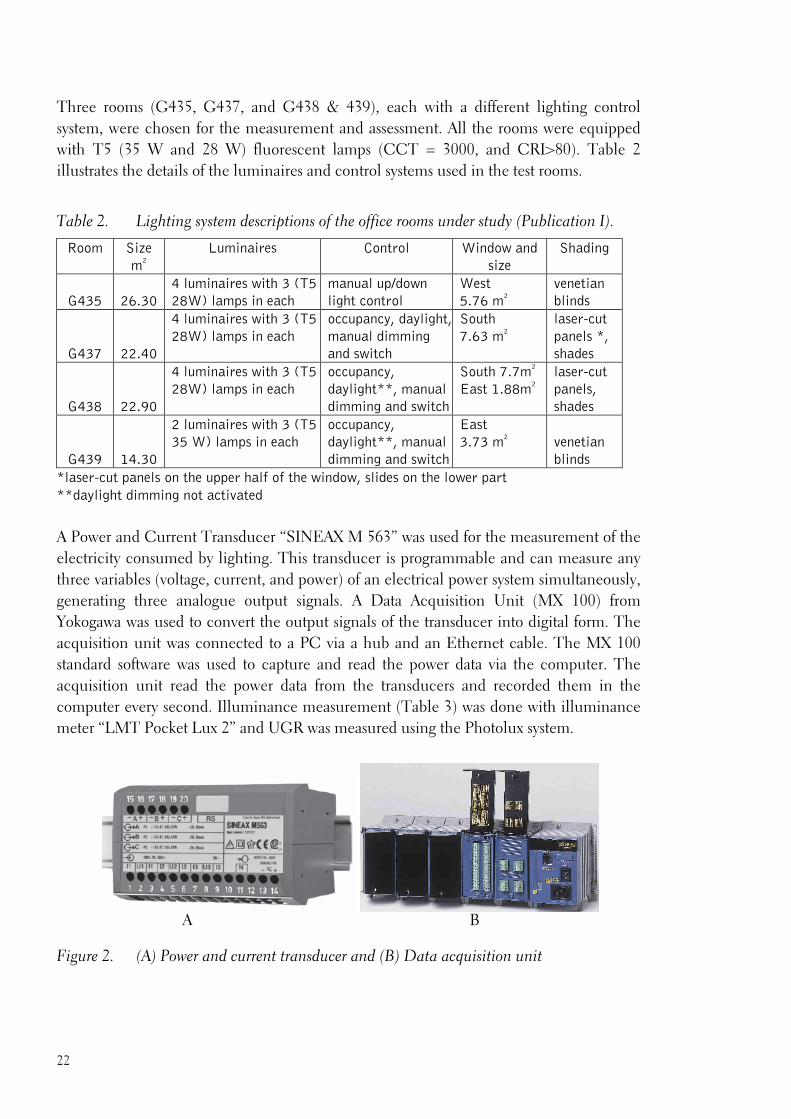
Three rooms (G435, G437, and G438 & 439), each with a different lighting control
system, were chosen for the measurement and assessment. All the rooms were equipped
with T5 (35 W and 28 W) fluorescent lamps (CCT = 3000, and CRI>80). Table 2
illustrates the details of the luminaires and control systems used in the test rooms.
Table 2. Lighting system descriptions of the office rooms under study (Publication I).
Room Size
m2
Luminaires Control Window and
size
Shading
G435 26.30
4 luminaires with 3 (T5
28W) lamps in each
manual up/down
light control
West
5.76 m2
venetian
blinds
G437 22.40
4 luminaires with 3 (T5
28W) lamps in each
occupancy, daylight,
manual dimming
and switch
South
7.63 m2
laser-cut
panels *,
shades
G438 22.90
4 luminaires with 3 (T5
28W) lamps in each
occupancy,
daylight**, manual
dimming and switch
South 7.7m2
East 1.88m2
laser-cut
panels,
shades
G439 14.30
2 luminaires with 3 (T5
35 W) lamps in each
occupancy,
daylight**, manual
dimming and switch
East
3.73 m2
venetian
blinds
*laser-cut panels on the upper half of the window, slides on the lower part
**daylight dimming not activated
A Power and Current Transducer “SINEAX M 563” was used for the measurement of the
electricity consumed by lighting. This transducer is programmable and can measure any
three variables (voltage, current, and power) of an electrical power system simultaneously,
generating three analogue output signals. A Data Acquisition Unit (MX 100) from
Yokogawa was used to convert the output signals of the transducer into digital form. The
acquisition unit was connected to a PC via a hub and an Ethernet cable. The MX 100
standard software was used to capture and read the power data via the computer. The
acquisition unit read the power data from the transducers and recorded them in the
computer every second. Illuminance measurement (Table 3) was done with illuminance
meter “LMT Pocket Lux 2” and UGR was measured using the Photolux system.
Figure 2. (A) Power and current transducer and (B) Data acquisition unit
A B

23
3.4.2 Results
Power consumption by lighting in the office rooms of the Lighting Laboratory was
measured during all four seasons of the year and the annual energy consumption was
calculated on the basis of the measured values. Figure 3 shows the measured power curve
of three different lighting systems during one day in April 2005. Room G435 uses full
installed power all the time because it has only a manual up/down lighting control system
and people do not use the manual up/down system for dimming. Rooms G438 & 439 also
use full installed power but only when the rooms are occupied. The power curve of room
G437 can change continuously because the lamps are dimmed according to the daylight.
The power curve of this room is almost at a zero level when there is no occupancy of the
room.
0
100
200
300
400
500
600
7:00 8:00 9:00 10:00 11:00 12:00 13:00 14:00 15:00 16:00 17:00
Time
Watt
s
G438&439 G435 G437
Figure 3. Power consumption curve for rooms G435, G437, and G438 & 439 (measured
on 06.04.2005) (Publication II).
The installed LPD was lowest for the room with manual control (G435); see Table 3. The
LPD of the room where only occupancy control was used during the measurement was
somewhat higher. The room with daylight dimming and occupancy control had the
highest LPD of all the three installations; however, for this room the annual lighting
energy intensity was the lowest of all due to energy savings from the control system (Table
3). The room with manual control has the lowest working plane illuminance in spite of
having the highest annual lighting energy intensity. The UGR values in all the rooms are
below the European standard recommendation. The average working plane illuminance
levels of all these rooms are higher than the current recommendation level (Publication
II). The measurements indicate that with the combination of occupancy control and
daylight-linked lighting control, it is possible to reduce the annual lighting energy
intensity below 20 kWh/m2.

24
Average savings resulting from the use of control were calculated from the measured
values of the energy use for one week in each season. The savings are calculated by
dividing the measured energy consumption by the energy consumption without the use of
dimming and occupancy control. The average savings were 40% in the room with
occupancy- and daylight-based dimming control (G437), and 22% in the rooms with
occupancy and manual dimming control (G438 & 439).
Table 3. Measured values of illuminance, glare rating, lighting power density, and
annual lighting energy intensity (Publication II).
Average Illuminance (lx)
Rooms Working plane Floor
UGR
W/m2
kWh/m2
G435 575 380 11 14.1 33
G437 665 390 16.4 16.9 20
G438 & 439 704 501 11.5 16.3 24
UGR Unified Glare Rating
W/m2
Lighting power density, in W/m2
kWh/m2
Annual lighting energy intensity, in kWh/m2
3.53.53.53.5 Accuracy of Accuracy of Accuracy of Accuracy of the the the the lighting energy calculation methodlighting energy calculation methodlighting energy calculation methodlighting energy calculation method
3.5.1 EU directive on energy performance of buildings
The European Commission’s directive for the energy performance of buildings was
adopted to promote the improvement of the energy efficiency of buildings by imposing
new energy performance requirements (EC 2002). According to the directive
(2002/91/EC), every building in the EU has to be tested for its energy efficiency when it is
constructed, sold, or rented out. The directive also requires every government to apply a
methodology that calculates the energy performance of buildings. These requirements
include a calculation procedure and performance limits. For lighting, the methodology
should include the built-in lighting installation and the positive influence of natural
lighting should also be taken into consideration.
3.5.2 Lighting energy calculation procedures
The lighting energy calculation procedures are devised in the building energy regulations
to calculate the energy consumption in relation to the energy requirements of the
building. These regulations also provide guidance on the establishment of the limit for
lighting energy use. This enables energy-efficient lighting to be used in meeting the
overall building energy standard. (Publication I)
Most of the countries in the European Union did not have measures for encouraging the
use of efficient lighting in their building energy regulations in 2003. The building energy
regulations of only four countries – Greece, France, Netherlands and the Flemish region
of Belgium – had a detailed calculation procedure for lighting. In these countries, energy
consumed by lighting in a building could be estimated and included in the overall

25
building energy consumption estimation profile. All the procedures carry out the
calculation by dividing the building into daylight and artificial light zones and by taking
into account the different reduction factors for the controls. The calculation in each zone
is performed by multiplying the installed load by the area of the zone, the burning hours,
and the different factors dependent on the control system. The Belgian method includes
the energy consumption in the sensors used for lighting control, which is not considered
by the other countries in their calculation methods. Another important difference is in the
way in which daylight is taken into account in the calculation procedure. Although all
four methods include daylight, the Dutch method includes only a crude ‘daylight zone’
allowance. The French calculation is similar but includes an extra factor, ‘climate zone’.
The Belgian method is more detailed as it includes a ‘daylight zone’ procedure and also
an option of a detailed daylight calculation. (ENPER-TEBUC 2003)
After the adoption of the Energy Performance of Buildings Directive, the European
standard EN 15193 (2007) was devised to establish conventions and procedures for the
estimation of energy requirements of lighting in buildings and to provide a numeric
indicator for lighting energy requirements used for certification purposes. The standard is
intended to facilitate the implementation of the energy performance of buildings directive
by providing the calculation methods and associated materials to obtain the overall energy
performance of buildings.
3.5.3 Calculation, measurement, and results
Calculation and measurement of the energy used by lighting was performed for the rooms
occupied by the Lighting Laboratory (Publication I, Chapter 3.4.1). The purpose was to
check the reliability and accuracy of the calculation method by comparing it with
measured data and to discuss the different parameters used for the calculation. The
calculations were performed on the basis of the Belgian calculation method (BBRI 2004)
and European Standard calculation method (EN 15193). The results of the calculations
and measurements on the lighting energy consumption are presented in Table 4.
The annual electricity consumption for lighting in the Belgian method is calculated by
summing up the total electricity consumption for the daylight area and artificial light area
and the possible electricity consumption of all the control equipment. The annual
electricity consumption of the daylight area of a room is calculated as:
( )narmddlmsw
rf
tdrf
rtdl TfTffA
APW ×+××××= __
,
lg_,
_lg_ ,
where W_dl
annual electricity consumption in the daylight area of room r, in kWh;
Plgt_r
calculation value for power for lighting in the entire room in kW;
Af,r_dlgt
floor area of the daylight sector in room r in m2;
Af,r
floor area of room r in m2;
fsw factor for the switching control system;
fm_dl
factor for the modulation control system in the daylight area;
fm_ar
factor for the modulation control system in the artificial light area;
Td number of daytime operating hours per year;

26
Tn number of night time operating hours per year.
Similarly, the annual electricity consumption of the artificial light area of a room is
calculated as:
( )ndarmsw
rf
artrf
rtar TTffA
APW +××××= _
,
_,
_lg_ ,
where W_ar
annual electricity consumption in the artificial light area of room r, in kWh;
Af,r_art
floor area of the artificial light area in room r in m2.
The annual electricity consumption for the control equipment in each room is
calculated as: ( )( ) ( )( ){ }ndswoutctrndswonctrctr TTfPTTfPW +×−×++××= 8760___ ,
where W_ctr
annual electricity consumption of the control system and sensors that is not yet
included in the consumption, in kWh;
Pctr_on
power of control equipment during the operating hours, default value for any
control, ballast, sensor, etc: 5 W;
Pctr_out
power of control equipment outside the operating hours, default value for any
control, ballast, sensor, etc: 5 W.
The floor area of the daylight sector is the contribution of both vertical and horizontal
facades. Since none of the rooms concerned had any horizontal or inwardly inclined
daylight openings, the calculation of the daylight area involves only the calculation of the
contribution of the vertical daylight openings. The floor area of the artificial light area can
be calculated by subtracting the floor area of the daylight sector from the total area of the
room.
The nominal power (Pnom) is calculated by summing up the power of all the lighting
components. The calculation value for the power for lighting (Plgt_r) is the nominal power
of the rooms with non-dimmable lighting installations. For dimmable lighting, the
calculation value also takes into account the lighting level and the reduction factor. The
burning hours Td and Tn are based on the use of the rooms. The total burning hours for
office rooms are taken to be 9 hours a day, 5 days a week, 50 weeks a year. The factor for
the switching control system is taken from the Belgian regulations. Its value is 1 for those
rooms where there are manual switches and no occupancy sensor system. It is taken to be
0.8 for those rooms that have occupancy sensors as well as automatic switches. Factors for
modulating control systems are taken to be 1 for the areas where there is no dimming. For
the areas where dimming is possible, the factors are calculated as:
fm_dl
= max [0.6; min (1.0; 0.6 +0.4* (Am-8)/22)]
fm_ar
= max [0.8; min (1.0; 0.8 +0.2* (Am-8)/22)],
where Am is the largest controlled surface area that is dimmed by one sensor in the room, in m
2.
The European standard calculation method provides both a quick method and a
comprehensive method to estimate the energy used for lighting. The comprehensive
27
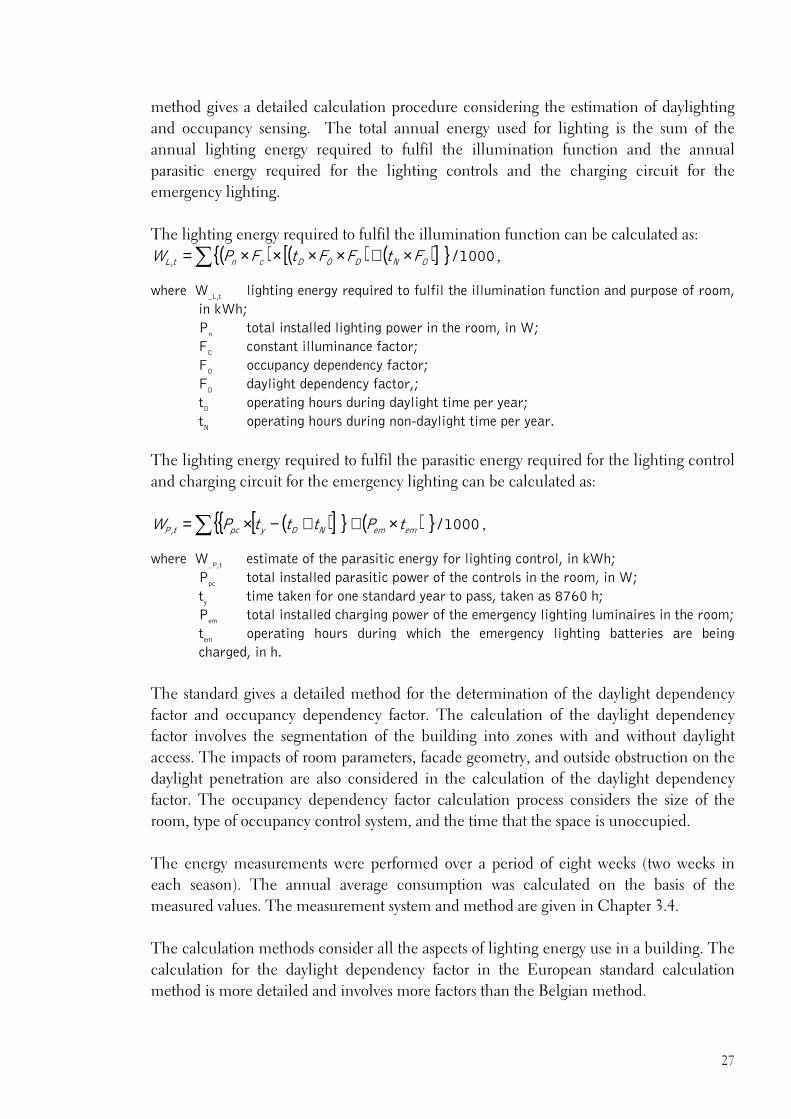
method gives a detailed calculation procedure considering the estimation of daylighting
and occupancy sensing. The total annual energy used for lighting is the sum of the
annual lighting energy required to fulfil the illumination function and the annual
parasitic energy required for the lighting controls and the charging circuit for the
emergency lighting.
The lighting energy required to fulfil the illumination function can be calculated as:
( ) ( ) ( )[ ]{ } 1000/, ∑ ×+××××= ONDODcntL FtFFtFPW ,
where W_L,t
lighting energy required to fulfil the illumination function and purpose of room,
in kWh;
Pn total installed lighting power in the room, in W;
FC constant illuminance factor;
FO occupancy dependency factor;
FD daylight dependency factor,;
tD operating hours during daylight time per year;
tN operating hours during non-daylight time per year.
The lighting energy required to fulfil the parasitic energy required for the lighting control
and charging circuit for the emergency lighting can be calculated as:
{ ( )[ ]{ } ( ) } 1000/, ememNDypctP tPtttPW ×++−×=∑ ,
where W_P,t
estimate of the parasitic energy for lighting control, in kWh;
Ppc total installed parasitic power of the controls in the room, in W;
ty time taken for one standard year to pass, taken as 8760 h;
Pem
total installed charging power of the emergency lighting luminaires in the room;
tem
operating hours during which the emergency lighting batteries are being
charged, in h.
The standard gives a detailed method for the determination of the daylight dependency
factor and occupancy dependency factor. The calculation of the daylight dependency
factor involves the segmentation of the building into zones with and without daylight
access. The impacts of room parameters, facade geometry, and outside obstruction on the
daylight penetration are also considered in the calculation of the daylight dependency
factor. The occupancy dependency factor calculation process considers the size of the
room, type of occupancy control system, and the time that the space is unoccupied.
The energy measurements were performed over a period of eight weeks (two weeks in
each season). The annual average consumption was calculated on the basis of the
measured values. The measurement system and method are given in Chapter 3.4.
The calculation methods consider all the aspects of lighting energy use in a building. The
calculation for the daylight dependency factor in the European standard calculation
method is more detailed and involves more factors than the Belgian method.

28
Table 4. Calculated and measured values of lighting energy consumption in the office
rooms of the Lighting Laboratory.
Af,,r
Winst
Wlgt-r/m2
WEN 15193
Room (m2) (W/m
2) (kWh/m
2) (kWh/m
2)
Wmes
(kWh/m2)
G435 26.30 14.1 32 30 33
G436 14.50 16.1 21 21 27
G437 22.40 16.9 23 23 20
G438 22.90 16.2 37 33
G439 14.30 16.4 37 35 24
G440 14.20 13.7 32 27
G441 19.00 18.0 38 32 39
G442 45.10 7.6 15 19 20
Total 179
Average
14
Average
27
Average
26
Average
27
Winst
installed power for lighting per square metre of room, in W/m2;
Wlgt-r/m2
calculated annual lighting energy consumption per square metre of room based on
Belgian calculation method, in kWh/m2;
WEN 15193
calculated annual lighting energy consumption per square metre of the room based on
European standard calculation method, in kWh/m2;
Wmes
measured value of annual lighting energy consumption per square metre of the room,
in kWh/m2.
The total average measured value of the energy consumption is similar to the values
calculated using two different methods. Although the average value is similar, there is a
significant difference between the calculated and measured values in some rooms. One of
the reasons for this difference between the measured and calculated values is that some
workers in those rooms had different working times during the measurement period than
the working time assumed for the calculation. For example, the lights were turned on for
a longer period than assumed in rooms G440 & 441, while the lights were turned on for a
shorter period than assumed in rooms G438 & 439.
3.63.63.63.6 ConclusionConclusionConclusionConclusionssss
A good lighting design involves not only the quantity and quality of lighting but also the
amount of energy used to illuminate the space. With the increase in energy costs and
people becoming more conscious of energy and environmental issues, more attention has
been given to energy-efficient lighting. Different codes and standards have and are being
introduced in many countries to restrict building energy consumption for all uses,
including lighting (Publication II). Significant savings in energy consumption without
any compromise in visual comfort and the visual performance of occupants can be
achieved by applying an energy-effective design approach to lighting installations.
29
Electric lighting is provided as a result of a combination of lighting equipment. A modern
lighting system needs light sources, ballasts, luminaries, and controls. Part of the power
input to the lighting unit is transformed into light, while the rest is considered as loss. The
saving of lighting energy requires the use of energy-efficient components, as well as the
application of control and dimming and the use of daylight. Savings of up to 40% have
been found with the use of daylight-based dimming and occupancy control. These savings
have been obtained without compromising the quality of the lighting service.
The renovation of the old lighting installation in the auditorium doubled the illuminance
while reducing the power consumption by 30%. This saving came as a result of the
combination of energy-efficient lamps, ballasts, and reflectors. New fluorescent lamps
with electronic ballasts are more energy-efficient and the ballast losses are smaller.
Additionally, due to the improved materials and designs, the new reflectors have greater
efficiency than the old ones.
Measurements in the office rooms showed average electricity savings of 40% with the use
of occupancy control and daylight-based dimming control. These savings were obtained
by utilising daylight and turning artificial light off when it was not needed. That shows
that proper management of the lighting can yield significant savings without reducing the
quantity of light.
The European standard lighting energy calculation procedure uses the more detailed
method for the consideration of daylight. The calculated value based on the Belgian
method is equal to the measured value. The total average measured value of energy
consumption is 4% higher than the calculated value based on the European standard
calculation method. These results show that a high level of accuracy has been maintained
in the calculation methods.

30
4444 EnergyEnergyEnergyEnergy----efficient lighting in developing countriesefficient lighting in developing countriesefficient lighting in developing countriesefficient lighting in developing countries
4.14.14.14.1 Defining basic lighting needs in remote villages Defining basic lighting needs in remote villages Defining basic lighting needs in remote villages Defining basic lighting needs in remote villages inininin developing developing developing developing
countriescountriescountriescountries
The major part of the population in developing countries does not have access to electric
lighting. Fuel-based lighting is the only option to bring minimal lighting services to such
areas. Providing grid electricity to the rural areas of many developing countries is a very
difficult task because of the geographical complexity and lack of financial resources. In
this scenario, the efficient use of available renewable energy resources and adoption of
energy-efficient, reliable, and durable lighting systems is essential for people living in
developing countries.
There are many factors that affect the definition of appropriate lighting for homes in
remote villages in developing countries. The availability of local energy resources, the cost
of the lighting technology, and the local people’s prevailing lighting practices should be
considered in order to make the lighting projects and programmes that are implemented
sustainable. The defined lighting levels should be suitable and affordable for the rural
people’s activities and needs. (Publication IV)
The primary function of any home lighting system is to provide a safe visual environment
for movement around the space, to make it possible to perform visual tasks, and to provide
a comfortable and pleasant visual environment. On the other hand, the lighting system
has to be cost-effective, efficient, non-polluting, and easy to clean and maintain.
The standards and guidelines for recommended lighting levels in developed countries
often categorise the household into different areas and give recommendations on lighting
levels according to the specific need of each area. However, homes in rural villages do not
have separate rooms for specified tasks. Usually, the whole family is accommodated in one
or two rooms and these rooms serve as kitchen, bedroom, study room, dining room, and
living room. Most of these rural homes use inefficient biomass or petroleum fuel for
illumination because of a lack of income and the unavailability of other energy resources.
So rural electrification projects are often the first electrification projects the rural
community has had, and thus have to aim to provide just minimal but sufficient lighting
for defined tasks, however, in an affordable and sustainable way. (Publication IV)
4.24.24.24.2 Lighting in rural Nepali villagesLighting in rural Nepali villagesLighting in rural Nepali villagesLighting in rural Nepali villages
4.2.1 Introduction
Around 80% of the 28.5 million population of Nepal live in rural areas, and about half of
them live in areas which are very remote and difficult to access (Zahnd 2005). As a result

31
of the geographical remoteness, harsh terrain, and low population density, grid
electrification in scattered rural communities in Nepal is infeasible. Therefore many
villages in Nepal will not be reached by electricity network extensions within the
foreseeable future.
The primary energy source used to provide the necessary daily energy supply in Nepal has
for centuries been firewood, often supplemented by crop residues and animal manure.
Only 40% of the population has access to electricity, of which 33% relies on the national
electrical network and 7% on alternative energy resources (CRT 2005). The rest of the
homes, mostly in rural areas, use kerosene, oil-based wick lamps, or resin-soaked twigs to
provide minimal lighting for their living conditions.
4.2.2 Fuel-based lighting
Currently many homes in rural areas of Nepal without access to electricity are
illuminated by the use of biomass or petroleum fuel. Many rural communities in Nepal
do not have access to motorable roads, and porters have to be used to carry materials and
equipment. Hence the price of commercial liquid fuels (kerosene, oil) increases
proportionally to the distance to the road. On the other hand, the homes in these
communities have very low incomes. For example, the Humla district in the north-
western region is one of the most isolated regions in Nepal because of its remoteness and
geography. Simikot, the district centre of Humla, is 16 days’ walking distance from the
nearest road. The families and communities in upper Humla have to use a “jharro”, a
resin-soaked high-altitude pinewood stick, to get minimum but smoky indoor lighting.
Figure 4. Open fireplaces for cooking and heating, and light through a “jharro”, a resin-
soaked pine-tree stick.
"Jharro" is gathered by inducing a deep wound in a pine tree, forcing it to produce locally
a high amount of resin in order to cure the wound. This high resin-content wood layer is
32
cut away after a week and burned in small sticks to generate light. Burning “jharro” sticks
are typically placed on an elevated stone or mud pile or on a hanging metal plate (Figure
4) at a height 40-50 cm above the floor. A “jharro” emits thick black smoke that is harmful
to the respiratory system, resulting in various health problems. The use of firewood on
open fireplaces for cooking and room heating and the use of “jharros” for lighting
accelerate the already-occurring deforestation in these villages.
4.2.3 Solid state lighting
Light-Emitting Diodes (LEDs) are rapidly evolving light sources. Technical advances
have greatly enhanced the performance of LEDs in recent years. According to Agilent
Technologies, the lumens per package value of red LEDs has been increasing 30 times
per decade, whereas the price is decreasing 10 times per decade (Haitz 2001). Some of the
current white LEDs have a luminous efficacy of more than 90 lm/W (Cree 2008), which
is more than five times greater than that of an incandescent lamp. The optoelectronics
industry development association (OIDA) roadmap has a target of achieving a value of
200 lm/W by 2020 (OIDA 2002). The other important advantages of LED light sources
that make them suitable for rural lighting are their lifetimes, which are measured in tens
of thousands of hours, low power requirements, ruggedness, compact size, and low
operating voltage.
The idea of using LEDs for lighting the unelectrified rural Nepali villages was initiated by
the Canadian professor Dave Irvine-Halliday, while he was trying to find solutions for
lighting houses in villages with no access to electrical networks (Rolex 2006). He saw
children in Nepali mountain villages trying to read in dark classrooms. That gave birth to
the Light Up the World Foundation (LUTW), which was the first humanitarian
organisation to utilise white LEDs to replace fuel-based lighting in developing countries
(LUTW 2006). In 2000, LUTW started its work by providing LED lighting to homes in
four small Nepali villages; Thulo Pokhara, Raje Danda, Thalpi, and Norung (Shailesh
2006). Since then the organisation has lit up more than 14,000 homes in 26 countries,
including the organisation’s birthplace, Nepal, directly influencing the lives of over
100,000 people (LUTW 2006).
Since the first home lighting projects in Nepal, LUTW has been helping to light up
villages by providing LEDs to a local non-governmental organisation, RIDS-Nepal (Rural
Integrated Development Services - Nepal). RIDS-Nepal uses solar photovoltaic (PV)
systems and pico hydro power plants with white LEDs to implement lighting in villages as
part of long-term community development projects. Until January 2008, RIDS-Nepal
had electrified seven villages in the remote upper Humla through elementary village
electrification projects. Six villages generate their energy through solar PV systems and
one village through a 1-kW pico hydro power plant. In these villages, a total of 561 homes
with 3,850 people now have minimal indoor electric lighting for about seven hours a day.
(Publication IV)

33
Two different types of LED luminaires are manufactured for the RIDS-Nepal village
illumination system. One consists of nine Nichia NSPW510BS white LEDs (low-power
white LEDs) and the other consists of a single white LED, Luxeon Star from Lumileds
(high-power LED). All the luminaires are manufactured in Nepal by Pico Power Nepal
(PPN), a local manufacturing company. The control circuits for the luminaires are also
designed and manufactured at PPN. (Publication IV)
4.2.4 Measurements and results
The luminaires used in the rural villages of the Humla district were measured in the
laboratory to test their performance. Measurements were also performed for the burning
“jharro” pine stick. The luminous fluxes of both luminaires were measured in an
integrating sphere. In order to make a direct comparison between an LED light source
and the “jharro” light source, the luminous efficacy of a “jharro” was calculated. The
energy content of the “jharro” was measured using a calorimeter at the University of
Jyväskylä and the value was converted into equivalent electrical power. The luminous flux
of the “jharro” was measured in a dark room. Table 5 shows the characteristics of the two
LED luminaires and the “jharro” pine stick. The measurements indicate that the
luminous efficacy of the pine stick lamp (0.04 lm/W) is half of the efficacy of a kerosene
fuel-based lamp (0.08 lm/W (Mills 2005)) and more than 300 times less than that of the
white LED luminaire used in the villages. (Publication IV)
The differences between the measured and rated values of luminous efficacy among the
LED luminaires are due to the losses in the driving circuit and in the luminaire. The
difference is significant in the high-power white LED luminaire as it was driven with a
lower than rated current, resulting also in a significant reduction in the light output. The
loss in the driving circuit of the high-power LED luminaire is considerably higher than
that of the low-power LED luminaire. It indicates the need for the design of more
efficient and better driving circuits for the high-power LED luminaire.
Table 5. The measured values of power (W), luminous flux (lm), and luminous efficacy
(lm/W) of the LED luminaires and “jharro”, and rated luminous efficacy of the
LEDs as given by the manufacturers.(Publication IV)
Light source type Power
(W)
Luminous
flux
(lm)
Luminous
efficacy
(lm/W)
Rated Luminous
efficacy of LED
(lm/W)
Luminaire with 9 Nichia LEDs 0.73 11 15 29
Luminaire with 1 Luxeon
LED
1.07 14 13.1 38
“Jharro” (pine stick) 2167 88 0.04
Illuminances in the houses with “jharro” stick lighting were measured in several villages
in the Humla district. The average illuminance on the floor up to a horizontal distance of
1 m from the source was 2 lx. In the room corners (floor level), which were more than 1
m from the burning jharro sticks, the illuminances were less than 1 lx. These low lighting

34
levels make it just possible to move around the room and to do some general work close to
the light source, but the lighting is not adequate for any visually oriented tasks such as
reading.
Illuminance measurements were also carried out under LED lighting in the villages.
Each home in the villages has two luminaires with nine low-power LEDs, and one
luminaire with a single high-power LED. These homes consist of two rooms of dissimilar
size, both with low ceilings. The two luminaires with low-power LEDs are installed in the
bigger room and the luminaire with a single high-power LED is installed in the smaller
room. The luminaires are installed on the ceiling of the room at a height of about 1.8 m
from the floor. The average illuminance at floor level in the bigger room with the two
luminaires was 5 lx, while it was 3 lx in the smaller room with a single high-power LED
luminaire.
Householders were interviewed to ascertain their reactions to the lighting. According to
their response, an average illuminance of about 5 lx seemed to be adequate for general
purposes. It was not possible to read at this lighting level, and any reading task had to be
done very close to the light source. It was possible to read texts from a book when the
illuminance level was around 25 lx, which level was achieved by bringing the book near
to the light source. This was tested by having the local schoolchildren perform reading
tasks. On the basis of the measurements under “jharro”-based and LED-based lighting
and considering the local economy and availability of energy resources, it is practical to
recommend two types of lighting levels for first-time electric lighting in the rural villages.
An illuminance of about 5 to 15 lx is recommended for general purposes and an
illuminance level 25≥ lx is recommended for reading and other similar tasks for a first-
time elementary lighting service for home lighting in these communities. (Publication
IV)
The illuminances under both the luminaires at variable distances were measured in the
dark room of the Lighting Laboratory. Figures 5 and 6 show the illuminances measured at
different horizontal and vertical distances from the light sources. When the luminaire
with low-power LEDs was installed 0.5 m above the illuminated plane, the illuminance
on the plane directly under the luminaire was 112 lx. Thus it can provide sufficient light
to read by and to perform other visual tasks. On the other hand, although the illuminance
on the plane directly under the luminaire was relatively high, the illuminance in adjacent
areas decreases sharply. The appropriate installation height of the luminaire depends on
the type of illumination needed. The illuminance on the plane directly under the high-
power LED luminaire was very low compared to that under the luminaire with low-power
LEDs. However, the decrease in illuminance on a wider horizontal plane is not so sharp
because of the wide viewing angle (110°) compared to the angle (50°) of the low-power
LED luminaire. The wide viewing angle of the high-power LED makes the luminaire
suitable for providing general orientation lighting for a larger area.

35
Figure 5. Illuminance at floor level under the low-power LED luminaire as a function of
horizontal distance and at three different luminaire mounting heights
(Publication IV).
Figure 6. Illuminance at floor level under the high-power LED luminaire as a function
of horizontal distance and at three different luminaire mounting heights
(Publication IV).
4.2.5 Technical and economic aspects of solar-powered LED lighting
The performance and lifetime of the lighting system is dependent on all the components
associated with it. Usually, rural communities lack the technical skills to install and
maintain lighting and energy systems. Improved public awareness and training

36
programmes, field research, and the incorporation of the social and cultural needs of
these communities into lighting system design are essential for the long-term success of
PV-powered LED lighting systems in remote areas.
Routine checking of the equipment is needed to maintain the quality of the lighting.
Cleaning the PV panels and luminaires, checking the battery voltage, topping up the
batteries with rainwater, and cleaning the glass of the luminaire should be done regularly.
The solar PV modules are the most expensive equipment in a PV system and they have
the longest lifetime. The monocrystalline PV arrays used in the Humla villages are
guaranteed by the manufacturer to provide 90% and 80% of their rated power output after
12 and 25 years, respectively. The climatic conditions are very important factors in
designing PV systems. Monocrystalline and polycrystalline PV modules have an average
power output reduction of 0.4% to 0.5% per increased temperature degree (°C) above the
rated temperature. Similarly, the power output increases compared to the rated power
when the temperature of a PV module is less than the rated temperature. The design of a
battery bank depends on the “independence of sunshine” (number of days without
sunshine). The battery bank has to be large enough to provide energy without being
charged and without being too highly discharged during the days without sunshine.
Overcharging and too-low discharging of the battery leads to a shorter life expectancy.
The charge and discharge controllers protect the battery bank from overcharging and too-
low discharging, which allows the deep cycle lead acid battery used in the villages to last
for 8-9 years. The charge and discharge controllers manufactured in Nepal have a lifetime
of about 8-10 years. The whole system is protected against short circuits and overloading
by an automatic fuse. (Publication IV)
A cost analysis of the two types of LED lighting systems and of the “jharro” lighting used
in the villages of Humla was performed to compare the costs in terms of per lumen hours
of light. The capital cost and variable cost of the lighting systems were converted into
annual costs. In “jharro” lighting, there were no capital costs and the cost involved only
the amount of “jharro” consumption. The amount of “jharro” consumption per hour in
“jharro” lighting was measured at Helsinki University of Technology. It was found that the
amount of “jharro” consumption for one “jharro” lamp giving 88 lumens (Table 5) is 0.27
kg/hour. Assuming the use of lighting for five hours a day, the annual “jharro”
consumption can be calculated as
0.27 kg / hour x 5 hours/day = 1.35 kg / day
1.35 kg / day x 365 days / year = 493 kg / year
The cost of using a “jharro” in the Humla villages can be assumed as Rs 100 / kg (Rs 100
is equivalent to 1.42 U.S. dollars). Hence the annual cost of “jharro” lighting providing 88
lm of light output is Rs 49,275, which corresponds to Rs 307 ($4.36) per klmh (kilolumen-
hour).

37
For the solar-powered LED lighting systems, the capital costs consist of the cost for a solar
PV array, battery, charge and discharge controllers, wires, switches, LED luminaires, and
installation costs. The variable costs consist of the cost of maintenance and the costs of the
replacement of batteries, controllers, and other auxiliaries. The cost analysis was done for
a 25-year life cycle, assuming the life of solar panels to be 25 years. An example of a solar
home system with a 12-W solar panel, two deep cycle batteries, a charge and discharge
controller, luminaires, and switches was taken for the calculation. The cost of each
component was assumed to be the cost at which they are available in the electrification
project in Humla. The result of the calculation showed that the cost per klmh was Rs
15.12 ($ 0.21) for solar-powered lighting with a high-power LED (Luxeon) luminaire,
while the cost per klmh was Rs 15.59 ($ 0.22) for the lighting system with a low-power
LED (Nichia) luminaire.
Because of the development of LED technology, the prices of LEDs are decreasing and
the luminous efficacies of LEDs are increasing. This will further increase the cost-efficacy
of LED lighting compared to the traditional “jharro” lighting in the future.
4.34.34.34.3 Energy supply solutions in developing countriesEnergy supply solutions in developing countriesEnergy supply solutions in developing countriesEnergy supply solutions in developing countries
4.3.1 Renewable energy systems
The lack of electricity and heavy reliance on traditional biomass are hallmarks of poverty
in developing countries (IEA 2002). Extending electricity networks to rural areas of
developing countries is very expensive because of their geographical remoteness, lack of
basic infrastructure, and low population density. Hence, the remote and rural parts of
many developing countries are not expected to be accessed by electricity networks in the
near future. (Publication V)
The use of renewable energy systems to produce electricity is becoming a viable option in
fulfilling the basic energy needs of rural villages. There are a range of innovative and
sustainable technology solutions which can meet energy needs in developing countries
(Doig 1999, Gustavsson et al. 2004, Richards 2006). The technologies, which involve
wind power, solar power, and small-scale hydropower, exploit local resources, operate on a
small scale, and have the advantage of meeting the needs of widely dispersed rural
communities (Publication V).
The efficient use of electrical energy is a very important issue in these situations because
of the low level of power production capacity from these technologies and also because of
the associated costs. A cost analysis of LED-based lighting systems driven with renewable
sources in different parts of developing countries has shown them to be cost-effective in
comparison with the existing options (Jones et al. 2005, Shailesh 2006).

38
The Light Up the World organisation, a pioneer in using LED lighting in rural villages,
has utilised a number of different energy supply systems to power LED light sources.
These energy systems include pedal generators, pico hydro, and solar photovoltaic
systems. The selection of the system depends on the availability of local resources, local
geographical situation, costs, and the sustainability of the system. (Publication V)
The first village lighting project of LUTW utilised pedal power to charge a battery by
using a pedal generator (PG). The pedal generator was chosen as it could be operated at
any time of the day when required, it was economical, easy to maintain, and could be
manufactured in the place where it is used (Halliday et al. 2000). The PG consists of a
DC motor used as a generator, a locally manufactured flywheel, a voltage regulator, a
digital multi-metre, and a poly-fibre belt. The PG system is installed in one home and
serves eight to twelve other homes. The battery of each home can be recharged with the
PG by only about 30 minutes of gentle pedalling. The size of the battery is chosen so that
it is enough to fulfil the daily lighting needs of each home, which is roughly between four
and five hours per night. (Publication V)
The use of very small-scale hydroelectric generation (pico hydro) has great potential to
power the villages in many rural areas. If electricity is produced from the estimated
200,000 traditional water mills existing in rural India, Nepal, and Bhutan, a large number
of villages in these regions can be illuminated by utilising efficient lighting technologies
(Craine et al. 2002). With an annual average water runoff of 225 billion m3 from over
6,000 rivers, Nepal has a technically and economically feasible hydropower potential of
around 43,000 MW (UNDP 2006). Pico hydro is taken as a sustainable and viable option
to provide power to rural areas. It exploits local resources and operates on a small scale,
using flexible and modular equipment manufactured locally. Local manufacturing
ensures appropriate designs for local settings and reduces the capital costs of the
equipment. The installation and maintenance costs are low and the technology used is
simple.
Solar PV systems are often the preferred energy sources for rural electrification. Most of
the LUTW lighting projects in different developing countries, including Nepal, use solar
PV arrays to produce electricity. Similarly, most of the lighting projects implemented in
rural Nepali villages by RIDS-Nepal use solar PV systems. Nepal lies around the 30°
Northern latitude solar belt, with solar energy presenting a sustainable energy resource,
with an average insolation of 5.5 – 6 kWh/m2 per day (Zahnd et al. 2005).
The solar PV system consists of a solar panel, a lead acid battery, and a battery charging
circuit. Depending on the local needs and circumstances, three different approaches have
been used in the previously mentioned solar PV system projects: a centralised solar
system, a distributed solar system, and an individual solar system. If the geographical
conditions of the villages are favourable and the houses are built close to each other, the
solar PV system of the villages is built as a central PV system. This central PV system

39
consists of a two-axis self-tracking frame which follows the sun’s position, increasing the
daily energy output by between 30%-40% compared to the output in stationary mode,
depending on the season. If the houses in the village are scattered, different clusters of
houses are formed in the village and each cluster is electrified with its own centralised
solar system. An individual solar system is suitable for widely scattered homes in villages.
In this case, each home has its own small panel and its own small battery and forms an
individual solar home system. (Publication IV)
4.3.2 Life cycle cost analysis
A simple life cycle cost analysis is used to compare the costs of two different energy supply
systems used for lighting in rural Nepali villages. The costs of generating capacity are
calculated for pico hydro and PV solar systems over their entire lifetime by taking into
consideration the characteristics of each individual case. Initially, the intention of the
study was to calculate the costs of pedal power systems as well. The pedal power system
installations in Nepali villages were the first projects of LUTW (started 7 to 8 years ago);
hence no recent data for their costs are available. On the other hand, a cost comparison of
the pedal systems with the others would not be meaningful as the pedal systems did not
last to the end of their expected lifetimes as a result of the mishandling of the systems
(used by kids as toys for playing, too-low discharging of the battery, wrong connections
while charging the battery with the pedal generator). Although the normal lifetime of a
battery used in a pedal system was two years, most of the batteries were out of order after
six months of operation. (Publication V)
A pico hydro system (1.1 kW) and a PV system (75 W) installed in the Humla district of
Nepal were chosen for the cost calculation. The cost and lifetime of each component and
the costs of construction and installation are taken into consideration for the calculation.
The costs of equipment for both systems are higher compared to those in other parts of
Nepal because of the transportation costs. All the equipment has first to be carried by
aeroplane and then by yak or porter to reach the installation site. The construction work
was partly carried out voluntarily by the villagers. The local labour costs are assumed to
estimate the cost of voluntary work in the cost calculation of the construction work. The
life cycle cost is calculated for the actual installed power of the PV and the pico hydro
system. The costs are given in Nepali Rupees (NRs). (Publication V)
A 20-year life cycle cost (LCC) analysis period is used for each system. Using a discount
rate of 4%, discount factors are calculated for each year in which costs occurred and the
costs are converted into present value. The life cycle costs are then converted into cost per
kilowatt of generating capacity to enable a comparison to be made between the two
systems. The results of the calculations are presented in Table 6.
The LCC calculation over a 20-year service life does not show any significant difference
in costs per kW generating capacity between the solar PV and the pico hydro systems.
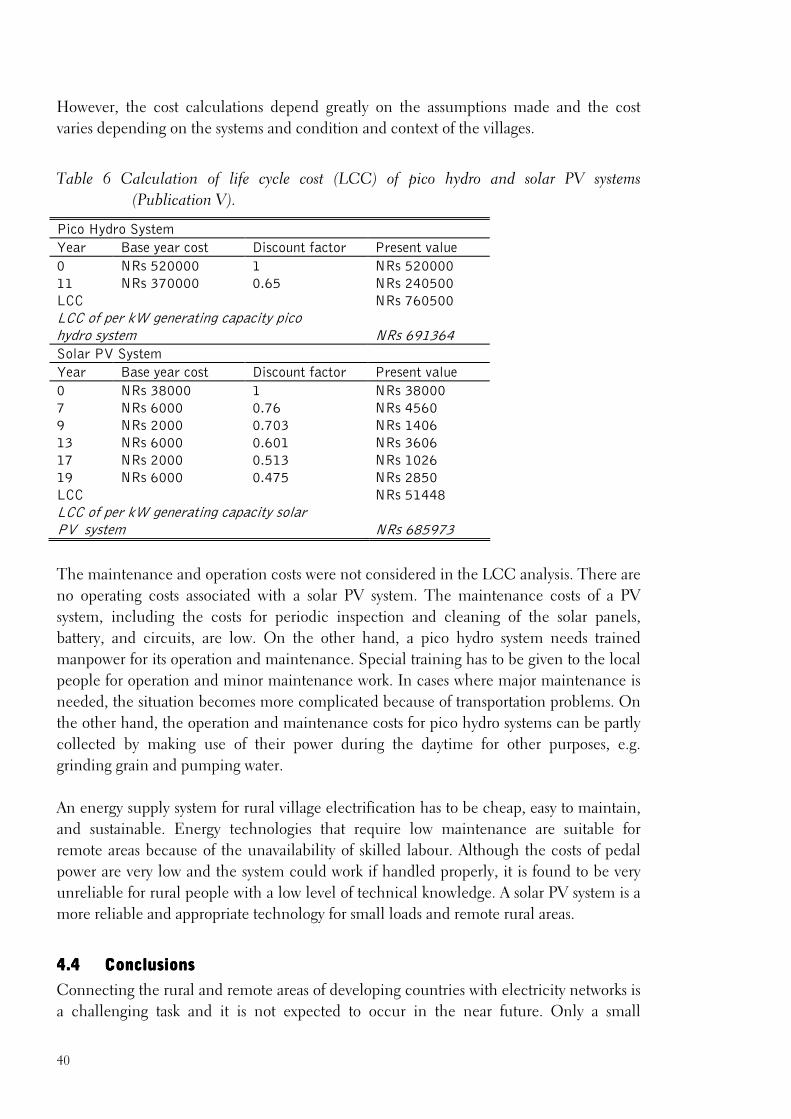
40
However, the cost calculations depend greatly on the assumptions made and the cost
varies depending on the systems and condition and context of the villages.
Table 6 Calculation of life cycle cost (LCC) of pico hydro and solar PV systems
(Publication V).
Pico Hydro System
Year Base year cost Discount factor Present value
0 NRs 520000 1 NRs 520000
11 NRs 370000 0.65 NRs 240500
LCC NRs 760500
LCC of per kW generating capacity pico hydro system NRs 691364
Solar PV System
Year Base year cost Discount factor Present value
0 NRs 38000 1 NRs 38000
7 NRs 6000 0.76 NRs 4560
9 NRs 2000 0.703 NRs 1406
13 NRs 6000 0.601 NRs 3606
17 NRs 2000 0.513 NRs 1026
19 NRs 6000 0.475 NRs 2850
LCC NRs 51448
LCC of per kW generating capacity solar PV system NRs 685973
The maintenance and operation costs were not considered in the LCC analysis. There are
no operating costs associated with a solar PV system. The maintenance costs of a PV
system, including the costs for periodic inspection and cleaning of the solar panels,
battery, and circuits, are low. On the other hand, a pico hydro system needs trained
manpower for its operation and maintenance. Special training has to be given to the local
people for operation and minor maintenance work. In cases where major maintenance is
needed, the situation becomes more complicated because of transportation problems. On
the other hand, the operation and maintenance costs for pico hydro systems can be partly
collected by making use of their power during the daytime for other purposes, e.g.
grinding grain and pumping water.
An energy supply system for rural village electrification has to be cheap, easy to maintain,
and sustainable. Energy technologies that require low maintenance are suitable for
remote areas because of the unavailability of skilled labour. Although the costs of pedal
power are very low and the system could work if handled properly, it is found to be very
unreliable for rural people with a low level of technical knowledge. A solar PV system is a
more reliable and appropriate technology for small loads and remote rural areas.
4.44.44.44.4 ConclusionConclusionConclusionConclusionssss
Connecting the rural and remote areas of developing countries with electricity networks is
a challenging task and it is not expected to occur in the near future. Only a small
41
percentage of the population in developing countries has access to electric lighting and
the rest use fuel-based lighting for their basic lighting needs.
The pine stick-based lighting used in rural Humla in Nepal was found to be more than
300 times less efficient than the new white LED-based lighting. Still, the LEDs currently
used in the villages are not the most efficient as there are white LEDs on the market with
a luminous efficacy of more than 90 lm/W (Cree 2008), compared to the 29 lm/W LEDs
used in the current installations. A whole village of up to 30 homes can be lit with the
comparative power of one 100-W incandescent lamp. With the continuous advancement
in the efficiency of LED technology, more light will be available in the future using the
same amount of energy.
Although the lighting levels provided by the current LED-based lighting systems in rural
homes are minimal, they can be considered adequate for a first-time elementary indoor
lighting installation. The appropriate lighting level for homes in remote villages in
developing countries depends on the current lighting practice, available energy resources,
and cost. Taking into consideration the current lighting practice and based on
measurements and interviews, two different illuminance levels were recommended as a
first-time elementary lighting service for home lighting in rural communities in
developing countries.
The replacement of fuel-based lighting by electric lighting can be done in a sustainable
way by using existing and environmentally friendly renewable energy sources such as
wind, solar, and hydro power. In choosing the appropriate renewable energy technology
for rural lighting, the reliability and sustainability of the technology in the local context
are important issues for a successful implementation. Life cycle cost calculations made for
solar PV and the pico hydro system did not show much difference in the costs over a 20-
year service life. Solar photovoltaic systems are economically competitive but require less
maintenance than pico hydro and are suited to widely scattered rural areas.

42
5555 Discussion and cDiscussion and cDiscussion and cDiscussion and conclusionsonclusionsonclusionsonclusions
The work started by reviewing lighting quality factors in an office environment and the
consequences of efficiency measures for lighting quality. Different codes, standards and
recommendations related to energy-efficient and high-quality lighting introduced in
different parts of the world were also discussed. Three different control systems were
compared for energy efficiency and quality of lighting by means of measurements. It was
found that rooms equipped with daylight-based dimming and occupancy control systems
used 40% less energy than those with manual lighting control. The corresponding savings
were 22% in rooms with only occupancy control. The savings were obtained without
reducing the illuminance level by utilising the daylight and turning the artificial light off
when it was not needed. The UGR values in all cases were below the value recommended
by the CIBSE code and European standard.
Dimming control according to daylight has great potential for energy savings but the
design of the system is quite complex. There is parasitic power associated with every
automatic control system, which should be justified by the savings from the use of the
control system. If daylight in the room is only available near the window, each luminaire
should be controlled independently and have its own individual daylight sensor.
The photometric and electrical measurements performed before and after the renovation
of the auditorium showed that the new lighting installation provided higher illuminance
levels and better colour rendering, while lighting energy consumption was reduced.
There was a 30% reduction in the consumption of electricity, while the illuminance level
was doubled after renovation. The UGR value from the lecturer’s point of view was found
to be beyond the standard recommendation level. This is due to the higher surface
brightness of the T5 lamp compared to that of the old T12 lamps and also higher
illumination levels. The luminaries are dimmed to 80% power level during the lectures.
This results in a reduction in the UGR value and a further increase in energy savings.
This illustrates the saving potential of the application of existing technology. The results
give backing to the previous estimates and claims of the possibility of making savings by
the use of new lighting technologies (IEA 2006, Mills 2002, Novem 1999, Tichelen
2007).
The EU energy performance of buildings directive adopted in 2002 is an attempt to
improve overall energy efficiency in buildings, including lighting. The directive requires,
inter alia, a calculation procedure and performance limits for lighting. This enables
energy-efficient lighting to be used in meeting the overall building energy standard. The
lighting energy calculations used in this work were made by dividing the building into
daylight and artificial light zones and by taking into account the different reduction

43
factors for daylight and controls. The calculation methods also consider the energy
consumption of the sensors used for lighting control.
Measurement of the energy consumption in the office rooms was carried out to make
comparisons with the calculated values. The calculation methods need to be tested by
taking measurements and correcting factors for the calculation methods can be
established if needed. The average measured value of energy use in the office rooms was
equal to the calculated value based on the Belgian method. This value was 4% higher
than the calculated value based on the European standard calculation method. The
calculation process involved assumption of the burning hours of lamps, which is difficult,
especially when the office workers have non-homogenous working hours. This resulted in
significant differences between the calculated and measured values in some rooms.
Measurement and evaluation of the traditional fuel-based lighting system in rural Nepali
villages revealed the degree of inequality of access to basic lighting services in developed
and developing countries. The existing pine stick lamps were found to be around 300
times less efficient than the new white LED-based lighting. Furthermore, pine stick
lighting is a cause of various health problems because of the smoke produced by the
burning stick.
A cost analysis of pine stick lighting and solar-powered LED lighting in rural Nepali
villages indicated that the cost of pine stick lighting was $4.36 per klmh (kilolumen-hour),
while the cost of solar PV-driven LED lighting was $0.22 per klmh. The prices of LEDs
are decreasing and the luminous efficacies are increasing due to the continuous
development of LED technology. Hence the difference in cost between LED lighting and
traditional pine stick lighting is expected to increase further in the future.
The amount of light provided by an LED lighting system has to be sufficient to provide a
safe visual environment and to make it possible to perform visual tasks. The proposed
recommendation for illuminance is 5 to 15 lx for general purposes and ≥ 25 lx for reading
and other similar tasks. These recommendations are based on illuminance measurements
and user interviews in Nepali villages.
The utilisation of decentralised small-scale renewable energy technologies is an important
element of the successful replacement of fuel-based lighting in developing countries.
These renewable energy technologies can be solar PV, small-scale hydro, and wind. The
chosen energy system has to be cheap and easy to maintain and operate as the rural
villagers often lack the knowledge and expertise for maintenance.

44
ReferencesReferencesReferencesReferences
ABB, 2005, Access to Electricity: A White Paper on ABB’s initiatives for Access to
Electricity, ABB, Zurich, Switzerland.
ASHRAE, 2004, ANSI/ASHRAE/IESNA Standard 90.1.2004, Energy Standard for
Buildings Except low-rise residential buildings.
BBRI (Belgian Building Research Institute), 2004, Lighting extracts from “The
determination method of the characteristic annual primary energy consumption of offices
and schools”, CEN draft standard CEN TC/169 WG9 (ADE) 04.
Belkin P., 2007, The European Union’s Energy Security Challenges, CRS Report for
Congress, NCSE, Washington.
Berson, D.M., Dunn, F.A., Takao, M., 2002, Phototransduction by retinal ganglion cells
that set the circadian clock. Science, Vol. 295.
Bertoldi P., Atanasiu B., 2006, Residential Lighting Consumption and Saving Potential in
the Enlarged EU, Proceedings of EDAL’06 Conference, London, UK.
Brockett D., Fridley D., Lin J., Lin J., 2000, A Tale of Five Cities: The China Residential
Energy Consumption Survey, Lawrence Berkeley National Laboratory.
CIBSE, 1997, CIBSE Code for interior lighting 1994: Additions and corrections 1997.
COM, 2001, Proposal for a Directive of the European Parliament and of the Council on
the Energy Performance of Buildings; Commission of the European Communities,
Brussels, COM (2001) 226 final; 2001/0098 (COD).
Craine S., Lawrance W., and Halliday D.I., 2002, Pico power - lighting lives with LED,
Journal of Electrical and Electronics Engineering, Australia, vol. 22, pp. 187-94.
Cree, 2008, XLamp® XR-E LEDs, http://www.cree.com/products/xlamp_new_warm.asp ,
Accessed on 27th May 2008.
CRT (Centre for Rural Technology), 2005, National Energy Situation Survey Report
Nepal, Report submitted to International Network for Sustainable Energy (INFORSE).
DOE (U.S. Department of Energy), 2005, Commercial Energy Code Compliance IECC
2000/2001/2003, Compliance Lighting Requirements, Chapter 8 IECC, Building Energy
Codes Program, Washington DC.

45
DOE (U.S.Department of Energy), 2006, Strategic Plan, Climate Change Technology
Program, U.S. Department of Energy, Available: http://www.climatetechnology.gov
/stratplan/final/CCTP-StratPlan-Sep-2006.pdf.
Doig A., 1999, Off-grid electricity for developing countries, IEE review, Volume 45, Issue
1, pp 25-28.
Douglas F. Barnes, Robert Van Der Plas, Willem Floor, 1977, Tackling the Rural Energy
Problem in Developing Countries, Finance & Development, International Monetary
Fund Magazine, pp 11-15.
Dumortier D., Coutelier B., Faulcon T. and Roy F.V., 2005, PHOTOLUX, a new
luminance mapping system based on the Nikon Coolpix digital camera, LUX EUROPA
Berlin, Germany, pp. 308-311.
EC (European Commission), 2002, Directive 2002/91/EC of the European Parliament
and of the Council on the Energy Performance of Buildings, Commission of the
European Communities (Official Journal L 001 of 04.01.2003), Brussels.
EC (European Commission), 2007, The European Greenlight Programme: Successful
examples of efficient lighting upgrades in buildings, http://www.eu-greenlight.org/,
Accessed on 20th July 2007.
ECODROME, 1998, Experimental Study of highly efficient Electrical Appliances in
Household Use, Final report: Executive summary, SAVE Contract No. 4.1031/S/94/-093,
ENERTECH, Felines S/Rimandoule, France.
EIA, 2004, International Energy Annual 2004, Energy Information Administration, US
Department of Energy.
EN 12464-1, 2002, European standard: Light and lighting – Lighting at work places – Part
1: Indoor Work Places.
EN 15193, 2007, European standard: Energy performance of buildings - Energy
requirements for lighting.
ENPER-TEBUC, 2003, Energy Performance of Buildings. Calculation Procedures Used
in European Countries, for the commission of the European Communities, DG-TREN
SAVE Contract No. 4.1031/C/ooo18/2000 ENPER TEBUC.
Gifford R., Hine D.W., Veitch J.A., 1997, Meta-analysis for environment-behaviour and
design research, Illuminated with a study of lighting level effects on office task
performance, Advances in Environment, Behaviour and Design, vol. 4 New York.

46
Govén T., 1997, Energy savings through improved lighting design and engineering,
Proceedings of the 4th European Conference on Energy-Efficient Lighting, Copenhagen,
Denmark. pp. 17-22.
Gustavsson M., Ellegard A., 2004, The impact of solar home systems on rural livelihoods -
Experiences from the Nyimba Energy Service Company in Zambia, Renewable Energy,
Volume 29, Issue 7, pp 1059-1072.
Haitz R., 2001, Another Semiconductor Revolution: This Time it’s Lighting, Proceedings
of 9th International Symposium on the Science and Technology of Light Sources, Ithaca,
NY, USA.
Halliday D. I., Craine S., Upadhyaya M.R., and Halliday G.I., 2000, Light Up The World
– Nepal Light Project and Everest, IEEE Canadian Review, vol. 36, pp. 14-18.
IEA, 2002, World Energy Outlook. IEA (International Energy Agency) Publications,
France.
IEA, 2006, Light’s Labour’s Lost, IEA (International Energy Agency) Publications, France.
IPCC, 2007, Climate Change 2007: Mitigation of Climate Change, Intergovernmental
Panel on Climate Change Working Group III, Netherlands Environmental Assessment
Agency.
Jennings J.D., Rubinstein F.M., Bartolomeo D., Blanc S.L., 2000, Comparison of control
options in private offices in an advanced controls testbed, Journal of the Illuminating
Engineering Society, 29(2): pp. 39-60.
Jones R., Du J., Gentry Z., Gur I., Mills E., 2005, Alternatives to Fuel-Based Lighting in
Rural China. Proceedings of Right Light 6, Shanghai.
Kanaya S., Hashimoto K., and Kichize E., 1979, Subjective balance between general
colour rendering index, colour temperature, and illuminance of interior lighting, Proc.
CIE 19th Session (Kyoto), pp. 274-278.
Katzev R., 1992, The impact of energy-efficient office lighting strategies on employee
satisfaction and productivity, Environment and Behavior, Vol. 24, No. 6, pp. 759-778.
LUTW, 2006, http://www.lutw.org/about.htm , Accessed on 28th Dec, 2006.

47
Martinot E., Chaurey A., Lew D., Moreira J.R., and Wamukonya N., 2002, Renewable
Energy Markets In Developing Countries, Annual Review of Energy and Environment,
Vol. 27, pp. 309-348.
Mills E., 2002, Why we’re here: The $320-billion global lighting energy bill, Proceedings
of the 5th International Conference on Energy-Efficient Lighting, Nice, France, pp. 369-
385.
Mills E., 2005, The Specter of Fuel Based Lighting, Science, Vol. 308, No. 5726, pp.
1263-1264.
Moore T., Carter D.J., and Slater A.I., 2003, A qualitative study of occupant controlled
office lighting, Lighting Research and Technology, Vol. 35, No. 4, pp. 297-317.
Muck E. & Bodmann H.W., 1961, Die Bedeutung Des Beleuchtungsniveau Bei
Praktischer Sehtatigkeit, Lichttechnik, 13, 502.
Navigant (Navigant Consulting), 2002, U. S. Lighting Market Characterization Volume
I: National Lighting Inventory and Energy Consumption Estimate, Building
Technologies Program, US Department of Energy, Washington DC.
Novem (Netherlands Agency for Energy and the Environment), 1999, EU Green Light
Background Study (SAVE Programme), Study on European Green Light: Savings
Potential and Best Practices in Lighting Applications and Voluntary Programmes ,Version
3.
OIDA, 2002, The promise of Solid State Lighting for General Illumination: Light
Emitting Diodes and Organic Light Emitting Diodes, Optoelectronics Industry
Development Association, Washington DC.
Rea M.S., 2000, Lighting handbook (9th ed.), New York: The Illuminating Engineering
Society of North America.
Richards P., 2006, Renewable development: New strategies in rural electrification,
Renewable Energy World Magazine, July/August 2006.
Rolex, 2006, The Rolex Awards: cheap LED lighting, http://rolexawards.com/en/the-
laureates/daveirvinehalliday-home.jsp, Accessed on 28th Dec, 2006.
Shailesh KR., 2006, White LED Based Illumination Systems for Indian Villages,
LEUKOS, The Journal of the Illuminating Engineering Society of North America, Vol.
3, no. 2, pp. 167-173.

48
Stern N., 2006, Stern Review: The Economics of Climate change, HM Treasury, UK.
Tichelen P.V., Jansen B., Geerken T., Vanden Bosch M., VanHoof V., Vanhooydonck
L., Vercalsteren A., 2007, Preparatory Studies for Eco-design Requirements of EuPs,
Final Report Lot 8: Office lighting, Study for the European Commission DGTREN unit
D3.
Title24, 2007, California’s Energy Efficiency Standards for Residential and Non-
residential Buildings, http://www.energy.ca.gov/title24/, Assessed on 12th August, 2007.
UNDP, 2006, Expanding access to modern energy services: Replicating, Scaling Up and
Mainstreaming at the local level, United Nations Development Programme (UNDP)
Publication, USA.
Veitch J. A., & Newsham G. R., 1996, Determinants of lighting quality I: State of the
science, Paper presented at the 1996 Annual Conference of the Illuminating Engineering
Society of North America, Cleveland, OH.
Veitch J.A., & Newsham G. R., 1997, Lighting Quality and Energy-Efficiency Effects on
Task Performance, Mood, Health, Satisfaction and Comfort, Annual Conference of the
Illuminating Engineering Society of North America, Seattle.
Zahnd A., McKay K., 2005, Renewable Energy Resources for Improved, Sustainable
Livelihood A Case Study of a Holistic Community Development Project with a Remote
and Poor Mountain Village in the Nepal Himalayas, In proceedings of 6APRSCP (Asia
Pacific Roundtable for Sustainable Consumption and Production), Melbourne, AUS.