Energy Efficiency Training Week - International Energy … · Toolkit: Building ... Energy...
35
© OECD/IEA 2016 © OECD/IEA 2015 Energy Efficiency Training Week Where to start: Energy efficiency potential in buildings Buildings: Session 2 Buildings energy efficiency sessions done in partnership with: #EnergyEfficientWorld sustainable energy partnerships
Transcript of Energy Efficiency Training Week - International Energy … · Toolkit: Building ... Energy...

© OECD/IEA 2016 © OECD/IEA 2015
Energy Efficiency Training Week
Where to start: Energy efficiency potential in buildings
Buildings: Session 2
Buildings energy efficiency sessions done in partnership with:
#EnergyEfficientWorld
sustainable energy partnerships

© OECD/IEA 2016
1. Where to start: Understanding building energy use
2. Where to start: Energy efficiency potential in buildings
3. Toolkit: Building technologies for low energy buildings
4. Toolkit: Linking buildings energy efficiency policy to investments and finance
5. Toolkit: Building energy codes and standards
6. Toolkit: Building energy efficiency policies
7. What are the steps: Set targets and develop policies
8. Did it work: Evaluating the multiple benefits of energy efficiency in buildings
9. Did it work: Tracking progress with energy efficiency indicators
10. Energy Efficiency Quiz: Understanding energy efficiency in buildings
Energy Efficiency Training Week Buildings: Program
#EnergyEfficientWorld

© OECD/IEA 2016
Trainers: John Dulac and Adam Hinge
Purpose: To teach professionals in the emerging economies about basic fundamentals of the energy efficiency potential in buildings. This will include information on IEA’s scenarios analysis modelling.
Scenario: You have been asked to create new policies for energy efficient buildings. How do you determine where to start?
Energy Efficiency Training Week (Buildings) 2. Where to start: Energy efficiency potential in buildings
#EnergyEfficientWorld

© OECD/IEA 2016
Buildings Sector Energy Demand
Global buildings final energy consumption, 1990-2013
Source: IEA World Energy Statistics and Balances, 2015
Global building energy intensities have improved since 1990, but not enough to offset buildings sector growth.
0
50
100
150
200
250
300
350
0
20
40
60
80
100
120
140
1990 1995 2000 2005 2010 2013
kWh/m
2
EJ
Coal
Oil
Commercial heat
Electricity
Natural gas
Solar
Biofuels
Residential intensity
Non-residential
intensity

© OECD/IEA 2016 Source: IEA Energy Technology Perspectives 2016
Building Energy Outlook to 2050
Global buildings energy demand growth to 2050
#EnergyEfficientWorld
0
50
100
150
200
250
300
350
400
450
0
20
40
60
80
100
120
140
160
180
200
1990
1995
2000
2005
2010
2015
2020
2025
2030
2035
2040
2045
2050
Historic 6DS
Billion
m2
EJ
Heating Cooling Water Lighting
Cooking Appliances Other Floor area
Global building energy consumption could increase by 50% to 2050 without assertive energy efficiency action.
0
50
100
150
200
250
300
350
400
450
0
20
40
60
80
100
120
140
160
180
200
1990
1995
2000
2005
2010
2015
2020
2025
2030
2035
2040
2045
2050
Historic 6DS
Billion
m2
EJ
Heating Cooling Water Lighting
Cooking Appliances Other Floor area
0
50
100
150
200
250
300
350
400
450
0
20
40
60
80
100
120
140
160
180
200
1990
1995
2000
2005
2010
2015
2020
2025
2030
2035
2040
2045
2050
Historic 6DS
Billion
m2
EJHeating Cooling Water Lighting
Cooking Appliances Other Floor area
0
50
100
150
200
250
300
350
400
450
0
20
40
60
80
100
120
140
160
180
200
1990
1995
2000
2005
2010
2015
2020
2025
2030
2035
2040
2045
2050
Historic 6DS
Billion
m2
EJ
Heating Cooling Water Lighting
Cooking Appliances Other Floor area
0
50
100
150
200
250
300
350
400
450
0
20
40
60
80
100
120
140
160
180
200
1990
1995
2000
2005
2010
2015
2020
2025
2030
2035
2040
2045
2050
Historic 6DS
Billion
m2
EJ
Heating Cooling Water Lighting
Cooking Appliances Other Floor area
0
50
100
150
200
250
300
350
400
450
0
20
40
60
80
100
120
140
160
180
200
1990
1995
2000
2005
2010
2015
2020
2025
2030
2035
2040
2045
2050
Historic 6DS
Billion
m2
EJ
Heating Cooling Water Lighting
Cooking Appliances Other Floor area
0
50
100
150
200
250
300
350
400
450
0
20
40
60
80
100
120
140
160
180
200
1990
1995
2000
2005
2010
2015
2020
2025
2030
2035
2040
2045
2050
Historic 6DS
Billion
m2
EJ
Heating Cooling Water Lighting
Cooking Appliances Other Floor area
0
50
100
150
200
250
300
350
400
450
0
20
40
60
80
100
120
140
160
180
200
1990
1995
2000
2005
2010
2015
2020
2025
2030
2035
2040
2045
2050
Historic 6DS
Billion
m2
EJ
Heating Cooling Water Lighting
Cooking Appliances Other Floor area
0
50
100
150
200
250
300
350
400
450
0
20
40
60
80
100
120
140
160
180
200
1990
1995
2000
2005
2010
2015
2020
2025
2030
2035
2040
2045
2050
Historic 6DS
Billion
m2
EJ
Heating Cooling Water Lighting
Cooking Appliances Other Floor area

© OECD/IEA 2016
Buildings Sector Energy Demand
Over 85% of projected growth in building energy demand to 2050 is expected to occur outside the OECD.
OECD
Eurasia
Latin America
Middle East
Africa
Non-OECD Asia
Others
Share of Buildings Energy Growth
2013-2050
13%
6%
4%
8%
13%
54%
2%
22 22
30
19
21
Buildings Final Energy Demand in 2050 (PJ)
United
States
Europe Japan
(5.1)
Canada
(3.2)
15
14
Mexico
(1.3)
Other Latin
America (3.8)
Brazil
(2.4)
Middle East
Africa
Eurasia China
India Southeast
Asia
Global buildings energy demand growth in 2050
Source: IEA Energy Technology Perspectives 2016

© OECD/IEA 2016
Energy efficiency potential by sector
Source: IEA World Energy Outlook 2012
#EnergyEfficientWorld
Global Energy Efficiency Potential
80%+ of existing buildings efficiency potential remains untapped!

© OECD/IEA 2016 Source: IEA Energy Technology Perspectives 2016
Building Energy Savings Potential
Global buildings energy savings potential to 2050
#EnergyEfficientWorld
0
20
40
60
80
100
120
140
160
180
20019
90
1995
2000
2005
2010
2015
2020
2025
2030
2035
2040
2045
2050
Fina
l En
ergy D
eman
d (EJ)
Other (services)AppliancesCookingLightingWater heatingSpace coolingSpace heating
Buildings energy demand is cut by 1/3 in 2050 in the 2DS.
~60% of energy reductions coming from heating and cooling needs.
6DS
2DS

© OECD/IEA 2016
Building Emissions Pathways
Global emissions trajectories to 2050 (direct & indirect)
Source: IEA Energy Technology Perspectives 2016 #EnergyEfficientWorld
0
2
4
6
8
10
12
14
16
2015 2020 2025 2030 2035 2040 2045 2050
GtC
O2
6DS
Indirect savings(power sector)
Energy efficiency
Fuel switching
Renewables
2DS
Energy efficiency accounts for 1/3 of emissions reductions in buildings – supporting decarbonisation of the power sector.

© OECD/IEA 2016
Getting It Right from the Start
Typical lifetimes of energy consuming buildings stock and equipment
Source: IEA Buildings Code Policy Pathway 2013 #EnergyEfficientWorld

© OECD/IEA 2016
0
50
100
150
200
250
300
350
400
1990
1995
2000
2005
2010
2015
2020
2025
2030
2035
2040
2045
2050
Total Floo
r Area (billion
m2 )
New Stock (Compliant)
New Stock (Non-Compliant)
Refurbished Stock
Historic Stock
Total
Global residential floor area growth and opportunities
Assertive building codes for new buildings are critical.
0
50
100
150
200
250
300
350
400
1990
1995
2000
2005
2010
2015
2020
2025
2030
2035
2040
2045
2050
Total Floo
r Area (billion
m2 )
New Stock (Compliant)
New Stock (Non-Compliant)
Refurbished Stock
Historic Stock
Total
Building Envelope Efficiency
Source: IEA Energy Technology Perspectives 2016

© OECD/IEA 2016
0
50
100
150
200
250
300
350
400
1990
1995
2000
2005
2010
2015
2020
2025
2030
2035
2040
2045
2050
Total Floo
r Area (billion
m2 )
New Stock (Compliant)
New Stock (Non-Compliant)
Refurbished Stock
Historic Stock
Total
Global residential floor area growth to 2050 (6DS)
In a 6DS world, we would expect continued high levels of non-compliance in construction and marginal retrofits of existing stock.
Building Envelope Efficiency
Source: IEA Energy Technology Perspectives 2016

© OECD/IEA 2016
0
50
100
150
200
250
300
350
400
1990
1995
2000
2005
2010
2015
2020
2025
2030
2035
2040
2045
2050
Total Floo
r Area (billion
m2 )
New Stock (Compliant)
New Stock (Non-Compliant)
Refurbished Stock
Historic Stock
Total
Global residential floor area growth to 2050 (2DS)
In a 2DS world, far smaller levels of non-compliance and high levels of deep retrofits will contribute to significant energy reductions.
Building Envelope Efficiency
Source: IEA Energy Technology Perspectives 2016

© OECD/IEA 2016
0
0.01
0.02
0.03
0.04
0.05
0.06
0.07
0.08
2015
2020
2025
2030
2035
2040
2045
2050
Energy Savings (6D
S to 2
DS) by C
ontribution
(EJ)
Intensity Improvement
Equipment Efficiency
Technology Switching
Demand Efficiency
Technology Efficiency
Technology Choice
Example: lighting efficiency potential.
What are the right levers to drive building energy savings?
#EnergyEfficientWorld
Building Equipment Efficiency

© OECD/IEA 2016
Demand efficiency: building design and occupant behaviour can have considerable impact on energy consumption.
#EnergyEfficientWorld
Building Equipment Efficiency
0
1
2
3
4
5
6
1990
2000
2010
2020
2030
2040
2050
Average Ligh
ting
Deman
d Intensity
(kW
h/m
2 )
Historical
6DS
2DS
Source: Sage Electrochromics

© OECD/IEA 2016
#EnergyEfficientWorld
Building Equipment Efficiency
Source: US DOE 2012
Technology efficiency: many (if not most) energy efficient building technologies are already on the market. Additional gains for many technologies are promising.

© OECD/IEA 2016
0%
10%
20%
30%
40%
50%
60%
70%
80%
90%
100%
2015
2025
2035
2045
2025
2035
2045
2025
2035
2045
6DS 4DS 2DS
Equipm
ent Share (%
)
Halogen
LED
CFL
Fluorescent
Incandescent
Oil lamp
Technology choice: many (if not most) energy efficient building technologies are already on the market. Need the right policy/market signals to increase adoption
#EnergyEfficientWorld
Building Equipment Efficiency
Source: IEA Energy Technology Perspectives 2015

© OECD/IEA 2016
Energy efficiency potential
Looking for answers…
1. Why is it important to know the potential?
2. What is energy efficiency potential in buildings?
3. How big is it?
4. How to estimate it?
5. What are the challenges?
#EnergyEfficientWorld

© OECD/IEA 2016
(Scientist)
#EnergyEfficientWorld
© OECD/IEA 2016
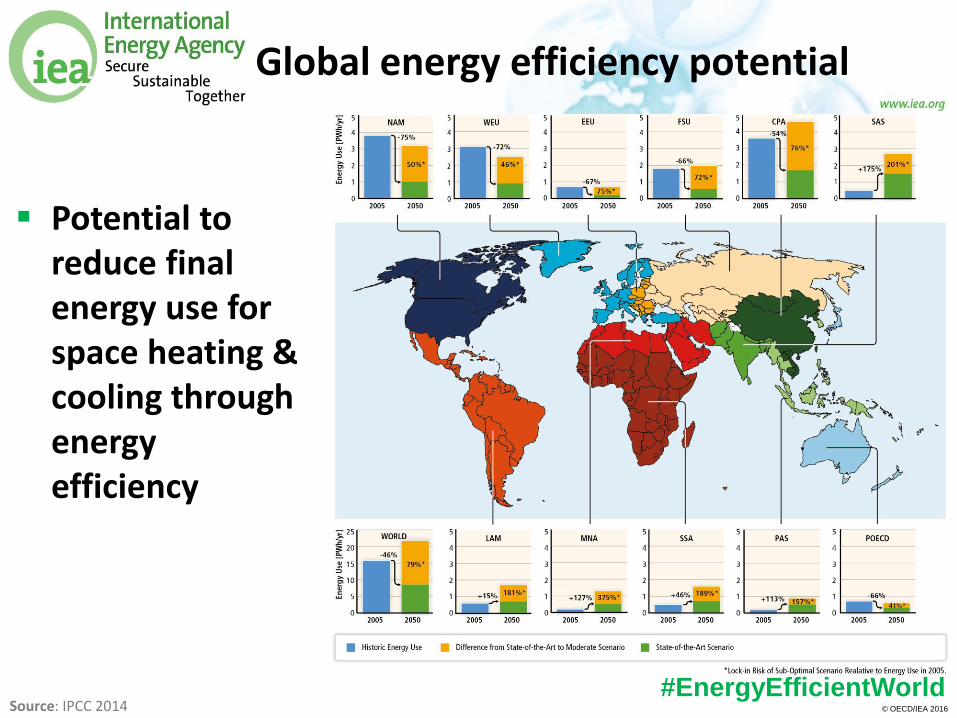
Potential to reduce final energy use for space heating & cooling through energy efficiency
Source: IPCC 2014 #EnergyEfficientWorld
Global energy efficiency potential

© OECD/IEA 2016
#EnergyEfficientWorld
Efficiency is not just technology
Source: Tianzhen Hong, Llawrence Berkeley National Lab, 2013
Occupant and Operator Behavior is critical: the impact of day to day comfort and building operations decisions can have a very dramatic impact on energy consumption

© OECD/IEA 2016
George E.P. Box
( Statistician)
#EnergyEfficientWorld

© OECD/IEA 2016
Energy efficiency potential modelling Building Energy Performance Scenarios
Source: GBPN
Free tool available for use globally from GBPN.
http://www.gbpn.org/databases-tools/mrv-tool/scenario-data-analysis
#EnergyEfficientWorld
© OECD/IEA 2016
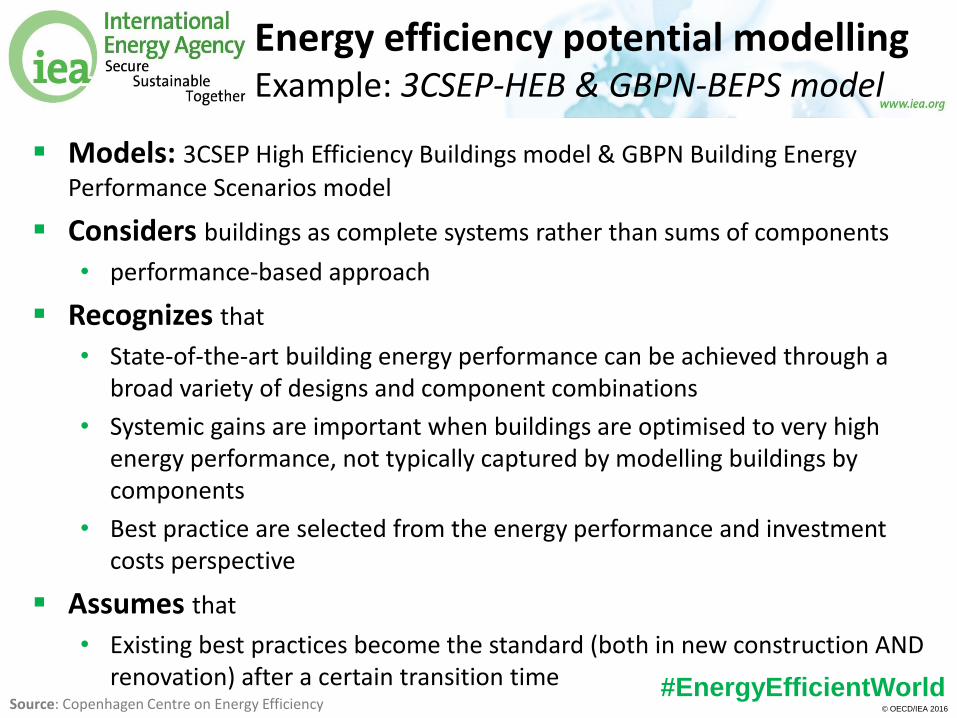
Energy efficiency potential modelling Example: 3CSEP-HEB & GBPN-BEPS model
Source: Copenhagen Centre on Energy Efficiency
Models: 3CSEP High Efficiency Buildings model & GBPN Building Energy
Performance Scenarios model
Considers buildings as complete systems rather than sums of components
• performance-based approach
Recognizes that
• State-of-the-art building energy performance can be achieved through a broad variety of designs and component combinations
• Systemic gains are important when buildings are optimised to very high energy performance, not typically captured by modelling buildings by components
• Best practice are selected from the energy performance and investment costs perspective
Assumes that
• Existing best practices become the standard (both in new construction AND renovation) after a certain transition time #EnergyEfficientWorld

© OECD/IEA 2016
Energy efficiency potential modelling Example: Modeling logic for 3CSEP-HEB
Source: Copenhagen Centre on Energy Efficiency
#EnergyEfficientWorld

© OECD/IEA 2016
Energy efficiency potential modelling Example: Uses of 3CSEP-HEB
Source: Copenhagen Centre on Energy Efficiency
2007 - 2011 2011 - 2012 2012 - 2014
#EnergyEfficientWorld

© OECD/IEA 2016
Where do I start?
A few key questions…
Do you have data on energy consumed in residential buildings vs. non-residential?
Do you have data on the overall floor area stock, and annual new additions to the stock?
What portion of building energy is used in urban areas vs rural areas?
#EnergyEfficientWorld

© OECD/IEA 2016
#EnergyEfficientWorld
Building Stock Accounting
Example building stock accounting, Turin (Italy)
0
60
120
180
240
300
360
420
480
0
2
4
6
8
10
12
14
16
Pre
-19
60
19
60
-80
19
80
-20
05
20
05
-14
Pre
-19
60
19
60
-80
19
80
-20
05
20
05
-14
Pre
-19
60
19
60
-80
19
80
-20
05
20
05
-14
Pre
-19
60
19
60
-80
19
80
-20
05
20
05
-14
Multifamily high-rise Multifamily low-rise Single family attached Single family detached
kWh
/m2
Mill
ion
m2 Building
stock
Heatingintensity
Source: IEA Energy Technology Perspectives 2016

© OECD/IEA 2016
What is your building stock, and how is it changing?
Key questions…
Where is the most energy consumption? Residential? Urban?
What sectors are growing most rapidly?
Do you see big increases in certain end-uses (air-conditioning)?
#EnergyEfficientWorld

© OECD/IEA 2016
Data Quality
For good policy making, valid data is critical:
1. How good is energy consumption data?
2. Building stock and floor area data?
3. End-use estimates?
#EnergyEfficientWorld

© OECD/IEA 2016
#EnergyEfficientWorld
What portion of total (final) energy use is consumed in buildings?
Source: IEA World Energy Balances and Statistics, 2015
Buildings Share of Final Energy Consumption, 2013
Industry, 37%
Transport, 27%
Other, 6% Coal, 4%
Oil, 10%
Natural Gas, 21%
Electricity, 29%
Commercial Heat, 5%
Renewables, 31%
Buildings, 30%

© OECD/IEA 2016
#EnergyEfficientWorld
Of total building energy consumption, what portion residential? Non-residential?
Source: IEA Energy Technology Perspectives 2016
Residential & Non-Residential Building Energy Use, 2013
30%
2%
20%4%
33%
11%
Residential, 89 EJ
Space heating Space cooling Water heating Lighting Cooking Appliances Other
44%
10%
12%
12%
22%
Non-Residential, 35 EJ

© OECD/IEA 2016
#EnergyEfficientWorld
What fraction of buildings in your country are in urban areas? Rural areas?
Source: IEA Energy Technology Perspectives 2016
Urban vs. Non-Urban Buildings Energy Demand
0
20
40
60
80
100
120
140
19
90
19
91
19
92
19
93
19
94
19
95
19
96
19
97
19
98
19
99
20
00
20
01
20
02
20
03
20
04
20
05
20
06
20
07
20
08
20
09
20
10
20
11
20
12
20
13
20
14
20
15
EJ
Non-Urban Buildings
Urban Non-Residential
Urban Residential

© OECD/IEA 2016
Scenario
You have been asked to create new policies for energy efficient buildings.
How do you determine where to start?

© OECD/IEA 2016 © OECD/IEA 2015
Discussion
#EnergyEfficientWorld