Energy efficiency of Industrial Utilities-Pratap Jung Rai
40
Energy Efficiency of Industrial Utilities 1 1. ENERGY EFFICIENCY OF INDUSTRIAL UTILITIES 1.1 Introduction Increasing Energy Efficiency is the quickest and least costly way of addressing energy security, economic and environmental challenges. Energy cost is one of the major components in an industry operation which carries utmost cost in industries run. With the advantages of energy efficiency practices and technologies, it is possible to cut down energy cost significantly in the industries without reducing the productivity of industrial utilities. An energy audit (Energy Efficiency) is an inspection, survey and analysis of energy for energy conservation in an industry, building, process or system to reduce the amount of energy input to the system without negatively affect the output. Industrial Energy Audit is fundamental to a comprehensive energy management programme and is defined in EC Act 2001 as follows: “Energy Audit means the verification, monitoring and analysis of use of energy including submission of technical report containing recommendations for improving energy efficiency with cost benefit analysis and an action plan to reduce energy consumption.” An Energy Audit is a package of services that delivers the following benefits to customers: a) Increase the goodwill of industries which will raise the health, comfort, safety and prolong the durability of the property. b) It helps to protect the environment by reducing unnecessary waste, carbon footprint and pollution. c) Undergone awareness regarding energy usage and conservation energy opportunities. 1.2 Objectives of Energy Efficiency of Industrial Utilities Saving of unnecessary energy consumption is a kind of energy generation, there are several objectives which is as follows: To minimize energy costs/waste without affecting production and quality. Minimize energy, production costs and utilities related risk. To achieve and maintain optimum energy procurement and utilization, throughout the industry. Enhance environmental performance and minimize greenhouse gas emissions. Reduce exposure to rising energy prices and energy shortages. Improve reputation with customers, government and public. 1.3 Methodology Study Area and Field Study The Study Area of this research paper is Energy Efficiency of Industrial Utilities. Most of the study of industrial utilities was conducted in Unilever Nepal Limited, Hetauda, Makwanpur. Ganga Soap and Chemical Pvt. Ltd. And National Soap Industries Pvt. Ltd. Hetauda, Makwanpur in three month OJT period. Where most of the energy efficiency of industrial utilities technique was known such as Electric motors, Boiler, Pumps and Pumping system, Compressor and Compressed Air System. And some utilities such as HVAC system was conducted in Nepal Telecom, Chhauni, Kathmandu. And furnace in Thapathali Campus, Thapathali under the guidance of Exports. Using following procedure I was prepared my research paper: Communication with Energy Audit Exports
-
Upload
pratap-jung-rai -
Category
Engineering
-
view
216 -
download
1
Transcript of Energy efficiency of Industrial Utilities-Pratap Jung Rai

Energy Efficiency of Industrial Utilities
1
1. ENERGY EFFICIENCY OF INDUSTRIAL UTILITIES
1.1 Introduction
Increasing Energy Efficiency is the quickest and least costly way of addressing energy security,
economic and environmental challenges. Energy cost is one of the major components in an industry
operation which carries utmost cost in industries run. With the advantages of energy efficiency
practices and technologies, it is possible to cut down energy cost significantly in the industries
without reducing the productivity of industrial utilities.
An energy audit (Energy Efficiency) is an inspection, survey and analysis of energy for energy
conservation in an industry, building, process or system to reduce the amount of energy input to the
system without negatively affect the output. Industrial Energy Audit is fundamental to a
comprehensive energy management programme and is defined in EC Act 2001 as follows:
“Energy Audit means the verification, monitoring and analysis of use of energy including
submission of technical report containing recommendations for improving energy efficiency with
cost benefit analysis and an action plan to reduce energy consumption.”
An Energy Audit is a package of services that delivers the following benefits to customers:
a) Increase the goodwill of industries which will raise the health, comfort, safety and prolong
the durability of the property.
b) It helps to protect the environment by reducing unnecessary waste, carbon footprint and
pollution.
c) Undergone awareness regarding energy usage and conservation energy opportunities.
1.2 Objectives of Energy Efficiency of Industrial Utilities
Saving of unnecessary energy consumption is a kind of energy generation, there are several
objectives which is as follows:
To minimize energy costs/waste without affecting production and quality.
Minimize energy, production costs and utilities related risk.
To achieve and maintain optimum energy procurement and utilization, throughout the
industry.
Enhance environmental performance and minimize greenhouse gas emissions.
Reduce exposure to rising energy prices and energy shortages.
Improve reputation with customers, government and public.
1.3 Methodology
Study Area and Field Study
The Study Area of this research paper is Energy Efficiency of Industrial Utilities. Most of the study
of industrial utilities was conducted in Unilever Nepal Limited, Hetauda, Makwanpur. Ganga Soap
and Chemical Pvt. Ltd. And National Soap Industries Pvt. Ltd. Hetauda, Makwanpur in three
month OJT period. Where most of the energy efficiency of industrial utilities technique was known
such as Electric motors, Boiler, Pumps and Pumping system, Compressor and Compressed Air
System. And some utilities such as HVAC system was conducted in Nepal Telecom, Chhauni,
Kathmandu. And furnace in Thapathali Campus, Thapathali under the guidance of Exports. Using
following procedure I was prepared my research paper:
Communication with Energy Audit Exports

Energy Efficiency of Industrial Utilities
2
The study had been conducted and research paper was prepared under the direct communication
with Energy Efficiency related Exports; Prof. Dr. Govinda Raj Pokharel, Executive Director of
Alternative Energy Promotion Center, Khumaltar, Kathmandu. Mr. Sanjaya Kumar Yadav,
Electrical Officer, UNL. Mr. Ramesh Yadav, Technical Executive, UNL. Er. Sanjeev Pudasaini,
Technical Officer, UNL, Mr. Shambhu Yadav, HOD of Industrial Engineering, Thapathali Campus
(Trainee of Trainers for energy audit) and Er. Govinda Tiwari, Consultant, SEED Nepal.
Internet and senior reports
Factual data of industrial utilities and its energy consumption scenario, energy losses and core
subject of industrial utilities are taken through internet. And format and some data are taken place
from energy efficiency related senior reports.
Books and energy related newspaper
Most of the calculation parts are extracted from Text Book of Energy Audit, Energy Efficiency
Guide for Industry in Asia, UNEP report. Bureau of Energy Efficiency, India. And Energy
efficiency related newspapers.
1.4 Scope of research on Energy Efficiency of Utilities of Industry
The following are the research areas envisaged under Research paper on “Energy Efficiency of
Basic Utilities of Industry” where includes only the basic industrial utilities of energy performance
assessment.
To calculate the energy performance assessment of industrial utilities.
To know how about the basic parameters of energy efficiency of industrial utilities.
To know condition of industrial utilities energy consumption.
To know the efficiency of industrial utilities.
Identify the financial analysis of industrial utilities and its cost benefit analysis.
1.5 Energy Consumption Scenario of Nepalese Industries
In different parts of Nepal, there are different kinds of industries are running which is shown in fig
(a) (location vs % of industries) and these industries have been using different types of fuel for
different industrial purpose. Which is given in pie chart, the coal is highest amount consumable
fuel; 58.7% and L diesel is least amount consumable fuel; 0.1%.
According to census of manufacturing establishments Nepal 2006-2007 based on number of
establishments of main energy consuming sectors data shows that potential energy consuming
Industrial Energy Consumption by Fuel type 2008/2009 (Source: DOI 2009/10; DCSI 2009/10), Total final energy consumption 13.4 MGJ

Energy Efficiency of Industrial Utilities
3
districts are Parsa, Sunsari, Rupandehi, Bara and Morang consumes 7.76%, 7.37%, 7.21%, 6.59%
and 6.15% respectively.

Energy Efficiency of Industrial Utilities
4
Fig. (a) location vs % of industries
Are there efficient uses of energy sources (fuel)? How much efficient uses of energy sources? These are the most important questions for
different energy users to know the condition of energy consumption. To know how about the condition of energy consumption and condition
of industrial utilities, Energy audit of industrial utilities is indispensible assessment to know the condition of energy consumption and
condition of industrial utilities. Only Industries can improve their energy consumption through perfect energy audit.
Kathmandu,13.93%
Bhaktapur,3.84%
Lalitpur,5.47%
Kanchanpur,2.89%
Morang,8.46%
Jhapa,3.98% Parsa,6.36%
Rupandehi,6.33%
Sunsari,6.28%
Bara,5.41%
Kaski,4.12%
Kailali,3.31%
Chitwan,2.89%
Banke,2.72%
Nawalparasi,2.13%
Dang,1.51%
Kapilbastu,1.49% Makwanpur,1.60%
Saptari,1.74%
Dhanusha,1.93%
Main Manufacturing Industry Distribution in the Country (Source: www.doind.gov.np)
100 % = 3446 Industry Establishments Source: Census of Manufacturing Establishments Nepal 2006-2007

Energy Efficiency of Industrial Utilities
5
1.6 Methodology of Energy Audit of Industries (Source: UNEP)
Basically Industries can improve their energy efficiency through a 6-step Cleaner Production approach.
The ultimate purpose is to keep improving energy efficiency, and this methodology can help companies
do this. But the methodology should be applied flexibly and depending on the company’s situation,
because each company is different: country, sector, size, organizational structure, production processes,
existing energy management systems, and so on.
There are basic steps to carry out energy audit inside the industries
task 6a: Prepare proposal to continue with energy efficiency for top management approval
Step 6: Continuous Improvement
task 4a: Technical, economic and environmental evaluation of options
task 4b: Rank feasible options for implementation
task 4c: Prepare implementation and monitoring proposal for top management approval
Step 4: Feasibility Analysis of Options
task 5a: Implement options and monitor results
task 5b: Evaluation meeting with top management
Step 5: Implementation and Monitoring of Options
task 1a: Meeting with top management
task 1b: Form a Team and inform staff
task 1c: Pre-assessment to collect general information
task 1d: Select focus areas
task 1e: Prepare assessment proposal for top management approval
Step 1: Planning and Organization
task 2a: Staff meeting and training
task 2b: Prepare focus area flow charts
task 2c: Walkthrough of focus areas
task 2d: Quantify inputs and outputs and costs to establish a seline
task 2e: Quantify losses through a material and energy balance
Step 2: Assessment
task 3a: Determine causes of losses
task 3b: Identify possible options
task 3c: Screen options for feasibility analysis
Step 3: Identification of Options

Energy Efficiency of Industrial Utilities
6
1.7 Types of Energy Audit and Approach
The type of energy audit to be performed depends on the type of industry, the depth to which Final
Audit is needed, and the potential and magnitude of cost reduction desired. Type of energy audit chosen
depends on:
Function and type of industry
Depth to which final audit is needed
Potential and magnitude of cost reduction desired
Types of energy audit
1) Preliminary energy audit
2) Targeted Energy Audit
3) Detailed energy audit
1) Preliminary Energy Audit
Shortly, called Walk-Through Audit, screening audit and Diagnostic Audit. it is a relatively quick
exercise and uses existing, or easily obtained data. The walk-through audit, as its name implies, is a tour
of the facility to visually inspect each of the energy using systems.it includes an evaluation of energy
consumption data analyze energy use quantities and patterns as well as provide comparison to industry
averages or benchmarks for similar facilities. It is least costly audit but can yield a preliminary estimate
to saving potential and provide a list of low cost saving opportunities via improvements in operational
maintenance practices.
1) Targeted Energy Audit
It often results from preliminary audits. They provide data and detailed analysis on specified target
projects. For example, industries may target its lighting system or boiler system or steam system or
compressed air system with a view of effecting energy savings. Targeted audits therefore involve
detailed surveys of the target subjects and analysis of the energy flows and cost associated with the
targets. Final outcome is the recommendations regarding actions to be taken.
2) Detailed Energy Audit
It is a comprehensive audit and results in a detailed energy project implementation plan for a facility,
since it accounts for the energy use of all major equipment. It considers the interactive effects of various
projects and offers the most accurate estimate of energy saving and cost. Ti includes detailed energy
cost saving calculations and project implementation costs. One of the key elements in a detailed energy
audit is the energy balance. This is based on an inventory of energy-using systems, assumptions of
current operating conditions, measurements and calculations of energy use.
Detailed energy auditing is carried out in three phases
o Pre-audit Phase
o Audit Phase
o Post-Audit
A comprehensive ten step methodology for conducting detailed energy audit is suggested as follows.
However, methodology is flexible and can be adapted depending upon company’s situation, because
each company is different: country, sector, size, organizational structure, production processes, existing
energy management systems, and so on.

Energy Efficiency of Industrial Utilities
7
Ten Steps Methodology for Detailed Audit
Step Plan of Action Purpose/ Results
1 Phase I –Pre Audit Phase
Plan and organise
Walk through Audit
Informal Interview with
Energy Manager, Production /
Plant Manager
Resource planning, Establish/organize an Energy audit
team
Organize Instruments & time frame
Macro Data collection (suitable to type of industry.)
Familiarization of process/plant activities
First hand observation & Assessment of current level
operation and practices
2 Conduct of brief meeting /
awareness programme with all
divisional heads and persons
concerned (2-3 hrs.)
Building up cooperation
Issue questionnaire for each department
Orientation, awareness creation
3 Phase II –Audit Phase
Primary data gathering,
Process Flow Diagram, &
Energy Utility Diagram
Historic data analysis, Baseline data collection
Prepare process flow charts
All service utilities system diagram (Example: Single
line power distribution diagram, water, compressed air
& steam distribution.
Design, operating data and schedule of operation
Annual Energy Bill and energy consumption pattern
(Refer manual, log sheet, name plate, interview)
4 Conduct survey and
monitoring
Measurements :
Motor survey, Insulation, and Lighting survey with
portable instruments for collection of more and accurate
data. Confirm and compare operating data with design
data.
5 Conduct of detailed trials /
experiments for selected
energy guzzlers
Trials/Experiments:
- 24 hours power monitoring (MD, PF, kWh
etc.).
- Load variations trends in pumps, fan
compressors etc.
- Boiler/Efficiency trials for (4 – 8 hours)
- Furnace Efficiency trials
Equipments Performance experiments etc.
6 Analysis of energy use Energy and Material balance
Energy loss/waste analysis
7 Identification and development
of Energy Conservation
(ENCON) opportunities
Energy and Material balance & energy loss/waste
analysis
Identification & Consolidation ENCON measures
Conceive, develop, and refine ideas
Review the previous ideas suggested by unit personal
Review the previous ideas suggested by energy audit if
any
Use brainstorming and value analysis techniques
Contact vendors for new/efficient technology

Energy Efficiency of Industrial Utilities
8
8 Cost benefit analysis Assess technical feasibility, economic viability and
prioritization of ENCON options for implementation
Select the most promising projects
Prioritise by low, medium, long term measures
9 Reporting & Presentation to
the Top Management Documentation, Report Presentation to the top
Management.
10 Phase III –Post Audit phase
Implementation and Follow-up
Assist and Implement ENCON recommendation measures
and Monitor the performance
Action plan, Schedule for implementation
Follow-up and periodic review
(Reference: General Aspects of Energy Management and Energy Audit, Guide Book for National
Certification Examination for Energy Managers and Energy Auditors)
1.8 Monitoring Equipment for Energy Efficiency
Without monitoring equipments impossible to quantify the condition of Energy Efficiency of Industry,
building, process or systems so it plays vital role to determine and measure the actual operating
parameters of various utilities of industry and compare them with the design parameters to determine if
energy efficiency can be improved or leave them as is it. Parameters that are often monitored during an
energy assessment are:
Basic electrical parameters in AC & DC systems: current (I), voltage (V), power factor (PF),
active power (kW), reactive power (kVAr), energy consumption (kWh), maximum demand
(kVA), frequency (Hz), harmonics, etc.
Other non-electrical parameters: radiation, air and gas flow, liquid flow, emperature C) and
heat flow, revolutions per minute (RPM), noise and vibration, air velocity, dust concentration,
total dissolved solids (TDS), pH, moisture content, relative humidity, flue gas analysis (CO2,
O2, CO, SOx, NOx), combustion efficiency, etc.
Considering above parameter provides information for various monitoring equipment that are often used
during energy assessments in industry, namely as follows:
1. Electrical measuring instruments
2. Combustion analyzer
3. Thermometers
4. Manometers and Pitot tube
5. Water flow meters
6. Psychrometer
7. Tachometers / Stroboscopes
8. Leak detectors
9. Lux meters
10. Thermography
11. Smart Energy Meter
Under here the equipments for industrial utilities audit.

Energy Efficiency of Industrial Utilities
9
1 Electrical Measuring Instrument: it includes Clamp-on or power analyzers instrument which
actually measures the power, basically these instruments are applied on-line i.e. on running
motors without any need to stop the motors.
Clamp-on Meter
Clamp-on or power analyzers and are used to measure
main electrical parameters such as KVA, kW, PF, Hertz,
KVAr, Amps and Volts. Some of these instruments also
measure harmonics. Instant measurements can be taken
with hand- held meters, while more advanced ones
facilitates cumulative readings with print outs at specified
intervals.
2 Combustion Analyzer: it is used to measure the composition of flue gases after combustion
has taken place. Basically it measures the percentage of oxygen (O2), or carbon dioxide (CO2)
in the exit flue gases and it calculates the combustion efficiency if required.it usually used to
determine the composition of flue gases in the duct. The duct is the large piping arrangement of
rectangular configuration and is used to flush out the combusted gases to the chimney.
Fuel Efficiency Monitor
Normally, it measures oxygen and temperature of flue
gas. Calorific values of common fuels are fed into the
microprocessor which calculates the combustion
efficiency.
Fyrite
A hand bellow pump draws the flue gas sample into a
solution inside the fyrite. A chemical reaction changes the
liquid volume revealing the amount of gas. The
percentage oxygen or CO2 can be read from the scale.
The unique feature of the fyrite is that the absorbing fluid
is also used as the indicating fluid so that one vessel taken
the place of both measuring burette and absorption
pipette.
Combustion Gas Analyzer
It builds with chemical cells which measure various gases
such as CO2, CO, NOX, SOX etc. it quite flexible in what
must be measured depending on the requirements of the
users.
Basically, it has specific sensors sealed inside the
equipment that can be changed to measure the different
components in the gas. But because a maximum of two
sensors can be connected, only two or three parameters
can be measured at one time.

Energy Efficiency of Industrial Utilities
10
3 Thermometer: it is an instrument used to measure the temperature of fluids, surfaces or gases.
Basically, it is used to measure the thermal energy losses or to make a thermal energy balance.
Temperature measurements are taken for the audit of air conditioning units, boilers, furnaces,
steam system, waste heat recovery systems, heat exchanges etc. thermometers are classified as
contact thermometer or non-contact thermometers.
Contact Thermometer
It is simply thermometer which measures the temperature with
physically contact between the thermometer and the object of
which the temperature is determined. It consists of two
dissimilar metals, joined together at one end. The thermocouple
metal alloys are commonly available as wire. A thermocouple is
available in different combinations of metals or calibrations.
Non-contact or infrared
Thermometer
A non-contact or infrared thermometer allows the measurement
of temperatures without physical contact between the
thermometer and the object of which the temperature is
determined. The thermometer is directed at the surface and
immediately gives a temperature reading. This instrument is
useful for measuring hot spots in furnaces, surface temperatures
etc.
infrared thermometer calculates the amount of thermal radiation
emitted from the object and the amount of infrared energy
emitted by object, the object’s temperature can be determined.
4 Manometer: It is widely used instrument in energy audit for measuring the differential
pressure across two pints. In a duct carrying exhaust gases or air. The pressure differential is
then used to calculate the velocity of flow in the duct using the Bernoulli’s equation.
Manometer
Pitot Tube
Digital flexible membrane manometer is used for measuring
pressures in air ducts carrying exhaust flue gases or air from
fans and blowers.
To measure pressure in air pipes, manometers must be in
combination with a pitot tube.
Attach flexible rubber tubes to the ends of the pitot tube
Attach these two tube to the ends to the pitot tube
Make a 6 cm monitoring hole in the duct or pipeline
Insert the pitot tube into the monitoring hole.

Energy Efficiency of Industrial Utilities
11
5 Water flow Meter: A flow meter is an instrument used measure the linear, nonlinear, mass or
volumetric flow rate of liquid or a gas. There are many varieties of flow meters and having its
functioning of each model differs from the other. However the basic principle of all remains
same.
Ultrasonic Flowmeter
It is commonly used in dirty applications such as wastewater and
other dirty fluids and slurries which ordinarily cause damage to
conventional sensors. The basic principle of operation employs
the frequency shift (Doppler Effect) of an ultrasonic signal when
it is reflected by suspended particles or gas bubbles in motion.
Spring & Piston Flowmeter
Piston-type flow meters use an annular orifice formed by a
piston and a tapered cone. The piston is held in place at the base
of the cone (in the "no flow position") by a calibrated spring.
Scales are based on specific gravities of 0.84 for oil meters and
1.0 for water meters. Their simple design and the ease with
which they can be equipped to transmit electrical signal has
made them an economical alternative to rotameters for flow rate
indication and control.
6 Psychrometer: A psychrometer is a device used to measure relative humidity of a certain area.
The temperature difference between the dry bulb and wet-bulb temperatures is noted. Then
each is used on a chart to find the relative humidity of that temperature and area. A small
difference between the temperatures of the bulbs shows a high relative humidity coming from a
low evaporation rate. In dry air, evaporation happens faster showing a large difference in
temperature thus giving you a low relative humidity.
Psychrometer
A sling psyshrometer consists of two thermometers mounted
together with a handle. One measures dry bulb temperature and
other measures wet bulb temperature. When reading is to be
taken the psychrometer is whirled around. The water evaporates
from the wick, cooling the wet bulb thermometer. Then the
temperatures of both dry, more moisture evaporates from the
wick, cooling the wet-bulb thermometer more, so there is a
greater difference between the temperatures of the two
thermometers. By using these temperatures the humidity is
computed.
7 Tachometers / Stroboscopes: In any audit exercise speed measurements of for example
motors are critical as they may change with frequency, belt slip and loading. There are two
main types of speed measurement instruments: the tachometer and the stroboscope.
Tachometer
Stroboscope
A simple tachometer is a contact type instrument, which can be
used to measure speeds where direct access is possible.
Sophisticated and safer instruments to measure speed are non-
contact instruments, such as stroboscopes. A stroboscope is a
source of flashing light that can be synchronized with any fast,
repetitive motion so that a rapidly moving device seems to stand
still, or to move slowly.

Energy Efficiency of Industrial Utilities
12
8 Leak detector: As the name implies, ultrasonic leak detectors detect the ultrasonic sound of a
leak. You are probably familiar with the hissing sound a large leak makes. Smaller leaks also
emit a sound, however the frequency is too high for our ears to detect it. An ultrasonic leak
detector transforms the ultrasonic hissing sound to a sound that humans can hear, and thus
leads to the source of the leak. Basically it is used for detecting the leak of compressed air,
pneumatic system. Compressed air is one of the most expensive energy used in industries.
Leak Detector
Ultrasonic leak detectors are used to detect leaks of compressed
air and other gases which are normally not possible to detect
with the human ear. No leak detector will find every leak, every
time. It is often a combination of several available methods
which will insure the highest rate of success.
9 Lux Meter: Lux meters are used to measure illumination levels in offices, factories etc. most
of lux meter consists of a body, a sensor with a photo cell, and display panel. The sensor is
placed under the light source. The light that falls on the photo cell has energy, which is
transferred by the photo cell into electric current. The more light is absorbed by cell, the higher
the generated current. The meter reads the electrical current and calculates the approx. value of
either Lux or Foot candles. This is shown in display panel.
Lux Meter
A light sensitive cell measures the incident light and evaluates
that against the human daylight sensitivity curve. The resulting
value is the measurement result in lux. This works well but it
requires a different correction factor for every light spectrum.
10 Thermography: It is an instrument which is used to measure thermal energy radiation from
hot/cold surfaces of an object and provides input for assessing health of equipment and
predictive maintenance. This is remarkable instruments creates pictures of heat. They measure
infrared (IR) energy and convert the data to images corresponding to the temperature.
Thermal Imager
It consists thermal camera unit converts electromagnetic thermal
energy radiated from an object into electronic video signals.
These signals are amplified and transmitted via interconnected
cable to a display monitor where the resulting image is analyzed
and interpreted for hot/cold spots
11 Smart Energy Meter: It is an instrument which is referred to electric meter which keep
detailed statistics on usage, but it can be used for fuels or water applications as well performing
the same job.
Smart Energy Meter
Primary purpose of it is to provide information on how end users
use their electricity on a real-time basis. It helps to track the
electricity consumption and thus save both electricity and
money. It is advanced metering unit which can be controlled via
mobile or internet.

Energy Efficiency of Industrial Utilities
13
2. ENERGY EFFICIENCY OF INDUSTRIAL UTILITIES
2.1 BOILERS
A Boiler is an enclosed vessel that provides a means for combustion heat to be transferred to water unit
it becomes heated water or steam. The hot water or steam under pressure is then usable for transferring
the heat to a process. Water is a useful and inexpensive medium for transferring heat to a process. When
water at atmospheric pressure is boiled into steam its volume increases about 1,600 times, producing a
force that is almost as explosive as gunpowder. This causes the boiler to be equipment that must be
treated with utmost care.
Fuel
2.1.1 Objectives of Boiler performance Assessment
Objective of boiler performance assessment is to know how about condition of boiler using in industry
and documentation of improvement loophole opportunities of boiler through the calculation of
following headings.
Find out Boiler efficiency
Find out the evaporative ratio
Know about Fuel consumption scenario
2.1.2 Performance Evaluation of Boiler
The boiler efficiency and evaporation ratio reduces with time due to following causes:
1. Poor combustion
2. Heat transfer fouling
3. Poor operation and maintenance
4. Fuel quality
5. Water quality
So Energy/ heat balance helps us to identify avoidable and unavoidable heat losses. Boiler efficiency
tests help us to find out the deviation of boiler efficiency from the best efficiency and target problem
area for corrective action. Boiler combustion process can be described in the form of an energy flow
The boiler system comprises of: a
feed water system, steam system and
fuel system. The feed water system
provides water to the boiler and
regulates it automatically to meet the
steam demand. Various valves
provide access for maintenance and
repair. The steam system collects and
controls the steam produced in the
boiler. Steam is directed through a
piping system to the point of use.
Throughout the system, steam
pressure is regulated using valves
and checked with steam pressure
gauges. The fuel system includes all
equipment used to provide fuel to
generate the necessary heat. The
equipment required in the fuel
system depends on the type of fuel
used in the system.
Softeners
Boiler
Water
Deaertor
Vent
Pumps
Stack
Exhaust gas
Steam to
Process
Fuel
Chemical feed
Economizer
Blow Down
Separator
Vent
Fig: Schematic diagram of a Boiler Room

Energy Efficiency of Industrial Utilities
14
diagram. Meanwhile steam is generated from fuel it is transformed into various heat and energy losses
which is shown in fig below.
Fig: Energy balance Diagram of a Boiler
The heat balance is an attempt to balance the total energy entering a boiler against that leaving the boiler
in different forms. Basically energy losses can be divided into unavoidable and avoidable losses (excess
air, stack gas temperature, blow down, condensate, convection and radiation). Only avoidable energy
losses must be reduced.
Fig: Typical Losses from Coal Fired Boiler (Reference: UNEP)
2.1.3 Energy Efficiency Opportunities in Boiler
Energy efficiency opportunities related to combustion, heat transfer, avoidable losses, auxiliary power
consumption, water quality and blow down. The various energy efficiency opportunities in a boiler
system can be related to:
1) Stack temperature control
2) Feed water preheating using economizers
3) Combustion air pre-heating
4) Excess air control
5) Radiation and convection heat loss avoidance
6) Incomplete combustion minimization
7) Reduction of scaling and soot losses
8) Automatic blow down control
9) Reduction of boiler steam pressure
Heat loss due to moisture in fuel
Heat loss due to moisture in air
Heat loss due to unburnts in residue
Heat loss due to radiation & other
unaccounted losses
Heat in Steam
Heat loss due to dry flue gas
Heat loss due to steam in flue gas
12.7 %
1.0 %
73.8 %
1.7 %
8.1 %
0.3 %
2.4 %
Fuel 100 %
BOILER
Ash
and
Un
bu
rnt
part o
f fuel in
ash
Blo
w D
ow
n
Co
nvectio
n &
Rad
iation
Steam Output Fuel Input 100% + Air
Stack Gas + Unburnt Air

Energy Efficiency of Industrial Utilities
15
10) Proper boiler scheduling
Definitely, above opportunities help us to reduce the losses of boiler for enhancing the efficiency of
boiler.
2.1.4 Boiler Efficiency
Boiler efficiency is defined as “percentage of energy heat) input that is effectively useful in the
generated steam.”
There are two methods of assessing boiler efficiency:
1) The Direct Method: the energy gain of the working fluid (water and steam) is compared with the
energy content of the boiler fuel.
2) The Indirect Method: the efficiency is the difference between the losses and the energy input
1) The Direct Method Testing
This is simply input output method due to the fact that it needs only the useful output (steam) and the
heat input (fuel) for evaluating the efficiency.
Boiler Efficiency η) =
100 &
=
100
= ( – )
Example
Find out the efficiency of boiler by direct method with the data given below:
Type of boiler: Coal fired
Quantity of steam (dry) generated: 14 TPH
Steam pressure (gauge) / temp: kg cm g) C
Quantity of coal consumed: 2.75 TPH
Feed water temperature: C
GCV of coal: 4000 kcal/kg
Enthalpy of steam at 10 kg/cm2 pressure: 665 kcal/kg (saturated)
Enthalpy of feed water: 85 kcal/kg
Calculation
Boiler Efficiency η) =
100 = 73.81 %
Evaporation Ratio = 14 Tonne of steam/ 2.75 Tonne of coal = 5.09
2) Indirect Method Testing The efficiency can be measured easily by measuring all the losses occurring in the boilers. The
disadvantages of direct method can be overcome by this method, which calculates the various heat
losses associated with boiler.
Boiler Flue gas
Steam Output
Efficiency = 100 – (i + ii + iii + iv + v + vi + vii)
Air
Fuel Input, 100%
i. Dry Flue gas loss
ii. H2 loss
iii. Moisture in fuel
iv. Moisture in air
v. Fly ash loss
vii. Surface loss
vi. Unborn fuel loss
Energy Efficiency of Industrial Utilities
16
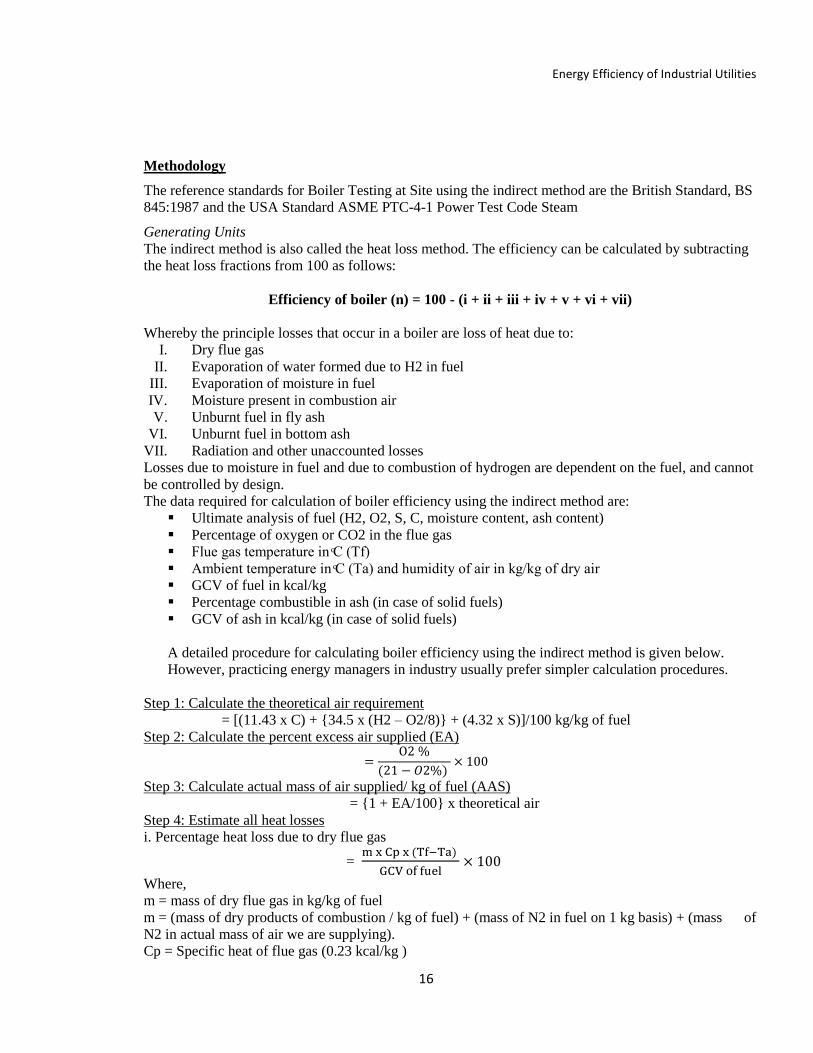
Methodology
The reference standards for Boiler Testing at Site using the indirect method are the British Standard, BS
845:1987 and the USA Standard ASME PTC-4-1 Power Test Code Steam
Generating Units
The indirect method is also called the heat loss method. The efficiency can be calculated by subtracting
the heat loss fractions from 100 as follows:
Efficiency of boiler (n) = 100 - (i + ii + iii + iv + v + vi + vii)
Whereby the principle losses that occur in a boiler are loss of heat due to:
I. Dry flue gas
II. Evaporation of water formed due to H2 in fuel
III. Evaporation of moisture in fuel
IV. Moisture present in combustion air
V. Unburnt fuel in fly ash
VI. Unburnt fuel in bottom ash
VII. Radiation and other unaccounted losses
Losses due to moisture in fuel and due to combustion of hydrogen are dependent on the fuel, and cannot
be controlled by design.
The data required for calculation of boiler efficiency using the indirect method are:
Ultimate analysis of fuel (H2, O2, S, C, moisture content, ash content)
Percentage of oxygen or CO2 in the flue gas
Flue gas temperature in C f)
Ambient temperature in C a) and humidity of air in kg kg of dry air
GCV of fuel in kcal/kg
Percentage combustible in ash (in case of solid fuels)
GCV of ash in kcal/kg (in case of solid fuels)
A detailed procedure for calculating boiler efficiency using the indirect method is given below.
However, practicing energy managers in industry usually prefer simpler calculation procedures.
Step 1: Calculate the theoretical air requirement
= [(11.43 x C) + {34.5 x (H2 – O2/8)} + (4.32 x S)]/100 kg/kg of fuel
Step 2: Calculate the percent excess air supplied (EA)
Step 3: Calculate actual mass of air supplied/ kg of fuel (AAS)
= {1 + EA/100} x theoretical air
Step 4: Estimate all heat losses
i. Percentage heat loss due to dry flue gas
=
Where,
m = mass of dry flue gas in kg/kg of fuel
m = (mass of dry products of combustion / kg of fuel) + (mass of N2 in fuel on 1 kg basis) + (mass of
N2 in actual mass of air we are supplying).
Cp = Specific heat of flue gas (0.23 kcal/kg )

Energy Efficiency of Industrial Utilities
17
ii. Percentage heat loss due to evaporation of water formed due to H2 in fuel
=
Where, H2 = percentage of H2 in 1 kg of fuel
Cp = specific heat of superheated steam (0.45 kcal/kg)
iii. Percentage heat loss due to evaporation of moisture present in fuel
Where,
M = Percent moisture in 1kg of fuel
Cp = Specific heat of superheated steam (0.45 kcal/kg)
iv. Percentage heat loss due to moisture present in air
=
Where,
Cp = Specific heat of superheated steam (0.45 kcal/kg)
v. Percentage heat loss due to unburnt fuel in fly ash
=
vi. Percentage heat loss due to unburnt fuel in bottom ash
=
vii. Percentage heat loss due to radiation and other unaccounted loss
The actual radiation and convection losses are difficult to assess because of particular emissivity
of various surfaces, its inclination, airflow patterns etc. In a relatively small boiler, with a capacity of 10
MW, the radiation and unaccounted losses could amount to between 1 percent and 2 percent of the gross
calorific value of the fuel, while in a 500 MW boiler, values between 0.2 percent to 1 percent are
typical. The loss may be assumed appropriately depending on the surface condition.
Step 5: Calculate boiler efficiency and boiler evaporation ratio
Efficiency of boiler (n) = 100 - (i + ii + iii + iv + v + vi + vii)
Evaporation Ratio = Heat utilized for steam generation/Heat addition to the steam
Evaporation ratio means kilogram of steam generated per kilogram of fuel consumed. Typical
Examples are:
Coal fired boiler: 5 (i.e. 1 kg of coal can generate 5 kg of steam)
Oil fired boiler: 13 (i.e. 1 kg of oil can generate 13 kg of steam)
However, the evaporation ratio will depend upon type of boiler, calorific value of the fuel and
associated efficiencies.
Example
The soap manufacture company uses the oil fire boiler, from the data measurement following data are
collected, calculate the boiler efficiency and evaporative ratio.

Energy Efficiency of Industrial Utilities
18
Type of boiler: Oil fired
Ultimate analysis of Oil
C: 84 %
H2: 12.0 %
S: 3.0 %
O2: 1 %
GCV of Oil: 10200 kcal/kg
% of O2 in flue gas by volume: 7%
% of CO2 in flue gas by volume: 11 %
Flue gas temperature (Tf): 220C
Ambient temperature (Ta): 27 C
Humidity of air : 0.018 kg/kg of dry air
Step-1: Calculate the theoretical air requirement
= [(11.43 x C) + [{34.5 x (H2 – O2/8)} + (4.32 x S)]/100 kg/kg of oil
= [(11.43 x 84) + [{34.5 x (12 – 1/8)} + (4.32 x 3)]/100 kg/kg of oil
= 13.82 kg of air/kg of oil
Step-2: Calculate the percent excess air supplied (EA)
Excess air supplied (EA)
= (O2 x 100)/(21-O2)
= (7 x 100)/(21-7)
= 50 %
Step 3: Calculate actual mass of air supplied/ kg of fuel (AAS)
AAS/kg fuel = [1 + EA/100] x Theo. Air (AAS)
= [1 + 50/100] x 13.82
= 1.5 x 13.82
= 20.74 kg of air/kg of oil
Step 4: Estimate all heat losses
i. Percentage heat loss due to dry flue gas
=
m = mass of CO2 + mass of SO2 + mass of N2 + mass of O2
0.84 x 44 0.03 x 64 20.74 x 77
m = ------------- +---- ---------- + --------------- (0.07 x 32)
12 32 100
m = 21.35 kg / kg of oil
21.35 x 0.23 x (220 – 27)
= ------------------------------- x 100
10200
= 9.29 percent
A simpler method can also be used: Percentage heat loss due to dry flue gas
=
m (total mass of flue gas) = mass of actual air supplied + mass of fuel supplied
= 20.19 + 1 = 21.19
21.19 x 0.23 x (220-27)
= ------------------------------- x 100
10200
= 9.22 %

Energy Efficiency of Industrial Utilities
19
ii. Heat loss due to evaporation of water formed due to H2 in fuel
=
where H2 = percentage of H2 in fuel
9 x 12 {584+0.45(220-27)}
= -------------------------------- =7.10%
10200
iii. Heat loss due to moisture present in air
=
= [20.74 x 0.018 x 0.45 x (220-27) x 100]/10200
= 0.317%
iv. Heat loss due to radiation and other unaccounted losses
For a small boiler it is estimated to be 2 percent
Step 5: Calculate boiler efficiency and boiler evaporation ratio
Efficiency of boiler (n) = 100 - (i + ii + iii + iv + v + vi + vii)
I. Heat loss due to dry flue gas : 9.29 percent
II. Heat loss due to evaporation of water formed due to H2 in fuel : 7.10 percent
III. Heat loss due to moisture present in air : 0.317 percent
IV. Heat loss due to radiation and other unaccounted losses : 2 percent
= 100- [9.29+7.10+0.317+2]
= 100 –18.421 = 81.58 % (approximate)
Evaporation Ratio = Heat utilized for steam generation/Heat addition to the steam
= 10200 x 0.83 / (660-60)
= 14.11 (compared to 13 for a typical oil fired boiler)
2.1.5 Findings
According to research, approximately 15% to 20% fuel consumption can be saved if
economizer used properly.
Approximately 26.2 % of heat losses in boiler while working condition in different headings.
Only 73.8 % of heat converts into steam.
Heat loss due to dry flue gas and heat loss due to steam in flue gas contributes highest degree of
losses in boiler operation.
Superheater can be used to increase temperature at constant pressure which access to maximize
the efficiency of boiler.
2.1.6 Recommendation
Here is an additional option which helps to improve efficiency and evaporation ratio of boiler:
Periodic tasks and checks outside of the boiler
Extra items for steam raising and hot water boilers
Boiler rooms and plant rooms ventilation should be proper for ventilation
Feed water always should be treated by chemical
Blow down (BD) procedure always applied while blow down
Always obey the SOP while operating boiler

Energy Efficiency of Industrial Utilities
20
2.2 FURNACE
A furnace is equipment used to melt metals for casting or to heat materials to change shape or
properties. Basically, furnace is device used to heat the materials.
2.2.1 Objectives of Furnace Performance Assessment
Objectives of furnace performance assessment are to find out the condition of furnace and energy
opportunities of furnace through following headings:
Find out various losses in furnace Find out the heat balance of furnace
Find out the efficiency of the furnace Find out the specific energy consumption
2.2.2 Performance Evaluation of Furnace
Due to the following causes efficiency and specific energy consumption of furnace is decreased with
time.
Provide low efficiency.
o Heat lost via exhaust gases
o Moisture and Hydrogen in fuel
o Heat loss via furnace walls and hearth
o Heat loss via radiation and convection from outer surface of wall
o Heat loss through gases leaking via cracks, opening of doors
Evaluating the furnace efficiency can be calculated from heat balance. Its efficiency can be calculated
after subtracting sensible heat loss in flue gas, heat loss due to opening of door, loss due to moisture in
flue gas, and other unaccounted losses from the heat input to the furnace.
Fig: Heat losses in Fuel Fired Furnace (Source: BEE)
Exhaust gas flue
Furnace
Chamber
Burner
Discharge
Door
Hearth Stock Charge
Door Fig: Industrial Heating Furnace
In furnace, flue gases come from
direct contact with the materials,
suitable fuel chosen is important. For
example, some materials will not
tolerate sulphur in the fuel. Solid
fuels generate particulate matter,
which will interfere the materials
placed inside the furnace, proper fuel
selection play vital role in every
aspect even in efficiency and specific
energy consumption.
Fuel Input 100% Useful heat in stock
(30-50%)
Wall lo
ss (3 -1
0 %
)
Flue lo
ss
20
-50
%
Op
enin
g loss
(1-2
%)
Co
olin
g loss (5
-
10
%)
Stored
heat (2
-
5 %
)
Oth
er
loss
Recycled heat (10-30%)
Furnace

Energy Efficiency of Industrial Utilities
21
There are many loopholes for heat losses of furnace so should be reduced to enhance the efficiency of
furnace.
2.2.3 Energy Efficiency Opportunities
There is various energy saving opportunities in furnaces. Typical energy efficiency measures for an
industry with furnace are:
1. Minimum refractory losses 2. Operation at the optimum furnace
temperature
3 Proper heat distribution 4. Reducing heat losses from furnace openings
5 Complete combustion with minimum excess air 6. Maintaining correct amount of furnace draft
7 Waste heat recovery from the flue gases 8. Selecting the right refractories
9 Optimum capacity utilization 10. Use of ceramic coatings
If above activities are clearly addressed in furnace operation, definitely efficiency of furnace can be
improved. Definitely, above opportunities help us to reduce the losses of furnace for enhancing the
efficiency of furnace.
2.2.4 Furnace Efficiency
A furnace’s efficiency increases when the percentage of heat that is transferred to the stock. he
efficiency of furnace is the ratio of useful heat output to heat input. The efficiency of the furnace can be
calculated in two ways; direct method and indirect method.
1) Direct Method:
The quantity of heat (Q) that will be transferred to stock can be calculated with this equation:
Q = m x Cp Δ i.e Δ =(t1
– t2)
Where, Q = Quantity of heat of stock in kCal
m = Weight of the stock in kg Cp= Mean specific heat of stock in kCal/kg
t1= Final temperature of stock in
t2= Initial temperature of the stock before it enters the furnace in
Example:
Suppose, A steel industry is using the continuous reheating furnace; heat input is 435 liters per hour.
The specific gravity of fuel is used to convert this into kg.
Therefore: 435 l/hr x 0.92 kg/l = 400 kg/hr, t1 = 1540
o
C & t2 = 37
o
C
The heat output is calculated as follows:
Q = m x Cp x Δ
= 6000 kg x 0.12 x (1540 – 37)
= 1082160 kCal
The efficiency is:
= (heat output / heat input) x 100
= [(1082160 / (400 x 10000)] x 100 = 27.054 %
The approximate heat loss is 100% – 27.054% = 72.946%
2) Indirect Method:
Calculate the efficiency of an oil-fired reheating furnace with the direct and indirect method using the data
below.
Operating temperature: 1340
Exit flue gas temperature after preheater: 750
Ambient temperature: 40

Energy Efficiency of Industrial Utilities
22
Preheated air temperature: 190
Specific gravity of fuel oil: 0.92
Average fuel oil consumption: 400 liters / hr = 400 x 0.92 =368 kg/hr
Calorific value of oil: 10000 kCal/kg
Average O2 percentage in flue gas: 12 %
Moisture in 1 kg of fuel oil: 0.15 kg
H2 in 1 kg of fuel oil: 0.1123 kg
Theoretical air required to burn 1 kg of oil: 14 kg
Weight of stock: 6000 kg/hr
Specific heat of billet: 0.12 kCal/kg/
Furnace wall thickness (D): 460 mm
Billet extraction outlet (X): 1 m x 1 m
Average surface temperature of heating + soaking zone: 122
Area of heating + soaking zone: 70.18 m2
Area other than heating and soaking zone: 12.6 m2
Average surface temperature of area other than heating and soaking zone: 80
The different heat losses are calculated below.
a) Heat loss in flue gas
= 12 / (21 – 12)
= 133 %
Mass of air supplied
= (1 + EA/100) x Theoretical air
= (1+ 1.13) x 14
= 32.62 kg/kg fuel oil
Mass of air supplied
= (1 + EA/100) x Theoretical air
= (1+ 1.13) x 14
= 32.62 kg/kg fuel oil
% Heat loss in flue gas =
Where,
m = weight of flue gas (air + fuel) = 32.62 + 1.0 = 33.62 kg/kg oil
Cp = specific heat
Δ = temperature difference
% Heat loss = {33.62 x 0.24 x (750 – 40)} x 100 = 57.29%
10000
b) Heat loss from moisture in fuel
% heat loss from moisture in fuel =
Where,
M = kg of moisture in 1 kg of fuel oil
f = Flue gas temperature C
amb= Ambient temperature C
GCV = Gross Calorific Value of fuel, kCal/kg
% Heat loss = 0.15 x {584 + 0.45 (750 – 40)} x 100 = 1.36%
10000

Energy Efficiency of Industrial Utilities
23
c) Loss due to hydrogen in fuel
Where,
H2 = kg of H
2 in 1 kg of fuel oil (= 0.1123 kg/kg of fuel oil)
% Heat loss = 9 x 0.1123 x {584 + 0.45 (750 – 40)} x 100 = 9.13%
10000
d) Heat loss due to openings in furnace
The factor of radiation through openings and the black body radiation factor can be obtained from standard
graphs.
Factor of radiation = 0.71
Black body radiation at 1340 0
C = 36 kCal/kg/cm2/hr
The area of the opening is 100 cm x 100 cm = 10000 cm2
Emissivity = 0.8
% Heat loss from furnace openings = 36 x 0.8 x 0.71 x 10000 x 100 = 5.56%
368 x 10000
e) Heat loss through furnace skin
To determine the heat loss through the furnace skin, first the heat loss through the roof and sidewalls and
through other areas must be calculated separately.
i). Heat loss through roof/ceiling and sidewalls (= heating and soaking zone):
Total average surface temperature = 122o
C
Heat loss at 122o
C (Refer Figure 14) = 1252 kCal /m2
hr
Total area of heating + soaking zone = 70.18 m2
Total heat loss i = 1252 kCal / m2
hr x 70.18 m2
= 87865 kCal/hr
ii) Heat lost from area other than heating and soaking zone
Total average surface temperature = 80 C
Heat loss at 80o
C (Refer Figure 14) = 740 kCal / m2
hr
Total area = 12.6 m2
Total heat loss ii = 740 kCal / m2
hr x 12.6 m2
= 9324 kCal/hr

Energy Efficiency of Industrial Utilities
24
% Heat loss through furnace skin = (87865 kCal/hr + 9324 kCal/hr) x 100 = 2.64%
10000 kCal/kg x 368 kg/hr
f) Unaccounted losses
The unaccounted losses cannot be calculated unless the other types of losses are known.
Furnace efficiency
Adding the losses gives the total losses:
a) Flue gas loss = 57.29 %
b) Loss due to moisture in fuel = 1.36 %
c) Loss due to H2 in fuel = 9.13 %
d) Loss due to openings in furnace = 5.56 %
e) Loss through furnace skin = 2.64 %
Total losses = (57.29+1.36+9.13+5.56+2.64) = 75.98 %
The furnace efficiency calculated through the indirect method = 100 – 75.98 = 24.02%
2.2.5 Findings
Only the 30-50% of energy is converted into usable heat.
Heat loss due to flue gas is utmost losses; 20-50% loss contributes by flue gas loss.
If proper insulation is used 3-7% of wall loss can be reduced.
Calorific value of furnace oil should be high regarding fuel cost
2.2.6 Recommendations
It is difficult to make a recommendation of general options for furnaces, because options to improve
energy efficiency vary between furnaces. But the main options that are applicable to most furnaces are:
Monitor O2 /CO2/CO and control excess air to the optimum level
Check against infiltration of air: use doors or air curtains
Retrofit with heat recovery device
Investigate cycle times and reduce
Provide temperature controllers
Ensure that flame does not touch the stock
Improve burner design, combustion control and instrumentation
Ensure that the furnace combustion chamber is under slight positive pressure
Use ceramic fibers in the case of batch operations
Match the load to the furnace capacity

Energy Efficiency of Industrial Utilities
25
2.3 ELECTRIC MOTORS AND VARIABLE DRIVES
An electric motor is an electromechanical device that converts electrical energy to mechanical energy.
Generally, electric motors are used in most industrial systems where mechanical energy is needed. It
converts electrical energy into rotary mechanical energy. This then is further converted to finally
provide the needed use-energy. That means it is ever one of the important component using in industries
to develop motion. Electric motors are sometime called “Inductive load” of industry because of it needs
some of the power which comes down the supply line temporarily to create magnetic field and
sometimes called the “work horses” of industry because it is estimated that motors use about % of the
total electrical load in industry. So that there are two important parameters one is efficiency and other is
power factor that should be addressed while executing energy audit of electric motors.
Inside industry, needed different mechanical energy for different works which is provided via electrical
motors that consumed more than 70 % of electric energy in different headings which is expressed in
above pie chart. If minimum-minimum amount of losses occurred in every headings become huge losses
in the whole electricity consumption which is unnecessary overhead of electricity consumption. But
proper utilization of different systems can be minimized the unnecessary electricity consumption.
2.3.1 Objectives of performance assessment of Electric motor and its drive
Only the objectives to electric motor assessment is to know how the condition of motors and motor
related devices and its energy consumption through following tests.
Efficiency test
No Load test
Stator and Rotor losses
Stray load losses
Motor Loading
Input power measurement
Line current measurement
Slip method
2.3.2 Energy Efficiency opportunities
There are several loophole or factors affecting electric motor performance, minimization of all these
factors may be the potential opportunities for energy efficiency of electric motors.
1 Reduce under-loading (and avoid over-sized motors) 2 Sizing to variable load
3 Replace standard motors with energy efficient motors 4 Rewinding
5 Power factor correction by installing capacitors 6 Improving maintenance
7 Reduce the under load condition 8 Improving power quality
9 Speed control of induction motor
Fig: Induction Motor
Fig: Share of different motor systems of total
electricity use by Industrial motor system

Energy Efficiency of Industrial Utilities
26
a) Multi-speed motors
b) Variable speed drives (VSDs)
c) Direct current drives (DC)
d) Wound rotor AC motor drives (slip ring induction motors)
There are different kinds of losses occurred in motor operation which is shown in below figure
Types of Losses in an Induction Motor (Source: Bureau of Energy Efficiency (BEE) India, 2004)
2.3.3 Terminology and definition
a) Motor speed The speed of a motor is the number of revolution in a given time frame, typically revolution per
minute (RPM). The speed of an AC motor depends on frequency of input power and the number of
poles for which the motor is wound,
The actual speed, with which the motor operates, will be less than the synchronous speed. The
difference between synchronous and full load speed is called slip and is measured in percent.
As part relation stated above, the speed of an AC motor is determined by the number of motor poles
and by the input frequency.
b) Power Factor
Power factor is relevant to AC transmission is given as: Cos𝞥 =
=
As the load on the motor comes down the magnitude of the active current reduces. However, there
is no corresponding reduction in the magnetizing current, which is proportional to supply voltage
with the result that the motor power factor reduces, with a reduction in applied load. Induction
motor, especially those operating below their rated capacity, is the main reason for low power factor
in electric system.
Reactive Power (KVAr) Total or real power (KVA)
Active Power (KW)

Energy Efficiency of Industrial Utilities
27
2.3.4 Assessment of Electric Motors
Efficiency of Eclectic Motor Testing
While input power measurements are fairly simple, measurement of output or losses need a laborious
exercise with extensive testing facilities. The following are the testing standards of widely used.
a) Field tests for Determining Efficiency
Efficiency of motor (𝜂) =
=
Where, Pout = Output power of the motor
Pin = Input power of the motor
P loss =Losses occurring in motor
Various losses in the motor are determined as follows:
No load Test:
The motor is run at rated voltage and frequency without any shaft load. Input power,
current, frequency and voltage are noted. The no load P.F is quite low and hence low PF
watt meters are required. From the input power, stator I2R losses under no load are
subtracted to give the sump of friction and windage (F&W) and core losses. To separate
core and F&W losses, test is repeated at variable voltages
Core losses =
Stator and Rotor I2 R losses:
The stator winding resistance is directly measured by a bridge or volt amp method. The
resistance must be corrected to the operating temperature. Tor modern motors, the operating
temperature is likely to be in the range of 100 to 120 and necessary correction should
be made. Correction to 75 may be inaccurate. The correction factor is given as follows:
=
Where, t1= ambient temperature t2= operating temperature
The rotor resistance can be determined from locked rotor test at reduced frequency, but
rotor I2R losses are measured from measurement of rotor slip.
Stary load loss:
These losses are difficult ot measure with any accuracy. IEEE satandard 112 gives a
complicated method, which is rarely used on shop floor. IS and IEC standards take a fixed
value as 0.5% of output. It must be remarked that actual value of stray losses is likely to be
more. IEEE-112 specifies values from 0.9 to 1.8%.
Motor Rating Stary Losses
1-125 HP 1.8%
126-500HP 1.5%
501-2499HP 1.2%
25000 and above 0.9%
b) Determining Motor Loading Input power measurements:
Step 1: Determine the input power using the following equation:
Pi =
Where,
Pi = Three phase power in kW I = RMS current, mean of 3 phases

Energy Efficiency of Industrial Utilities
28
V = RMS voltage, mean line to line of 3 phases PF = Power factor as a decimal
Step 2: Determine the rated power by taking the nameplate value or by using the following
equation:
Where,
Pr = Input power at full-rated load in kW HP = Nameplate rated horse power
𝜂r = Efficiency at full-rated load (name plate value or from motor efficiency tables)
Step 3: Determine the percentage load using the following equation:
Where,
Pr = Input power at full-rated load in kW Pi = Measured three phase power in kW
Load = Output power as a % of rated power
Example
The following power measurement observations were made for a 50 kW three phase induction
motor with 85% full load efficiency.
V = 420 Volt
I =32 Amp
PF = 0.87
Calculate the load
Calculation:
Input Power = (1.732 x 420 x 32 x 0.87)/1000 = 20.25 kW
% Loading = [20.25 /(50/0.85)] x 100 = 34.425 %
2.3.5 Findings
About 70% of electricity is consumed by only motor for different purpose.
As much as possible don’t use re-winded motor which efficiency is decreased under the 50 % to
60% efficiency if re-winding is carried out.
Always maintain PF more than 0.9 which saved the electric cost.
Stator loss is the main potential loss source which contributes 34% loss out of 7.6 % power loss
2.3.6 Recommendation
Here is a list of most important energy efficiency options for electric motors.
Maintain supply voltage level with a maximum deviation of 5% from the nameplate value.
Minimize phase unbalance within 1% to avoid derating of the motor.
Maintain high power factor by installing capacitors as close to the motor as possible
Select proper motor size to avoid inefficiencies and poor power factor
Use variable speed drives (VSD) or two-speed systems wherever applicable
Replace oversized, undersized and failed motors with energy efficiency motors
Get burnt out motors rewound by a qualified expert
Optimize transmission efficiency by proper installation and maintenance of shafts, belts, chains,
and gears
Control the ambient temperature to maximize insulation life and motor reliability, e.g. by
avoiding exposure to the sun, locating them in well-ventilated areas, and keeping them clean
Lubricate the motor according to manufacturers’ specifications and apply high-quality greases
or oils to prevent contamination with dirt or water.

Energy Efficiency of Industrial Utilities
29
2.4 PUMPS & PUMPING SYSTEM
Pump is the device that helps to transport the fluid from one point to another, transporting system called
pumping system is the process of addition of kinetic and potential energy to a liquid for the purpose of
moving it from one point to another. Basically under the Dynamic, positive displacement and others
types of pumps there are different kind of pumps are using in industry to transport. According to the US
DOE, survey on 4 pumping systems account for nearly % of the world’s electrical energy
demand and range from 25 – 50 % of the energy usage in certain industrial plant operation. Basically
installation of pumps in industry is two purposes for:
Transport of liquid from one point to another place
Circulate liquid around the system
Fig: Centrifugal pump Fig: Pump operating pint
Matching of the pumps to load plays the critical role for energy efficiency in pumping system. Wrong
selection of pumps and deposition in impellers decreases efficiency of pumps. Hence performance
assessment of pumps and pumping system should be done in order to take corrective action.
2.4.1 Objectives of Performance Assessment
Energy audit may help to determine the efficiency of pump during operating condition and saving of
unwanted overhead of pumping system. Not only this much it also helps to determine the system
resistance and operating duty point of the pump and compare the same with design.
2.4.2 Terms and Definition
Pump Capacity, Q = Volume of liquid delivered by pump per unit time, m3/hr or m3/sec. Q is
proportional to rotational speed of the pump
Total developed head, H = the difference of discharge and suction pressure. The pump head represents
the net work done on unit weights of a liquid in passing from inlet of the pump to the discharge of the
pump. There are two heads in common use in pumps namely:
1. Static head = difference in height between source and destination of the liquid
2. Friction head = this is loss due to friction in pipes, valves and fitting, joints varies as function of
capacity flow through the system.
System resistance: the sum of frictional head in resistance and total static head
Pump performance
curve Pump
operating point
System curve
Head
Flow
Static head

Energy Efficiency of Industrial Utilities
30
Pump Efficiency: Fluid power and useful work done by the pump divided by the power input in the
shaft.
2.4.3 Energy Efficiency Opportunities of pump and pumping system
There are several main areas for improving pumps and pumping systems efficiency and its energy
conservation. The main areas for energy conservation include:
1. Selecting the right pump 2. Controlling the flow rate by speed variation
2.1 Explaining the effect of speed
2.2 Using variable speed drive (VSD)
3. Pumps in parallel to meet varying demand 4. Eliminating flow control valve
4. Eliminating by-pass control 6. Start/stop control of pump
7. Impeller trimming
If the industry followed and addressed the above significant area for improving the pumping system and
Its efficiency. Finally, increases the machine productivity and decreases unnecessary energy
consumption
2.4.4 Difficulties of pumps assessment
In practice, it is more difficult to assess pump performance. Some important reasons are:
Absence of pump specification data
Difficulty in flow measurement
Improper calibration of pressure gauges and measuring instruments
2.4.5 Assessment of Pumps
The work performed by a pump is a function of the total head and of the weight of the liquid pumped in
a given time period. Pump shaft power (Ps) is the actual horsepower delivered to the pump shaft, and
can be calculated as follows:
=
Pump output, water horsepower or hydraulic horsepower (hp) is the liquid horsepower delivered by the
pump, and can be calculated as follows:
Where,
Q = flow rate (m3/sec) hd = discharge head (m)
hs = suction head (m) ρ = density of the fluid kg m3)
g = acceleration due to gravity (m/s2)
Example
A personal care industry operates a cooling water pump for process cooling and refrigeration
applications. During the performance testing the following operating parameters were measured.
Measured Data:
Pump flow (Q) = 0.52 m3/sec Power absorbed (P) = 380 kW
Suction head (tower basin level, h1) = +1 m Delivery head (h2) = 60 m
Height of cooling tower = 5 m Motor efficiency = 87 %
Type of drive = Direct coupled Density of water = 996 kg/m3

Energy Efficiency of Industrial Utilities
31
Solution
= 299.76 kW
𝜂
= 78.89 %
2.4.6 Findings
Almost 20% of electricity energy accounted out of world’s electrical energy demand and range
from 25 – 50 % of the energy usage in certain industrial plant operation. Fitting and bending are played vital role in pumping system losses.
Always addressed static loss and frictional loss that played vital role in efficiency.
For industrial purpose, most of the industry uses centrifugal pumps.
Selection of pumps depends upon requirement of quantity flow/hr.
2.4.7 Recommendations
Here is additional option to improve energy efficiency of pumps and pumping systems.
Operate pumps near their best efficiency point (BEP)
Ensure adequate Net positive suction head (NPSH) at site of installation
Modify pumping system and pumps losses to minimize throttling.
Ensure availability of basic instruments at pumps like pressure gauges, flow meters
Adapt to wide load variation with variable speed drives or sequenced control of multiple units
Avoid operating more than one pump for the same application
Use booster pumps for small loads requiring higher pressures
To improve the performance of heat exchangers, reduce the difference in temperature between
the inlet and outlet rather than increasing the flow rate
Repair seals and packing to minimize water loss by dripping
Balance the system to minimize flows and reduce pump power requirements
Avoid pumping head with a free-fall return (gravity), and use the siphon effect
Conduct a water balance to minimize water consumption, thus optimum pump operation
Avoid cooling water re-circulation in DG sets, air compressors, refrigeration systems, cooling
towers feed water pumps, condenser pumps and process pumps
In multiple pump operations, carefully combine the operation of pumps to avoid throttling
Replace old pumps with energy efficient pumps
T improve the efficiency of oversized pumps, install variable speed drive, downsize /replace
impeller, or replace with a smaller pump
Optimize the number of stages in multi-stage pump if margins in pressure exist
Reduce the system resistance by pressure drop assessment and pipe size optimization

Energy Efficiency of Industrial Utilities
32
2.5 COMPRESSOR AND COMPRESSED AIR SYSTEM
Most of the industrial plants are using compressed air throughout their production operation which is
produced by compressed air units ranging from 5 to over 50000 hp. So compressed air system is not
only an energy intensive utility but also one of the least energy efficient but compressed air is most
expensive energy source using in industries. Due to different causes like poor maintenance, wear and
tear etc. efficiency of compressed air drastically reduces with period of time. So a periodic performance
assessment is essential to minimize the cost of compressed air.
Fig: Cost components in a typical compressed air system (eCompressed Air)
From this above figure, only the minimum amount of energy is used for end use, most of the energy
converts into heat loss and there are many loopholes for effective cost saving.
2.5.1 Objectives of Compressor Performance Assessment
Objectives of compressor performance assessment are to identify about condition of compressor using
in industry and find out the potential opportunities of compressor and compressed air system.
Find out Volumetric efficiency
Find out Specific power requirement
Find out Actual Free Air Delivery (FAD) of compressor
Find out Isothermal power required
Find out compression ratio
The actual performance of the plant is to be compared with design/standard values for assessing the
plant energy efficiency. Under the Dynamic and positive displacement type of compressor there are
various types of compressor and different compressor performance opportunities.
Electricity
consumed by
compressor
Simple, cost effective measures 30% savings (Generation, Treatment, Distribution, Misuse)
Heat loss
Delivered compressed
air 10% approx..
Fig: Shauky Diagram for Compressed Air system (Source: Mckane and Medaris, 2003)

Energy Efficiency of Industrial Utilities
33
2.5.2 Energy Efficiency Opportunities
There are different opportunities which may be the potential insight strength for the minimization of
losses in Compressor and Compressed air system which are as follows:
1. Location of Compressor 2. Air Intake Temperature
3. Pressure drops in Air Filter 4. Elevation
5. Inter and after coolers 6. Pressure Setting
7. Minimizing leakage 8. Condensate Removal
9. Controlled Usage of Compressed 10.Compressor Controlled
11. Maintenance Practices
Strictly addressed the above opportunities, the efficiency of compressor and its air system can be
improved.
2.5.3 Assessment of Compressors and Compressed Air System
1. Capacity of a Compressor
The capacity of a compressor is the full rated volume of flow of gas compressed and delivered
under conditions of total temperature, total pressure, and composition prevailing at the compressor
inlet. It sometimes means actual flow rate, rather than rated volume of flow. This is also called free
air delivery (FAD)
Actual Free Air Delivery
Nm3/min
Where,
P2 = Final Pressure after filling (kg/cm2 a)
P1 = Initial Pressure (kg/cm2 a) after bleeding
P0 = Atmospheric Pressure (kg/cm2 a)
V = Storage volume in m3 which includes receiver, after coller, and delivery piping
T = Time take to build up pressure to P2 in minutes
The above equation is relevant where the compressed air temperature is the same as the ambient air
temperature, i.e., perfect isothermal compression. In case the actual compressed air temperature at
discharge, say t2 C is higher than ambient air temperature say t1 0C (as is usual case), the FAD is to
be corrected by a factor (273 + t1) / (273 + t2).
2. Compressor Efficiency
Under compressor efficiency there are different measures that compressor efficiency are commonly
used to measure compressor efficiency: volumetric efficiency, adiabatic efficiency, isothermal
efficiency and mechanical efficiency.
2.1 Free air delivered
Free air delivered Qf,
Where, = Flow coefficient as per IS D = Nozzle diameter M
= Absolute inlet temperature P1 = Absolute inlet pressure kg/cm2
P3 = Absolute pressure before nozzle kg/cm2 Ra = Gas constant for air 287.1 j/kg k
3 = Absolute temperature before nozzle k
P3-P4 = Differential pressure across the nozzle kg/cm2
2.2 Isothermal efficiency
Isothermal efficiency =

Energy Efficiency of Industrial Utilities
34
Isothermal power (kW) =
Where, P1 = Absolute intake pressure kg/ cm2
Q1= Free air delivered m3/hr.
r = Pressure ratio or compression ratio P2/P1
The calculation of isothermal power does not include power needed to overcome friction and
generally gives an efficiency that is lower than adiabatic efficiency. The reported value of efficiency
is normally the isothermal efficiency. This is an important consideration when selecting
compressors based on reported values of efficiency.
2.3 Volumetric Efficiency
Compressor Displacement =
Where D = Cylinder bore, meter L = Cylinder stroke, meter
S = Compressor speed rpm n = No. of cylinders
= 1 for single acting and
2 for double acting cylinders
For practical purposes, the most effective guide in comparing compressor efficiencies is the specific
power consumption, i.e. kW/volume flow rate, for different compressors that would provide
identical duty.
2.4 Specific power consumption at rated discharge pressure
Specific power consumption at rated discharge pressure =
Example
A FMCG Company is using the screw compressor for production operation. This has been following
Specification; calculate volumetric flow rate, isothermal efficiency, specific power requirement and
Actual Free air delivered.
Given, for Actual Free Air Delivered
Piston displacement = 16.88 m3/min
Theoretical compressor capacity = 14.75 m3/min
Receiver volume = 7.79 m3
Initial pressure (P1) = 0.5 kg/cm2
Final pressure (P2) = 7.03 kg/cm2
Atmospheric pressure (P0) = 1.026 kg/cm2 a
Compressor rated rpm 750 = 1445 motor rated rpm
Total volume = 8.332 m3
Compressor output (m3/min) =
= 13.739 m3/min
Capacity shortfall with respect to 14.74 m3/min rating is 1.011 m3/min i.e. 6.85%, which indicates
performance of compressor needs to be investigated further.
For Free air delivered, Given:
Flow coefficient (k) = 1 (assume) Nozzle diameter (d) = 0.08 meter
Receiver pressure (P2) = 3.5 kg/cm2 (a) Inlet pressure (P1) = 1.04 kg/cm2 (a)
Inlet air temperature (T1) = 303 k Pressure before nozzle (P3) = 1.08 kg/cm2
Temperature before nozzle (T3) = 313 k Gas constant (Ra) = 278 J/kg K
Motor input = 100 kW Motor and drive efficiency = 86 %

Energy Efficiency of Industrial Utilities
35
Compression ratio (r) =
= 3.36 Pressure drop across the nozzle (P3 – P4) = 0.036 kg/cm2
Compressor input power = 86 kW
Free air delivered = 1
= 0.384 m3/sec
= 1385.511 m3/hr
Now,
Isothermal power (kW) =
= 47.58 kW
Isothermal Efficiency =
=
= 55.32 %
And, specific power consumption =
=
= 0.0721 kW/m3/hr
2.5.4 Findings
Compressed air is most expensive energy among the industry.
Compressor only near about 10% of compressed air delivered and other energy is converted into
heat (i.e. heat losses)
According to research a pinpoint leakage of compressed air per year takes Rs. 1,12,000.
Piping system is played vital role for compressed air deliver losses.
Efficiency of compressor also depends up on altitude.
2.5.5 Recommendation
Here are recommendations help to enhance the efficiency of compressor
Reduction of the use of air hoists, and air motors.
Find and fix current compressed air leaks and try to prevent the same. Check for leaks and
pressure losses throughout the system regularly (monthly).
Avoid the improper, yet common practice of cracking drains in an effort to insure moisture free
performance at a particular point-of- use.
Shut off the air supply to "off- line" production equipment.
Ensure the entire system is monitored by good housekeeping practices.
Ensure condensation can be removed swiftly from the distribution network, or does not occur.
Check that receivers are sized to store air for short heavy demands.
Use high efficiency motors in place of standard motors.
Consider multiple staged compressors.
Understand the requirements for clean- up equipment.
Use the drying technology that gives you the maximum allowable pressure dew point.
Choose "best in class" products for all compressor parts in case of replacements.
Use waste heat off the compressor to help the rest of the plant save energy.
Avoid delivering higher pressure to the entire plant just to meet the requirements of one user.
Understand multiple compressor system controls.
Adopt a systematic preventive maintenance strategy for your compressor.

Energy Efficiency of Industrial Utilities
36
2.6 HVAC System
HVAC system is heating ventilation and Air conditioning system installed in factory for maintaining the
temperature as per required of system it consumes significant amount of energy which varies with load
change, season, operation and maintenance and ambient conditions etc. so its performance evaluation
should be take to extent possible all these factors. Here we only concerned in industrial HVAC system.
Fig: General Refrigeration cycle Fig: Schematic representation of refrigeration system
Refrigeration system is used in industry for chilling the products or preserving the products for long
time. Basically, Refrigeration systems are used in Dairy industry, Cold storage, brewery and shipping
the products. Air Conditioning system is also similar to the refrigeration system but some operationally
use of system is quite different. Air conditioning system is used to maintain temperature as required
quantity of system and it can be used for human comfort. Basically, HVAC systems are used in big
hotel, Tele communication and those industries which needed high temperature lift.
Basically in HVAC system comprises; Compression process, Condensation process, Expansion process
and Evaporation process. This system takes the compressor (for Vapour Compression Refrigeration
system) or absorber and generator (for vapour absorption refrigeration system) which consumes
significant amount of electricity compared to other system.
2.6.1 Objectives of HVAC system Assessment
The objective of HVAC system assessment is to verify the performance of HVAC system by using field
measurements. The test will measure net cooling capacity (TR) and energy requirements, at the actual
operating conditions. The objective of test is to estimate the energy consumption at actual load verses
design conditions.
2.6.2 Terminology and definition
a) Tons of refrigeration (TR): the amount of cooling obtained by one ton of ice melting in 24 hour:
210 kJ/min, 12000 Btu, 3.5 kW or 3024 kCal/hr.
b) Net Refrigerating Capacity: It is mass flow rate of the evaporator water multiplied by the
difference in enthalpy of water entering and leaving the cooler, expressed in kCal/h or TR.
c) Coefficient of Performance (COP): It is the ratio of heat extracted in the refrigerator to the work
done on the refrigerant. It refers to heating efficiency of an air conditioner.
d) kW/Tons rating: Commonly referred to as efficiency, but actually power input to compressor
motor divided by tons of cooling produced, or kilowatts per ton
e) Energy Efficiency Ratio (EER): performance of smaller chillers and rooftop units is frequently
measured in EER rather than kWton. EER is calculated by dividing a chiller’s cooling capacity in
watts) by its power input (in watts) at full-load conditions.
High Temperature Reservoir
Low Temperature
Reservoir
R
Work (W)
Condenser
Evaporator
H C
High pressure, Temperature side
Low pressure,
temperature side
Compressor
Expansion valve
Q1
Q2= Q1+W

Energy Efficiency of Industrial Utilities
37
2.6.3 Components of HVAC System
The various components of HVAC systems are
1) Chiller plant
a) Evaporator unit
b) Compressor unit
c) Condenser unit (air cooled/water cooled and condenser fan/cooling tower fan)
2) Air handling unit (with fans/blowers)
3) Primary and secondary chilled/cooling water pumps
2.6.4 Energy Efficiency Opportunities
There are many potential opportunities which help for energy conservation in HVAC system which is as
follows:
1. Optimization of Process Heat Exchangers 2. Maintenance of Heat Exchanger Surfaces
3 Multi-staging for Efficiency 4. Matching Capacity to System load
5 Capacity control and Energy Efficiency 6. Multi-level Refrigeration for Plant Needs
7 Chilled water storage 8 System Design Features
Strictly addressed the above actives energy conservation may enhance and increase the COP of
system with saving huge amount of capital.
2.6.5 Assessment of HVAC System
For executing the HVAC system assessment, at first establish the steady-state conditions then three sets
of data shall be taken, preferably at a minimum of five minute interval. To minimize the effects of
transient conditions, test readings should be taken simultaneously to the extent possible in all
components of HVAC system.
Performance evaluation of Refrigeration system:
1) Net Refrigeration Capacity (TR)= –
Where, Q = Mass flow rate of coolant in kg/hr
Cp = Coolant specific heat in kCal /kg
Ti = Inlet, temperature of coolant to evaporator (chiller) in
To = Outlet temperature of coolant from evaporator (chiller) in .
1 TR = 3024 kCal/hr heat rejected
2) Compressor Power (kW)
Power (kW) =
3) Heat rejected at the condenser
Heat rejected at condenser = cooling load + work done by compressor
Heat rejected (TR) = (Evaporator TR) +
Heat rejected (TR) =
The shaft power kW absorbed (work done) by the compressor can be derived by measuring the
motor input power multiplied by motor operating efficiency.
Heat rejected at condenser can be measured as under:
Water cooled condenser: measure the water quantity flow through condenser coil
Mc = Mass flow rate of cooling water, kg/hr

Energy Efficiency of Industrial Utilities
38
Cp = Coolant specific heat in kCal kg C
wi = Inlet, temperature of coolant to evaporator chiller) in C
wo = Outlet temperature of coolant from evaporator chiller) in C.
Air cooled condenser: measure the air quantity flow through the condenser coil
Heat rejected (TR) =
Ma = Mass flow rate of air, kg/hr
Cpa = Coolant specific heat of air, kCal kg C
ai = Inlet, temperature of cooling air in C
ao = Outlet temperature of cooling air in C.
Coefficient of Performance (COP) =
=
or
or
Where, Q1 = heat taken from evaporator (kJ/min)
Q2 = heat delivery to condenser (kJ/min)
W = work done (kJ/sec)
Te = Evaporator temperature in
c = condenser temperature in
Energy efficiency ratio (EER) =
Power per Ton (kW/ton) =
Performance Evaluation of Air Conditioning For air conditioning units, the airflow at the Fan Coil Units (FCU) or the Air Handling Units (AHU)
can be measured with an anemometer. Dry bulb and wet bulb temperatures are measured by
psychrometer at the inlet and outlet of the AHU or the FCU. While assessing AC performance
should be considered followings bullets:
Accuracy of flow and temperature measurements
Integrated part load value (IPLV)
Heat load (TR) =
Where, Q = the air flow in m3/h
= density of air kg/m3
hin = enthalpy of inlet air kCal/kg
hout = enthalpy of outlet air kCal/kg
Use of psychometric charts can help to calculate hin and hout from dry bulb and wet bulb
temperature values which are measured during trials by a whirling psychrometer. Power
measurements at compressor, pumps, AHU fans, cooling tower fans can be taken with a portable
load analyzer.
Example 1
Suppose, a brewery company planning to estimate the performance for an air conditioning system
which has direct expansion type air handling unit. As per given parameter calculate heat load
Given,
Air flow (m) = 25000 m3/hr Air density ( = 1.29 kg/m3
Air DB temperature at evap. inlet = 3 C Air WB temperature evap. inlet = C
Air DB temperature at evap. outlet = C Air WB temperature evap. Outlet = C

Energy Efficiency of Industrial Utilities
39
Enthalpy of air at evap. inlet(hin) = 60 kJ/kg Enthalpy of air at evap. Outlet (hout) =
47kJ/kg
Calculation:
Heat load (TR) =
= 13.86 TR
Example 2
A Dairy Company collected data during the energy audit of chilled water system. Find out the Net
refrigeration capacity, COP, and kW/TR
Power drawn by compressor motor = 90 kW Motor efficiency = 87 %
Compressor circuit- 2 A loading = 61 % Compressor circuit -2B loading = 59 %
Primary pump power = 9 kW Secondary pump power = 2 kW
Chilled water temp. Outlet of evap. = 7.2 Chilled water temp. Inlet to evap. = 9
Chilled water flow via the primary circuit = 148 m3/hr
Calculations:
Net refrigeration capacity (TR) = –
= 88.09 TR
KW/ton rating =
=
=0.89 kW/TR
Coefficient of Performance (COP) =
= 3.95
2.6.6 Findings
It is also one of the costly utilities used in industry.
Refrigerant used in compressor is harmful for man environment if exposed outside
surroundings.
Compressor consumed more electricity for operation rather than other electric utilities.
HVAC system consists many devices so there are several loophole for losses, similarly there are
several energy saving opportunities
HVAC system measures in TR.
2.6.7 Recommendation
Here are recommendation energy efficiency options of HVAC system:
Install a programmable thermostat unit, if you do not have one. You can save as much as 10 to
15% on your cooling bill by simply turning your thermostat back 10 to 15 degrees for 8 hours.
Building Heat Loads Minimization: minimize the air conditioning loads by measures such as
roof cooling, roof painting, efficient lighting, pre-cooling of fresh air by air- to-air heat
exchangers, variable volume air system, optimal thermo-static setting of temperature of air
conditioned spaces, sun film applications, etc.
Replace or clean the filter and clean the evaporator and condenser coils regularly, for the air
conditioner to cool efficiently.
A good air filter will extend the life of your air conditioner because the important parts, like the
blower assembly, the cooling coil, and other inner parts will stay cleaner, operate more
efficiently and last longer.
Avoid frequent opening of doors/windows. A door kept open can result in doubling the power
consumption of your AC.

Energy Efficiency of Industrial Utilities
40
3. Conclusion
With poor practice of energy efficiency measurement in most of the industries, heavy energy cost
is switched on through energy losses. With the advantage of energy efficiency practices and
technologies, it is possible to cut down energy cost significantly in the industries without reducing the
productivity of industrial utilities.
But there are several constrains for energy auditing in industries which significantly affects in
energy audit works, auditor should be addressed each and every problems. According my study
there are many losses associated with industrial utilities can be minimized by small efforts of
stakeholder which may be huge economic value. So that, through this paper I have tried to address
those losses which can be eliminated or reduced. In Universe, there are list of countries which
regularly executed energy efficiency work in their industries. Specially, I am talking about my
country, there are no mandatory rule and regulation for energy efficiency of industries. Not only
this much but also here is lack of energy efficiency related experts.
Evidently, my research paper has tried to address different opportunities, losses associated with industrial
utilities and finding and recommendation also provided to enhance energy efficiency of industrial utilities. I
believe that this research paper may help as a small milestone in coming days in the sector of energy
efficiency of industrial utilities.
4. Bibliography
www.unep.fr
Energy Guide Industry Asia, (UNEP)
www.moi.gov.np
www.doind.gov.np
www.energy-efficiency.gov.uk
www.aepc.gov.np
www.nea.org.np
www.un.org/millenniumgoals/
Bureau of Energy Efficiency India, 2004
Federation of Nepalese Chamber of Commerce and Industry (FNCCI)
Nepal Energy Efficiency Program (NEEP)
Energy Efficiency Center (EEC)
Old Reports
Competitiveness and sustainability unit European IPPC Bureau
A text book of Industrial Energy Efficiency, office of technology assessment, congress of US