ENERGY EFFICIENCY INDICATOR EEI Europe... · Institute for Building Efficiency | 6th annual survey...
25
Institute for Building Efficiency | www.InstituteBE.com 1 Institute for Building Efficiency | www.InstituteBE.com Copyright 2011 Johnson Controls, Inc. ENERGY EFFICIENCY INDICATOR 2012 European Results Jennifer Layke Executive Director, Institute for Building Efficiency [email protected]
Transcript of ENERGY EFFICIENCY INDICATOR EEI Europe... · Institute for Building Efficiency | 6th annual survey...
Institute for Building Efficiency | www.InstituteBE.com 1 Institute for Building Efficiency | www.InstituteBE.com Copyright 2011 Johnson Controls, Inc.
ENERGY EFFICIENCY INDICATOR
2012 European Results
Jennifer Layke Executive Director, Institute for Building Efficiency

Institute for Building Efficiency | www.InstituteBE.com
6th annual survey led by the Institute for
Building Efficiency, in partnership with the
International Facility Manager Association
and the Urban Land Institute
Respondents reached through independent
survey provider Survey.com and members
of strategic partner organizations:
A global survey of decision makers
responsible for energy use in
buildings – examines trends in
priorities and practices
THE ENERGY EFFICIENCY INDICATOR
Market trends and practices among
executives since 2007
2

Institute for Building Efficiency | www.InstituteBE.com 3
EEI SURVEY SCOPE
944 European Respondents
369
253
396
944
230
1,139
331
307
296
Globally, nearly 3500 respondents, targeting 6 regions in 4 languages
Europe: 944 respondents up from 857 in 2011
Other Europe: 10
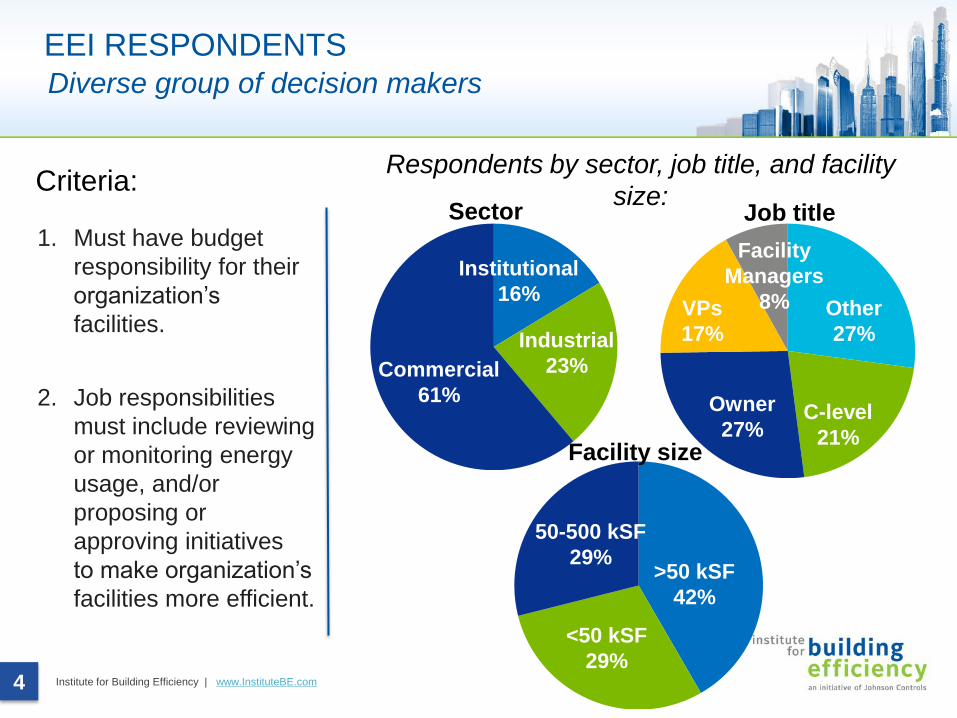
Institute for Building Efficiency | www.InstituteBE.com 4
EEI RESPONDENTS
Respondents by sector, job title, and facility
size:
1. Must have budget
responsibility for their
organization’s
facilities.
2. Job responsibilities
must include reviewing
or monitoring energy
usage, and/or
proposing or
approving initiatives
to make organization’s
facilities more efficient.
Criteria:
Diverse group of decision makers
Commercial
61%
Institutional
16%
Industrial
23%
Owner
27% C-level
21%
Other
27%
VPs
17%
Facility
Managers
8%
50-500 kSF
29%
<50 kSF
29%
>50 kSF
42%
Sector Job title
Facility size

Institute for Building Efficiency | www.InstituteBE.com
ENERGY EFFICIENCY INDICATOR
2012 EUROPEAN RESULTS
Energy management and investment trends
5

Institute for Building Efficiency | www.InstituteBE.com 6
IMPORTANCE OF ENERGY MANAGEMENT
Interest growing in all countries
70%64%
55% 53%
85% 84%81%
72%
0%
10%
20%
30%
40%
50%
60%
70%
80%
90%
Global UK Germany France
2011
2012
2012 Europe Results
Germany saw the
largest increase in
importance from
2011-12
Respondents identifying energy management as extremely or very important

Institute for Building Efficiency | www.InstituteBE.com 7
ENERGY EFFICIENCY INVESTMENT
Germany and France also investing in renewables
63%60%
49% 50%
36% 34%
45%48%
0%
10%
20%
30%
40%
50%
60%
70%
Global UK Germany France
Invested in energy efficiency
Invested in renewable energy
2012 Europe Results
Has your company/organization invested in energy efficiency or renewable
energy projects in the past year?

Institute for Building Efficiency | www.InstituteBE.com 8
INVESTMENT EXPECTED TO INCREASE
Planned investment increase greatest in France
52%40%
33%45%
31%
41%
38%
29%
9% 11%20% 15%
0%
10%
20%
30%
40%
50%
60%
70%
80%
90%
100%
Global UK Germany France
Don't know
Decrease
Stay the same
Increase
2012 Europe Results
Over the next 12 months, will your company/organization’s
investment in energy efficiency or renewable energy:
Institute for Building Efficiency | www.InstituteBE.com
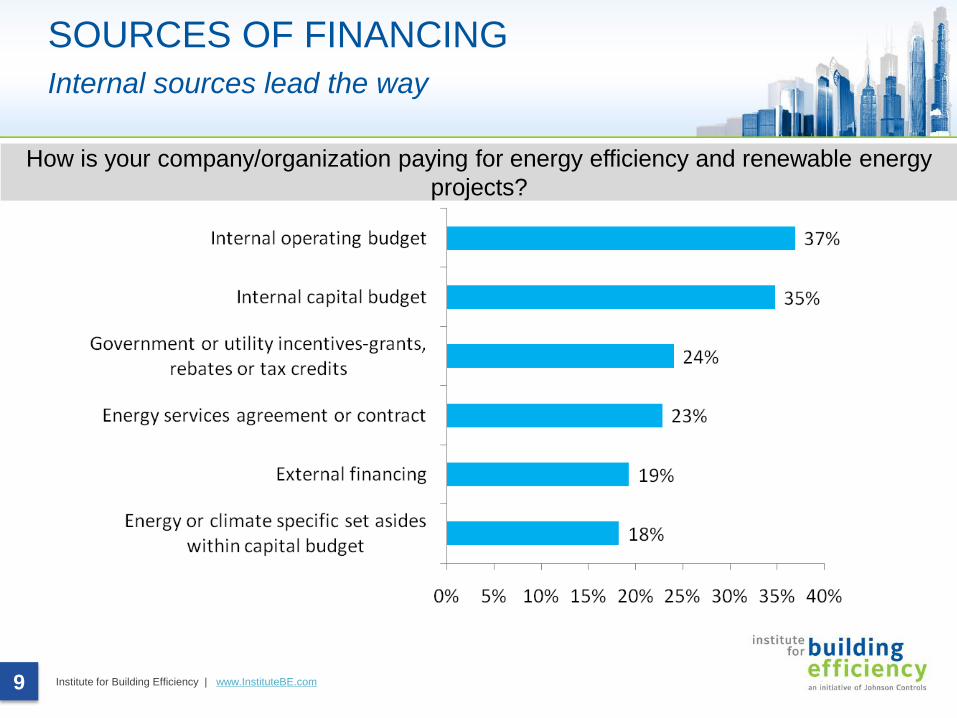
SOURCES OF FINANCING
Internal sources lead the way
9
How is your company/organization paying for energy efficiency and renewable energy
projects?
Institute for Building Efficiency | www.InstituteBE.com 10
TOP CARBON REDUCTION STRATEGIES
Buildings top strategy, renewables #2 in Germany;
Behavior #2 in the UK
7%
13%
7%
8%
25%
6%
7%
10%
15%
17%
9%
6%
11%
8%
20%
0% 10% 20% 30%
Implement training program for operations staff
Implement behavior program targeting employees/occupants
Purchase 'green power'
Install onsite renewable energy
Improve energy efficiency in buildings
France
Germany
UK
2012 Europe Results
What is your company/organization's top strategy for reducing its
carbon footprint?

Institute for Building Efficiency | www.InstituteBE.com
13%
17%
20%
25%
29%
45%
46%
50%
64%
19%
26%
24%
37%
38%
29%
24%
48%
49%
15%
17%
29%
34%
30%
29%
31%
47%
56%
0% 20% 40% 60% 80%
Non-renewable distributed generation or demand management practices
Retro commissioning and system tune-ups
Smart grid or smart building technology
Building envelope improvements
Onsite renewable energy
Water efficiency improvements
Behavioral or educational programs
HVAC and/or controls improvements
Lighting improvements
France
Germany
UK
11
IMPROVEMENT MEASURES
EU countries implementing different measures
Which of the following energy efficiency measures has your company/organization adopted in the last 12 months? (Select all that apply)
2012 Europe Results
Which of the following energy efficiency measures has your company/organization
adopted in the last 12 months? (Select all that apply)

Institute for Building Efficiency | www.InstituteBE.com 12
TECHNOLOGY EXPECTATIONS
UK and France looking to lighting, solar PV; Germany
advanced building materials
20%
15%
20%
23%
24%
29%
14%
13%
21%
23%
21%
20%
13%
21%
13%
24%
30%
36%
0% 10% 20% 30% 40%
Solar thermal
Electric and plug-in electric vehicles
Smart building technology (integrated systems, demand response)
Advanced building materials (windows, insulation, roofing materials)
Solar photovoltaics (PV)
Lighting technologies
France
Germany
UK
2012 Europe Results
Which of the following on-site technologies do you expect to have the
greatest increase in market adoption over the next ten years?

Institute for Building Efficiency | www.InstituteBE.com
ENERGY EFFICIENCY INDICATOR
2012 EUROPE RESULTS
Drivers and policy
13

Institute for Building Efficiency | www.InstituteBE.com 14
DRIVERS
What drives investment in efficiency in Europe?
2012 Europe Results
How significant are the following in your organization's energy efficiency decisions?
Increasing
asset value ranked 3rd in UK,
4th in France and
US/Canada
Energy
Security is #2 driver in
Europe, China

Institute for Building Efficiency | www.InstituteBE.com 15
EUROPEAN ENERGY POLICY
Incentives and financing most favored policies:
end use disclosure new policy trend
11% 10% 13% 13%
12%9%
14% 18%
31%29%
29% 26%
17%21%
17% 20%
18% 20% 15% 13%
10% 10% 12% 11%
0%
10%
20%
30%
40%
50%
60%
70%
80%
90%
100%
Global UK Germany France
Mandatory energy-use disclosure
Stricter building codes and equipment standards
Low-interest financing for energy upgrades
Tax credits/incentives or rebates
Green appraisals
Price on Carbon
2012 Europe Results
Which of the following energy policies would have the greatest impact on improving
energy efficiency in buildings?

Institute for Building Efficiency | www.InstituteBE.com
ENERGY EFFICIENCY INDICATOR
2012 EUROPEAN RESULTS
Barriers and risks
16
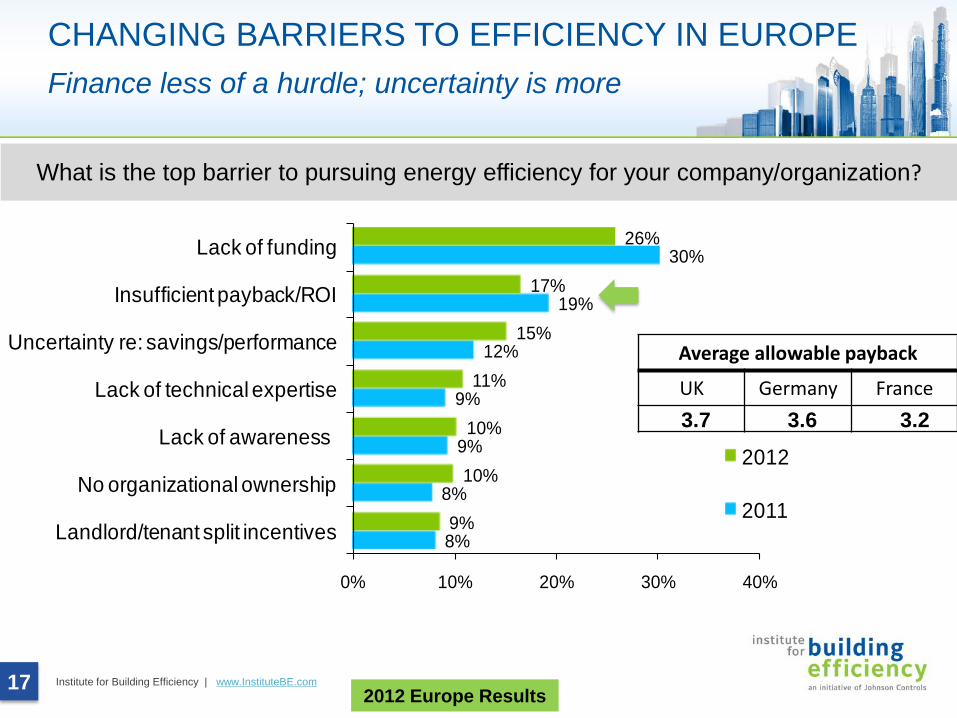
Institute for Building Efficiency | www.InstituteBE.com
8%
8%
9%
9%
12%
19%
30%
9%
10%
10%
11%
15%
17%
26%
0% 10% 20% 30% 40%
Landlord/tenant split incentives
No organizational ownership
Lack of awareness
Lack of technical expertise
Uncertainty re: savings/performance
Insufficient payback/ROI
Lack of funding
2012
2011
17
CHANGING BARRIERS TO EFFICIENCY IN EUROPE
Finance less of a hurdle; uncertainty is more
Average allowable payback
UK Germany France
3.7 3.6 3.2
2012 Europe Results
What is the top barrier to pursuing energy efficiency for your company/organization?

Institute for Building Efficiency | www.InstituteBE.com 18
FINANCIAL BARRIERS
Germany looks to external financing; UK and France to
internal budgets
12%
16%
18%
29%
22%
10%
11%
25%
18%
32%
13%
12%
18%
29%
27%
0% 10% 20% 30% 40%
Balance sheet debt limitations
Competition for other capital investments
Insufficient government or utility incentives
Insufficient internal capital budget
External finance
France
Germany
UK
2012 Europe Results
What is the top financial barrier to pursuing energy efficiency for your
company/organization?
Institute for Building Efficiency | www.InstituteBE.com
ENERGY EFFICIENCY INDICATOR
2012 GLOBAL RESULTS
Energy management and sustainable leasing
practices
19
Institute for Building Efficiency | www.InstituteBE.com
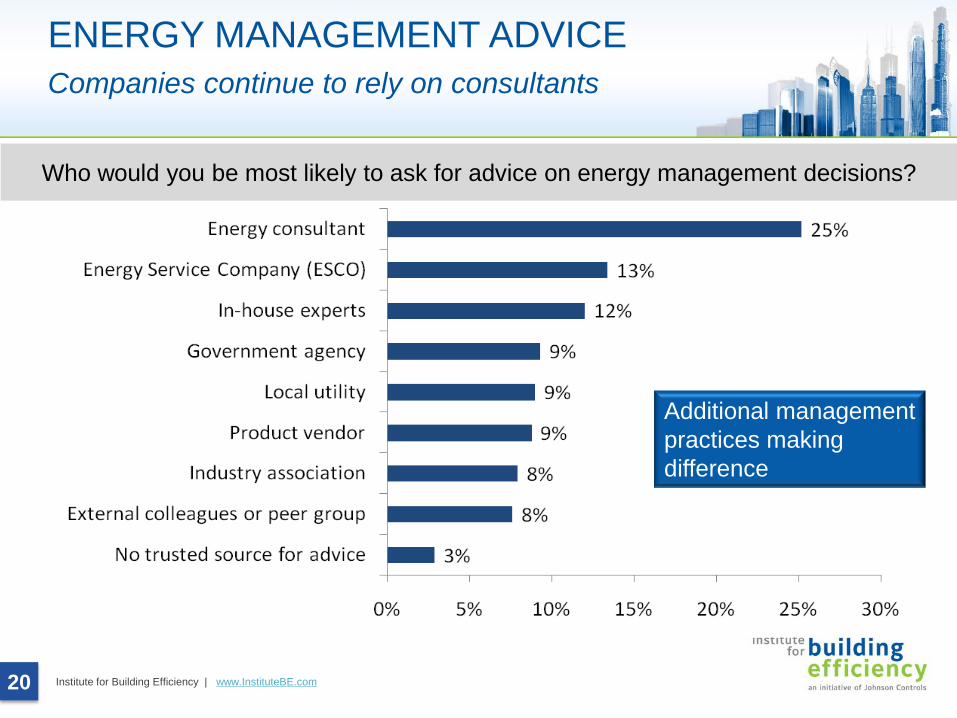
ENERGY MANAGEMENT ADVICE
Companies continue to rely on consultants
20
Who would you be most likely to ask for advice on energy management decisions?
Additional management
practices making
difference

Institute for Building Efficiency | www.InstituteBE.com 21
ENERGY MANAGEMENT PRACTICES
EU slower in adoption of core practices
35%
39%
41%
44%
43%
48%
50%
57%
33%
34%
35%
37%
38%
40%
45%
49%
0% 10% 20% 30% 40% 50% 60%
Staffed an energy management team
Dedicated a capital budget for energy
improvement projects
Benchmarked facility energy performance
Created an action plan to implement energy
improvement projects
Defined/communicated an energy policy/goals
Performed energy audit of facilities or equipment
Measured and verified energy project savings
Tracked and analyzed energy data
EU
Global
2012 Europe Results
Which of the following energy management practices has your company already
implemented in your facilities?

Institute for Building Efficiency | www.InstituteBE.com
ENERGY MANAGEMENT PRACTICES
Best practices drive greater action
22
9.710.3 10.1
10.9 10.7 10.9 10.7 10.8
3.12.7
3.23.6
3.1
3.93.6
4.0
0.0
2.0
4.0
6.0
8.0
10.0
12.0
Tracked and analyzed energy data
Measured and verified energy project savings
Performed energy audits
Benchmarked facility energy performance
Created an action plan to implement
projects
Dedicated capital budget for energy
projects
Communicated energy policy & goals
Staffed energy management team
Tracked &
analyzed
energy data
Measured &
verified
energy
project
savings
Performed
energy
audits
Benchmarked
facility energy
performance
Dedicated
capital
budget for
energy
projects
Communicated
energy policy &
goals
Staffed energy
management
team
Created an
action plan to
implement
projects
Average number of measures
implemented when practice in place
Average number of measures when
practice not in place
2012 Europe Results
Num
be
r o
f m
ea
su
res im
ple
me
nte
d

Institute for Building Efficiency | www.InstituteBE.com 23
GREEN BUILDINGS
Plans to certify increase
31%
35%36%
44%
0%
5%
10%
15%
20%
25%
30%
35%
40%
45%
50%
2011 2012
New Construction
Existing buildings
55% of European
respondents have
at least one
certified green
building
2012 Europe Results
Will your company/organization pursue voluntary green building certification in the next 12 months?

Institute for Building Efficiency | www.InstituteBE.com
5%
7%
18%
19%
7%
14%
30%
28%
8%
13%
27%
36%
7%
13%
24%
25%
0% 5% 10% 15% 20% 25% 30% 35% 40%
Have a corporate policy to only lease space in a certified green building
Enter into green leases that align building owner and tenant incentives
Build-out tenant space to high performance (above code) standards
Willing to pay a premium for space in a certified green building
Global
France
Germany
UK
24
LEASED OFFICE SPACE PRACTICES
France leads in practices; UK lags
2012 Europe Results
What practices does your company/organization follow for leased office space?
Institute for Building Efficiency | www.InstituteBE.com
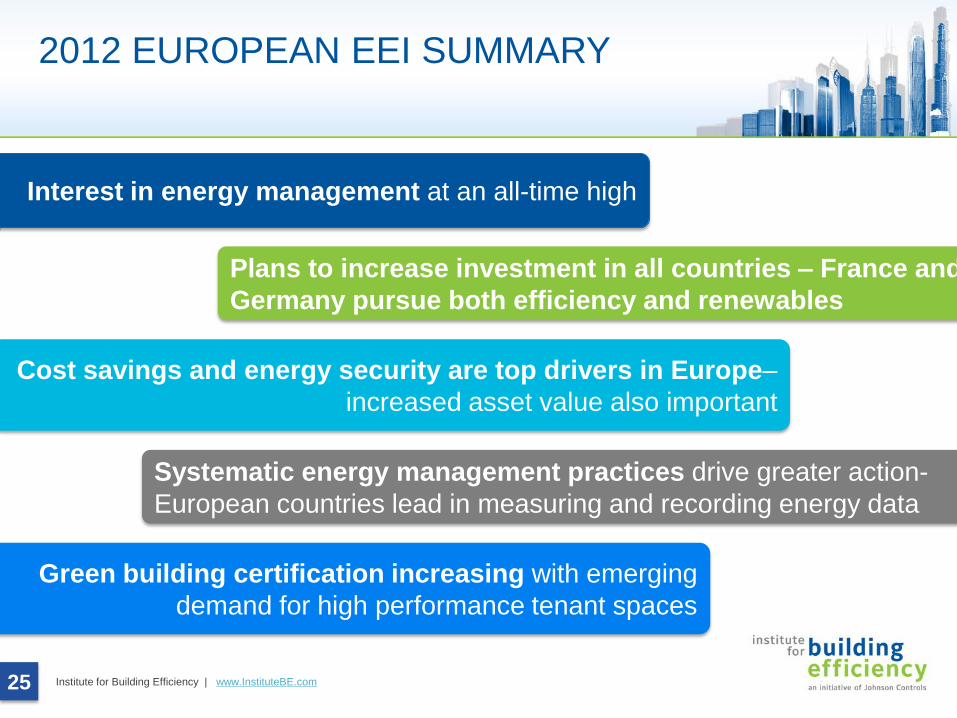
2012 EUROPEAN EEI SUMMARY
25
Interest in energy management at an all-time high
Plans to increase investment in all countries – France and
Germany pursue both efficiency and renewables
Cost savings and energy security are top drivers in Europe–
increased asset value also important
Systematic energy management practices drive greater action-
European countries lead in measuring and recording energy data
Green building certification increasing with emerging
demand for high performance tenant spaces