Energy Efficiency in electrical distribution · 2012-02-10 · Energy Efficiency in electrical...
36
Schneider Electric - Electrical installation guide 2009 K © Schneider Electric - all rights reserved Chapter K Energy Efficiency in electrical distribution Contents Introduction K2 Energy efficiency and electricity K3 2.1 Regulation is pushing energy efficiency worldwide K3 2.2 How to achieve Energy Efficiency K4 Diagnosis through electrical measurement K7 3.1 Physical value acquisition K7 3.2 Electrical data for real objectives K8 3.3 Measurement starts with the "stand alone product" solution K10 Energy saving solutions k3 4.1 Motor systems and replacement K13 4.2 Pumps, fans and variable speed drives K14 4.3 Lighting K18 4.4 Load management strategies K20 4.5 Power factor correction K22 4.6 Harmonic filtering K22 4.7 Other measures K23 4.8 Communication and Information System K23 4.9 Mapping of solutions K30 How to value energy savings K3 5.1 Introduction to IPMVP and EVO K31 5.2 Principles and options of IPMVP K31 5.3 Six qualities of IPMVP K32 5.4 IPMVP'S options K32 5.5 Fundamental points of an M&V plan K33 From returns on investment to sustained performance K34 6.1 Technical support services K34 6.2 Operational support services K35 2 3 4 5 6
Transcript of Energy Efficiency in electrical distribution · 2012-02-10 · Energy Efficiency in electrical...

Schneider Electric - Electrical installation guide 2009
K�
© S
chne
ider
Ele
ctric
- a
ll rig
hts
rese
rved
Chapter KEnergy Efficiency in electrical distribution
Contents
Introduction K2
Energy efficiency and electricity K3
2.1 Regulation is pushing energy efficiency worldwide K3
2.2 How to achieve Energy Efficiency K4
Diagnosis through electrical measurement K7
3.1 Physical value acquisition K7
3.2 Electrical data for real objectives K8
3.3 Measurement starts with the "stand alone product" solution K10
Energy saving solutions k�3
4.1 Motor systems and replacement K13
4.2 Pumps, fans and variable speed drives K14
4.3 Lighting K18
4.4 Load management strategies K20
4.5 Power factor correction K22
4.6 Harmonic filtering K22
4.7 Other measures K23
4.8 Communication and Information System K23
4.9 Mapping of solutions K30
How to value energy savings K3�
5.1 Introduction to IPMVP and EVO K31
5.2 Principles and options of IPMVP K31
5.3 Six qualities of IPMVP K32
5.4 IPMVP'S options K32
5.5 Fundamental points of an M&V plan K33
From returns on investment to sustained performance K34
6.1 Technical support services K34
6.2 Operational support services K35
�
2
3
4
5
6

Schneider Electric - Electrical installation guide 2009
K - Energy Efficiency in electrical installations
K2
© S
chne
ider
Ele
ctric
- a
ll rig
hts
rese
rved
� Introduction
While there are a number of factors influencing the attitudes and opinions towards energy efficiency – most notably the increasing cost of energy and a rising social conscience – it is likely to be legislative drivers that have the greatest impact on changing behaviours and practices. Respective governments internationally are introducing energy saving targets and effecting regulations to ensure they are met.
Reducing greenhouse gas emissions is a global target set at the Earth Summit in Kyoto in 1997 and finally ratified by 169 countries in December 2006 enabling the Agreement’s enactment in February 2005.
Under the Kyoto Protocol industrialised countries have agreed to reduce their collective emissions of greenhouse gases by 5.2% by 2008-2012 compared to the year 1990 (however, compared to the emissions levels expected by 2012 prior to the Protocol, this limitation represents a 29% cut). The target in Europe is an 8% reduction overall with a target for CO2 emissions to fall by 20% by 2020.
Of the six greenhouse gases listed by Kyoto, one of the most significant by volume of emissions is carbon dioxide (CO2) and it is gas that is mainly emitted as a result of electricity generation and use, as well as direct thermal losses in, for example, heating.
Up to 50% of CO2 emissions attributable to residential and commercial buildings is from electricity consumption. Moreover, as domestic appliances, computers and entertainment systems proliferate; and other equipment such as air conditioning and ventilation systems increase in use, electricity consumption is rising at a higher rate than other energy usage.
The ability to meet targets by simply persuading people to act differently or deploy new energy saving or energy efficient technology is unlikely to succeed. Just considering construction and the built environment, new construction is far less than 2% of existing stock. If newly constructed buildings perform exactly as existing stock the result by 2020 will be an increase in electricity consumption of 22%. On the other hand, if all new construction has energy consumption of 50% less than existing stock, the result is still an increase of 18%.
In order to reach a fall in consumption of 20% by 2020 the folllowing has to happen:b All new buildings constructed to consume 50% less energyb 1 in 10 existing buildings reduce consumption by 30% each year
(see Fig.K�).
Significantly, by 2020 in most countries 80% of all buildings will have already been built. The refurbishment of existing building stock and improving energy management is vital in meeting emission reduction targets. Given that in the west, most buildings have already undergone thermal insulation upgrades such as cavity wall insulation, loft insulation and glazing, the only potential for further savings is by reducing the amount of energy consumed.
Action on existing built environment will almost certainly become compulsory to meet targets fixed for the coming years.
As a result, governments are applying pressures to meet the ambitious targets. It is almost certain that ever more demanding regulations will be enforced to address all energy uses, including existing buildings and, naturally, industry. At the same time energy prices are rising as natural resources become exhausted and the electrical infrastructure in some countries struggles to cope with increasing demand.
Technology exists to help tackle energy efficiency on many levels from reducing electrical consumption to controlling other energy sources more efficiently. Strong regulatory measures may be required to ensure these technologies are adopted quickly enough to impact on the 2020 targets.
The most important ingredient however, lies with the ability of those in control of industry, business and government to concentrate their hearts and minds on making energy efficiency a critical target. Otherwise, it might not be just the Kyoto targets on which the lights go out.
The message to heed is that if those empowered to save energy don’t do so willingly now, they will be compelled under legal threat to do so in the future.
Fig. K1 : How to reach a fall in consumption of 20% by 2020
140
120
100
80
60
40
20
0
BaseSC1SC2
2007
2008
2009
2010
2011
2012
2013
2014
2015
2016
2017
2018
A minimum renovation of �0% per year of existing stock is compulsory to reach less 20%
Renovation = 70% of the savingsNew = 30% of the savings

Schneider Electric - Electrical installation guide 2009
K - Energy Efficiency in electrical installations
K3
© S
chne
ider
Ele
ctric
- a
ll rig
hts
rese
rved
2.� Regulation is pushing Energy Efficiency worldwide
Kyoto Protocol was the start of fixing quantitative targets and agenda in CO2 emissions reduction with clear government's commitments.
Beyond Kyoto commitment (which covers only the period up to 2012) many countries have fixed longer time frame and targets in line with the last GIEEC recommendations to UNFCC to stabilise the CO2 concentration at a level of 450 ppm (this should require a division by 2 before 2050 of the CO2 emission level based on 1990).European Union is a good example and firm commitment with a target of Iess 20% before 2020 has been taken by heads of EU member states in March 2007 (known as the 3x20: it includes reduction of 20% of CO2 emission, Improvement of 20% of the Energy Efficiency level and reaching 20% of the energy produced from renewable).This commitment of Iess 20% in 2020 couId be extended to less 30% in 2020 in case of post Kyoto international agreement.
Some European Countries are planning commitment for the 2050 with level of reduction up to 50%. All of this illustrates that Energy Efficiency Iandscape and policies will be present in a long time frame.
Reaching these targets wiII require real change and regulations, legislation, standardisation are enablers governments are re inforcing everyday.
All over the world Régulation/Législation is strengthening stakeholders obligations and putting in place financial & fiscal schemes
b In USv Energy Policy Act of 2005v Building Codesv Energy Codes (10CFR434)v State Energy prograrn (10CFR420)v Energy Conservation for Consumer Goods (10CFR430)
b In European Unionv EU Emission Trading Schemev Energy Performance of Building Directivev Energy Using Product Directivev End use of energy & energy services directive
b In Chinav China Energy Conservation Lawv China Architecture law (EE in Building)v China Renewable Energy Lawv Top 1000 Industrial Energy Conservation Program
Various legislative and financial-fiscal incentives schemes are developed at national and regional levels such as:b Auditing & assessment schemesb Performance labelling schemesb Building Codesb Energy Performance Certificatesb Obligation to energy sellers to have their clients making energy savingsb Voluntary agreements in Industryb Financial-market mechanism (tax credit, accelerated depreciation, white certificates,...)b Taxation and incentive schemes
2 Energy efficiency and electricity
Fig. K2 : EE Dedicated directives
BuildingEnergyPerformance
EEDedicateddirectives
Dec 02EPB
2002/91
EmissionTradingScheme
Oct 03ETS
2003/87
CombinedHeat &Power
Feb 04CHP
2004/8
EnergyUsingProducts
July 05Eco Design
2005/32
End use ofEnergy & Energy Services
April 06EUE & ES2006/32
EnergyLabelling ofDomesticAppliances
Jul 03ELDA
2003/66
Schneider Electric - Electrical installation guide 2009
K - Energy Efficiency in electrical installations
K4
© S
chne
ider
Ele
ctric
- a
ll rig
hts
rese
rved
All sectors are concerned and regulations impact not only new construction and installation but as well the existing buildings in industrial or infrastructure environment.
In parallel Standardisation work has started with a lot of new standards being issued or in progress.
In building all energy use are concerned:b Lightingb Ventilationb Heatingb Cooling and AC
For industries as well as commercial companies Energy Management Systems standards ( in Iine with the well known ISO 9001 for quality and ISO 14001 for environment) are under process in Standardisation Bodies. Energy Efficiency Services standards are as well at work.
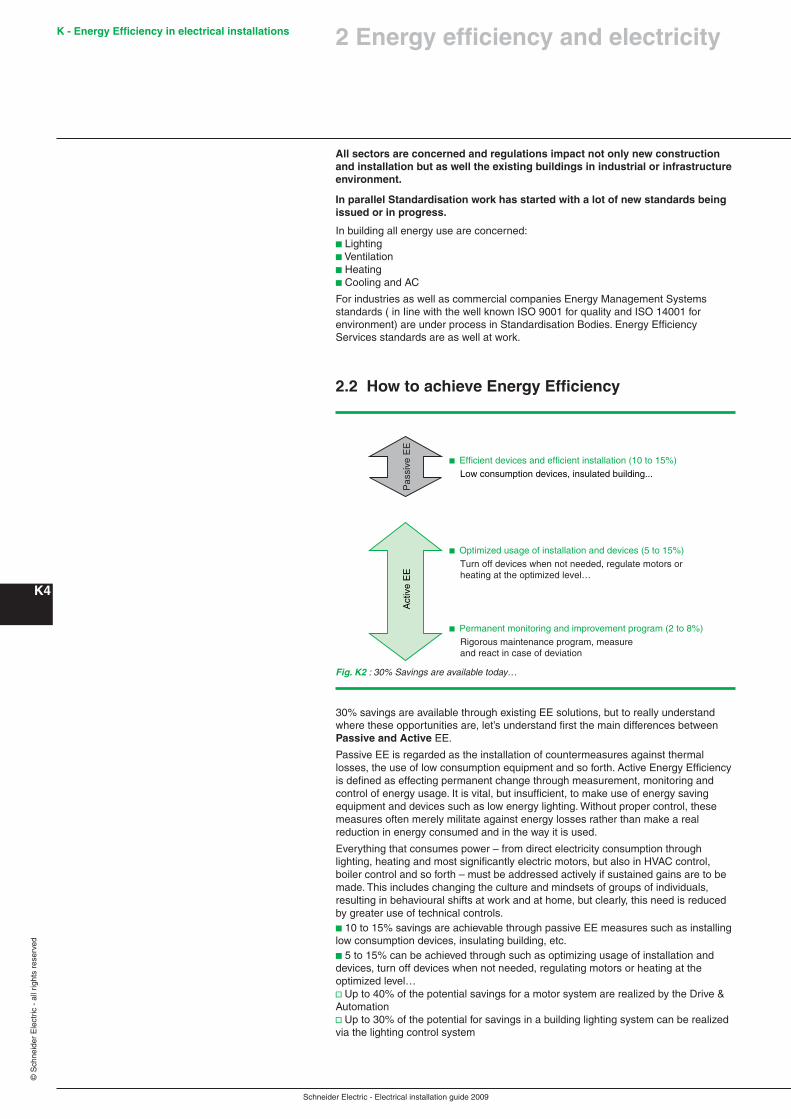
2.2 How to achieve Energy Efficiency
b Efficient devices and efficient installation (10 to 15%)
Low consumption devices, insulated building...
b Optimized usage of installation and devices (5 to 15%)
Turn off devices when not needed, regulate motors orheating at the optimized level…
b Permanent monitoring and improvement program (2 to 8%)
Rigorous maintenance program, measureand react in case of deviation
Pas
sive
EE
Act
ive
EE
30% savings are available through existing EE solutions, but to really understand where these opportunities are, let’s understand first the main differences betweenPassive and Active EE.
Passive EE is regarded as the installation of countermeasures against thermallosses, the use of low consumption equipment and so forth. Active Energy Efficiencyis defined as effecting permanent change through measurement, monitoring andcontrol of energy usage. It is vital, but insufficient, to make use of energy savingequipment and devices such as low energy lighting. Without proper control, thesemeasures often merely militate against energy losses rather than make a realreduction in energy consumed and in the way it is used.
Everything that consumes power – from direct electricity consumption through lighting, heating and most significantly electric motors, but also in HVAC control,boiler control and so forth – must be addressed actively if sustained gains are to bemade. This includes changing the culture and mindsets of groups of individuals,resulting in behavioural shifts at work and at home, but clearly, this need is reducedby greater use of technical controls.b 10 to 15% savings are achievable through passive EE measures such as installing low consumption devices, insulating building, etc.b 5 to 15% can be achieved through such as optimizing usage of installation and devices, turn off devices when not needed, regulating motors or heating at theoptimized level…v Up to 40% of the potential savings for a motor system are realized by the Drive & Automationv Up to 30% of the potential for savings in a building lighting system can be realized via the lighting control system
Fig. K2 : 30% Savings are available today…
2 Energy efficiency and electricity

Schneider Electric - Electrical installation guide 2009
K - Energy Efficiency in electrical installations
K5
© S
chne
ider
Ele
ctric
- a
ll rig
hts
rese
rved
b And a further 2 to 8% can also be achieved through active EE measures such as putting in place a permanent monitoring and improvement program
But savings can be lost quickly if there is:b Unplanned, unmanaged shutdowns of equipment and processesb Lack of automation and regulation (motors, heating)b No continuity of behaviors
Fig. K4 : The 4 sustainability steps
Energy Efficiency : it's easy, just follow the 4 sustainability steps
b Energy metersb Power quality meters
� Measure
2 Fix the basics b Low consumption devicesb Insulation materialb Power qualityb Power reliability
b Building management systemsb Lighting control systemsb Motor control systemsb Home control systemsb Variable speed drive
b Energy management softwareb Remote monitoring systems
3 Automate
4 Monitor and Improve
Energy Efficiency is not different form other disciplines and we take a very rational approach to it, very similar to the 6Sigma DMAIC (Define, Measure, Analyze, Improve and Control) approach.
As always, the first thing that we need to do is to measure in order to understand where are the main consumptions, what is the consumption pattern, etc. This initial measurement, together with some benchmarking information, will allow us see how good or bad we are doing, to define the main improvement axis and an estimation of what can be expected in terms of gains. We can not improve what we can not measure.
Then, we need to fix the basics or what is called passive EE. Change old enduse devices by Low consumption ones (bulbs, motors, etc), Improve the Insulation of your installations, and assure power quality reliability in order to be able to work in a stable environment where the gains are going to sustainable over time.
After that, we are ready to enter into the automation phase or Active Energy efficiency. As already highlighted, everything that consumes power must be addressed actively if sustained gains are to be made.
Active Energy Efficiency can be achieved not only when energy saving devices and equipment are installed, but with all kind of end-use devices. It is this aspect of control that is critical to achieving the maximum efficiency. As an example, consider a low consumption bulb that is left on in an empty room. All that is achieved is that less energy is wasted compared to using an ordinary bulb, but energy is still wasted!
Responsible equipment manufacturers are continually developing more efficient products. However, while for the most part the efficiency of the equipment is a fair representation of its energy saving potential - say, in the example of a domestic washing machine or refrigerator - it is not always the case in industrial and commercial equipment. In many cases the overall energy performance of the system is what really counts. Put simply, if an energy saving device is left permanently on stand-by it can be less efficient than a higher consuming device that is always switched off when not in use.
Summarizing, managing energy is the key to maximizing its usefulness and economizing on its waste. While there are increasing numbers of products that are now more energy efficient than their predecessors, controlling switching or reducing settings of variables such as temperature or speed, makes the greatest impact.
2 Energy efficiency and electricity
Schneider Electric - Electrical installation guide 2009
K - Energy Efficiency in electrical installations
K6
© S
chne
ider
Ele
ctric
- a
ll rig
hts
rese
rved
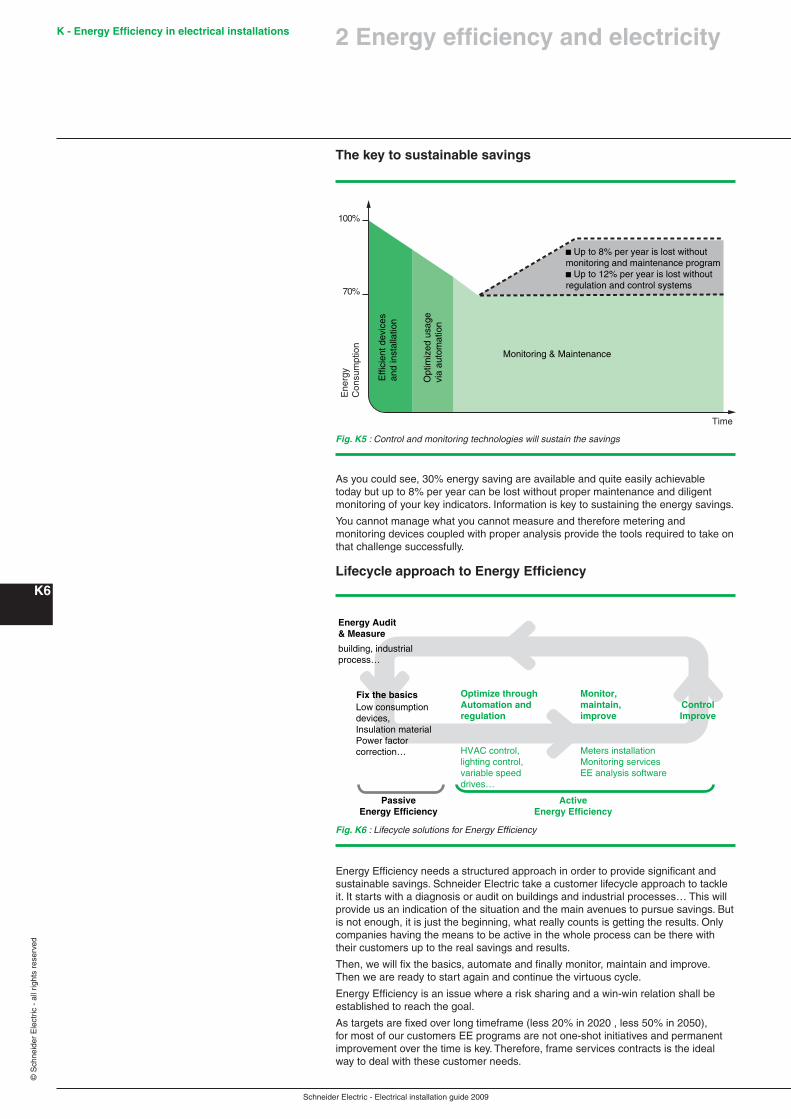
The key to sustainable savings
Fig. K5 : Control and monitoring technologies will sustain the savings
Ene
rgy
Con
sum
ptio
n
70%
100%
Time
Effi
cien
t dev
ices
and
inst
alla
tion
Opt
imiz
ed u
sage
via
auto
mat
ion
Monitoring & Maintenance
b Up to 8% per year is lost withoutmonitoring and maintenance programb Up to 12% per year is lost withoutregulation and control systems
As you could see, 30% energy saving are available and quite easily achievable today but up to 8% per year can be lost without proper maintenance and diligent monitoring of your key indicators. Information is key to sustaining the energy savings.
You cannot manage what you cannot measure and therefore metering and monitoring devices coupled with proper analysis provide the tools required to take on that challenge successfully.
Lifecycle approach to Energy Efficiency
Fig. K6 : Lifecycle solutions for Energy Efficiency
Energy Audit& Measure
building, industrialprocess…
Low consumptiondevices,Insulation materialPower factorcorrection…
Fix the basics
PassiveEnergy Efficiency
ActiveEnergy Efficiency
Optimize throughAutomation andregulation
HVAC control,lighting control,variable speeddrives…
Monitor,maintain,improve
ControlImprove
Meters installationMonitoring servicesEE analysis software
Energy Efficiency needs a structured approach in order to provide significant and sustainable savings. Schneider Electric take a customer lifecycle approach to tackle it. It starts with a diagnosis or audit on buildings and industrial processes… This will provide us an indication of the situation and the main avenues to pursue savings. But is not enough, it is just the beginning, what really counts is getting the results. Only companies having the means to be active in the whole process can be there with their customers up to the real savings and results.
Then, we will fix the basics, automate and finally monitor, maintain and improve. Then we are ready to start again and continue the virtuous cycle.
Energy Efficiency is an issue where a risk sharing and a win-win relation shall be established to reach the goal.
As targets are fixed over long timeframe (less 20% in 2020 , less 50% in 2050), for most of our customers EE programs are not one-shot initiatives and permanent improvement over the time is key. Therefore, frame services contracts is the ideal way to deal with these customer needs.
2 Energy efficiency and electricity
Schneider Electric - Electrical installation guide 2009
K - Energy Efficiency in electrical installations
K7
© S
chne
ider
Ele
ctric
- a
ll rig
hts
rese
rved
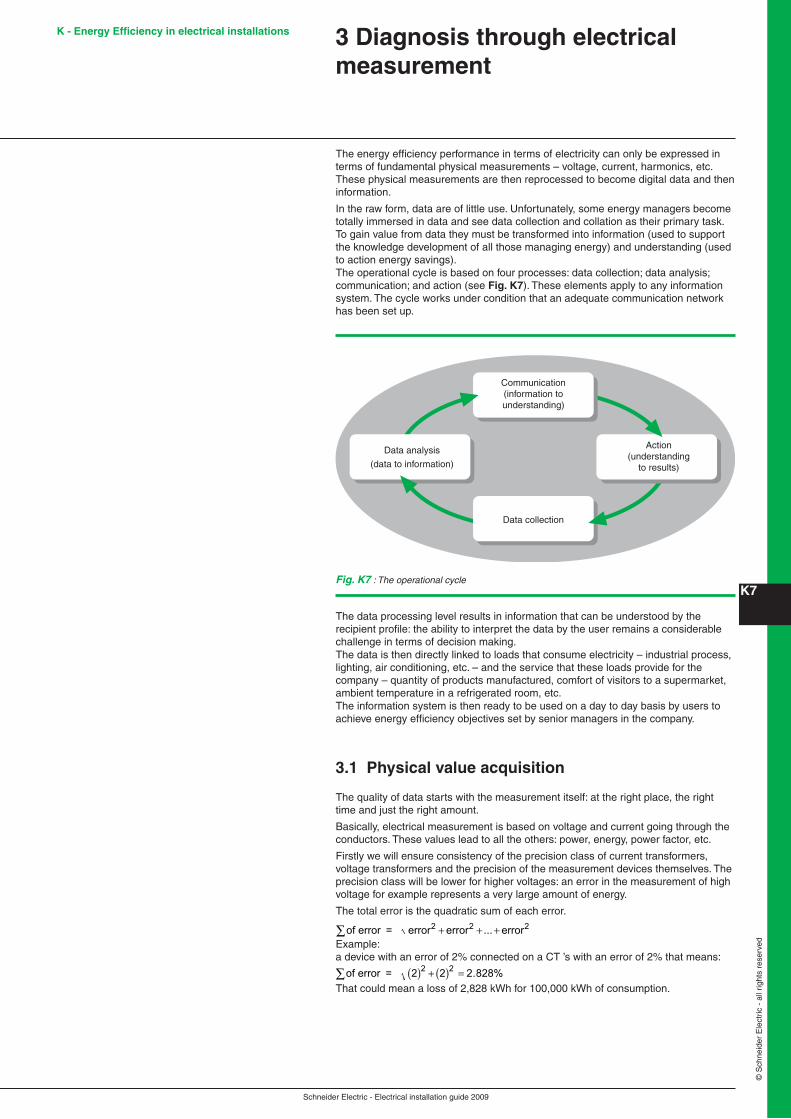
The energy efficiency performance in terms of electricity can only be expressed in terms of fundamental physical measurements – voltage, current, harmonics, etc. These physical measurements are then reprocessed to become digital data and then information.
In the raw form, data are of little use. Unfortunately, some energy managers become totally immersed in data and see data collection and collation as their primary task. To gain value from data they must be transformed into information (used to support the knowledge development of all those managing energy) and understanding (used to action energy savings).The operational cycle is based on four processes: data collection; data analysis; communication; and action (see Fig. K7). These elements apply to any information system. The cycle works under condition that an adequate communication network has been set up.
The data processing level results in information that can be understood by the recipient profile: the ability to interpret the data by the user remains a considerable challenge in terms of decision making.The data is then directly linked to loads that consume electricity – industrial process, lighting, air conditioning, etc. – and the service that these loads provide for the company – quantity of products manufactured, comfort of visitors to a supermarket, ambient temperature in a refrigerated room, etc.The information system is then ready to be used on a day to day basis by users to achieve energy efficiency objectives set by senior managers in the company.
3.� Physical value acquisition
The quality of data starts with the measurement itself: at the right place, the right time and just the right amount.
Basically, electrical measurement is based on voltage and current going through the conductors. These values lead to all the others: power, energy, power factor, etc.
Firstly we will ensure consistency of the precision class of current transformers, voltage transformers and the precision of the measurement devices themselves. The precision class will be lower for higher voltages: an error in the measurement of high voltage for example represents a very large amount of energy.
The total error is the quadratic sum of each error.
of error = error error ... error2 2 2+ + +∑Example: a device with an error of 2% connected on a CT ’s with an error of 2% that means:
of error = 2,828%2 22 2( ) + ( ) =∑That could mean a loss of 2,828 kWh for 100,000 kWh of consumption.
3 Diagnosis through electrical measurement
Fig. K7 : The operational cycle
Data analysis
(data to information)
Action(understanding
to results)
Communication(information tounderstanding)
Data collection
.

Schneider Electric - Electrical installation guide 2009
K - Energy Efficiency in electrical installations
K�
© S
chne
ider
Ele
ctric
- a
ll rig
hts
rese
rved
Voltage measurementIn low voltage, the voltage measurement is directly made by the measurement device. When the voltage level becomes incompatible with the device capacity, for example in medium voltage, we have to put in voltage transformers.
A VT (Voltage transformer) is defined by:b its primary voltage and secondary voltageb its apparent power b its precision class
Current measurementCurrent measurement is made by split or closed-core CT’s placed around the phase and neutral conductors as appropriate.According to the required precision for measurement, the CT used for the protection relay also allows current measurement under normal conditions.
Energy measurement
To measure energy, we consider two objectives:b A contractual billing objective, e.g. between an electricity company and its client or even between an airport manager (sub-billing) and stores renting airport surface areas. In this case IEC 62053-21 for Classes 1 and 2 and IEC 62053-22 for Classes 0.5S and 0.2S become applicable to measure active energy.The full measurement chain – CT, VT and measurement unit – can reach a precision class Cl of 1 in low voltage, Cl 0.5 in medium voltage and 0.2 in high voltage, or even 0.1 in the future.b An internal cost allocation objective for the company, e.g. to break-down the cost of electricity for each product produced in a specific workshop. In this case of a precision class between 1 and 2 for the whole chain (CT, VT and measurement station) is sufficient.
It is recommended to match the full measurement chain precision with actual measurement requirements: there is no one single universal solution, but a good technical and economic compromise according to the requirement to be satisfied. Note that the measurement precision also has a cost, to be compared with the return on investment that we are expecting.
Generally gains in terms of energy efficiency are even greater when the electrical network has not been equipped in this way until this point. In addition, permanent modifications of the electrical network, according to the company’s activity, mainly cause us to search for significant and immediate optimizations straight away.
Example:A class 1 analogue ammeter, rated 100 A, will display a measurement of +/-1 A at 100 A. However if it displays 2 A, the measurement is correct to within 1 A and therefore there is uncertainty of 50%.A class 1 energy measurement station such as PM710 – like all other Power Meter and Circuit Monitor Measurement Units – is accurate to 1% throughout the measurement range as described in IEC standards 62053.
Other physical measurements considerably enhance the data:b on/off, open/closed operating position of devices, etc.b energy metering impulseb transformer, motor temperatureb operation hours, quantity of switching operationsb motor loadb UPS battery loadb event logged equipment failuresb etc.
3.2 Electrical data for real objectives
Electrical data is transformed into information that is usually intended to satisfy several objectives:b It can modify the behaviour of users to manage energy wisely and finally lowers overall energy costsb It can contribute to field staff efficiency increaseb It can contribute to decrease the cost of Energyb It can contribute to save energy by understanding how it is used and how assets and process can be optimized to be more energy efficient
A CT is defined by:b transformation ratio. For example: 50/5Ab precision class Cl. Example: Cl=0.5b precision power in VA to supply power to the measurement devices on the secondary. Example: 1.25 VAb limit precision factor indicated as a factor applied to In before saturation. Example: FLP (or Fs) =10 for measurement devices with a precision power that is in conformity.
PM700 measurement unit
3 Diagnosis through electrical measurement

Schneider Electric - Electrical installation guide 2009
K - Energy Efficiency in electrical installations
K�
© S
chne
ider
Ele
ctric
- a
ll rig
hts
rese
rved
b It may help in optimizing and increasing the life duration of the assets associated to the electrical networkb And finally it may be a master piece in increasing the productivity of the associated process (industrial process or even office, building management), by preventing, or reducing downtime, or insuring higher quality energy to the loads.
Facility utility costs parallel the visualization of an iceberg (see Fig. K�). While an iceberg seems large above the surface, the size is completely overwhelming beneath the surface. Similarly, electrical bills are brought to the surface each month when your power provider sends you a bill. Savings in this area are important and can be considerable enough to be the only justification needed for a power monitoring system. However, there are other less obvious yet more significant savings opportunities to be found below the surface if you have the right tools at your disposal.
Modify the behaviour of energy usersUsing cost allocation reports, you can verify utility billing accuracy, distribute bills internally by department, make effective fact-based energy decisions and drive accountability in every level of your organization. Then providing ownership of electricity costs to the appropriate level in an organization, you modify the behaviour of users to manage energy wisely and finally lowers overall energy costs.
Increase field staff efficiencyOne of the big challenges of field staff in charge of the electrical network is to make the right decision and operate in the minimum time.The first need of such people is then to better know what happens on the network, and possibly to be informed everywhere on the concerned site.This site-wise transparency is a key feature that enables a field staff to:b Understand the electrical energy flows – check that the network is correctly set-up, balanced, what are the main consumers, at what period of the day, or the week…b Understand the network behaviour – a trip on a feeder is easier to understand when you have access to information from downstream loads.b Be spontaneously informed on events, even outside the concerned site by using today’s mobile communicationb Going straight forward to the right location on the site with the right spare part, and with the understanding of the complete pictureb Initiate a maintenance action taking into account the real usage of a device, not too early and not too lateb Therefore, providing to the electrician a way to monitor the electrical network can appear as a powerful mean to optimize and in certain case drastically reduce the cost of power.
Here are some examples of the main usage of the simplest monitoring systems:b Benchmark between zones to detect abnormal consumption.b Track unexpected consumption.b Ensure that power consumption is not higher that your competitors.b Choose the right Power delivery contract with the Power Utility.b Set-up simple load-shedding just focusing on optimizing manageable loads such as lights.b Be in a position to ask for damage compensation due to non-quality delivery from the Power Utilities – " The process has been stopped because of a sag on the networks".
Implementing energy efficiency projectsThe Power monitoring system will deliver information that support a complete energy audit of a factility. Such audit can be the way to cover not only electricity but also Water, Air, Gas and Steam. Measures, benchmark and normalized energy consumption information will tell how efficient the industrial facilities and process are. Appropriate action plans can then be put in place. Their scope can be as wide as setting up control lighting, Building automation systems, variable speed drive, process automation, etc.
Optimizing the assetsOne increasing fact is that electrical network evolves more and more and then a recurrent question occurs : Will my network support this new evolution?This is typically where a Monitoring system can help the network owner in making the right decision.By its logging activity, it can archive the real use of the assets and then evaluate quite accurately the spare capacity of a network, or a switchboard, a transformer…A better use of an asset may increase its life duration.Monitoring systems can provide accurate information of the exact use of an asset and then the maintenance team can decide the appropriate maintenance operation, not too late, or not too early.In some cases also, the monitoring of harmonics can be a positive factor for the life duration of some assets (such as motors or transformers).
Fig. K8 : Facility utility costs parallel the visualisation of an iceberg
3 Diagnosis through electrical measurement

Schneider Electric - Electrical installation guide 2009
K - Energy Efficiency in electrical installations
K�0
© S
chne
ider
Ele
ctric
- a
ll rig
hts
rese
rved
Increasing the productivity by reducing the downtimeDowntime is the nightmare of any people in charge of an electrical network. It may cause dramatic loss for the company, and the pressure for powering up again in the minimum time – and the associated stress for the operator – is very high.A monitoring and control system can help reducing the downtime very efficiently.Without speaking of a remote control system which are the most sophisticatedsystem and which may be necessary for the most demanding application, a simple monitoring system can already provide relevant information that will highly contribute in reducing the downtime:b Making the operator spontaneously informed, even remote, even out of the concerned site (Using the mobile communication such as DECT network or GSM/SMS)b Providing a global view of the whole network statusb Helping the identification of the faulty zoneb Having remotely the detailed information attached to each event caught by the field devices (reason for trip for example)
Then remote control of a device is a must but not necessary mandatory. In many cases, a visit of the faulty zone is necessary where local actions are possible.
Increasing the productivity by improving the Energy QualitySome loads can be very sensitive to electricity quality, and operators may face unexpected situations if the Energy quality is not under control.Monitoring the Energy quality is then an appropriate way to prevent such event and / or to fix specific issue.
3.3 Measurement starts with the “stand alone product” solution
The choice of measurement products in electrical equipment is made according to your energy efficiency priorities and also current technological advances: b measurement and protection functions of the LV or MV electrical network are integrated in the same device,Example: Sepam metering and protection relays, Micrologic tripping unit for Compact NSX and Masterpact, TeSys U motor controller, NRC12 capacitor bank controller, Galaxy UPSs b the measurement function is in the device, separate from the protection function, e.g. built on board the LV circuit breaker.Example: PowerLogic ION 6200 metering unit
The progress made in real time industrial electronics and IT are used in a single device:b to meet requirements for simplification of switchboardsb to reduce acquisition costs and reduce the number of devicesb to facilitate product developments by software upgrade procedures
TeSys U motor controllerION 6200 metering unit
Compact NSX with Micrologic trip unit
3 Diagnosis through electrical measurement

Schneider Electric - Electrical installation guide 2009
K - Energy Efficiency in electrical installations
K��
© S
chne
ider
Ele
ctric
- a
ll rig
hts
rese
rved
3 Diagnosis through electrical measurement
Example of solutions for a medium-sized site: Analysesample Ltd. is a company specialized in analyzing industrial samples from regional factories: metals, plastics, etc., to certify their chemical characteristics. The company wants to carry out better control of its electrical consumption for the existing electrical furnaces, its air conditioning system and to ensure quality of electrical supply for high-precision electronic devices used to analyze the samples.
Electrical network protected and monitored via the Intranet siteThe solution implemented involves recovering power data via metering units that also allows measurement of basic electrical parameters as well as verification of energy power quality. Connected to a web server, an Internet browser allows to use them very simply and export data in a Microsoft Excel™ type spreadsheet. Power curves can be plotted in real time by the spreadsheet (see Fig. K�).
Therefore no IT investment, either in software or hardware, is necessary to use the data.
For example to reduce the electricity bill and limit consumption during nighttime and weekends, we have to study trend curves supplied by the measurement units (see Fig. K�0).
Fig. K10 : A Test to stop all lighting B Test to stop air conditioning Here consumption during non-working hours seems excessive, consequently two decisions were taken: b reducing night time lighting b stopping air conditioning during weekends The new curve obtained shows a significant drop in consumption.
Fig. K9 : Example of electrical network protected and monitored via the Intranet site

Schneider Electric - Electrical installation guide 2009
K - Energy Efficiency in electrical installations
K�2
© S
chne
ider
Ele
ctric
- a
ll rig
hts
rese
rved
3 Diagnosis through electrical measurement
Measurement units MV protection and measurement relays
LV protection and measurement relays
Capacitor bank regulators
Insulation monitors
Examples Power Meter, Circuit Monitor
Sepam Masterpact & Compact Micrologic trip units
Varlogic Vigilohm System
Keep control over power consumption
Power, inst., max., min. b b b b -
Energy, reset capability b b b - -
Power factor, inst. b b b - -
Cos φ inst. - - - b -
Improve power supply availability
Current, inst., max., min., unbalance b b b b -
Current, wave form capture b b b - -
Voltage, inst., max., min., unbalance b b b b -
Voltage, wave form capture b b b - -
Device status b b b b -
Faults history b b b - -
Frequency, inst., max., min. b b b - -
THDu, THDi b b b b -
Manage electrical installation better
Load temperature, load and device thermal state
b b - b -
Insulating resistance - - - - b
Motor controllers LV variable speed drives
LV softstarters MV softstarters UPSs
Examples TeSys U ATV.1 ATS.8 Motorpact RVSS Galaxy
Keep control over power consumption
Power, inst., max., min. - b - b b
Energy, reset capability - b b b -
Power factor, inst. - - b b b
Improve power supply availability
Current, inst., max., min., unbalance b b b b b
Current, wave form capture - - - b b
Device status b b b b b
Faults history b b b b -
THDu, THDi - b - - -
Manage electrical installation better
Load temperature, load and device thermal state
b b b b b
Motor running hours - b b b -
Battery follow up - - - - b
Fig. K11 : Examples of measurements available via Modbus, RS485 or Ethernet
Below we give examples of measurements available via Modbus, RS485 or Ethernet (see Fig. K��):

Schneider Electric - Electrical installation guide 2009
K - Energy Efficiency in electrical installations
K�3
© S
chne
ider
Ele
ctric
- a
ll rig
hts
rese
rved
Based on the reports collected by the power monitoring system or energy information system, appropriate energy efficiency projects can be selected. There are various strategies for choosing which projects to implement:b Often organizations like to get started with relatively low-cost, easy projects to generate some quick wins before making larger investments.b The simple payback period (the length of time the project will take to pay for itself) is a popular method to rank and choose projects. Its advantage is simplicity of the analysis. The disadvantage is that this method may not take into account the full long-term impact of the project.b Other more complex methods such as net present value or internal rate of return can also be used. Additional effort is required to make the analysis, but a truer indication of the full project benefits is obtained.
Energy savings can be achieved in a number of ways:b Energy reduction measures that either use less energy to achieve the same results, or reduce energy consumption by ensuring that energy is not over-used beyond the real requirements. An example of the former is using high-efficiency lamps to provide the same illumination at lower energy cost. An example of the latter is reducing the number of lamps in over-illuminated areas to reduce lighting levels to the required level.b Energy cost saving measures that do not reduce the total energy consumed, but reduce the per-unit cost. An example is scheduling some activities at night to take advantage of time-of-day electricity tariffs. Peak demand avoidance and demand response schemes are other examples.b Energy reliability measures that not only contribute to operational efficiency by avoiding downtime, but which also avoid the energy losses associated with restarts or reworking spoiled batches.
4 Energy saving solutions
Fig. K12 : Comprehensive Energy strategy
ComprehensiveEnergy Strategy
ReduceConsumption
OptimizeUtilityCosts
ImproveReliability &Availability
4.� Motor systems and replacement
Since in industry, 60% of consumed electricity is used to run motors, there is a high likelihood that motor systems will appear strongly among the identified opportunities. Two reasons to consider replacing motors and thereby improve passive energy efficiency are:
b to take advantage of new high-efficiency motor designs
b to address oversizing
Depending on horsepower, high efficiency motors operate between 1% and 10% more efficiently than standard motors. Motors that operate for long periods may be good candidates for replacement with high efficiency motors, especially if the existing motor needs rewinding. Note that rewound motors are usually 3% – 4% less efficient than the original motor. However, if the motor receives low to moderate use (e.g. under 3000 hours per year), replacement of standard efficiency motors (particularly those that have not yet been re-wound) with high efficiency motors may not be economical. Also, it is important to ensure the critical performance characteristics (such as speed) of the new motor are equivalent to those of the existing motor.
Fig. K13 : Definition of energy efficiency classes for LV motors established by the European Commission and CEMEP (European Committee of Manufacturers of Electrical Machines and Power Electronics)
95
90
85
80
75
701 15 90
Rated Power (kW)
Effi
cien
cy (
%)
EFF 3EFF 2
EFF 14 pole
2 pole 2 & 4pole

Schneider Electric - Electrical installation guide 2009
K - Energy Efficiency in electrical installations
K�4
© S
chne
ider
Ele
ctric
- a
ll rig
hts
rese
rved
Motors are most efficient when operated between about 60% and 100% of their full-rated load. Efficiency falls sharply when loading is below 50%. Historically, designers have tended to oversize motors by a significant safety margin in order to eliminate any risk of failure even under extremely unlikely conditions. Facility studies show that about one-third of motors are severely oversized and generally are running below 50% of rated load (1). Average loading of motors is around 60%(2). Oversized motors are not only inefficient but have higher initial purchase cost than correctly-sized units. Larger motors can also contribute to lower power factor, which may lead to reactive power charges on the electricity bill. Replacement considerations should take this into account along with the remaining useful life of the motor. In addition, note that some motors may be oversized but still be so lightly loaded or infrequently used that they do not consume enough electricity to make it cost-effective to install a different motor.
Clearly, wherever appropriate the two approaches should be combined to replace over-sized standard motors with high-efficiency motors sized suitably for the application.
Other tactics which can be applied to motor systems include:
b Improve active energy efficiency by simply turn off motors when they are not required. This may require improvements in automatic control, or education, monitoring and perhaps incentives for operators. If the operator of the motor is not accountable for its energy consumption, they are more likely to leave it running even when not in use.
b Check and if necessary correct shaft alignment, starting with the largest motors. Misaligned motor couplings waste energy and eventually lead to coupling failure and downtime. An angular offset of 0.6 mm in a pin coupling can result in a power loss of as much as 8%.
4.2 Pumps, fans and variable speed drives
63% of energy used by motors is for fluid applications such as pumps and fans. Many of these applications run the motor at full speed even when lower levels of flow are required. To obtain the level of flow needed, inefficient methods such as valves, dampers and throttles are often used. In a car, these methods would be equivalent to using the brake to control speed while keeping the gas or accelerator pedal fully depressed. These are still some of the most common control methods used in industry. Given that motors are the leading energy-consuming device, and pumps and fans are the largest category of motor-driven equipment, these applications are frequently among the top-ranked energy saving opportunities.
An Altivar variable speed drive is an active EE approach that can provide the means to obtain the variable output required from the fan or pump along with significant energy savings and other benefits. Well-chosen projects can result in simple payback periods as short as ten months, with many useful projects in the range of paybacks up to three years. Variable speed drives (VSD) can be useful in many applications, including air compressors, plastic injection moulding machines, and other machines.
(1) Operations and Maintenance Manual for Energy Management - James E. Piper(2) US Department of Energy fact sheet
Fig. K14 : Examples of centrifugal pump and fan which can benefit from variable speed control
4 Energy saving solutions

Schneider Electric - Electrical installation guide 2009
K - Energy Efficiency in electrical installations
K�5
© S
chne
ider
Ele
ctric
- a
ll rig
hts
rese
rved
4 Energy saving solutions
Most pumps are required either to move fluids between a source and a destination (e.g. filling a reservoir at a higher level) or to circulate liquid in a system (e.g. to transfer heat). Fans are required to move air or other gases, or to maintain a pressure differential. To make the liquid or air flow at the required rate, pressure is required. Many pumping or ventilation systems require the flow or pressure to vary from time to time.
To change the flow or pressure in the system, there are a number of possible methods. The suitability will depend on the design of the fan or pump, e.g. whether a pump is a positive displacement pump or rotodynamic pump, whether a fan is a centrifugal fan or axial fan.
b Multiple pumps or fans: This leads to step increase when additional pumps or fans are switched in, making fine control difficult. Usually there are efficiency losses as the real needs are somewhere between the possible steps.
b Stop/start control: This is only practical where intermittent flow is acceptable.
b Flow control valve: This uses a valve to reduce the flow by increased frictional resistance to the output of the pump. This wastes energy since the pump is producing a flow which is then cut back by the valve. In addition, pumps have a preferred operating range, and increasing the resistance by this method can force the pump to operate in a range where its efficiency is lower (wasting even more energy) and where its reliability is reduced.
b Damper: Similar in effect to a flow control valve in a pumping system, this reduces the flow by obstructing the output of the fan. This wastes energy since the fan is producing a flow which is then cut back by the damper.
b Bypass control: This technique keeps the pump running at full power and routes surplus fluid output from the pump back to the source. It allows a low value of flow to be achieved without risk of increasing the output pressure, but inefficiency is very high since the energy used to pump the surplus fluid is entirely wasted.
b Spillage valve: Similar in effect to a bypass control valve in a pumping system, this technique keeps the fan running at full power and vents surplus flow. Inefficiency is very high since the energy used to move the vented air or gas is entirely wasted.
b Variable pitch: Some fan designs allow the angle of the blades to be adapted to change the output.
b Inlet guide vane: these are structures using fins to improve or disrupt the routing of air or gas into a fan. In this way they increase or decrease the airflow going in and hence increase or decrease the output.
Wherever a fan or a pump has been installed for a range of required flow rates or pressure levels, it will have been sized to meet the greatest output demand. It will therefore usually be oversized, and will be operating inefficiently for other duties. Combining this with the inefficiency of the control methods listed above means that there is generally an opportunity to achieve an energy cost saving by using control methods which reduce the power to drive the pump or fan during the periods of reduced demand. However, a fan or pump that is not required to perform variable duties may be running at full speed without any of the above control methods, or with those control methods present but unused (e.g. valves or dampers set to fully open). In this case the device will be operating at or close to its best efficiency and a variable frequency drive will not bring any improvement.
Fig. K15 : Fan and pump control: in theory
motor
fixedshaft speed
100% of nominal output
100% of nominal
reduced output 50% of nominal
motor
variableshaft speed
50% of nominal
output50% of nominal
unchanged output 50% of nominal
VSD
powerconsumed12.5% ofnominal
fan orpump
sensoractuator
fan orpump
damperor valve
open
sensor
Schneider Electric - Electrical installation guide 2009
K - Energy Efficiency in electrical installations
K�6
© S
chne
ider
Ele
ctric
- a
ll rig
hts
rese
rved
For those fans and pumps which are required to generate varying levels of output, a variable frequency drive reduces the speed of the pump or fan and the power it consumes. Among fans, effectiveness will vary depending on the design. Centrifugal fans offer good potential, both with forward curved and backward curved impellers. Axial fans have a greater intrinsic efficiency and normally do not offer enough economic potential for a VSD application. In pumps, the effectiveness will vary depending on a number of factors, including the ‘static head’ of the system (the effects of a difference in height between the source and destination of the fluid) and ‘friction head’ (the effects of the liquid moving in the pipes, valves and equipment). The variable frequency drive should always be matched with the safe operating range of the pump. Generally, variable speed drives bring greater benefits in systems where the friction head is the dominant effect. In some cases, replacing the fan or pump with a more efficient design may bring greater benefits than retrofit of a VSD. A fan or pump that is infrequently used, even if it is inefficient, may not generate enough savings to make replacement or VSD retrofit cost-effective. However note that flow control by speed regulation is always more efficient than by control valve or bypass control.
Fan and pump applications are governed by the affinity laws:
b Flow is proportional to shaft speedv Half the shaft speed gives you half the flow
b Pressure or head is proportional to the square of shaft speedv Half the shaft speed gives you quarter the pressure
b Power is proportional to the cube of shaft speedv Half the shaft speed uses one–eighth of the powerv Hence half the flow uses one-eighth of the power
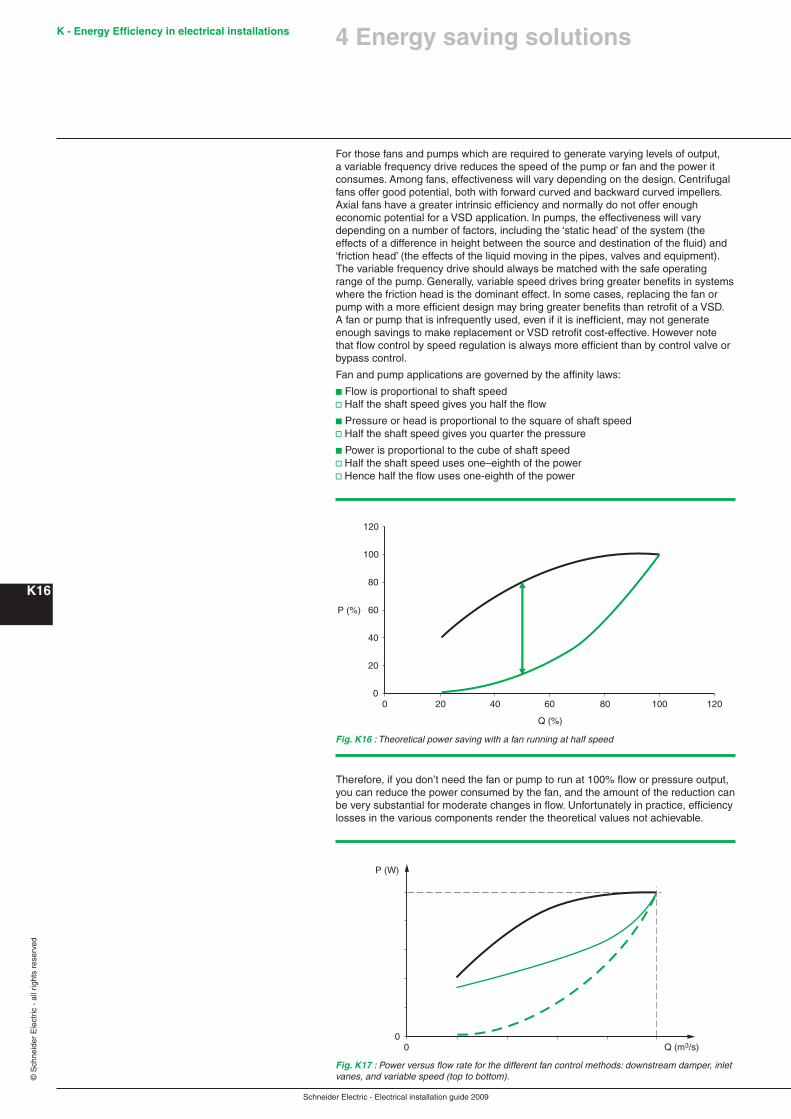
Therefore, if you don’t need the fan or pump to run at 100% flow or pressure output, you can reduce the power consumed by the fan, and the amount of the reduction can be very substantial for moderate changes in flow. Unfortunately in practice, efficiency losses in the various components render the theoretical values not achievable.
Fig. K16 : Theoretical power saving with a fan running at half speed
0
20
40
60
80
100
120
0 20 40 60 80 100 120
Q (%)
P (%)
Fig. K17 : Power versus flow rate for the different fan control methods: downstream damper, inlet vanes, and variable speed (top to bottom).
0
P (W)
0 Q (m3/s)
4 Energy saving solutions

Schneider Electric - Electrical installation guide 2009
K - Energy Efficiency in electrical installations
K�7
© S
chne
ider
Ele
ctric
- a
ll rig
hts
rese
rved
The actual achievable savings depend on the design of the fan or pump, its inherent efficiency profile, the size of the motor, the number of hours used per year, and the local cost of electricity. These savings can be estimated using a tool such as ECO8, or can be accurately forecast by installing temporary metering and analyzing the data obtained in the context of the appropriate curve.
The drive can be integrated into a variety of possible control methods:
b Control by fixing pressure but varying flow: This uses a pressure sensor connected to the VSD which in turn varies the speed allowing the fan or pump to increase or decrease the flow required by the system. This is a common method in water supply schemes where constant pressure is required but water is required at different flows dependant on the number of users at any given time. This is also common on centralised cooling and distribution systems and in irrigation where a varying number of spray heads or irrigation sections are involved.
b Heating system control: In heating and cooling systems there is a requirement for flow to vary based on temperature. The VSD is controlled by a temperature sensor, which increases or decreases the flow of hot or cold liquid or air based on the actual temperature required by the process. This is similar to pressure control, where the flow also varies, but a constant temperature requirement from a temperature sensor replaces that from a pressure sensor.b Control by fixing flow but varying pressure: Constant flow may be required in irrigation and water supply systems. Since the water levels both upstream and downstream of the pumping station can change, the pressure will be variable. Also many cooling, chiller, spraying and washing applications require a specific volume of water to be supplied even if the suction and delivery conditions vary. Typically suction conditions vary when the height of a suction reservoir or tank drops and delivery pressure can change if filters blind or if system resistance increases occur through blockages etc. A flowmeter is used to keep the flow rate constant, normally installed in the discharge line.The benefits achieved include:b Reduced energy consumption and hence cost savings by replacing inefficient control methods or other obsolete components such as two-speed motorsb Better control and accuracy in achieving required flow and pressureb Reduced noise and vibration, as the inverter allows fine adjustment of the speeds and so prevents the equipment running at a resonant frequency of the pipes or ductworkb Increased lifecycle and improved reliability, for example, pumps that are operated in a throttled condition usually suffer from reduced useful lifeb Simplified pipe or duct systems (elimination of dampers, control valves & by-pass lines)b Soft start & stop creates less risk of transient effects in the electrical network or mechanical stress on the rotating parts of the pump or fan. This also reduces water hammer in pumps, because the drive provides smooth acceleration and deceleration instead of abrupt speed variationsb Reduced maintenance
Additionally, significant energy savings can be often be made simply by changing pulley sizes, to ensure a fan or pump runs at a more appropriate duty point. This doesn’t provide the flexibility of variable speed control but costs very little, can probably be done within the maintenance budget and doesn’t require capital approval.
4 Energy saving solutions
Without VSD With VSD Reduction % savings
Average power use (2 motors per fan)
104 kW per motor
40 kW per motor 64 kW per motor 62%
Electricity cost per fan
£68.66 per tonne output
£26.41 per tonne output
£42.25 per tonne output
CO2 rate 459,000 kg / year
175,541 kg / year
283,459 kg / year
Annual running cost
£34,884 £13,341 £21,542
Payback period 10 months with local capital allowances claimed14 months without local capital allowances
Fig. K18 : Example of savings for variable speed driven pumps

Schneider Electric - Electrical installation guide 2009
K - Energy Efficiency in electrical installations
K��
© S
chne
ider
Ele
ctric
- a
ll rig
hts
rese
rved
4.3 Lighting
Lighting can represent over 35% of energy consumption in buildings depending on the business. Lighting control is one of the easiest ways to save energy costs for low investment and is one of the most common energy saving measures.
Lamps and ballastsLighting design for commercial buildings is governed by standards, regulations and building codes. Lighting not only needs to be functional but must meet occupational health and safety requirements and be fit for purpose. In many instances, office lighting is over-illuminated, and substantial energy savings are possible by passive EE: replacing inefficient, old technology lamps with high efficiency, low wattage lamps in conjunction with electronic ballasts. This is especially appropriate in areas where lighting is required constantly or for long periods, because in such places there is less opportunity to save energy by turning lights off. Simple payback periods vary but many projects have paybacks of around two years.Depending on the needs, type and age of your lighting installation, more efficient lamps may be available. For example, 40-watt T12 fluorescent lamps may be replaced by newer 32-watt T8 fluorescent lamps. (T designates a tubular lamp. The number is the diameter in eights of an inch. T12 lamps are therefore 1.5 inches in diameter. Standards vary between countries.) Changing the lamp will also require changing the ballast.Fluorescent lamps contain gases that emit ultraviolet light when excited by electricity. The phosphor coating of the lamp converts the ultraviolet light into the visible spectrum. If the electricity entering the lamp is not regulated, the light will continue to gain in intensity. A ballast supplies the initial electricity to create the light and then regulates the current thereafter to maintain the correct light level. Ballasts are also used with arc lamps or mercury vapor lamps. New designs of electronic ballasts deliver considerable savings compared with older electromagnetic ballast designs.T8 lamps with electronic ballasts will use from 32% to 40% less electricity than T12 lamps with electromagnetic ballasts.Electronic ballasts do have a disadvantage compared to magnetic ballasts. Magnetic ballasts operate at line frequency (50 or 60 Hz), but electronic ballasts operate at 20,000 to 60,000 Hz and can introduce harmonic distortion or noise into the electrical network. This can contribute to overheating or reduced life of transformers, motors, neutral lines, overvoltage trips and damage to electronics. Usually this is not a problem apart from facilities with heavy lighting loads and a large number of electronic ballasts. Most makes of electronic ballasts integrate passive filtering within the ballast to keep the total harmonic distortion to less than 20 percent of fundamental current. If the facility has strict needs for power quality, (e.g. hospitals, sensitive manufacturing environments, etc) electronic ballasts are available having total harmonic distortion of five percent or less.Other types of lighting are also available and may be suitable depending on the requirements of the facility. An assessment of lighting needs will include evaluation of the activities taking place and the required degree of illumination and colour rendering. Many older lighting systems were designed to provide more light than current standards require. Savings can be made by redesigning a system to provide the minimum necessary illumination. The use of high efficiency lamps in conjunction with electronic ballasts have a number of advantages, firstly energy and cost savings can be easily qualified, modern lamps and electronic ballasts are more reliable leading to reduced maintenance costs, lighting levels are restored to more appropriate levels for office space, whilst complying with relevant building codes, practices and lighting standards, the incidence of ‘frequency beat” often associated with migraines and eye strain disappears and the color rendering of modern lamps produces a more conducive working environment.
ReflectorsA less common passive EE recommendation, but one which should be considered along with changing lamps and ballasts, is to replace reflectors. The reflector in a luminaire (light fixture) directs light from the lamps towards the area where it is intended to fall. Advances in materials and design have resulted in improved reflector designs which can be retrofitted to existing luminaires. This results in increased usable light, and may allow lamps to be removed, this saving energy while maintaining the needed level of lighting.
4 Energy saving solutions
Schneider Electric - Electrical installation guide 2009
K - Energy Efficiency in electrical installations
K��
© S
chne
ider
Ele
ctric
- a
ll rig
hts
rese
rved
A KW2 high efficiency reflector has a spectral efficiency of over 90%. This means two lamps may be replaced by a single lamp. In this way it is possible to reduce energy costs attributed to lighting by 50% or more. Existing luminaires may be retrofitted with the space age technology reflector, whilst maintaining spatial distance between luminaires, making retrofitting easy and cost effective, with minimal disruption to the existing ceiling design.
Lighting controlImproved lighting control is another method of increasing efficiency in lighting. Such recommendations are less common, but the simple payback period is typically shorter, between six and twelve months. By itself, passive EE from lamps, ballasts and reflectors does not maximize savings, since an energy efficient lamp will still waste energy if left on when not required. Although users can be sensitized to switch off lights, in practice lapses are common, and automatic control is much more effective in obtaining and sustaining efficiency. The objective of lighting control schemes is to provide the comfort and flexibility that users require, while simultaneously ensuring active EE, minimizing costs by ensuring lights are turned off promptly whenever they are not needed. The sophistication of such schemes can vary considerably.Some of the simplest methods include:b Timer switches to turn off lights after a fixed period has passed. Timers are best deployed in areas where occupancy is well defined (e.g. in hotel corridors where the time for a person to pass through is predictable).b Occupancy sensors / movement detectors to turn off lights when no movement has been detected for a certain period. Occupancy sensors are best deployed in offices, storerooms, stairwells, kitchens and bathrooms where the use of the facilities cannot be predicted with a high degree of accuracy during the day.b Photoelectric cells / daylight harvesting sensors to control lights near windows. When bright exterior light is available, lamps are turned off or dimmed.b Programmable timers to switch lights on and off at predetermined times (e.g. shop fronts, ensure office lights are turned off at nights and weekends).b Dimmable lights to maintain a low level of illumination at off-peak periods (e.g. a car parking lot which needs to be fully illuminated during peak use, perhaps until midnight, but which can have lower ambient illumination from midnight until dawn)b Voltage regulators to optimize the power consumed. Ballasts perform this function on fluorescent lighting. Voltage regulators are also available for other lighting types such as high pressure sodium lamps.
4 Energy saving solutions
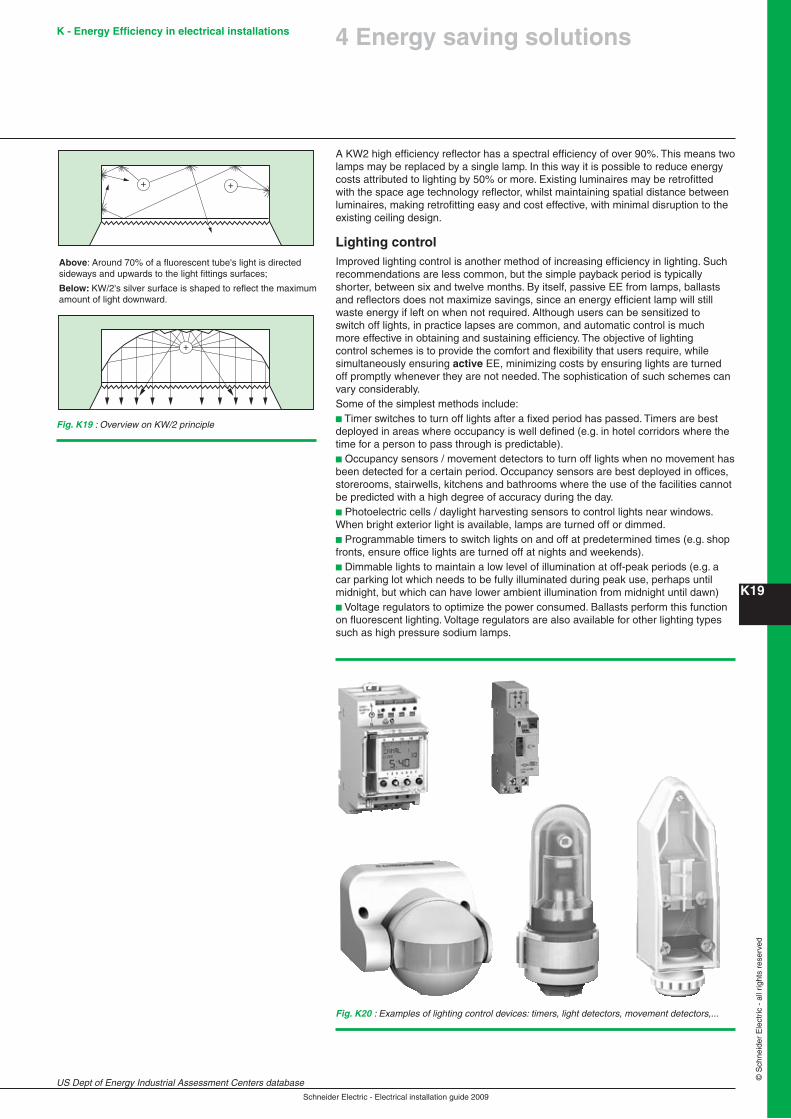
+ +
Above: Around 70% of a fluorescent tube's light is directedsideways and upwards to the light fittings surfaces;
Below: KW/2's silver surface is shaped to reflect the maximumamount of light downward.
+
Fig. K19 : Overview on KW/2 principle
Fig. K20 : Examples of lighting control devices: timers, light detectors, movement detectors,...
US Dept of Energy Industrial Assessment Centers database

Schneider Electric - Electrical installation guide 2009
K - Energy Efficiency in electrical installations
K20
© S
chne
ider
Ele
ctric
- a
ll rig
hts
rese
rved
Methods may be combined, e.g. the ability to dim lights in the parking lot may be combined with movement detectors or override switches with a timer to increase illumination when needed if a user requires access outside normal hours.More sophisticated and customizable schemes can be implemented with integrated lighting control systems. Aesthetic requirements can be incorporated, such as using programmable lighting panels to record a variety of lighting setups which can be reproduced at the touch of a button (e.g. for boardrooms requiring different light arrangements for meetings, presentations, demonstrations, etc). Wireless technology can make retrofit applications simple and economical.Lighting control systems such as C-Bus and KNX offer the additional advantage that they can be networked and integrated with the building management system, for greater flexibility of control, central monitoring and control function as well as combination of lighting controls with other building services such as HVAC for even greater energy savings.Lighting controls have the potential to realize energy savings of 30% but this depends very much on application. A lighting survey and energy audit can help define the best lighting solution for the premises and activities performed as well as identify areas for energy and cost savings. In addition to office space, Schneider offers solutions for exterior, car parking and landscape lighting for optimum lighting and energy savings.
4.4 Load management strategies
Since electricity has to be generated in response to immediate needs, and cannot economically be stored, suppliers are obliged to size their generating capacity according to peak needs, which may occur infrequently. At other times, that capacity is surplus and represents capital tied up in facilities and equipment that are idle and unused. Suppliers are therefore motivated to smooth out peaks in electricity demand.Load management requires an active EE approach, since even high-efficiency devices will contribute to peak needs.
Peak demand avoidanceOne way utilities encourage users to avoid peaks is by transferring the cost of maintaining the peak production capacity to those users who contribute most to the peaks. Utilities structure their billing with various components. One is always the actual consumption in the billing period, but another component (the demand charge) is normally based on the peak usage at some point during the preceding period, which could be twelve months or another period such as a season. The demand charge is a premium that large users pay each month for the utility to have the extra generation capacity and infrastructure required to meet their peak demand levels whenever they need it – even if they don’t use it very often. If a customer can avoid setting peaks in their energy usage, they can minimize the part of their energy bill driven by the peak consumption, even if their total consumption remains the same. Note that setting a new peak has a continuing economic impact, because it determines the demand charge not only for that month, but for each subsequent month during the period defined by the tariff, which may be as much as a year. This means that a single short event that spikes consumption for as little as a few minutes can have a continuing effect on the electricity bill.
Fig. K21 : Example of load management strategy
kW
Time
Shaved PeakDemand
Peak Demand
Peak Usagerescheduledto fit underlower threshold
4 Energy saving solutions

Schneider Electric - Electrical installation guide 2009
K - Energy Efficiency in electrical installations
K2�
© S
chne
ider
Ele
ctric
- a
ll rig
hts
rese
rved
Peak demand avoidance applications are PLC controlled automatic electrical distribution control systems. A demand interval is defined as a particular level of consumption in a period of time (e.g. kWh in a 15 minute period). The objective is to keep the total energy consumed in each period below the limit. If the customer is consuming a large amount of power in a given period, the system will detect that a peak is approaching. An alarm is activated, and unless an operator overrides the system, it will begin to shed non-essential loads in a predetermined order, until the alarm condition is cleared, or the demand interval ends. All loads in a facility are defined in one of three categories: critical, essential, and non-essential loads. Usually only non-essential loads are shed, and the order of shedding can be configured.
Providing the customer has enough non-essential loads to be able to impact their peak consumption, it may be possible to reduce the demand charge by as much as 10% to 30%. Demand charge can be up to 60% of the bill. The application usually pays for itself in one year or less.
Load schedulingUtilities often have different rates that apply for different times of the day. During normal daily business hours, the rates are the highest. Many users shift, or reschedule loads to take advantage of lower rates. These are loads that are not time sensitive or critical.
Demand response (curtailment)Another tactic is demand response (also known as demand curtailment). Demand response is a means to manage the demand from customers taking supply conditions into account. Utilities may offer financial incentives to customers to reduce load during periods when the utility does not have the distribution capacity to handle the total demand. Typically this will be during the hottest months of the year, when consumer and business needs for cooling and ventilation are high and draw a lot of electricity in addition to normal requirements. In some countries, third-party aggregators may manage schemes that monitor the network capacity and the real-time price of electricity on the network. Participants in the scheme receive incentives to shed load, creating capacity which the aggregator can sell into the network.In each case, the utility or aggregator offers a contract including an agreement from the customer to reduce the kW consumption at their site down to a predetermined level when notified. These contracts may contain both emergency curtailments (when the participants in the scheme must comply or face penalties) and opt-in curtailments (where participants can evaluate the specific conditions for that particular curtailment and decide whether or not to accept). Usually the contract limits the duration of the curtailment (e.g. 2 to 6 hours) and the number of times per year the curtailment can be activated (3 to 5). Industrial customers tend to have more opportunity to participate, since building managers are less likely to be able to drop substantial loads without impacting the building occupants’ comfort.
4 Energy saving solutions
kW
1 2 3 4 5
Peak during month 2
The peak set during month 2 will dictate the demand charge for the next 12 months (or some other peirod set by the tariff).
The bill for month 4 will be based on the consumption (green) and the peak set during month 2 (red line).
Fig. K22 : Impact of peak demand on electricity bill

Schneider Electric - Electrical installation guide 2009
K - Energy Efficiency in electrical installations
K22
© S
chne
ider
Ele
ctric
- a
ll rig
hts
rese
rved
A curtailment is activated following a notification by phone or via a signal output from the utility revenue meter. Typically there is 30 to 60 minutes advance notice. The customer systematically reduces load until the curtailment level is obtained, either by manually reducing or shutting off loads or by an automated PLC controlled system. The utility or aggregator then signals the start of the curtailment period. After the curtailment period is complete, the utility or aggregator signals the end of the curtailment period. The customer may then re-establish normal facility loading and production.The return on investment from demand response schemes will vary depending on local tariff rates and electricity market. The incentive generally takes the form of a credit for the demand reduction during the response period. If the customer has enough non-essential loads to be able to impact peak consumption, he may be able to benefit from incentives that in effect reduce the cost per unit by as much as 30%. Automated demand response control applications usually pay for themselves in one year or less. Without such a scheme, loads have to be turned off manually, with a significant chance of failure, for example, if a human operator does not act quickly enough. Failing to comply with a curtailment brings financial penalties, and so an automated application which can support both peak demand avoidance and demand curtailment can be a very good investment. Together with the control applications, a demand response portal can make participation in a demand response scheme much more convenient. Such a portal provides a means for a utility or aggregator to notify the participants of emergency or opt-in events. Participants can evaluate the conditions of an opt-in and view their current consumption and what they would have to do in order to comply with the request before accepting or rejecting the event. The portal also supports auditing or completed events to demonstrate compliance with the conditions.
On-site generationOn-site generation increases the flexibility available to facility operators. Instead of shedding loads, on-site generation can provide the power required to keep running during a period of peak avoidance or demand curtailment. The automated control system can be extended to integrate control of on-site generation facilities into the scheme. If the customer is buying electricity from a supplier at a time-of-use rate, the control system can be configured to continuously monitor the current cost of electricity from the supplier and compare it to the cost of energy generated on site using another fuel source. When the cost of electricity rises above the cost of using the generator (replacing the fuel), the control scheme automatically shifts load to the on-site generation. When the cost falls, load is shifted back to the supply utility.However, in many places the local authorities only permit diesel generators to be used for a certain maximum number of hours per year, in order to limit emissions. This has to be taken into account as it limits the opportunities to make use of the generator.
4.5 Power factor correction
If the electricity supplier charges penalties for reactive power, implementing power factor correction has the potential to bring significant savings on the electricity bill. Power factor correction solutions are typically passive EE measures that operate transparently once installed, and don’t require any changes to existing procedures or behaviour of staff. Simple payback periods can be less than a year.Power factor correction is treated in detail in chapter L.
4.6 Harmonic filtering
Many solutions to improve efficient use of electricity can have side effects, bring harmonics into the electrical network. High-efficiency motors, variable speed drives, electronic ballasts for fluorescent lights, and computers can all generate electrical pollution which can have significant effects. Harmonics can create transient over-voltage conditions that cause protection relays to trip and result in production downtime. They increase heat and vibration and thereby decrease efficiency and shorten life of neutral conductors, transformers, motors and generators. Power factor correction capacitors may magnify harmonics, and can suffer from overloading and premature aging. Management of harmonics is treated in detail in chapter M.
4 Energy saving solutions

Schneider Electric - Electrical installation guide 2009
K - Energy Efficiency in electrical installations
K23
© S
chne
ider
Ele
ctric
- a
ll rig
hts
rese
rved
4.7 Other measures
Outside the scope of the electrical installation, other energy savings measures may be available depending on the activities present on the site. Productivity enhancements in production such as reducing bottlenecks, eliminating defects and reducing materials can generate further savings. Combustion systems (such as furnaces, ovens, boilers) and thermal systems (such as steam systems, heat generation, containment and recovery, cooling towers, chillers, refrigerators, dryers) may also provide opportunities.
4.� Communication and Information System
Most organisations will already have some level of energy information system, even if it is not identified or managed as one. It should be appreciated that in a changing working world, any information system will need to develop to meet its prime objective - supporting management decision making: a key point is to make the energy information visible at any level of the organization through the communication infrastructure.
Energy data is important data, it is one of the company’s assets. The company has IT managers who are already in charge of managing its other IT systems. These are important players in the power monitoring system and above all in that for data exchange within the corporate organization.
Communication network at product, equipment and site level The day-to-day working of the energy information system can be illustrated by aclosed loop diagram (see Fig. K23).
4 Energy saving solutions
Fig. K23 : System hierarchy
Data
Information
Understanding
* Communication network
Modbus*Intranet*
Energy information systems
Communicating
measurement device*
Various resources are used to send data from metering and protection devices installed in the user’s electrical cabinets, e.g. via Schneider ElectricTransparent Ready™.

Schneider Electric - Electrical installation guide 2009
K - Energy Efficiency in electrical installations
K24
© S
chne
ider
Ele
ctric
- a
ll rig
hts
rese
rved
The Modbus communication protocolModbus is an industrial messaging protocol between equipment that is interconnected via a physical transmission link e.g. RS 485 or Ethernet (via TCP/IP) or modem (GSM, Radio etc). This protocol is very widely implemented on metering and protection products for electrical networks.
Initially created by Schneider Electric, Modbus is now a public resource managed by an independent organization Modbus-IDA – enabling total opening up of its specification. An industrial standard since 1979, Modbus allows millions of products to communicate with one another. The IETF, international authority managing the Internet, has approved the creation of a port (502) for products connected to the Internet/Intranet and using the Ethernet Modbus TCP/IP communication protocol.
Modbus is a query/reply process between two pieces of equipment based on data reading and writing services (function codes).The query is emitted by a single “master”, the reply is sent only by the “slave” equipment identified in the query (see Fig. K24).Each “slave” product connected to the Modbus network is set by the user with an ID number, called the Modbus address, between 1 and 247.The “master” – for example a web server included in an electrical cabinet – simultaneously queries all of the products with a message comprising its target’s address, function code, memory location in the product and quantity of information, at most 253 octets.Only a product set with the corresponding address answers the request for data.Exchange is only carried out on the initiative of the master (here the web server): this is the master-slave Modbus operating procedure.
This query procedure followed by a reply, implies that the master will have all of the data available in a product when it is queried.The “master” manages all of the transaction queries successively if they are intended for the same product. This arrangement leads to the calculation of a maximum number of products connected to the master to optimize an acceptable response time for the query initiator, particularly when it is a low rate RS485 link.
Your Intranet network
Data exchange from industrial data basically uses web technologies implemented permanently on the corporate communication network, and more particularly on its Intranet.
The IT infrastructure manages the cohabitation of software applications: the company uses it to operate applications for the office, printing, data backup, for the corporate IT system, accounting, purchasing, ERP, production facility control, API, MES, etc. The cohabitation of data on the same communication network does not pose any particular technological problem.
When several PC’s, printers and servers are connected to one another in the company’s buildings, very probably using the Ethernet local network and web services: this company is then immediately eligible to have energy efficiency data delivered by its electrical cabinets. Without any software development, all they need is an Internet browser.
Fig. K24 : The function codes allow writing or reading of data. A transmission error software detection mechanism called CRC16 allows a message with an error to be repeated and only the product concerned to respond.
4 Energy saving solutions

Schneider Electric - Electrical installation guide 2009
K - Energy Efficiency in electrical installations
K25
© S
chne
ider
Ele
ctric
- a
ll rig
hts
rese
rved
4 Energy saving solutions
The data from these applications cross the local broadband Ethernet network up to 1 Gb/s: the communication media generally used in this world is copper or optic fiber, which allows connection everywhere, in commercial or industrial buildings and in electrical premises.
If the company also has an internal Intranet communication network for emailing and sharing web servers data, it uses an extremely common standardized communication protocol: TCP/IP.
The TCP/IP communication protocol is designed for widely used web services such as HTTP to access web pages, SMTP for electronic messaging between other services.
Applications SNMP NTP RTPS DHCP TFTP FTP HTTP SMTP Modbus
Transport UDP TCP
Link IP
Physical Ethernet 802.3 and Ethernet II
Electrical data recorded in industrial web servers installed in electrical cabinets are sent using the same standardized TCP/IP protocol in order to limit the recurrent IT maintenance costs that are intrinsic in an IT network. This is the operating principle of Schneider Electric Transparent ReadyTM for communication of data on energy efficiency. The electrical cabinet is autonomous without the need for any additional IT system on a PC, all of the data related to energy efficiency is recorded and can be circulated in the usual way via the intranet, GSM, fixed telephone link, etc.
SecurityEmployees are well informed, more efficient and working in complete electrical safety: they no longer need to go into electrical rooms or make standard checks on electrical devices - they just have to consult data. Under these conditions, communicative systems give the company’s employees immediate and significant gains and avoid worrying about making mistakes.It becomes possible for electricians, maintenance or production technicians, on-site or visiting managers to work together in complete safety.According to the sensitivity of data, the IT manager will simply give users the appropriate access rights.
Marginal impact on local network maintenanceThe company’s IT manager has technical resources to add and monitor equipment to the local company network.Based on standard web services including the Modbus protocol on TCP/IP, and due to the low level of bandwidth requirement characteristic in electrical network monitoring systems as well as the use of technologies that are not impacted by viruses and worldwide IT standards, the IT manager does not have to make any specific investment to preserve the local network performance level or to protect against any additional security problems (virus, hacking, etc.).
Empowering external partnersAccording to the company’s security policy, it becomes possible to use support services of the usual partners in the electrical sector: contractors, utilities managers, panelbuilders, systems integrators or Schneider Electric Services can provide remote assistance and electrical data analysis to the company consuming electricity.The messaging web service can regularly send data by email or web pages can be remotely consulted using the appropriate techniques.
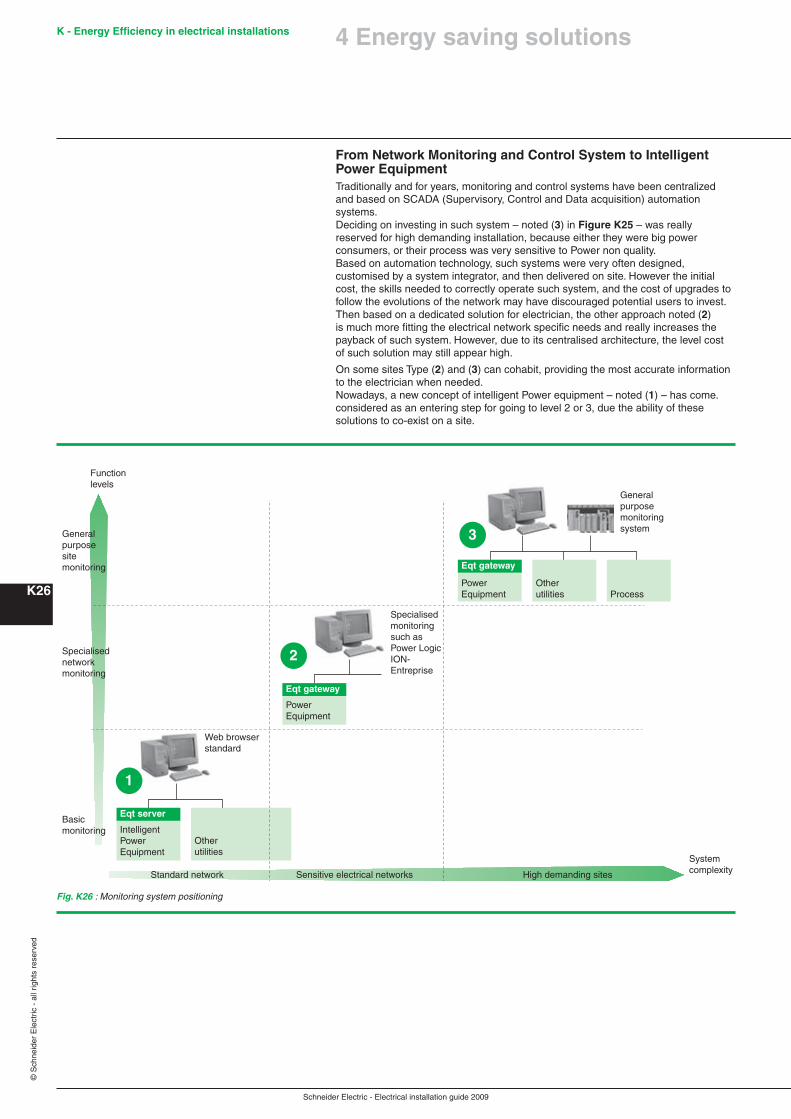
Schneider Electric - Electrical installation guide 2009
K - Energy Efficiency in electrical installations
K26
© S
chne
ider
Ele
ctric
- a
ll rig
hts
rese
rved
From Network Monitoring and Control System to Intelligent Power Equipment Traditionally and for years, monitoring and control systems have been centralized and based on SCADA (Supervisory, Control and Data acquisition) automation systems. Deciding on investing in such system – noted (3) in Figure K25 – was really reserved for high demanding installation, because either they were big power consumers, or their process was very sensitive to Power non quality. Based on automation technology, such systems were very often designed, customised by a system integrator, and then delivered on site. However the initial cost, the skills needed to correctly operate such system, and the cost of upgrades to follow the evolutions of the network may have discouraged potential users to invest. Then based on a dedicated solution for electrician, the other approach noted (2) is much more fitting the electrical network specific needs and really increases the payback of such system. However, due to its centralised architecture, the level cost of such solution may still appear high.
On some sites Type (2) and (3) can cohabit, providing the most accurate information to the electrician when needed.Nowadays, a new concept of intelligent Power equipment – noted (�) – has come. considered as an entering step for going to level 2 or 3, due the ability of these solutions to co-exist on a site.
Specialisedmonitoringsuch as Power LogicION-Entreprise
Wstandard
eb browser
PowerEquipment
Otherutilities Process
Eqt gateway
1
2
3
IntelligentPowerEquipment
Otherutilities
Eqt server
PowerEquipment
Eqt gateway
Generalpurposesitemonitoring
Functionlevels
Specialisednetworkmonitoring
Basicmonitoring
Standard network Sensitive electrical networks High demanding sites
Systemcomplexity
Generalpurposemonitoringsystem
Fig. K26 : Monitoring system positioning
4 Energy saving solutions

Schneider Electric - Electrical installation guide 2009
K - Energy Efficiency in electrical installations
K27
© S
chne
ider
Ele
ctric
- a
ll rig
hts
rese
rved
4 Energy saving solutions
b Level �
Intelligent equipment based architecture (see Fig. K26)This new architecture has appeared recently due to Web technology capabilities, and can really be positioned as an entry point into monitoring systems.Based on Web technologies it takes the maximum benefits of standardcommunication services and protocols, and license-free software.The access to electricity information can be done from everywhere in the site, and electrical staff can gain a lot in efficiency.Openness to the Internet is also offered for out of the site services.
b Level 2
Electrician specialized centralised architecture (see Fig. K27)Dedicated to electrician, this architecture is based on a specific supervision centralised mean that fully match the needs for monitoring an electrical network.Then it offers naturally a lower level of skill to set up and maintain it – all Electrical Distribution devices are already present in a dedicated library. Finally its purchase cost is really minimized, due the low level of system integrator effort.
Meter 11 2 3
Circuit breakersMeter 2 Meter 3
Equipment serverGateway
Modbus
Intelligence Power Equipment
Standard remoteWeb browser
Standard local Web browser
Intranet (Ethernet/IP)
Internet
Fig. K26 : Intelligent equipment architecture
Fig. K27 : ED specialist monitoring system
Meter 1 Meter 2 Meter 3
Gateway
Modbus
Communicating Power Equipment
Dedicated supervisorfor electrician
Modbus (SL or Ethernet/IP)
Circuit breakers
1 2 3

Schneider Electric - Electrical installation guide 2009
K - Energy Efficiency in electrical installations
K2�
© S
chne
ider
Ele
ctric
- a
ll rig
hts
rese
rved
b Level 3
Conventional general purpose centralised architecture (see Fig. K2�)Here is a typical architecture based on standard automation pieces such as SCADA systems, and gateways.This architecture is typically used for high demanding installation which requires high availability of electricity.In such case, real time performance is key, either to be achieved automatically or through 24/7 operation team on site.In order to comply with very high availability constraint, such system very often requests to support transparently (i.e with no visible impact) a first fault of system level components such as the SCADA itself, the communication infrastructure, ...Energy efficiency is also an important matter, and such solution should offer all the mean to clearly master the energy consumption and quality on site. Electrical assets protection is then the 3d main matter, and such solution should offer a mean to prevent any damage of these very expensive electrical and process assets.Connectivity with the Process control system is also required, especially through the remote control of the operating mode of motors (MV and LV). Solutions such as PowerLogic SCADA (Modbus or IEC 61850 based) appear the most appropriate.
e-Support becomes accessible The setting up of an information system to support a global energy efficiency approach very quickly leads to economic gains, in general with an ROI of less than 2 years for electricity.
An additional benefit, that is still underestimated today, is the leverage that this leads to in terms of information technologies in the electrical sector. The electrical network can be analyzed from time to time by third parties – in particular using external competencies via the internet for very specific issues:b Electricity supply contracts. Changing of supplier at a given point in time, e.g. permanent economic analysis of the costs related to consumption becomes possible without having to wait for an annual review.b Total management of electrical data – via internet – to transform it into relevant information that is fed back via a personalized web portal. Consumer usage information is now a value-added commodity, available to a wide range of users. It's easy to post customer usage data on the Internet – making it useful to the users is another matter.b Complex electrical fault diagnosis to call in an electrotechnical expert, a rare resource that is easily accessible on the web.b Monitoring of consumption and generating alerts in the case of abnormal consumption peaks. b A maintenance service that is no more than necessary to meet pressure on overheads via facility management services.
Fig. K28 : Real-time conventional monitoring and control system
Meter 1 Meter 2 Meter 3
Gateway
Modbus
Conventionalsupervisor
Modbus (SL or Ethernet/IP)
Communicating Power Equipment
Circuit breakers
1 2 3
4 Energy saving solutions

Schneider Electric - Electrical installation guide 2009
K - Energy Efficiency in electrical installations
K2�
© S
chne
ider
Ele
ctric
- a
ll rig
hts
rese
rved
4 Energy saving solutions
Energy efficiency is no longer an issue that the company has to face on its own, many e-partners can back up the approach as necessary – in particular when the measurement and decision making assistance stage is reached, on condition that the electrical network is metered and communicative via internet.Implementation can be gradual starting by making a few key pieces of equipment communicative and gradually extending the system so as to be more accurate or to give wider coverage of the installation.The company can choose its policy: ask one or more partners to analyze the data, do it itself or combine these options.The company may decide to manage its electrical energy itself, or ask a partner to monitor the quality to ensure active monitoring of performances in terms of aging.
Example:Schneider Electric proposes e-Services that offers load data visualization and analysis application in ASP mode. It simplifies processes for tenants with geographically diverse locations by providing convenient integrated billing and usage information for all locations combined. The system turns customer usage data into useful information, easily accessible to all internal users. It helps control costs by showing customers how their organizations use power.
A wide range of functionality serves the needs of staff from the same platform:Data Access and Analysis , Historical and Estimated Bills, Rate Comparison, What-if Analysis - Assess the impact of operational changes, such as shifting energy between time periods or reducing usage by fixed amounts or percentages, Automatic Alarming, Memorized Reports, Benchmarking - Benchmark usage data from multiple facilities by applying normalization factors such as square footage, operating hours, and units of production. Multiple Commodities - Access usage data for gas and water as well as electricity etc.
ReportsODBC
XML
ElectricityWater & Gas
Power Quality
Ethernet/VPN Ethernet/VPN
New York Chicago Los Angeles Seattle
Stores data including:- Occupancy rates- Square footage- Other parameters
Normalize data using:- Temperature- Occupancy rates- Rooms- Other parameters
Energy CostAnalysis
WEB
CorporateDatabase
Weather info
Utility tariffs & rates
Real-time pricingWEB
Fig. K29 : Typical solution example

Schneider Electric - Electrical installation guide 2009
K - Energy Efficiency in electrical installations
K30
© S
chne
ider
Ele
ctric
- a
ll rig
hts
rese
rved
4.� Mapping of solutions:
Energy savings Cost optimization Availability & Reliability
Variable speed drives
High efficiency motors and transformers
MV motor supply
Power factor correction
Harmonic management
Configuration of circuits
Back-up generators
UPS (see page N��)
Soft starters
Protection coordination
iMCC
Intelligent Equipment based architecture Level �
Electrician specialized centralised architecture Level 2
Conventional general purpose centralised architecture Level 3
4 Energy saving solutions
Fig. K31 : Mapping of solutions
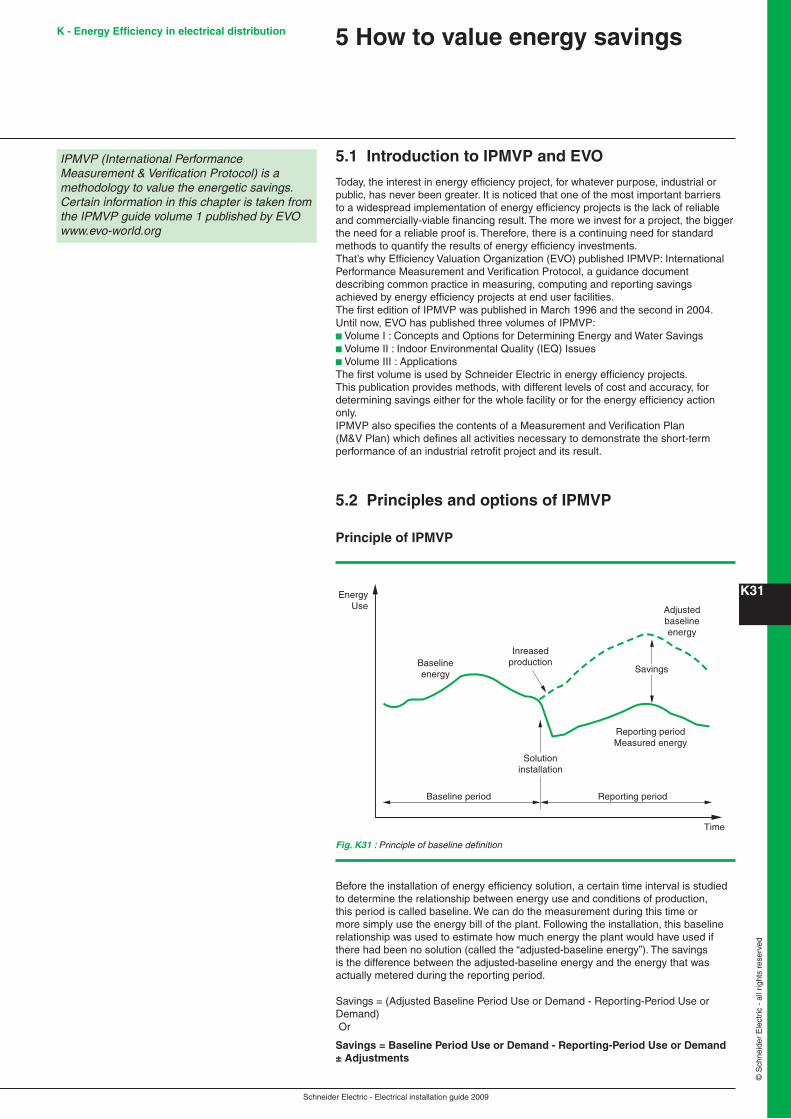
Schneider Electric - Electrical installation guide 2009
K - Energy Efficiency in electrical distribution
K3�
© S
chne
ider
Ele
ctric
- a
ll rig
hts
rese
rved
5.� Introduction to IPMVP and EVO
Today, the interest in energy efficiency project, for whatever purpose, industrial or public, has never been greater. It is noticed that one of the most important barriers to a widespread implementation of energy efficiency projects is the lack of reliable and commercially-viable financing result. The more we invest for a project, the bigger the need for a reliable proof is. Therefore, there is a continuing need for standard methods to quantify the results of energy efficiency investments.That’s why Efficiency Valuation Organization (EVO) published IPMVP: International Performance Measurement and Verification Protocol, a guidance document describing common practice in measuring, computing and reporting savings achieved by energy efficiency projects at end user facilities. The first edition of IPMVP was published in March 1996 and the second in 2004.Until now, EVO has published three volumes of IPMVP:b Volume I : Concepts and Options for Determining Energy and Water Savingsb Volume II : Indoor Environmental Quality (IEQ) Issuesb Volume III : Applications The first volume is used by Schneider Electric in energy efficiency projects. This publication provides methods, with different levels of cost and accuracy, for determining savings either for the whole facility or for the energy efficiency action only.IPMVP also specifies the contents of a Measurement and Verification Plan (M&V Plan) which defines all activities necessary to demonstrate the short-term performance of an industrial retrofit project and its result.
5.2 Principles and options of IPMVP
Principle of IPMVP
5 How to value energy savings
Fig. K31 : Principle of baseline definition
IPMVP (International Performance Measurement & Verification Protocol) is a methodology to value the energetic savings. Certain information in this chapter is taken from the IPMVP guide volume 1 published by EVO www.evo-world.org
EnergyUse
Baselineenergy
Inreasedproduction
Adjustedbaselineenergy
Savings
Solutioninstallation
Reporting periodMeasured energy
Reporting periodBaseline period
Time
Before the installation of energy efficiency solution, a certain time interval is studied to determine the relationship between energy use and conditions of production, this period is called baseline. We can do the measurement during this time or more simply use the energy bill of the plant. Following the installation, this baseline relationship was used to estimate how much energy the plant would have used if there had been no solution (called the “adjusted-baseline energy”). The savings is the difference between the adjusted-baseline energy and the energy that was actually metered during the reporting period.
Savings = (Adjusted Baseline Period Use or Demand - Reporting-Period Use or Demand) Or
Savings = Baseline Period Use or Demand - Reporting-Period Use or Demand ± Adjustments

Schneider Electric - Electrical installation guide 2009
K - Energy Efficiency in electrical distribution
K32
© S
chne
ider
Ele
ctric
- a
ll rig
hts
rese
rved
5.3 Six qualities of IPMVP
When an M&V plan is drawn up for an IPMVP action, it must guarantee six principles:b Accurate: M&V reports should be as accurate as the M&V budget will allow. M&V costs should normally be small relative to the monetary value of the savings being evaluated.b Complete: The reporting of energy savings should consider all effects of a project.b Conservative: Where judgements are made about uncertain quantities, M&V procedures should be designed to under-estimate savings.b Consistent: The reporting of a project’s energy effectiveness should be consistent between:v different types of energy efficiency projects;v different energy management professionals for any one project;v different periods of time for the same project; v and energy efficiency projects and new energy supply projects.b Relevant: The determination of savings should measure the performance parameters of concern, or least well known, while other less critical or predictable parameters may be estimated. b Transparent: All M&V activities should be clearly and fully disclosed.
5.4 IPMVP’s options
Option A Option B Option C Option D
Definition Retrofit isolation: keyparameter measurement
Retrofit isolation: all parametermeasurement
Whole facility Calibrated simulation
Description Savings are determined by field measurement of the key performance parameter(s) which define the energy use of the system affected by the energy efficiency solution. Parameters not selected for field measurement are estimated.
Savings are determined by field measurement of the energy use of the system affected by the solution.
Savings are determined by measuring energy use at the whole facility or sub-facility level. Continuous measurements of the entire facility’s energy use are taken throughout the reporting period.
Savings are determined through simulation of the energy use of the whole facility, or of a sub-facility. Simulation routines are demonstrated to adequately model actual energy performance measured in the facility.
Calculation of savings Engineering calculation of baseline and reporting period energy from: - short-term or continuous measurements of key operating parameter(s); and- estimated values.
Short-term or continuous measurements of baseline and reporting period energy
Analysis of whole facility baseline and reporting period data. Routine adjustments are required, using techniques such as simple comparison or regression analysis.
Energy use simulation, calibrated with hourly or monthly utility billing data.
When use this option? On one hand, this option can give a result with considerable uncertainty because of the estimation of some parameters. On the other hand, it is not expensive compared to the option B.
Option B is less cheap than option A as all parameters are measured. But if a customer asks for a high precision level, it would be a good choice.
When there is a multifaceted energy management program affecting many systems in a facility, a choice of option C can help in saving money and work.
Option D is used only when the baseline data is missed. Example: a facility where no meter existed before solution’s installation and the measure of the baseline period takes too much time and money.
5 How to value energy savings

Schneider Electric - Electrical installation guide 2009
K - Energy Efficiency in electrical distribution
K33
© S
chne
ider
Ele
ctric
- a
ll rig
hts
rese
rved
5 How to value energy savings
Fig. K32 : Option selection process
5.5 Fundamental points of an M&V plan
b Energy efficiency project’s intentb Selected IPMVP option and measurement boundaryb Baseline: period, energy and conditionsb Reporting period : duration and conditionb Basis for adjustmentb Analysis procedure: the data analysis procedures, algorithms and assumptions to be used.b Energy pricesb Meter specificationsb Monitoring responsibilitiesb Expected accuracyb Budget for IPMVP activitiesb Report formatb Quality assurance
Our services with IPMVP
Option selection process
Start
Measure facility orECM performance?
Facilityperformance
ECMperformance
No
No
No
No
No
Yes
Yes
Yes
Yes
Yes
No
Yes
Able to isolateECM withmeter(s)?
Need fullperfomance
demonstration?
Install isolationmeters for all
parameters andassess interactive
effects
Install isolation metersfor key parameters
assess interactive effects,and estimate well know
parameters
Need toseparately assess
each ECM?Analysis ofmain meter
data
Simulatesystem or
facilityObtain
calibrationdata
Calibratesimulation
Simulate with andwithout ECM(s)
Missing baselineor reporting period
data?
Missing baselineor reporting period
data?
Option BRetrofit isolation:
All parametermeasurement
Option ARetrofit isolation:Key parametermeasurement
Option CWhole facility
Option DCalibratedsimulation
Expectedsavings >10%?
Sign the energeticperformancecontract
Establishan M&Vplan
Collect the baselineinformation
Projectinstallation
Measure the reporting,report information and calculate the savings
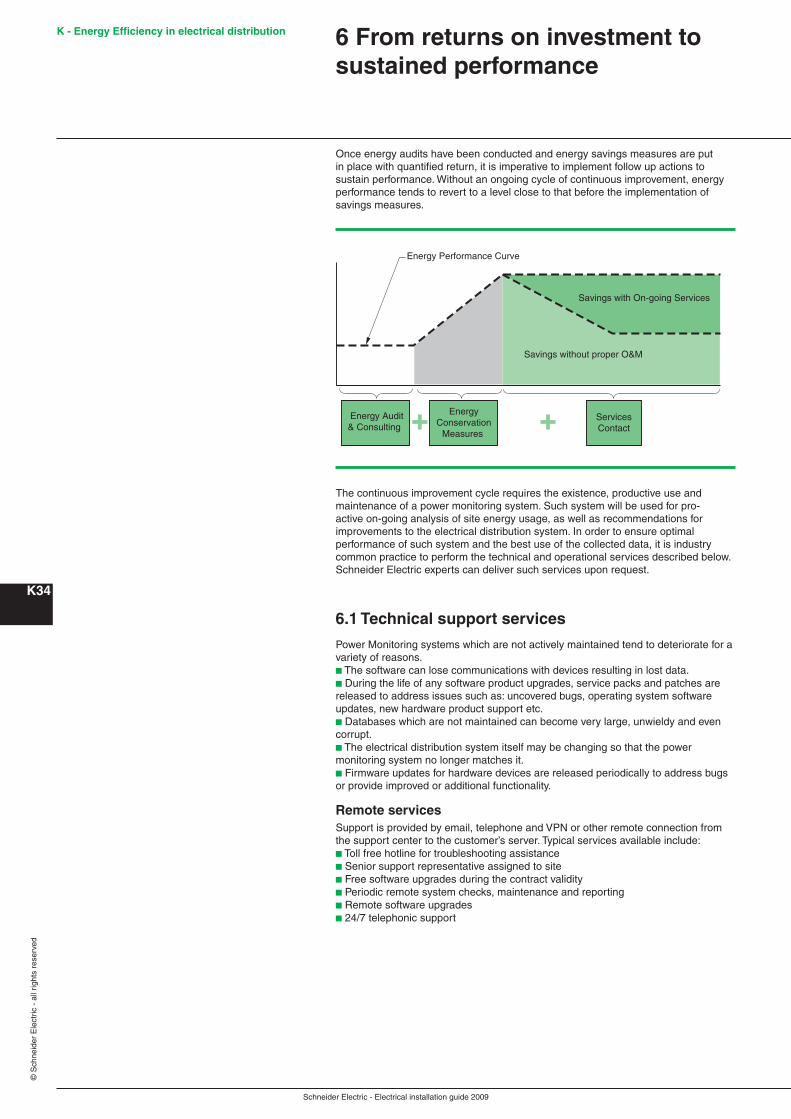
Schneider Electric - Electrical installation guide 2009
K - Energy Efficiency in electrical distribution
K34
© S
chne
ider
Ele
ctric
- a
ll rig
hts
rese
rved
Once energy audits have been conducted and energy savings measures are put in place with quantified return, it is imperative to implement follow up actions to sustain performance. Without an ongoing cycle of continuous improvement, energy performance tends to revert to a level close to that before the implementation of savings measures.
6 From returns on investment to sustained performance
The continuous improvement cycle requires the existence, productive use and maintenance of a power monitoring system. Such system will be used for pro-active on-going analysis of site energy usage, as well as recommendations for improvements to the electrical distribution system. In order to ensure optimal performance of such system and the best use of the collected data, it is industry common practice to perform the technical and operational services described below. Schneider Electric experts can deliver such services upon request.
6.� Technical support services
Power Monitoring systems which are not actively maintained tend to deteriorate for a variety of reasons.b The software can lose communications with devices resulting in lost data. b During the life of any software product upgrades, service packs and patches are released to address issues such as: uncovered bugs, operating system software updates, new hardware product support etc. b Databases which are not maintained can become very large, unwieldy and even corrupt.b The electrical distribution system itself may be changing so that the power monitoring system no longer matches it.b Firmware updates for hardware devices are released periodically to address bugs or provide improved or additional functionality.
Remote servicesSupport is provided by email, telephone and VPN or other remote connection from the support center to the customer’s server. Typical services available include:b Toll free hotline for troubleshooting assistanceb Senior support representative assigned to siteb Free software upgrades during the contract validityb Periodic remote system checks, maintenance and reportingb Remote software upgradesb 24/7 telephonic support
Energy Performance Curve
EnergyConservation
Measures
ServicesContact
Savings with On-going Services
Savings without proper O&M
Energy Audit& Consulting

Schneider Electric - Electrical installation guide 2009
K - Energy Efficiency in electrical distribution
K35
© S
chne
ider
Ele
ctric
- a
ll rig
hts
rese
rved
On site servicesMonthly, quarterly, biannual or annual (as agreed) site visits for system maintenance. Typical services provided are:b Install all PowerLogic software upgradesb Perform firmware upgrades to all PowerLogic monitoring devicesb System troubleshooting to the device levelb Modification of graphic screens per customer inputb Modification of alarms and data logs per customer inputb Reconfiguration of system to match changes to the electrical distribution system
6.2 Operational support services
These contracts are designed to meet the need for energy analysis and improvement recommendations.
Hosted systemsIn this scenario the user’s usage data is pushed to a Schneider Electric hosted server. The user accesses his information via a web browser. Typical information made available is the following:b Energy consumption datab Carbon emissions datab Degree day analysisb Normalized performance indicatorsb Regression analysisb CUSUM analysis (Cumulative Sum)
On site systemsHere the user has a server at one or multiple sites. Different software packages can be in use depending on the need. The services include all the reports offered in the hosted system plus the following:b An up front site energy audit with improvement recommendationsb Direct line to an energy consultantb Periodic data analysis, reporting and recommendations (monthly, quarterly, biannual or annual as required)b Consolidated data from multiple facilitiesb Load profilesb Power quality reporting
6 From returns on investment to sustained performance

Schneider Electric - Electrical installation guide 2009