
Energy Efficiency Improvements for the Inn at Otter Crestweb.cecs.pdx.edu/~far/Past Capstone...
34
Energy Efficiency Improvements for the Inn at Otter Crest June 5, 2015 _____________________________________________________ ME 493 FINAL REPORT – YEAR 2015 _____________________________________________________ Group Members Lee Ha Lee Han Osman Kucuk Abdulaziz Alnassar Kevin Murray Natalie Sherwood Huy Tran Andrey Volodkin PSU Staff Advisor Dr. Huafen Hu Sponsor The Inn at Otter Crest
Transcript of Energy Efficiency Improvements for the Inn at Otter Crestweb.cecs.pdx.edu/~far/Past Capstone...

Energy Efficiency
Improvements for the
Inn at Otter Crest
June 5, 2015
_____________________________________________________
ME 493 FINAL REPORT – YEAR 2015
_____________________________________________________
Group Members
Lee Ha
Lee Han
Osman Kucuk
Abdulaziz Alnassar
Kevin Murray
Natalie Sherwood
Huy Tran
Andrey Volodkin
PSU Staff Advisor
Dr. Huafen Hu
Sponsor
The Inn at Otter Crest

2 | P a g e

3
Executive Summary
The objective of this Capstone project is to reduce the annual energy utility bill for the
Inn at Otter Crest (IOC), an Oregon Coast resort hotel and condominium built in 1972. The IOC
homeowners association set the project design specification (PDS) of a 20% reduction in the
annual IOC energy bill, with a simple payback of six years or less for any purchase.
Unique challenges to the final design included the mixed use of IOC condo units (private
ownership vs. hotel use), difficult occupancy schedule prediction, and unavailability of fossil
fuel. Of the eight cost-saving measures researched, only two were found to be feasible and
satisfy the PDS payback criteria: air source heat pumps and LED exterior lighting.
Replacing resistance heaters with mini-split ductless heat pumps was found to reduce the
annual electricity bill by 13.4%, with a payback period of 4.5 years when combined with
available incentives. Changing exterior lighting to LED from CFL was found to reduce the
annual electricity bill by 0.7%, with a payback period of 3.2 years. The combined annual utility
savings for kWh consumption alone is 14%, below the PDS target of 20%. Additional savings
are possible with heat pumps due to a reduced peak demand. A detailed eQUEST energy model
of an eight unit IOC condo predicts a 30-35% reduction in the peak demand with heat pump
space heating.

TABLE OF CONTENTS
1. Introduction
2. Mission statement
3. Main Design Requirements
4. Top Level Energy Efficiency Considerations
4.1 Exterior Considerations
4.2 Interior Considerations
5. Final Design
5.1 Mini-Split Heat Pumps
5.2 LED Lighting
6. Energy Modeling
7. Cost Analysis
7.1 LED Lighting Cost Analysis
7.2 Heat Pump Cost Analysis
8. Conclusion and Recommendations
8.1 Recommendations
References and Appendices

1 Introduction
The Inn at Otter Crest (IOC) is an oceanfront
resort built in 1972 on the Oregon Coast, where
electricity is the only available source of energy. The
IOC association of owners is a representative group
who make property management decisions based on
the collective interests of all IOC owners. The
association is concerned about the mounting
electricity bills, which totaled $135,000 in 2014. The
Capstone team has been tasked with reducing the
electricity bill for the condo buildings on the
property, excluding the heated pool and restaurant. The mild to cool Oregon Coast weather leads
to a combined majority energy end-use of heating for domestic water and spaces. Electric
resistance is the current method of space and water heating due to the lack of fossil fuel
availability.
The IOC condo buildings are divided into either four or eight condo units. Figure 1 shows
the four and eight unit buildings, as well as the general property layout. IOC condo electricity
usage is metered to groups of eight condo units, either per single eight unit building or per pair of
adjacent four unit buildings. The utility charges for the property are divided evenly among condo
owners, based on the total annual energy expenditure for the previous fiscal year.
Condo units vary in use and ownership. Some units are used as permanent residences
while others are used periodically when the owner is visiting. Other units are divided into two
sub-units and rented out through the IOC hotel service. Condo owners have complete control
over all appliances, heaters, and thermostats within each condo, making blanket implementation
of interior energy efficient improvements difficult. With the aforementioned limitations in mind,
the Capstone team set out to identify feasible energy saving measures which satisfy the
customer’s criteria. This report contains proposed saving energy measures, evaluation of
proposed energy saving measures, and the final design solution.
Figure 1. Ocean view condo buildings on the grounds of the Inn at Otter Crest

2 Mission Statement
The Capstone team will recommend energy efficiency and cost saving improvements to
reduce the energy bill for the Otter Crest community. Energy savings will be evaluated through
research and energy audit modeling. The metric for success is a reduction of the IOC energy bill
by 20%, with the stipulation of a six year payback for any purchase. The project will be
completed by June 5, 2015.
3 Main Design Requirements
The PDS criteria were established by the project sponsor, the IOC association of owners.
The goal for project success is a net total 20% reduction in the electrical utility annual
expenditure associated with property lodging buildings. The constraint for individual energy
efficient improvements is a simple payback of 6 years or less. All energy efficiency
considerations were measured against the PDS requirements and the feasibility of
implementation.

4 Top Level Energy Efficiency Considerations_
Domestic hot water, space heating, and a portion of
lighting (exterior) were all investigated for potential energy
savings. Figure 2 shows the energy consumption by end-use
of an eight unit condo modeled by eQUEST. Miscellaneous
equipment represents the so called ‘plug load’ electricity
use, in other words all of the equipment and appliances
which are plugged into a wall socket. All appliances and
equipment internal to IOC condos are property of the
respective condo owners, and as such miscellaneous
equipment energy use would be difficult to reduce.
The energy efficiency measures which were considered may be split into two categories:
exterior improvements (external to the privately owned space) and interior condo improvements.
Exterior energy efficiency improvements have the advantage of being implemented by IOC
management, whereas interior condo improvements require the consent of the respective private
owner. For this reason, the Capstone team initially focused on exterior measures.
4.1 Exterior Considerations
Building Envelope
The Capstone team calculated the effective R value of exterior condo walls using a
thermal imager to accurately obtain differential wall temperature measurements. The effective R
value was determined to be approximately 12.5, a sufficient R value for a wood framed structure.
The effective R value will be lower than the in-wall insulation R value due to thermal bridging of
the wood frame. The windows had been upgraded in the early 2000’s from the original 1970’s
construction. The Capstone team determined that building envelope properties are sufficient such
that any further improvements would require a payback period in excess of the PDS criteria.
Figure 2. Energy consumption by end-use for an 8 unit condo, as modeled by eQUEST.

Exterior Lighting
The price of LED lighting has decreased in recent years due to advancements in
manufacturing processes. Given the large number of exterior lighting fixtures on the IOC
property, and the recent drop in LED bulb prices, exterior lighting was selected as a viable option
for the final design.
Solar Panels
Climate information for the Oregon Coast revealed a total annual solar collection of
687.72 kWh per square meter. Including tax incentives and utility rebates, the initial cost of a
photovoltaic (PV) system is estimated at $3,617,310. The high cost of the system coupled with
the low solar collection gives a payback of 23 years, well outside the target payback period.
4.2 Interior Considerations
Air Source Heat Pumps
Without natural gas availability, all IOC space heating is currently performed by way of
electric resistance. Primary space heating is performed by thermostat controlled electric
baseboard heaters, with secondary heating by electric fan-forced wall heaters. Heat pumps offer
a higher ratio of heating to electrical energy consumed than simple resistance heaters, and
operate best in climates which rarely experience freezing weather such as the Oregon Coast. A
heat pump’s efficiency is discussed in terms of its coefficient of performance (COP) to help
compare heat pumps with electrical resistance heaters. The COP is defined as the ratio of heating
(or cooling) to the electrical energy consumed. It is true that electrical resistance heaters are
100% electrically efficient, in that all electricity is converted into heat. Electrical resistance
heaters therefore have a COP of 1.0 (1 part heat produced for every 1 part of electric energy
consumed). Heat pumps use electricity to power a refrigerant cycle which extracts heat from
ambient air to produce more heat energy than electricity consumed. Typical COP values for heat
pumps are 2.5 to 3.0 (2.5 parts heat produced for every 1 part of electric energy consumed). Heat
pumps were considered for the final design.

Hybrid Water Heaters
Hybrid water heaters normally operate as a heat pump, but they also have backup
resistance heating for instances of high hot water demand. Units are usually installed in garage
sized areas as they require an installation space with at least 1,000 ft3 of air around the water
heater [1]. This means they cannot currently be used as direct replacements for IOC water
heaters which are located in small hallway closets and lack air circulation.
Hot Water Recirculation System
Hot water recirculation saves water and energy by recirculating the standing water in hot
water piping back to the heater until hot water reaches the point of use. The Capstone team
decided against this option due to OSHA’s hot-water system operating guidelines, which require
that recirculation pumps be run continuously and be excluded from energy conservation
measures [2]. The OSHA guideline is concerned with the growth of Legionella in hot water
loops and is directed towards larger hot-water systems, however any hot water recirculation
method may be subject to OSHA guidelines.
Tankless Water Heaters
Tankless heaters eliminate the stand-by loss associated with traditional tank water
heaters. Eliminating stand-by loss would lower the electricity consumption for IOC domestic hot
water. Tankless heaters were not considered for the final design due to a pay-back period well
outside the PDS criteria. The payback period estimate is longest for meters which are charged for
peak demand, such as the majority of IOC meters. Tankless heaters draw a large amount of
electric current which would result in significant demand charges [3].
Occupancy-Responsive Adaptive Thermostat Control
So-called ‘smart thermostats’ offer a range of functions and leaning algorithms which
attempt to reduce HVAC system energy use. One feature which may reduce space heating cost
for IOC hotel units is a thermostat web network control which allows instant management of
multiple thermostats from the front desk [4]. This system may be coupled with electronic room
access, a feature not currently available at IOC. The IOC hotel staff are already in the practice of

turning off space heating for vacant rooms to mitigate heating of unoccupied hotel spaces,
therefore smart thermostats were not included in the final design.
5 Final Design
The mixed use of IOC condo units, property layout, and unavailability of fossil fuel each
provided unique challenges to the final design. Only two of the energy efficiency considerations
were found to be feasible and satisfy the PDS payback requirement: air source heat pumps and
LED exterior lighting. Replacing resistance heaters with mini-split ductless heat pumps was
found to reduce the annual electricity bill by 13.4%, with a payback period of 4.5 years when
combined with available incentives, not including installation cost. Changing exterior lighting to
LED from CFL was found to reduce the annual electricity bill by 0.7% with a payback period of
3.2 years. The combined annual utility savings for kWh consumption alone is 14%, 6% below
the PDS target of a 20% reduced annual utility bill. Additional savings are possible with the
reduced peak electricity demand of heat pumps. Energy modeling with eQUEST showed a 30-
35% reduction in peak kW demand using heat pumps for space heating. A more detailed
description of the final design measures is discussed in the following sections.
5.1 Mini-Split Ductless Heat Pumps
Research and client interviews revealed The IOC’s
heating system to be a vital consideration in the site’s high
energy use. We ultimately selected ductless mini-split heat
pumps due to their high efficiency, low cost, and ease of
installation. Further research indicated that mini-splits have
the added benefit of distributing heat more efficiently than
the currently installed electric baseboard heaters [5]. The
heat-pump system consists of an exterior condenser
connected, via a refrigerant line, to a number of evaporator
units fixed to interior walls, as seen in Figure 3.
Figure 3: A typical mini-split ductless heat pump installation, shown with one evaporator.

The heating system was sized on the basis of peak heat loss, as outlined in 2013
ASHRAE Fundamentals. Under the “worst-case” assumption of no internal heat generation or
solar gain, the peak heat loss (QH) is calculated as follows [6];
𝑄𝐻 = 𝑈 ∗ 𝐴 ∗ ∆𝑇
where U is the thermal transmittance of the building envelope, A is the heat transfer area, and ∆T
is defined by the internal set-point temperature and the external design condition temperature.
The UA value for the calculation was obtained from an energy signature inverse model of the
worst-case building on the property. Worst-case, for this purpose, was defined by the 8-unit
building with the highest heat-loss, or the highest UA value. The sloped-line of the inverse
model, when multiplied by the average hours in a month (730 hrs) gives the UA for the heat loss
calculation. For the internal-external temperature difference, the internal set-point was assumed
to be 70oF and the 99% heating dry-bulb temperature of 34.4oF was used for the external
temperature. The design heating load was calculated at 25kW, or 85,303 Btu/hr. We decided to
be conservative and oversize the system slightly for a 100,000 BTU/hr. We recommend the
installation of two 50,000 Btu/hr heat pumps per eight unit building, and one per 4 unit building.
5.2 LED Lighting
Light emitting diode (LED) bulbs provide an increase in savings, when compared to
compact fluorescent bulbs (CFL), through increased efficiency and a longer life expectancy. A
nine watt LED bulb will produce as much light as a 60-watt incandescent bulb, while a 14-watt
CFL bulb is needed to produce the same amount of light. Although LED bulbs cost
approximately three times as much as CFL, their average life expectancy is five times longer.
One additional advantage for the use of LED bulbs is that they are more environmentally
friendly than CFL bulbs which contain mercury.

6 Energy Modeling
The design process involved generating two different building energy models. The
models identified potential energy savings and addressed the more complicated problem of utility
demand charges. The first of these issues was addressed with an inverse modeling process,
referred to as an energy signature model. The appeal of this modeling process is that it utilizes
data which was readily available: average dry bulb temperature and utility bill data.
The process involves the plotting of monthly consumption data against monthly
temperature data, and applying a piece-wise line fit. The model allowed us to separate the
temperature independent base load from the temperature dependent load. The slope of the
temperature dependent line fit, when multiplied by time, represents the UA portion of the heating
equipment sizing calculation. The slope value is dependent upon the efficiency of the building’s
heating system. A new slope value is calculated from the efficiency of a new proposed heating
system. We used the difference between the existing heating slope and the proposed heating
slope to calculate the savings from heat pump installation. For more information regarding the
inverse model, please see Appendix B.
The second model used was a detailed building simulation of an eight unit condo building
in eQUEST. EQUEST energy simulations require a great deal of inputs, and for our purposes, a
great deal of assumptions. By comparing the actual energy use of the building, obtained from
Central Lincoln MyMeter data, to the eQUEST model energy simulation, we were able to
calibrate the model to minimize error. One of the purposes of performing a detailed simulation
was to evaluate the impact of the proposed heat pumps on the peak demand of the building. The
IOC experiences considerable demand charges and interest in reducing them was expressly
stated by our client. Peak demand was difficult to address outside of a building simulation on due
to its dependence on occupant behavior, a variable for which data is limited. Through the eQuest
model we were able to evaluate the demand-reducing potential of our proposed heating system.
Please see the Appendix E for the detailed output from the eQUEST model energy simulation.

7 Cost Analysis
The first step in performing an effective utility cost analysis is to understand how utility
charges are structured, information that is found in the utility rate schedule. The IOC property is
considered a commercial residential site with two different metered rate schedules, 190 and 200.
Utility rate schedules consists of up to three parts: basic charge, energy charge (kWh
consumption), and demand charge (kW peak demand). The majority of IOC meters fall under
schedule 200 and include a demand charge, while schedule 190 consists of only basic and
consumption charges.
The basic charge is the flat monthly fee which is independent of electricity use. The
energy charge is based on total electricity consumed, measured in kilowatt-hours (kWh), for a
given rate. Schedule 200 has two different energy charge rates based on the consumption. For
conservative estimates, we based our calculations on the higher rate of $0.0875/kWh. The
demand charge, sometimes referred to as peak demand, is based on the highest average 15
minute interval of electrical power delivered during a billing period, measured in kilowatts (kW).
Schedule 200 demand charges are incurred when peak demand exceeds 30 kW within a billing
period. Each kW in excess of 30 kW for a given billing period is billed at $8.96/kW. A summary
of the utility bill charges for all condo building meters is shown in Table 1.
Table 1. Summary of utility bill charges for 2014
Utility Bill Distribution 2014 (20 Meters)
Category Total Charge Percent of Total Bill
Base Charge $8,881.92 6.62%
Demand Charge $19,157.91 14.27%
Energy Charge $106,202.70 79.11%
Total $134,242.53 100%

7.1 LED Lighting Cost Analysis
There were three main factors for the cost benefit of LED vs. CFL lighting: price,
efficiency (watts per bulb), and life expectancy. To make the calculation straight forward, cost
analysis was performed for 450 exterior light bulbs. A comparison of LED and CFL bulbs Is
shown in Table 2.
Table 2. Summary of LED and CLF bulbs
Light Bulb Information
Bulb Type $/bulb Watts/bulb Life Expectancy
(year) Utility Cost (year)
CFL $3.00 14 2.5 $6.18
LED $10.00 9 7.5 $3.97
The initial investment is $4,500 to change all 450 bulbs assuming $10 per LED bulb. The
energy charge savings for a complete changeover to LED lighting would be $994 annually (0.7%
of the total), resulting in a simple payback of 3.2 years. With life expectancy five times that of
CFL, LED’s would continue to save more in subsequent years of operation. Figure 5 shows the
simple payback of LED’s in a 14 year investment period. The drop in savings in the seventh year
accounts for the replacement for all 450 LED bulbs.

Figure 5. 14 year investment period for conversion of 450 CFL bulbs to LED.
7.2 Mini-Split Ductless Heat Pump Cost Analysis
The heat pump cost analysis focused on the 16 buildings with eight condo units. These
buildings were selected for the cost analysis because all 16 buildings have a demand charge
under rate schedule 200. The more efficient heating per kW of power offered by heat pumps
would lower peak demand. Additionally, Central Lincoln PUD offers a $500 incentive per heat
pump when installed to replace baseboard and fan-forced wall heaters. This would result in
$16,000 saved for an installation of 32 heat pumps (16 buildings w/ 8 units, 1 50,000 BTU heat
pump per 4 units). However, this incentive is only available if a pre-approved contractor
performs the heat pump installation. All of the Central Lincoln PUD approved contractors have
been screened to ensure they meet the district's requirements. Approved contractors know
Central Lincoln will inspect heat pump systems installed under their program. Approved
contractors also agree they will make any corrections necessary if installation problems are
found during Central Lincoln’s inspection process. Please see the Central Lincoln PUD website
for the heat pump rebate brochure.

Table 3 shows the initial investment to install 32 heat pumps is $80,000, not including the
cost of installation by a Central Lincoln approved contractor. Heat pump energy savings was
calculated using an energy signature model. Annual saving in energy consumption (kWh). The
energy consumption applied to the flat utility rate gives the annual average saving of $1,121.12
per building and $17,937.92 for all 16 buildings. In comparing the amount saved to the 2014
utility bill the heat pump managed to save an annual of only 14.1 %. The simple payback was
calculated from the initial investment divided by the annual saving of 4.5 year investment.
Table 3. Summary of heat pump initial investment
Summary of Heat Pump Cost
Cost per Unit Units per Building
16 building total cost
Incentive Value
Total Capital Cost
$3,000 2 $96,000.00 -$16,000.00 $80,000.00, plus installation*
*Installation must be performed by a Central Lincoln approved contractor to qualify for the rebate incentive.
8Conclusion and Recommendations
The Capstone team was unable to prove through modeling and calculations that the final
design will achieve the PDS goal of a 20% utility bill reduction annually. However, sufficient
evidence was shown to suggest that additional peak demand savings are possible with heat pump
space heating. Specifically, a 30-35% reduction in peak demand was shown by the eQUEST
detailed model. Please see Appendix D for the modeled resistance heating and heat pump peak
demand. Due to the peak demand charge criteria, not all of the reduced demand will be realized
in the form of a lower utility bill, but it is a step in the right direction.
The ultimate goal of IOC energy efficiency upgrades should be to qualify as many
buildings as possible for the lower rate schedule 190. If all IOC condo meters were charged
under rate schedule 190 for the 2014 year, the Capstone team calculated the annual utility bill
would be $87,000, a savings of 35% ($48,000) from the actual $135,000 annual bill. To qualify
for rate schedule 190, a given meter must have a monthly billing demand of less than 31 kW for
any 9 months out of a 12 month billing period.

17 | P a g e
Depending on occupant behavior, it may be possible for some condo meters to qualify for
rate schedule 190 from a changeover to heat pump heating alone. Unfortunately, the Capstone
team was unable to predict or model occupant behavior with enough certainty to quantify post
heat pump installation peak demand.
8.1 Recommendations
Backup Heat
Heat pumps may experience difficulty generating sufficient heat during the rare times
when outside temperatures drop to near freezing or below. During these times the heat pumps
may rely on the built in baseboard heaters to provide backup heat. For this reason, it is
recommended that the currently existing resistance heating remain installed in the condo
buildings. This may present some efficiency loss if the residents and guests continue to use
resistance heaters in lieu of the heat pumps, even under normal conditions. One possible method
of mitigating this is to inform customers and residents that the IOC is attempting to be as green
and sustainable as possible, and to please use the more efficient heat pumps for space heating
before using electric heating.
Cooling
Heat pumps provide both heating and cooling capabilities. Energy savings and thus
payback period were calculated based on the use of heat pumps for space heating only, and not
summer cooling. It is recommended that heat pumps be disabled in the summer months to
minimize the payback period. Even with cooling, eQUEST model results predict that heat pumps
would use less energy annually than resistance heating alone, but the payback period is greatly
increased if cooling energy is accounted for. Please see Appendix E for the eQUEST modeled
annual energy comparison between current resistance heating, heat pump heating, and heat pump
heating and cooling.

18 | P a g e
Hybrid Water Heaters and Future Peak Demand Reduction
Hybrid heat pump water heaters offer another avenue for reducing peak demand further.
Hybrid heaters were not considered for the final design due to potential for significant structural
changes to the water heater storage closets. As stated in the top level design considerations
section, hybrid water heaters require a surrounding air volume of 1,000 ft3. Depending on the
recommendation from hybrid water heater manufacturers, it may be possible to modify the
existing storage closets with the installation of a screen door and ventilation louvers.
With the proven savings and payback period of heat pumps, given the occupant behavior
considerations, the Capstone team recommends first installing heat pumps for space heating.
After a full year of heat pump operation, enough peak demand data would exist to make an
informed decision regarding hybrid water heats. If heat pump space heating reduces peak
demand sufficiently, it would be a safe assumption that hybrid water heaters would reduce peak
demand even further, with the eventual goal of reducing the rate schedule for as many condo
meters as possible.

19 | P a g e
References
[1] https://smartwaterheat.org/sites/default/files/hpwh_utility-customer-handout.pdf
[2] https://www.osha.gov/dts/osta/otm/legionnaires/hotwater.html
[3] https://www.energystar.gov/ia/partners/prod_development/new_specs/downloads/
water_heaters/ElectricTanklessCompetitiveAssessment.pdf
[4] J.Woolley, M. Pritoni, and M. Modera.“Why Occupancy-Responsive Adaptive Thermostats Do Not
Always Save -and the Limits for When They Should.” (2014).
[5] Engelmann, P., K. Roth, and V. Tiefenbeck. "Comfort, Indoor Air Quality, and Energy Consumption in
Low Energy Homes." (2013): 20. Web. 3 June 2015
[6] Kissock, Franc Sever Kelly, PE Dan Brown, and PE Steve Mulqueen. "Estimating Industrial Building Energy Savings using Inverse Simulation." (2011).

20 | P a g e
Appendix A. Central Lincoln PUN rate schedules
190

21 | P a g e

22 | P a g e
Appendix B. Heat pump modeling
Final Report Heat Pump Section
To understand how we got the paybacks for heat pumps, one needs to understand the
scientific method used. Below, there is a quick overview of Inverse modeling.
Inverse Modeling
Inverse modeling is done by estimate the energy savings from retrofitting the existing
building systems. This model is accomplished by developing a simulation model which consists
of multiple stages, running model with actual weather data, calibrating the model to actual
energy use data, modifying the model to include the proposed changes and running the base and
proposed models with typical meteorological year weather data to estimate energy savings.
Simulation Model
In order to get a simulation or base model, the energy consumption records for previous
year and temperature averages for the same year are obtained. These data are then calibrated and
important information is extracted such as the heating slope, weather-independent energy
consumption and heating change-point temperature.
Figure 1. Represents the energy consumption as function of temperature.

23 | P a g e
The graphical representation of the energy consumption as function of temperature is
shown in figure 1, where Ei is weather-independent energy consumption, EH is heating energy,
Tb,H is heating change-point temperature, TOA is outside air temperature and HS is heating slope.
The mathematical representation of the inverse model is a piecewise function:
𝐸 = 𝐸𝑖 + 𝐻𝑆(𝑇𝑏,𝐻 − 𝑇𝑂𝐴)+
𝐻𝑆𝑃𝐻𝑆𝐶
=𝜂𝐶𝜂𝑃
Where subscripts p and c show proposed and current.
Figure 2. Represents actual energy signature model.
Using MatLab and calibrating the model to actual energy use data for previous year and
temperature averages for the same year, the base models for all buildings are obtained. Figure 2
40 42 44 46 48 50 52 54 56 58 603000
4000
5000
6000
7000
8000
9000
10000
11000
kW
h
Temp Degree F
Energy Signature Model (Building D & E)

24 | P a g e
show as an example the base model for buildings D and E, very similar graphs were obtained for
other buildings.
Modified Model
The modified model is based on changing the heating system, where baseboard heaters were
proposed to replace with heat pumps which are well known to have high efficiency.
Figure 3. Represents the effects of the heating system modification.
Changing the heating system to more efficient one will cause the slope of the model to decrease
as is shown in figure 3, where it can be seen that with the drop of the outdoor temperature the
energy consumption is not going to jump as before.
𝐸𝑃 = 𝐸𝑖 +𝐻𝑆𝑃(𝑇𝑏,𝐻 − 𝑇𝑇𝑀𝑌)+
𝐻𝑆𝑃 = 𝐻𝑆𝐶𝜂𝐶𝜂𝑃
This is the modified energy consumption model based on the change of the heating system,
where EP is proposed energy consumption and TTMY is the typical meteorological year, which is
basically a collation of selected weather data for a specific location, generated from a data bank
much longer than a year in duration.
25 | P a g e
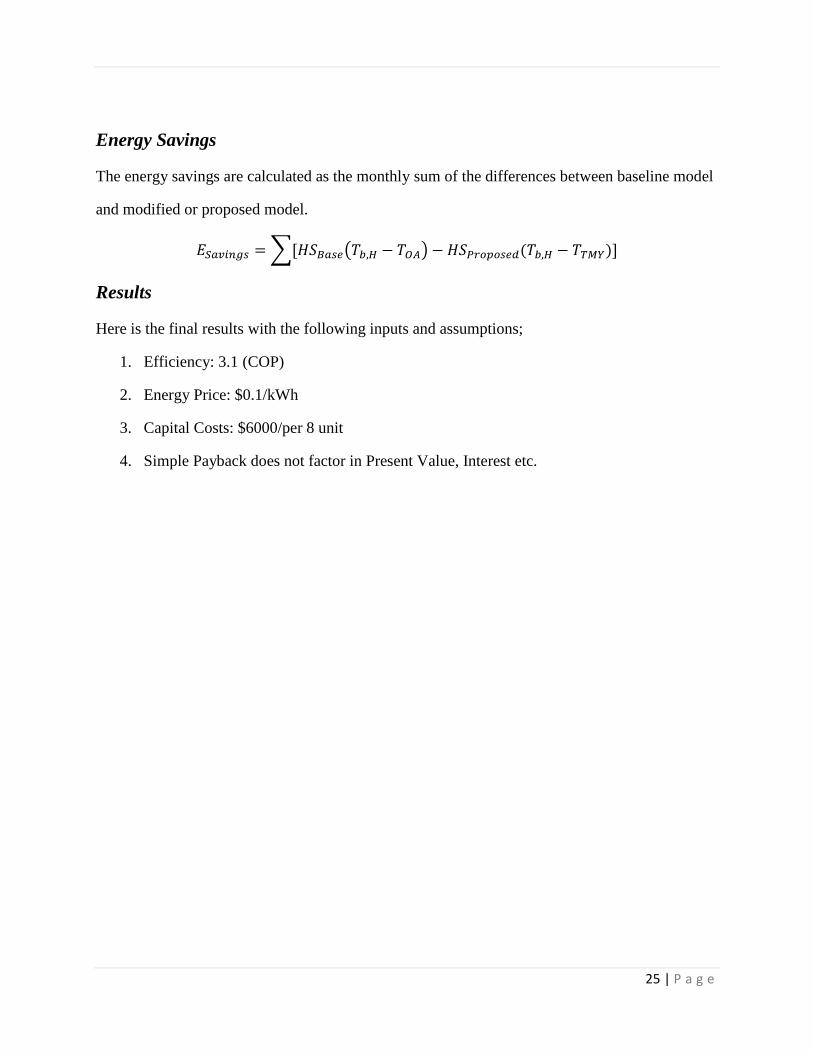
Energy Savings
The energy savings are calculated as the monthly sum of the differences between baseline model
and modified or proposed model.
𝐸𝑆𝑎𝑣𝑖𝑛𝑔𝑠 =∑[𝐻𝑆𝐵𝑎𝑠𝑒(𝑇𝑏,𝐻 − 𝑇𝑂𝐴) − 𝐻𝑆𝑃𝑟𝑜𝑝𝑜𝑠𝑒𝑑(𝑇𝑏,𝐻 − 𝑇𝑇𝑀𝑌)]
Results
Here is the final results with the following inputs and assumptions;
1. Efficiency: 3.1 (COP)
2. Energy Price: $0.1/kWh
3. Capital Costs: $6000/per 8 unit
4. Simple Payback does not factor in Present Value, Interest etc.

26 | P a g e
Results for All Buildings:
Simple Payback (Years) Energy Reduction in a Year (%) Energy Savings in a Year ($)
5.21 16.3 18411
Years Savings By the Year ($)
0 -96000
1 -77589
2 -59177
3 -40766
4 -22355
5 -3943
6 14468
7 32880
8 51291
9 69702
10 88114
11 106525
12 124936
13 143348
14 161759
15 180170
-150000
-100000
-50000
0
50000
100000
150000
200000
0 1 2 3 4 5 6 7 8 9 10 11 12 13 14 15
$
Years
Savings By the Year

27 | P a g e
Results for Individual Buildings:
References:
Estimating industrial building energy savings using inverse simulation by Franc Sever, Kelly
Kissock Phd, PE, Dan Brown PE, Steve Mulqueen, 2001 ASHRAE.
Buildings Simple Payback (Years) Energy Savings in a Year ($)
K 4.40 1363
B 4.62 1298
H&G 4.77 1258
O&P 4.99 1203
F 4.53 1325
R&Q 5.59 1073
I 6.36 944
A 6.14 977
M 5.82 1032
U 5.34 1123
S&T 6.18 972
Y&Z 6.26 959
W&X 5.79 1036
C 4.09 1469
J 6.45 931
D&E 4.14 1451
Hote
lM
ixed
Resid
enta
l
Buildings Energy Reduction in a Year (%)
K 17.3
B 21.2
H&G 16.0
O&P 18.0
F 13.7
R&Q 17.4
I 13.4
A 15.4
M 16.1
U 15.0
S&T 15.1
Y&Z 15.4
W&X 15.6
C 18.6
J 14.5
D&E 19.7
Resid
enta
l M
ixed
Hote
l

28 | P a g e
Appendix C. Annual kWh usage by building.
Total kWH by meter for 2012 - 2014
Unit BLDG 2012 2013 2014 Total kWh Average per unit
4 L 34240 34000 24240 92480 23120
4 V 36800 32880 24080 93760 23440
8 B 69440 73040 50880 193360 24170
8 J 67600 71840 55200 194640 24330
8 M 73440 70400 54000 197840 24730
4&4 S&T 77120 68880 53440 199440 24930
8 A 75040 73680 52560 201280 25160
4&4 Y&Z 74560 76240 51200 202000 25250
4&4 O&P 76560 76960 54400 207920 25990
4&4 R&Q 79440 78160 51200 208800 26100
4&4 W&X 79360 73920 56240 209520 26190
4 N 38480 38240 28240 104960 26240
4&4 D&E 78800 74000 60560 213360 26670
8 I 81200 81120 60000 222320 27790
8 U 81840 86720 62480 231040 28880
8 C 84240 87200 66320 237760 29720
8 K 93120 85600 64720 243440 30430
8 F 96880 96480 75360 268720 33590
4&4 H&G 105120 101120 66320 272560 34070
Model Home AA 62720 48000 34680 145400 48467

29 | P a g e
Appendix D. Potential peak demand reduction.
0
10
20
30
40
50
60
Jan Feb Mar Apr May Jun Jul Aug Sep Oct Nov Dec
De
man
d (
kW)
Possible Demand Reduction
Current Demand Heat Pump Model

30 | P a g e
Appendix E. eQuest energy model reports.
Figure E1. Baseline BEPS report

31 | P a g e
Figure E2. Baseline PS-F Energy End-Use Summary. End-Use monthly energy consumption and demand.
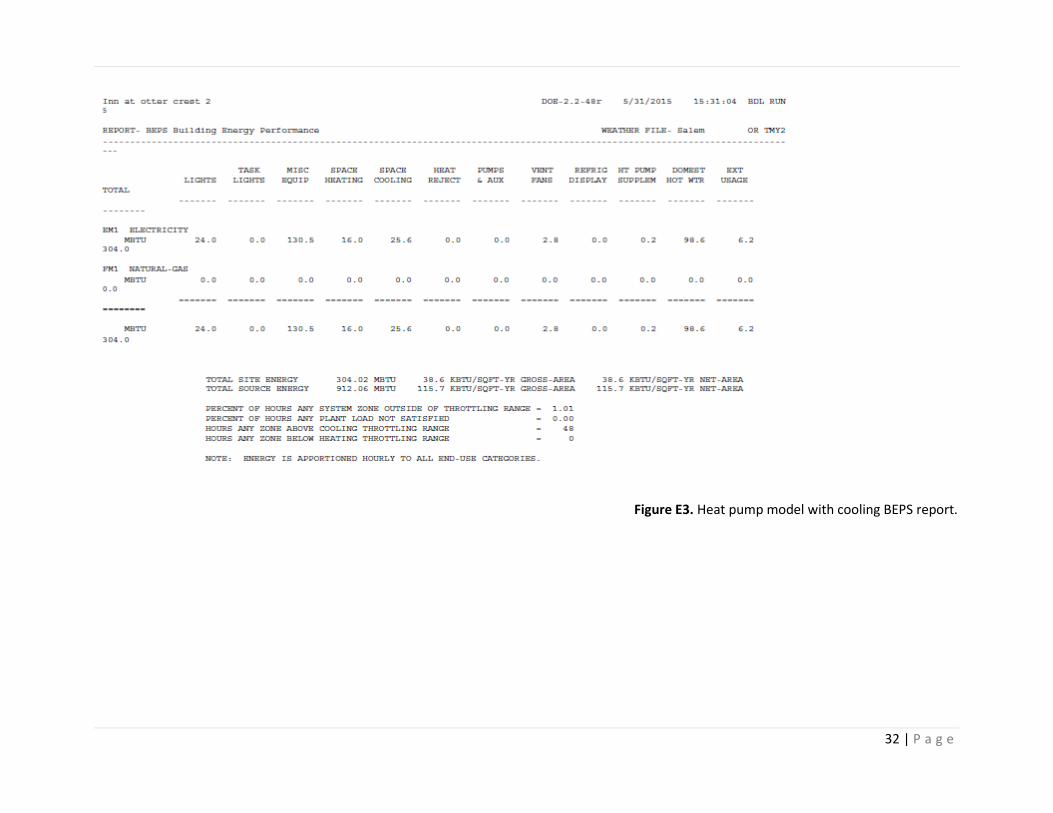
32 | P a g e
Figure E3. Heat pump model with cooling BEPS report.

33 | P a g e
Figure E4. Heat pump model with cooling Energy End-Use Summary. End-Use monthly energy consumption and demand.

34 | P a g e
Appendix F. Energy Outputs from eQuest model.
Monthly Energy Consumption in kWh
Total Actual Avg. eQuest Baseline HP with Cooling HP w/o Cooling
Jan 11262 11566 6428 6428 Feb 8898 8394 5506 5506 Mar 9644 6784 5819 5797 Apr 9413 7586 7788 7571 May 6658 7821 8674 7884 Jun 6382 7199 8556 7298 Jul 5947 7186 9427 7364
Aug 5840 7280 9516 7462 Sep 5822 6871 7847 6946 Oct 5644 7352 7552 7344 Nov 7667 8468 5808 5808 Dec 9227 11718 6155 6155
Total 92404 98225 89076 81563
End-Use Energy Consumption
End-use Baseline HP w/o Cooling
Lights 7047 7047
Misc. Equip 36479 36479
Space Heating 19424 3123
Vent Fans 250 1477
DHW 28828 28903
Ext. Usage 1808 1808
Total 93836 78837
Kwh saving 14999 15.98%