Energy-Efficiency Forecast Background Report · Energy Efficiency Forecast Background Report page 2...
29
Energy-Efficiency Forecast Background Report © ISO New England Inc. System Planning MAY 1, 2016 ISO-NE PUBLIC
Transcript of Energy-Efficiency Forecast Background Report · Energy Efficiency Forecast Background Report page 2...
Energy-Efficiency Forecast Background Report © ISO New England Inc. System Planning MAY 1, 2016
ISO-NE PUBLIC


Energy Efficiency Forecast Background Report page iii ISO-NE PUBLIC
Contents Figures .................................................................................................................................................................. iv
Tables .................................................................................................................................................................... 4
Section 1 Executive Summary ............................................................................................................................................... 1
1.1 Overview ............................................................................................................................................................. 1
1.2 EE Forecast Methodology.................................................................................................................................... 2
1.3 Sample Metrics Presented .................................................................................................................................. 2
Ssection 2 Introduction ........................................................................................................................................................... 3
2.1 Background.......................................................................................................................................................... 3
2.2 Energy Efficiency in New England ....................................................................................................................... 4
2.3 Early Development of the Energy-Efficiency Forecast ........................................................................................ 6
2.4 Energy-Efficiency Forecast Working Group ......................................................................................................... 7
Section 3 Forecast Methodology ........................................................................................................................................... 8
3.1 EE Forecast Model ............................................................................................................................................... 8
3.1.1 Calculations for Future Energy Reductions .................................................................................................. 8
3.1.2 Model Uncertainty Factors .......................................................................................................................... 9
3.2 Budget Model ...................................................................................................................................................... 9
Section 4 Data Collection .................................................................................................................................................... 13
4.1 Data-Collection Process ..................................................................................................................................... 13
4.2 Sample Data-Collection Results......................................................................................................................... 15
4.3 EE Forecast Input Data ...................................................................................................................................... 17
Section 5 Sample Results of New England’s Energy-Efficiency Forecast .............................................................................. 18
5.1 State-Level EE Forecasts .................................................................................................................................... 20
Section 6 Appendix A: Sample Data on Energy-Efficiency Measures ................................................................................... 21
6.1 Energy-Efficiency Measure Savings and Costs by Customer Sector .................................................................. 21
6.2 Production Cost Savings by Energy-Efficiency Measure.................................................................................... 23

Energy Efficiency Forecast Background Report page iv ISO-NE PUBLIC
Figures Figure 2-1: Trends in EE funding for the six New England states, 2004 to 2014. ....................................................... 5
Figure 2-2: Growth of energy efficiency in the Forward Capacity Market (Capacity Supply Obligation; MW) .......... 6
Figure 2-3: General timeline for developing the energy-efficiency forecast. ............................................................ 7
Figure 6-1: Sample percentage of costs ($), demand (kW), and lifetime energy reduction (kWh), for each type of energy-efficiency measure used by programs in the New England states, total for 2009 to 2014. ........................................................................................................................... 21
Figure 6-2: Percentage of total annual energy savings (kWh) in New England, by type of energy-efficiency measure and sector, total for 2009 to 2014. ......................................................................................... 22
Figure 6-3: Percentage of total demand savings (kW) in New England, by type of energy-efficiency measure and sector, total for 2009 to 2014. ........................................................................................................ 22
Figure 6-4: Percentage of total investment ($) in energy-efficiency measures in New England, by type of measure and sector, total for 2009 to 2014. ........................................................................ 23
Tables Table 2-1 Types of Energy-Efficiency Programs of the New England States ............................................................ 4
Table 4-1 Sample EE Data Parameters Collected on the EEF Worksheet .............................................................. 14
Table 4-2 Sample Program Summary of an ISO New England Energy-Efficiency Forecast .................................... 16
Table 5-1 ISO New England’s Sample Final Energy-Efficiency Forecast for 2020 to 2025 (GWh, MW, $1,000s) .............................................................................................................................. 19
Table 6-1 Sample Net Annualized Production Costs for Energy-Efficiency Measures Reported in 2014 for Each New England State (Sum of $/MWh) .......................................................... 24
Table 6-2 Sample Costs Based on Net Annualized Savings for Energy-Efficiency Measures Reported in 2014 for Each New England State ($/kW) ............................................................................................................ 24
Table 6-3 Sample Peak-to-Energy Ratio Based on Net Annualized Savings for Energy-Efficiency Measures Reported in 2014 for Each New England State (MW/GWh) .................................................. 25

Energy Efficiency Forecast Overview Report page 1 ISO-NE PUBLIC
Section 1
Executive Summary ISO New England Inc. (ISO) is the not-for-profit corporation responsible for the reliable operation of New England’s electric power system. It also administers the region’s wholesale electricity markets and manages the comprehensive planning of the regional power system. In 2012, at the request of stakeholders, the ISO developed a process to forecast the future impacts on power system loads of the energy efficiency (EE) delivered by state-sponsored EE programs. It subsequently incorporated the EE forecast (EEF) into system planning studies.1
This document provides an overview of the ISO’s EEF methodology and assumptions it uses to generate the annual forecast.2 It also presents sample data depicting how the ISO collects and presents regional and state-level data and how energy efficiency affects total annual energy use and seasonal peak demand. Also discussed are the ISO’s approach to assessing measurement trends in EE policy and funding.
1.1 Overview
Compared with the rest of the nation, the New England states’ EE programs rank among the most ambitious.3 Each state has its own structure for planning and implementing EE programs, although all the programs generally cover the residential, commercial, and industrial sectors. In general, EE programs range from consumer incentives, such as rebates for purchasing new efficient equipment, process improvements, and energy management systems, to energy audits. Some states also have established aggressive long-term energy-efficiency goals tied to reductions in greenhouse gas emissions and global-warming solutions. In New England, lighting and mixed-lighting measures constitute most of the savings in energy use and peak demand, and the commercial and industrial sectors provide a majority of the overall savings.
The savings in energy use resulting from EE programs result in demand reductions that can be bid into the ISO-administered Forward Capacity Market (FCM). Since the inception of the FCM, the region’s EE program administrators (PAs) typically have bid their EE portfolios into this market. By this mechanism, EE resources are compensated for providing capacity the same way as traditional generating resources. Long-term data on EE performance in the FCM provides the ISO with a solid understanding of the amount of EE available in the region in the one- to three-year timeframe. Because the New England states intend for their EE programs to grow in the long term, and because the ISO’s long-term planning process generally estimates system needs 10 years into the future, the EE forecast provides information about the amount of EE anticipated to be deployed over the four-to-10-year planning horizon beyond the FCM’s three-year timeframe.
1 The forecast does not affect any market activity pursuant to Market Rule 1, Section III.13, of the ISO’s Transmission, Markets, and Services Tariff (ISO tariff), Market Rule 1 (2016), http://www.iso-ne.com/regulatory/tariff/sect_3/index.html. 2 The data for the most recent energy-efficiency forecast is available at http://www.iso-ne.com/system-planning/system-forecasting/energy-efficiency-forecast. 3 In 2015, Massachusetts was ranked first nationally on the American Council for an Energy-Efficient Economy’s (ACEEE) annual scorecard—for the fifth year in a row; Vermont was ranked third; Rhode Island, fourth; and Connecticut, sixth. Maine was ranked fourteenth in 2015 and New Hampshire, twentieth. See http://database.aceee.org/state-scorecard-rank.

Energy Efficiency Forecast Background Report page 2 ISO-NE PUBLIC
To get assistance in developing an EE forecast, the ISO chairs the Energy-Efficiency Forecast Working Group (EEFWG). This broad stakeholder group supplies and verifies data on the performance of EE programs in New England.
1.2 EE Forecast Methodology
At a high level, the EE forecasting methodology is based on the projected costs of energy savings (expressed in dollars per megawatt-hours; $/MWh) and projected future state-sponsored EE budgets. By projecting the amount that the states will authorize PAs to spend in future years and the amount of energy savings achieved per dollar spent, future energy savings can be calculated. The ISO also uses a “peak-to-energy” ratio to estimate how the projections of energy use (i.e., savings in energy use) (in MWh) will affect future peak demand (in megawatts; MW).
A simplified representation of the calculation for the ISO’s EE forecast methodology is as follows:
Where:
• BSR is budget spend rate (%).
• Budget $ is an estimate of the dollars to be spent on EE ($).
• $/MWh is production cost.
• PCINCR is production cost increase (%).
Where:
• PER is the ratio of the peak energy demand to the annual energy use (peak-to-
energy ratio) (MW/MWh)
1.3 Sample Metrics Presented
An EE forecast shows the savings in energy use (or, potentially, no net change) resulting from state-sponsored EE programs in New England as a whole and for each state. The EE forecast also projects the impact that any savings in energy use resulting from EE would have on peak demand across the region. The EE forecast report presents the results for a lower percentage of expected energy use and a lower or relatively unchanged peak demand in winter and summer for the forecast period. For the year of the forecast, the ISO states the total energy output from the region’s generation sources in gigawatt-hours (GWh), the average annual energy savings attributable to EE as a percentage of total generation, the savings from EE on average over the forecast timeframe, and other relevant metrics. For its EEF reports, the ISO also collects and presents data on EE measures to help analyze future trends in EE performance production cost.
1) MWh = [ (1 - BSR) * Budget $ ] / [ $/MWh * PCINCR ]
2) MW = MWh * PER

Energy Efficiency Forecast Background Report page 3 ISO-NE PUBLIC
Section 2 Introduction ISO New England Inc. (ISO) is the not-for-profit corporation responsible for the reliable operation of New England’s electric power system. It also administers the region’s wholesale electricity markets and manages the comprehensive planning of the regional power system. In 2012, at the request of stakeholders, the ISO developed a process for forecasting the impacts of energy efficiency (EE) delivered by state-sponsored EE programs on future loads and incorporated the EE forecast into system planning studies.4
Energy efficiency can include any combination of products, equipment, systems, services, practices, and strategies an end-use customer can use to reduce the total amount of electrical energy needed at their facilities while delivering a comparable or improved level of end-use service. These measures can include the installation of more energy-efficient lighting; motors; refrigeration; heating, ventilation, and air conditioning (HVAC) equipment and control systems; envelope measures; operations and maintenance procedures; and industrial process equipment.5 In the New England states, EE measures are components of a program administrator’s (PA’s) EE portfolio offered to customers to reduce their energy usage.
The development of the ISO’s EE forecast (EEF) followed a multiyear stakeholder outreach and data-collecting effort spearheaded by the ISO.6 This initial effort was necessary because no single source of information was available on the size and scope of the six New England states’ EE programs.
This report summarizes the rationale for developing the EE forecast and the methodology and assumptions used to create them. Sample results are provided at the regional and state levels on the savings in annual energy use attributable to the states’ energy-efficiency programs, the effects of energy-efficiency measures on peak demand, and several other metrics.7
2.1 Background
The six New England states—Connecticut, Maine, Massachusetts, New Hampshire, Rhode Island, and Vermont—have led the charge nationally for increasing energy efficiency through the deployment of statewide ratepayer-funded programs. While each state has its own statutes, rules, policies, and structure for planning and implementing EE programs, all the programs generally cover the residential and commercial and industrial (C&I) sectors. In general, EE programs range from consumer incentives, such as rebates for purchasing new efficient equipment, process improvements, and energy management systems, to energy audits. In addition, most states have EE
4 The ISO uses the energy-efficiency forecast for planning purposes only; the forecast does not affect any market activity pursuant to Market Rule 1, Section III.13, of the ISO’s Transmission, Markets, and Services Tariff (ISO tariff); http://www.iso-ne.com/participate/rules-procedures/tariff. The ISO takes no position on state policy decisions regarding the selection of measure types or the focus of EE programs. 5 Energy efficiency is as defined in Section I of the ISO tariff; see http://www.iso-ne.com/static-assets/documents/regulatory/tariff/sect_1/sect_i.pdf. 6 Background information on the ISO’s Regional Energy-Efficiency Initiative is available at http://www.iso-ne.com/static-assets/documents/committees/comm_wkgrps/inactive/reei/mtrls/reei_background.pdf. 7 The most recent forecast is available at http://www.iso-ne.com/system-planning/system-forecasting/energy-efficiency-forecast.

Energy Efficiency Forecast Background Report page 4 ISO-NE PUBLIC
programs designed to assist low-income residents and “hard-to-reach” customers, as well as goals to achieve all cost-effective savings. Some states also have established aggressive long-term energy-efficiency goals tied to reductions in greenhouse gas emissions and global-warming solutions. Table 2-1 shows the types of EE programs of the New England states for each class.
Table 2-1 Types of Energy-Efficiency Programs of the New England States
Commercial/Industrial Low Income Residential
Behavior Behavior Behavior
Demand response Demand response Demand response
Education Education Education
Lighting/appliances Lighting/appliances Lighting/appliances
Loans Loans Loans
Lost opportunity, small(a) Lost opportunity(a) Lost opportunity(a)
Lost opportunity, large(a)
Retrofit, small Retrofit Retrofit
Retrofit, large
(a) Lost opportunity generally refers to new construction efficiency measures.
Generally, the state public utilities commissions (PUCs) are responsible for approving EE program scope, costs, and implementation.8 Investor-owned utilities, “efficiency” utilities, and community-choice aggregators often serve as program administrators and manage the state-sponsored EE programs.9 States fund EE programs via several sources. The majority of funds are accrued through a system benefits charge (SBC), which appears as a line item on ratepayer bills. EE funds also are generated by other sources, such as proceeds from the Regional Greenhouse Gas Initiative (RGGI) auctions, the ISO New England Forward Capacity Market (FCM), and EE reconciliation funds established to support all cost-effective EE policies.10
2.2 Energy Efficiency in New England
State-sponsored EE programs have a long history in the region, with programs in Massachusetts going back close to 25 years.11 In recent years, significant changes in New England state policies 8 More specific information about state EE programs is available at http://www.dsireusa.org. 9 Most of the energy efficiency implemented in Maine and Vermont is by energy-efficiency utilities, Efficiency Maine Trust, and Efficiency Vermont, respectively. 10 EE expenditures also typically include some investment directly by the rate payer for costs not covered by the programs. These funds are considered as part of the calculations to determine net benefits but are not explicitly factored into program budgets for the purpose of the EEF. For information on RGGI, see www.rggi.org. The FCM is a locational capacity market for which the ISO projects the needs of the power system three years in advance and then holds an annual auction to purchase power resources to satisfy the future capacity needs, regionwide and in local areas. The aim of the FCM is to send appropriate price signals to attract new investment and maintain existing resources where and when needed, including during shortage events, thus ensuring the reliability of the New England electricity grid. 11 Massachusetts Department of Energy Resources, Efficiency as Our First Fuel: Strategic Investments in Massachusetts’ Energy Future: the 2010 Report of the Massachusetts Energy Efficiency Advisory Council (June 2011), http://www.mass.gov/eea/docs/doer/energy-efficiency/eeac-2010-report-ee-advisory-council.pdf.

Energy Efficiency Forecast Background Report page 5 ISO-NE PUBLIC
and funding for EE programs have grown to unprecedented levels. Vermont began the trend in supporting all cost-effective EE measures in 2007, earning it the top spot in the American Council for an Energy-Efficient Economy (ACEEE) scorecard for that year.12 In subsequent years, Rhode Island, Massachusetts, Maine, and Connecticut adopted policies to promote all cost-effective measures, with funding mechanisms to match the state goals. All four states continue to rank in the top 10 nationally on the ACEEE scorecard, with Massachusetts taking the top spot for five years running.13 Figure 2-1 depicts the trends in EE funding for the six New England states from 2004 to 2014, as reported by either PAs or the state regulatory agencies.
Figure 2-1: Trends in EE funding for the six New England states, 2004 to 2014.
Energy-efficiency programs not only have a long history as state policy, they also have a long history of participation in ISO New England’s markets. Under the market rules governing the transition period of the Forward Capacity Market, in December 2006, the ISO began accepting and registering qualified EE projects as capacity resources. Starting in 2010 and continuing today, EE resources continue to participate in the FCM, taking significant positions in all the annual auctions for future delivery periods. As a result, the FCM provides the ISO with a comprehensive understanding and projection of the savings in energy use over the three-to-four-year FCM horizon. Figure 2-2 shows the growth of EE in the FCM.
12 See the American Council for an Energy-Efficient Economy’s annual scorecard ranking states on their EE programs; http://aceee.org/state-policy/scorecard. 13 In 2015, Massachusetts was ranked first nationally on the ACEEE scorecard—for the fifth year in a row; Vermont was ranked third; Rhode Island, fourth; and Connecticut, sixth. Maine was ranked fourteenth in 2015 and New Hampshire, twentieth. See http://database.aceee.org/state-scorecard-rank.

Energy Efficiency Forecast Background Report page 6 ISO-NE PUBLIC
Figure 2-2: Growth of energy efficiency in the Forward Capacity Market (Capacity Supply Obligation; MW) Notes: “MW” stands for megawatts.
Given the significant changes that had occurred in the New England EE programs over the 10 prior years, in 2011, the ISO conducted a detailed survey of the region’s EE program administrators concerning their participation in the FCM. The results of this analysis showed that essentially all the EE capacity the PAs developed was indeed participating in the FCM.14 The ISO also determined that nonregulated entities deploying EE through performance contracts were small relative to the state-funded programs and some already in the FCM. Consequently, the projections of EE in the ISO’s planning process only focus on state-sponsored EE programs. 2.3 Early Development of the Energy-Efficiency Forecast
In 2009, the ISO and the region’s energy-efficiency stakeholders began an intensive, multiyear research, data-collection, and analysis process, resulting in a comprehensive assessment of historical EE spending and savings achieved in PA-administered programs. The ISO and EE stakeholders agreed to the need for an approach to account for future EE investment and savings beyond the FCM based on empirical data and long-standing policy and legislative mandates. In 2012, the ISO began the development, with input from stakeholders, of a methodology to forecast EE savings in years beyond the FCM out to 10 years. The EE forecast would equip system planners and stakeholders with reliable information about the long-term impacts of state-sponsored EE programs.
14 ISO New England, Energy Efficiency Update, PAC presentation (April 14, 2011), http://www.iso-ne.com/static-assets/documents/committees/comm_wkgrps/prtcpnts_comm/pac/mtrls/2011/apr142011/energy_efficiency.pdf.

Energy Efficiency Forecast Background Report page 7 ISO-NE PUBLIC
2.4 Energy-Efficiency Forecast Working Group
In 2012, the ISO established the Energy-Efficiency Forecast Working Group (EEFWG) to provide ongoing input into the EE forecast process.15 In addition to the ISO, this stakeholder group consists of state representatives with expertise in energy-efficiency programs, PAs, and other interested parties, who provide guidance on EE forecast assumptions, methodologies, and data inputs. Chaired by the ISO, the EEFWG meets periodically over the course of a year to assist the ISO in the development of the EE forecast. Members of the EEFWG provide data to the ISO on EE programs, ensuring that the most complete and accurate information is available for the EE forecast. The ISO analyzes the data, which the EEFWG then validates. The EEFWG also reviews the draft EE forecast and provides feedback where appropriate. The EEFWG is an open stakeholder process, and new participants are welcome. Figure 2-3 shows a sample timeline of relevant EE forecast meetings and other milestones in the EEF process.
Figure 2-3: General timeline for developing the energy-efficiency forecast. Note: Key to data presented at EEFWG meetings: 1) The ISO posts draft EE production data, spending data, and measure details for the EEFWG December meeting for data verification. Data used for implementing the model are vetted during this meeting. 2) Draft EE production data and spending data, draft model assumptions, and preliminary forecast results are included in materials posted for the draft EE forecast review meeting of the EEFWG held in the February timeframe. 3) Final EE production data and spending data, model assumptions, and final forecast results are included in materials posted to the ISO webpage for the EE forecast; see http://www.iso-ne.com/eef.
15 More information on the EEFWG is available at http://www.iso-ne.com/eefwg.

Energy Efficiency Forecast Background Report page 8 ISO-NE PUBLIC
Section 3 Forecast Methodology To create a quantitative, data-driven forecast of future EE, the ISO needed a forecast methodology. To determine whether such a methodology existed, ISO New England surveyed other ISOs and Regional Transmission Organizations. The survey gathered information about whether other regions were dealing with these issues and, if so, if they had an EE forecast methodology. Results of this survey concluded that only the New York ISO (NYISO) had a basic EE forecast tool primarily based on the cost of EE measures and the state’s EE budget. Building on this basic concept, the ISO developed its own EE forecast methodology with stakeholder input. It first vetted a proof-of-concept forecast with stakeholders and then released a draft EE forecast for review on February 24, 2012.16 This draft used budget data and production costs provided by the PAs and included a range of scenarios for addressing various levels of uncertainty for consideration by the EEFWG. After consultation with the EEFWG, a final draft was released on March 19, 2012.17 As a result of input provided by the EEFWG, the ISO revised the EE forecast methodology to incorporate the states’ near-term approved EE budgets. The ISO bases its estimates of future EE budgets on projections of current EE revenue sources, including system benefits charges, revenues from RGGI auctions, the FCM, and other sources. The ISO relies on the states to provide accurate information about the sources of funding for EE programs. This section includes the calculations for the EE forecast model and the budget model.
3.1 EE Forecast Model
The ISO’s EE forecast calculates future energy reductions and peak demand savings based on three major elements:
• EE program budgets
• Production costs (expressed as dollars per megawatt-hours; $/MWh)
• A ratio of peak demand to the annual savings in energy use (MW/MWh)
3.1.1 Calculations for Future Energy Reductions
A simplified representation of the calculation for the ISO’s EE forecast methodology is as follows:
Where:
16 ISO New England, Energy Efficiency Forecast 2015–2012, EEFWG presentation (February 24, 2012), http://www.iso-ne.com/static-assets/documents/committees/comm_wkgrps/othr/enrgy_effncy_frcst/mtrls/ee_forecast_work_group_2_24_12_final.pdf. 17 ISO New England, Draft Final Energy-Efficiency Forecast 2015–2021 (March 19, 2012), http://www.iso-ne.com/committees/comm_wkgrps/othr/enrgy_effncy_frcst/mtrls/draft_final_ee_forecast_3_16_12.pdf.
1) MWh = [ (1 - BSR) * Budget $ ] / [ $/MWh * PCINCR ]

Energy Efficiency Forecast Background Report page 9 ISO-NE PUBLIC
• BSR is budget spend rate (%).
• Budget $ is an estimate of the dollars to be spent on EE ($).
• $/MWh is production cost.
• PCINCR is production cost increase (%).
Where:
• PER is the ratio of the peak energy demand to the annual energy use (“peak-to-
energy” ratio) (MW/MWh)
3.1.2 Model Uncertainty Factors
The ISO applies modest and reasonable uncertainty factors to future EE budgets to reflect the vagaries of predicting future policy trends. For example, in Massachusetts and Rhode Island in 2013, EE programs were continuing to expand rapidly. Another example is that Connecticut’s program expanded significantly for the 2014 program year. To reflect the uncertainty regarding whether or not these states would be able to spend the full budgeted amount for their newly expanded EE goals, the ISO discounted the budgets for these states a certain percentage (i.e., 10% for Massachusetts and Rhode Island). The ISO developed this uncertainty factor using actual percentage spend rates observed in prior reporting years. For the example of Connecticut’s projected expansion, the ISO determined that the Connecticut utilities had significant demand for services and would spend their full budget—a factor that would need to be reassessed in subsequent forecast years.
The ISO also adjusts the final EE forecast to account for the impacts of inflation on the program costs and assumed increases in production costs. For all states, the ISO has escalated production costs by 5% each year to account for the increasing costs of energy-efficiency measures. In addition, the ISO has applied a 2.5% inflation rate on all states. A longer EE data record, built up year after year, may allow for the refinement of all the uncertainty factors.
A description of the regional and state-specific EE forecast model uncertainty factors and other assumptions are presented in the actual forecast.18
3.2 Budget Model
The following equations are used to estimate the projected budgets through a forecast period. The budget model accounts for temporal changes to the annual budgets resulting from revenues tied to energy sales, the FCM, RGGI fund allocation and other policy dollars. As previously noted, program administrators, state regulatory personnel, or their representatives provide certain data used in the
18 http://www.iso-ne.com/system-planning/system-forecasting/energy-efficiency-forecast
2) MW = MWh * PER

Energy Efficiency Forecast Background Report page 10 ISO-NE PUBLIC
equations. The balance of parameters originates from other ISO reports, such as the Capacity, Energy, Load, and Transmission (CELT) Report and Forward Capacity Market results.19
3) Amount of EE dollars gained from system benefits charge:
SALES(y, r) =NEL(y, r) − PDR(y, r)
(1 + Loss Factor) ∗ %SBC
Where:
• NEL is the ISO New England annual net energy for load forecast.
• PDR refers to ISO New England FCM passive demand resources.20
• Loss Factor is the average of transmission and distribution losses for ISO New England.
• %SBC is the percentage of sales subject to the systems benefit charge (PA/regulator).
• y is the year
• r is the region or state
4) Budget dollars available for EE programs from sources other than state budgets:
Budget$(y, r) = [SALES(y, r) ∗ SBC(r)] + [RGGI$(r) ∗ %RGGI(r)] +
[FCMMW(r) ∗ %FCM(r)] + POLVAR(y, r)
Where:
• SALES refers to the ISO New England annual electricity sales forecast.
• SBC is the system benefit charge (PA/regulator).
• RGGI$ is the annual average dollars from the historical RGGI auctions in New England.
• %RGGI is the percentage of RGGI$ to be spent on EE (PA/regulator).
• FCMMW is the level of passive demand resources in the ISO New England FCM.
• CLPR is the last ISO New England Forward Capacity Auction (FCA) clearing price.
• %FCM is the percentage of FCM dollars to be spent on EE (PA/regulator).
19 The ISO’s CELT reports are available at http://www.iso-ne.com/system-planning/system-plans-studies/celt. FCM results are available at http://iso-ne.com/markets-operations/markets/forward-capacity-market and http://iso-ne.com/about/key-stats/markets#fcaresults. 20 Passive demand resources (PDRs) reduce electric energy consumption that generation resources would have otherwise served. Energy efficiency is a passive demand resource.

Energy Efficiency Forecast Background Report page 11 ISO-NE PUBLIC
• POLVAR$ is the money to be spent on EE not based on SBC, RGGI, or FCM (PA/regulator).
5) State budget dollars accounting for spend-rate uncertainty:
TOTALDLR$(y, r) = BUDGET$(y, r) ∗ [100 − BSR(r)]
Where:
• %SPENT is the percentage of BUDGET$ that can be spent (PA data).
6) EE megawatt-hours based on cost to produce an EE megawatt-hour and available funds:
EEMWH(y, r) = TOTDLR$(y,r)
PRODCOST(r)∗PCINCR(y,r) ∗ (1 + Loss Factor)
Where:
• EEMWH is the annual megawatt-hours of EE.
• TOTDLR$ is the amount of dollars spent annually on EE.
• PRODCOST refers to the dollars spent per achieved megawatt-hour of EE (PA data).
7) Amount of EE megawatt-hours that occur on peak:
EEMW(y, r) = EEMWH(y, r) ∗ PEAKENER(r)
Where:
• EEMW refers to the EE megawatts on peak.
• PEAKENER is the ratio of EE megawatts on peak to the annual EE megawatt-hours (PA data).
8) Adjustment in system benefits charge (SBCADJ) in the budget due to the impacts of lower energy sales resulting from EE investment:

Energy Efficiency Forecast Background Report page 12 ISO-NE PUBLIC
SBCADJ$(y, r) = �EEMWH(y, r) ∗ SBC(r)
Where:
• EEMWH EE reduces total electricity sales and SBC dollars for EE:
9) Adjustment in FCM revenues (FCMADJ) in the budget due to impacts of increased capacity payments resulting from EE investment:
FCMADJ$(y, r) = �EEMW(y, r) ∗ CLPR ∗ %FCM(y, r)
Where:
• EEMW clears the FCA and funds additional EE.
10) Total energy reductions based on budget, adjustments to the budget, production costs, and adjustments to production costs:
EEMWH(y, r) =TOTDLR$(y, r) − SBCADJ$(y, r) + FCMADJ$(y, r)
PRODCOST(r) ∗ PCINCR(y, r)
11) Peak demand reduction based on energy and peak-to-energy ratio:
EEMW(y, r) = EEMWH(y, r) ∗ PEAKENER(r)

Energy Efficiency Forecast Background Report page 13 ISO-NE PUBLIC
Section 4 Data Collection This section summarizes the process the ISO uses to gather data and presents sample data collected for a set of forecast years. The detailed sample data from state-sponsored EE programs are used to implement the EE forecast methodology and produce the EE forecast.
4.1 Data-Collection Process
The ISO collects data for the EE forecast by annually distributing an EE data-gathering worksheet to the PAs.21
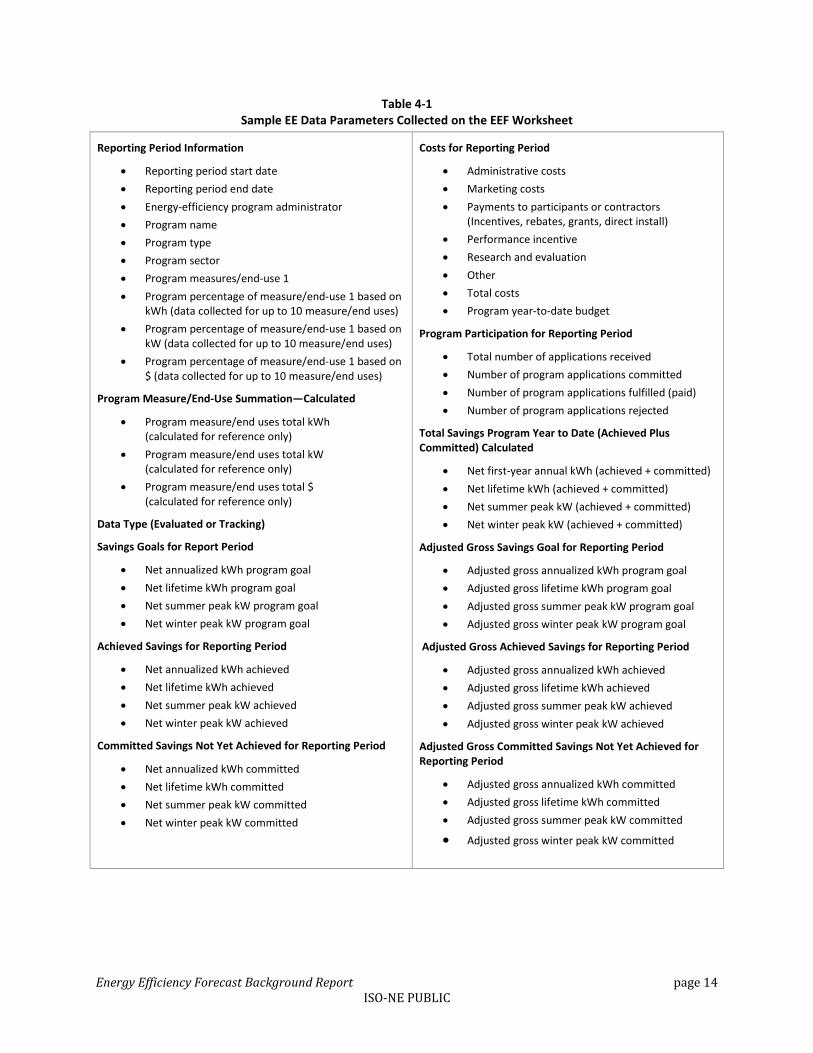
Via the worksheet, the ISO receives data from all the region’s PAs, who report on approximately 150 unique EE programs aimed at commercial/industrial, residential, and low-income customers.22 For each EE program, a PA can provide information on the type of EE program, the distribution of measures, the budgeted and actual costs associated with implementing the program, the planned and the actual net energy and demand savings, and gross energy and demand savings. Table 4-1 shows a sample of the EE data-parameter categories included on the EEF worksheet that the ISO provides to the PAs each year for collecting data.
21 EE data that the PAs submit the ISO are available at http://www.iso-ne.com/committees/planning/energy-efficiency-forecast. 22 The ISO did not request data from municipal electric entities and merchant energy-efficiency providers.
Energy Efficiency Forecast Background Report page 14 ISO-NE PUBLIC
Table 4-1 Sample EE Data Parameters Collected on the EEF Worksheet
Reporting Period Information
• Reporting period start date • Reporting period end date • Energy-efficiency program administrator • Program name • Program type • Program sector • Program measures/end-use 1 • Program percentage of measure/end-use 1 based on
kWh (data collected for up to 10 measure/end uses) • Program percentage of measure/end-use 1 based on
kW (data collected for up to 10 measure/end uses) • Program percentage of measure/end-use 1 based on
$ (data collected for up to 10 measure/end uses)
Program Measure/End-Use Summation—Calculated
• Program measure/end uses total kWh (calculated for reference only)
• Program measure/end uses total kW (calculated for reference only)
• Program measure/end uses total $ (calculated for reference only)
Data Type (Evaluated or Tracking)
Savings Goals for Report Period
• Net annualized kWh program goal • Net lifetime kWh program goal • Net summer peak kW program goal • Net winter peak kW program goal
Achieved Savings for Reporting Period
• Net annualized kWh achieved • Net lifetime kWh achieved • Net summer peak kW achieved • Net winter peak kW achieved
Committed Savings Not Yet Achieved for Reporting Period
• Net annualized kWh committed • Net lifetime kWh committed • Net summer peak kW committed • Net winter peak kW committed
Costs for Reporting Period
• Administrative costs • Marketing costs • Payments to participants or contractors
(Incentives, rebates, grants, direct install) • Performance incentive • Research and evaluation • Other • Total costs • Program year-to-date budget
Program Participation for Reporting Period
• Total number of applications received • Number of program applications committed • Number of program applications fulfilled (paid) • Number of program applications rejected
Total Savings Program Year to Date (Achieved Plus Committed) Calculated
• Net first-year annual kWh (achieved + committed) • Net lifetime kWh (achieved + committed) • Net summer peak kW (achieved + committed) • Net winter peak kW (achieved + committed)
Adjusted Gross Savings Goal for Reporting Period
• Adjusted gross annualized kWh program goal • Adjusted gross lifetime kWh program goal • Adjusted gross summer peak kW program goal • Adjusted gross winter peak kW program goal
Adjusted Gross Achieved Savings for Reporting Period
• Adjusted gross annualized kWh achieved • Adjusted gross lifetime kWh achieved • Adjusted gross summer peak kW achieved • Adjusted gross winter peak kW achieved
Adjusted Gross Committed Savings Not Yet Achieved for Reporting Period
• Adjusted gross annualized kWh committed • Adjusted gross lifetime kWh committed • Adjusted gross summer peak kW committed
• Adjusted gross winter peak kW committed

Energy Efficiency Forecast Background Report page 15 ISO-NE PUBLIC
The New England states’ energy-efficiency programs include the following types of general end-use measures:23
• Appliances
• Building envelope
• Compressed air
• Consumer products
• Custom
• Education
• Heating
• Hot water
• Heating, ventilation, and air conditioning
• Lighting
• Motors/drives/variable-frequency drives
• Process improvements (equipment operation)
• Refrigeration
• Small motors
4.2 Sample Data-Collection Results
Table 4-2 shows a summary of sample program data for an ISO energy-efficiency forecast.24 The proxy results show the totals and averages for the following statistics for New England and each New England state:25
• Annual energy production costs
• Ratio of summer peak demand to annual energy use
• Percentage of the annual energy savings goal achieved
• Percentage of the budget spent
• Percentage of the summer peak reduction goal achieved
23 Cooling end-use was converted to HVAC, pursuant to PA requests that cooling was better characterized as HVAC. 24 Please refer to the final forecast presentation for each year posted to the EE forecast webpage at http:/www.iso-ne.com/eef. 25 These data are presented in the data-verification materials for the EEFWG December timeframe meeting.

Energy Efficiency Forecast Background Report page 16 ISO-NE PUBLIC
Table 4-2 Sample Program Summary of an ISO New England Energy-Efficiency Forecast
State Budget Total
Costs
Achieved Annual Energy
$/MWh Achieved Summer
Peak $/MW Energy
Achieved Budget Spent
Peak Achieved
Peak-to-Energy Ratio
Achieved Lifetime Energy
Lifetime $/MWh
$1,000s $1,000s MWh $ MW $ % % % MW/GWh MWh $
NE
2009 357,939 352,374 933,803 377 150 160.8 2,352,646 83 98 94 0.1604 0.1722
2010 524,416 500,979 1,371,179 365 192 238.4 2,616,574 103 96 95 0.1396 0.1738
2011 665,087 518,865 1,575,303 329 200 266.3 2,588,875 90 78 75 0.1272 0.1690
2012 745,761 648,848 1,723,357 377 221 289.5 2,930,057 98 87 86 0.1285 0.1680
2013 726,500 706,010 1,829,993 386 253 314.5 2,786,815 109 97 105 0.1384 0.1718
2014 857,984 862,384 2,063,665 418 275 337.4 3,139,835 114 101 100 0.1331 0.1635
Avg 2011–13 712,449 624,574 1,709,551 365 225 290.1 2,775,039 99 88 88 0.1317 0.1697
Avg 2012–14 776,749 739,081 1,872,338 395 250 313.8 2,958,516 107 95 97 0.1334 0.1676

Energy Efficiency Forecast Background Report page 17 ISO-NE PUBLIC
4.3 EE Forecast Input Data
Tables including the inputs, such as forecasted energy and loads, and the sample data collected for an actual forecast from the PAs and state regulatory agencies are included in the draft and final forecasts and are posted to the ISO web page (see previous links in footnotes).

Energy Efficiency Forecast Background Report page 18 ISO-NE PUBLIC
Section 5 Sample Results of New England’s Energy-Efficiency Forecast The results of the final EE forecast for the forecast years will project a savings in the average and total energy use and peak demand for the region and each state attributable to the states’ energy-efficiency programs. The results for average energy use, which are based on an average annual spending rate among the six states, and the forecast for total savings for the forecast years, are presented in gigawatt-hours.
Table 5-1 shows sample results for the ISO’s final EE forecast for the sample forecast years. The sections that follow show summaries of sample results of the regional load forecast accounting for the state-level EE forecasts.

Energy Efficiency Forecast Background Report page 19 ISO-NE PUBLIC
Table 5-1 ISO New England’s Sample Final Energy-Efficiency Forecast for 2020 to 2025 (GWh, MW, $1,000s)
Forecast of Electric Energy Savings (GWh)
Year Sum of States States
ME NH VT CT RI MA
2020 1,890 141 56 108 368 148 1,069
2021 1,767 131 53 104 347 138 994
2022 1,652 122 51 99 327 128 925
2023 1,545 114 48 95 308 119 860
2024 1,444 106 46 91 290 111 800
2025 1,350 98 43 87 273 103 745
Total 9,648 713 297 584 1,914 747 5,394
Average 1,608 119 49 97 319 125 899
Forecast of Peak Demand Savings (MW)
Year Sum of States States
ME NH VT CT RI MA
2020 251.4 14.5 8.2 13.6 47.6 21.8 145.8
2021 235.1 13.5 7.8 13.1 44.9 20.3 135.6
2022 219.8 12.5 7.4 12.6 42.3 18.9 126.1
2023 205.5 11.7 7.0 12.0 39.9 17.6 117.3
2024 192.1 10.8 6.7 11.5 37.6 16.4 109.1
2025 179.5 10.1 6.3 11.0 35.4 15.3 101.5
Total 1,283.5 73.1 43.3 73.8 247.6 110.2 735.5
Average 213.9 12.2 7.2 12.3 41.3 18.4 122.6
Forecast of Projected Budgets ($1,000s)
Year Sum of States States
ME NH VT CT RI MA
2020 1,086,341 35,789 32,452 58,887 234,931 86,218 638,064
2021 1,092,352 35,789 33,204 60,794 238,373 86,128 638,064
2022 1,098,212 35,789 33,930 62,613 241,693 86,123 638,064
2023 1,104,118 35,789 34,634 64,510 244,876 86,246 638,064
2024 1,109,760 35,789 35,300 66,346 247,905 86,356 638,064
2025 1,115,324 35,789 35,941 68,234 250,800 86,497 638,064
Total 6,606,107 214,734 205,461 381,384 1,458,578 517,568 3,828,384
Average 1,101,018 35,789 34,244 63,564 243,096 86,261 638,064
Figure 5-1 shows ISO New England FCM results for passive demand resources (square) for the earlier sample years and the energy-efficiency forecast results (diamonds) for later sample years for summer peak demand (MW).

Energy Efficiency Forecast Background Report page 20 ISO-NE PUBLIC
Figure 5-1: ISO New England FCM #X passive-demand-resource projections for earlier sample years (square) and energy-efficiency forecast results (diamonds) for later sample years for summer peak demand (MW).
5.1 State-Level EE Forecasts
The inputs to the forecast model for each state reflect that each state funds its EE programs somewhat differently. The ISO addressed these unique issues in the assumptions described for each state, including the model input and the rationale for the use of the assumption. The following are the state-level assumptions that may vary across the regional model:
• Budget basis: planned or rate based
• Budget uncertainty rate: applied to rapidly changing portfolios
• Production cost basis: average of historical production costs
• Production cost escalation rate: estimated change in delivery cost due to technology and penetration rates plus inflation
• Ratio of peak energy demand to the annual use of electric energy: average of historical ratio
• Additional budgetary items: alternative revenue sources, state redirection of budget model components (e.g., SBC, RGGI, FCM, policy)
State-level results for the effects of energy efficiency on summer peak demand and savings in annual energy use are presented in each annual forecast and posted to the ISO website.
Energy Efficiency Forecast Background Report page 21 ISO-NE PUBLIC
Section 6 Appendix A: Sample Data on Energy-Efficiency Measures 6.1 Energy-Efficiency Measure Savings and Costs by Customer Sector
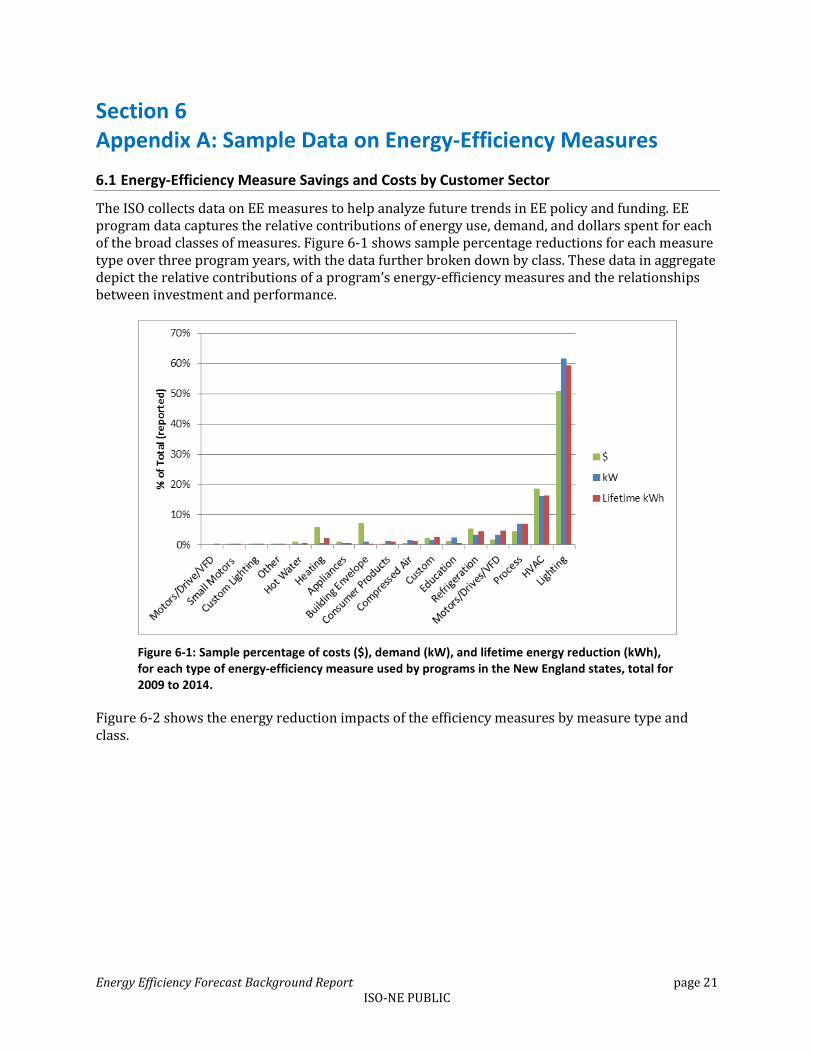
The ISO collects data on EE measures to help analyze future trends in EE policy and funding. EE program data captures the relative contributions of energy use, demand, and dollars spent for each of the broad classes of measures. Figure 6-1 shows sample percentage reductions for each measure type over three program years, with the data further broken down by class. These data in aggregate depict the relative contributions of a program’s energy-efficiency measures and the relationships between investment and performance.
Figure 6-1: Sample percentage of costs ($), demand (kW), and lifetime energy reduction (kWh), for each type of energy-efficiency measure used by programs in the New England states, total for 2009 to 2014.
Figure 6-2 shows the energy reduction impacts of the efficiency measures by measure type and class.

Energy Efficiency Forecast Background Report page 22 ISO-NE PUBLIC
Figure 6-2: Percentage of total annual energy savings (kWh) in New England, by type of energy-efficiency measure and sector, total for 2009 to 2014.
Figure 6-3 shows the demand reduction exhibited by each of the efficiency measures and sector.
Figure 6-3: Percentage of total demand savings (kW) in New England, by type of energy-efficiency measure and sector, total for 2009 to 2014.
Figure 6-4 shows the sample distribution of program funding across the measures.

Energy Efficiency Forecast Background Report page 23 ISO-NE PUBLIC
Figure 6-4: Percentage of total investment ($) in energy-efficiency measures in New England, by type of measure and sector, total for 2009 to 2014.
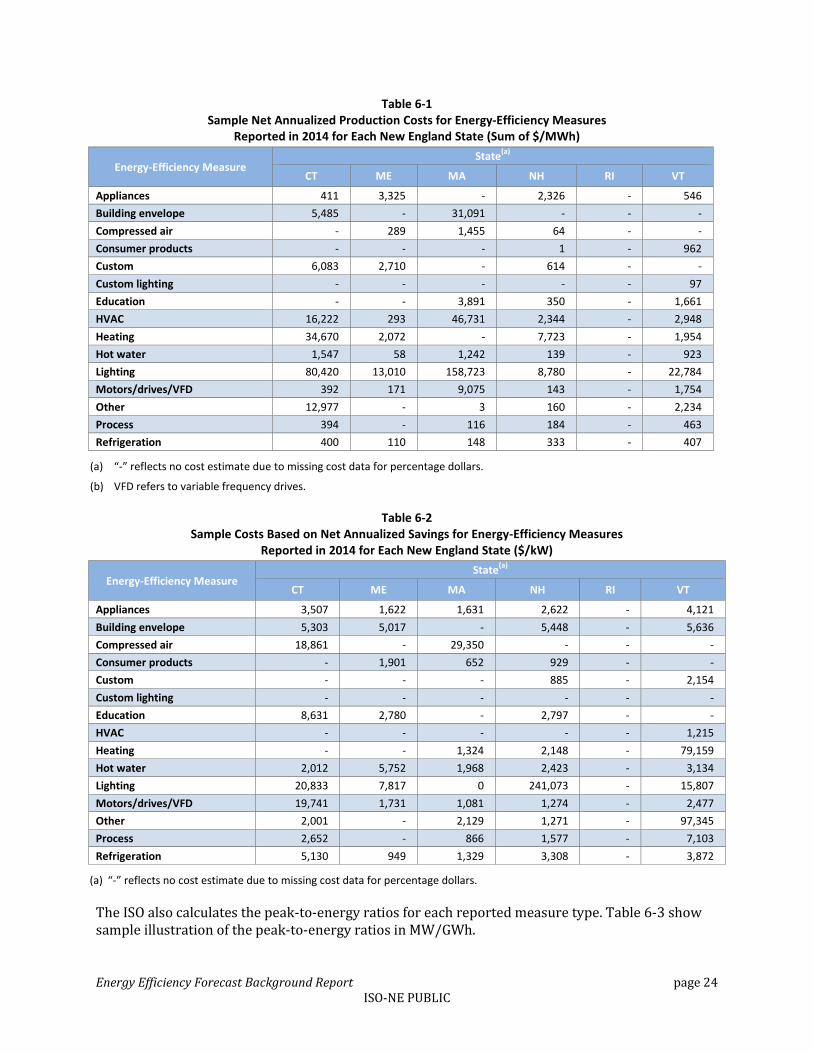
6.2 Production Cost Savings by Energy-Efficiency Measure
The ISO calculates production cost data for each type of energy-efficiency measure for the latest production year. Table 6-1 and Table 6-2 show sample illustrations for the relative dollar cost of each measure per megawatt-hour and per kilowatt, respectively, and the cost differences. These values reflect total costs for program measures plus any attributable, unallocated portfolio costs divided by savings for all periods.26
26 Attributable unallocated portfolio costs include costs from programs that have no reported savings and are shared across programs that have savings proportional to energy or cost contribution, depending on the type of spending.
Energy Efficiency Forecast Background Report page 24 ISO-NE PUBLIC
Table 6-1 Sample Net Annualized Production Costs for Energy-Efficiency Measures
Reported in 2014 for Each New England State (Sum of $/MWh)
Energy-Efficiency Measure State(a)
CT ME MA NH RI VT
Appliances 411 3,325 - 2,326 - 546 Building envelope 5,485 - 31,091 - - - Compressed air - 289 1,455 64 - - Consumer products - - - 1 - 962 Custom 6,083 2,710 - 614 - - Custom lighting - - - - - 97 Education - - 3,891 350 - 1,661 HVAC 16,222 293 46,731 2,344 - 2,948 Heating 34,670 2,072 - 7,723 - 1,954 Hot water 1,547 58 1,242 139 - 923 Lighting 80,420 13,010 158,723 8,780 - 22,784 Motors/drives/VFD 392 171 9,075 143 - 1,754 Other 12,977 - 3 160 - 2,234 Process 394 - 116 184 - 463 Refrigeration 400 110 148 333 - 407
(a) “-” reflects no cost estimate due to missing cost data for percentage dollars.
(b) VFD refers to variable frequency drives.
Table 6-2 Sample Costs Based on Net Annualized Savings for Energy-Efficiency Measures
Reported in 2014 for Each New England State ($/kW)
Energy-Efficiency Measure State(a)
CT ME MA NH RI VT
Appliances 3,507 1,622 1,631 2,622 - 4,121 Building envelope 5,303 5,017 - 5,448 - 5,636 Compressed air 18,861 - 29,350 - - - Consumer products - 1,901 652 929 - - Custom - - - 885 - 2,154 Custom lighting - - - - - - Education 8,631 2,780 - 2,797 - - HVAC - - - - - 1,215 Heating - - 1,324 2,148 - 79,159 Hot water 2,012 5,752 1,968 2,423 - 3,134 Lighting 20,833 7,817 0 241,073 - 15,807 Motors/drives/VFD 19,741 1,731 1,081 1,274 - 2,477 Other 2,001 - 2,129 1,271 - 97,345 Process 2,652 - 866 1,577 - 7,103 Refrigeration 5,130 949 1,329 3,308 - 3,872
(a) “-” reflects no cost estimate due to missing cost data for percentage dollars.
The ISO also calculates the peak-to-energy ratios for each reported measure type. Table 6-3 show sample illustration of the peak-to-energy ratios in MW/GWh.

Energy Efficiency Forecast Background Report page 25 ISO-NE PUBLIC
Table 6-3 Sample Peak-to-Energy Ratio Based on Net Annualized Savings for Energy-Efficiency Measures
Reported in 2014 for Each New England State (MW/GWh)
Energy-Efficiency Measure State(a)
CT ME MA NH RI VT
Appliances 0.2039 0.0962 0.0000 0.1363 0.0000 0.1061
Building envelope 0.0922 0.0000 0.3566 0.0000 0.0000 0.0000
Compressed air 0.0000 0.1780 0.1610 0.1469 0.2745 0.0000
Consumer products 0.0000 0.0000 0.2429 0.1776 0.6945 0.1272
Custom 0.1247 0.0871 0.0000 0.1462 0.0000 0.0000
Custom lighting 0.0000 0.0000 0.0000 0.0000 0.0000 0.1938
Education 0.0000 0.0000 0.1940 0.1142 0.0008 0.0377
HVAC 0.3068 0.0844 0.1368 0.3928 0.2249 0.1588
Heating 0.0762 0.1962 0.0000 0.0089 0.0000 0.0484
Hot water 0.0701 0.1962 0.1900 0.1040 0.2375 0.0873
Lighting 0.1133 0.1208 0.1377 0.1783 0.1198 0.1301
Motors/drives/VFD 0.0090 0.0914 0.1128 0.1967 0.1426 0.1208
Other 0.2195 0.0000 0.1525 0.1471 0.0000 0.0506
Process 0.1486 0.0000 0.1340 0.1168 0.1724 0.0652
Refrigeration 0.0781 0.1163 0.1114 0.1007 0.1057 0.1051