Energy Efficiency Enhancement and Climate Change ...
19
Research Article Energy Efficiency Enhancement and Climate Change Mitigations of SMEs through Grid-Interactive Solar Photovoltaic System G. N. Lalith Pankaj Raj and V. Kirubakaran Centre for Rural Energy, The Gandhigram Rural Institute-Deemed to be University, Gandhigram, 624 302 Tamil Nadu, India Correspondence should be addressed to V. Kirubakaran; [email protected] Received 26 November 2020; Revised 5 January 2021; Accepted 8 January 2021; Published 27 January 2021 Academic Editor: S. Shanmuga Priya Copyright © 2021 G. N. Lalith Pankaj Raj and V. Kirubakaran. This is an open access article distributed under the Creative Commons Attribution License, which permits unrestricted use, distribution, and reproduction in any medium, provided the original work is properly cited. According to the International Energy Agency’s estimation, Indian primary energy demand is expected to increase by about 1250 Mtoe and 1500 Mtoe by 2030. The 3 M management concept now changed into a 4 M management concept that includes energy management. In the case of energy management, the electrical energy sector assumes critical importance. An energy cost occupies nearly 30-40% of the production cost in small and medium-size enterprises (SMEs). Bureau of Energy Efficiency (BEE) has initiated a separate energy efficiency intervention to the SME’s, where the energy-efficient technologies, operational procedures, and proper awareness programs to SMEs are stated. This paper discusses the complete electrical energy audit on a small-scale Siddha and Ayurveda medicine industry. The traditional medicine manufacturing technologies make the process complex (process loads are intermittent/interlinked) during analysis. Hence, the detailed energy auditing/conservation studies on the power factor/harmonics were carried out without affecting Indian traditional medicine manufacturing technology. The postauditing design and installation of an intelligent controller by considering the intermittent/interlinked loads are carried out, and the effectiveness of the intelligent controller is ascertained with the energy conservation and the carbon emission reduction of SME. In addition, the climate change mitigation is ensured through the design and deployment of grid-interactive rooftop solar photovoltaic power plant using Solar Pro v4.5 (Photovoltaic System simulation software) with the power analysis, economic analysis and life cycle carbon emission of the proposed plant. The proposed solar photovoltaic power plant ensures energy self-sufficiency and sustainable energy utilization by carbon emission reduction on electricity utilization of SMEs. 1. Introduction According to the Ministry of Environment and Forests (MOEF), 70% of the total industrial pollution of the whole nation (INDIA) is due to SMEs [1]. The Bureau of Energy Efficiency (BEE) has initiated the energy efficiency interven- tions in selected 25 SME clusters during the XI plan. During the XII plan, implementations of 100 technology demonstra- tion real-time projects in five SME sectors envisaged facilitat- ing large-scale replication of the successful technology. As per Energy Conservation Act, 2001, energy audit is defined as verification, monitoring, and analysis of the use of energy, including submission of technical report containing recom- mendations for improving energy efficiency with cost-benefit analysis and an action plan to reduce energy consumption. Energy auditing is a systematic approach for energy manage- ment and the first step in realizing the energy efficiency oppor- tunities [2] with economic [3] consideration. The industrial energy audit is mainly focusing on the energy loss reduction [4] in the following aspects of the process, the operation modification, investment in energy-efficient technologies, load management, and conversion energy losses. Hindawi International Journal of Photoenergy Volume 2021, Article ID 6651717, 19 pages https://doi.org/10.1155/2021/6651717
Transcript of Energy Efficiency Enhancement and Climate Change ...

Research ArticleEnergy Efficiency Enhancement and Climate ChangeMitigations of SMEs through Grid-Interactive SolarPhotovoltaic System
G. N. Lalith Pankaj Raj and V. Kirubakaran
Centre for Rural Energy, The Gandhigram Rural Institute-Deemed to be University, Gandhigram, 624 302 Tamil Nadu, India
Correspondence should be addressed to V. Kirubakaran; [email protected]
Received 26 November 2020; Revised 5 January 2021; Accepted 8 January 2021; Published 27 January 2021
Academic Editor: S. Shanmuga Priya
Copyright © 2021 G. N. Lalith Pankaj Raj and V. Kirubakaran. This is an open access article distributed under the CreativeCommons Attribution License, which permits unrestricted use, distribution, and reproduction in any medium, provided theoriginal work is properly cited.
According to the International Energy Agency’s estimation, Indian primary energy demand is expected to increase by about1250Mtoe and 1500Mtoe by 2030. The 3M management concept now changed into a 4M management concept that includesenergy management. In the case of energy management, the electrical energy sector assumes critical importance. An energy costoccupies nearly 30-40% of the production cost in small and medium-size enterprises (SMEs). Bureau of Energy Efficiency (BEE)has initiated a separate energy efficiency intervention to the SME’s, where the energy-efficient technologies, operationalprocedures, and proper awareness programs to SMEs are stated. This paper discusses the complete electrical energy audit on asmall-scale Siddha and Ayurveda medicine industry. The traditional medicine manufacturing technologies make the processcomplex (process loads are intermittent/interlinked) during analysis. Hence, the detailed energy auditing/conservation studieson the power factor/harmonics were carried out without affecting Indian traditional medicine manufacturing technology. Thepostauditing design and installation of an intelligent controller by considering the intermittent/interlinked loads are carried out,and the effectiveness of the intelligent controller is ascertained with the energy conservation and the carbon emission reductionof SME. In addition, the climate change mitigation is ensured through the design and deployment of grid-interactive rooftopsolar photovoltaic power plant using Solar Pro v4.5 (Photovoltaic System simulation software) with the power analysis,economic analysis and life cycle carbon emission of the proposed plant. The proposed solar photovoltaic power plant ensuresenergy self-sufficiency and sustainable energy utilization by carbon emission reduction on electricity utilization of SMEs.
1. Introduction
According to the Ministry of Environment and Forests(MOEF), 70% of the total industrial pollution of the wholenation (INDIA) is due to SMEs [1]. The Bureau of EnergyEfficiency (BEE) has initiated the energy efficiency interven-tions in selected 25 SME clusters during the XI plan. Duringthe XII plan, implementations of 100 technology demonstra-tion real-time projects in five SME sectors envisaged facilitat-ing large-scale replication of the successful technology. Asper Energy Conservation Act, 2001, energy audit is defined
as verification, monitoring, and analysis of the use of energy,including submission of technical report containing recom-mendations for improving energy efficiency with cost-benefitanalysis and an action plan to reduce energy consumption.Energy auditing is a systematic approach for energy manage-ment and the first step in realizing the energy efficiency oppor-tunities [2] with economic [3] consideration. The industrialenergy audit is mainly focusing on the energy loss reduction[4] in the following aspects of the process, the operationmodification, investment in energy-efficient technologies, loadmanagement, and conversion energy losses.
HindawiInternational Journal of PhotoenergyVolume 2021, Article ID 6651717, 19 pageshttps://doi.org/10.1155/2021/6651717
The power quality is a catchword that came into the powerindustry during the 1980s. According to the Institute ofElectrical and Electronics Engineers (IEEE) standard IEEE1100, power quality is “the concept of powering and ground-ing sensitive electronic equipment in a manner suitable forthe equipment.” The device may be anything; they willrespond adversely towards the power quality issues. Accordingto EDSA, power analytics ensuring business resilience, “30 to40 % of all business downtime is closely associated with powerquality problems” [5]. Businesses have many expensive invest-ments towards the office, production equipment, and infra-structures. Power quality protection is a low-cost insurancepolicy against power wastage and accidents.
This paper deals with the objective of attaining the stateof energy self-sufficient SME, and the quest for energy self-sufficiency commences once the conventional power grid isvolatile and unreliable. The dependence on the conventionalpower grid will reduce the industry’s overall productivity dueto various constraints like peak time shutdown, off-peak timeof operation, and high tariff with lower power quality. Theparadigm shift from the conventional power grid to a non-conventional (renewable) power grid could address the issueand increase overall industrial productivity. Therefore,energy self-sufficiency is highly recommended for increasingproductivity with less carbon emission through renewableenergy resources.
This paper deals with the electrical anomalies that arepertaining to the power quality issues faced by a medium-scale Siddha and Ayurveda manufacturing enterprise in thecomplete electrical energy auditing perspective. The reflec-tion of low power quality shows an increase in the electricitybill of the enterprise. This paper also deals with the postauditproposal of grid-interactive solar photovoltaic (SPV) powerplant for attaining the state of energy self-sufficiency of theSMEs using the Solar Pro simulation software, and it is aroadmap for climate change mitigation by carbon emissionreduction.
2. Literature Review
The various forms of the power factor improvement in anSME unit with the underlying design calculations for powercapacitors and various power quality issues in a processindustry were discussed [6]. The clarity about the overallaudit process of textile industry motors in turn helps us tostudy the old induction-type motor loads in this SME [7,8]. The process mapping of an industrial production processis a critical area that has to be taken care of to start up withthe process, which helped us create a roadmap to start withthe SME audit process under investigation [9].
The various economic aspects from the point of top-levelmanagement people, to implement the various collectiverecommendations by the electrical service company (ESCO),Industrial Assessment Centres (IAS), helped in makingsuggestions and recommendations for this SME [10]. Thepresence of power quality issues in the food processing indus-try was addressed, which gave clarity in the power factorcapacitor’s design to act as a harmonic filter to counter-effectthe harmonics generated in the industry [11]. The author
focused on the practical challenges in the environmental man-agement of the Indian SMEs and its methodologies to addressthe environmental issues by considering the country's needand sector-specific investigation for identifying the relation-ship between the small SMEs [12]. The detailed energy andeconomic analysis for energy conservation measures helpSME’s energy auditing with detailed cost economics [3, 13].
The energy audit is a consistent and useful tool for over-coming technological, information bottlenecks, and investmentin energy-efficient measures [2]. The measurement [14] of dataas a primary data collection is to understand the operation andevent occurrence, calculate, explain, and validate the industry’senergy consumption. The energy auditing tool [15] of PassiveHome Planning Package (PHPP) and Transient SystemSimulation (TRNSYS) are used for energy estimation, andequivalent energy savings with greater accuracy and machinelearning [16] algorithms are used for energy self-sufficiency.The effectiveness of energy audit diminishes with the numberof employees increasing in the organizational size [17] inlighting, heating, insulation, and operations. The energy self-sufficiency [18] of SME is ensured by installing the SPV powerplant with the sensitivity analysis of factors pertaining to thetechnical and economic consideration. The country's energyself-sufficiency and energy security is achieved by the 100%renewable energy transition based on the country's energydemand [19]. The renewable energy resource without or withnegligible energy storage [20] is highly economical for attainingthe state of energy self-sufficiency.
The solar PVsyst simulation software is used for designingthe SPV plants in vessels [21]. The power and energy analysisof the designed SPV plant is carried out by the PVsyst softwarebased on the vessel’s route. The location-specific [22] solarpotential and its performance can be analyzed using thePVsyst software. The 15kWp grid-interactive SPV [23] isdesigned and simulated using the PVsyst software with theannual average performance ratio (PR) of 79.48%.
The design and performance analysis of 2 kWp SPV gives73.5% with the PVsyst [24] simulation software in India’sOdisha state. The economic analysis gives a payback periodof 7.6 years. The annual average PR of 200 kWp simulatedSPV plant is 81.7%. The real-time comparative analysis ofperformance ratio [25] ranges between 60% and 90%, andcapacity utilization factor (CUF) ranges from 12% to 18%for the rooftop 20 kWp SPV power plant in the Telanganastate of India. The design and performance analysis of100 kWp Si-poly [26] SPV plant is carried out using thePVsyst simulation software. The annual average PR of 80%with a power generation of 165.38MWh is achieved in thedesigned SPV plant.
The Solar Pro simulation software has a tremendousamount of metro [27] database for various global parts. Also,the interface for manual addition of the measured datasetmakes the software more user-friendly and has greateraccuracy. The design and performance analysis of 100kWpSPV is carried out using the Solar Pro simulation software inthe Telangana state of India. The Solar Pro simulation soft-ware is used for shadow analysis of the SPV plant. The sea-sonal tilt (or) inclination angle [27] for module mounting iscalculated based on the field conditions using Solar Pro and
2 International Journal of Photoenergy

obtained 30791.64kWh/year for building energy performanceenhancement. The Solar Pro software is used for 3.15kWpSPV plant design and its fault characteristics [28] study duringthe faulty condition. The design and development of circuit-based solar module performance on shadow and faulty condi-tion and its validity is verified using the Solar Pro simulationsoftware package. The maximum power point (MPP) errorof 10.17% [29] is recorded during the effectiveness comparisonof the circuit-based module and Solar Pro simulator.
From the review, SMEs have significant energy efficiencyenhancement scope by enhancing the system’s power quality.In addition, due to the various positive indices in the installa-tion of SPV power plant in SMEs for attaining the state ofenergy self-sufficiency and climate change mitigation, thevarious commercial and noncommercial solar design andsimulation packages are available. The Solar Pro v4.5 (Photo-voltaic System simulation software) is used for obtaining aninteractive 3D user interface for shading and designing panelmounting with more significant space and power optimiza-tion. It is also highly recommended for its unique featuresof calculation for shading and power analysis with minute-by-minute accuracy. Therefore, the proposed SPV’s designand performance prediction is carried out by Solar Pro v4.5(Photovoltaic System simulation software).
3. Methodology
The present technology practiced in Siddha and Ayurvedamedicine production process is traditional cum mechanizedwith some modern machinery. In this enterprise, the medi-cine manufacturing process is undefined (i.e., intermitted innature). The methodology of the detailed energy audit variesfrom industry to industry, and it is highly flexible accordingto the type of the industry. Here, the intermittent/interlinkedtraditional medicine manufacturing process is crucial tocarry out the energy audit. According to the BEE guidelines,a systematic methodology for detailed energy auditing isshown in Figure 1.
The phase I: preaudit kickstarted to obtain the overallresource planning and organize the instrument for settingup a reference point for energy consumption. Here, the loadcurve and cost economic curves are obtained by collectingthe macrolevel data from the responsible individuals andthe historical dataset of the industry. The preaudit of theSiddha and Ayurvedic industry needs to be done precisely.The Indian traditional medicine manufacturing technologyis unique and intermitted/noncontinuous, which cannot bealtered based on the energy perspective. The lack of continu-ous running process machine and part loading operation is acrucial issue to address in this auditing. Therefore, planningand organizing the instruments for energy analysis and orga-nization of resources are highly recommended.
The phase II: audit phase comprises developing the pro-cess and energy flow diagram with the active involvementof energy individuals of the industry. The survey and moni-toring are carried out for all the connected loads to meetthe supply and demand management of the industry. Thedetailed energy auditing phase is by continuous monitoringand logging of data using various energy auditing instru-
ments like power on clamp meter for electrical energy stud-ies, thermal imager for infrared thermography, and othervarious energy auditing instruments.
The process is followed by energy analysis using theobtained data and standard data. Based on the detailedenergy audit, energy analysis is carried out. Therefore, theENCON (Energy Conservation) opportunities proposed withthe cost economics as a report to the top-level management.
The phase III: postenergy audit phase was initiated by theimplementation of ENCON measures by the action planrecommended. The periodic reviews and follow-ups ensurethe effectiveness of the implementation. Therefore, based onthe detailed energy audit results, suggested ENCON recom-mendations were implemented accurately. The power qualityanalyzer analysis is a class “A” accuracy instrument used forcontinuous logging of electrical anomalies of the SME’s powersystem on power quality issues like sag, swell, power factor,voltage-total harmonic distortion factor (V-THDF), andcurrent-total harmonic distortion factor (I-THDF). The designand implementation of Intelligent Power Factor Controller(IPFC) and its effectiveness were studied in the post energyaudit phase.
Also, a grid-interactive SPV power plant is designed andproposed with the power, economic, and carbon emission anal-ysis using Solar Pro simulation software package for attainingthe state of energy self-sufficiency SME. The feasibility studyfor the solar simulation was carried out by considering thevarious primary dataset of latitude, longitude, energy utilizationpattern, connected load, energy demand, energy consumptiondetails, building dimensions, type of building, and shade-freearea (effective area) for solar module installation. Therefore,the proposed SPV plant is highly significant in energy self-suf-ficiency, and the renewable energy resource led to climatechange mitigation.
The power quality analyzer (clamp-on-power meter)shown in Figure 2 is used at the vicinity of the point ofcommon coupling (PCC) for themain power distribution panelin order to calculate the energy utilization pattern of the entireenterprise. Figure 3 shows the energy auditing carried in theenterprise. The power meter clamp is calibrated in three-phase-four-wire configuration for detailed power quality andenergy analysis of the enterprise. After the energy auditinganalysis, the power quality issues have arrived. The graph gavethe plotted results of the analysis and interpreted the same inthe analysis. The power quality graphs show the total voltage,total current, power (real (kW), reactive (KVAr), and apparent(kVA)), power factor, voltage-total harmonic distortion factor(V-THDF), current-total harmonic distortion factor (I-THDF),and frequency.
4. Results and Discussion of Preaudit Phase
Energy auditing started with the collection of load curvesfrom enterprise historical data. The load curve gives thenecessary prerequests to carry out the energy auditing inthe enterprise. The primary vertical axis of Figure 4 illustratesthe enterprise’s annual load curve, and the secondary axisgives the month-wise energy cost of the enterprise in theoverall annual load curve. This load and cost curve reveals
3International Journal of Photoenergy

the preaudit phase of an energy audit by revealing a powerconsumption pattern. The overall electrical energy consump-tion concerning time gives the industry’s loading pattern fora particular time.
5. Results and Discussion of Audit Phase
Figure 5 shows the gives of time versus voltage performanceof the enterprise. The analysis starts from the beginning ofthe load to the load’s termination to study the starting spikesor surges in the power system by connecting the power onclamp meters on the PCC. From the voltage profile, it isinferred that the presence of voltage unbalances in thesystem. The 5% voltage unbalance will increase the currentconsumption by 1 to 6 times of rated current consumptionand reduce the efficiency of the electric motor load in thepower system.
Figure 6 shows the graphical representation of the timeversus the current profile of the enterprise. The phase-wisecurrent consumption is R-phase (A), Y-phase (A), B-phase(A), and neutral (N), respectively. Here, nearly 30A ofneutral current is present in the unit, and the total currentis about 35A during the recording period. The presence ofunbalance in the current consumption profile clearly definesthe poor load sharing between each phase. The unbalancedloads and the presence of current harmonics lead to a highneutral current in the system.
Phase-I preaudit
Step-1: Plan and Organize the Audit Step-2: Walk-through Audit and Meetingswith heads and energy managers
Step-10 : Implementation and Follow-ups
Phase-III postaudit Phase
Step-9 : Reporting and Presentation to top-level management
Step-8 : Cost-benifit analysis
Step-7 : Identification and Development of ENCON (Energy Conservation) Opportunities
Step-6 : Analysis of Energy Use
Step-5 : Conduct Detailed experimentation on Industry
Step-4 : Conduct survey and monitoring
Step-3 : Primary Data Gathering, Process and Energy flow diagram
Phase-II Audit Phase
Figure 1: Systematic detailed energy auditing methodology.
Figure 2: Power on clamp meter for energy auditing.
4 International Journal of Photoenergy

Figure 7 shows the time versus real (W), reactive (VAr),and apparent power (VA). The presence of apparent poweris more in the unit. The significance of reactive power injectionin the SME is a minimum value, which concludes the conse-quence of the enormous consumption of the real power sincethere is a prevalence of lagging power factor in the enterprise.The need for compensation is essential to equate the powerconsumption without a considerable amount of wastage.
Figure 8 shows the graphical representation of timeversus % voltage-total harmonic distortion factor (V-THDF)from the graphical representation; the Y-phase voltageTHDF is higher than other phases. At the PCC, the maxi-mum allowable V-THDF is of 5% as per the IEEE 519-2014and IEC 61000 standards. This voltage harmonic distortionin the enterprise is under the Central Electricity Authority(CEA) regulations. The presence of poor V-THDF directlyreflects the temperature rise of the electric motor load inthe enterprise. As the temperature increases, the efficiencyof the motor drastically decreases.
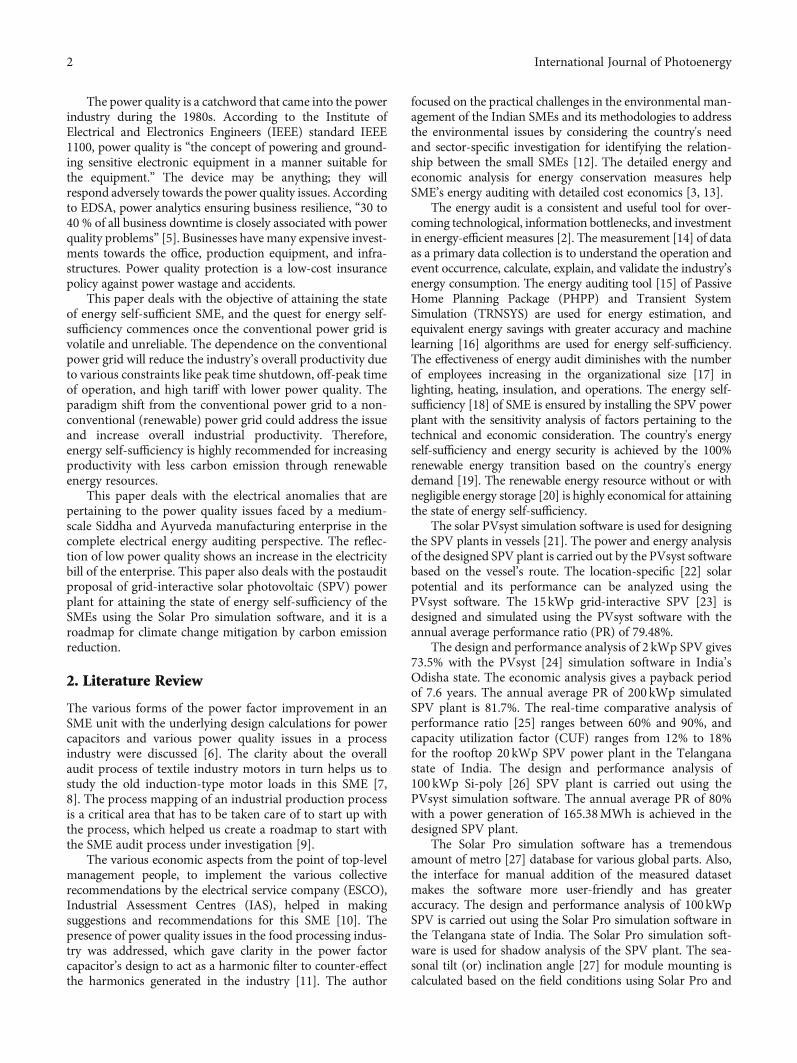
Figure 9 shows the time versus current-total harmonicdistortion factor (I-THDF). At the PCC, the maximumallowable I-THDF if of 8% as per the IEEE 519-2014 andIEC 61000 standards. The presence of harmonics in the Y-phase has higher value compared that with the other phaseharmonics. The overall harmonic level of the enterprise isexceeding the central electricity authority rules andregulations.
Figure 10 gives a graphical representation of the timeversus the power factor of the enterprise. The range of powerfactor varies from 0.65 to 0.8 without any compensation tech-nologies. The inefficient, ancient, and rewinding inductionelectric motor loads are the primary sources for producinglow power factor. Figure 11 gives the graphical representationof the time versus frequency of the enterprise. There is nosignificant variation of frequency. Therefore, skin effect isminimum in the SME.
The enterprise has low power quality indices like laggingpower factor, voltage, and current harmonic distortion, whichunbalance from the detailed energy audit analysis. Therefore,the harmonic mitigating filter circuit is highly recommended,and proper load balancing between the phases is essential forbetter power quality. Also, the power factor improvementcapacitors will address the above-mentioned power qualityissues by the compensation technique.
From the detailed energy auditing, it is perceived thatthere is an unbalance exists in phases [30]. The loads arenot evenly distributed in the system, and several loads arecritical, which generates positive, negative, and zero sequenceerrors. Frequency variations are high due to nonlinear load-ing examples like Hammer Machine, Ball Mill. The powerfactor for the motors is about 0.65. Total harmonic distortionfactor (THDF) is higher in the Y-phase, which recorded as14%, which is above IEEE standard limits of V-THDF of5% and I-THDF [31] of 8% at point of common coupling(PCC) as per the norms of Central Electricity Authority(CEA).
There are steps to study the sequence of operation of aparticular medicine manufacturing process to get rid of theharmonic prone environment. The electrical operation isscheduled accordingly to the phase balancing with carefulconsideration of critical and nonlinear loads without affect-ing their traditional operations during the productionprocess. This will reduce the neutral current and enhancethe overall power quality of the enterprise.
5.1. Condenser Calculation of Intelligent Power FactorController (IPFC). The required leading KVAr compensationby P.F. correction equipment [32]
KVAr = kW tan∅1 − tan∅2ð Þ: ð1Þ
The sum of the machine’s horse power rating is the activepower for the power factor improvement calculation from0.65 to 0.99.
Total active power = sumof all connectedHPð Þ ∗ 746, ð2Þ
Total active power = 94 ∗ 0:746ð Þ = 70:124 kW, ð3Þ
KVAr = 70:124 tan 49:46 − tan 8:11ð Þ: ð4Þ
The leading reactive power (KVAr) was supplied bypower factor correction equipment = 72,052:41KVAr.
The KVAr compensator rating of 72,052.41 is sufficientto enhance the power factor.
Figure 3: Energy auditing at point of common coupling.
5International Journal of Photoenergy

5.2. Intelligent Controller. Figure 12 shows the IntelligentPower Factor Controller (IPFC), a smart, simple, accurate[33], and robust reactive power compensator. It is versatilein power factor mitigation [34] by its smart features of loadsensing and storage of historical datasets. The IPFC ispowered by various combinations of power capacitors forreactive power compensation [32]. The AT89S52 [35] islow power consuming, high-performance 8-bit Microcon-troller with 8 k bit in-system programmable flash memory.
It provides the following standard features: 32 input-outputlines, 256 bytes of RAM, watchdog times, two data pointers,fully duplex serial port, clock circuit, and memory storagefacility. The voltage and current transformers are used tosense and measure the system’s input voltage and current.The zero-crossing filter is used to obtain the instantaneousvoltage and current point at which there is no voltage andcurrent, respectively. The IPFC is equipped with the datastorage facility for logging of present load and historical
0
5000
10000
15000
20000
25000
30000
0
500
1000
1500
2000
2500
3000
3500
4000
16/12/2018 04/02/2019 26/03/2019 15/05/2019 04/07/2019 23/08/2019 12/10/2019 01/12/2019 20/01/2020
Cost, rupeesU
nits
cons
umed
, kW
h
Month
Units consumedCost
Figure 4: Load and cost economics curve of SME (phase I—preaudit).
220
225
230
235
240
245
250
255
9:07:12 10:19:12 11:31:12 12:43:12 13:55:12 15:07:12 16:19:12 17:31:12
Vol
tage
,V
Time, minR-Phase (V)Y-Phase (V)B-Phase (V)
Figure 5: Time vs. voltage (phase II—audit phase).
6 International Journal of Photoenergy

datasets for better reliable and faster compensation. The relaycircuit is to electrically make (turn on) and break (turn off)the shunt capacitors [36] from the system. Based on thecontroller’s load-sensing signal, the switching on and off ofshunt capacitors is carried out. The relay drive is poweredby the embedded system [37] to reduce the overall systemcost to have robust, accurate control, and cost-effective.
6. Results and Discussion of Postaudit Phase
The postaudit phase is carried out to calculate the effective-ness of the installed IPFC unit. Figure 13 gives the graphicalrepresentation of the time versus voltage profile of SME afterimprovement using IPFC installation. The IPFC unit’s instal-lation achieves a 5% increase in the voltage profile. Figure 14
0
5
10
15
20
25
30
35
40
45
50
8:52:48 10:04:48 11:16:48 12:28:48 13:40:48 14:52:48 16:04:48 17:16:48
Curr
ent,
A
Time, minR-Phase (A)Y-Phase (A)B-Phase (A)Neutral (A)
Figure 6: Time vs. current (phase II—audit phase).
0
5000
10000
15000
20000
25000
30000
9:07:12 10:19:12 11:31:12 12:43:12 13:55:12 15:07:12 16:19:12 17:31:12
Pow
er, W
, VA
r, V
A
Time, minP-AVE (W)Q-AVE (Var)S-AVE (VA)Total power (W)
Figure 7: Time vs. power (phase II—audit phase).
7International Journal of Photoenergy

illustrates the postaudit time versus the current profile of theSME. The installation of the IPFC unit achieves a 33.33%reduction in the current consumption profile.
Figure 15 illustrates the graphical representation of timeversus power includes active (or) real, reactive, apparent,and total SME power profile. The 28.88% reduction of total
0
0.5
1
1.5
2
2.5
9:07:12 10:19:12 11:31:12 12:43:12 13:55:12 15:07:12 16:19:12 17:31:12
V-T
HD
F, %
Time, minR-Phase (% V-THDF)
Y-Phase (% V-THDF)
B-Phase (% V-THDF)
Figure 8: Time vs. V-THDF (phase II—audit phase).
0
5
10
15
20
25
30
35
40
9:07:12 10:19:12 11:31:12 12:43:12 13:55:12 15:07:12 16:19:12 17:31:12
I-TH
DF,
%
Time, minR-Phase (% I-THDF)Y-Phase (% I-THDF)B-Phase (% I-THDF)Neutral (% I-THDF)
Figure 9: Time vs. I-THDF (phase II—audit phase).
8 International Journal of Photoenergy

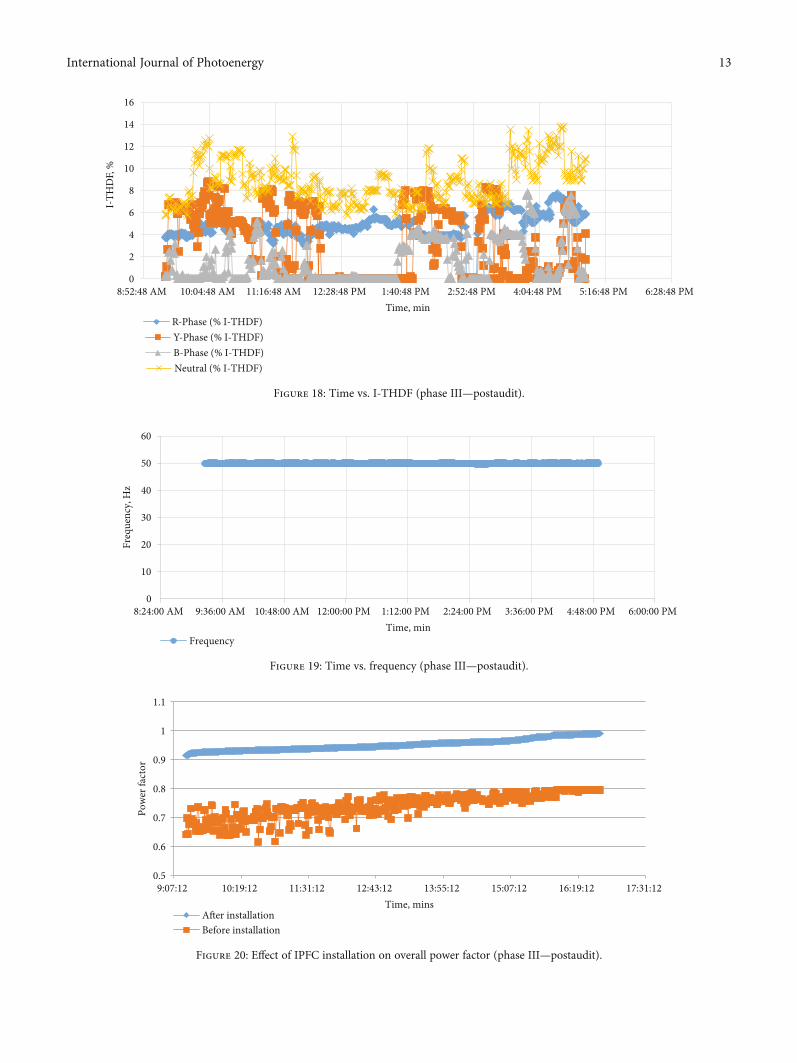
power is achieved by installing the IPFC unit in the SME.Figure 16 gives the graphical representation of time versusthe overall power factor of the SME at the point of commoncoupling after the installation of the IPFC unit. The 65%increase in the overall power factor is achieved after installingthe IPFC unit in the SME. Figure 17 gives the time versustotal voltage harmonic distortion factor after the installationof the IPFC unit. The V-THDF of 1.6% is within the IEEE519 standards and limits under central electricity authorityguidelines. Figure 18 gives the time versus total currentharmonic distortion factor after the installation of the IPFCunit. The I-THDF of 4.8% is within the IEEE 519 standardsand limits under central electricity authority guidelines. Also,the 27.27% reduction is achieved in the neutral I-THDF afterinstalling the IPFC unit. Figure 19 gives the graphical repre-sentation of the time versus frequency profile that ensures theless amount of skin effect after installing the IPFC unit.
Figure 20 gives the graphical representation of the exactcomparison of power factor before and after installing powerfactor improvement capacitors (Intelligent Power FactorController). The average increase of lagging power factor from0.6 to 0.99, with the IPFC controller’s installation, isascertained and shown in Figure 20. The 65% increase in thelagging power factor is achieved after the installation of theIPFC.
6.1. Climate Change Mitigations through Power FactorImprovement. According to the Energy Information Adminis-tration (EIA), the USA, the electricity utilization holds 37% ofcarbon emission in the overall greenhouse gas emission. Asper the CEA of India [38], 1 kWh of electricity emits 2kg ofCO2. From the detailed energy audit, we came to know theamount of CO2 emitted from the enterprise operation.
0.5
0.55
0.6
0.65
0.7
0.75
0.8
0.85
9:07:12 10:19:12 11:31:12 12:43:12 13:55:12 15:07:12 16:19:12 17:31:12
Pow
er fa
ctor
Time, minPower factor (AVE)
Figure 10: Time vs. power factor (phase II—audit phase).
49.75
49.8
49.85
49.9
49.95
50
50.05
50.1
50.15
9:07:12 10:19:12 11:31:12 12:43:12 13:55:12 15:07:12 16:19:12 17:31:12
Freq
uenc
y, H
z
Time ,minFrequency
Figure 11: Time vs. frequency (phase II—audit phase).
9International Journal of Photoenergy

6.1.1. Before Power Factor Improvement.
CO2 emission = power in kWh/dayð Þ ∗ 2 kg of CO2: ð5Þ
The per-day power consumption is of 208 kWh beforeimprovement; therefore, the following carbon dioxide emis-sions are calculated as follows:
CO2 emission = 416 kg of CO2 per day ð6Þ
6.1.2. CO2 Reduction after Power Factor Improvement.
CO2 emission = power in kWh/dayð Þ ∗ 2 kg of CO2 ð7Þ
The per-day power consumption is of 205.92 kWh beforeimprovement; therefore, the following carbon dioxide emis-sions are calculated as follows:
CO2 emission = 411:5 kg of CO2 per day ð8Þ
Current transformer
Current zero-crossing
filter
Capacitor bank
Display unitStorage
Microcontroller
Voltage input
Relaydriver
Current input
Voltage transformer
Voltage zero-crossing
filter
Power supplyunit
Load
Figure 12: Block diagram of the designed intelligent controller.
200
210
220
230
240
250
260
8:52:48 AM 10:04:48 AM 11:16:48 AM 12:28:48 PM 1:40:48 PM 2:52:48 PM 4:04:48 PM 5:16:48 PM 6:28:48 PM
Vol
tage
, V
Time, minR-Phase (V)Y-Phase (V)B-Phase (V)
Figure 13: Time vs. voltage (phase III—postaudit).
10 International Journal of Photoenergy

Therefore, per day saving is 4.5 kg of CO2.
Per year saving of CO2 = 1296 kg of CO2: ð9Þ
7. Design of Proposed Grid-Interactive SolarPhotovoltaic System
Based on the detailed energy audit of the SME, the grid-interactive photovoltaic system is proposed for climate changemitigation and designed by the Solar Pro v4.5 (PhotovoltaicSystem simulation software). As per norms of Central Electric-ity Authority (CEA) and Tamil Nadu Electricity RegulatoryCommission (TNERC), 100% of the sanctioned demand [39]
can be taken as the capacity of a grid-connected solar photovol-taic rooftop system. Also, the overall energy self-sufficiency isensured via SPV installation sustainably.
Figure 21 gives the overall single line diagram of the pro-posed 100 kWp solar photovoltaic power plant created usingthe PVsyst software. The general construction of the plant isdivided into three prominent cases as PV array side (includesPV array and diodes), system side (includes inverter and itsenergy out), and load side (includes load, energy used, energyover, and energy back-up) for ease of operation and mainte-nance purposes. A 360Wp polycrystalline module powersthe 100 kWp SPV plant with a compactable string inverterfor better grid interaction.
0
5
10
15
20
25
30
35
8:52:48 AM 10:04:48 AM 11:16:48 AM 12:28:48 PM 1:40:48 PM 2:52:48 PM 4:04:48 PM 5:16:48 PM 6:28:48 PM
Curr
ent,
A
Time, minR-Phase (A)Y-Phase (A)B-Phase (A)Neutral (A)
Figure 14: Time vs. current (phase III—postaudit).
0
2000
4000
6000
8000
10000
12000
14000
16000
18000
20000
8:52:48 AM 10:04:48 AM 11:16:48 AM 12:28:48 PM 1:40:48 PM 2:52:48 PM 4:04:48 PM 5:16:48 PM 6:28:48 PM
Pow
er, W
,VA
r,VA
Time, minP-AVE (W)Q-AVE (VAr)S_AVE (VA)Total power (W)
Figure 15: Time vs. power (phase III—postaudit).
11International Journal of Photoenergy

Figure 22 gives the 3D CAD simulation of the proposed100 kWp SPV plant. The interactive 3D CAD of Solar Prosoftware aids in developing the virtual design of 100 kWpSPV plant in the SME enterprise, which creates better perfor-mance optimization like shading and space distribution ofSPV module installation in the premises of the enterprise.
The space optimization of the SPV plant is carried out by3D CAD simulation of the proposed plant. The module-leveldimension specifications are given as input, and optimalstring and array combinations arrive by considering theinverter specification’s capacity. The real-time two primarycriteria are weight distribution for load-bearing capacity ofthe building and space availability for demand and installedcapacity match. The ample space is available in the SME forthe installation of the SPV plant. Therefore, space optimiza-tion is carried out by choosing the weight distribution for
load-bearing capacity in the building. According to theguidelines, space and weight distribution are precisely takenas 30 kg/m2 to 60 kg/m2 of weight distribution throughoutthe SPV plant’s installation, including module and modulemounting structure.
Figure 23 illustrates the solar irradiation details like total,horizontal, and direct irradiation of the enterprise generatedby Solar Pro design software. The metrological data of SolarPro simulation software is developed with the accuratemetrological dataset from the NADO (New Energy andIndustrial Technology Development Organization), a Japa-nese weather association. The collection of 1600 locationdataset is equipped with the Solar Pro software. Here, themonth of March is significantly having the maximumrecorded irradiation of 220 kWh/m2 with the maximum gen-eration potential.
0.5
0.6
0.7
0.8
0.9
1
1.1
8:52:48 AM 10:04:48 AM 11:16:48 AM 12:28:48 PM 1:40:48 PM 2:52:48 PM 4:04:48 PM 5:16:48 PM 6:28:48 PM
Pow
er fa
ctor
Time, minPower factor (AVE)
Figure 16: Time vs. power factor (phase III—postaudit).
0
0.5
1
1.5
2
2.5
8:52:48 AM 10:04:48 AM 11:16:48 AM 12:28:48 PM 1:40:48 PM 2:52:48 PM 4:04:48 PM 5:16:48 PM 6:28:48 PM
V-T
HD
F, %
Time, minR-Phase (%V-THDF)Y-Phase (%V-THDF)B-Phase (%V-THDF)
Figure 17: Time vs. V-THDF (phase III—postaudit).
12 International Journal of Photoenergy
0
2
4
6
8
10
12
14
16
8:52:48 AM 10:04:48 AM 11:16:48 AM 12:28:48 PM 1:40:48 PM 2:52:48 PM 4:04:48 PM 5:16:48 PM 6:28:48 PM
I-TH
DF,
%
Time, minR-Phase (% I-THDF)Y-Phase (% I-THDF)B-Phase (% I-THDF)Neutral (% I-THDF)
Figure 18: Time vs. I-THDF (phase III—postaudit).
0
10
20
30
40
50
60
8:24:00 AM 9:36:00 AM 10:48:00 AM 12:00:00 PM 1:12:00 PM 2:24:00 PM 3:36:00 PM 4:48:00 PM 6:00:00 PM
Freq
uenc
y, H
z
Time, minFrequency
Figure 19: Time vs. frequency (phase III—postaudit).
0.5
0.6
0.7
0.8
0.9
1
1.1
9:07:12 10:19:12 11:31:12 12:43:12 13:55:12 15:07:12 16:19:12 17:31:12
Pow
er fa
ctor
Time, minsAfter installationBefore installation
Figure 20: Effect of IPFC installation on overall power factor (phase III—postaudit).
13International Journal of Photoenergy

PVarray
U array
E array E out inv.Inverter
PV array System User (load)
E used
E overGrid
PE back-up
N
User
E needed
Figure 21: Layout of proposed solar photovoltaic plant (Source: PVsyst simulation software).
Figure 22: Solar Pro 3D CAD modelling of proposed 100 kWp SPV plant.
Jan Feb Mar Apr May Jun Jul Aug Sep Oct Nov Dec
250
Total irradiationHorizonta irradiationDirect irradiation
200
150
100
50
0
Month
Irra
diat
ion
(kW
h/m
2 )
Figure 23: Month-wise solar irradiation of the proposed SPV plant.
14 International Journal of Photoenergy

8. Results and Discussion of the Proposed SolarPhotovoltaic Power Plant
8.1. Power Analysis of the Proposed SPV Plant. Figure 24 illus-trates the voltage versus current characteristics of the overallSPV power plant in the primary vertical axis. The manufac-turer datasheet provides the following parameters of themodule: rated power of 360Wp solar PV module is poweredby the open-circuit voltage of 187.50 (VOC) and short-circuitcurrent of (ISC) 2.7A. The voltage versus power characteris-tics are shown in the secondary vertical axis of Figure 24.The maximum power point (MPP) is the maximum pointat which maximum (or) optimum power generation isascertained. The maximum voltage and maximum currentof 146.2V and 2.46A are achieved during the Solar Prosimulation software calculation mode.
The effect of the average increase in the ambient temper-ature is directly proportional to the temperature rise of theSPV module. As per the Standard Test Conditions (STC),the SPV modules perform more effectively at 25 degreesCelsius. The negative temperature coefficient of voltage andpower is about -0.35%/°C and -0.45%/°C, respectively [40].Therefore, the temperature rise directly affects the power out-put and efficiency [40] of the SPV plants.
Figure 25 illustrates the month-wise solar PV and ACenergy generation (power analysis) of the proposed solarphotovoltaic power plant. The maximum peak generationof 12,000 kWh is achieved during the month of March withthe maximum total irradiation. The power analysis is carriedout based on the solar generation and the historical powerconsumption pattern of the SME under investigation. There-fore, the average generation of 8000 kWh is maintainedthroughout the year as a positive indicator to move forwardinto the proposed SPV plant.
8.2. Economic Analysis of the Proposed SPV Plant. Theeconomic analysis of SPV is carried out using the Solar Pro
simulation software with the month-wise historical data ofSME power consumption. Figure 26 gives themonth-wise sell-ing, buying, and bill reduction price of the proposed SPVplant. As per the guidelines and regulations of state and centralnodal agencies, the selling price of the SPV power plant isfixed. The higher average annual bill reduction is achievedbased on the economic and power analysis due to the maxi-mum SPV power generation, excess power evacuation (powerexport), and optimized energy utilization of SMEs.
Figure 27 gives the month-wise load energy (i.e., loadconsumption and AC energy generated by the proposed SPVpower plant of SME in the primary vertical axis). The second-ary vertical axis gives month-wise cost economics of energyconsumption and its bill reduction due to SPV power penetra-tion and power export to the grid. The period from March toMay is having the highest SPV generation and bill reduction.The average energy bill reduction (savings) is significantlymaintained throughout the year. Figure 28 gives the economicpayback period of 7 years on the proposed SPV plant, which isa positive indicator for the proposed SPV power plant.
8.3. Life Cycle Carbon Emission of the Proposed SPV Plant.The life cycle carbon [41] emission of the proposed solarpower plant is calculated in detail with the SPV modules, sup-ports (includes the balance of system and other auxiliaries),and inverters. The amount of carbon emission generated fromthe proposed SPV plant’s installation and operation is about188.61 tCO2 for the 30 years lifetime of the SPV plant. There-fore, the replacement carbon emission is based on SPV powergeneration as per the Central Electricity Authority (CEA)guidelines and regulations.
The carbon emission of grid-interactive SPV is taken, andthe replacement emission is calculated as 4694.8 tCO2 with theannual SPV power production of 167.17MWh. The followingInternational Energy Agency (IEA) considerations like theSPV power plant lifespan of 30 years, the 1% annual degrada-tion, and the grid lifecycle emission of 936 gCO₂/kWh are
300
250
200
150
100
50
00 100 200 300
Voltage (V)
Pow
er (W
)
Curr
ent (
A)
400 500 600
120,000
100,00
80,000
60,000
40,000
20,000
0
I-V graphP-V graph
Figure 24: Voltage vs. current and power characteristic curve of the proposed SPV plant.
15International Journal of Photoenergy

considered for the calculation of CO2 emission balance analy-sis. Therefore, the resultant CO₂ emission balance of 4506.2tCO₂ is achieved from the proposed SPV power plant.
9. Conclusion
Complete electrical energy auditing was carried out. Based onthe detailed analysis, the following suggestions and recom-mendations are prepared. The design and installation of73KVAr compensator capacitors will enhance the enter-
prise’s power factor to improve the SME’s overall energyefficiency. The effectiveness of IPFC is ensured by 33.33%current reduction, 28.88% total power consumption reduc-tion, 27.22% neutral I-THDF reduction, and a 65% increasein the overall power factor. Therefore, the effectiveness ofinstalled Intelligent Power Factor Correction (IPFC) panelis highly significant, and it could enable the cost-effective,accurate, and high-performance reactive power compensa-tion by installing the IPFC unit in the point of commoncoupling (PCC) instead of going with the load side reactive
14,000
12,000
10,000
8,000
6,000
4,000
2,000
0
250
200
150
100
50
0Jan Feb Mar Apr May Jun Jul Aug Sep Oct Nov Dec
Month
Irra
diat
ion
(kW
h/m
2 )
Elec
tric
ity (k
Wh)
PV energyAC energyTotal irradiation
Figure 25: Month vs. power analysis of the proposed SPV plant.
Jan
45,000
40,000
30,000
20,000
Elec
tric
bill
(Rup
ees)
10,000
0Feb Mar Apr May Jun Jul Aug Sep Oct Nov Dec
MonthSelling priceBuying priceBill reduction
Figure 26: Month-wise economic analysis of the proposed SPV plant.
16 International Journal of Photoenergy

power compensation to get the desirable compensation.There is a significant reduction in the enterprise’s powerconsumption by installing the IPFC compensator, paving aroadmap to achieve climate change mitigation by reducingcarbon dioxide emission by reducing 1296 kg of CO2 fromthe electrical power consumption.
From the design of the SPV power plant, the availabilityof SPV potential, energy, and cost economic performance ishighly feasible for SMEs to deploy the SPV power plant.The SPV energy generation and utilization lead to energy billreduction of SME and additional revenue by exporting theexcess power to the grid. The replacement carbon emission
of 4694.8 tCO₂ is possible by the installation of the proposedSPV plant. Therefore, the proposed solar photovoltaic powerplant is highly feasible to deploy in the SME for its energy andeconomic savings with the more significant environmentalsustainability for climate change mitigation. Therefore, theenergy self-sufficient of SME is highly feasible by theproposed SPV plant in a sustainable manner.
Data Availability
The data used to support the findings of this study areavailable from the corresponding author upon request.
Jan
12,000
10,000
45,000
40,000
30,000
20,000
10,000
0
Elec
tric
bill
(Rup
ees)
Elec
tric
ity (k
Wh)
8,000
6,000
4,000
2,000
0Feb Mar Apr May Jun Jul Aug Sep Oct Nov Dec
MonthAC energyLoad energyBill reduction
Figure 27: Month-wise economic saving of the proposed SPV plant.
8,000
Pay back period: 7 years 3 months
6,000
CostCumulative savings
4,000
2,000
00 5 10
Years
Cos
t (1,
000
Rupe
es)
Figure 28: Economic payback analysis of the proposed SPV plant.
17International Journal of Photoenergy

Conflicts of Interest
The authors declare that there are no conflicts of interestregarding the publication of this paper.
Acknowledgments
The authors gratefully acknowledge the Department ofScience and Technology (DST), India, for financial supportunder the DST-INSPIRE Fellowship (ID No: IF180435) andthe secretary of Lakshmi Seva Sangam, Gandhigram, forproviding permission to carry out the analysis.
References
[1] R. Saidur, “A review on electrical motors energy use andenergy savings,” Renewable and Sustainable Energy Reviews,vol. 14, no. 3, pp. 877–898, 2010.
[2] F. Kalantzis and D. Revoltella, “Do energy audits help SMEs torealize energy-efficiency opportunities?,” Energy Economics,vol. 83, pp. 229–239, 2019.
[3] A. Kubule, K. Ločmelis, and D. Blumberga, “Analysis of theresults of national energy audit program in Latvia,” Energy,vol. 202, p. 117679, 2020.
[4] P. Thollander, M. Karlsson, P. Rohdin, J. Wollin, andJ. Rosenqvist, “Energy auditing1,” Introduction to IndustrialEnergy Efficiency, vol. 50, pp. 61–87, 2020.
[5] J. R. Neumann, Ensuring Business Resilience. EDSAMicro Cor-poration n.d.:1–5, 2020, http://www.poweranalytics.com/pa_articles/pdf/EnsuringBusinessResilience.pdf.
[6] C. Sreenath, S. Prabhakaran, V. Rajakumaran, C. Shankar, S. S.S. Velan, and V. Kirubakaran, “Energy auditing of paymenttiles making small scale industry: suggestions and recommen-dations for energy conservation,” in 2015 International Con-ference on Circuits, Power and Computing TechnologiesICCPCT-2015, pp. 1–4, March 2015.
[7] S. K. Rajput and O. Singh, “Energy audit in textile industry: astudy with ring frame motor,” in 2016 International Confer-ence on Control, Computing, Communication and Materials(ICCCCM), pp. 1–4, October 2016.
[8] A. L. Divya, C. A. Vigneshwari, M. Damini, M. A. Sabeena,V. Kolambikai, and V. Kirubakaran, “Energy auditing for afarm house10.1109/ICCPCT.2015.7159446,” in 2015 Interna-tional Conference on Circuits, Power and Computing Technol-ogies ICCPCT-2015, pp. 1–6, March 2015.
[9] I. Palcic, M. Pons, A. Bikfalvi, J. Llach, and B. Buchmeister,“Analysing energy and material saving technologies’ adoptionand adopters/Analiza uporabe in uporabnikov okolju prijaz-nih tehnologij v proizvodnih podjetjih,” Strojniski Vestnik -Journal of Mechanical Engineering, vol. 59, 2013.
[10] V. Blass, C. J. Corbett, M. A. Delmas, and S. Muthulingam,“Top management and the adoption of energy efficiency prac-tices: evidence from small and medium-sized manufacturingfirms in the US,” Energy, vol. 65, pp. 560–571, 2014.
[11] R. Shinde, A. Pathak, and B. Chaughule, “Harmonic analysisand power factor correction for food processing industry,”International Journal of Computational Engineering Research,vol. 3, no. 6, pp. 53–58, 2013.
[12] M. Singh, “Environment management systems in Indian smalland medium-sized enterprises,” Academy of Taiwan BusinessManagement Review, vol. 8, no. 2, pp. 45–55, 2010.
[13] S. S. S. Velan and V. Kirubakaran, “Implementation of energyconservation and management activities and its economics inGRI boy’s hostel - a case study,” in 2016 Biennial InternationalConference on Power and Energy Systems: Towards SustainableEnergy (PESTSE), pp. 1–10, January 2016.
[14] P. Thollander, M. Karlsson, P. Rohdin, J. Wollin, andJ. Rosenqvist, Energy auditing and measurements in practice.Introduction to Industrial Energy Efficiency, Elsevier, 2020.
[15] G. Dermentzis, F. Ochs, M. Gustafsson et al., “A comprehen-sive evaluation of a monthly-based energy auditing toolthrough dynamic simulations, and monitoring in a renovationcase study,” Energy and Buildings, vol. 183, pp. 713–726, 2019.
[16] Z. De Grève, J. Bottieau, D. Vangulick et al., “Machine learningtechniques for improving self-consumption in renewableenergy communities,” Energies, vol. 13, no. 18, p. 4892, 2020.
[17] J. Schleich and T. Fleiter, “Effectiveness of energy audits insmall business organizations,” Resource and Energy Economics,vol. 56, pp. 59–70, 2019.
[18] R. Scozzari and M. Santarelli, “Techno-economic analysis of asmall size short range EES ( electric energy storage ) system fora PV (photovoltaic) plant serving a SME (small and mediumenterprise) in a given regulatory context,” Energy, vol. 71,pp. 180–193, 2014.
[19] A. Khoodaruth, V. Oree, M. K. Elahee, and W. W. Clark,“Exploring options for a 100% renewable energy system inMauritius by 2050,” Utilities Policy, vol. 44, pp. 38–49, 2017.
[20] A. Pechmann and M. Zarte, “Economic analysis of decentra-lized, electrical- and thermal renewable energy supply forsmall and medium-sized enterprises,” Procedia CIRP, vol. 61,pp. 422–427, 2017.
[21] Ç. Karatuğ and Y. Durmuşoğlu, “Design of a solar photovol-taic system for a Ro-Ro ship and estimation of performanceanalysis: a case study,” Solar Energy, vol. 207, pp. 1259–1268,2020.
[22] M. Satish, S. Santhosh, and A. Yadav, “Simulation of a Dubaibased 200 KW power plant using PVsyst Software,” in 20207th International Conference on Signal Processing and Inte-grated Networks (SPIN), pp. 824–847, Febuary 2020.
[23] A. Chauhan, M. Sharma, and S. Baghel, “Designing and per-formance analysis of 15KWP grid connection photovoltaicsystem using Pvsyst software,” in 2020 Second InternationalConference on Inventive Research in Computing Applications(ICIRCA), pp. 1003–1008, July 2020.
[24] K. C. Rout and P. Kulkarni, “Design and performance evalua-tion of proposed 2 kW solar PV rooftop on grid system in Odi-sha using PVsyst,” in 2020 IEEE International Students’Conference on Electrical,Electronics and Computer Science(SCEECS), pp. 1–6, Febuary 2020.
[25] S. S. Chopade, L. P. Raj, and G. N. Prabakaran, “Bench mark-ing of grid tied solar roof top photovoltaic system: a case com-parison,” International Journal of Engineering & Technology,vol. 7, 2018.
[26] N. M. Kumar, M. R. Kumar, P. R. Rejoice, and M. Mathew,“Performance analysis of 100 kWp grid connected Si-polyphotovoltaic system using PVsyst simulation tool,” EnergyProcedia, vol. 117, pp. 180–189, 2017.
[27] L. G. Popa and M. Brumaru, “Optimizing buildings energyperformance through photovoltaic panel integration within amobile shading system,” Procedia Manufacturing, vol. 22,pp. 765–772, 2018.
18 International Journal of Photoenergy

[28] K. H. Chao and C. T. Chen, “A remote supervision fault diag-nosis meter for photovoltaic power generation systems,”Mea-surement: Journal of the International MeasurementConfederation, vol. 104, pp. 93–104, 2017.
[29] K.-H. Chao, Y.-W. Chao, and J.-P. Chen, “A circuit-basedphotovoltaic module simulator with shadow and fault set-tings,” International Journal of Electronics, vol. 103, pp. 424–438, 2015.
[30] K. Kamaleswaran, M. Venkateshwaran, P. Harinath, M. A.Mydeen, and V. Kirubakaran, “Energy conservation potentialin rural industry: a case study on coir industry,” in IEEE Inter-national Conference on Circuit, Power and Computing Tech-nologies, ICCPCT 2015, March 2015.
[31] T. Mariprasath and V. Kirubakaran, “Real time harmonicanalysis on rural industries,” Indian Journal of Science andTechnology, vol. 9, no. 2, 2016.
[32] N. R. Kulkami, H. Vijay Murthy, and A. P. Raju, “PLC basedintelligent power factor correctors for industrial powersystems-a case study,” in Proceedings of the 2015 IEEE Interna-tional Conference on Power and Advanced Control Engineer-ing, ICPACE 2015, pp. 75–79, August 2015.
[33] R. Bayindir, S. Sagiroglu, and I. Colak, “An intelligent powerfactor corrector for power system using artificial neural net-works,” Electric Power Systems Research, vol. 79, no. 1,pp. 152–160, 2009.
[34] K. Kamaleswaran, S. Prabhakaran, P. Harinath, M. Damini,and V. Kirubakaran, “Capacity building on energy conserva-tion in rural industries: a case study,” in 2016 3rd InternationalConference on Electrical Energy Systems (ICEES), pp. 306–311,March 2016.
[35] Atmel. AT89S52 - Datasheet Microcontroller with 8K BytesProgrammable Flash. Atmel 2001, pp. 1–30, 2020, http://www.atmel.com/images/doc1919.pdf.
[36] P. Harinath, K. Kamaleswaran, M. Venkateshwaran,C. Sreenath, S. Prabhakaran, and V. Kirubakaran, “A criticalanalysis of power quality issues in data center,” in 2016 Bien-nial International Conference on Power and Energy Systems:Towards Sustainable Energy (PESTSE), pp. 1–6, January 2016.
[37] M. Ravindran and V. Kirubakaran, “Electrical energy conser-vation in automatic power factor correction by embedded sys-tem,” Energy and Power, vol. 2, no. 4, pp. 51–54, 2012.
[38] GOI-MOP, CO2 baseline database for the Indian power sectoruser guide, vol. 3, Report by Ministry of Power Govt of India2014, 2020, http://www.indiaenvironmentportal.org.in/files/file/CO2%20Baseline%20Database%20for%20the%20Indian%20Power%20Sector.pdf.
[39] T. N. E. REGULATORY, C. Solar, and On RG, Tamil NaduElectricity Regulatory Commission, Tamil Nadu State Press2013, 2020, http://www.tnerc.gov.in/.
[40] P. R. G. N. P. R. G. N. Lalith, G. Prabakaran, A. Murugaiyan,and V. Kirubakaran, “Hybrid photovoltaic-thermal systems:innovative CHP approach,” in Proceedings of the 4th Interna-tional Conference on Electrical Energy Systems, ICEES 2018,pp. 726–730, Febuary 2018.
[41] C. Marimuthu and V. Kirubakaran, “Carbon pay back periodfor solar and wind energy project installed in India: a criticalreview,” Renewable and Sustainable Energy Reviews, vol. 23,pp. 80–90, 2013.
19International Journal of Photoenergy