
Energy Efficiency and Renewable Energy Portfolios · Efficiency and Renewable Energy Portfolios...
25
Energy Efficiency and Renewable Energy Portfolios 2018 Annual Evaluation Report (Volume I – Executive Summary) June 3, 2019
Transcript of Energy Efficiency and Renewable Energy Portfolios · Efficiency and Renewable Energy Portfolios...

Energy Efficiency and Renewable Energy Portfolios 2018 Annual Evaluation Report (Volume I – Executive Summary)
June 3, 2019

Prepared for: Prepared by:
Opinion Dynamics Corporation
With Subcontractors:

Introduction to the Annual Evaluation Report
opiniondynamics.com Page ii
Table of Contents
1. Introduction to the Annual Evaluation Report ........................................................................................ 1
1.1 Key Definitions ......................................................................................................................................... 1
2. Executive Summary .................................................................................................................................. 4
2.1 Summary of Portfolio Performance ......................................................................................................... 5
Cost Effectiveness Results ...................................................................................................................... 7
2018 Expenditure Summary ................................................................................................................... 8
2.2 Energy Efficiency Portfolio Evaluated Impacts ..................................................................................... 10
2.3 Energy Efficiency Portfolio Economic Impacts ...................................................................................... 11
2.4 Renewable Energy Portfolio Evaluated Impacts ................................................................................... 12
2.5 Renewable Energy Portfolio Economic Impacts ................................................................................... 13
2.6 Key Themes for Continued Success ..................................................................................................... 14
Energy Efficiency Portfolio ..................................................................................................................... 15
Renewable Energy Portfolio................................................................................................................... 17
3. Impact Results ........................................................................................................................................ 19
3.1 Energy Efficiency Portfolio Impacts ....................................................................................................... 19
3.2 Renewable Energy Portfolio Impacts .................................................................................................... 20

Introduction to the Annual Evaluation Report
opiniondynamics.com Page iii
Table of Tables
Table 2-1. Net Impacts: Energy Efficiency and Renewable Energy Portfolios – Evaluated Impacts versus Goals ......................................................................................................................................................................... 6
Table 2-2. Energy Efficiency and Renewable Energy Portfolios Benefit/Cost Ratio and Levelized Costs .......... 8
Table 2-3. Economic Impact of 2009 – 2018 Energy Efficiency Portfolio Investments .................................... 12
Table 2-4. Economic Impact of 2009–2017 Renewable Energy Portfolio Investments ................................... 14
Table 3-1. Net Impacts: Energy Efficiency Portfolio Evaluated and Verified Ex Ante Savings Versus Goals .... 19
Table 3-2. Net Impacts: Renewable Energy Portfolio Evaluated and Verified Ex Ante Savings Versus Goals .. 20

Introduction to the Annual Evaluation Report
opiniondynamics.com Page iv
Table of Figures
Figure 2-1. 2018 PSEG Long Island Expenditures for the Energy Efficiency Portfolio ......................................... 9
Figure 2-2. 2018 PSEG Long Island Expenditures for the Renewable Energy Portfolio ...................................... 9
Figure 2-3. 2018 Energy Efficiency Portfolio Evaluated Net MW and GWh Savings .......................................... 10
Figure 2-4. 2018 Renewable Energy Portfolio Evaluated Net MW and MWh Savings ...................................... 13
Introduction to the Annual Evaluation Report
opiniondynamics.com Page 1
1. Introduction to the Annual Evaluation Report
This report presents the results of the program evaluation that the Opinion Dynamics evaluation team conducted for PSEG Long Island’s 2018 Energy Efficiency and Renewable Energy Portfolios. The Energy Efficiency and Renewable Energy Portfolios were administered by the Long Island Power Authority (LIPA) from inception through 2013. Effective January 1, 2014, PSEG Long Island began a 12-year contract assuming all day-to-day management and operations of the electric system, including planning, administration, design, and implementation of the Energy Efficiency and Renewable Energy Portfolios. In March 2015, PSEG Long Island transitioned the implementation of the Energy Efficiency Portfolio to its subcontractor, Lockheed Martin. PSEG Long Island continues to implement the Renewable Energy Portfolio. In 2017, PSEG Long Island added the Home Energy Management program to the Energy Efficiency Portfolio, implemented by its subcontractor Tendril. This assessment covers the period from January 1, 2018, to December 31, 2018.
The Opinion Dynamics evaluation team produced two volumes that together compose the entire Annual Evaluation Report. This document, the 2018 Annual Evaluation Report (Volume I), provides an overview of evaluation findings, including impact and process results for 2018. The 2018 Program Guidance Document (Volume II) provides detailed program-by-program impact analysis results, process evaluation findings, and a discussion of data collection and analytic methods. The evaluation team developed the Program Guidance Document with the needs of PSEG Long Island’s and Lockheed Martin’s program planners and managers in mind, as the programs in the Energy Efficiency and the Renewable Energy Portfolios continue to be important and cost-effective resources. In addition to the Annual Evaluation Report, each year in late January, the evaluation team calculates verified ex ante savings for the Energy Efficiency and Renewable Energy Portfolios, which PSEG Long Island and LIPA use to assess the performance of the programs in relation to the annual savings goals. The memorandum reporting the 2018 verified ex ante savings is provided as an appendix to Volume II of the report.
1.1 Key Definitions
Below we provide definitions for key terms used throughout the document.
Gross Impacts: The change in energy consumption or demand at the generator that results directly from program-related actions taken by participants, regardless of why they participated. These impacts include line losses, coincidence factors (CFs) for demand, and waste-heat factors and installation rates. Gross impacts are the capacity and energy that power plants do not generate due to program-related actions taken by participants.1
Net Impacts: The change in energy consumption or demand at the generator that results directly from program-related actions taken by customers (both program participants and non-participants) that would not have occurred absent the program. The difference between the gross and net impacts is the application of the net-to-gross ratio (NTGR).
Net-to-Gross Ratio (Free-Ridership and Spillover): The factor that, when multiplied by the gross impact, provides the net impacts for a program. The NTGR is defined as the savings that can be attributed to programmatic activity and is composed of free-ridership (FR) and spillover (SO). FR reduces the ratio to account for those customers who would have installed an energy-efficient measure without a program. The FR component of the NTGR can be viewed as a measure of
1 While this evaluation includes line losses, CFs, and installation rates when estimating gross impacts, PSEG Long Island does not include these in its gross impact estimates.

Introduction to the Annual Evaluation Report
opiniondynamics.com Page 2
naturally occurring energy efficiency, which may include efficiency gains associated with market transformation resulting from ongoing program efforts. SO increases the NTGR to account for those customers who install energy-efficient measures outside of the program (i.e., without an incentive) but due to the actions of the program. The NTGR is generally expressed as a decimal and quantified through the following equation:
Equation 1-1. Net-to-Gross Ratio Equation
NTGR = 1 − FR + SO
Ex Ante Net Impacts: The energy and demand savings expected by the program as found in the program-tracking database. The ex ante net impacts include program planning NTGRs.
Verified Ex Ante Savings: The energy and demand savings calculated by the evaluation team using methods and assumptions consistent with those used by PSEG Long Island to develop annual savings goals. These savings estimates are used to determine if PSEG Long Island achieves its annual scorecard goals.
Evaluated Net Savings: The net savings attributed to the program. Evaluated net savings are determined by applying program planning assumptions for NTGR to the gross impact estimates determined by the evaluation team.
Ex Post Net Savings: The savings realized by the program after independent evaluation determines gross impacts and applies ex post NTGRs developed by the evaluation team. The evaluation team uses the ex post net impacts in the cost-effectiveness calculation to reflect the current best industry practices.
Line Loss Factors: The evaluation team applies line losses of 6.4% on energy consumption (resulting in a multiplier of 1.0684 = [1 ÷ (1 − 0.064)]) and of 9.1% on peak demand (resulting in a multiplier of 1.1001 = [1 ÷ (1 − 0.091)]) to estimate energy and demand savings at the power plant.
kW (Demand or Capacity): The average level of power used over the course of an hour. Peak demand is the average power used across a 4-hour period when there is high use. For Long Island, peak demand may take place anytime from 2pm to 6pm, Monday through Friday (non-holiday), from June to August. System coincident demand is the level of demand at the hour of the day when there is the maximum demand on the system grid. Demand savings values in this report are based on system coincident demand impacts between 4pm and 5pm on non-holiday weekdays from June to August.
kWh (Energy Consumption): The total power consumed over the course of an hour. Energy impacts are based on annual consumption.
Societal Cost Test (SCT): A test that measures the net costs of an energy efficiency program as a resource option based on the total costs of the program, including both the participants' and the program administrator's costs. Rebate costs are not included in this test because they are assumed to be a societal transfer. To maintain consistency with the most current version of the New York Benefit-Cost Analysis Handbook, we applied the SCT as a primary method of determining cost-effectiveness using the same assumptions as those used by PSEG Long Island's resource planning team.
Utility Cost Test (UCT): A test that measures the net costs of an energy efficiency program as a resource option based on the costs that the program administrator incurs (including incentive costs) and excluding any net costs incurred by the participant. To allow for direct comparison with PSEG Long Island's assessment of all supply-side options, and consistent with previous evaluation reports, we continue to show the UCT as a secondary method of determining cost-effectiveness.
Introduction to the Annual Evaluation Report
opiniondynamics.com Page 3
Discount Rate: The interest rate used to calculate the present value of future payments (i.e., the avoided costs from energy and demand savings). PSEG Long Island uses a weighted average cost of capital supplied by LIPA that represents the cost of borrowing to build additional capacity to meet the future supply needs of the service territory. Based on these factors, we used a nominal discount rate of 6.11% in the 2018 evaluation.
Levelized Cost of Capacity: The equivalent cost of capacity (kW) to be incurred each year over the life of the equipment that would yield the same present value of total costs, using a nominal discount rate of 6.11% to be consistent with base load generation supply-side resources in the Long Island service territory. The levelized cost of capacity is a measure of the program administrator’s program costs in a form that can be compared to the cost of supply additions.
Levelized Cost of Energy: The equivalent cost of energy (kWh) over the life of the equipment that would yield the same present value of costs, using a nominal discount rate of 6.11%. The levelized cost of energy is a measure of the program administrator’s program costs in a form that can be compared to the cost of supply additions.

Executive Summary
opiniondynamics.com Page 4
2. Executive Summary
In 2018, PSEG Long Island spent approximately $74.7 million implementing the Energy Efficiency and Renewable Energy Portfolios, which was about $8 million less than was spent in 2017.2 In 2018, the portfolios continued their transition from a demand savings focus to an energy savings focus, which is reflected in the overall portfolio performance. While the 2018 evaluated energy savings from these portfolios exceeded established energy savings goals by 14%, demand savings were 3% below goal. Energy savings for the portfolio were significantly higher than in 2017. The evaluated energy savings increased from 262,427 MWh in 2017 to 306,545 MWh in 2018. Evaluated demand savings, however, decreased from 67.6 MW in 2017 to 57.5 MW in 2018. Four key factors drove 2018 program performance in terms of overall savings and comparisons to goals, as described below.
Programs have more fully transitioned to energy focus. In 2017, PSEG Long Island’s Energy Efficiency Portfolio began to make the investments necessary to transition from its historical demand savings focus to an energy savings focus. In 2018, the results of these investments began to become apparent. Energy efficiency program spending was down 7% in 2018, but energy savings saw a 17% increase. For example, investments made in the Home Energy Management (HEM) program in 2017 were more fully realized in 2018, as described below. Also, 2018 saw the introduction of new energy-saving measures (e.g., exterior lighting) and the shifting of resources within programs toward those measures that provide more energy savings (e.g., commercial refrigeration)
Home Energy Management program now fully implemented. In 2017, PSEG Long Island launched the HEM program, which uses home energy reports (HERs) targeted at a portion of PSEG Long Island’s residential customers to raise awareness and influence customers to adopt energy-saving behaviors. The HEM program is focused on providing energy savings and not demand savings. The introduction of this program marks a positive step for PSEG Long Island’s efforts to diversify its Energy Efficiency Portfolio and its move toward maximizing energy savings. In 2018, the HEM program accounted for 19% of the Energy Efficiency Portfolio’s energy savings and more than seven times the savings realized in 2017. Savings in 2017 were lower than anticipated due to delays in launching the program. With full implementation throughout the year, and an expansion of the program participants from about 330,000 to 490,000 customers, the program helped drive the portfolio’s overall performance in 2018.
Energy Efficiency Portfolio continues to diversify. PSEG Long Island continued to make progress toward diversifying the sources of energy savings in its Energy Efficiency Portfolio in 2018. While lighting continues to account for the largest share of savings by end use, both the residential and commercial programs have begun to reduce their dependence on lighting savings. PSEG Long Island has invested in new measures (e.g., Smart Thermostats) and emphasized other non-lighting measures (e.g., air source heat pumps, combined heat and power) within its existing programs. For the Commercial Efficiency program (CEP), lighting now accounts for 80% of energy savings, down from 94% in 2016, due to the program placing a greater emphasis on refrigeration, custom non-lighting, and combined heat and power (CHP) measures. For the Energy Efficient Products (EEP) program, however, lighting still accounts for very large share (92%) of energy savings. Driven by the Energy Independence and Security Act (EISA) and other market forces, the savings opportunities from lighting are quickly disappearing. Recognizing the impending market changes driven by EISA, PSEG Long Island is not planning to provide rebates on standard lighting products in 2020. Losing a
2 The total expenditure for 2018 was $80.6 million, which includes expenditures for non-efficiency and non-renewables such as Utility 2.0 and REV expenditures.

Executive Summary
opiniondynamics.com Page 5
substantial portion of savings from lighting measures, PSEG Long Island’s efforts to identify cost-effective alternatives will be critical to the continued success of its Energy Efficiency Portfolio.
Despite steep decline in Solar Photovoltaic (PV) program rebates, the Long Island solar PV market remains strong. In 2018, the Solar PV program continued to experience the steep reduction in new projects and generation capacity that began with the end of the New York State Energy Research and Development Authority’s (NYSERDA’s) NY-Sun initiative rebates for residential solar systems on Long Island. Only 486 systems were rebated or financed in 2018 compared to 1,511 in 2017 and 7,176 in the peak year of 2015. Most of the decline in 2018 was due to substantially fewer residential systems, but non-residential systems also declined. While non-residential rebates were still available throughout the year, the compensation model for non-residential systems switched from net metering to the Value of Distributed Energy Resources (VDER) model, which compensates projects based on when and where they provide electricity to the grid. Despite the reductions in PSEG Long Island rebated projects in recent years, the solar PV market on Long Island remains strong. PSEG Long Island approves about 500 applications for solar interconnection per month. The continued rapid pace of solar PV installations without PSEG Long Island or NYSERDA rebates is a strong indication of the success of these programs in helping to transform the solar PV market on Long Island.
2.1 Summary of Portfolio Performance
The 2018 annual demand and energy savings goals were 268,948 MWh and 59.3 MW for the combined Energy Efficiency and Renewable Energy Portfolios, as shown in Table 2-1. The verified ex ante savings, which are used for comparing savings to the annual scorecard goals, are 114% of the goal for energy and 101% of the goal for demand. Evaluated energy and demand savings are 114% and 97% of the goals, respectively. PSEG Long Island achieved these savings at a total cost of approximately $74.7 million, 92% of budget.

Executive Summary
opiniondynamics.com Page 6
Table 2-1. Net Impacts: Energy Efficiency and Renewable Energy Portfolios – Evaluated Impacts versus Goals
Program
PSEG Long Island Annual
Energy Efficiency and
Renewable Energy Budget
Energy Efficiency
and Renewable
Energy Actual Cost
Energy Savings (MWh) Coincident Demand Savings (MW)
Goal Verified Ex Ante Evaluated Goal Verified Ex
Ante Evaluated
Energy Efficiency Portfolio
Commercial Efficiency Program $41,139,144 $32,129,236 97,802 99,108 95,633 24.9 20.9 20.7
Residential Efficiency Programs
Energy Efficient Products $17,697,376 $20,867,309 112,363 136,036 135,795 24.7 27.9 28.4
Cool Homes $4,165,657 $4,212,549 3,234 3,528 3,697 2.4 2.4 2.2
Residential Energy Affordability Partnership (REAP) $1,909,476 $2,039,234 1,920 1,907 972 0.49 0.48 0.20
Home Performance $9,925,218 $10,158,908 3,682 3,458 1,402 2.7 2.2 0.27
Home Energy Management $3,106,999 $2,317,251 40,000 47,845 55,662 N/A N/A N/A
Subtotal Residential $36,804,725 $39,595,251 161,198 192,774 197,527 30.3 33.0 31.1
Total Energy Efficiency Portfolio (Commercial and Residential) $77,943,870 $71,724,487 259,000 291,882 293,161 55.3 53.8 51.8
Renewable Energy Portfolio $3,456,990 $2,991,886 9,948 14,663 13,595 4.0 6.0 5.7
Total Energy Efficiency and Renewable Energy Portfolios $81,400,859 $74,716,372 268,948 306,545 306,756 59.3 59.8 57.5 Notes: 1. Costs and budget figures do not include line items not associated directly with the Energy Efficiency or Renewable Energy Portfolios, including LIPAEdge, Reforming the Energy Vision (REV), or Utility 2.0. 2. Actual costs are the expenditures necessary to obtain the energy and demand savings as reported in the Lockheed Martin Captures systems, and do not reflect PSEG Long Island accrual accounting. 3. Renewable Energy Portfolio impacts are expressed in terms of generation. 4. Solar PV benefits and costs (which are included in the Renewable Energy Portfolio) include $1.7 million in rebates from NYSERDA’s NY-Sun Initiative.
Executive Summary
opiniondynamics.com Page 7
PSEG Long Island tracks its performance against annual energy savings goals, which it derives from planning assumptions regarding key inputs to the estimation of expected gross and net savings. To allow for consistency and direct comparison between evaluated program performance and established savings goals, the evaluation team developed “verified ex ante net savings” estimates for each Energy Efficiency and Renewable Energy program. This comparison verifies that the methods and assumptions used by PSEG Long Island to develop their annual plan for program savings were applied consistently throughout the year in developing the ex ante savings. The verified ex ante savings are used as a comparison to the established annual savings goals.
An important catalyst in LIPA’s initial decision to invest in the Energy Efficiency and Renewable Energy Portfolios was the need to offset approximately 520 MW of generating capacity on Long Island required to satisfy energy demand forecasted at that time. As such, performance relative to the annual capacity savings goals had been the primary performance metric for these programs since 2009. However, with the launch of New York’s Reforming the Energy Vision (REV), the role of energy efficiency and renewable energy within New York’s comprehensive energy strategy has changed. PSEG Long Island’s strategies and goals for energy efficiency are now more closely aligned with REV principles. Beginning in 2017, the primary goal focused on electric energy savings rather than capacity savings, and the 10-year 520 MW goal is no longer a relevant metric. As such, PSEG Long Island now primarily uses the evaluated net savings to refine its savings estimates going forward and to help inform its program planning and goal-setting process for the next program year.
Among other inputs, the benefit/cost assessment requires an estimate of ex post net program savings. The best-practice approach to this assessment dictates that the net savings used to develop the benefit/cost ratio reflect current levels of naturally occurring energy efficiency, FR, and SO to provide an estimate of the benefits associated with the current year’s investment in the programs. As such, the evaluation team used net-to-gross factors derived from primary data collection with customers to develop the net energy savings estimates included in the benefit/cost ratio calculation and for lifetime levelized costs.
Cost Effectiveness Results
Based on our analysis of portfolio impacts and costs, the savings generated by the Energy Efficiency and Renewable Energy portfolios are cost-effective. As shown in Table 2-2:
Based on the UCT, the overall benefit/cost ratio is 2.0 for the combined portfolio savings (a UCT value greater than 1 indicates that portfolio benefits outweigh costs), and the levelized costs of the combined portfolio savings are $142.44/kW-yr or $0.03/kWh.3
Based on the SCT, the overall benefit/cost ratio is 1.5 for the combined portfolio savings and the levelized costs are $248.96/kW-yr or $0.06/kWh.
3 A levelized cost analysis is a way to quickly compare the cost of energy efficiency programs with energy or demand savings from other sources. Because levelized costs are expressed as $/kW-yr and/or $/kWh, they can be readily compared to the cost of alternative supply additions or the cost of generating electricity.

Executive Summary
opiniondynamics.com Page 8
Table 2-2. Energy Efficiency and Renewable Energy Portfolios Benefit/Cost Ratio and Levelized Costs
Program Benefit/Cost Ratio UCT Levelized Costs SCT Levelized Costs
UCT SCT $/kW-yr $/kWh $/kW-yr $/kWh
Energy Efficiency Portfolio
Commercial Efficiency Program 1.6 1.6 $193.24 $0.04 $250.47 $0.05
Residential Efficiency Programs
Energy Efficient Products 3.7 2.9 $81.12 $0.02 $138.76 $0.03
Cool Homes 0.89 0.92 $183.60 $0.11 $215.86 $0.13
Residential Energy Affordability Partnership (REAP) 0.24 0.32 $1,256.23 $0.25 $1,256.23 $0.25
Home Performance 0.07 0.17 $4,680.03 $0.89 $3,897.33 $0.74
Home Energy Management 0.97 1.47 - $0.04 - $0.04
Subtotal Residential 2.2 2.1 $139.43 $0.03 $188.27 $0.04
Total Energy Efficiency Portfolio (Commercial and Residential) 1.9 1.9 $159.30 $0.03 $211.24 $0.04
Renewable Energy Portfolio 5.40 0.56 $40.27 $0.02 $477.54 $0.19
Total Energy Efficiency and Renewable Energy Portfolios 2.0 1.5 $142.44 $0.03 $248.96 $0.06
Notes: 1. Benefit/cost ratio from Utility Cost perspective using comparison to base load marginal supply costs. If ratio is greater than 1.0,
program is cost-effective. 2. UCT does not consider lost revenues or net metering subsidies. 3. All levelized cost calculations use a discount rate of 6.11% to be consistent with supply-side alternatives. 4. Solar PV benefits and costs (which are included in the Renewable Energy Portfolio) include $1.7 million in rebates from
NYSERDA’s NY-Sun Initiative.
2018 Expenditure Summary
PSEG Long Island spent $74.7 million4 on the Energy Efficiency and Renewable Energy Portfolios in 2018, compared to $83.2 million in 2017. This expenditure figure is inclusive of $1.7 million in solar PV rebates from NYSERDA that were passed through to customers. Overall, PSEG Long Island realized a 17% increase in evaluated energy savings and a 15% decrease in evaluated demand savings compared to 2017, which is reflective of the portfolio’s recent emphasis on energy savings over demand savings. For example, the recent addition of the HEM program and CHP within the CEP provide significant new energy savings and relatively little demand savings. Figure 2-1 presents a summary of the $71.7 million spending related to implementation, management, and evaluation of energy efficiency programs in the 2018 Energy Efficiency Portfolio by type of expenditure. Figure 2-2 provides the detail for the $3.0 million investment in the 2018 Renewable Energy Portfolio, which includes $1.7 million in rebate funding from NYSERDA.
4 PSEG Long Island’s total expenditure was $80.6 million, which is inclusive of expenditures unrelated to the core-energy efficiency or renewables portfolios and includes Direct Load Control, Dynamic Load Management, and NYSERDA Energy Efficiency Community programs. For this evaluation, the $5.9 million spent on these other efforts is omitted.

Executive Summary
opiniondynamics.com Page 9
Figure 2-1. 2018 PSEG Long Island Expenditures for the Energy Efficiency Portfolio
“Rebates” consists of payments made to participating customers. “Incentives” consists of payments made to participating contractors (e.g., heating, ventilation, and air conditioning (HVAC) installers).
Figure 2-2. 2018 PSEG Long Island Expenditures for the Renewable Energy Portfolio
Includes $1.7M in solar PV rebates from NYSERDA funding that were passed through to PSEG Long Island customers.
57%
35%
1%4% 1% 2%
Rebates
Contractors
Incentives
Labor
Evaluation
Advertising
2018 Total: $71.7 million
58%
0%
42%
1%
Rebates
Contractors
Labor
Evaluation
2018 Total: $3.0 million
Executive Summary
opiniondynamics.com Page 10
2.2 Energy Efficiency Portfolio Evaluated Impacts
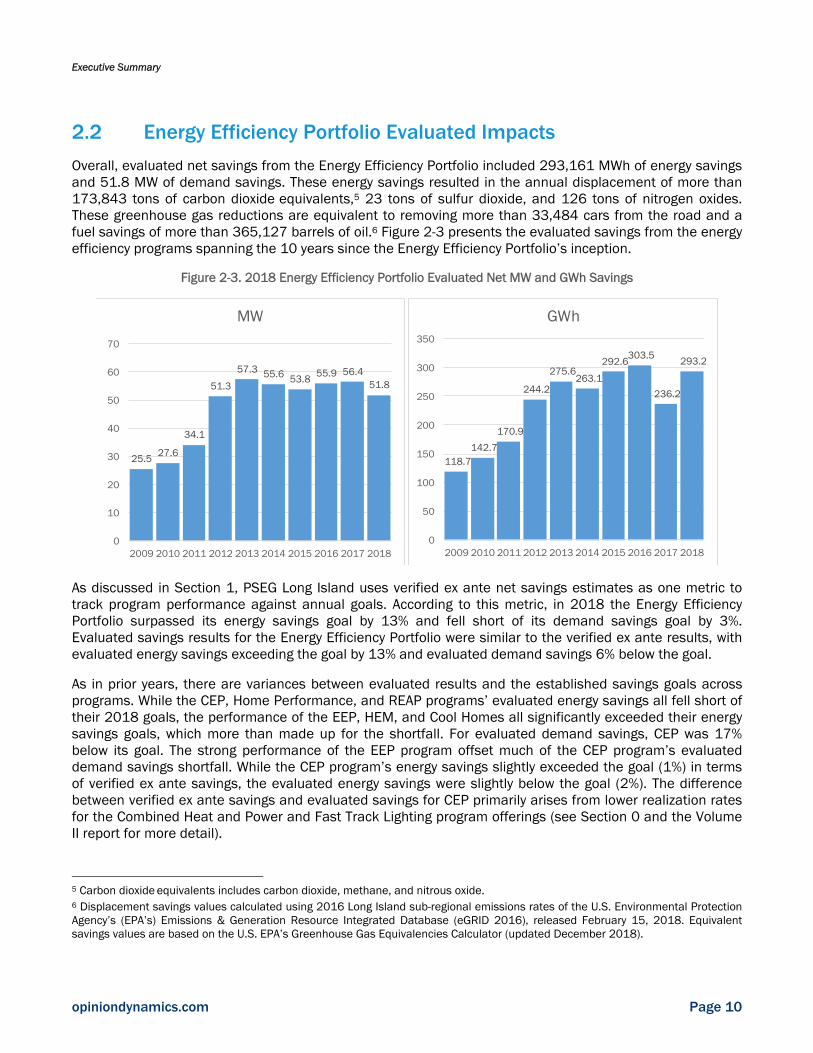
Overall, evaluated net savings from the Energy Efficiency Portfolio included 293,161 MWh of energy savings and 51.8 MW of demand savings. These energy savings resulted in the annual displacement of more than 173,843 tons of carbon dioxide equivalents,5 23 tons of sulfur dioxide, and 126 tons of nitrogen oxides. These greenhouse gas reductions are equivalent to removing more than 33,484 cars from the road and a fuel savings of more than 365,127 barrels of oil.6 Figure 2-3 presents the evaluated savings from the energy efficiency programs spanning the 10 years since the Energy Efficiency Portfolio’s inception.
Figure 2-3. 2018 Energy Efficiency Portfolio Evaluated Net MW and GWh Savings
As discussed in Section 1, PSEG Long Island uses verified ex ante net savings estimates as one metric to track program performance against annual goals. According to this metric, in 2018 the Energy Efficiency Portfolio surpassed its energy savings goal by 13% and fell short of its demand savings goal by 3%. Evaluated savings results for the Energy Efficiency Portfolio were similar to the verified ex ante results, with evaluated energy savings exceeding the goal by 13% and evaluated demand savings 6% below the goal.
As in prior years, there are variances between evaluated results and the established savings goals across programs. While the CEP, Home Performance, and REAP programs’ evaluated energy savings all fell short of their 2018 goals, the performance of the EEP, HEM, and Cool Homes all significantly exceeded their energy savings goals, which more than made up for the shortfall. For evaluated demand savings, CEP was 17% below its goal. The strong performance of the EEP program offset much of the CEP program’s evaluated demand savings shortfall. While the CEP program’s energy savings slightly exceeded the goal (1%) in terms of verified ex ante savings, the evaluated energy savings were slightly below the goal (2%). The difference between verified ex ante savings and evaluated savings for CEP primarily arises from lower realization rates for the Combined Heat and Power and Fast Track Lighting program offerings (see Section 0 and the Volume II report for more detail).
5 Carbon dioxide equivalents includes carbon dioxide, methane, and nitrous oxide. 6 Displacement savings values calculated using 2016 Long Island sub-regional emissions rates of the U.S. Environmental Protection Agency’s (EPA’s) Emissions & Generation Resource Integrated Database (eGRID 2016), released February 15, 2018. Equivalent savings values are based on the U.S. EPA’s Greenhouse Gas Equivalencies Calculator (updated December 2018).
25.5 27.6
34.1
51.3
57.3 55.6 53.8 55.9 56.451.8
0
10
20
30
40
50
60
70
2009 2010 2011 2012 2013 2014 2015 2016 2017 2018
MW
118.7 142.7
170.9
244.2
275.6 263.1
292.6 303.5
236.2
293.2
0
50
100
150
200
250
300
350
2009 2010 2011 2012 2013 2014 2015 2016 2017 2018
GWh
Executive Summary
opiniondynamics.com Page 11
2.3 Energy Efficiency Portfolio Economic Impacts
As part of the annual evaluation, the evaluation team assessed the economic impacts of the Energy Efficiency Portfolio investments on the economy of Long Island. Beginning in 2011, we developed an input-output (I-O) model of the Long Island regional economy using IMPLAN modeling software to estimate these impacts. Central to the I-O model approach is the development of a static model for the effects of program spending based on a matrix of relationships among economic sectors, including industries, households, government, and foreign trade. The model requires inputs on spending, avoided costs, electric rates, and other parameters from PSEG Long Island, and draws on the net savings information included in the benefit/cost assessment. The evaluation team updated this model and its inputs for this 2018 evaluation.
As in previous years, we estimated 1-year and 10-year economic impacts associated with the 2018 Energy Efficiency Portfolio investment, where the 10-year economic impacts accrue from measures installed in 2018 over their effective useful life. We then add these 1-year and 10-year economic impacts to the 2009–2017 estimates to develop a portfolio-to-date estimate (adjusted to 2018 dollars).7
As shown in Table 2-3, our analysis of economic benefits found that PSEG Long Island’s $71.7 million investment in the Energy Efficiency Portfolio in 2018 returned $73.0 million in total economic benefits to the Long Island regional economy in 2018, including an additional 512 full-time equivalent (FTE) employees.8 Over 10 years, these 2018 investments are expected to return $150.0 million in total economic benefits to the regional economy (in 2018 dollars9), with an employment benefit of 1,127 new FTEs.
Extrapolating these results over the 10-year life of the portfolio, the $622.0 million invested to date in Energy Efficiency ($790.4 million in 2018 dollars) produced approximately $890.9 million10 in cumulative annual economic benefits, with an employment benefit of 4,920 FTE employees. Over the 10 years following each program year investment, these 10-years of investments are expected to return $1.89 billion11 to the Long Island regional economy and result in 10,918 additional FTEs between 2009 and 2027.
7 Opinion Dynamics estimated the economic impact of the portfolio for the first 2 years of Energy Efficiency Portfolio implementation by extrapolating the economic impacts from 2011 (assuming similar multipliers of economic impact) to arrive at a portfolio-to-date estimate. 8 FTEs represent the number of total hours worked divided by the number of compensable hours in a full-time schedule. This unit allows for comparison of workloads across various contexts. An FTE of 1.0 means that the workload is equivalent to a full-time employee for 1 year, but could be done, for example, by one person working full-time for a year, two people both working half-time for the year, or two people both working full-time for 6 months. 9 Using the energy supply discount rate assumption of 6.11%. 10 In 2018 dollars. 11 In 2018 dollars.

Executive Summary
opiniondynamics.com Page 12
Table 2-3. Economic Impact of 2009 – 2018 Energy Efficiency Portfolio Investments
Effect Impact of 2018 Program Investment Impact of 2009 – 2018 Program
Investment
First-Year Impact Impact over 10 Yearsa First-Year Impact Impact over 10
Yearsa
Total Economic Output (2018 $1M)b $73.0 $150.0 $890.9 $1,887.4
FTE Employees 512 1,127 4,920 10,918 a Includes the 10-year impacts for each program year beginning in that year. b Total economic output is the value of industry production. In IMPLAN, these are annual production estimates in producer prices.
2.4 Renewable Energy Portfolio Evaluated Impacts
Overall, evaluated net savings from the Renewable Energy Portfolio included 13,595 MWh of energy savings and 5.7 MW of demand savings. These energy savings resulted in the annual displacement of more than 8,062 tons of carbon dioxide equivalents,12 1.07 tons of sulfur dioxide, and 5.85 tons of nitrogen oxides. These greenhouse gas reductions are equivalent to removing more than 1,553 cars from the road and a fuel savings of more than 16,933 barrels of oil.13 Figure 2-4 presents the evaluated savings from the energy efficiency programs spanning the 10 years since the Renewable Energy Portfolio’s inception.
The Renewable Energy Portfolio greatly exceeded its goals in 2018, achieving verified ex ante savings of 147% of its goal for energy savings and 150% of its goal for demand savings. However, energy and demand savings from the Renewable Energy Portfolio dropped steeply from 2017, which program staff attribute primarily to the lack of new residential projects following the exhaustion of NYSERDA residential incentives in April 2016. In 2018, PSEG Long Island provided rebates or financing for 486 solar PV systems, amounting to just one-third of the number of projects completed in 2017 and just 7% of the projects completed in 2016. Figure 2-4 outlines historical program achievement of demand and energy savings.
12 Carbon dioxide equivalents includes carbon dioxide, methane, and nitrous oxide. 13 Displacement savings values calculated using 2016 Long Island sub-regional emissions rates of the U.S. Environmental Protection Agency’s (EPA) Emissions & Generation Resource Integrated Database (eGRID 2016), released February 15, 2018. Equivalent savings values are based on the U.S. EPA’s Greenhouse Gas Equivalencies Calculator (updated December 2018).
Executive Summary
opiniondynamics.com Page 13
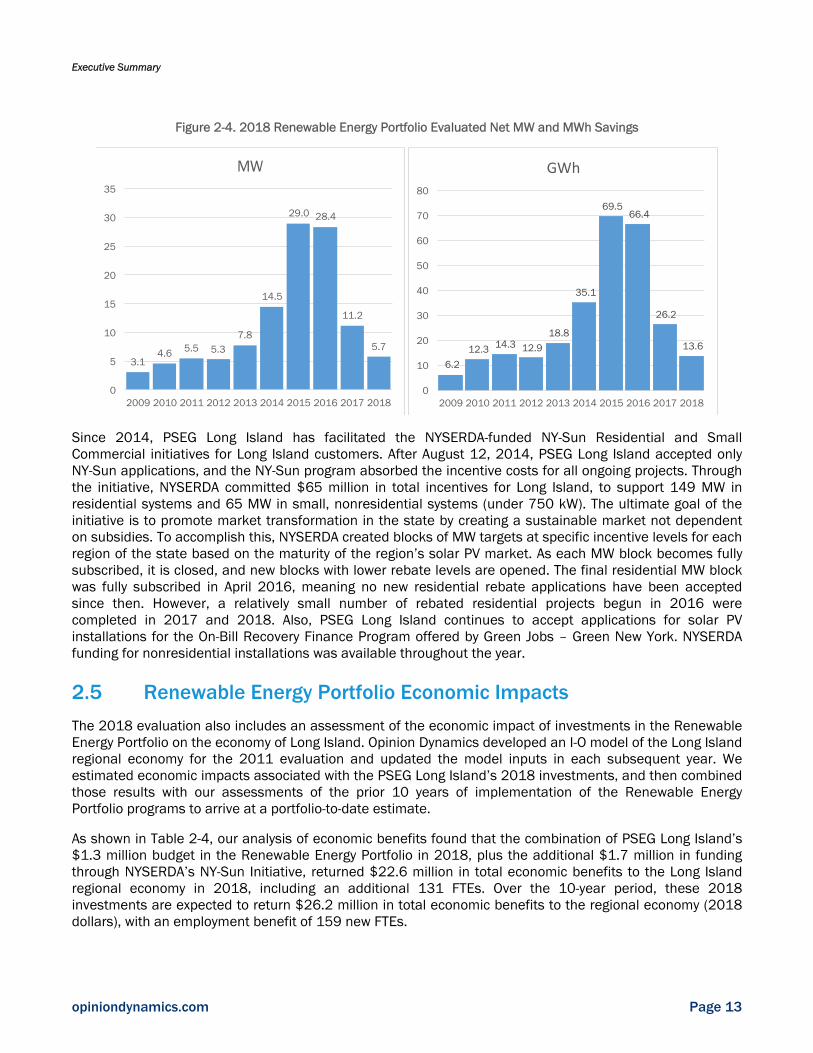
Figure 2-4. 2018 Renewable Energy Portfolio Evaluated Net MW and MWh Savings
Since 2014, PSEG Long Island has facilitated the NYSERDA-funded NY-Sun Residential and Small Commercial initiatives for Long Island customers. After August 12, 2014, PSEG Long Island accepted only NY-Sun applications, and the NY-Sun program absorbed the incentive costs for all ongoing projects. Through the initiative, NYSERDA committed $65 million in total incentives for Long Island, to support 149 MW in residential systems and 65 MW in small, nonresidential systems (under 750 kW). The ultimate goal of the initiative is to promote market transformation in the state by creating a sustainable market not dependent on subsidies. To accomplish this, NYSERDA created blocks of MW targets at specific incentive levels for each region of the state based on the maturity of the region’s solar PV market. As each MW block becomes fully subscribed, it is closed, and new blocks with lower rebate levels are opened. The final residential MW block was fully subscribed in April 2016, meaning no new residential rebate applications have been accepted since then. However, a relatively small number of rebated residential projects begun in 2016 were completed in 2017 and 2018. Also, PSEG Long Island continues to accept applications for solar PV installations for the On-Bill Recovery Finance Program offered by Green Jobs – Green New York. NYSERDA funding for nonresidential installations was available throughout the year.
2.5 Renewable Energy Portfolio Economic Impacts
The 2018 evaluation also includes an assessment of the economic impact of investments in the Renewable Energy Portfolio on the economy of Long Island. Opinion Dynamics developed an I-O model of the Long Island regional economy for the 2011 evaluation and updated the model inputs in each subsequent year. We estimated economic impacts associated with the PSEG Long Island’s 2018 investments, and then combined those results with our assessments of the prior 10 years of implementation of the Renewable Energy Portfolio programs to arrive at a portfolio-to-date estimate.
As shown in Table 2-4, our analysis of economic benefits found that the combination of PSEG Long Island’s $1.3 million budget in the Renewable Energy Portfolio in 2018, plus the additional $1.7 million in funding through NYSERDA’s NY-Sun Initiative, returned $22.6 million in total economic benefits to the Long Island regional economy in 2018, including an additional 131 FTEs. Over the 10-year period, these 2018 investments are expected to return $26.2 million in total economic benefits to the regional economy (2018 dollars), with an employment benefit of 159 new FTEs.
3.14.6 5.5 5.3
7.8
14.5
29.0 28.4
11.2
5.7
0
5
10
15
20
25
30
35
2009 2010 2011 2012 2013 2014 2015 2016 2017 2018
MW
6.2
12.3 14.3 12.9 18.8
35.1
69.5 66.4
26.2
13.6
0
10
20
30
40
50
60
70
80
2009 2010 2011 2012 2013 2014 2015 2016 2017 2018
GWh

Executive Summary
opiniondynamics.com Page 14
Extrapolating these results over the 10-year life of the portfolio, the $151.9 million investment in Renewable Energy programs to date ($224.0 million in 2018 dollars) produced approximately $493.4 million in cumulative annual economic benefits, with an employment benefit of 2,394 FTE employees. Over the 10 years following each program year investment, these 10-year investments are expected to return approximately $833.7 million to the Long Island regional economy and result in 4,563 additional FTEs between 2009 and 2027.
Table 2-4. Economic Impact of 2009–2017 Renewable Energy Portfolio Investments
Effect
Impact of 2018 Program Investment Impact of 2009 – 2018 Program Investment
First-Year Impact Impact over 10 Yearsa First-Year Impact Impact over 10
Yearsa
Total Economic Output (2018 $1M)b $22.6 $26.2 $493.4 $833.7
FTE Employees 131 159 2,394 4,563 a Includes the 10-year impacts for each program year beginning in that year. b Total economic output is the value of industry production. In IMPLAN, these are annual production estimates in producer prices.
Similar to the 2017 results, 2018 spending on PSEG Long Island’s Renewable Energy Portfolio resulted in greater benefits to the Long Island economy than in earlier program years, however economic impacts have declined since the peak in 2015, due to reduced funding availability through NYSERDA’s NY-Sun program. This reduction in funding resulted in fewer systems installed in 2018 compared to the past two years. The renewables portfolio still realized positive economic impacts in 2018 because of the inclusion of $1.7 million in funding from the NY-Sun program; however, NY-Sun funding has declined from $20 million in 2015. As with previous years, the NY-Sun funding had a large impact on the results because it positively contributed to the direct impact of the program but did not incur a corresponding renewables charge to PSEG Long Island ratepayers.
2.6 Key Themes for Continued Success
The Energy Efficiency and Renewable Energy Portfolios continued to demonstrate strong performance in 2018, providing substantial energy savings in a cost-effective manner. Combined, the portfolios exceeded the established goal for energy savings and fell just short of demand savings goals. In 2018, PSEG Long Island continued to offer new energy-saving measures and implemented new program designs with the aim of transitioning to an energy savings focus and of diversifying savings away from lighting. In addition, with the impending EISA efficiency standards going into effect in 2020, PSEG Long Island has decided to no longer offer rebates on standard lighting products after 2019. As the lighting market continues to transition, and as the ambitious New York state efficiency targets go into effect, identifying and investing in new and emerging solutions will be imperative to the portfolios’ long-term success. To maintain overall performance, and to build on the historical success of the Energy Efficiency and Renewable Energy Portfolios, PSEG Long Island must continue to identify and consider emerging issues and challenges during its planning, budgeting, implementation, and management decisions.
Over the next several years, PSEG Long Island will likely face significant challenges in responding to the ambitious new energy efficiency and renewable energy initiatives in New York. As part of its overall goal of reducing GHG emissions by 40% by 2030, New York set a new statewide energy efficiency target of 185 TBtu by 2025. A significant portion of this savings is expected to arise from accelerated energy efficiency investments by the state’s utilities. Electrification of thermal end uses in buildings is a key energy efficiency and decarbonization strategy that the utilities are expected to use to meet these goals. In laying out these

Executive Summary
opiniondynamics.com Page 15
targets, the New Efficiency: New York December 2018 Order14 established fuel-neutral targets to accommodate beneficial electrification of buildings, including heat pumps. The Order further established a subsidiary target of an annual 3% reduction in electricity sales from electric utilities in 2025. It is expected that PSEG Long Island will adopt fuel-neutral savings targets beginning in 2020, aggregating efficiency achievements across electricity, natural gas, and delivered fuels such as oil and propane. Aligning PSEG Long Island’s Energy Efficiency Portfolio with the all-fuels target, as well as the annual target for reduction in electricity sales, will require substantial changes to existing programs and additional energy efficiency investments.
Below we provide an overview of the performance of the Energy Efficiency and Renewable Energy Portfolios for the 2018 evaluation cycle and identify challenges that warrant attention in the future.
Energy Efficiency Portfolio
Commercial Efficiency Program
Overview of Performance
PSEG Long Island’s CEP continued to offer Long Island’s commercial customers effective opportunities for energy savings through the Comprehensive Lighting, Fast Track Lighting, HVAC, Standard, and Custom program offerings. The 2018 CEP also continued to offer no-cost energy assessments, cost-shared technical assistance studies, building commissioning co-funding, Leadership in Energy and Environmental Design (LEED) certification incentives, and ENERGY STAR® Benchmarking certification. New in 2018, an exterior lighting program offering was added as part of the shifted portfolio focus from demand to energy savings. Also, in 2018, the CEP saw its first four CHP projects completed under the Custom Program offering.
The CEP’s performance was mixed in 2018. For energy savings, the CEP was just over its goal (101%) in terms of verified ex ante savings and just below the goal (98%) in terms of evaluated energy savings. For peak demand savings, the CEP was significantly below the goals in terms of both verified ex ante savings (84%) and evaluated demand savings (83%). The difference between energy and demand savings compared to goals is in part due to Lockheed Martin’s key performance metric shifting from demand savings to energy savings midway through the year. Program resources were refocused to achieve greater energy savings at the expense of demand savings. Beyond performance in terms of energy and demand savings, the CEP continued customer and trade ally engagement, rigorous data tracking and quality assurance/quality control, exploration of alternative savings sources, and improvements to the program participation process. Highlights include:
In August of 2018, Comprehensive Lighting rebates changed from being calculated on a per-fixture basis to being calculated on a per-kWh basis, based on the energy savings a measure generates. This shift better aligns rebates with the claimable savings a project generates, as rebates are directly related to the level of inefficiency of the replaced equipment and the expected operating hours of the facility. By aligning the incentives participants are offered directly with energy savings, the CEP program administrators can better align budgets and energy savings goals over the course of a program year. This shift to performance-based lighting rebates also helps to incentivize lighting optimization because the marginal benefit of “over lighting” a space is now reduced compared to a dollars-per-fixture rebate design.
14 Case 18-M-0084, In the Matter of a Comprehensive Energy Efficiency Initiative, Order Adopting Accelerated Energy Efficiency Targets (issued December 13, 2018).

Executive Summary
opiniondynamics.com Page 16
In 2018, the Comprehensive Lighting and Fast Track Lighting program offerings were opened up to commercial customers with any rate class. By providing customers with more options for energy-saving projects, this expanded program eligibility will likely help to increase overall program participation.
The CEP program administrators sought to expand the array of measures offered in 2018. While lighting measures still accounted for the largest share of the CEP’s evaluated energy savings in 2018 (80%), this marked a decrease from their share in 2017 (88%) and 2016 (94%). In 2018, the CEP completed several CHP projects and placed more emphasis on the custom non-lighting measures and refrigeration measures.
Potential Challenges for the Future
While the CEP’s heavy reliance on lighting will continue to be a challenge for PSEG Long Island, the addition of new measures and changes to incentive structures in 2018 mark positive movement toward more measure diversity. As noted in previous evaluations, PSEG Long Island should continue to monitor the rapidly changing commercial LED lighting market and adjust incentive levels where possible, and also continue to explore new offerings and emerging technologies.
As described above, to meet new ambitious energy savings goals, it is anticipated that building electrification will become an important aspect of both commercial and residential programs going forward. The all-fuels targets will likely affect how PSEG Long Island’s programs are delivered. Additional investments in commercial building space heating and cooling technologies, such as air source heat pumps, geothermal heat pumps, and variable refrigerant flow systems, may play a significant role in addressing the New Efficiency: New York targets.
Residential Efficiency Programs
Overview of Performance
Together, the residential programs provided about two-thirds of the Energy Efficiency Portfolio’s energy savings in 2018. Based on evaluated savings, the residential programs exceeded their energy and demand savings goals by 23% and 3%, respectively. This performance was largely driven by the EEP program, which accounts for almost 70% of the savings from the residential programs. Based on evaluated savings, the EEP program exceeded its energy savings goal by 21% and fell short of its demand goal by 3%. The HEM program, which now accounts for the next largest portion of residential program savings, also substantially exceeded its energy savings goals by 39%. Together, the EEP and HEM programs accounted for 97% of the evaluated energy savings from the residential programs in 2018. The remainder of the residential portfolio—Cool Homes, REAP, and Home Performance programs—accounted for just 3% of the residential programs’ energy savings. The Cool Homes program also exceeded its energy savings goal in 2018, while the REAP and the Home Performance programs fell short.
The HEM program saw a considerable increase in savings, helping to drive the portfolio’s overall performance in 2018. Evaluated energy savings were more than seven times that realized in 2017. Savings in 2017 were lower than anticipated due to delays in launching the program. In 2018, however, the program was implemented throughout the year and was expanded from about 330,000 to 490,000 customers receiving reports. In addition, the ex ante savings estimated by PSEG Long Island were based on a lower baseline energy use than that observed in the evaluation’s analysis of billing records. Applying the evaluated
Executive Summary
opiniondynamics.com Page 17
percent savings from the regression model15 to this higher baseline energy use resulted in higher evaluated savings than those estimated by the program.
Potential Challenges for the Future
PSEG Long Island will need to continue to monitor emerging technologies and invest in new offerings to address the rapidly changing markets for energy-efficient products. In particular, PSEG Long Island will need to continue to prepare for upcoming federal lighting efficiency standards going into effect in 2020 (EISA 2020). While evaluated energy savings from residential lighting measures increased relative to 2017, going forward the programs will have diminishing ability to influence the lighting purchasing behaviors of customers through rebates in a residential lighting market that is rapidly transitioning to efficient LEDs. Program staff will need to plan carefully and set appropriate goals that are consistent with the transforming market. In addition, to meet the ambitious New York energy savings goals for 2025, building electrification will necessarily become an important aspect of PSEG Long Island’s residential programs. All-fuels targets will require substantial shifts in how PSEG Long Island’s residential programs are delivered. For example, the New Efficiency: New York December 2018 Order calls for high rates of high-efficiency heat pump adoption and fuel-neutral deep energy retrofits. Currently, the Cool Homes (now Home Comfort) and Home Performance programs account for a small portion of overall portfolio savings. To meet the new targets, it will be necessary for these programs to touch substantially more customers and take on a greater role within the portfolio.
Renewable Energy Portfolio
Solar Photovoltaic Program
Overview of Performance
PSEG Long Island’s Solar PV program performed well in 2018 in relation to its goals. Its verified ex ante savings reached 147% of the energy savings goal and 147% of the peak demand goal. The evaluated savings were similar at 137% and 143% of the energy and demands savings goals, respectively.
In terms of the overall number of systems rebated and installed capacity, however, the solar PV program is greatly reduced from prior years. PSEG Long Island provided rebates or financing for just 486 solar PV systems in 2018, amounting to just 32% of the number of projects completed in 2017, and just 7% of those completed in 2016. This decline corresponds with the final block of NYSERDA-funded NY-Sun funding for Long Island residential rebates, which was fully allocated in April 2016. As a result, no new residential rebate applications were accepted in 2018.16 However, the program continued to accept applications for solar PV installations through the On-Bill Recovery Financing Program offered by Green Jobs – Green New York throughout 2018.
With NY-Sun funding for non-residential installations still available throughout 2018, the program experienced a notable shift toward non-residential system installations as the residential incentive blocks ran out. However, program administrators contend that switching from the net metering compensation model to a Value of Distributed Energy Resources model for non-residential systems tempered this trend. The VDER compensation model, which was applied to all new non-residential projects submitted after May 1, 15 A consumption analysis regression model is used to determine energy savings from the HEM program. The regression model compares the energy consumption of treatment group participants to control group participants prior to and after treatment. Additional detail on the consumption analysis method is available in the Volume II report. 16 A small number of Affordable Solar incentives were processed in 2018, which are available for residential income-qualified customers on systems up to 6 kW.

Executive Summary
opiniondynamics.com Page 18
2018, takes into account the temporal and locational value of electricity sold to the grid. Program administrators estimate that the “all-in” value of compensation for most commercial customers under VDER is roughly two-thirds of what they would have received under a net metering model.17 As a result, the program experienced a rush of applications before the shift to the VDER model and saw the number of commercial systems interconnected in the second half of the year decrease dramatically.
Past research conducted by the evaluation team credited PSEG Long Island’s legacy Solar Pioneer and Solar Entrepreneur programs with promoting the development of a renewable energy industry on Long Island, helping increase consumer awareness of and demand for solar energy while also contributing to a robust supply chain and delivery infrastructure. This healthy solar market on Long Island continues to exhibit a high demand for solar PV even without incentives or financing from PSEG Long Island. Program administrators note that PSEG Long Island approves approximately 500 applications per month for solar interconnection.
Potential Challenges for the Future
By design, the NY-Sun program is winding down on Long Island: As of April 2016, PSEG Long Island had allocated all of the 149 MW of residential solar PV funding and, as of February 2019, all of the 84 MW of nonresidential funding had been allocated. PSEG Long Island still provides On-Bill Recovery Financing Program through Green Jobs – Green New York, and some funding is available for residential income-qualified customers through the Affordable Solar incentives program. However, without the NYSERDA rebates, impacts of the PSEG Long Island solar PV program will continue the steep decline seen in recent years. Given these changes and the advanced state of the solar PV market on Long Island, PSEG Long Island will need to determine the actual level of market transformation that has occurred on Long Island and in what form the program should continue.
Market and policy forces are likely to continue to advance solar PV on Long Island and statewide over the longer term. In the short term, however, there is some uncertainty that PSEG Long Island will need to monitor. For example, changes to the VDER tariff are being considered that would likely impact the solar PV market on Long island. Also, it remains to be seen how the governor’s goal of installing six gigawatts of distributed solar in New York by 2025 will affect PSEG Long Island. In addition, NYSERDA and PSEG Long Island are currently considering incentives for Long Island customers to encourage energy storage paired with new solar PV.
17 According to NYSERDA, compensation under VDER will vary by project, but “in many cases, compensation will be lower under the value stack than under [net metering].” (https://www.nyserda.ny.gov/-/media/NYSun/files/VDER-Frequently-Asked-Questions.pdf)
Impact Results
opiniondynamics.com Page 19
3. Impact Results
This section presents the evaluated net energy and demand impacts for the Energy Efficiency and Renewable Energy Portfolios.
3.1 Energy Efficiency Portfolio Impacts
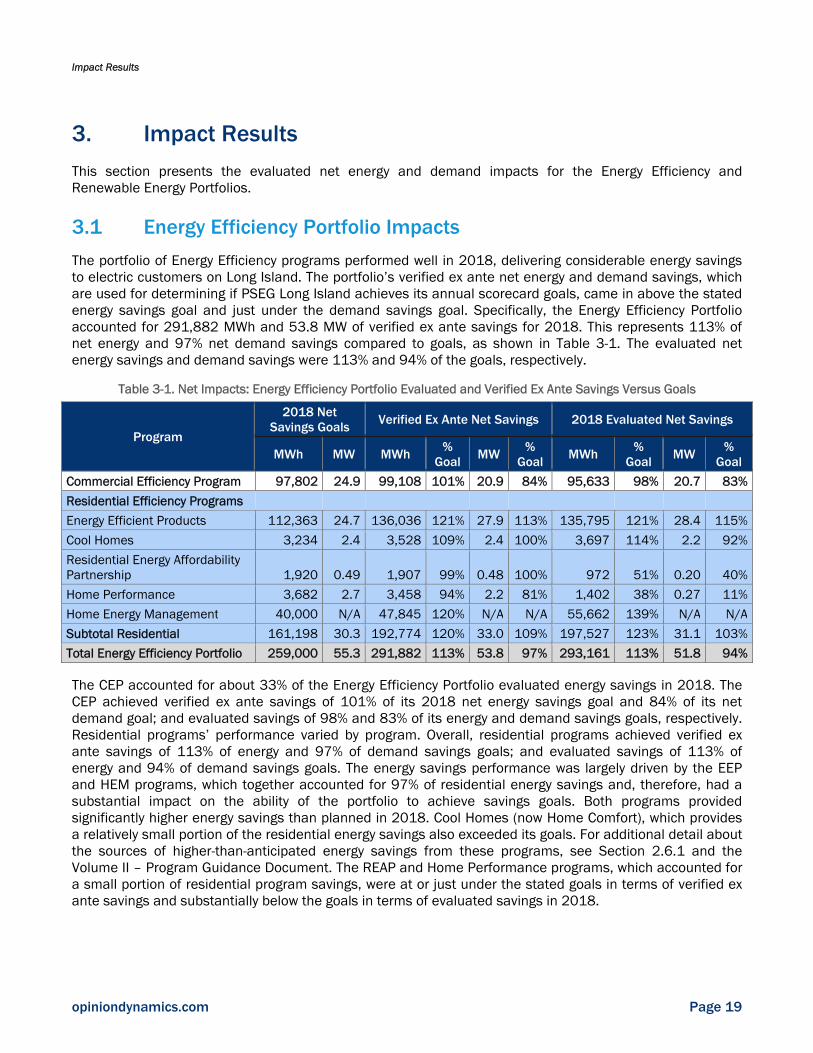
The portfolio of Energy Efficiency programs performed well in 2018, delivering considerable energy savings to electric customers on Long Island. The portfolio’s verified ex ante net energy and demand savings, which are used for determining if PSEG Long Island achieves its annual scorecard goals, came in above the stated energy savings goal and just under the demand savings goal. Specifically, the Energy Efficiency Portfolio accounted for 291,882 MWh and 53.8 MW of verified ex ante savings for 2018. This represents 113% of net energy and 97% net demand savings compared to goals, as shown in Table 3-1. The evaluated net energy savings and demand savings were 113% and 94% of the goals, respectively.
Table 3-1. Net Impacts: Energy Efficiency Portfolio Evaluated and Verified Ex Ante Savings Versus Goals
Program
2018 Net Savings Goals Verified Ex Ante Net Savings 2018 Evaluated Net Savings
MWh MW MWh % Goal MW %
Goal MWh % Goal MW %
Goal
Commercial Efficiency Program 97,802 24.9 99,108 101% 20.9 84% 95,633 98% 20.7 83%
Residential Efficiency Programs
Energy Efficient Products 112,363 24.7 136,036 121% 27.9 113% 135,795 121% 28.4 115%
Cool Homes 3,234 2.4 3,528 109% 2.4 100% 3,697 114% 2.2 92%
Residential Energy Affordability Partnership 1,920 0.49 1,907 99% 0.48 100% 972 51% 0.20 40%
Home Performance 3,682 2.7 3,458 94% 2.2 81% 1,402 38% 0.27 11%
Home Energy Management 40,000 N/A 47,845 120% N/A N/A 55,662 139% N/A N/A
Subtotal Residential 161,198 30.3 192,774 120% 33.0 109% 197,527 123% 31.1 103%
Total Energy Efficiency Portfolio 259,000 55.3 291,882 113% 53.8 97% 293,161 113% 51.8 94%
The CEP accounted for about 33% of the Energy Efficiency Portfolio evaluated energy savings in 2018. The CEP achieved verified ex ante savings of 101% of its 2018 net energy savings goal and 84% of its net demand goal; and evaluated savings of 98% and 83% of its energy and demand savings goals, respectively. Residential programs’ performance varied by program. Overall, residential programs achieved verified ex ante savings of 113% of energy and 97% of demand savings goals; and evaluated savings of 113% of energy and 94% of demand savings goals. The energy savings performance was largely driven by the EEP and HEM programs, which together accounted for 97% of residential energy savings and, therefore, had a substantial impact on the ability of the portfolio to achieve savings goals. Both programs provided significantly higher energy savings than planned in 2018. Cool Homes (now Home Comfort), which provides a relatively small portion of the residential energy savings also exceeded its goals. For additional detail about the sources of higher-than-anticipated energy savings from these programs, see Section 2.6.1 and the Volume II – Program Guidance Document. The REAP and Home Performance programs, which accounted for a small portion of residential program savings, were at or just under the stated goals in terms of verified ex ante savings and substantially below the goals in terms of evaluated savings in 2018.

Impact Results
opiniondynamics.com Page 20
3.2 Renewable Energy Portfolio Impacts
In 2018, the Renewable Energy Portfolio’s verified ex ante savings exceeding the net energy and demand generation goals by 47% and 50%, respectively, and evaluated energy and demand savings by 37% and 43%, as shown in Table 3-2.
Table 3-2. Net Impacts: Renewable Energy Portfolio Evaluated and Verified Ex Ante Savings Versus Goals
Program 2018 Net
Savings Goals Verified Ex Ante Net Savings 2018 Evaluated Net Savings
MWh MW MWh % Goal MW % Goal MWh % Goal MW % Goal
Solar PV 9,948 4.0 14,663 147% 6.0 150% 13,595 137% 5.7 143%
Total Renewable Energy Portfolio 9,948 4.0 14,663 147% 6.0 150% 13,595 137% 5.7 143%


![[PPT]Chapter 18 Renewable Energy 18-1 Renewable …environmentalscienceclass.weebly.com/.../ch_18_notes.ppt · Web viewChapter 18 Renewable Energy 18-1 Renewable Energy Today Renewable](https://static.fdocuments.net/doc/165x107/5b029fb97f8b9a6a2e900bdf/pptchapter-18-renewable-energy-18-1-renewable-envir-viewchapter-18-renewable.jpg)