Energy Efficiency and Financial Performance of information about how energy efficiency upgrades may...
22
2_Title Slide ENERGY EFFICIENCY & FINANCIAL PERFORMANCE: A Review of Studies in the Market December 2015
Transcript of Energy Efficiency and Financial Performance of information about how energy efficiency upgrades may...

2_Title Slide
ENERGY EFFICIENCY & FINANCIAL PERFORMANCE: A Review of Studies in the Market December 2015

Impact of Energy Efficiency on the Financial Performance of Commercial Buildings
Key Barrier Lack of information about how energy efficiency upgrades may improve a
property's financial performance leads to underinvestment in energy efficiency
Purpose of Study The goal of the study was to determine the extent to which empirical evidence
gathered via existing studies demonstrates that efficiency contributes to better financial performance
2
Methodology Over 50 relevant studies from the market were reviewed and compiled into
this summary
Energy Efficiency Could Impact a Building’s Financial Performance Through a Number of Channels
Net Operating Income Rental Income
Rental Rates Occupancy Tenant Quality
Occupant Comfort and Productivity*
Operating Expenses Utility Costs Operating
Expenses 3
Building Owner Financial Performance
Cash Flow Asset Value
Market Value Sales Price Cap Rates
Development Costs Construction Costs
*This can directly generate profits for businesses occupying the building and potentially drive higher rental income

Methodology
While this review originally sought to cover all research on energy efficiency and financial performance, the final product focuses on “green labeled” buildings The majority of research to date uses LEED or ENERGY STAR certifications as the
means of distinguishing between efficient or sustainable buildings and conventional buildings Specific energy efficiency measures, while proven to result in energy cost savings, have
not yet been extensively evaluated for broader impacts
This study does not represent new analysis conducted by DOE. It is a comprehensive survey and summary of the current body of research on the impacts of green labels on key components of commercial buildings’ operating statements. It does not exclude any studies or evaluate the quality of analysis. While most studies’ scope covered the U.S. commercial real estate industry, some
focused on regional and/or international markets 50 different organizations generated the 58 studies reviewed in this analysis Many studies share the same authors and may draw conclusions from overlapping data
sets
4

Current State of Research
There is an increasing body of evidence demonstrating green labels’ impacts on some areas of financial performance, while others need more research
5
Note: This analysis excludes costs of new equipment, insurance, taxes and debt terms
Greater Evidence (More than 7 studies) Rental Rates Occupancy Rates Utility Expenses Sales Price Construction Costs
Preliminary Evidence (7 or fewer studies) Tenant Quality Occupant Health,
Comfort and Productivity
Capitalization Rates
Mixed Evidence
Total Operating Expenses

Key Conclusions
Studies sampling thousands of buildings nationwide found that buildings with LEED and ENERGY STAR certifications have:
Higher Rental Rates – LEED buildings display a 15.2-17.3% premium and ENERGY STAR buildings display an 7.3-8.6% premium over similar* non-rated buildings50
Higher Occupancy Rates – LEED buildings have 16-18% higher occupancy than non-rated buildings, while ENERGY STAR buildings have 10-11% higher occupancy.50
Lower Utility Costs – Electricity and gas expenses in ENERGY STAR buildings are more than 13% lower compared to similar* non-rated buildings42
Increased Sales Prices –LEED buildings exhibit a 10-31% premium and ENERGY STAR buildings exhibit an 6-10% premium over non-rated buildings20,35
Low Construction Cost Premiums – Construction costs for LEED buildings are typically equal to or only slightly greater than the costs for non-rated buildings, primarily due to the costs of certification (approximately 2%)23
6
*Controlled for factors such as building class, location, etc. Sources: 20, 23, 35, 42, 50. See Appendix.

Areas for Further Research
There is still a need to better quantify the actual impacts of energy efficiency at a more granular level. Further research needs have been identified based on limitations in the existing body of evidence, including:
Sector-specific study limitations: Break-downs by geographic markets Sub-sectors such as retail malls, multifamily, warehouse, healthcare
More granular information on efficiency or sustainability measures: Specific LEED level or ENERGY STAR Score, as well as energy use intensity (EUI) or
specific equipment investments, independent of labels Financial impacts with minimal research conducted to date:
Tenant-related aspects: occupancy, leasing velocity, tenant quality and turnover, tenant improvement (TI) allocations
Occupant health, comfort, and productivity Operating expenses, emergency maintenance and repair costs Overall cash flow stability and market price risk Cap rates on building sales and REIT stock prices Building insurance rate premiums
7

Greater Evidence: Rental Rates are higher for green-labeled buildings
Key Findings: A 2011 study of over 21,000 U.S. rental buildings reports LEED buildings achieve a rent increment
of 7.9%, and ENERGY STAR buildings gain 3.5% average higher rent16 One 2010 study of CoStar Class A Office Data from 46 U.S. Markets (7,308 properties) found that
Energy Star buildings achieve rent premiums of 7.3-8.6%, and LEED labeled buildings achieve 15.2-17.3% 50
A 2011 study of 123 buildings in San Francisco and Washington, D.C. reports a 2.4% rent premium for LEED buildings in down markets vs. a 0.1% premium in up markets, suggesting LEED buildings maintain more stable rental rates in real estate down cycles12
Another 2012 study of 6,518 buildings in Colorado reports a higher rent premium for LEED buildings than ENERGY STAR buildings ($3.54 vs. $2.87 per sq. ft.23)
A 2014 study on multifamily buildings reported a $0.34 increase per sq. ft. in rental income 55
13 additional studies support the concept of rental rate premiums, yet warn that other factors may influence rental rates as well 2, 4, 8, 16, 18, 20, 22, 23, 25, 26, 29, 35, 37, 42, 47, 51
Some but not all of these studies statistically controlled for other market factors such as building size, location, class, and age
Sources: 2, 4, 8, 12, 16, 18, 20, 22, 23, 24, 25, 26, 29, 30, 35, 37, 42, 47, 50, 51. See Appendix.
8
Rental Rate: The cost per square foot (sq. ft.) that a tenant/occupant pays the building owner to rent the building space

Greater Evidence: Occupancy Rates are higher in green-labeled buildings
Key Findings: One 2010 study found that LEED buildings have 16-18% higher occupancy than a non-rated
building, while ENERGY STAR buildings have 10-11% higher occupancy.50
Green Design and the Market for Commercial Office Space (2010): examined CoStar class A office data across 46 markets (7,308 properties) in the U.S. 50
Another 2010 study of 286 LEED office buildings and 1,045 ENERGY STAR office buildings in 45 U.S. markets found an occupancy rate premium of 11% for both LEED and ENERGY STAR18* A 2009 study of 292 LEED and 1,291 ENERGY STAR buildings across the nation found
occupancy rates are 8% higher in LEED offices and 3% higher in ENERGY STAR offices21
12 additional studies support occupancy rate premiums, yet caveat that effects can be concentrated in certain market segments 2, 4, 8, 15, 16, 17, 20, 23, 24, 25, 26, 29, 35, 42, 46, 51
Some but not all of these studies statistically controlled for other market factors such as building size, location, class, and age
Occupancy Rate: The percentage of rentable space in a building that is currently leased and occupied by a tenant
Sources: 2, 4, 8, 15, 16, 17, 18, 20, 21, 23, 24, 25, 26, 29, 35, 42, 46, 50, 51. See Appendix.
9
*Did not distinguish between LEED and ENERGY STAR buildings.

Preliminary Evidence: Green-labeled buildings attract High Quality Tenants
Key Findings: A 2012 nationwide study of 11,179 tenant organizations (3,179 tenants in 1,180 green office
buildings and 8,000 tenants in 4,390 nearby control office buildings) found that certain industries, such as financial services, oil, mining, and construction industries or government agencies, are more likely to seek out green office space (controlling for building quality and location)17
Examples of prominent organizations that are among the largest consumers of green office space include: Wells Fargo Bank, Bank of America, ABN-AMRO, Department of Health and Human Services, U.S. EPA, Shell, and Chevron17
Organizations with high employee skill levels and compensation levels are also positively correlated to the propensity to lease green office space, 17 particularly corporations with socially responsible investment (SRI) goals, government agencies, and technology companies that have stated sustainability initiatives9
Additional studies hypothesize that rental payment collection loss and vacancy risk are minimized by leasing to higher quality tenants2, 20
Tenant Quality: The likelihood of rental payment collection or longer occupancy periods, reflected in a tenant’s credit rating or finances
Sources: 2, 4, 9, 17, 20, 44, 51. See Appendix.
10

Preliminary evidence: Green labeled buildings increase Occupant Health, Comfort, and Productivity
Key Findings: One 2009 study found that 55%* of 534 tenants across the U.S., who moved into LEED and
ENERGY STAR buildings managed by CBRE, agreed that employees were more productive, and 45% thought there were an average of 2.88 fewer sick days taken (resulting in an average impact of $1,228 per worker or $4.91 per sq. ft.).33 A 2012 study of 494 facilities of PNC Bank found PNC Bank’s LEED certified facilities
annually opened up 458 more consumer deposit accounts and had $3,032,000 more in consumer deposit balance per facility per year. LEED certified facilities also opened up 25.5 more consumer loan accounts and had $994,900 more in loan balance per facility per year.11 IMT and the Appraisal Institute (2012) suggest that daylighting can make indoor spaces more
pleasant for occupants, and has been shown to increase productivity in offices and even to increase sales in retail settings25 Most studies primarily link improved employee productivity to factors such as enhanced
environmental air quality, temperature control, lighting/daylighting and noise reduction in LEED and ENERGY STAR buildings2, 4, 7, 8, 15, 16, 17, 18, 19, 20, 25, 37, 41, 44, 46, 48, 51, 53, 54, 56 but there is no universally accepted measure of office productivity
Sources: 2, 4, 7, 8 , 11, 15, 16, 17, 18, 19, 20, 25, 28, 33, 37, 41, 44, 46, 48, 51. See Appendix.
Occupant Productivity: An occupant organization’s employee performance measured by output per unit of input
11
*12% of tenants surveyed strongly agreed and 42.5% agreed that employees were more productive

Greater Evidence: Green-labeled buildings have lower Utility Expenses
Key Findings: A 2013 nationwide study of 1,199 properties showed utility expenses were 12.9% lower per
sq. ft. for ENERGY STAR office buildings42
Another 2013 study of 2,760 office buildings in 4 U.S. markets found an average discount of 13.1% on electricity bills across both LEED and ENERGY STAR buildings47* A 2010 national study of 154 ENERGY STAR CBRE office buildings compared to 105 CBRE
buildings with no green label found lower electricity expenses per sq. ft. ($1.84 vs. $2.19, or 16%) and lower gas expenses per sq. ft. ($0.14 vs. $0.22, or 36%)34
A 2012 study of 494 U.S. facilities of PNC Bank found that its LEED-certified facilities annually saved $675.26/employee in utility costs compared to the firm’s non-green facilities11 One 2009 study of 23 LEED-EB buildings shows lower utility expenses than average
buildings listed in the BOMA 2007 Experience Exchange Report ($1.76 vs. $2.09, or 16%)31
23 additional studies support utility expense reductions, yet caveat results may have been impacted by variation of tenant occupancy schedules 2, 4, 5, 7, 8, 9, 11, 16, 19, 22, 23, 28, 29, 37, 41, 44, 46, 47, 48, 51, 55, 56, 57
Utility Expenses: Building operating expenses for electricity, gas, or other utilities
Sources: 2, 4, 5, 7, 8, 9, 11, 16, 19, 22, 23, 28, 29, 31, 34, 37, 41, 42, 43, 44, 46, 47, 48, 51. See Appendix.
12
*Did not differentiate between LEED and ENERGY STAR.

Mixed Evidence: Sources do not yet agree on effects of green labels on Total Operating Expenses
Key Findings: Three national studies (2010, 2010, 2013) sampling over 15,000 green-labeled buildings (mix
of LEED and ENERGY STAR) and associated transaction data observed no statistically significant effect on total operating expenses27,34,42 Another 2013 study of 2,760 Class A, B, and C LEED and ENERGY STAR buildings in New
York City, Washington, D.C., Los Angeles, and Northern New Jersey found operating expenses to be 11.2% higher based on operating expense estimates from CoStar47
The authors of this study acknowledged difficulties in measuring the effect of green labels on OpEx, specifically that “aside from energy, few other cost items can be objectively measured independently of their financial value”47
A different 2011 study of 12 nationwide LEED and ENERGY STAR buildings showed actual operating expenses to be 19% lower from a sample of GSA buildings19
The authors defined “aggregate operating cost” to include water utilities, energy utilities, general maintenance, grounds maintenance, waste and recycling, and janitorial costs.19
All five of these studies did not distinguish between LEED and ENERGY STAR
Operating Expenses (OpEx): The ongoing, generally periodic, operating costs associated with the occupation of space over and above the base rent
Sources: 2, 4, 8, 9, 14, 15, 19, 20, 27, 31, 34, 37, 42, 45, 46, 47, 51. See Appendix.
13
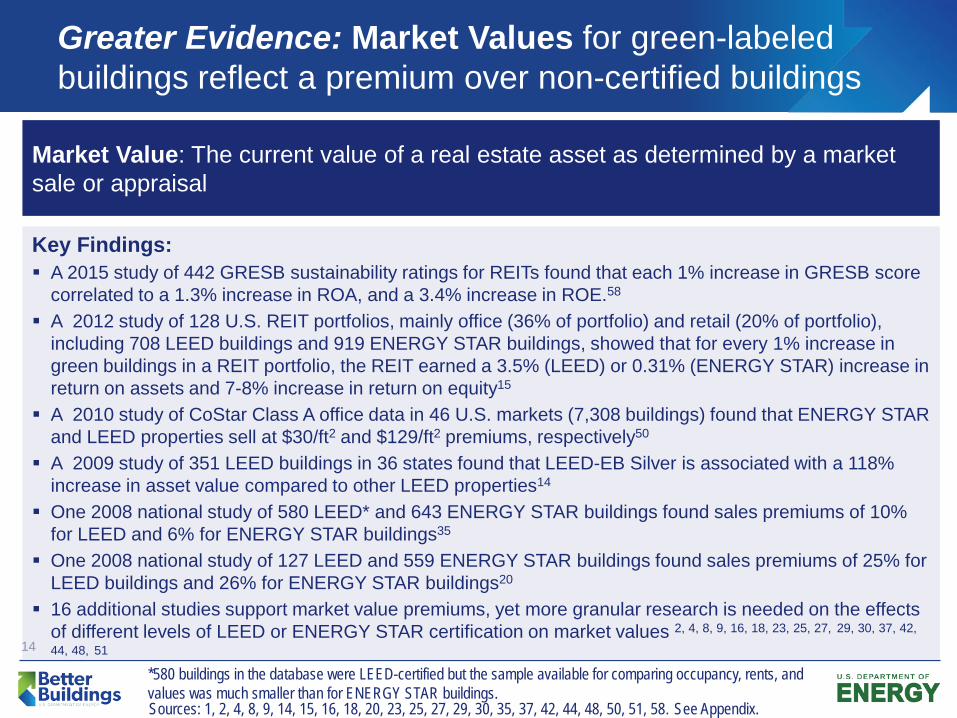
Greater Evidence: Market Values for green-labeled buildings reflect a premium over non-certified buildings
Key Findings: A 2015 study of 442 GRESB sustainability ratings for REITs found that each 1% increase in GRESB score
correlated to a 1.3% increase in ROA, and a 3.4% increase in ROE.58
A 2012 study of 128 U.S. REIT portfolios, mainly office (36% of portfolio) and retail (20% of portfolio), including 708 LEED buildings and 919 ENERGY STAR buildings, showed that for every 1% increase in green buildings in a REIT portfolio, the REIT earned a 3.5% (LEED) or 0.31% (ENERGY STAR) increase in return on assets and 7-8% increase in return on equity15
A 2010 study of CoStar Class A office data in 46 U.S. markets (7,308 buildings) found that ENERGY STAR and LEED properties sell at $30/ft2 and $129/ft2 premiums, respectively50
A 2009 study of 351 LEED buildings in 36 states found that LEED-EB Silver is associated with a 118% increase in asset value compared to other LEED properties14
One 2008 national study of 580 LEED* and 643 ENERGY STAR buildings found sales premiums of 10% for LEED and 6% for ENERGY STAR buildings35
One 2008 national study of 127 LEED and 559 ENERGY STAR buildings found sales premiums of 25% for LEED buildings and 26% for ENERGY STAR buildings20
16 additional studies support market value premiums, yet more granular research is needed on the effects of different levels of LEED or ENERGY STAR certification on market values 2, 4, 8, 9, 16, 18, 23, 25, 27, 29, 30, 37, 42,
44, 48, 51
Market Value: The current value of a real estate asset as determined by a market sale or appraisal
Sources: 1, 2, 4, 8, 9, 14, 15, 16, 18, 20, 23, 25, 27, 29, 30, 35, 37, 42, 44, 48, 50, 51, 58. See Appendix.
14
*580 buildings in the database were LEED-certified but the sample available for comparing occupancy, rents, and values was much smaller than for ENERGY STAR buildings.
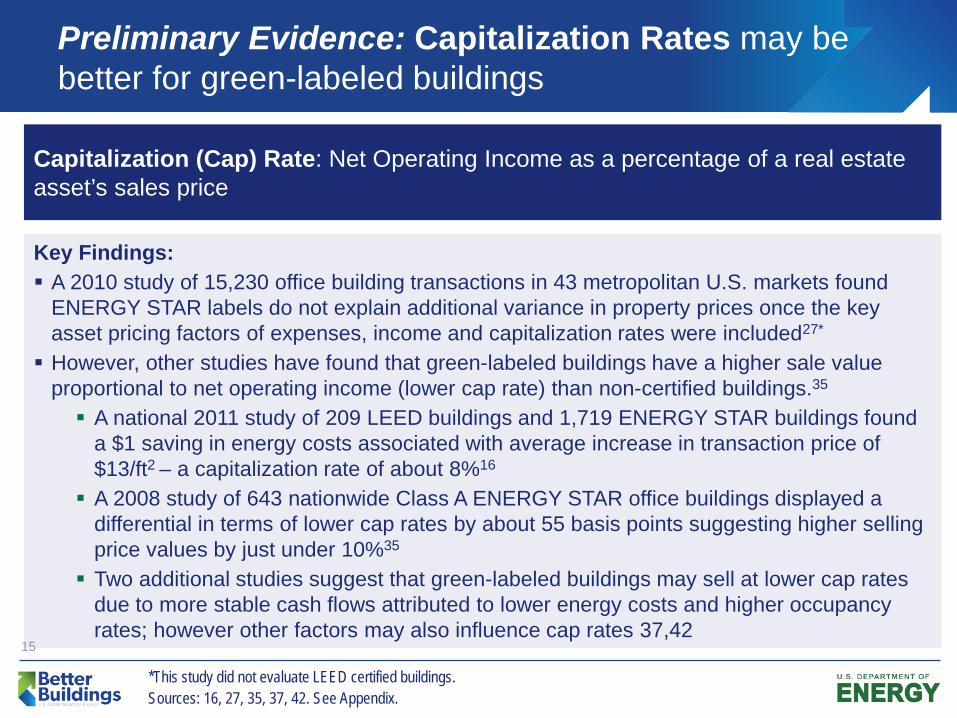
Preliminary Evidence: Capitalization Rates may be better for green-labeled buildings
Key Findings: A 2010 study of 15,230 office building transactions in 43 metropolitan U.S. markets found
ENERGY STAR labels do not explain additional variance in property prices once the key asset pricing factors of expenses, income and capitalization rates were included27* However, other studies have found that green-labeled buildings have a higher sale value
proportional to net operating income (lower cap rate) than non-certified buildings.35 A national 2011 study of 209 LEED buildings and 1,719 ENERGY STAR buildings found
a $1 saving in energy costs associated with average increase in transaction price of $13/ft2 – a capitalization rate of about 8%16 A 2008 study of 643 nationwide Class A ENERGY STAR office buildings displayed a
differential in terms of lower cap rates by about 55 basis points suggesting higher selling price values by just under 10%35
Two additional studies suggest that green-labeled buildings may sell at lower cap rates due to more stable cash flows attributed to lower energy costs and higher occupancy rates; however other factors may also influence cap rates 37,42
Capitalization (Cap) Rate: Net Operating Income as a percentage of a real estate asset’s sales price
Sources: 16, 27, 35, 37, 42. See Appendix.
15
*This study did not evaluate LEED certified buildings.

Greater Evidence: Construction Costs for green-labeled buildings are comparable to conventional buildings
Key Findings: A 2012 study of 6,518 LEED and ENERGY STAR buildings in Colorado noted that the small
extra costs for LEED are primarily due to the costs of certification (approximately 1.5-2%)23, rather than added hard construction costs for a more efficient building. A 2008 study of 6 markets across the U.S. found little significant cost difference for building to
meet LEED Certified, Silver, or Gold standards; building to LEED Platinum standards costs slightly more35: LEED Certified: 0-0.6% LEED Silver: 1.0-3.7% LEED Gold: 2.2-6.3% LEED Platinum: 7.8-10.3%
A national 2007 study comparing construction costs of 221 buildings, including 83 buildings designed to achieve LEED certification, found no significant difference in construction cost13
6 additional studies found that construction costs for LEED buildings are typically equal to or only slightly greater than the costs for non-certified buildings.6, 7, 8, 28, 46, 51
Construction Costs: The hard and soft costs associated with developing new buildings or renovating existing buildings

Appendix: Research Reviewed (1 of 5)
17
Source Author(s) Title Organizational Affiliation/Sponsor(s)
Regional Markets Scope Year
1 Addae-Dapaah, Kwame and Su Jen Chieh Green Mark Certification: Does the Market Understand? National University of Singapore Singapore 2011
2 Austin, Grant W. Sustainability and Income- Producing Property Valuation: North American Status and Recommended Procedures American Valuation, Inc. North America 2012
3 Beach, Robert Facility Sustainment and Firm Value: A Case Study Based on Target Corporation
East Tennessee State University
Target Corporation 2011
4 Bernstein, H.M. and Russo, M.A. Business Case for Energy Efficient Building Retrofit and Renovation McGraw Hill Smart Market
Reports U.S. 2011
5 BetterBricks, NEEA Kalispell Regional Medical Center: A Case Study of Energy-Saving Operational Improvements BetterBricks, NEEA U.S. 2010
6 Building Design & Construction White Paper on Sustainability USGBC U.S. 2003
7 Building Design & Construction Green Building Research White Paper USGBC U.S. 2007
8 Chappell, Theddi Wright, and Chris Corps High Performance Green Building: What’s It Worth?
Washington State Department of Ecology, The Real Estate Foundation of British Columbia, Evergreen Business Capital
International 2009
9 Ciochetti, Brian A. and Mark D. McGowan Energy Efficiency Improvements: Do they Pay? MIT, Skanska USA Commercial
Development Inc. U.S. 2010
10 CNT Energy, National Home Performance Council Unlocking the Value of an Energy Efficient Home CNT Energy, National Home
Performance Council U.S. 2013
11 Conlon and Glavas The Relationship Between Corporate Sustainability and Firm Financial Performance Notre Dame Business School U.S. 2012
12 Das, Prashant, Alan Tidwell, and Alan Ziobrowski
Dynamics of Green Rentals over Market Cycles: Evidence from Commercial Office Properties in San Francisco and Washington DC
Georgia State University, Columbus State University
San Francisco and Washington
DC 2011
13 Davis Langdon Cost of Green Revisted Davis Langdon U.S. 2007
14 Dermisi, Sofia V. Effect of LEED Ratings and Levels on Office Property Assessed and Market Values Roosevelt University U.S. 2009

Appendix: Research Reviewed (2 of 5)
18
15 Eichholtz, Piet, Nils Kok, and Erkan Yonder Portfolio greenness and the financial performance of REITs Maastricth University International 2012
16 Eichholtz, Piet, Nils Kok, and John H. Quigley The Economics of Green Building
Fisher Center for Real Estate and Urban Economics - UC Berkeley
U.S. 2011
17 Eichholtz, Piet, Nils Kok, and John H. Quigley
Why do companies rent green? Ecological responsiveness and corporate real estate
University of California and Maastricht University U.S. 2012
18 Eichholtz, Piet, Nils Kok, and John M. Quigley Doing Well by Doing Good? Green Office Buildings
Maastricht University, University of California Energy Institute, RICS
U.S. 2010
19 Fowler, Kim M. and Emily M. Rauch
Re-Assessing Green Building Performance: A Post Occupancy Evaluation of 12 GSA Buildings
PNNL U.S. 2011
20 Fuerst, Franz and Patrick M. McAllister
Green Noise or Green Value? Measuring the Price Effects of Environmental Certification in Commercial Buildings
University of Cambridge, University of Reading U.S. 2008
21 Fuerst, Franz and Patrick M. McAllister
An Investigation of the Effect of Eco-Labeling on Office Occupancy Rates University of Reading U.S. 2009
22 Goering, John Sustainable Real Estate Development: The Dynamics of Market Penetration City University of New York U.S. 2009
23 Gripne, Stephanie, J.C. Martel, and Brian Lewandowski
A Market Evaluation of Colorado’s High-performanceCommercial Buildings University of Denver Colorado 2012
24 Harrison, David M. and Michael J. Seiler The Political Economy of Green Industrial Warehouses Texas Tech University, Old
Dominion University U.S. 2011
25 IMT, Appraisal Institute Recognition of Energy Costs and Energy Performance in Real Property Valuation; Considerations and Resources for Appraisers IMT, Appraisal Institute U.S. 2012
26 Jackson, Jerry Sustainable Real Estate Projects? An Evaluation of LEED and ENERGY STAR Development Options
Journal of Sustainble Real Estate U.S. 2009
27 Jaffee, Dwight, Richard Stanton, and Nancy Wallace
Energy Factors, Leasing Structure and the Market Price of Office Buildings in the U.S. UC Berkeley U.S. 2010

Appendix: Research Reviewed (3 of 5)
19
28 Kats, Gregory H. Green Building Costs and Benefits Massachussetts Technology Collaborative Massachusetts 2003
29 Kok, Nils, Norman G. Miller and Peter Morris The Economics of Green Retrofits Maastricth University, University
of San Diego, Davis Langdon U.S. 2012
30 Kontokosta, Constantine E. Is There a Link Between Energy Performance and Investment Performance? Evidence from New Yrlk City Benchmarking Data NYU New York City 2013
31 Leonardo Academy Inc. The Economics of LEED for Existing Buildings: For Individual Buildings Leonardo Acadmey Inc. U.S. 2008
32 Mcallister, Andrew Draft Action Plan for the Comprehensive Energy Efficiency Program for Existing Buildings
California Energy Commission Efficiency and Renewable Energy Division
California 2013
33 Miller, Norman G., et al. Green Buildings and Productivity University of San Diego, CBRE, University of Baltimore, University of Britisth Columbia
U.S. 2009
34 Miller, Norman G., et al. The Operations and Management of Green Buildings i n the United States
University of San Diego, CBRE, University of Baltimore, University of Britisth Columbia
U.S. 2010
35 Miller, Norman G., Jay Spivey and Andy Florance Does Green Pay Off? Burnham-Moores Center for
Real Estate, CoStar U.S. 2008
36 Mills, Evan Building Commissioning: A Golden Opportunity for Reducing Energy Costs and Greenhouse Gas Emissions LBNL U.S. 2009
37 Muldavin, Scott Value Beyond Cost Savings Green Building Finance Consortium U.S. 2010
38 Nadel, Steven and Kate Farley
Modifying How Energy Costs Are Treated for Business Tax Purposes in Order to Decrease Subsidies and Increase Energy Efficiency ACEEE U.S. 2012
39 Nadel, Steven and Kate Farley Tax Reforms to Advance Energy Efficiency ACEEE U.S. 2013
40 Northbridge Environmental Management Consultants Analyzing the Cost of Obtaining LEED Certification The American Chemistry
Council U.S. 2003

Appendix: Research Reviewed (4 of 5)
20
41 Peterson, Kristian and Ross Gammill The Economics of Sustainability in Commercial Real Estate IFMA Foundation U.S. 2010
42 Pivo, Gary, and Jeffrey D. Fisher Income, Value, and Returns in Socially Responsible Office Properties University of Arizona, Indiana
University U.S. 2013
43 Ray, David Healthcare: A Business and Ethical Case for Sustainability BetterBricks, NEEA U.S. 2010
44 Runde, Timothy P., and Stacey Thoyre
Integrating Sustainability and Green Building into the Appraisal Process Carneghi Blum & Partners U.S. 2010
45 Sachs, Harvey et al. Depreciation: Impacts on Tax Policy The American Chemistry Council U.S. 2012
46 Syphers, Geof, et al. Managing the Cost of Green Buildings KEMA Northern California 2003
47 Szumilo, Nikodem and Franz Fuerst The Operating Expense Puzzle of US Green Office Buildings University of Cambridge U.S. 2013
48 Twill, Jason, et al. Economics of Change; Phase One Report Living Building Institute U.S. 2011
49 Warren-Myers, Georgia and Richard Reed
The Challenges of Identifying and Examining Links between Sustainability and Value: Evidence from Australia and New Zealand RMIT Austrailia & New
Zealand 2010
50 Wiley, Jonathan A., Justin D. Benefield and Ken H. Johnson
Green Design and the Market for Commercial Office Space College of Charleston, Florida International University U.S. 2010
51 World Green Building Council The Business Case for Green Building: A review of the Costs and Benefits for Developers, Investors and Occupants World Green Building Council International 2013

Appendix: Research Reviewed (5 of 5)
21
52 Rick Cleveland, Eric Duchon US Occupier Survey: The Corporate View of Sustainability Cushman & Wakefield U.S. 2014
53 OECD/IEA Capturing the Multiple Benefits of Energy Efficiency IEA International 2014
54 PR Newswire Tenant Satisfaction, Sustainability Link Revealed in DTZ Research
DTZ U.S. 2015
55 Deborah Philbrick, Rachel Scheu, Anne Evans
Valuing the Financial Benefits of Energy Efficiency in the Multifamily Sector
Elevate Energy U.S. 2014
56 Jon Lovell Breakthrough for Sustainability in Commercial Real Estate Deloitte Center for Finanacial Services U.S. 2014
57 Institute for Market Transformation Valuing Energy Efficiency: Beyond the Empire State Building IMT U.S. 2015
58 Franz Fuerst The Financial Rewards of Sustainability: A global Performance Study of Real Estate Investment Trusts
Social Science Research Network International 2015
Contact Information
For questions or comments regarding this document please contact: Elena Alschuler Building Technologies Program U.S. Dept. of Energy [email protected] 202-287-1561 Patrick Finch Waypoint Building Group [email protected] 415-738-4730 Waypoint Building Group delivers utility and public services for the commercial real estate sector. Waypoint’s core mission is to significantly decrease energy usage within the commercial sector through advanced energy analytics and innovative market deployment programs.
22