Energy Efficiency and Conservation Plan
190
1 Regional Plan Association August 2010 Energy Efficiency and Conservation Plan Bridgeport, Connecticut
Transcript of Energy Efficiency and Conservation Plan

1
Regional Plan Association
August 2010
Energy Efficiency and
Conservation Plan
Bridgeport, Connecticut

ACKNOWLEDGEMENTS
RPA is extremely grateful to the following, for providing vital input and lending professional expertise
during the creation of Bridgeport’s Energy Efficiency and Conservation Plan. Assistance in Plan
development does not necessarily constitute endorsement of this Strategy.Aquarion Water Company
Bridgeport Regional Business Council
Bridgeport WPCA
City of Bridgeport
Connecticut Clean Energy Fund
Enviro Express, Inc.
Fletcher Thompson, Inc.
Greater Bridgeport Transit
Groundwork Bridgeport
Institute for Sustainable Energy
Mercury Solar Systems
MetroPool
Santa Energy
Southern Connecticut Gas Company
Sunlight Solar Energy
The United Illuminating Company
Plan developed by:
Regional Plan Association BGreen Staff:
Evelyn Lee, Project Associate Matt Thurston, Research Assistant
David Kooris, Vice President, Connecticut Director Amanda Kennedy, Associate Planner
2 Landmark Square Suite 108 Stamford, CT 06901
203‐356‐0390 4 Irving Place 7th Floor New York, NY 10003
212‐253‐2727 www.rpa.org
www.bgreenbridgeport.org twitter: @BGreenBPT
www.facebook.com/bgreenbridgeport
EXECUTIVE SUMMARY ....................................................................................................................... 1
Introduction ............................................................................................................................................... 1
Background ................................................................................................................................................ 1
Greenhouse Gas Emissions, Setting Targets, and Focusing Reductions ........................................................ 2
Components of an “Action‐Oriented” Plan ................................................................................................. 7
Emissions Reduction Summary ................................................................................................................... 7
Green Building ................................................................................................................................ 19
Summary .................................................................................................................................................. 19
Action 1 Retrofit Public Facilities .......................................................................................................... 21
Action 2 Retrofit Commercial Buildings ................................................................................................ 24
Action 3 Weatherize and Retrofit Residential Buildings ........................................................................ 28
Action 4 Efficient appliances, fixtures and bulbs ................................................................................... 35
Action 5 Build Green ............................................................................................................................ 45
Action 6 Cool with Trees and Green Roofs ............................................................................................ 51
Action 7 Behavioral changes to save energy and reduce emissions ....................................................... 57
Action 8 Utility Scale Policies and Programs ......................................................................................... 64
Renewable Energy .......................................................................................................................... 67
Summary .................................................................................................................................................. 67
Action 1 Renewable Energy Development ............................................................................................ 69
Action 2 Increase distributed generation and combined heat and power capacity ................................ 74
Action 3 Residential and commercial solar energy ................................................................................ 77
Action 4 Utility scale policies and programs for regional renewable energy development .................. 85
LAND USE AND TRANSPORTATION .................................................................................................. 88
Summary .................................................................................................................................................. 88
Action 1 Boost Bridgeport's Regional Train Ridership ........................................................................... 90
Action 2 Transfer auto transit to bus transit ......................................................................................... 93
Action 3 Transfer SOV VMT to carpool, vanpool and car share options ................................................. 96
Action 4 Promote transit oriented development .................................................................................. 99
Action 5 Replace automobile trips with walking or bicycle trips ......................................................... 101

Action 6 Reduce municipal fleet emissions ......................................................................................... 103
Action 7 Switch to cleaner fuels .......................................................................................................... 105
Action 8 Achieve higher fuel efficiency community‐wide .................................................................... 107
WASTE AND RECYCLING ................................................................................................................. 110
Summary ................................................................................................................................................ 110
Action 1 Expand recycling rate to 16% by 2015 and 35% by 2030 ........................................................ 113
Action 2 Achieve 80% household participation in recycling by 2015 .................................................... 116
Action 3 Increase Recycling in the Commercial Sector to achieve 80% participation by 2015 .............. 117
Action 4 Develop community composting program ............................................................................ 118
Action 5 Actively pursue emissions avoidance through reuse, reduction, or green procurement ........ 119
Action 6 Single Stream or more aggressive collection process ............................................................ 120
WATER RESOURCES ....................................................................................................................... 123
Summary ................................................................................................................................................ 123
Action 1 Water and energy conservation through efficiency ............................................................... 125
Action 2 Build Green to reduce water usage ....................................................................................... 132
Action 3 Green Infrastructure ............................................................................................................. 134
References .................................................................................................................................... 147
Bridgeport Energy Efficiency and Conservation Plan 1
EXECUTIVE SUMMARY
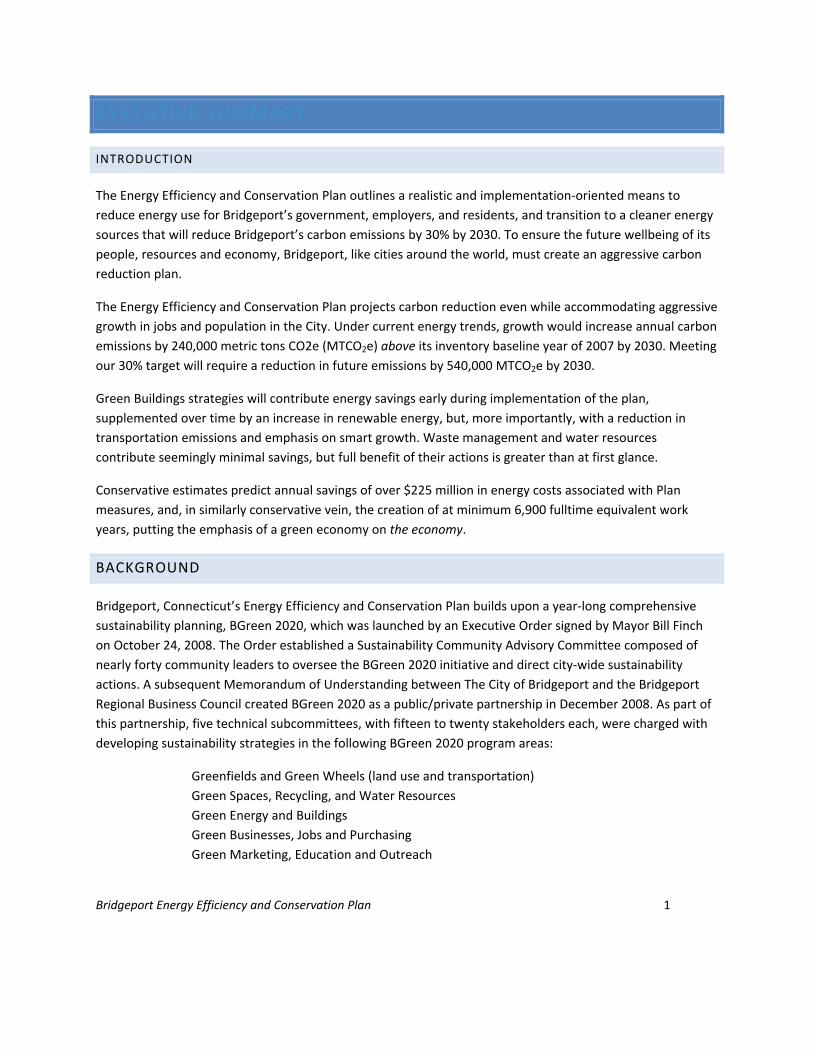
INTRODUCTION
The Energy Efficiency and Conservation Plan outlines a realistic and implementation‐oriented means to
reduce energy use for Bridgeport’s government, employers, and residents, and transition to a cleaner energy
sources that will reduce Bridgeport’s carbon emissions by 30% by 2030. To ensure the future wellbeing of its
people, resources and economy, Bridgeport, like cities around the world, must create an aggressive carbon
reduction plan.
The Energy Efficiency and Conservation Plan projects carbon reduction even while accommodating aggressive
growth in jobs and population in the City. Under current energy trends, growth would increase annual carbon
emissions by 240,000 metric tons CO2e (MTCO2e) above its inventory baseline year of 2007 by 2030. Meeting
our 30% target will require a reduction in future emissions by 540,000 MTCO2e by 2030.
Green Buildings strategies will contribute energy savings early during implementation of the plan,
supplemented over time by an increase in renewable energy, but, more importantly, with a reduction in
transportation emissions and emphasis on smart growth. Waste management and water resources
contribute seemingly minimal savings, but full benefit of their actions is greater than at first glance.
Conservative estimates predict annual savings of over $225 million in energy costs associated with Plan
measures, and, in similarly conservative vein, the creation of at minimum 6,900 fulltime equivalent work
years, putting the emphasis of a green economy on the economy.
BACKGROUND
Bridgeport, Connecticut’s Energy Efficiency and Conservation Plan builds upon a year‐long comprehensive
sustainability planning, BGreen 2020, which was launched by an Executive Order signed by Mayor Bill Finch
on October 24, 2008. The Order established a Sustainability Community Advisory Committee composed of
nearly forty community leaders to oversee the BGreen 2020 initiative and direct city‐wide sustainability
actions. A subsequent Memorandum of Understanding between The City of Bridgeport and the Bridgeport
Regional Business Council created BGreen 2020 as a public/private partnership in December 2008. As part of
this partnership, five technical subcommittees, with fifteen to twenty stakeholders each, were charged with
developing sustainability strategies in the following BGreen 2020 program areas:
Greenfields and Green Wheels (land use and transportation)
Green Spaces, Recycling, and Water Resources
Green Energy and Buildings
Green Businesses, Jobs and Purchasing
Green Marketing, Education and Outreach

Bridgeport Energy Efficiency and Conservation Plan 2
The resulting strategies are incorporated into a citywide BGreen 2020 Sustainability Plan. Since many of these
committee‐developed strategies have significant implications for reduced energy use, the BGreen Plan can be
viewed broadly as a comprehensive Energy Efficiency and Conservation Plan. However, to have greatest
impact and to more clearly direct and motivate municipal and community actions, strategies outlined in the
BGreen Plan were combined with results of Bridgeport’s 2007 Greenhouse Gas Inventory, conducted for the
city in 2008, so as to develop a more targeted Energy Efficiency and Conservation Plan.
GREENHOUSE GAS EMISSIONS, SETTING TARGETS, AND FOCUSING REDUCTIONS
A. Current Emissions
Bridgeport’s 2007 emissions were 997,799 metric tons CO2e.1 Municipal facilities and operations accounted
for slightly less than 4% of this total. While municipal leadership is essential to this energy plan,
communitywide actions are equally essential to making needed progress toward GHG reductions goals.
B. Setting Targets: What Level of Action is Required?
Varying greenhouse gas reduction targets have been established by different governmental or quasi‐
governmental entities. At the 73rd Annual Meeting of the United States Conference of Mayors in Chicago on
June 10‐14, 2005, mayors from cities nationwide created the Mayor’s Climate Protection Agreement as a
means for taking local action in reducing greenhouse gas emissions. This agreement, to which Bridgeport is a
participating city, includes a commitment to meet or beat provisions of the internationally‐recognized Kyoto
Protocol. The Kyoto Protocol targeted a seven percent greenhouse gas emissions reduction from 1990 levels
by 2012.
By Executive Order of Mayor Bill Finch signed October 24, 2008, (the same Executive Order which created the
BGreen 2020 Initiative) the City reinforced its commitment to Kyoto Protocol goals, with targets of seven
percent below 1990 levels by 2012, and ten percent below 1990 levels by 2020. This seemingly supports and
expands upon the goal set forth in the City’s Master Plan of Conservation and Development of a ten percent
reduction by 2020, although the Master Plan does not specify a baseline date.
In more recent action, Public Act 08‐98 of the State of Connecticut mandated attainment of the following
maximum emissions for the State: (1) Not later than January 1, 2020, a level at least ten percent below the
level emitted in 1990; and (2) Not later than January 1, 2050, a level at least eighty percent below the level
emitted in 2001.
At the Federal level, the United States House of Representatives, in June 2009, passed the American Clean
Energy and Security Act, which looked to reduce emissions three percent by 2012, 17 percent by 2020, 42

Bridgeport Energy Efficiency and Conservation Plan 3
percent by 2030, and 83 percent by 2050, all using 2005 emissions as the baseline. Under provisions of this
Act, certain subject industries would be required to limit emissions based on a cap and trade system. This Act
was not signed into law; discussions under separate legislative session are ongoing.
TABLE 1 Comparison of Recognized GHG Emission Reduction Targets
Baseline 2012 2020 2030 2050
Bridgeport CT
Executive Order 1990 7% reduction 10% reduction
Bridgeport Municipal
Plan
Not
specified 10% reduction
Kyoto Protocol and
Conference of Mayors 1990 7% reduction
Connecticut PA 08‐98 1990 &
2001
10% reduction
below 1990
80% reduction
below 2001
Federal Legislation –
House Bill 6/09 2005 3% reduction 17% reduction 42% reduction 83% reduction
C. Analyzing Growth to Establish Bridgeport’s Emissions Reduction Target
Energy strategies to reduce future emissions must consider the potential growth in energy use that comes
from increases in population and employment. This Energy Plan considers both a population‐based approach
and sector‐based approach to predicting growth and establishing emissions reduction targets for Bridgeport.
Under each, two different growth scenarios‐ Low Growth (following growth trends of the last several
decades) and high growth (expected from demographic shifts that favor urban environments) are analyzed
(See Appendix for full description of emissions projection scenarios).
This Bridgeport Energy Plan ultimately targets emissions reductions using the Sector‐based, High Growth
projection, which is the most aggressive growth projection of all scenarios and requires the largest emissions
reduction. Under this scenario, by 2030 Bridgeport will add 15,623 households, which are 8,000 more than
State projections. It will also add 27,500 more jobs, which is almost double the projection of nearly 15,0002.
Projected emissions under this scenario equal 1,237,688 metric tons CO2e. This represents an increase of
239,889 MTCO2e over 2007 baseline emissions.
The High Growth Scenario takes into account expected development of housing and commercial real estate
enabled by new zoning regulations enacted by the City of Bridgeport in 2009. Even in this currently
constrained economy, Bridgeport is poised and expected to grow. Redevelopment will increase Bridgeport
emissions. Favorably, redevelopment will occur at a time when we have our most efficient energy systems
and building codes ever. Also, favorably, Bridgeport growth represents potential to avoid growth‐related

Bridgeport Energy Efficiency and Conservation Plan 4
emissions in other towns. Growth in Bridgeport is the epitome of “smart growth,” placing more compact,
transit‐accessible residential and commercial opportunities in infill locations instead of on suburban
greenfields. To the extent that avoided sprawl may or may not be realized, this Energy Plan establishes strict
goals for reducing emissions under this second, more intensive Growth Scenario, and for Bridgeport taking
responsibility for reducing emissions to designated levels even in the face of expected increases in
households and employment.
Projected Emissions, 2007‐2030
This Energy Plan sets a goal of reducing emissions to a level, which is 30% below Bridgeport’s 2007 baseline
by the year 2030‐ an ultimate reduction of 539,228 MTCO2e in annual emissions. This will bring the City’s
emissions to 698,459 MTCO2e per year.
This Energy Plan outlines the means to achieve a reduction of 549,766 MTCO2e by 2030, exceeding very
slightly the long‐term target. Additional reductions, noted but not quantified by this plan, are also
anticipated. The following interim goals are recommended.
2007 Baseline annual emissions 997,799 MTCO2e
2030 Projected annual emissions 1,237,688 MTCO2e
Bridgeport Energy Efficiency and Conservation Plan 5
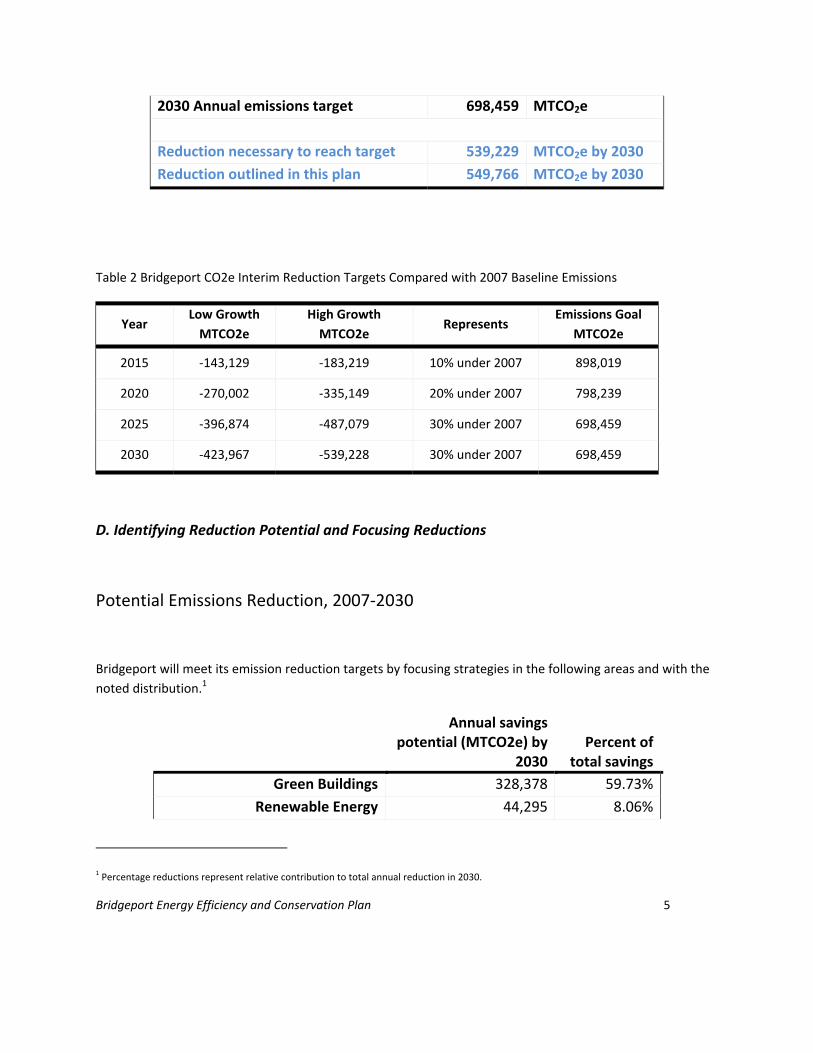
2030 Annual emissions target 698,459 MTCO2e
Reduction necessary to reach target 539,229 MTCO2e by 2030
Reduction outlined in this plan 549,766 MTCO2e by 2030
Table 2 Bridgeport CO2e Interim Reduction Targets Compared with 2007 Baseline Emissions
Year Low Growth
MTCO2e
High Growth
MTCO2e Represents
Emissions Goal
MTCO2e
2015 ‐143,129 ‐183,219 10% under 2007 898,019
2020 ‐270,002 ‐335,149 20% under 2007 798,239
2025 ‐396,874 ‐487,079 30% under 2007 698,459
2030 ‐423,967 ‐539,228 30% under 2007 698,459
D. Identifying Reduction Potential and Focusing Reductions
Potential Emissions Reduction, 2007‐2030
Bridgeport will meet its emission reduction targets by focusing strategies in the following areas and with the
noted distribution.1
Annual savings
potential (MTCO2e) by 2030
Percent of total savings
Green Buildings 328,378 59.73%
Renewable Energy 44,295 8.06%
1 Percentage reductions represent relative contribution to total annual reduction in 2030.

Bridgeport Energy Efficiency and Conservation Plan 6
Land Use and Transportation 170,124 30.94%
MSW and Recycling 6,129 1.11%
Water 841 0.15%
Total 549,766 100%
During each of four 5‐year periods between 2010 and 2030, contributions of each to the overall strategy vary,
depending upon phase‐in schedules associated with numerous individual strategies, specific economics, and
other variables. The ultimate goal of 60% green buildings and 30% transportation and land use in meeting
emissions reduction targets mimics closely the current division of emission output.
Green Building measures‐incorporating weatherization and retrofit actions, as well as behavioral modification
related to energy use‐create the bulk of early actions‐ over 80% ‐ in the next five years. Renewable energy
development phases in more slowly, in part due to its relatively less favorable economics. Transportation,
undoubtedly more difficult to alter than buildings, will rely, in part, on recent federal action to strengthen
vehicle fuel standards. To address transportation, Bridgeport must seek collaboration with others, since the
vast majority of vehicle miles travelled “in” Bridgeport are actually parts of trips “through” Bridgeport, and
developing transit alternatives will, of necessity, reach beyond the city.
Municipal solid waste/recycling and water resources actions currently contribute little to the carbon
“spreadsheet”, relative to buildings and transportation, but many of the full benefits of resource re‐use and
water conservation and stewardship are simply not accounted for in carbon analyses, unless full life‐cycle
approach is taken. Strategies to reduce waste‐ and water‐ emissions will have extremely valuable co‐benefits,
and give equally strong reason for their undertaking.

Bridgeport Energy Efficiency and Conservation Plan 7
COMPONENTS OF AN “ACTION‐ORIENTED” PLAN
Implementation is the only way to achieve success. All actions will require full community support and
participation. Several key elements of this Plan are intended to facilitate implementation of the strategies
identified by this plan. These include:
Identification of concrete 5‐year reduction targets for every strategy
Personalization of action strategies into manageable “blocks” or implementation units– such as 10
households, 10 buildings, or 20 persons‐so the strategies may become meaningful on a
neighborhood scale, considered the most likely scale for action
Energy savings linked to each strategy
Labor in “man‐days” linked to many actions to demonstrate broader value of community
participation in this EE&C Strategy
EMISSIONS REDUCTION SUMMARY
A. Green Buildings Strategy 83.3% of total reduction 2010 to
2015
59.7% of cumulative reduction
by 2030
$143 million+ annual energy cost savings 6,000+ fulltime equivalent work‐years
created

Bridgeport Energy Efficiency and Conservation Plan 8
Percentage of total emissions reductions by 2030 60%
Jobs created 6,100 FTEWY
Annual energy cost savings $143,035,000
Building weatherization and retrofit are relatively easy and cost effective actions, which provide good
returns in terms of reducing fuel costs. This is a strong early action item, which provides 44% of Green
Buildings savings by 2030.
Connecticut’s Energy Advisory Board makes all achievable cost effective conservation and efficiency (A‐
ACE) measures the number one priority in the state’s short‐term energy management. Connecticut ranks
third in the nation for having an outstanding energy efficiency program. Utility and energy supply
companies across the board – electricity, natural gas and fuel oil‐ participate in the State‐sponsored
program supported by an electric bill fee to all users, and federal recovery funds.
Green Buildings strategies have the potential to save over $143 million in energy costs annually upon full
implementation.
Weatherizing and retrofitting homes and businesses also offer high potential for jobs. Green Buildings
Actions identify opportunity for over 6,000 Full Time Equivalent Work Years associated with
implementation. Local entities, including The WorkPlace, Greater Bridgeport Community Enterprises, and
Bridgeport Minority and Small Business Center currently provide training programs specific to the jobs

Bridgeport Energy Efficiency and Conservation Plan 9
that these actions create. Additional occupational/career training will be needed to meet the high
demand.
The Mayor’s Conservation Corps can plan an effective outreach role in continuing to alert residents of
the cost savings related to green building measures. Schools and neighborhood groups can “go green” by
selling low cost light bulbs as fundraisers.
Bridgeport’s in‐place EID has a pivotal role to play, as well, developing additional private funding
mechanisms which optimize capacity for Bridgeport to achieve Plan goals. The Connecticut Energy
Advisory Board cites expanded funding mechanisms as a critical piece to Connecticut’s future energy
management plan.
Redeveloping Bridgeport properties in as green a manner as possible is an important element of this
plan, which must be supported by aggressive but realistic building codes and public education.
Green roofs will have coupled benefits of outdoor temperature moderation, indoor HVAC demand‐
reduction, greater roof longevity, stormwater management, potential carbon sequestration and positive
impact on solar efficiency; the City can take the lead in helping to define a good workable balance of
green roof and solar roof development.
50,000 trees planted will moderate air quality and temperature.
Behavioral changes are the easiest of actions proposed in the Green Buildings Strategy, and can provide
nearly 30% of the Green Buildings savings.
Policies related to utility companies and energy supply will impact Bridgeport emissions. Repowering of
power plants, for example, may have mixed impact on local emissions, since greater efficiency may be
offset by increased generation time.
B. Renewable and Clean Energy 5.2% of total reduction 2010 to
2015
8.1% of cumulative reduction by
2030
$20.5 million annual energy cost savings 575+ fulltime equivalent work‐years
create

Bridgeport Energy Efficiency and Conservation Plan 10
Percentage of total emissions reductions by 2030 8%
Jobs created 579 FTEWY
Annual energy cost savings $20,566,000
Narrative Summary
Clean and renewable energy strategies assume a steady spot between 5% and 10% of overall Plan
reduction savings throughout the plan’s twenty‐year period.
Several utility‐scale renewable energy projects may be developed in Bridgeport, possibly beginning
within 2 or 3 years. These include a 3 MW solar energy park near the closed Seaside Landfill, a 100KW

Bridgeport Energy Efficiency and Conservation Plan 11
on‐shore windmill on City‐owned property near the coast and a biogas retrofit on the City’s West Side
water treatment facility.
Connecticut’s Energy Advisory Board notes that costs of solar energy are still relatively high compared
with weatherization and retrofit opportunities and also notes cost reductions are expected. Ramping up
of household and commercial building site solar is delayed for several years under this plan. A City‐
initiated program, under development, and based on a power purchase agreement with a private entity,
may enable earlier establishment of solar capacity, at an acceptable cost. Solar energy installation can
prove very beneficial for an end user such as a city for its public and/or educational facilities or business.
Solar/green roof combinations can have many benefits. Optimizing the mix of these two opportunities is
important. Marketing the merits of this mix to commercial property owners will be important.
Solar thermal costs less than residential solar PV and residents can now benefit from a State funding
program in support of its installation. Excellent incentives currently exist for commercial solar thermal,
which may be of great benefit to hospitals, daycare centers, hotels, and other similar businesses that do
a lot of laundry.
Bridgeport’s southern industrial core should be comprehensively analyzed for development of resource
sharing opportunities, as several large players have heat and/or water “waste resources” that can benefit
others.
The Bridgeport EID and Planning and Economic Development Department must work jointly with the
State DECD and CDA in identifying more potential for distributed generation, particularly given the power
supply systems and resource recovery system near Bridgeport’s waterfront.
The City of Bridgeport can look to expand purchase of “green energy” and may find benefit to working
with other municipalities in lower‐cost group purchase.
Connecticut Clean Choice option will help certain residents obtain “green electricity” which can help the
City obtain solar PV systems for public facilities. Wind energy, a clean choice option, is viewed by electric
suppliers to be the next pivotal piece in regional green generation and supply.
Although far less than the estimated number of Green Buildings jobs, Renewables can provide
employment opportunities in the hundreds of fulltime equivalent work years in Bridgeport.

Bridgeport Energy Efficiency and Conservation Plan 12
C. Land Use and Transportation 9.4% of total reduction 2010 to
2015
30.9% of cumulative reduction
by 2030
$53.3 million annual energy cost savings 10+ fulltime equivalent work‐years
created
Percentage of total emissions reductions by 2030 31%
Annual energy cost savings $53,325,000
More limited employment opportunity 10 FTEWY
Annual VMT or fuel equivalent reduction 714,072,000
VMT avoidance potential through TOD 111,064,800

Bridgeport Energy Efficiency and Conservation Plan 13
Plan action items related to land use and transportation are estimated to have savings potential of $53
million in energy costs a year, upon full implementation. Emissions reduction is the equivalent of roughly
715 million VMT a year.
Land use and transportation are intertwined in their impact on carbon emissions. Bridgeport’s greatest
opportunity to effect regional emissions reductions is to redevelop. Households, employment centers,
cultural and entertainment venues can be located close to the City’s urban core and public transit.
Recently‐revised zoning enables this. Bridgeport emissions will increase from additional in‐use structures,
but emissions may be avoided if development occurs “in‐city” in place of sprawled development.
6,000 new households in the urban core will create lower net energy demand and emissions increases
than suburban development, owing to more energy‐efficient urban form and potential for reduced
dependence on automobile usage.
Along with housing must come support services to decrease reliance on the automobile. These include
expanded bus service, shuttle vans to job sites and mechanisms for developing carpools and car share
and/or bike share programs.
An easy opportunity to reduce transportation emissions is to transfer work and non‐work trips under 1‐
mile immediately from automobile VMT to walk or bike VMT. Outreach will be needed to encourage this
shift. Schools can play a vital role in bringing students to neighborhood schools in walking or bicycling
groups in place of automobiles.
Flat topography in the City’s southern section makes Bridgeport easily‐bikeable, and the streets can be
made even more bike and pedestrian‐friendly through “Complete Streets” development, which is in its
nascent stage, under City‐direction.
Beyond Bridgeport’s control are the several hundred thousand vehicles that pass through the City on
interstate highways daily. Emissions from vehicles passing through the City will be reduced over time as
Federal CAFÉ standards prompt more fuel efficient cars and light trucks. Certain reductions will also
occur as alternate fueled vehicles begin to enter the market. Connecticut’s Electric Vehicles
Infrastructure Council (CEVIC) is currently targeting Connecticut for PEV development, although overall
market penetration will likely be small.3
Also beyond Bridgeport’s immediate control is investment in transit. This must continue to take place as
part of State and regional smart growth, transport, and economic development, and environmental
health strategies. Transit alternatives must be provided to reduce single occupancy vehicle travel,
congestion, and poor air quality days, and to enable expanded opportunity to the job market for those
unable to afford cars.
Bridgeport Energy Efficiency and Conservation Plan 14
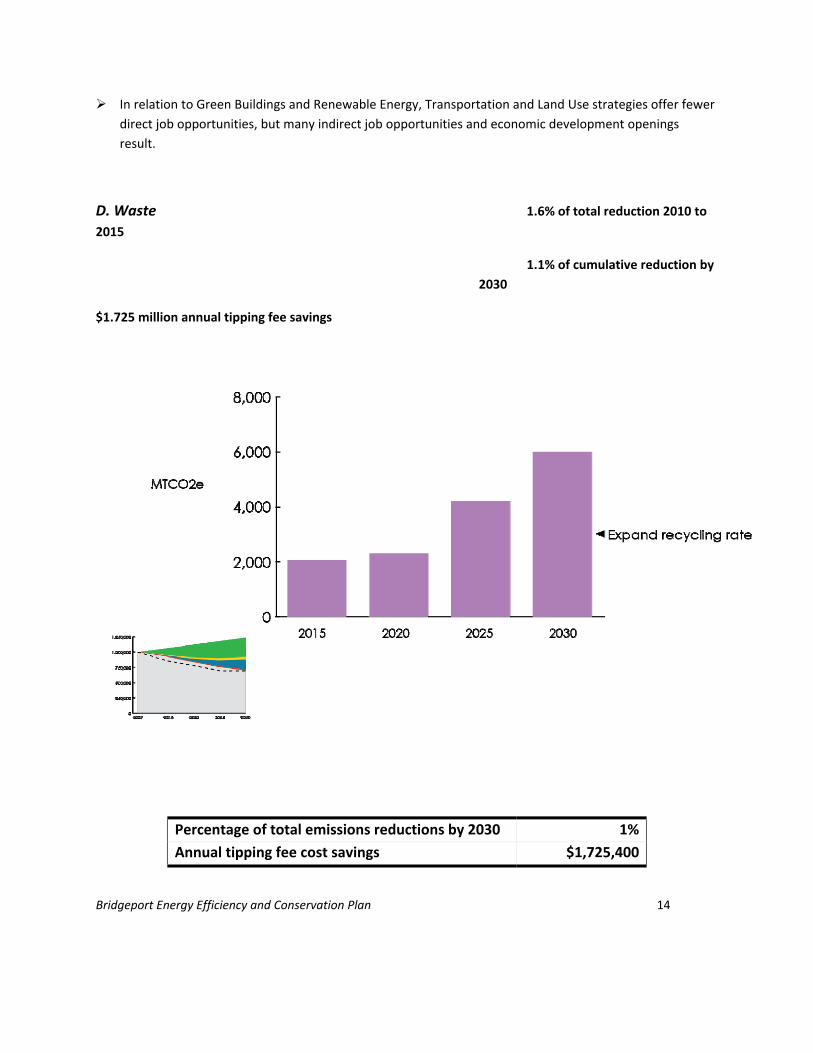
In relation to Green Buildings and Renewable Energy, Transportation and Land Use strategies offer fewer
direct job opportunities, but many indirect job opportunities and economic development openings
result.
D. Waste 1.6% of total reduction 2010 to
2015
1.1% of cumulative reduction by
2030
$1.725 million annual tipping fee savings
Percentage of total emissions reductions by 2030 1%
Annual tipping fee cost savings $1,725,400

Bridgeport Energy Efficiency and Conservation Plan 15
Opportunities for micro‐business development
Bridgeport’s incineration of municipal solid waste (MSW) is technically a biomass‐fueled operation, in
part, and provides electricity‐generation, so increased recycling (meaning diversion from incineration)
does not show the same carbon reduction impacts as diversion from landfilling would.
If life‐cycle is taken into account, impacts are greater (although they are not quantified by this energy
plan). Expanding reuse and recycle is a benefit to keeping many materials “in circulation.”
Increasing recycling participation is paramount to diverting tonnage from incineration to recycle and
reuse. This plan proposes a fast‐tracked and aggressive strategy for creating 80% recycling participation
by residents and businesses, quantified and monitored separately from tonnage diverted.
Residential participation will be bolstered by The Mayor’s Conservation Corps and Environmental Justice
community group outreach as well as by launch of a pilot recycling incentive program expected to
commence within the year.
The City, BRBC and DSSD will be pivotal to establishing more widespread commercial recycling. A
recycling and MSW Management Forum, sponsored by the City of Bridgeport, recently jumpstarted
focused attention on an expanded citywide recycling goal and a variety of micro‐business opportunities
related to solid waste management.
Composting on several scales will divert significant materials from incineration, although non‐commercial
composting may result in increased methane release. Larger scale commercial facilities can manage
waste and emissions, resulting in a net decrease.
“Single Stream” or more aggressive system has prompted greater diversion from incineration in many
towns, and will likely become a part of Bridgeport’s future MSW/Recycling operations.
Expanded recycling in schools, expected in pilot stage in Fall 2010, will establish a stronger recycling
mindset with carry‐over benefit to residential participation.
Employment opportunities linked to MSW and recycling are not identified in this plan, but it is certain
that many will evolve. Materials waste management is extremely varied and there is tremendous
potential to develop a host of associated micro‐businesses. Much of Bridgeport’s commercial building
space would be well suited to associated start‐ups.

Bridgeport Energy Efficiency and Conservation Plan 16
E. Water Resources 0.13% of total reduction, 2010 to
2015
0.15% of cumulative reduction
by 2030
$9.74 million annual energy and water cost savings 245+ fulltime equivalent work‐years
created
Percentage of total emissions reductions by 2030 0.2%
Jobs created 249 FTEWY
Annual energy cost savings $9,743,000
Annual water savings and/or treatment diversion 1,104,000,000 gallons

Bridgeport Energy Efficiency and Conservation Plan 17
If all items of the Plan are fully implemented, 1.1 billion gallons of water a year (an average exceeding 3
million gallons per day) may be detained or retained from the WPCA system. This will reduce energy
demand for treatment and emissions, and provide a valuable buffer to the city stormwater management
and flood control capacities.
Conservation and efficiency, promoted by current water‐ company and other efficiency programs, can
easily expand to provide small cost savings to customers, as well as water control benefit during dry and
wet weather. Per customer demand is already on the decline, likely as a result of these programs.4
Careful installation of green infrastructure, including green roofs, rain gardens, and bioswales, can also
significantly assist localized water management and flood control. Green roofs will yield strong co‐
benefits related to building energy, solar PV efficiency and outdoor air quality and temperature.
Increasingly, cities, including New York City and Philadelphia, report notable benefits to stormwater
control, as a result of conservation, efficiency and outdoor green infrastructure. Green roof modeling for
Washington D. C. shows significant promise to reduce CSO’s, either by reducing total water input to the
treatment system, or altering input timing. Bridgeport must draw from these, and other, models.
Green roof installation and maintenance, as well as rain garden installation, offer job opportunities of
close to one thousand work‐years, an additional incentive to their implementation.
New construction and renovations to Bridgeport buildings will certainly achieve water savings, due to
improved inherent fixture and system efficiencies.
The City can promote additional water savings through green building incentives.
Water “audits” can identify effective ways to reduce water usage in commercial facilities; the EID can
assist in creating financing mechanisms for audits and retrofit action.
City streets and right‐of‐ways must be viewed as essential elements in water management, and must be
employed to significantly temper stormwater flow and benefit water quality in rivers and Long Island
Sound.
The City, as a property owner, has an opportunity to work with WPCA and private landowners, to create
water management zones to capture or divert stormwater and provide flood control. Private/public
partnership is essential to this effort’s success.
As the WPCA works with the State of Connecticut in creating a Long Term Control Plan, green infrastructure
inclusion will be essential. Baseline study is needed to quantify potential economic and water quality impact
of wide scale implementation. As already noted, action items in this Plan identify means for conserving,
retaining, or detaining over 1 Billion gallons of water a year, a small amount compared to the City’s whole,
but, 3 million gallons/day average being slowed or eliminated from storm sewer systems can prove critical to
localized flood control.

Bridgeport Energy Efficiency and Conservation Plan 18
This page intentionally left blank
Bridgeport Energy Efficiency and Conservation Plan 19
GREEN BUILDING
SUMMARY
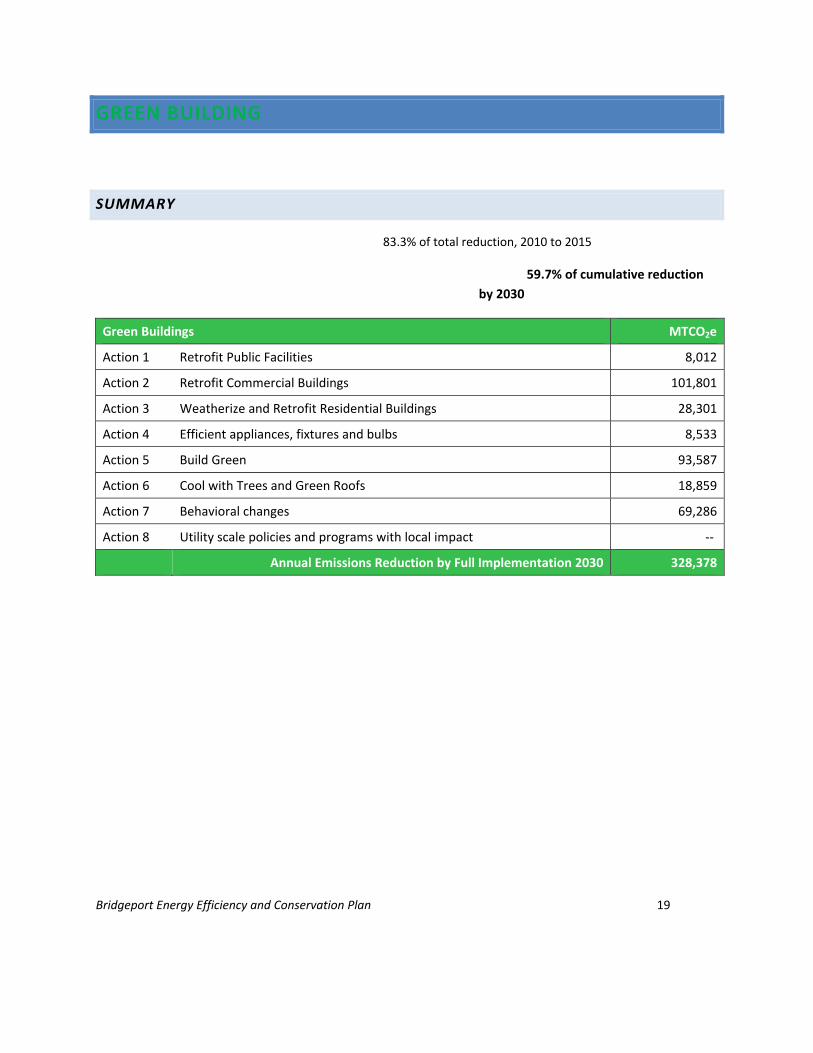
83.3% of total reduction, 2010 to 2015
59.7% of cumulative reduction
by 2030
Green Buildings MTCO2e
Action 1 Retrofit Public Facilities 8,012
Action 2 Retrofit Commercial Buildings 101,801
Action 3 Weatherize and Retrofit Residential Buildings 28,301
Action 4 Efficient appliances, fixtures and bulbs 8,533
Action 5 Build Green 93,587
Action 6 Cool with Trees and Green Roofs 18,859
Action 7 Behavioral changes 69,286
Action 8 Utility scale policies and programs with local impact ‐‐
Annual Emissions Reduction by Full Implementation 2030 328,378

Bridgeport Energy Efficiency and Conservation Plan 20
SAVINGS (annual by full implementation)
Electricity $88.8 million
Natural Gas $32.6 million
Light Fuel Oil $13.9 million
Water $0.48 million
GAINS
Fulltime equivalent work‐years 7,082
GREEN BUILDINGS
Narrative Summary
Building weatherization and retrofit are relatively easy and cost effective actions, which provide good
returns in terms of reducing fuel costs. This is a strong early action item, which provides 44% of Green
Buildings savings by 2030.
Connecticut’s Energy Advisory Board makes all achievable cost effective conservation and efficiency (A‐
ACE) measures the number one priority in the state’s short‐term energy management. Connecticut ranks
third in the nation for having an outstanding energy efficiency program. Utility and energy supply
companies across the board – electricity, natural gas and fuel oil‐ participate in the State‐sponsored
program supported by an electric bill fee to all users, and federal recovery funds.

Bridgeport Energy Efficiency and Conservation Plan 21
Green Buildings strategies have the potential to save over $143 million in energy costs annually upon full
implementation.
Weatherizing and retrofitting homes and businesses also offer high potential for jobs. Green Buildings
Actions identify opportunity for over 6,000 fulltime equivalent work years (FTEWY) associated with
implementation. Local entities, including The WorkPlace, Greater Bridgeport Community Enterprises, and
Bridgeport Minority and Small Business Center currently provide training programs specific to the jobs
that these actions create. Additional occupational/career training will be needed to meet the high
demand.
The Mayor’s Conservation Corps can play an effective outreach role by continuing to alert residents of
the cost savings related to green building measures. Schools and neighborhood groups can “go green” by
selling low cost light bulbs as fundraisers.
Bridgeport’s in‐place EID has a pivotal role to play, as well, developing additional private funding
mechanisms which optimize capacity for Bridgeport to achieve Plan goals. The Connecticut Energy
Advisory Board cites expanded funding mechanisms as a critical piece to Connecticut’s future energy
management plan.
Redeveloping Bridgeport properties in as green a manner as possible is an important element of this
plan, which must be supported by aggressive but realistic building codes and public education.
Green roofs will have coupled benefits of outdoor temperature moderation, indoor HVAC demand‐
reduction, greater roof longevity, stormwater management, potential carbon sequestration and positive
impact on solar efficiency; the City can take the lead in helping to define a good workable balance of
green roof and solar roof development.
50,000 trees planted will benefit air quality and reduce energy demand by moderating temperature
Behavioral changes are the easiest of actions proposed in the Green Buildings Strategy, and can provide
nearly 30% of the Green Buildings savings.
Policies related to utility companies and energy supply will impact Bridgeport emissions. Repowering of
power plants, for example, may have mixed impact on local emissions, since greater efficiency may be
offset by increased generation time.
Green buildings
ACTION 1 RETROFIT PUBLIC FACILITIES
Sub item 1.1 ‐ Reduce Public Facilities emissions
Goal: Achieve 30% reduction in 2007 public facilities emissions by 2030.
Bridgeport Energy Efficiency and Conservation Plan 22
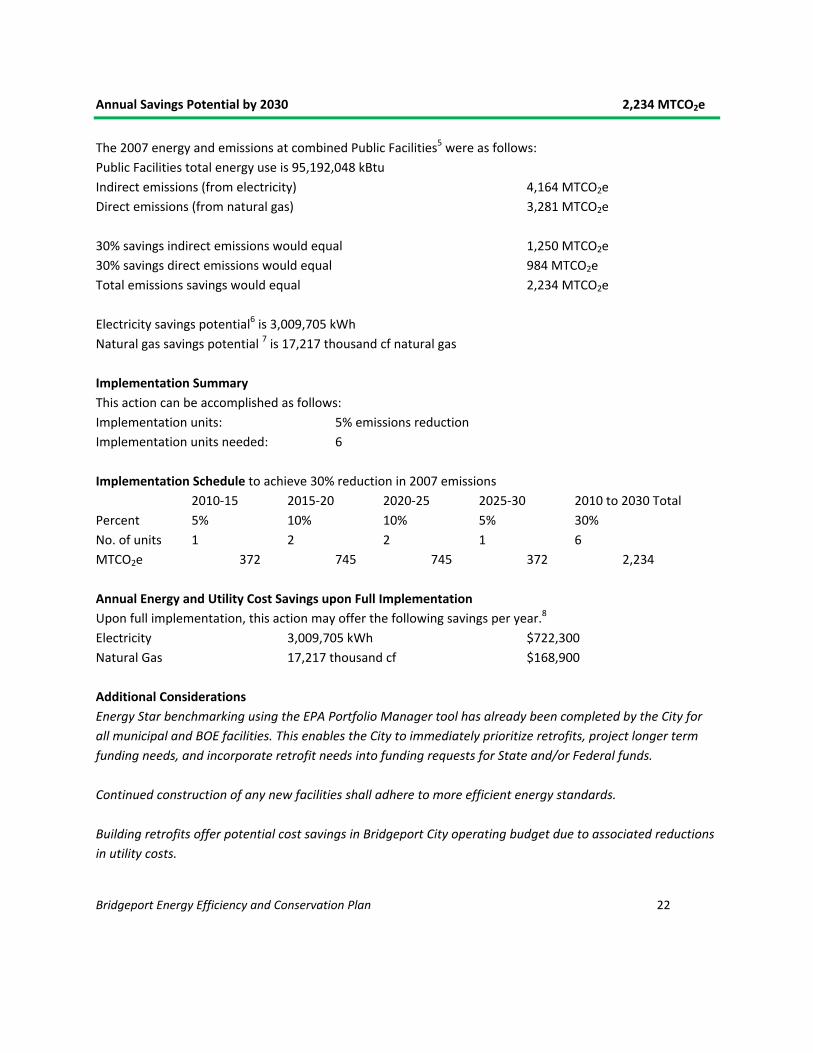
Annual Savings Potential by 2030 2,234 MTCO2e
The 2007 energy and emissions at combined Public Facilities5 were as follows:
Public Facilities total energy use is 95,192,048 kBtu
Indirect emissions (from electricity) 4,164 MTCO2e
Direct emissions (from natural gas) 3,281 MTCO2e
30% savings indirect emissions would equal 1,250 MTCO2e
30% savings direct emissions would equal 984 MTCO2e
Total emissions savings would equal 2,234 MTCO2e
Electricity savings potential6 is 3,009,705 kWh
Natural gas savings potential 7 is 17,217 thousand cf natural gas
Implementation Summary
This action can be accomplished as follows:
Implementation units: 5% emissions reduction
Implementation units needed: 6
Implementation Schedule to achieve 30% reduction in 2007 emissions
2010‐15 2015‐20 2020‐25 2025‐30 2010 to 2030 Total
Percent 5% 10% 10% 5% 30%
No. of units 1 2 2 1 6
MTCO2e 372 745 745 372 2,234
Annual Energy and Utility Cost Savings upon Full Implementation
Upon full implementation, this action may offer the following savings per year.8
Electricity 3,009,705 kWh $722,300
Natural Gas 17,217 thousand cf $168,900
Additional Considerations
Energy Star benchmarking using the EPA Portfolio Manager tool has already been completed by the City for
all municipal and BOE facilities. This enables the City to immediately prioritize retrofits, project longer term
funding needs, and incorporate retrofit needs into funding requests for State and/or Federal funds.
Continued construction of any new facilities shall adhere to more efficient energy standards.
Building retrofits offer potential cost savings in Bridgeport City operating budget due to associated reductions
in utility costs.

Bridgeport Energy Efficiency and Conservation Plan 23
Continued prioritization of facilities consolidation and excess property disposal supports reduction in
municipal sector building emissions.
Cost savings will result from lower utility costs in retrofitted buildings. Energy performance contracting, in
conjunction with federal and state grant monies, will reduce initial outlay of City funds.
The Connecticut Energy Advisory Board, in 2010, established energy efficiency and conservation as the top
priority for energy management in Connecticut. It recommends implementation of all achievable cost
effective measures.
Retrofit of municipal buildings helps sustain employment in the building and related trades. Employment
potential has not been quantified for this action item.
Sub item 1.2 ‐ Reduce Public School emissions
Goal: Achieve 30% reduction in 2007 Public School emissions by 2030.
Annual Savings Potential by 2030 5,778 MTCO2e
The 2007 energy and emissions at Bridgeport public schools9 were as follows:
Schools total energy use is 247,315,910 kBtu
Indirect emissions (from electricity) 8,887 MTCO2e
Direct emissions (from natural gas) 10,371 MTCO2e
30% savings indirect emissions would be 2,666 MTCO2e
30% savings direct emissions would be 3,112 MTCO2e
Total emissions savings would be 5,778 MTCO2e
Electricity savings potential10 is 6,422,350 kWh
Natural gas savings potential11 is 54,422 thousand cf
Implementation Summary
This action can be accomplished as follows:
Implementation units: 5% emissions reduction
Implementation units needed: 6
Implementation Schedule to achieve 30% reduction in 2007 emissions
2010‐15 2015‐20 2020‐25 2025‐30 2010 to 2030 Total
Percent 5% 10% 10% 5% 30%
No. of units 1 2 2 1 6

Bridgeport Energy Efficiency and Conservation Plan 24
MTCO2e 963 1926 1926 963 5,778
Annual Energy and Utility Cost Savings upon Full Implementation
Upon full implementation, this action may offer the following savings per year.12
Electricity 6,422,350 kWh $1,541,400
Natural Gas 54,422 thousand cf $ 533,900
Additional considerations
Energy Star benchmarking using the EPA Portfolio Manager tool has already been completed by the City for
all municipal and BOE facilities. This enables the City to immediately prioritize retrofits and incorporate
retrofit needs into annual funding request to State for school facilities and longer term funding planning.
Continued construction of new, more energy‐efficient facilities shall continue according to the long term
school facilities plan.
Cost savings will result from lower utility costs in retrofitted buildings. Energy performance contracting, in
conjunction with federal and state grant monies, will reduce initial outlay of City funds.
The Connecticut Energy Advisory Board, in 2010, established energy efficiency and conservation as the top
priority for energy management in Connecticut. It recommends implementation of all achievable cost
effective measures.
Retrofit of municipal buildings helps sustain employment in the building and related trades. Employment
potential has not been quantified for this action item.
ACTION 2 RETROFIT COMMERCIAL BUILDINGS
Sub Action 2.1 ‐ UI Small Business Energy Advantage or similar program for 1,000 small businesses
Goal: achieve 25% reduction in 2007 commercial building emissions13 through utility or other
weatherization and retrofit programs.
Annual Savings Potential by 2030 9,679 MTCO2e
Per building average annual savings potential
23,314 kWh14 10 MTCO2e15
Implementation Summary

Bridgeport Energy Efficiency and Conservation Plan 25
This action assumes program implementation in small businesses at 1,000 project sites. This action can be
accomplished as follows:
Implementation unit: 10 project sites
Implementation units needed: 100
Implementation Schedule
2010‐15 2015‐20 2020‐25 2025‐30 2010 to 2030 Total
Percent 0.4 0.3 0.2 0.1 1.00
No. units 40 30 20 10 100
MTCO2e 3,871 2,904 1,936 968 9,679
Annual Energy and Utility Cost Savings upon Full Implementation
Upon full implementation, this action, in its entirety, may offer the following savings per year.16
Electricity 23,314,000 kWh $5,595,000
An average business might save $5,595 in electrical costs per year from taking this action, although savings
may be matched against cost of implementation.
Additional considerations
The UI Small Business Energy Advantage program is an “in‐place” program, funded through a State
Conservation and Efficiency Fund, which provides cost‐effective conservation and load management services
for small business customers. The program includes energy assessments and installation of measures with no
up‐front cost to the customer. The program includes measures such as installation of high‐performance
fixture retrofits, occupancy sensors, cfl’s, LED strips, door heater controls, and/or fan motor controls.
Implementing these measures can provide annual savings on utility bills.
The Connecticut Energy Advisory Board, in 2010, established energy efficiency and conservation as the top
priority for energy management in Connecticut. It recommends implementation of all achievable cost
effective measures.
The CEAB also prioritizes creation of additional financing programs to supplement the utility‐supported
programs, which are currently funded by a small charge on all electric utility bills.17 Bridgeport’s electric
utility, UI, already offers interest free loans on the electric bill financing for measures installed through this
Small Business Program. Most relate to lighting projects and refrigeration controls.
Bridgeport’s in‐place Energy Improvement District (EID) may play a pivotal role in establishing additional
financing programs to expand commercial efficiency and conservation load management program
participation, and supplement financing programs which already exist through the electric and other utility
companies.

Bridgeport Energy Efficiency and Conservation Plan 26
The Bridgeport Regional Business Council (BRBC) and Mayor’s Conservation Corps can provide critical support
roles to the utility companies by expanding outreach to increase participation in this commercial energy‐
saving program.
Measures carried out under the UI Small Business Energy Advantage or similar program are estimated to
create job potential for 91 fulltime equivalent work years.18
Sub Action 2.2 ‐ UI/SCG Energy Opportunities or similar program for 1,000 larger project sites
Goal: achieve 25% reduction in 2007 commercial building emissions using existing utility energy
conservation programs at existing commercial buildings.
Annual Savings Potential by 2030 89,088 MTCO2e
Per building average annual savings potential
97,478 kWh19 40 MTCO2e20
850.4 thousand cf natural gas21 49 MTCO2e22
Implementation Summary
This action assumes program implementation in 1,000 commercial building project sites. This action can be
accomplished as follows:
Implementation unit: 10 project sites
Implementation units needed: 100
Implementation Schedule
2010‐15 2015‐20 020‐25 2025‐30 2010 to 2030 Total
Percent 0.4 0.3 0.2 0.1 1.00
No. units 40 30 20 10 100
MTCO2e 35,635 26,727 17,818 8,909 89,088
Annual Energy and Cost Savings upon Full Implementation
Upon full implementation, this action, in its entirety, may offer the following savings per year.23
Electricity 97,478,000 kWh $23,394,700
Natural Gas 850,400 thousand cf $7,806,700
Implementing these measures can provide annual savings on utility bills. Annual energy‐related savings per
completed building are estimated at over $30,000, although savings may be matched against cost of
implementation.
Bridgeport Energy Efficiency and Conservation Plan 27
Additional Considerations
The UI/SCG Energy Opportunities program is an “in‐place” program, funded through a State Conservation and
Efficiency Fund, and sometimes supplemented by utility‐financing, which provides cost‐effective conservation
and load management services for larger commercial customers.
The Connecticut Energy Advisory Board, in 2010, established energy efficiency and conservation as the top
priority for energy management in Connecticut. It recommends implementation of all achievable cost
effective measures.
The CEAB also prioritizes creation of additional financing programs to supplement the utility‐supported
programs, which are currently funded by a small charge on all electric utility bills.24 Bridgeport’s electric
utility, UI, currently partners with a vendor to offer reduced interest loans (as low as 7% designed to provide
positive cash flow from energy savings) for amounts up to $100,000.
Bridgeport’s in‐place Energy Improvement District (EID) may play a pivotal role in establishing additional
financing programs to expand commercial efficiency and conservation load management program
participation, and supplement financing programs which already exist through the electric and other utility
companies.
The Bridgeport Regional Business Council (BRBC) and Mayor’s Conservation Corps may play a pivotal role in
assisting the utility companies by expanding outreach to increase participation in this commercial energy‐
saving program.
Measures carried out under the UI/SCG Energy Opportunities or similar program are estimated to create
job potential for 2,912 fulltime equivalent work years.25
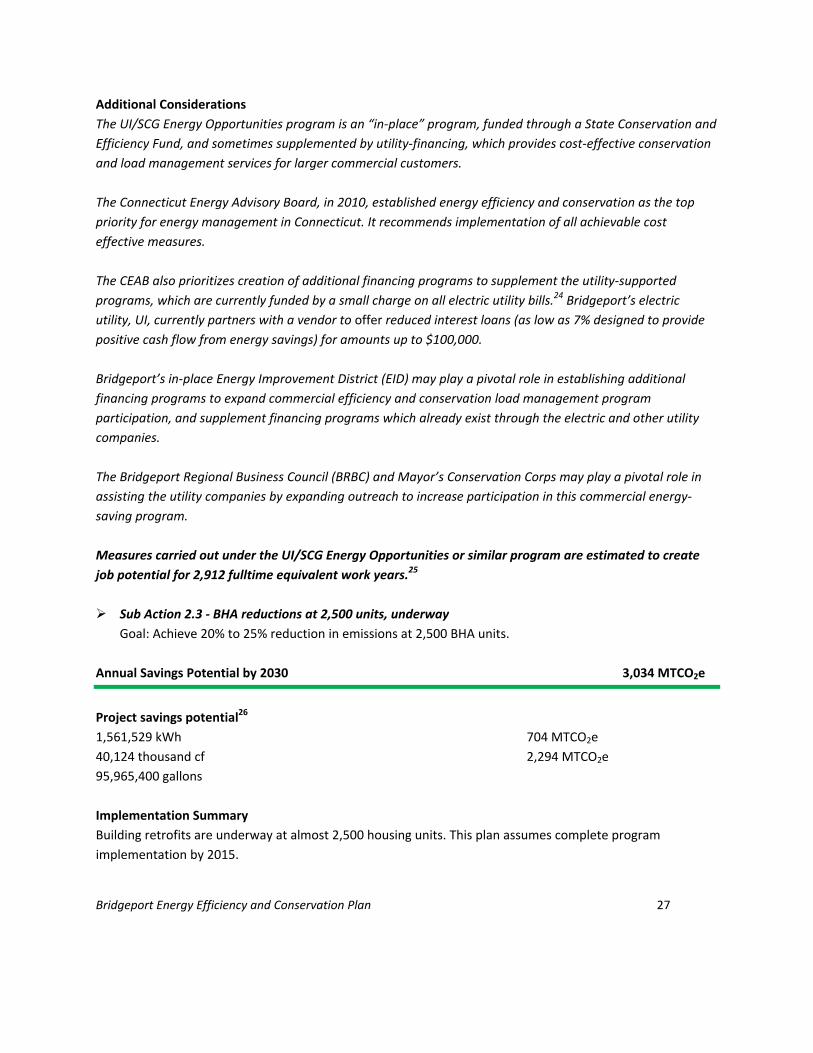
Sub Action 2.3 ‐ BHA reductions at 2,500 units, underway
Goal: Achieve 20% to 25% reduction in emissions at 2,500 BHA units.
Annual Savings Potential by 2030 3,034 MTCO2e
Project savings potential26
1,561,529 kWh 704 MTCO2e
40,124 thousand cf 2,294 MTCO2e
95,965,400 gallons
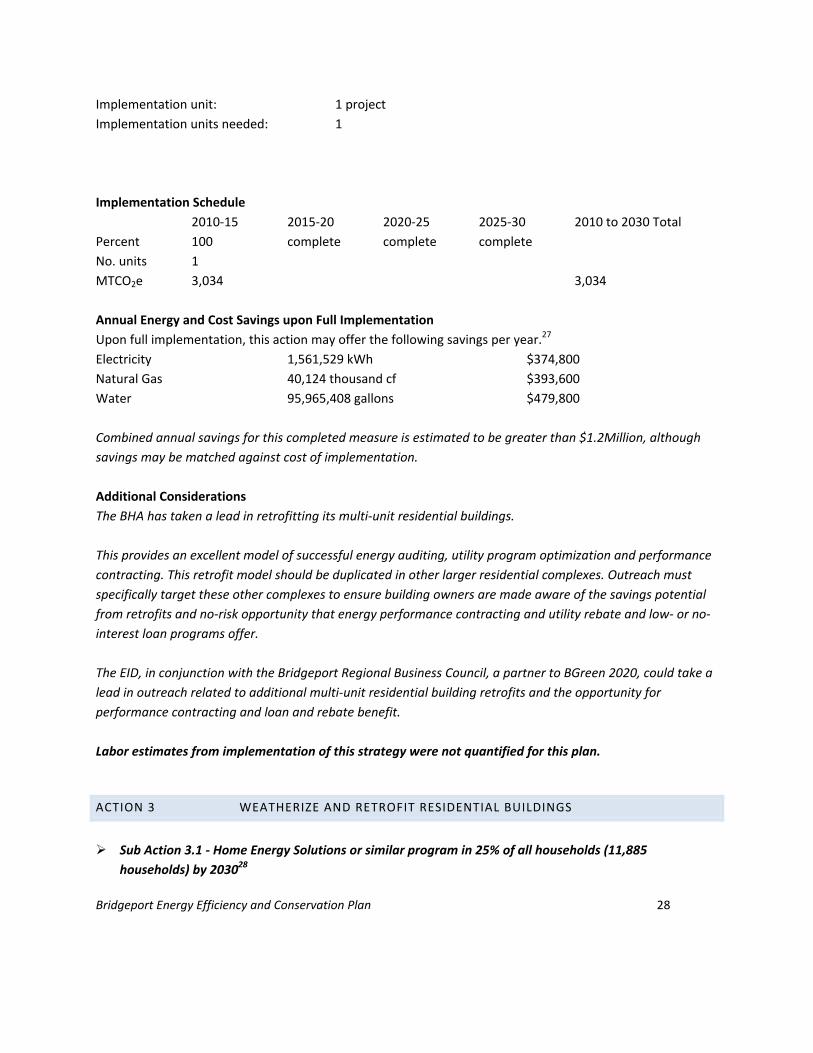
Implementation Summary
Building retrofits are underway at almost 2,500 housing units. This plan assumes complete program
implementation by 2015.
Bridgeport Energy Efficiency and Conservation Plan 28
Implementation unit: 1 project
Implementation units needed: 1
Implementation Schedule
2010‐15 2015‐20 2020‐25 2025‐30 2010 to 2030 Total
Percent 100 complete complete complete
No. units 1
MTCO2e 3,034 3,034
Annual Energy and Cost Savings upon Full Implementation
Upon full implementation, this action may offer the following savings per year.27
Electricity 1,561,529 kWh $374,800
Natural Gas 40,124 thousand cf $393,600
Water 95,965,408 gallons $479,800
Combined annual savings for this completed measure is estimated to be greater than $1.2Million, although
savings may be matched against cost of implementation.
Additional Considerations
The BHA has taken a lead in retrofitting its multi‐unit residential buildings.
This provides an excellent model of successful energy auditing, utility program optimization and performance
contracting. This retrofit model should be duplicated in other larger residential complexes. Outreach must
specifically target these other complexes to ensure building owners are made aware of the savings potential
from retrofits and no‐risk opportunity that energy performance contracting and utility rebate and low‐ or no‐
interest loan programs offer.
The EID, in conjunction with the Bridgeport Regional Business Council, a partner to BGreen 2020, could take a
lead in outreach related to additional multi‐unit residential building retrofits and the opportunity for
performance contracting and loan and rebate benefit.
Labor estimates from implementation of this strategy were not quantified for this plan.
ACTION 3 WEATHERIZE AND RETROFIT RESIDENTIAL BUILDINGS
Sub Action 3.1 ‐ Home Energy Solutions or similar program in 25% of all households (11,885
households) by 203028

Bridgeport Energy Efficiency and Conservation Plan 29
Goal: achieve 10% reduction in existing household emissions through utility or other weatherization and
energy‐savings programs.
Annual Savings Potential by 2030 8,631 MTCO2e
Per household savings potential
1,070 kWh29 0.44 MTCO2e30
6.5 thousand cf 31 0.52 MTCO2e32
0.05625 thousand gallons fuel oil33 0.03 MTCO2e34
Total emissions savings per household 0.73 MTCO2e
Implementation Summary
This action assumes program implementation in 25% of existing households (11,885 households) by 2030.
This action can be accomplished as follows:
Implementation unit: 10 households
Implementation units needed: 1,189
Implementation Schedule
2010‐15 2015‐20 2020‐25 2025‐30 2010 to 2030 Total
Percent 0.4 0.3 0.2 0.1 1.0
No. units 475 357 238 119 1,189
MTCO2e 3,452 2,589 1,726 863 8,631
Annual Energy and Cost Savings upon Full Implementation
Upon full implementation, this action may offer the following savings per year.35
Electricity 12,716,950 kWh $3,052,000
Natural Gas 77,253 thousand cf $1,144,100
Light fuel oil 668 thousand gallons $1,771,600
This action may result in average annual savings per household of approximately $500. The program cost to
participants is $75, or a fee up to $300 for oil customers (depending on federal funding availability to offset
the fee). The value of services in return often exceeds $700.
Additional Considerations
The Home Energy Solutions program includes several simple but effective measures during initial
implementation. These include caulking, installation of attic insulation if needed and accessible, weather‐
stripping around exterior doors, installation of faucet aerators, low‐flow showerheads, pipe insulation close to
boilers, and installation of cfl’s. Additional, more intensive retrofits may be added.
Bridgeport Energy Efficiency and Conservation Plan 30
Weatherization is a relatively inexpensive measure, which has potential to quickly achieve significant energy
and emissions savings.
The Connecticut Energy Advisory Board, in 2010, established energy efficiency and conservation as the top
priority for energy management in Connecticut. It recommends implementation of all achievable cost
effective measures. The Home Energy Solutions program supports this priority.
The CEAB also recommends creation of additional financing programs to supplement the utility‐supported
programs, which are currently funded by a small charge on all electric utility bills.36 Bridgeport’s electric
utility, UI, currently offers loans through a vendor for between $2,500 and $20,000,with interest rates as low
as 0%, for a variety of efficiency measures. To receive 0% financing, comprehensive work, such as new air
conditioning and insulation, must be done.
The EID may play a pivotal role in establishing additional financing programs to expand residential
weatherization participation.
The Mayor’s Conservation Corps may also play a pivotal role by expanding outreach to increase participation
in residential energy‐saving programs. Particular attention must be paid by the Conservation Corps and
utilities to establish a successful mechanism for engaging non‐resident landlords in program participation.
Measures carried out under the Home Energy Solutions, or similar program, are estimated to create job
potential for 48 fulltime equivalent work years.37
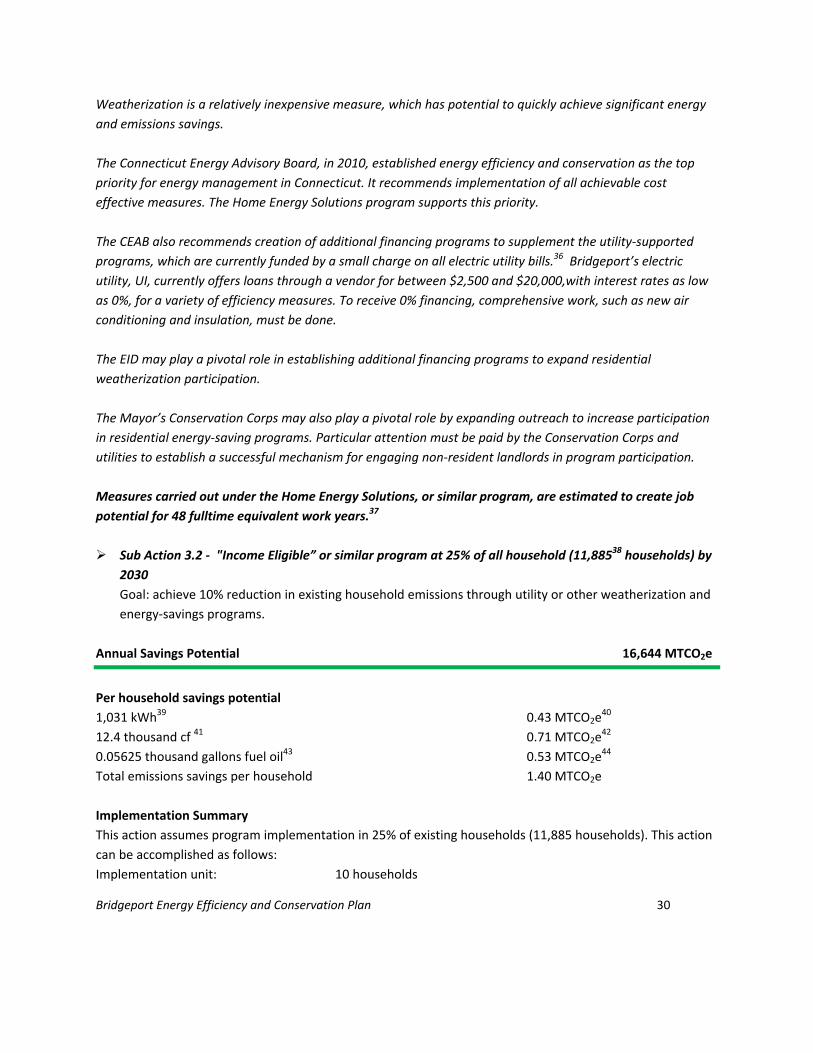
Sub Action 3.2 ‐ "Income Eligible” or similar program at 25% of all household (11,88538 households) by
2030
Goal: achieve 10% reduction in existing household emissions through utility or other weatherization and
energy‐savings programs.
Annual Savings Potential 16,644 MTCO2e
Per household savings potential
1,031 kWh39 0.43 MTCO2e40
12.4 thousand cf 41 0.71 MTCO2e42
0.05625 thousand gallons fuel oil43 0.53 MTCO2e44
Total emissions savings per household 1.40 MTCO2e
Implementation Summary
This action assumes program implementation in 25% of existing households (11,885 households). This action
can be accomplished as follows:
Implementation unit: 10 households
Bridgeport Energy Efficiency and Conservation Plan 31
Implementation units needed: 1,189
Implementation Schedule
2010‐15 2015‐20 2020‐25 2025‐30 2010 to 2030 Total
Percent 0.4 0.3 0.2 0.1 1.0
No. units 475 357 238 119 1,189
MTCO2e 6,658 4,993 3,329 1,664 16,644
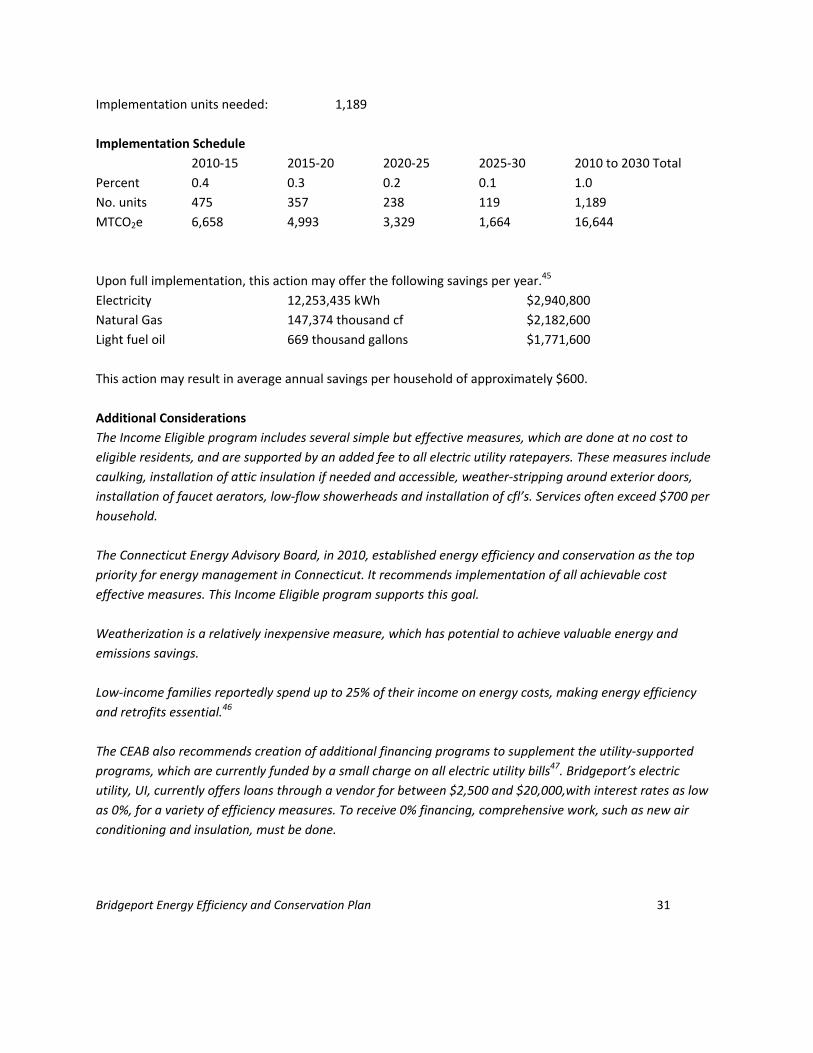
Upon full implementation, this action may offer the following savings per year.45
Electricity 12,253,435 kWh $2,940,800
Natural Gas 147,374 thousand cf $2,182,600
Light fuel oil 669 thousand gallons $1,771,600
This action may result in average annual savings per household of approximately $600.
Additional Considerations
The Income Eligible program includes several simple but effective measures, which are done at no cost to
eligible residents, and are supported by an added fee to all electric utility ratepayers. These measures include
caulking, installation of attic insulation if needed and accessible, weather‐stripping around exterior doors,
installation of faucet aerators, low‐flow showerheads and installation of cfl’s. Services often exceed $700 per
household.
The Connecticut Energy Advisory Board, in 2010, established energy efficiency and conservation as the top
priority for energy management in Connecticut. It recommends implementation of all achievable cost
effective measures. This Income Eligible program supports this goal.
Weatherization is a relatively inexpensive measure, which has potential to achieve valuable energy and
emissions savings.
Low‐income families reportedly spend up to 25% of their income on energy costs, making energy efficiency
and retrofits essential.46
The CEAB also recommends creation of additional financing programs to supplement the utility‐supported
programs, which are currently funded by a small charge on all electric utility bills47. Bridgeport’s electric
utility, UI, currently offers loans through a vendor for between $2,500 and $20,000,with interest rates as low
as 0%, for a variety of efficiency measures. To receive 0% financing, comprehensive work, such as new air
conditioning and insulation, must be done.

Bridgeport Energy Efficiency and Conservation Plan 32
The EID may play a pivotal role in establishing additional financing programs to expand residential
weatherization participation.
The Mayor’s Conservation Corps may also play a pivotal role by expanding outreach to increase participation
in residential energy‐saving programs. Particular attention must be paid by the Conservation Corps and
utilities to establish a successful mechanism for engaging non‐resident landlords in program participation,
since many income‐eligible customers may also rent, rather than own.
Measures carried out under the Home Energy Solutions, or similar program, are estimated to create job
potential for 48 fulltime equivalent work years.48
Sub Action 3.3 ‐ Insulate residential buildings
Goal: Achieve 10% reduction in existing single building residential emissions by installing ceiling
insulation.49
Annual Savings Potential by 2030 1,585 MTCO2e
Per building savings potential
829.92 kWh (if electric heated)50 0.344 MTCO2e51
3.724 thousand cf (if gas heated)52 0.213 MTCO2e53
0.0266 thousand gallons fuel oil (if oil heated)54 0.249 MTCO2e55
Total emissions savings per building56 0.231 MTCO2e
Implementation Summary
This action assumes program implementation in 6,860 residential buildings57 (not households) by 2030. This
action can be accomplished as follows:
Implementation unit: 10 buildings
Implementation units needed: 686
Implementation Schedule
2010‐15 2015‐20 2020‐25 2025‐30 2010 to 2030 Total
Percent 0.4 0.3 0.2 0.1 1.0
No. units 475 357 238 119 1,189
MTCO2e 634 475 317 158 1,585
Upon full implementation, this action may offer the following savings per year.58
Natural Gas 12,773.32 thousand cf $189,200
Light fuel oil 91.24 thousand gallons $511,300

Bridgeport Energy Efficiency and Conservation Plan 33
This action may result in average annual savings per building of approximately $75.
Additional Considerations
This home insulation program is considered separate and apart from other utility company programs, such as
the Home Energy Solutions program and Income Eligible program, which also may include ceiling insulation if
needed and accessible.
The Connecticut Energy Advisory Board, in 2010, established energy efficiency and conservation as the top
priority for energy management in Connecticut. It recommends implementation of all achievable cost
effective measures.
Weatherization is a relatively inexpensive measure, which has potential to achieve significant energy and
emissions savings.
The CEAB also recommends creation of additional financing programs to supplement the utility‐supported
programs, which are currently funded by a small charge on all electric utility bills.59. Bridgeport’s electric
utility, UI, currently offers loans through a vendor for between $2,500 and $20,000,with interest rates as low
as 0%, for a variety of efficiency measures. To receive 0% financing, comprehensive work, such as new air
conditioning and insulation, must be done.
The EID may play a pivotal role in establishing additional financing programs to expand residential
weatherization participation.
The Mayor’s Conservation Corps may also play a pivotal role by expanding outreach to increase participation
in residential energy‐saving programs. Particular attention must be paid by the Conservation Corps and
utilities to establish a successful mechanism for engaging non‐resident landlords in program participation.
Measures carried out under the ceiling insulation program, are estimated to create job potential for 55
fulltime equivalent work years60.
Several training programs already exist in Bridgeport to prepare residents for employment related to this
type of action. These include the Bridgeport Small and Minority Business Center training for building retrofits,
the WorkPlace’s “Green Up” program, which links with numerous other existing training programs, and the
Greater Bridgeport Community Enterprises (Green Team) programs.
Sub Action 3.4 ‐ DIY Weatherization
Goal: achieve 10% reduction in household emissions through do‐it‐yourself weatherization measures in
5% of existing households.
Annual Savings Potential by 2030 1,440 MTCO2e

Bridgeport Energy Efficiency and Conservation Plan 34
Per household savings potential
695 kWh61 0.29 MTCO2e62
3.57 thousand cf natural gas 0.20 MTCO2e
0.0098 thousand gallons fuel oil 0.10 MTCO2e
Total emissions savings per building 0.60 MTCO2e
Implementation Summary
This action assumes program implementation in 2,420 households by 2030, and assumes certain
homeowners will perform insulation procedures on their own, apart from available utility programs. This
action can be accomplished as follows:
Implementation unit: 10 buildings
Implementation units needed: 242
Implementation Schedule
2010‐15 2015‐20 2020‐25 2025‐30 2010 to 2030 Total
Percent 0.4 0.3 0.2 0.1 1.0
No. units 97 73 48 24 242
MTCO2e 576 432 288 144 1,440
Upon full implementation, this action may offer the following savings per year.63
Electricity 1,681,858 kWh $403,600
Natural Gas 8,642 thousand cf $128,000
Light fuel oil 23.63 thousand gallons $62,600
This action may result in average annual savings per household of approximately $240.
Additional Considerations
Weatherization is a relatively inexpensive measure, which has potential to achieve significant energy and
emissions savings. This strategy assumes certain residents or building owners will pursue building insulation
on their own, separate from utility programs. The cost of this measure will be the cost of insulation alone, not
labor.
The Connecticut Energy Advisory Board, in 2010, established energy efficiency and conservation as the top
priority for energy management in Connecticut. It recommends implementation of all achievable cost
effective measures.
The CEAB also recommends creation of additional financing programs to supplement the utility‐supported
programs, which are currently funded by a small charge on all electric utility bills.

Bridgeport Energy Efficiency and Conservation Plan 35
The EID may play a pivotal role in establishing additional financing programs to expand residential
weatherization participation.
The Mayor’s Conservation Corps may also play a pivotal role by expanding outreach to increase participation
in residential energy‐saving programs. Particular attention must be paid by the Conservation Corps and
utilities to establish a successful mechanism for engaging non‐resident landlords in program participation.
This action item involves self‐installation of insulation and creates only indirect employment opportunities.
ACTION 4 EFFICIENT APPLIANCES, FIXTURES AND BULBS
Sub Action 4.1 ‐ Install 4 energy efficient light bulbs in all households = 47,543 households = 190,172
bulbs initial install
Goal: Conserve residential energy through a switch to 75% more efficient light bulbs.
Annual Savings Potential by 2030 4,843 MTCO2e
Per household savings potential
Electricity 245.3652 kWh64 0.1019 MTCO2e65
Implementation Summary
This action assumes installation of 4 cfl bulbs in 47,543 existing households.66
This action can be accomplished as follows:
Implementation unit: 10 households
Implementation units needed: 4,745
Implementation Schedule
2010‐15 2015‐20 2020‐25 2025‐30 2010 to 2030 Total
Percent 0.4 0.3 0.2 0.1 1.0
No. units 2,853 1,902 0 0 4,745
MTCO2e 2906 1,937 0 0 4,843
Upon full implementation, this action may offer the following savings per year.67
Electricity 11,665,398 kWh $2,799,700
This action may result in average annual savings per household of approximately $60, which is partially offset
by the higher initial cost of the bulbs.

Bridgeport Energy Efficiency and Conservation Plan 36
Additional Considerations
During 2010, a light bulb sales program is being offered as a fund‐raising opportunity for schools and other
community groups through the Connecticut Clean Energy Fund. Bulk quantity bulbs are available for less than
market value, which enables profits to be placed toward organizational fundraising goals.68 In addition,
nontraditional bulb distribution opportunities may exist through routine outreach programs of such entities as
Meals on Wheels, Fire Department inspections, Police Department outreach, and Building Inspector
inspections.
Lighting represents approximately 9% of home electric use.69 This is an easy opportunity to save energy,
money and emissions.
This action assumes installation of light bulbs separate and distinct from bulb installation associated with
utility programs cited in other Energy Plan Action items 3.1 Home Energy Solutions and 3.2 Income Eligible,
which both include bulb installation.
Utility companies note that general service bulbs have become increasingly prevalent in households but that
specialty light bulb use has lagged. Utility programs plan to place more emphasis on expanding installation of
specialty bulbs.70
This action item involves self‐installation of light bulbs and creates only indirect employment opportunities.
Sub Action 4.2 ‐ Refrigerator Trade‐Ins
Goal: Trade in inefficient refrigerators and freezers in 5% of all households.
Annual Savings Potential by 2030 18 MTCO2e
Per household savings potential
24 kWh71 0.01 MTCO2e72
Implementation Summary
This action assumes refrigerator or freezer trade‐in in 5% of Bridgeport households, which equals 2,378
households. It assumes refrigerator trade‐ins will account for 75% of this total, which equals 1,783 inefficient
refrigerators.
This action can be accomplished as follows:
Implementation unit: 10 appliances
Implementation units needed: 178
Bridgeport Energy Efficiency and Conservation Plan 37
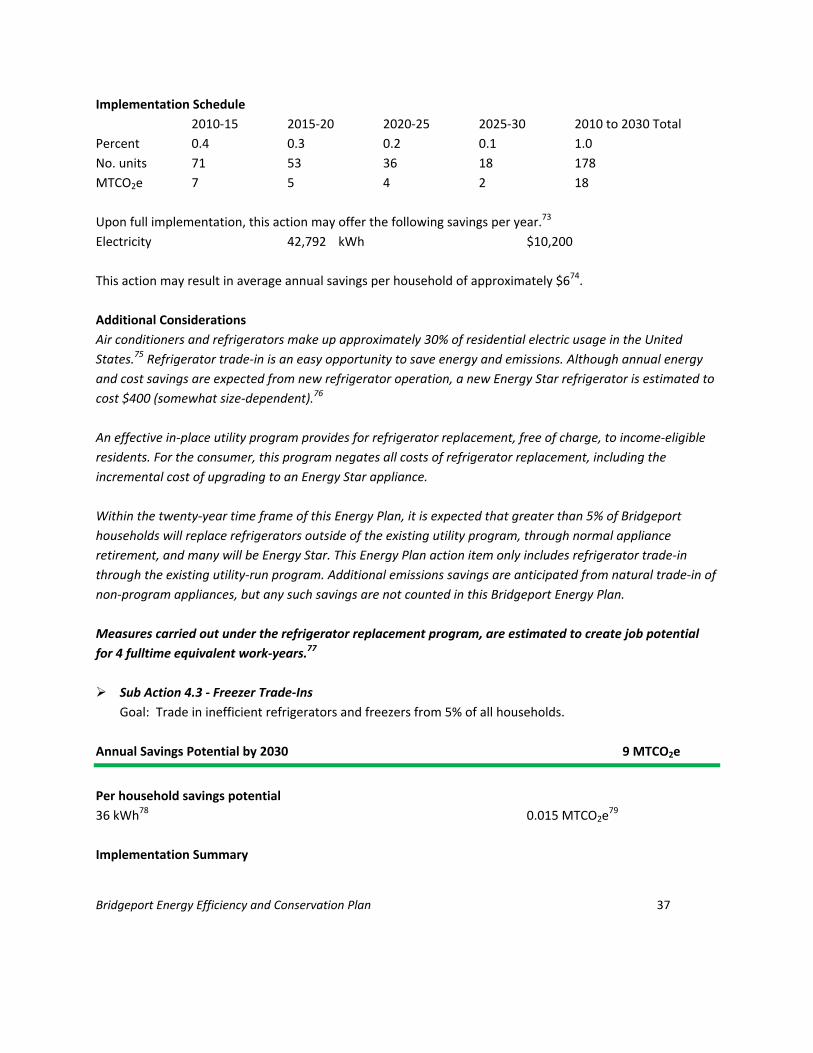
Implementation Schedule
2010‐15 2015‐20 2020‐25 2025‐30 2010 to 2030 Total
Percent 0.4 0.3 0.2 0.1 1.0
No. units 71 53 36 18 178
MTCO2e 7 5 4 2 18
Upon full implementation, this action may offer the following savings per year.73
Electricity 42,792 kWh $10,200
This action may result in average annual savings per household of approximately $674.
Additional Considerations
Air conditioners and refrigerators make up approximately 30% of residential electric usage in the United
States.75 Refrigerator trade‐in is an easy opportunity to save energy and emissions. Although annual energy
and cost savings are expected from new refrigerator operation, a new Energy Star refrigerator is estimated to
cost $400 (somewhat size‐dependent).76
An effective in‐place utility program provides for refrigerator replacement, free of charge, to income‐eligible
residents. For the consumer, this program negates all costs of refrigerator replacement, including the
incremental cost of upgrading to an Energy Star appliance.
Within the twenty‐year time frame of this Energy Plan, it is expected that greater than 5% of Bridgeport
households will replace refrigerators outside of the existing utility program, through normal appliance
retirement, and many will be Energy Star. This Energy Plan action item only includes refrigerator trade‐in
through the existing utility‐run program. Additional emissions savings are anticipated from natural trade‐in of
non‐program appliances, but any such savings are not counted in this Bridgeport Energy Plan.
Measures carried out under the refrigerator replacement program, are estimated to create job potential
for 4 fulltime equivalent work‐years.77
Sub Action 4.3 ‐ Freezer Trade‐Ins
Goal: Trade in inefficient refrigerators and freezers from 5% of all households.
Annual Savings Potential by 2030 9 MTCO2e
Per household savings potential
36 kWh78 0.015 MTCO2e79
Implementation Summary
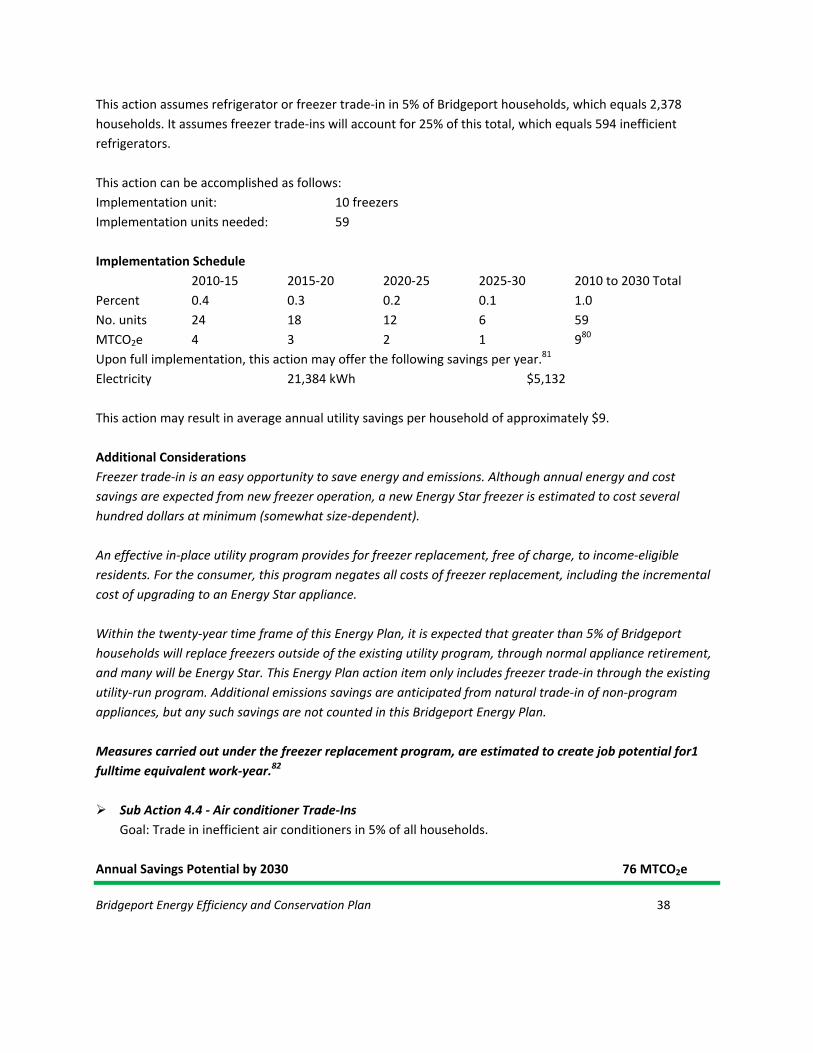
Bridgeport Energy Efficiency and Conservation Plan 38
This action assumes refrigerator or freezer trade‐in in 5% of Bridgeport households, which equals 2,378
households. It assumes freezer trade‐ins will account for 25% of this total, which equals 594 inefficient
refrigerators.
This action can be accomplished as follows:
Implementation unit: 10 freezers
Implementation units needed: 59
Implementation Schedule
2010‐15 2015‐20 2020‐25 2025‐30 2010 to 2030 Total
Percent 0.4 0.3 0.2 0.1 1.0
No. units 24 18 12 6 59
MTCO2e 4 3 2 1 980
Upon full implementation, this action may offer the following savings per year.81
Electricity 21,384 kWh $5,132
This action may result in average annual utility savings per household of approximately $9.
Additional Considerations
Freezer trade‐in is an easy opportunity to save energy and emissions. Although annual energy and cost
savings are expected from new freezer operation, a new Energy Star freezer is estimated to cost several
hundred dollars at minimum (somewhat size‐dependent).
An effective in‐place utility program provides for freezer replacement, free of charge, to income‐eligible
residents. For the consumer, this program negates all costs of freezer replacement, including the incremental
cost of upgrading to an Energy Star appliance.
Within the twenty‐year time frame of this Energy Plan, it is expected that greater than 5% of Bridgeport
households will replace freezers outside of the existing utility program, through normal appliance retirement,
and many will be Energy Star. This Energy Plan action item only includes freezer trade‐in through the existing
utility‐run program. Additional emissions savings are anticipated from natural trade‐in of non‐program
appliances, but any such savings are not counted in this Bridgeport Energy Plan.
Measures carried out under the freezer replacement program, are estimated to create job potential for1
fulltime equivalent work‐year.82
Sub Action 4.4 ‐ Air conditioner Trade‐Ins
Goal: Trade in inefficient air conditioners in 5% of all households.
Annual Savings Potential by 2030 76 MTCO2e

Bridgeport Energy Efficiency and Conservation Plan 39
Per household savings potential
77 kWh83 0.03 MTCO2e84
Implementation Summary
This action assumes air conditioner trade‐in in 5% of Bridgeport households, which equals 2,378 households.
This action can be accomplished as follows:
Implementation unit: 10 appliances
Implementation units needed: 237
Implementation Schedule
2010‐15 2015‐20 2020‐25 2025‐30 2010 to 2030 Total
Percent 0.4 0.3 0.2 0.1 1.0
No. units 95 71 47 24 237
MTCO2e 30 23 15 8 76
Upon full implementation, this action may offer the following savings per year.85
Electricity 183,356 kWh $44,000
This action may result in average annual utility savings per household of approximately $19.86
Additional Considerations
Air conditioners and refrigerators make up approximately 30% of residential electric usage in the United
States.87 Room air conditioner trade‐in is an easy opportunity to save energy and emissions. Although annual
energy and cost savings are expected from new air conditioner operation, a new Energy Star air conditioner is
estimated to cost $150 (somewhat size‐dependent).88
An effective in‐place utility program provides for air conditioner replacement, free of charge, to income‐
eligible residents. For the consumer, this program negates all costs of air conditioner replacement, including
the incremental cost of upgrading to an Energy Star appliance.
Within the twenty‐year time frame of this Energy Plan, it is expected that greater than 5% of Bridgeport
households will replace air conditioners outside of the existing utility program, through normal appliance
retirement, and many will be Energy Star. This Energy Plan action item only includes air conditioner trade‐in
through the existing utility‐run program. Additional emissions savings are anticipated from natural trade‐in of
non‐program appliances, but any such savings are not counted in this Bridgeport Energy Plan.
Measures carried out under the air conditioner replacement program, are estimated to create job potential
for 7 fulltime equivalent work‐years.

Bridgeport Energy Efficiency and Conservation Plan 40
Sub Action 4.5 ‐ Clothes washer trade‐ins
Goal: Trade in inefficient clothes washers from 30% of all households.
Annual Savings Potential by 2030 134 MTCO2e
Per household savings potential
17 kWh89 0.0071 MTCO2e90
0.012 thousand cf natural gas 0.0007 MTCO2e
0.00018 thousand gallons fuel oil 0.0016 MTCO2e
Implementation Summary
This action assumes installation of more efficient clothes washers in 14,263 households over a 20 year
period.
This action can be accomplished as follows:
Implementation unit: 10 washers
Implementation units needed: 1,426
Implementation Schedule
2010‐15 2015‐20 2020‐25 2025‐30 2010 to 2030 Total
Percent 0.25 0.25 0.25 0.25 1.0
No. units 357 357 357 57 1,426
MTCO2e 33.62 33.62 33.62 33.62 1,426
Upon full implementation, this action may offer the following savings per year.91
Electricity 242,471 kWh $58,200
Natural Gas 171 thousand cf $2,500
Light fuel oil 3 thousand gallons $6,800
This action may result in average annual utility savings per household of approximately $5 plus minimal water
costs.
Additional Considerations
An in‐place utility program provides for clothes washer replacement, free of charge, to income‐eligible
residents, but this is not as great a priority program as freezer or air conditioner replacement programs. This
Energy Plan considers natural retirement of clothes washers beyond the existing utility program. Within the
twenty‐year time frame of this Energy Plan, it is assumed that one quarter of Bridgeport households will
replace clothes washers.

Bridgeport Energy Efficiency and Conservation Plan 41
Measures carried out under the clothes washer replacement program, are estimated to create job potential
for 29 fulltime equivalent work‐years.92
Sub Action 4.6 ‐ Dishwasher Trade‐ins
Goal: Trade in dishwashers in 50% of households, which is 23,772 households by 2030.
Annual Savings Potential by 2030 132 MTCO2e
Per household savings potential
3 kWh93 0.001 MTCO2e94
0.016 thousand cf natural gas 0.001 MTCO2e
0.00036 thousand gallons fuel oil 0.003 MTCO2e
Implementation Summary
This action assumes installation of more efficient dishwashers in 23,772 households over a 20 year period of
natural retirement.
This action can be accomplished as follows:
Implementation unit: 10 dishwashers
Implementation units needed: 2,377
Implementation Schedule
2010‐15 2015‐20 2020‐25 2025‐30 2010 to 2030 Total
Percent 0.25 0.25 0.25 0.25 1.0
No. units 594 594 594 594 2,377
MTCO2e 32.88 32.88 32.88 32.88 132
Upon full implementation, this action may offer the following savings per year.95
Electricity 71,316 kWh $17,100
Natural Gas 380 thousand cf $5,600
Light fuel oil 9 thousand gallons $22,700
This action may result in average annual utility savings per household of approximately $2 plus minimal water
savings.
Additional Considerations
An in‐place utility program provides for dishwasher replacement, free of charge, to income‐eligible residents,
but this is not as great a priority program as freezer or air conditioner replacement programs. This Energy
Plan considers natural retirement of dishwashers beyond the existing utility program. Within the twenty‐year
time frame of this Energy Plan, it is assumed that one half of Bridgeport households will replace dishwashers.

Bridgeport Energy Efficiency and Conservation Plan 42
Measures carried out under the dishwasher trade‐in program are estimated to create job potential for 48
fulltime equivalent work‐years.
Sub Action 4.7 ‐ Low flow showerhead installation
Goal: Install Low Flow Showerheads in 20% of existing households.
Annual Savings Potential by 2030 1,966 MTCO2e96
Per household savings potential
27.5194 kWh97 0.0114 MTCO2e98
1.458 thousand cf natural gas 0.0834 MTCO2e
0.0120 thousand gallons fuel oil 0.1120 MTCO2e
Implementation Summary
This action assumes installation of one low flow showerhead in 9,508 households (20% of existing
households) through actions which are separate from CEEF‐supported utility programs.
This action can be accomplished as follows:
Implementation unit: 10 households
Implementation units needed: 951
Implementation Schedule
2010‐15 2015‐20 2020‐25 2025‐30 2010 to 2030 Total
Percent 0.4 0.3 0.2 0.1 1.0
No. units 380 285 190 95 951
MTCO2e 786 590 393 197 1,966
Upon full implementation, this action may offer the following savings per year.99
Electricity 261,654 kWh $62,800
Natural Gas 13, 863 thousand cf $205,300
Light fuel oil 114 thousand gallons $301,200
This action may result in average annual utility savings per household of approximately $60 plus water
savings.
Additional Considerations
This action assumes installation of low flow showerheads separate and distinct from showerhead installation
associated with utility programs cited in Energy Plan Action items 3.1 Home Energy Solutions and 3.2 Income
Eligible, which both include showerhead installation, if feasible.

Bridgeport Energy Efficiency and Conservation Plan 43
Showerheads can be easy to install in some applications, but not all. Installing a low flow showerhead saves
water. Equally important, it reduces hot water flow. This means less fuel is needed to heat water, so
additional savings result.
Measures carried out under the showerhead installation program, are estimated to create job potential for
2 fulltime equivalent work‐years.100
Sub Action 4.8 ‐ Faucet aerator installation
Goal: Install water flow‐reducing aerators in 20% of existing households.
Annual Savings Potential by 2030 117 MTCO2e
101
Per household savings potential
1.6464 kWh electricity102 0.001 MTCO2e103
0.0852 thousand cf natural gas 0.005 MTCO2e
0.0008 thousand gallons fuel oil 0.007 MTCO2e
Implementation Summary
This action assumes installation of two water‐reducing faucet aerators in 9,508 households (20% of existing
households) through actions which are separate from CEEF‐supported utility programs.
This action can be accomplished as follows:
Implementation unit: 10 households
Implementation units needed: 951
Implementation Schedule
2010‐15 2015‐20 2020‐25 2025‐30 2010 to 2030 Total
Percent 0.4 0.3 0.2 0.1 1.0
No. units 380 285 190 95 951
MTCO2e 47 35 23 12 117
Upon full implementation, this action may offer the following savings per year.104
Electricity 15,654 kWh $3,800
Natural Gas 810 thousand cf $12,000
Light fuel oil 7 thousand gallons $18,100
This action may result in average annual utility savings per household of approximately $3 plus water savings.

Bridgeport Energy Efficiency and Conservation Plan 44
Additional Considerations
This action assumes installation of 2 faucet aerators separate and distinct from aerator installation associated
with utility programs cited in Energy Plan Action items 3.1 Home Energy Solutions and 3.2 Income Eligible,
which both include aerator installation, if feasible.
Aerators cost less than $1 each. They are easy to install in most applications, but not all. Aerators are low‐cost
money‐savers, bringing savings on water bills and water heating costs.
Aquarion, the water supply company, has an in‐place program for water education and outreach in a number
of schools. In some instances, aerators are included as “give‐aways” in these programs.
Faucet aerators are assumed to be self‐installed so it is estimated that this action item only creates indirect
employment opportunities.
Sub Action 4.9 ‐ Install on‐demand gas water heaters
Goal: Replace 15% of existing residential gas fueled water heaters with high efficiency gas water heating
system‐ indirect or on‐demand.
Annual Savings Potential by 2030 1,239 MTCO2e
Per household savings potential
6.085 thousand cf natural gas105 0.348 MTCO2e106
Implementation Summary
This action assumes installation of residential gas fueled water heaters with high efficiency gas water heating
system – indirect or on‐demand in 3,560 existing households.
This action can be accomplished as follows:
Implementation unit: 10 households
Implementation units needed: 356
Implementation Schedule
2010‐15 2015‐20 2020‐25 2025‐30 2010 to 2030 Total
Percent 0.3 0.4 0.2 0.1 1.0
No. units 107 142 71 36 356
MTCO2e 372 495 248 124 1,239
Upon full implementation, this action may offer the following savings per year.107
Natural Gas 21,663 thousand cf $320,800

Bridgeport Energy Efficiency and Conservation Plan 45
This action may result in average annual utility savings per building of approximately $90.
Additional Considerations
This action item proposes to tie into an existing utility program, which offers a $300 rebate for installation of
certain indirect heating or on‐demand tankless water heaters.
After house heating and cooling, hot water heating is the next largest energy user in most homes. Tankless
water heaters can reduce energy consumption for water heating by 10% to 15% because it eliminates losses,
which occur when no hot water is being used.108 On‐demand gas‐fired units or, for oil‐customers, indirect
tank, or integrated systems, are more efficient than most systems in use today, particularly electric‐ water
heater systems.
Installation of tankless or on‐demand water heating systems described in this action item is estimated to
create job potential for 9 fulltime equivalent work‐years.109
ACTION 5 BUILD GREEN
Sub Action 5.1 ‐ Residential Green Building (includes 5.1.a, 5.1.b, 5.1.c)
Sub Action 5.1.a ‐ Retrofit existing residential buildings
Goal: Achieve 25% savings in nearly three quarters of existing households through green building
retrofits.
Annual Savings Potential by 2030 49,520 MTCO2e
Per household savings potential
1, 737 kWh110 0.721 MTCO2e111
8.93 thousand cf natural gas 0.511 MTCO2e
0.024 gallons fuel oil 0.258 MTCO2e
Implementation Summary
This action assumes performance of green building measures related to energy systems and building
envelopes in 33,280 households, which is 70% of existing households. Although included in the “Build
Green” section, the measures proposed by Sub Action 5.1.a do not relate to complete new construction.
This Sub Action assumes completion of intensive retrofit measures to improve envelope plus energy system
efficiency. These measures include such actions as new heating system installation, programmable
thermostat installation and window and door retrofit, distinct from the less intensive retrofit measures in
Action 3 of this Bridgeport Energy Plan (caulking, weather‐stripping, light bulb switch outs, water flow
reduction measures and ceiling insulation, etc).

Bridgeport Energy Efficiency and Conservation Plan 46
This action can be accomplished as follows:
Implementation unit: 10 households
Implementation units needed: 3,328
Implementation Schedule
2010‐15 2015‐20 2020‐25 2025‐30 2010 to 2030 Total
Percent 0.2 0.3 0.4 0.1 1.0
No. units 665 998 1,331 332 3,328
MTCO2e 9,904 14,856 19,808 4,952 49,520
Upon full implementation, this action may offer the following savings per year.112
Electricity 57,822,566 kWh $13,877,400
Natural Gas 297,123 thousand cf $4,400,400
Light fuel oil 813 thousand gallons $2,153,200
This action may result in average annual utility savings per building of approximately $600. Initial investment
will likely cost tens of thousands of dollars.
Additional Considerations
New heating (and in some instances) cooling systems are expected to replace less efficient units in many
residential buildings through natural replacement during the next twenty years, bringing reduced energy use
and emissions. Building envelope retrofit is essential to optimizing savings, but is less likely to occur since
natural replacement cycle of windows is considerably longer than that of heating/cooling systems and the
same “necessity” of action does not exist.
On average, it costs less than 2% more to retrofit buildings in a green manner than not, and buildings are
increasingly being built to LEED certified levels at little or no extra cost.113 Green building has been reported to
have 20‐year net benefits ranging from $50 to $65 per square foot.114
In‐place utility company programs currently provide some financial incentive to heating/cooling system
replacement. Financial incentive programs for upgrading building envelopes could be a key factor in achieving
greater energy and emissions savings. Bridgeport’s electric utility, UI, currently offers loans through a vendor
for between $2,500 and $20,000, with interest rates as low as 0%, for a variety of efficiency measures. To
receive 0% financing, comprehensive work, such as new air conditioning and insulation, must be done
Bridgeport’s recently amended zoning regulations enable the construction of many thousand new households
through infill of the existing building grid. This represents a tremendous opportunity to beneficially impact the
regional emissions load. Buildings which are underutilized, and undergo expansion, complete renovation
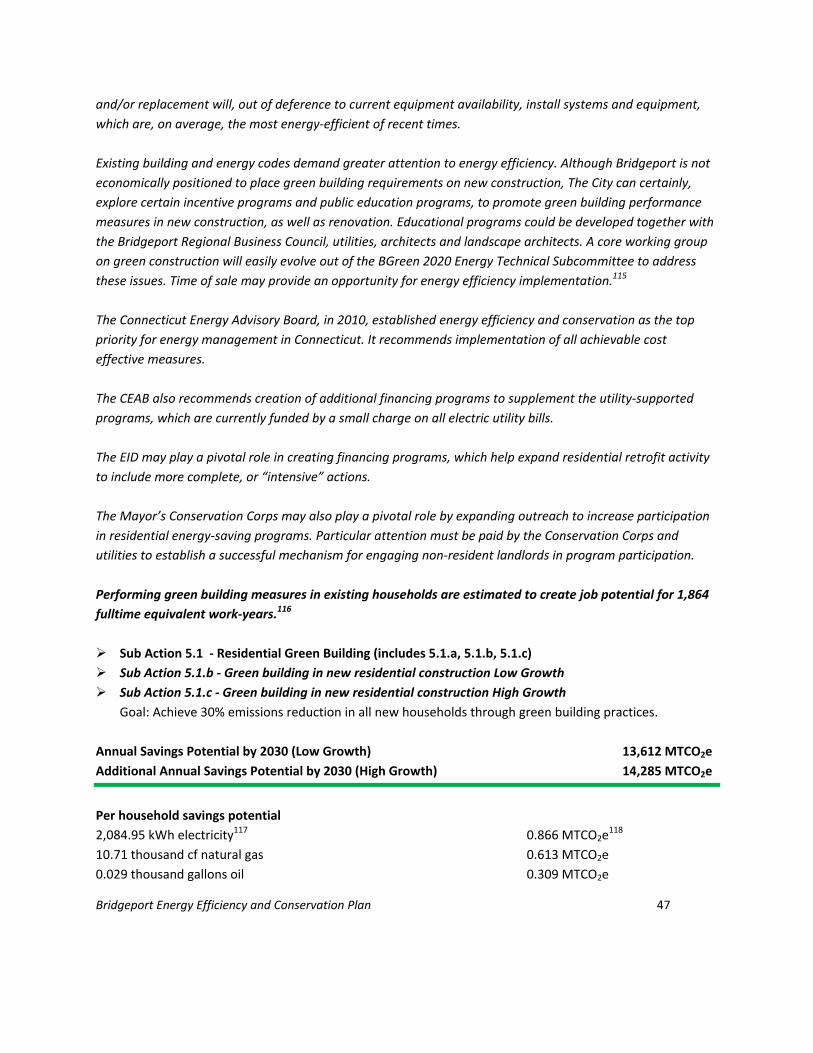
Bridgeport Energy Efficiency and Conservation Plan 47
and/or replacement will, out of deference to current equipment availability, install systems and equipment,
which are, on average, the most energy‐efficient of recent times.
Existing building and energy codes demand greater attention to energy efficiency. Although Bridgeport is not
economically positioned to place green building requirements on new construction, The City can certainly,
explore certain incentive programs and public education programs, to promote green building performance
measures in new construction, as well as renovation. Educational programs could be developed together with
the Bridgeport Regional Business Council, utilities, architects and landscape architects. A core working group
on green construction will easily evolve out of the BGreen 2020 Energy Technical Subcommittee to address
these issues. Time of sale may provide an opportunity for energy efficiency implementation.115
The Connecticut Energy Advisory Board, in 2010, established energy efficiency and conservation as the top
priority for energy management in Connecticut. It recommends implementation of all achievable cost
effective measures.
The CEAB also recommends creation of additional financing programs to supplement the utility‐supported
programs, which are currently funded by a small charge on all electric utility bills.
The EID may play a pivotal role in creating financing programs, which help expand residential retrofit activity
to include more complete, or “intensive” actions.
The Mayor’s Conservation Corps may also play a pivotal role by expanding outreach to increase participation
in residential energy‐saving programs. Particular attention must be paid by the Conservation Corps and
utilities to establish a successful mechanism for engaging non‐resident landlords in program participation.
Performing green building measures in existing households are estimated to create job potential for 1,864
fulltime equivalent work‐years.116
Sub Action 5.1 ‐ Residential Green Building (includes 5.1.a, 5.1.b, 5.1.c)
Sub Action 5.1.b ‐ Green building in new residential construction Low Growth
Sub Action 5.1.c ‐ Green building in new residential construction High Growth
Goal: Achieve 30% emissions reduction in all new households through green building practices.
Annual Savings Potential by 2030 (Low Growth) 13,612 MTCO2e
Additional Annual Savings Potential by 2030 (High Growth) 14,285 MTCO2e
Per household savings potential
2,084.95 kWh electricity117 0.866 MTCO2e118
10.71 thousand cf natural gas 0.613 MTCO2e
0.029 thousand gallons oil 0.309 MTCO2e

Bridgeport Energy Efficiency and Conservation Plan 48
Implementation Summary
This action assumes performance of green building measures related to energy systems and building
envelopes, which will achieve 30% emissions savings in 7,623 new households under the Low Growth
Scenario (Sub Action 5.2) and 8,000 new households under the High Growth Scenario (Sub Action 5.3).
Sub Action 5.1.b (Low Growth) can be accomplished as follows:
Implementation unit: 10 buildings
Implementation units needed: 762
Implementation Schedule
2010‐15 2015‐20 2020‐25 2025‐30 2010 to 2030 Total
Percent 0.25 0.25 0.25 0.25 1.0
No. units 191 191 191 191 762119
MTCO2e 3,403 3,403 3,403 3,403 13,612
Upon full implementation, this action may offer the following savings per year.120
Electricity 15,893,561 kWh $3,814,500
Natural Gas 81,669 thousand cf $1,209,500
Light fuel oil 223 thousand gallons $591,800
Sub Action 5.1.c (High Growth) can be accomplished as follows:
Implementation unit: 10 buildings
Implementation units needed: 800
Implementation Schedule
2010‐15 2015‐20 2020‐25 2025‐30 2010 to 2030 Total
Percent 0 0.2 0.4 0.4 1.0
No. units 0 160 320 320 800
MTCO2e 0 2,857 5,714 5,714 14,285
Upon full implementation, this action may offer the following savings per year.121
Electricity 16,679,586 kWh $4,003,100
Natural Gas 85,708 thousand cf $1,269,300
Light fuel oil 234 thousand gallons $621,100
This action may result in average annual utility savings per building of approximately $750.
Additional considerations

Bridgeport Energy Efficiency and Conservation Plan 49
Bridgeport’s recently amended zoning regulations enable the construction of many thousand new households
through infill of the existing building grid. This represents a tremendous opportunity to beneficially impact the
regional emissions load. Buildings which are underutilized, and undergo expansion, complete renovation
and/or replacement will, out of deference to current equipment availability, install systems and equipment,
which are, on average, the most energy‐efficient of recent times.
On average, it costs less than 2% more to retrofit buildings in a green manner than not, and buildings are
increasingly being built to LEED certified levels at little or no extra cost.122 Green building has been reported to
have 20‐year net benefits ranging from $50 to $65 per square foot.123
Existing building and energy codes demand greater attention to energy efficiency. Although Bridgeport is not
economically positioned to place green building requirements on new construction, The City can certainly,
explore certain incentive programs and public education programs, to promote green building performance
measures in new construction, as well as renovation. Educational programs could be developed together with
the Bridgeport Regional Business Council, utilities, architects and landscape architects. A core working group
on green construction will easily evolve out of the BGreen 2020 Energy Technical Subcommittee to address
these issues.
“Building Green” is not anticipated to create any incremental job potential beyond normal construction
trade demand, so this action item creates no additional fulltime equivalent work‐years. However,
Bridgeport’s tremendous potential for redevelopment poses significant potential for employment in the
construction trades.
Sub Action 5.2 ‐ Commercial Green Building (includes 5.2.a and 5.2.b)
Sub Action 5.2.a ‐ Green building in new commercial construction Low Growth
Sub Action 5.2.b ‐ Green building in new commercial construction High Growth
Goal: Achieve 30% emissions reduction in all new commercial buildings through green building practices.
Annual Savings Potential by 2030 (Low Growth) 8,768 MTCO2e
Additional Savings Potential by 2030 (High Growth) 7,402 MTCO2e
Per buildings savings potential
575,250 kWh electricity124 238 MTCO2e125
2,462 thousand cf natural gas 141 MTCO2e
Implementation Summary
This action assumes performance of green building measures related to energy systems and building
envelopes, which will achieve 28% emissions savings in 231 new commercial buildings under the Low Growth

Bridgeport Energy Efficiency and Conservation Plan 50
Scenario (Sub Action 5.4) and 195 new commercial buildings under the High Growth Scenario (Sub Action
5.5). This falls slightly short of the 30% reduction goal.
Sub Action 5.2.a (Low Growth) can be accomplished as follows:
Implementation unit: 10 buildings
Implementation units needed: 23.1
Implementation Schedule
2010‐15 2015‐20 2020‐25 2025‐30 2010 to 2030 Total
Percent 0.25 0.25 0.25 0.25 1.0
No. units 6 6 6 6 24
MTCO2e 2,192 2,192 2,192 2,192 8,768
Upon full implementation, this action may offer the following savings per year.126
Electricity 13,288,275 kWh $3,189,200
Natural Gas 56,872 thousand cf $522,100
Sub Action 5.2.b (High Growth) can be accomplished as follows:
Implementation unit: 10 buildings
Implementation units needed: 19.5
Implementation Schedule
2010‐15 2015‐20 2020‐25 2025‐30 2010 to 2030 Total
Percent 0 0.2 0.4 0.4 1.0
No. units 0 3.9 3.9 7.8 19.5
MTCO2e 0 1,480 2,961 2,961 7402
Upon full implementation, this action may offer the following savings per year.127
Electricity 11,217,375 kWh $2,692,200
Natural Gas 48,009 thousand cf $440,700
This action may result in average annual utility savings per building of approximately $15,000.
Additional Considerations
The technology exists to construct buildings with 30% or greater energy savings over currently standing
structures. On average, it costs less than 2% more to retrofit buildings in a green manner than not, and
buildings are increasingly being built to LEED certified levels at little or no extra cost.128 Green building has
been reported to have 20‐year net benefits ranging from $50 to $65 per square foot.129
This measure proposes that all new construction take advantage of the existing Energy Conscious BluePrint
utility‐managed program, or similar, to plan for new commercial construction, which installs efficient energy

Bridgeport Energy Efficiency and Conservation Plan 51
systems. Complementing the Energy Conscious BluePrint planning program are several financing programs,
including rebates and loans against consumption.
Bridgeport’s tremendous potential for redevelopment poses significant opportunity to institute green building
measures not only in expected new buildings, but also in major renovation of existing buildings, which, in
essence, will be new construction. The existing Energy Conscious Blue Print program also encompasses major
retrofit and renovation.
New commercial construction should, in its related design and planning process, consider inclusion of
renewable energy opportunities, combined heat and power and distributed generation, which are addressed
in the Renewable Resources section of this energy plan.
“Building Green” is not anticipated to create any incremental job potential beyond normal construction
trade demand, so this action item creates no additional fulltime equivalent work‐years. However,
Bridgeport’s tremendous potential for redevelopment poses significant opportunity for employment in the
construction trades.
SEE APPENDIX for Cost Saving Opportunities related to green construction and retrofit.
ACTION 6 COOL WITH TREES AND GREEN ROOFS
Sub Action 6.1 ‐ Plant 2 or 3 trees at half of the city’s residential buildings
Goal: Save 3% of heating and cooling energy130 in 50% of residential buildings131 through tree planting.
Annual Savings Potential by 2030 2,288 MTCO2e
Per household savings potential
243 kWh electricity132 0.10 MTCO2e133
1.2474 thousand cf natural gas 0.07 MTCO2e
0.0034 thousand gallons fuel oil 0.04 MTCO2e
Implementation Summary
This action may be accomplished by planting 27,510 trees in the residential sector. Two or three trees can be
planted at 11,004 buildings as follows.
Implementation unit: 10 buildings
Implementation units needed: 1,100
Implementation Schedule
2010‐15 2015‐20 2020‐25 2025‐30 2010 to 2030 Total

Bridgeport Energy Efficiency and Conservation Plan 52
Percent 0.4 0.4 0.2 0 1.0
No. units 440 440 220 0 1,100
MTCO2e 915 915 458 0 2,288
Trees134 11,004 11,004 5,502 0 27,510
Upon full implementation, this action may offer the following savings per year.135
Electricity 2,671,347 kWh $2,600
Natural Gas 13,727 thousand cf $203,300
Light fuel oil 38 thousand gallons $99,500
This action may result in average annual utility savings per building of approximately $75.
Additional Considerations
Trees have value to energy savings, the natural environment, quality of life, and water management.
The City of Bridgeport has recently started an “Adopt‐a‐Tree” program. This program can look to expand
through focused outreach and education and a highly visible tree planting campaign. Sufficient administrative
support will be essential. It is possible that a citizens group may provide some of the backbone for this
program to support the Parks Department efforts. The potential for communitywide participation in tree
planting and sponsorship is high.
The City can benefit from expanding its existing urban forest database through specific ITree/UFORE and/or
UTC assessment. Additional data may help direct a tree‐planting program toward established goals beyond
tree number, to include specific water management and/or air quality goals.
The City cannot fund this on its own and private property ownership requires residents to partner with the City
on this effort.
Groundwork Bridgeport can be a valuable resource in this effort, drawing upon established strengths, which
align with this action.
Measures carried out under the Bridgeport tree‐planting program are estimated to create job potential for
55 fulltime equivalent work‐years. This will be reduced if some trees are self‐installed.
Sub Action 6.2 ‐ Plant trees at commercial building sites
Goal: Plant trees at 80% of the existing commercial buildings that are under 3 stories tall to reduce
building energy by 3%.
Annual Savings Potential by 2030 3874 MTCO2e

Bridgeport Energy Efficiency and Conservation Plan 53
Per building savings potential
2,967 kWh electricity136 1.23 MTCO2e137
15.802 thousand cf natural gas 0.90 MTCO2e
0.034 thousand gallons oil 0.36 MTCO2e
Implementation Summary
This action may be accomplished by planting trees in the commercial sector. Six to nine trees can be planted
at 1,555 buildings as follows.
Implementation unit: 10 buildings
Implementation units needed: 155
Implementation Schedule
2010‐15 2015‐20 2020‐25 2025‐30 2010 to 2030 Total
Percent 0.4 0.4 0.2 0 1.0
No. units 62 62 31 0 155
MTCO2e 1,550 1,550 775 0 3,874
Trees138 5,894 5,894 2,947 0 14,734
Upon full implementation, this action may offer the following savings per year.139
Electricity 4,613,925 kWh $1,107,300
Natural Gas 24,572.249 thousand cf $225,600
Light fuel oil 53 thousand gallons $139,900
This action may result in average annual utility savings per building of approximately $1,000.
Additional Considerations
Trees have value to energy savings, the natural environment, quality of life, and water management.
The City of Bridgeport has recently started an “Adopt‐a‐Tree” program. This program can expand through
focused outreach and education and a highly visible tree planting campaign. Sufficient administrative support
will be essential. It is possible that a citizens group may provide some of the backbone for this program to
support the Parks Department efforts. The potential for communitywide participation in tree planting and
sponsorship is high.
The City can benefit from expanding its existing urban forest database through specific ITree/UFORE and/or
UTC assessment. Additional data may help direct a tree‐planting program toward established goals beyond
tree number, to include specific water management and/or air quality goals.

Bridgeport Energy Efficiency and Conservation Plan 54
The City cannot fund this alone; and private property ownership requires that businesses partner with the City
on this effort.
Groundwork Bridgeport can be an instrumental resource in citywide planting programs, drawing upon
established strengths, which align with this action.
Measures carried out under the Bridgeport tree‐planting program are estimated to create job potential for
29 fulltime equivalent work‐years. This will be reduced if some trees are self‐installed.
Sub Action 6.3. ‐ Install green roofs on 30% of existing flat roof commercial buildings
Sub Action 6.4 and Sub Action 6.5 ‐ Install green roofs on 30% new flat roof commercial buildings
Goal: Achieve 3% savings on individual building heating and cooling energy through green roof
installation.
Annual Savings Potential by 2030 Existing Buildings 9,282 MTCO2e
Annual Savings Potential new buildings (Low Growth) 1,049 MTCO2e
Additional annual savings potential (High Growth) 888 MTCO2e
Per building savings potential
24,030 kWh electricity140 9.98 MTCO2e
4.098 thousand cf natural gas 7.32 MTCO2e
1.615 thousand gallons oil 2.88 MTCO2e
Implementation Summary
This action assumes installation of a green roof on 460141 existing commercial buildings, 52 new commercial
buildings under Low Growth scenario, and an additional 44 commercial buildings under the High Growth
scenario for a total of 512 to 556 buildings.
This action can be accomplished as follows:
Sub Action 6.3 ‐ 460 Existing buildings
Implementation unit: 1 building
Implementation units needed: 460
Implementation Schedule
2010‐15 2015‐20 2020‐25 2025‐30 2010 to 2030 Total
Percent 0.1 0.3 0.4 0.2 1.0
No. units 46 138 184 92 460
MTCO2e 928 2,784 3,713 1,856 9,282
Upon full implementation, this action may offer the following savings per year.142

Bridgeport Energy Efficiency and Conservation Plan 55
Electricity 11,053,802 kWh $2,652,900
Natural Gas 1884.85 thousand cf $27,900
Light fuel oil 743.04 thousand gallons $1,969,000
Sub Action 6.4 ‐ 52 New buildings Low Growth
Implementation unit: 1 building
Implementation units needed: 52
Implementation Schedule
2010‐15 2015‐20 2020‐25 2025‐30 2010 to 2030 Total
Percent 0.1 0.3 0.4 0.2 1.0
No. units 5 16 21 10 52
MTCO2e 105 315 420 210 1,049
Upon full implementation, this action may offer the following savings per year.143
Electricity 1,249,560 kWh $299,900
Natural Gas 213 thousand cf $2,000
Light fuel oil 84 thousand gallons $222,600
Sub Action 6.5 ‐ 44 New buildings High Growth
Implementation unit: 1 building
Implementation units needed: 44
Implementation Schedule
2010‐15 2015‐20 2020‐25 2025‐30 2010 to 2030 Total
Percent 0.1 0.3 0.4 0.2 1.0
No. units 4 13 18 9 44
MTCO2e 89 266 355 178 888
Upon full implementation, this action may offer the following savings per year.144
Electricity 1,057,320 kWh $253,757
Natural Gas 180.29 thousand cf $1,700
Light fuel oil 71.07 thousand gallons $188,300
This action may result in average annual utility savings per building of approximately $10,000.
Additional considerations
Rooftops are an untapped carbon reduction resource. Several critical elements must be addressed to
maximize their potential. First and foremost is the need to determine the optimal use of roof space, which
could either be assigned to green roof or to solar. Solar/green roof combinations can have many benefits.

Bridgeport Energy Efficiency and Conservation Plan 56
Optimizing the mix of these two opportunities is important. The EID could play a vital role in commissioning
study to develop models for commercial property owners to draw from. Although green roofs have a higher
initial cost than traditional roofs, they return savings in many ways, and last two‐ to three times as long as
conventional roofs.145
The EID, City and Bridgeport Regional Business Council BGreen partners can play a strategic role in marketing
the merits of an optimal solar/green roof mix to commercial property owners.
For additional information on green roof actions related to water management, see Water Resources Part 6
of this Bridgeport Energy Plan
Measures carried out under the green roof program on existing buildings are estimated to create job
potential for 743 fulltime equivalent work‐years. Measures carried out under the green roof program on
new buildings under the Low Growth and High Growth scenarios combined are estimated to create job
potential for 155 fulltime equivalent work‐years.146
Sub Action 6.6 ‐ Carbon sequestration in newly‐planted trees
Goal: Sequester carbon in Bridgeport’s urban forest
Annual Savings Potential by 2030 1,479 MTCO2e
Savings potential per 20 trees 0.0350 MTCO2e147
Specific types of energy or fuel savings were not quantified by this energy plan.
Implementation Summary
This action assumes carbon will be sequestered in 42,244 newly‐planted trees as described under Sub Actions
6.1 and 6.2.
This action can be accomplished as follows:
Implementation unit: 20 trees
Implementation units needed: 2,112
Implementation Schedule
2010‐15 2015‐20 2020‐25 2025‐30 2010 to 2030 Total
Percent 0.4 0.4 0.2 0 1.0
No. units 845 845 422 0 2,112
MTCO2e 591 591 296 0 1,479
Upon full implementation, this action may offer electricity, natural gas and/or fuel oil savings, but specific
savings were not allocated by fuel type.

Bridgeport Energy Efficiency and Conservation Plan 57
Additional Considerations
Carbon sequestration in newly planted trees relates to actions taken under Sub Actions 6.1 and 6.2, which,
combined, are estimated to create job potential for 84 fulltime equivalent work‐years. This will be lessened if
some trees in the residential sector are self‐installed.
Sub Action 6.7 ‐ Carbon sequestration in newly‐planted green roofs
Goal: Sequester carbon in urban vegetation established on commercial green roofs.
Annual Savings Potential by 2030 MTCO2e not
quantified148
Implementation Summary
This action assumes carbon will be sequestered in 512 to 556 newly established green roofs as described
under Sub Actions 6.3 and 6.4.
Upon full implementation, this action may offer electricity, natural gas and/or fuel oil savings, but specific
savings were not allocated by fuel type.
Additional Considerations
Carbon sequestration in newly planted green roofs relates to actions taken under Sub Actions 6.3, 6.4 and 6.5,
which, combined, are estimated to create job potential for 898 fulltime equivalent work‐years.
ACTION 7 BEHAVIORAL CHANGES TO SAVE ENERGY AND REDUCE EMISSIONS
Sub Action 7.1 ‐ Four behavioral changes in 5% existing households
Sub Action 7.2 ‐ Four behavioral changes in 5% new households under Low Growth scenario
Sub Action 7.3 ‐ Four behavioral changes in 5% new households under High Growth scenario
Goal: Adopt four behavioral changes to reduce energy consumption and reduce household emissions by
more than ½ MTCO2e (0.63 MTCO2e) at 5% of existing and future households.
Annual Savings Potential by 2030 Existing households 1,501 MTCO2e
Annual Savings Potential by 2030 new households (Low Growth) 241 MTCO2e
Additional annual savings potential new households (High Growth) 253 MTCO2e
Per household savings potential
1,149 kWh electricity149 0.48 MTCO2e
1.8 thousand cf natural gas 0.10 MTCO2e

Bridgeport Energy Efficiency and Conservation Plan 58
0.005 thousand gallons oil 0.05 MTCO2e
Implementation Summary
This action assumes behavioral changes are implemented in 2,377 existing households, 382 new households
under the Low Growth scenario, and an additional 400 new households under the High Growth scenario. The
behavioral changes included in this measure are 1) changing heating and cooling by 3 degrees, 2) changing
filters on air conditioners to achieve 10% savings, 3) turning off three 60‐watt light bulbs for 2 hours a day,
and 4) turning off appliances which contribute to the “phantom load.”
This action can be accomplished as follows:
Sub Action 7.1 ‐ Four behavioral changes in 5% existing households
Implementation unit: 10 households
Implementation units needed: 238
Implementation Schedule
2010‐15 2015‐20 2020‐25 2025‐30 2010 to 2030 Total
Percent 0.5 0.4 0.1 0 1.0
No. units 119 95 24 0 238
MTCO2e 751 600 150 0 1,501
Upon full implementation, this action may offer the following savings per year.150
Electricity 2,730,828 kWh $655,400
Natural Gas 4,728 thousand cf $63,400
Light fuel oil 12 thousand gallons $31,000
Sub Action 7.2 ‐ Four behavioral changes in 5% new households under Low Growth scenario
Implementation unit: 10 households
Implementation units needed: 38.2
Implementation Schedule
2010‐15 2015‐20 2020‐25 2025‐30 2010 to 2030 Total
Percent 0.25 0.25 0.25 25 1.0
No. units 10 10 10 10 40
MTCO2e 60 60 60 60 241
Upon full implementation, this action may offer the following savings per year.151
Electricity 438,863 kWh $105,327
Natural Gas 688 thousand cf $10,200
Light fuel oil 2 thousand gallons $5,000
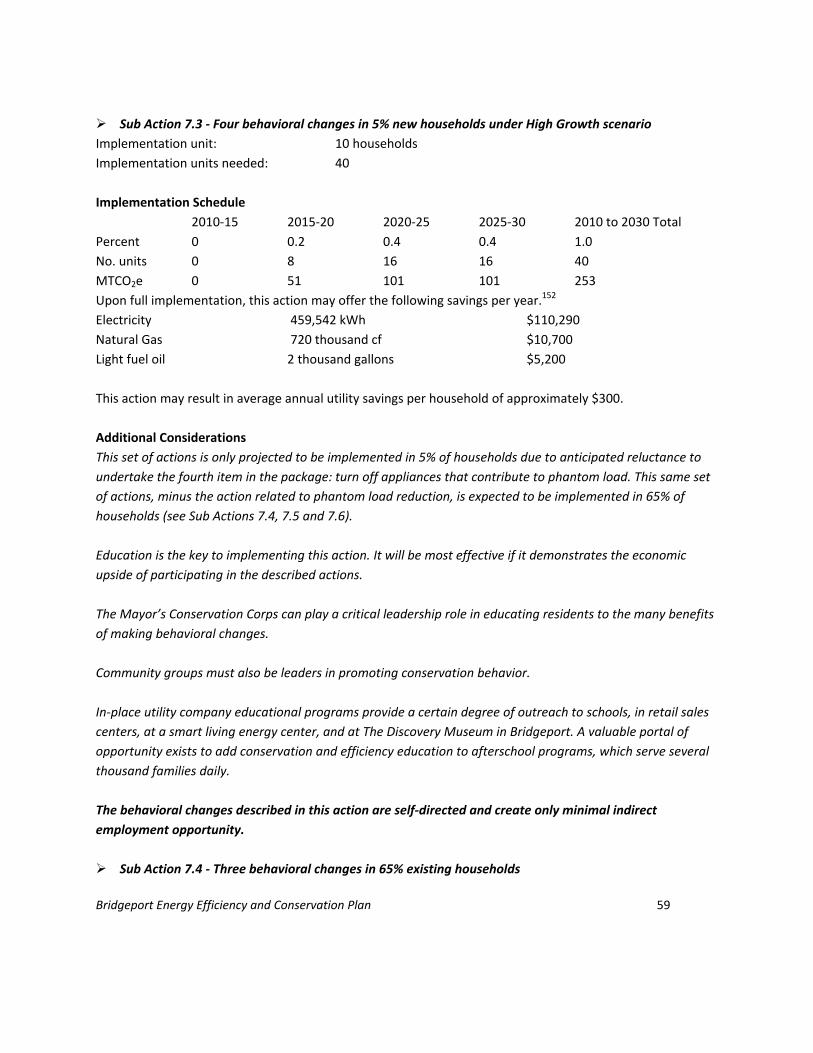
Bridgeport Energy Efficiency and Conservation Plan 59
Sub Action 7.3 ‐ Four behavioral changes in 5% new households under High Growth scenario
Implementation unit: 10 households
Implementation units needed: 40
Implementation Schedule
2010‐15 2015‐20 2020‐25 2025‐30 2010 to 2030 Total
Percent 0 0.2 0.4 0.4 1.0
No. units 0 8 16 16 40
MTCO2e 0 51 101 101 253
Upon full implementation, this action may offer the following savings per year.152
Electricity 459,542 kWh $110,290
Natural Gas 720 thousand cf $10,700
Light fuel oil 2 thousand gallons $5,200
This action may result in average annual utility savings per household of approximately $300.
Additional Considerations
This set of actions is only projected to be implemented in 5% of households due to anticipated reluctance to
undertake the fourth item in the package: turn off appliances that contribute to phantom load. This same set
of actions, minus the action related to phantom load reduction, is expected to be implemented in 65% of
households (see Sub Actions 7.4, 7.5 and 7.6).
Education is the key to implementing this action. It will be most effective if it demonstrates the economic
upside of participating in the described actions.
The Mayor’s Conservation Corps can play a critical leadership role in educating residents to the many benefits
of making behavioral changes.
Community groups must also be leaders in promoting conservation behavior.
In‐place utility company educational programs provide a certain degree of outreach to schools, in retail sales
centers, at a smart living energy center, and at The Discovery Museum in Bridgeport. A valuable portal of
opportunity exists to add conservation and efficiency education to afterschool programs, which serve several
thousand families daily.
The behavioral changes described in this action are self‐directed and create only minimal indirect
employment opportunity.
Sub Action 7.4 ‐ Three behavioral changes in 65% existing households

Bridgeport Energy Efficiency and Conservation Plan 60
Sub Action 7.5 ‐ Three behavioral changes in 65% new households under Low Growth scenario
Sub Action 7.6 ‐ Three behavioral changes in 65% new households under High Growth scenario
Goal: Adopt three behavioral changes to reduce energy consumption and reduce household emissions by
0.51 MTCO2e at 65% of existing and future households.
Annual Savings Potential by 2030 Existing households 15,948 MTCO2e
Annual Savings Potential by 2030 new households (Low Growth) 2,557 MTCO2e
Additional annual savings potential new households (High Growth) 2,684 MTCO2e
Per household savings potential
871 kWh electricity153 0.36 MTCO2e
1.8 thousand cf natural gas 0.10 MTCO2e
0.005 thousand gallons oil 0.05 MTCO2e
Implementation Summary
This action assumes behavioral changes are implemented in 30,902 existing households, 4,955 new
households under the Low Growth scenario, and an additional 5,200 new households under the High Growth
scenario. The behavioral changes included in this measure are 1) changing heating and cooling by 3 degrees,
2) changing filters on air conditioners to achieve 10% savings, and 3) turning off three 60‐watt light bulbs for
2 hours a day.
This action can be accomplished as follows:
Sub Action 7.4 ‐ Three behavioral changes in 65% existing households
Implementation unit: 10 households
Implementation units needed: 3,090
Implementation Schedule
2010‐15 2015‐20 2020‐25 2025‐30 2010 to 2030 Total
Percent 0.5 0.4 0.1 0 1.0
No. units 1,545 1,236 309 0 3,090
MTCO2e 7974 6379 1595 0 15,948
Upon full implementation, this action may offer the following savings per year.154
Electricity 26,911,367 kWh $6,458,700
Natural Gas 55,620 thousand cf $823,700
Light fuel oil 152 thousand gallons $403,000
Sub Action 7.5 ‐ Three behavioral changes in 65% new households under Low Growth scenario
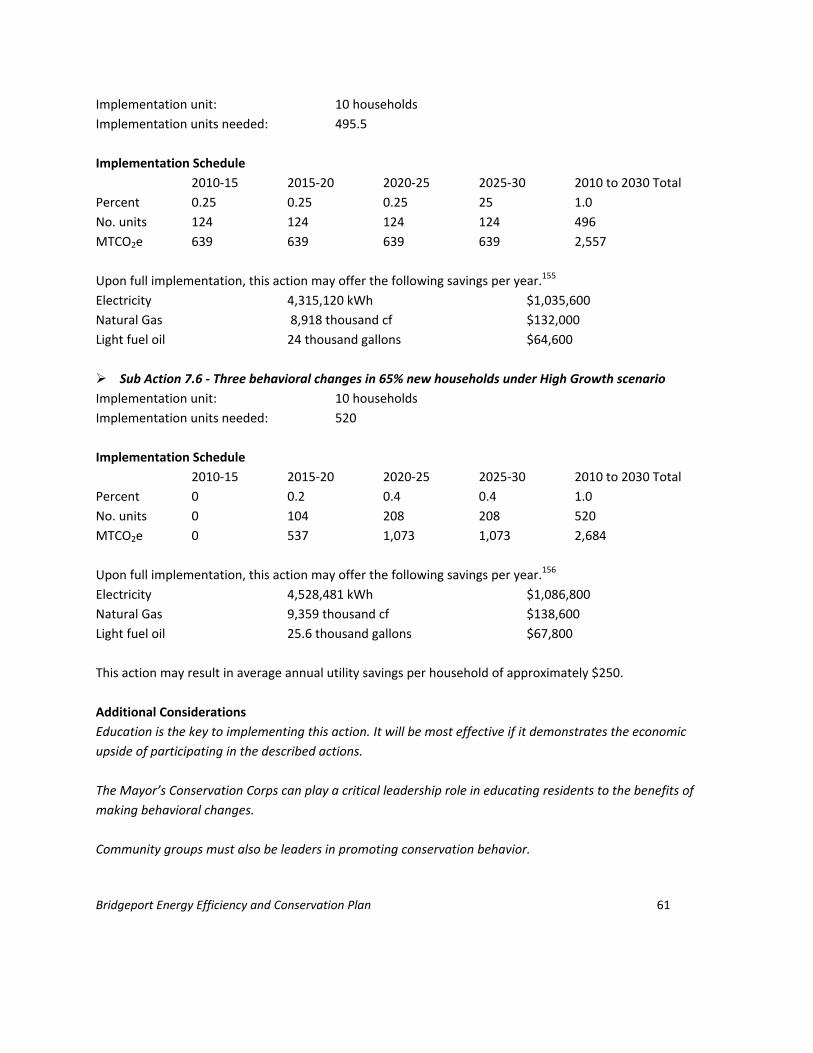
Bridgeport Energy Efficiency and Conservation Plan 61
Implementation unit: 10 households
Implementation units needed: 495.5
Implementation Schedule
2010‐15 2015‐20 2020‐25 2025‐30 2010 to 2030 Total
Percent 0.25 0.25 0.25 25 1.0
No. units 124 124 124 124 496
MTCO2e 639 639 639 639 2,557
Upon full implementation, this action may offer the following savings per year.155
Electricity 4,315,120 kWh $1,035,600
Natural Gas 8,918 thousand cf $132,000
Light fuel oil 24 thousand gallons $64,600
Sub Action 7.6 ‐ Three behavioral changes in 65% new households under High Growth scenario
Implementation unit: 10 households
Implementation units needed: 520
Implementation Schedule
2010‐15 2015‐20 2020‐25 2025‐30 2010 to 2030 Total
Percent 0 0.2 0.4 0.4 1.0
No. units 0 104 208 208 520
MTCO2e 0 537 1,073 1,073 2,684
Upon full implementation, this action may offer the following savings per year.156
Electricity 4,528,481 kWh $1,086,800
Natural Gas 9,359 thousand cf $138,600
Light fuel oil 25.6 thousand gallons $67,800
This action may result in average annual utility savings per household of approximately $250.
Additional Considerations
Education is the key to implementing this action. It will be most effective if it demonstrates the economic
upside of participating in the described actions.
The Mayor’s Conservation Corps can play a critical leadership role in educating residents to the benefits of
making behavioral changes.
Community groups must also be leaders in promoting conservation behavior.

Bridgeport Energy Efficiency and Conservation Plan 62
In‐place utility company educational programs provide a certain degree of outreach to schools, in retail sales
centers, at a smart living energy center, and at The Discovery Museum in Bridgeport. A valuable portal of
opportunity exists to add conservation and efficiency education to afterschool programs, which serve several
thousand families daily.
The behavioral changes described in this action are self‐directed and create only minimal indirect
employment opportunity.
Sub Action 7.7 ‐ Two behavioral changes in 80% of existing commercial buildings
Sub Action 7.8 ‐ Two behavioral changes in 80% of new buildings under Low Growth scenario
Sub Action 7.9 ‐ Two behavioral changes in 80% of additional new buildings under High Growth
scenario
Goal: Adopt two behavioral changes to reduce energy consumption and reduce emissions by nearly 20
MTCO2e at 80% of existing and future commercial buildings.
Annual Savings Potential by 2030 existing Buildings 39,305 MTCO2e
Annual Savings Potential by 2030 new buildings (Low Growth) 3,687 MTCO2e
Additional Annual Savings new buildings (High Growth) 3,109 MTCO2e
Per building savings potential157
23,737 kWh electricity 9.85 MTCO2e
126.42 thousand cf natural gas 7.23 MTCO2e
0.272 thousand gallons oil 2.85 MTCO2e
Implementation Summary
This action assumes two behavioral changes are implemented in 1,972 existing commercial buildings, 185
new commercial buildings under the Low Growth scenario, and 156 additional new commercial buildings
under the High Growth Scenario. The behavioral changes included in this measure are: 1) changing heating
and cooling in commercial buildings by 3 degrees and 2) changing the thermostat at commercial buildings to
a programmable thermostat, which adjusts temperatures during work and nonwork hours.
This action can be accomplished as follows:
Sub Action 7.7 ‐ Two behavioral changes in 80% existing commercial buildings
Implementation unit: 10
Implementation units needed: 197.2
Implementation Schedule
2010‐15 2015‐20 2020‐25 2025‐30 2010 to 2030 Total
Percent 0.5 0.4 0.1 0 1.0
No. units 99 79 20 0 198

Bridgeport Energy Efficiency and Conservation Plan 63
MTCO2e 19,652 15,722 3,930 0 39,305
Upon full implementation, this action may offer the following savings per year.158
Electricity 46,809,825 kWh $11,234,400
Natural Gas 249,294 thousand cf $2,288,500
Light fuel oil 535 thousand gallons $1,419,000
Sub Action 7.8 ‐ Two behavioral changes in 80% new commercial buildings under Low Growth scenario
Implementation unit: 10 buildings
Implementation units needed: 18.5
Implementation Schedule
2010‐15 2015‐20 2020‐25 2025‐30 2010 to 2030 Total
Percent 0.25 0.25 0.25 0.25 1.0
No. units 4.65 4.65 4.65 4.65 18.6
MTCO2e 922 922 922 922 3,687
Upon full implementation, this action may offer the following savings per year.159
Electricity 4,391,388 kWh $1,053,900
Natural Gas 23,387 thousand cf $214,700
Light fuel oil 50 thousand gallons $133,000
Sub Action 7.9 ‐ Two behavioral changes in 80% new commercial buildings under High Growth scenario
Implementation unit: 10
Implementation units needed: 15.6
Implementation Schedule
2010‐15 2015‐20 2020‐25 2025‐30 2010 to 2030 Total
Percent 0 0.2 0.4 0.4 1.0
No. units 0 3 6 6 15
MTCO2e 0 622 1,244 1,244 3,109
Upon full implementation, this action may offer the following savings per year.160
Electricity 3,703,008 kWh $888,700
Natural Gas 19,721 thousand cf $292,000
Light fuel oil 42 thousand gallons $112,300
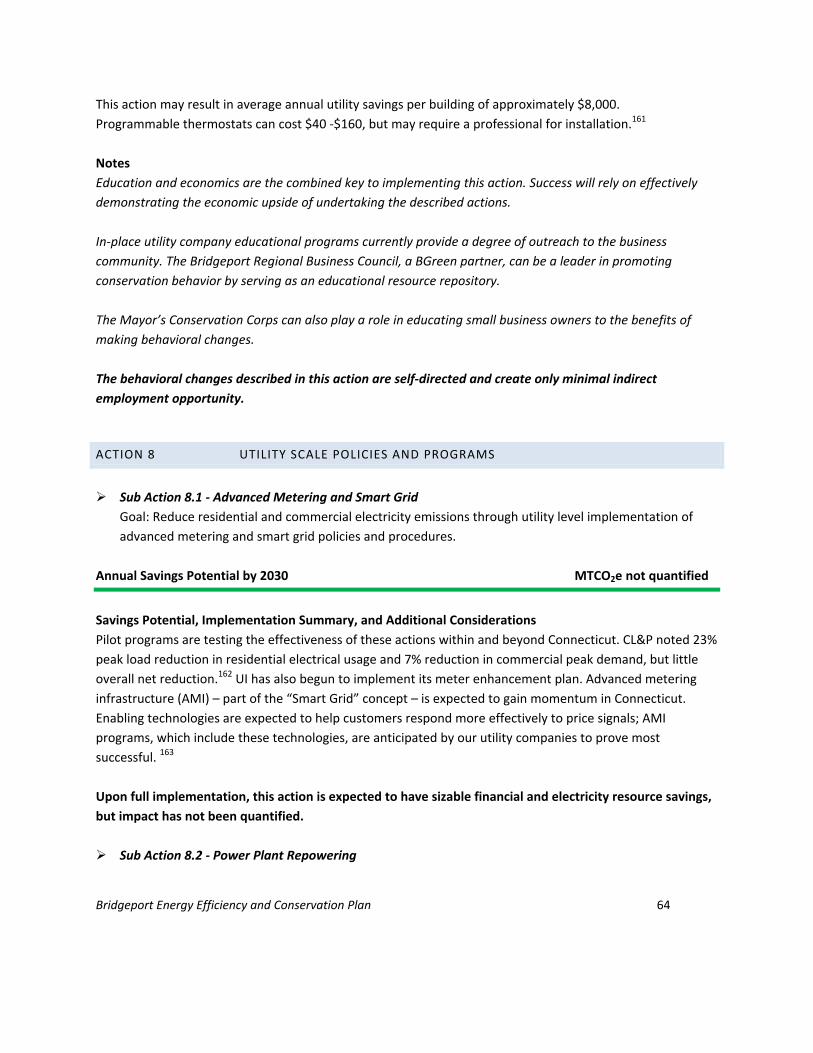
Bridgeport Energy Efficiency and Conservation Plan 64
This action may result in average annual utility savings per building of approximately $8,000.
Programmable thermostats can cost $40 ‐$160, but may require a professional for installation.161
Notes
Education and economics are the combined key to implementing this action. Success will rely on effectively
demonstrating the economic upside of undertaking the described actions.
In‐place utility company educational programs currently provide a degree of outreach to the business
community. The Bridgeport Regional Business Council, a BGreen partner, can be a leader in promoting
conservation behavior by serving as an educational resource repository.
The Mayor’s Conservation Corps can also play a role in educating small business owners to the benefits of
making behavioral changes.
The behavioral changes described in this action are self‐directed and create only minimal indirect
employment opportunity.
ACTION 8 UTILITY SCALE POLICIES AND PROGRAMS
Sub Action 8.1 ‐ Advanced Metering and Smart Grid
Goal: Reduce residential and commercial electricity emissions through utility level implementation of
advanced metering and smart grid policies and procedures.
Annual Savings Potential by 2030 MTCO2e not quantified
Savings Potential, Implementation Summary, and Additional Considerations
Pilot programs are testing the effectiveness of these actions within and beyond Connecticut. CL&P noted 23%
peak load reduction in residential electrical usage and 7% reduction in commercial peak demand, but little
overall net reduction.162 UI has also begun to implement its meter enhancement plan. Advanced metering
infrastructure (AMI) – part of the “Smart Grid” concept – is expected to gain momentum in Connecticut.
Enabling technologies are expected to help customers respond more effectively to price signals; AMI
programs, which include these technologies, are anticipated by our utility companies to prove most
successful. 163
Upon full implementation, this action is expected to have sizable financial and electricity resource savings,
but impact has not been quantified.
Sub Action 8.2 ‐ Power Plant Repowering

Bridgeport Energy Efficiency and Conservation Plan 65
Goal: Reduce residential and commercial electricity emissions through utility level transfer to cleaner
fuels or technology at local power plants.
Annual Savings Potential by 2030 MTCO2e not quantified
Savings potential and Implementation Summary
Utility supply companies may repower existing power plants to operate with cleaner fuels, particularly
switching away from coal as a fuel source. In depth analysis by utility companies for the Connecticut Energy
Advisory Board164 shows this action may actually increase local emissions of certain pollutants, although it
would help decrease emissions regionally as part of the regional power supply. Although repowered plants
will be more efficient, they are anticipated to be operated for additional time to help meet regional grid
demand; Connecticut would, in fact, become a net exporter of electricity.
Upon full implementation, this action is expected to have sizable financial and electricity resource savings,
but impact specific to Bridgeport has not been quantified.

Bridgeport Energy Efficiency and Conservation Plan 66
This page intentionally left blank

Bridgeport Energy Efficiency and Conservation Plan 67
RENEWABLE ENERGY
SUMMARY
5.2% of total reduction 2010 to 2015
8.1% of cumulative reduction by
2030
Renewable and Clean Energy MTCO2e
Action 1 Renewable energy development 5,595
Action 2 Increase distributed generation and combined heat and power projects 4,921
Action 3 Residential and commercial solar energy 33,780
Action 4 Utility scale regional renewable energy development and transmission ‐‐
Annual Emissions Reduction by Full Implementation 2030 44,295

Bridgeport Energy Efficiency and Conservation Plan 68
SAVINGS (annual by full implementation)
Electricity $17.1 million
Natural Gas $1.1 million
Light Fuel Oil $1.4 million
Gasoline/Diesel $0.95 million
GAINS
Fulltime equivalent work‐years 579
Narrative Summary
Clean and renewable energy strategies assume a steady spot between 5% and 10% of overall Plan
reduction savings throughout the plan’s twenty‐year period.
Several utility‐scale renewable energy projects may be developed in Bridgeport, possibly beginning
within 2 or 3 years. These include a 3 MW solar energy park near the closed Seaside Landfill, a 100KW
on‐shore windmill on City‐owned property near the coast and a biogas retrofit on the City’s West Side
water treatment facility.
Connecticut’s Energy Advisory Board notes that costs of solar energy are still relatively high compared
with weatherization and retrofit opportunities and also notes cost reductions are expected. Ramping up
of household and commercial building site solar is delayed for several years under this plan. A City‐
initiated program, under development, and based on a power purchase agreement with a private entity,
may enable earlier establishment of solar capacity, at an acceptable cost.
Solar/green roof combinations can have many benefits. Optimizing the mix of these two opportunities is
important. Marketing the merits of this mix to commercial property owners will be important.
Solar thermal currently costs less than residential solar PV and residents can now benefit from a
Connecticut Clean Energy Fund (CCEF) program and federal tax credits in support of its installation.
Bridgeport’s southern industrial core should be comprehensively analyzed for development of resource
sharing opportunities, as several large players have heat and/or water “waste resources” that can benefit
others.
The Bridgeport EID and Planning and Economic Development Department must work jointly with the
State DECD and CDA in identifying more potential for distributed generation, particularly given the power
supply systems and resource recovery system near Bridgeport’s waterfront.

Bridgeport Energy Efficiency and Conservation Plan 69
The City of Bridgeport can look to expand purchase of “green energy” and may find benefit to working
with other municipalities in lower‐cost group purchase.
Connecticut Clean Choice option will help certain residents obtain “green electricity” which can help the
City obtain solar PV systems for public facilities. Wind energy, a clean choice option, is viewed by electric
suppliers to be the next pivotal piece in regional green generation and supply.
Although far less than the estimated number of Green Buildings jobs, Renewables can provide
employment opportunities in the hundreds of fulltime equivalent work years in Bridgeport.
ACTION 1 RENEWABLE ENERGY DEVELOPMENT
Sub Action 1.1 ‐ Develop Green Energy Park in closed landfill region
Goal: Create 3MW solar generation facility to contribute to the local grid, reduce reliance on fossil fuels
and reduce fossil fuel emissions.
Annual Savings Potential by 2030 170 MTCO2e
Project savings potential
Electricity 410,959 kWh165 170 MTCO2e166
Implementation Summary
This action assumes installation 3MW solar capacity at the closed Seaside Landfill. This may be coordinated
with installation of wind generation on nearby properties, but this sub action considers 3 MW solar
installation only.
This action can be accomplished as follows:
Implementation unit: Single project
Implementation units needed: 1
Implementation Schedule
2010‐15 2015‐20 2020‐25 2025‐30 2010 to 2030 Total
Percent 1.0 0 0 0 1.0
No. units 1 0 0 0 1.0
MTCO2e 170 0 0 0 170
Upon full implementation, this action may offer the following savings per year.167
Electricity 410,959 kWh $98,600

Bridgeport Energy Efficiency and Conservation Plan 70
Combined annual savings for this completed measure is estimated to be $98,600 although savings will be
matched against cost of implementation.
Additional Considerations
A major deterrent to expanded solar energy use is cost. The direct cost of electricity from solar is roughly ten
times greater than the cost of wind, hydropower or combined cycle systems.168 The Connecticut Energy
Advisory Board reports that solar module prices are expected to drop as much as 30 percent in the next year
or two, which would reduce installed costs about 15 percent from the current average installed cost of
$7.50/watt for all systems. (Smaller systems cost more than this average per watt; larger systems cost less
per watt.) The CEAB also notes that industry goals reported by SolarBuzz are a drop from $4+/watt to $1.5 to
$2/watt by 2020 for module costs. Installed costs declined from $7.8/watt in 2007 to $7.5/watt in 2008. As a
result of current and projected solar economics, CEAB currently recommends a delay in implementing
significant solar installation as a means of meeting Connecticut’s electricity supply.169
A feasibility study is underway to determine more specific potential for solar PV development at the former
Seaside Landfill site.
Creation of a solar energy park will sustain employment in the building‐ and related specialty energy
trades. Employment potential has not been quantified for this action item.
Sub Action 1.2 ‐ Develop electrical generation from on‐shore wind in Bridgeport
Goal: Reduce emissions by 91 MTCO2e per year by installing on‐shore electricity‐generating wind facility.
Annual Savings Potential by 2030 91 MTCO2e
Electricity 219,000 kWh170 91 MTCO2e
Project savings potential
A single windmill with 100KW‐installed capacity can, under Connecticut’s current generation rules, provide
savings to tied‐in facilities. 219,000 kWh per year may be generated by this size facility.
Implementation Summary
This action assumes one 100KW171 on‐shore windmill will be established at one city location.
This action can be accomplished as follows:
Implementation unit: 1 windmill
Implementation units needed: 1
Implementation Schedule
2010‐15 2015‐20 2020‐25 2025‐30 2010 to 2030 Total

Bridgeport Energy Efficiency and Conservation Plan 71
Percent 1.0 0.3 0.2 0.1 1.0
No. units 1 0 0 0 1.0
MTCO2e 91 0 0 0 91
Upon full implementation, this action may offer the following savings per year.172
Electricity 219,000 kWh $52,600
Additional Considerations
The implementation schedule in this Bridgeport Energy Plan assumes full implementation within 5 years,
which might be a bit too aggressive, considering pre‐design wind measurements require more than 1 year to
complete. Full implementation of this action might be pushed back to 2015‐2020‐time period.
Initial consideration is being given to installation on city‐owned property near Captain’s Cove.
Connecticut, and Bridgeport, are not considered high potential sites for on‐shore wind generation, but a
recently installed windmill in New Haven, funded with assistance from the Connecticut Clean Energy Fund, is
proving successful.173
The cost of onshore wind development equals about $2,400/KW (current dollars), which is not expected to
change much over time, other than through inflation, because wind is an established technology.174
In general, Connecticut utilities and the Connecticut Energy Advisory Board (CEAB) are looking to fulfill
renewable portfolio standards through development of what is believed to be far greater on‐shore wind
potential in other New England and Northeastern states.
Development of wind energy in Bridgeport will sustain employment in the alternative energy and related
electrical trades. Employment potential has not been quantified for this action item.
Sub Action 1.3 Double municipal and BOE clean energy purchase from electric utilities
Goal: Achieve 40% green energy purchase for municipal and BOE facilities by 2030.
Annual Savings Potential by 2030 3,695 MTCO2e
Electricity 8,900,000 kWh175,176 3,695 MTCO2e177
Implementation Summary
This action assumes a doubling of the current 20% purchase of “green” electricity to result in total use of 40%
“green” electricity.
This action can be accomplished as follows:

Bridgeport Energy Efficiency and Conservation Plan 72
Implementation unit: 50% increase in purchase
Implementation units needed: 2
Implementation Schedule
2010‐15 2015‐20 2020‐25 2025‐30 2010 to 2030 Total
Percent 0.5 0.5 0 0 1.0
No. units 1 1 0 0 2
MTCO2e 1,847.5 1,847.5 0 0 0 3,695
Upon full implementation, this action may offer the following savings per year.178
Electricity 8,900,000 kWh $2,136,000
Additional Considerations
The City must explore cost‐effective ways to expand municipal and BOE clean energy purchase for electricity,
and possibly work with adjacent municipal energy departments for regionalized active bidding of reduced‐
rate electricity.
Sub Action 1.4 ‐ Expand CTCleanEnergyOptions enrollment to 1% of Bridgeport households
Sub Action 1.5 ‐ Promote CTCleanEnergyOptions enrollment by 1% of future households under Low
Growth scenario
Sub Action 1.6 ‐ Promote CTCleanEnergyOptions enrollment by 1% of future households under High
Growth scenario
Goal: Expand CTCleanEnergyOptions enrollment (100% renewable option) from 0.4%179 to 1% of existing
households, and 1% of new households under Low Growth and Expand Growth scenarios, to reduce
emissions and promote regional and national clean energy markets and generation.
Annual Savings Potential by 2030 existing households 958 MTCO2e
Annual Savings Potential Low Growth scenario 220 MTCO2e
Additional Annual Savings High Growth scenario 231 MTCO2e
Per household savings potential
6950 kWh electricity180 2.9 MTCO2e181
Implementation Summary
This action assumes 332 currently‐existing‐households will voluntarily switch to 100% renewable electricity
purchase through the local utility and existing Connecticut Clean Choice option program and that 1% of new
households (76 households) under Low Growth scenario and an additional 1% of new households (80
households) under the High Growth scenario will voluntarily switch to 100% renewable electricity purchase
program.
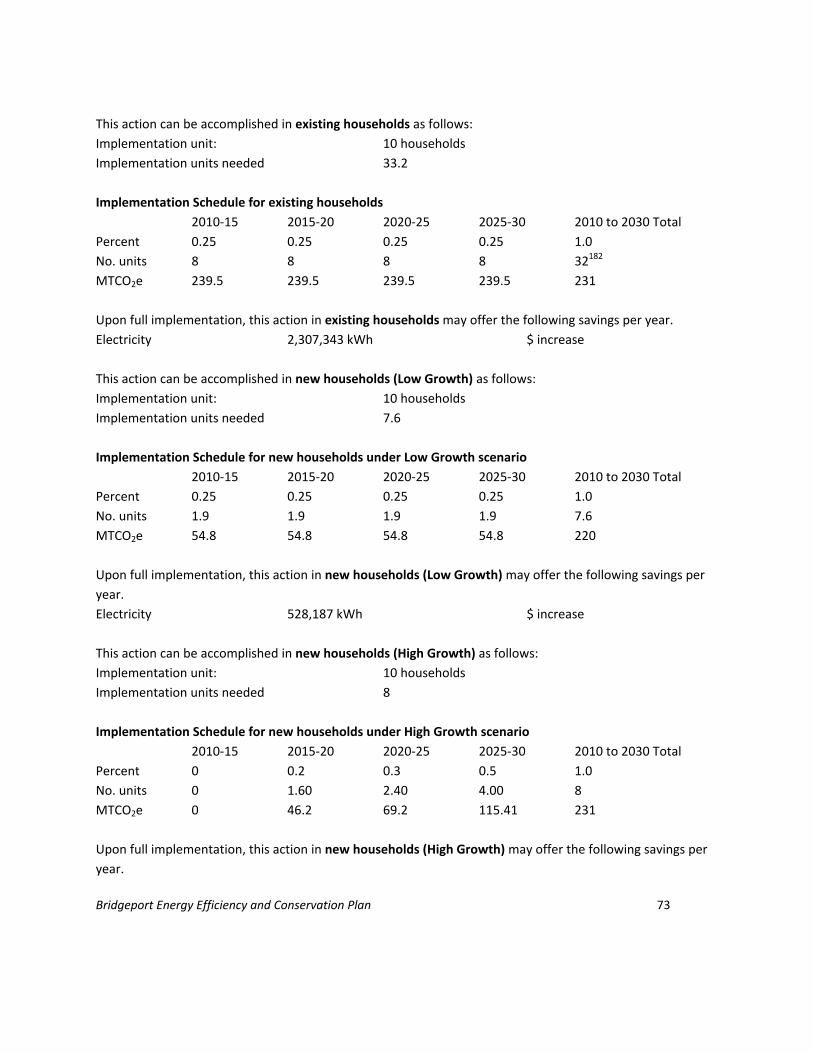
Bridgeport Energy Efficiency and Conservation Plan 73
This action can be accomplished in existing households as follows:
Implementation unit: 10 households
Implementation units needed 33.2
Implementation Schedule for existing households
2010‐15 2015‐20 2020‐25 2025‐30 2010 to 2030 Total
Percent 0.25 0.25 0.25 0.25 1.0
No. units 8 8 8 8 32182
MTCO2e 239.5 239.5 239.5 239.5 231
Upon full implementation, this action in existing households may offer the following savings per year.
Electricity 2,307,343 kWh $ increase
This action can be accomplished in new households (Low Growth) as follows:
Implementation unit: 10 households
Implementation units needed 7.6
Implementation Schedule for new households under Low Growth scenario
2010‐15 2015‐20 2020‐25 2025‐30 2010 to 2030 Total
Percent 0.25 0.25 0.25 0.25 1.0
No. units 1.9 1.9 1.9 1.9 7.6
MTCO2e 54.8 54.8 54.8 54.8 220
Upon full implementation, this action in new households (Low Growth) may offer the following savings per
year.
Electricity 528,187 kWh $ increase
This action can be accomplished in new households (High Growth) as follows:
Implementation unit: 10 households
Implementation units needed 8
Implementation Schedule for new households under High Growth scenario
2010‐15 2015‐20 2020‐25 2025‐30 2010 to 2030 Total
Percent 0 0.2 0.3 0.5 1.0
No. units 0 1.60 2.40 4.00 8
MTCO2e 0 46.2 69.2 115.41 231
Upon full implementation, this action in new households (High Growth) may offer the following savings per
year.

Bridgeport Energy Efficiency and Conservation Plan 74
Electricity 555,986 kWh $ increase
This action may result in a slight increase in annual electric utility costs per household.
Additional Considerations
A cost increase to individual consumers may detract from potential to expand Bridgeport residential
participation in this program. . Nevertheless, a strategy that combines the savings from competitively
supplied generation service, conservation and energy efficiency can more than offset the clean energy
premium. Increased participation in this program and increased clean energy systems in the community
would potentially enable the City to be eligible to receive solar panels from CCEF for public facilities. This
related action could reduce City electricity costs, which would conceivably be passed indirectly to taxpayers
through tax bill impact.
Connecticut Clean Energy Fund website notes that Bridgeport is a Clean Energy Community and that as of
May 2010 Bridgeport has 192 Clean Energy Points.
The Mayor’s Conservation Corps provides an in‐place resource for promoting CTCleanEnergyOptions.
Sub Action 1.7 ‐ EID Opportunities for Large Scale Renewable Development
Annual Savings Potential by 2030 MTCO2e not quantified
Bridgeport’s in‐place Energy Improvement District (EID) can play a strategic role in developing policies and
devising creative financing mechanisms to promote large‐scale renewable energy development. In particular,
the EID can:
Investigate resource‐sharing opportunities to maximize reuse of energy byproducts from facilities
located near one another;
Conduct commercial sector solid waste products analysis to determine opportunities for “waste
energy" sharing and energy creation from waste products; and
Creatively finance large scale renewable development.
ACTION 2 INCREASE DISTRIBUTED GENERATION AND COMBINED HEAT AND POWER
CAPACITY
Sub Action 2.1 ‐ Biomass retrofit at wastewater treatment facilities
Goal: Reduce fossil‐fueled electricity and/or gasoline equivalents through retrofit measures at West End
water treatment facility, possibly coordinating re‐use of waste heat from the RESCO MSW incineration
facility with re‐use of treated water from the West End water treatment facility.

Bridgeport Energy Efficiency and Conservation Plan 75
Annual Savings Potential by 2030 4,921 MTCO2e
Project savings potential
4,380,000 kWh electricity183 1,818 MTCO2e184
319,375 gallons gasoline equivalent 3,103 MTCO2e
Implementation Summary
This action assumes retrofit measures will be undertaken at the West End water treatment facility, possibly
coordinating re‐use of waste heat from the RESCO municipal solid waste incineration facility with re‐use of
treated water from the West End water treatment facility, and also potentially including recycling of
restaurant waste oils as a biomass fuel supplement at the water treatment facility.
This action can be accomplished as follows:
Implementation unit: 1 project
Implementation units needed: 1
Implementation Schedule
2010‐15 2015‐20 2020‐25 2025‐30 2010 to 2030 Total
Percent 0 0.1 0 0 1.0
No. units 0 1 0 0 1
MTCO2e 0 4,921 0 0 4,921
Upon full implementation, this action may offer the following savings per year.185
Electricity 4,380,000 kWh $ 1,051,200
Gasoline 319,375 gallons $ 958,125
The following potential savings may be realized from this action:
$2M/year savings from eliminating hauling to New Haven and $2M per year lowered system costs186
Additional Considerations
Coordinated “waste products sharing”, which entails using rather than losing the wastewater from the city’s
water treatment plant, and the excess heat from the municipal solid waste incineration facility, has great
potential to make the best of both facilities, to save energy and reduce emissions. Additionally, depending
upon specific technology employed, the city’s water treatment facility could beneficially incorporate used
cooking oils from area restaurants into operations. This measure would help turn another waste product,
which currently costs money for disposal, into a usable resource.
Bridgeport Energy Efficiency and Conservation Plan 76
Performing biomass retrofits at the city’s water treatment facilities will create employment potential for
the duration of project construction, in the building and energy trades, and possibly upon completion in
water treatment operations. This Bridgeport Energy Plan does not quantify employment potential.
Sub Action 2.2 ‐ Joint action on CHP Planning
Goal: Define and develop feasible opportunities to reduce emissions by implementing combined heat
and power and distributed generation.
Annual Savings Potential by 2030 MTCO2e not quantified
Energy savings and emissions not quantified. This sub‐action proposes study to determine savings potential.
Implementation Summary
This action proposes joint action between Bridgeport’s in‐place Energy Improvement District (EID), State
DECD and CDA, local business, and regional planning entities to investigate potential for reducing energy
consumption and emissions by a) aggregating heating loads and b) identifying best sites for combined heat
and power (CHP) and distributed energy (DE) based on proposed redevelopment and also based upon
potential near Bridgeport power plant. This action also proposes exploration of the potential to receive
Thermal Energy Efficiency Fund support, if associated federal legislation provides for fund establishment.
Upon implementation, this action may offer energy reduction, emissions reduction and financial savings.
Additional Considerations
This action can prove a critical first step in linking land planning and development/redevelopment to energy
demand and supply and potential for reducing emissions through optimally efficient energy delivery systems.
The Connecticut Energy Advisory Board is supporting study related to CHP potential. Although it is generally
believed Connecticut’s large‐size CHP potential has been tapped, there may very well be opportunities for
smaller‐site development. Several cities are beginning to require CHP evaluation as part of building
construction, exceeding a certain size threshold.187
Large‐scale retrofit projects at Bridgeport buildings should consider CHP potential. Large gas combined cycle
turbines are one of the least expensive to install.
Fuel cells are another technology to consider in Bridgeport redevelopment planning. Fuel cells are generally
considered more efficient in producing electricity than many other CHP technologies and have lower
emissions, but also have higher capital costs. 188 The CEAB reports fuel cells are a good fit for distributed
generation CHP applications due to the large release of heat related to their operation, and notes efficiencies
upwards of 90 percent may result from their use in this manner.189 Connecticut, unlike many other states,
considers fuel cells as a renewable energy source under its Renewable Portfolio Standard guidelines.

Bridgeport Energy Efficiency and Conservation Plan 77
Several major cities, including London and Copenhagen, have embraced DG and CHP in recent or relatively
recent timeframes with extremely favorable emissions reduction results. Nearly 60 percent of Denmark’s
electricity is coproduced with heat, and over 97 percent of Copenhagen’s 35,000 buildings do not have a boiler
or smokestack owing to district heat, which is delivered through 800 miles of underground piping. Eighteen
years’ time and $562 million created most of the system. More recently, London has begun to invest $7.5‐10.5
billion in infrastructure to supply a quarter of its energy demand from decentralized sources by 2020.190
At the federal level, discussions are ongoing to create a Thermal Energy Fund, supported by proceeds from the
auction of two percent of carbon emission allowances, which would be made available to entities, including
local governments, to finance district heat energy, CHP, and recoverable waste energy projects. Related
action would formally establish a goal for combined heat and power of 20 percent or more of total U.S.
electrical power capacity.191 Short‐term planning, on Bridgeport’s part, can well position the City for longer‐
term opportunities.
ACTION 3 RESIDENTIAL AND COMMERCIAL SOLAR ENERGY
Sub Action 3.1 ‐ Solar pv on flat‐roof residential buildings
Goal: Meet one third of electricity demand per building192 at 15% of flat‐roof residential buildings
through on‐site solar systems.
Annual Savings Potential by 2030 279 MTCO2e
Per household savings potential
4,800 kWh electricity193 2 MTCO2e194
Implementation Summary
This action assumes installation of a 4 KW solar PV system on15% of the city’s 934195 flat‐roof residential
buildings, or 140 buildings.
This action can be accomplished as follows:
Implementation unit: 10 buildings
Implementation units needed: 14
Implementation Schedule
2010‐15 2015‐20 2020‐25 2025‐30 2010 to 2030 Total
Percent 0.1 0.3 0.4 0.2 1.0
No. units 1 4 6 3 14
MTCO2e 28 84 112 56 279

Bridgeport Energy Efficiency and Conservation Plan 78
Upon full implementation, this action may offer the following savings per year.196
Electricity 672,000 kWh $161,300
This action may result in average annual savings per building of $1,152, but savings would be offset, in part,
by system installation cost.
Additional Considerations
The majority of solar installation phase‐in in this Energy Plan is deferred to the 2015‐2020 and 2020‐2025
time periods. The Connecticut Energy Advisory Board (CEAB) notes costs of solar pv systems are relatively
high, compared with other energy‐ and emissions‐ saving measures, particularly conservation and efficiency.
CEAB notes solar installation costs are decreasing, and are expected to continue to decrease, making slight
delay in implementation potentially more worthwhile financially.197
The City of Bridgeport is evaluating responses to an RFP for multi‐site solar development potential of more
than 20 MW installed capacity, and possible power purchase agreement opportunities. The Bridgeport Energy
Improvement District may be able to participate in solar development and financing options.
Connecticut, through its Connecticut Clean Energy Fund, has a solar incentive program in place, but
oversubscription periodically reduces fund availability.
Solar PV installed on residential flat roof properties is estimated to create job potential for 7.28 fulltime
equivalent work years.198
Sub Action 3.2 ‐ Solar pv on pitched roof residential buildings
Goal: Meet one third of electricity demand per building199 at 10% of pitched roof residential buildings
through on‐site solar systems.
Annual Savings Potential by 2030 4,370 MTCO2e
Per household savings potential
4,800 kWh electricity200 2 MTCO2e
Implementation Summary
This action assumes installation of a 4 KW solar PV system on 10% of the city’s 21,932 pitched roof residential
buildings, or 2,193 buildings.
This action can be accomplished as follows:
Implementation unit: 10 buildings
Implementation units needed: 219.3

Bridgeport Energy Efficiency and Conservation Plan 79
Implementation Schedule
2010‐15 2015‐20 2020‐25 2025‐30 2010 to 2030 Total
Percent 0.1 0.3 0.4 0.2 1.0
No. units 22 66 88 44 220201
MTCO2e 437 1,311 1,748 874 4,370
Upon full implementation, this action may offer the following savings per year.202
Electricity 10,526,400 kWh $2,526,300
This action may result in average annual savings per building of $1,152.
Additional Considerations
The majority of solar installation phase‐in is deferred to the 2015‐2020 and 2020‐2025 time periods. The
Connecticut Energy Advisory Board (CEAB) notes costs of solar pv systems are relatively high, compared with
other energy‐ and emissions‐ saving measures, particularly conservation and efficiency. CEAB notes solar
installation costs are decreasing, and are expected to continue to decrease, making slight delay in
implementation potentially more worthwhile financially.203
The City of Bridgeport is evaluating responses to an RFP for multi‐site solar development and possible power
purchase agreement opportunities. The Bridgeport Energy Improvement District may be able to participate in
solar development and financing options.
Connecticut, through its Connecticut Clean Energy Fund, has a solar incentive program in place, but
oversubscription may reduce fund availability.
Installation of solar PV on pitched roof residential buildings is estimated to create job potential for 114
fulltime equivalent work years.204
Sub Action 3.3 ‐ Solar thermal on pitched roof residential buildings
Goal: Meet 70% of hot water needs per building205 at 15% of the city’s 21,932 pitched roof residential
buildings206 through on‐site solar thermal systems.
Annual Savings Potential by 2030 9,170 MTCO2e
Per household savings potential
22.02 thousand cf natural gas207 1.3 MTCO2e208
0.162 thousand gallons heating oil 1.5 MTCO2e
Implementation Summary

Bridgeport Energy Efficiency and Conservation Plan 80
This action assumes installation of 3‐collector solar thermal systems on 3,290 pitched roof residential
buildings209.
This action can be accomplished as follows:
Implementation unit: 10 buildings
Implementation units needed: 329
Implementation Schedule
2010‐15 2015‐20 2020‐25 2025‐30 2010 to 2030 Total
Percent 0.2 0.3 0.4 0.1 1.0
No. units 66 99 132 33 329
MTCO2e 1,834 2,751 3,668 917 9,170
Upon full implementation, this action may offer the following savings per year.210
Natural Gas 72,437 thousand cf $ 1,072,800
Light fuel oil 532 thousand gallons $ 1,409,800
This action may result in average annual savings per building of approximately $750.
Additional considerations
The majority of solar installation phase‐in is deferred to the 2015‐2020 and 2020‐2025 time periods. The
Connecticut Energy Advisory Board (CEAB) notes costs of solar pv systems are relatively high, compared with
other energy‐ and emissions‐ saving measures, particularly conservation and efficiency. CEAB notes solar
installation costs are decreasing, and are expected to continue to decrease, making slight delay in
implementation potentially more worthwhile financially.211
The City of Bridgeport is evaluating responses to an RFP for multi‐site solar development and possible power
purchase agreement opportunities. The Bridgeport Energy Improvement District may be able to participate in
solar thermal development and financing options.
Connecticut, through its Connecticut Clean Energy Fund, has a solar thermal incentive program in place, but
oversubscription may reduce fund availability.
Solar thermal installation is less expensive than solar PV system installation. Some parts of Hawaii require
solar thermal installation on new construction.
Solar thermal installation on pitched roof residential buildings is estimated to create job potential for 118
fulltime equivalent work years.212
Sub Action 3.4 ‐ Solar pv on existing flat roof commercial buildings

Bridgeport Energy Efficiency and Conservation Plan 81
Goal: Reduce electricity‐related emissions by 20% per building at 30% of the city’s 1,532 existing flat roof
commercial buildings through on‐site solar PV systems.213
Annual Savings Potential by 2030 16,663 MTCO2e
Per building savings potential
87,258 kWh electricity214 36.2 MTCO2e215
Implementation Summary
This action assumes installation of 73 KW (average size)216 on‐site solar PV system at 460 existing flat roof
commercial buildings.
This action can be accomplished as follows:
Implementation unit: 10 buildings
Implementation units needed: 46
Implementation Schedule
2010‐15 2015‐20 2020‐25 2025‐30 2010 to 2030 Total
Percent 0.1 0.3 0.4 0.2 1.0
No. units 5 14 18 9 46
MTCO2e 1,666 4,999 6,665 3,333 16,663
Upon full implementation, this action may offer the following savings per year.217
Electricity 40,138,487 kWh $9,633,200
This action may result in average annual savings per building of $20,900.
Additional Considerations
The majority of solar installation phase‐in is deferred to the 2015‐2020 and 2020‐2025 time periods. The
Connecticut Energy Advisory Board (CEAB) notes costs of solar pv systems are relatively high, compared with
other energy‐ and emissions‐ saving measures, particularly conservation and efficiency. CEAB notes solar
installation costs are decreasing, and are expected to continue to decrease, making slight delay in
implementation potentially more worthwhile financially.218
The City of Bridgeport is evaluating responses to an RFP for multi‐site solar development and possible power
purchase agreement opportunities. The Bridgeport Energy Improvement District may be able to participate in
solar development and financing options.
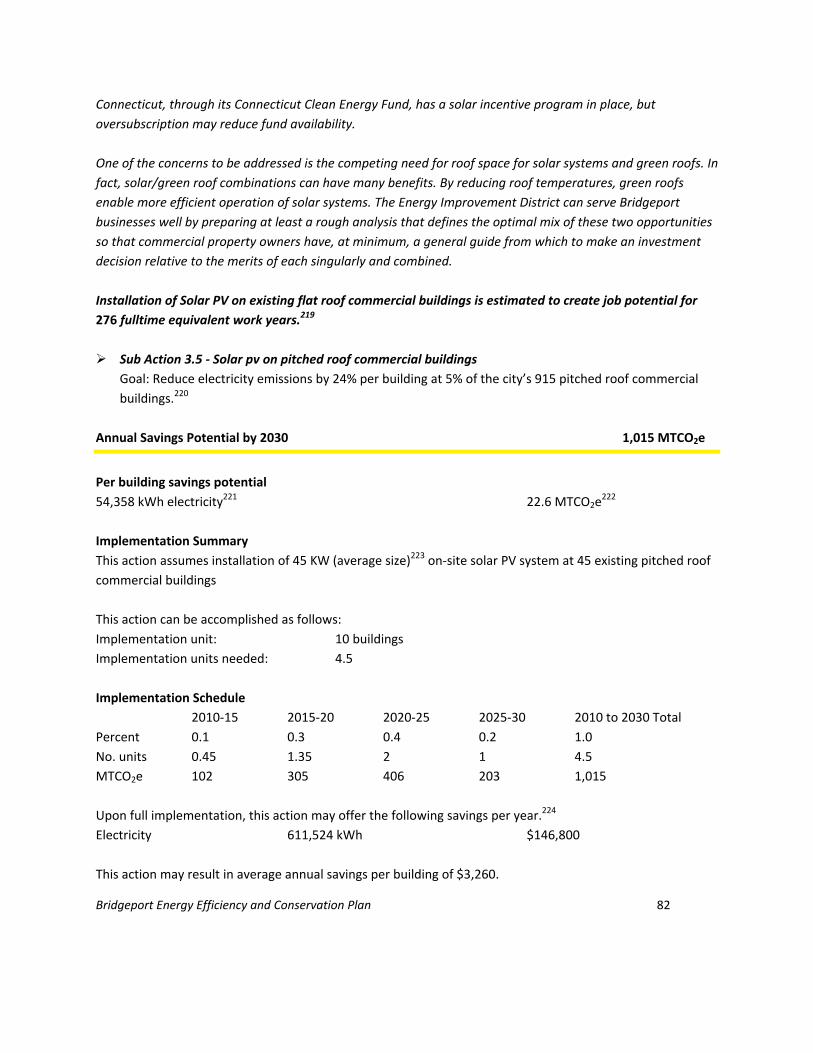
Bridgeport Energy Efficiency and Conservation Plan 82
Connecticut, through its Connecticut Clean Energy Fund, has a solar incentive program in place, but
oversubscription may reduce fund availability.
One of the concerns to be addressed is the competing need for roof space for solar systems and green roofs. In
fact, solar/green roof combinations can have many benefits. By reducing roof temperatures, green roofs
enable more efficient operation of solar systems. The Energy Improvement District can serve Bridgeport
businesses well by preparing at least a rough analysis that defines the optimal mix of these two opportunities
so that commercial property owners have, at minimum, a general guide from which to make an investment
decision relative to the merits of each singularly and combined.
Installation of Solar PV on existing flat roof commercial buildings is estimated to create job potential for
276 fulltime equivalent work years.219
Sub Action 3.5 ‐ Solar pv on pitched roof commercial buildings
Goal: Reduce electricity emissions by 24% per building at 5% of the city’s 915 pitched roof commercial
buildings.220
Annual Savings Potential by 2030 1,015 MTCO2e
Per building savings potential
54,358 kWh electricity221 22.6 MTCO2e222
Implementation Summary
This action assumes installation of 45 KW (average size)223 on‐site solar PV system at 45 existing pitched roof
commercial buildings
This action can be accomplished as follows:
Implementation unit: 10 buildings
Implementation units needed: 4.5
Implementation Schedule
2010‐15 2015‐20 2020‐25 2025‐30 2010 to 2030 Total
Percent 0.1 0.3 0.4 0.2 1.0
No. units 0.45 1.35 2 1 4.5
MTCO2e 102 305 406 203 1,015
Upon full implementation, this action may offer the following savings per year.224
Electricity 611,524 kWh $146,800
This action may result in average annual savings per building of $3,260.

Bridgeport Energy Efficiency and Conservation Plan 83
Additional Considerations
The majority of solar installation phase‐in is deferred to the 2015‐2020 and 2020‐2025 time periods. The
Connecticut Energy Advisory Board (CEAB) notes costs of solar pv systems are relatively high, compared with
other energy‐ and emissions‐ saving measures, particularly conservation and efficiency. CEAB notes solar
installation costs are decreasing, and are expected to continue to decrease, making slight delay in
implementation potentially more worthwhile financially.225
The City of Bridgeport is evaluating responses to an RFP for multi‐site solar development and possible power
purchase agreement opportunities. The Bridgeport Energy Improvement District may be able to participate in
solar development and financing options.
Connecticut, through its Connecticut Clean Energy Fund, has a solar incentive program in place, but
oversubscription may reduce fund availability.
Installation of Solar PV on pitched roof commercial buildings is estimated to create job potential for 27
fulltime equivalent work years.226
Sub Action 3.6 ‐ Solar pv on new flat roof commercial buildings under Low Growth scenario
Sub Action 3.7 ‐ Solar pv on additional new flat roof commercial buildings under High Growth scenario
Goal: Reduce electricity‐related emissions by 20% per building through solar system installation on 15%
of new commercial buildings.227
Annual Savings Potential by 2030 (Low Growth) 1,232 MTCO2e
Additional Annual Savings Potential by 2030 (High Growth) 1,051 MTCO2e
Per building savings potential
87,258 kWh electricity228 36.2 MTCO2e229
Implementation Summary
Sub Action 3.6 and Sub Action 3.7
This action assumes installation of 73 KW (average) solar PV on 34 new commercial buildings under Low
Growth Scenario and 29 additional new buildings under the High Growth scenario.
Sub Action 3.6 (Low Growth) can be accomplished as follows:
Implementation unit: 10 buildings
Implementation units needed: 3.5
Implementation Schedule
2010‐15 2015‐20 2020‐25 2025‐30 2010 to 2030 Total

Bridgeport Energy Efficiency and Conservation Plan 84
Percent 0.25 0.25 0.25 0.25 1.0
No. units 0.85 0.85 0.85 0.85 3.5
MTCO2e 308 308 308 308 1,232
Upon full implementation, this action may offer the following savings per year.230
Electricity 2,966,758 kWh $712,000
Sub Action 3.7 (High Growth) can be accomplished as follows:
Implementation unit: 10 buildings
Implementation units needed: 2.9
Implementation Schedule
2010‐15 2015‐20 2020‐25 2025‐30 2010 to 2030 Total
Percent 0 0.2 0.4 0.4 1.0
No. units 0 0.58 1.16 1.16 2.9231
MTCO2e 0 210 420 420 1,051
Upon full implementation, this action may offer the following savings per year.232
Electricity 2,530,470 kW $607,300
Each of these actions may result in average annual savings per building of $20,940.
Additional Considerations
The majority of solar installation phase‐in is deferred to the 2015‐2020 and 2020‐2025 time periods. The
Connecticut Energy Advisory Board (CEAB) notes costs of solar pv systems are relatively high, compared with
other energy‐ and emissions‐ saving measures, particularly conservation and efficiency. CEAB notes solar
installation costs are decreasing, and are expected to continue to decrease, making slight delay in
implementation potentially more worthwhile financially.233
The City of Bridgeport is evaluating responses to an RFP for multi‐site solar development and possible power
purchase agreement opportunities. The Bridgeport Energy Improvement District may be able to participate in
solar development and financing options.
Connecticut, through its Connecticut Clean Energy Fund, has a solar incentive program in place, but
oversubscription may reduce fund availability.
Installation of solar PV on new flat roof commercial buildings under Low Growth scenario is estimated to
create job potential for 20.4 fulltime equivalent work years.

Bridgeport Energy Efficiency and Conservation Plan 85
Installation of Solar PV on new flat roof commercial buildings under High Growth scenario is estimated to
create job potential for 17.4 fulltime equivalent work years.
Sub Action 3.8 ‐ EID Opportunities for On‐site Renewable Development
Goal: Capitalize on the EID’s unique capabilities to support renewable energy development.
Annual Savings Potential by 2030 MTCO2e not quantified
Implementation Summary and Considerations
Bridgeport’s existing Energy Improvement District may play a critical leadership role in forwarding the City of
Bridgeport’s efforts to establish on‐site renewable energy systems. The City is currently evaluating
submissions related to the creation of scattered‐site solar PV on 183 acres in Bridgeport’s Downtown. The
EID’s bonding capacity, and unique organizational structure, enable it to lend financial and other assistance
to the process of aggregating the power potential of scattered on‐site renewable installations and developing
power supply relationships with generation partners. The EID may use its own financial capacity to great
effect to leverage other existing funds to support renewable energy development in Bridgeport.
The EID should look to other municipalities, which have demonstrated visible and effective investment in
development of solar, solar thermal, and associated green roof installations as models for maximizing its
ability to establish renewable energy in Bridgeport.
ACTION 4 UTILITY SCALE POLICIES AND PROGRAMS FOR REGIONAL RENEWABLE ENERGY
DEVELOPMENT
Goal: Reduce emissions though utility‐scale policies and programs, which develop increased
renewable capacity for electricity generation.
Annual Savings Potential by 2030 MTCO2e not quantified
Implementation Summary and Considerations
Connecticut energy distributors are working closely with others in New England to develop the best roadmap
for developing renewable energy. New England Governors have joined together to support this regional
renewable initiative through their New England Governor’s 2009 Renewable Blueprint initiative.234
Connecticut’s Renewable Portfolio Standard is the most stringent in the region, and recent analysis suggests
Connecticut cannot meet its RPS in a cost effective manner via in‐state renewable resources. Procurement
through the New England regional market is currently viewed as Connecticut’s preferred strategy for meeting
its RPS. Regionally, onshore wind is viewed as the most favorable renewable fuel source. High transmission
infrastructure costs associated with this type of capacity expansion are still expected to be less than the cost
of on‐site renewable development in state.235 The Connecticut Energy Advisory Board reports the most

Bridgeport Energy Efficiency and Conservation Plan 86
economic mix of renewable resources for the New England region is 42 percent wind, 35 percent biomass, 10
percent offshore wind, 6 percent solar, 3 percent hydro, 2 percent landfill gas, and 2 percent fuel cells by
energy. 236 How New England develops and distributes renewable energy will impact future emissions
associated with energy use in Bridgeport. Furthermore, how the Connecticut governing bodies allocate funds
associated with renewable energy and energy and efficiency programs will critically impact renewable energy
development and emissions in Bridgeport as well as all state municipalities.

Bridgeport Energy Efficiency and Conservation Plan 87
This page intentionally left blank
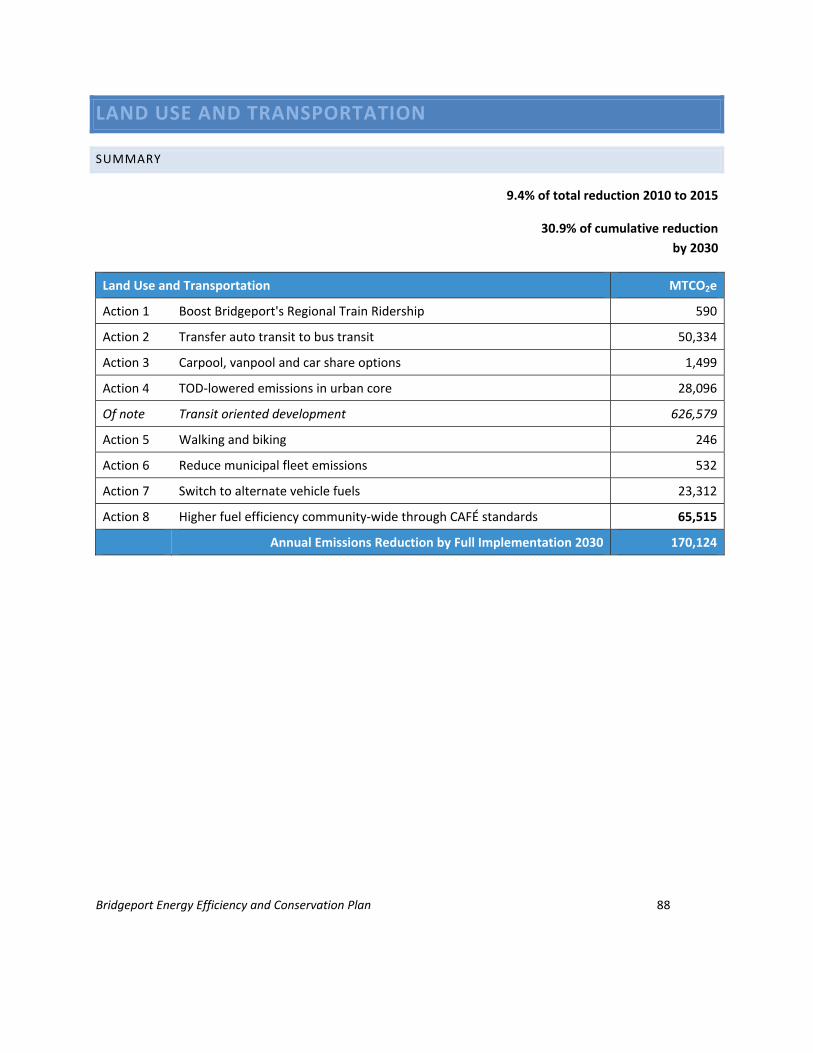
Bridgeport Energy Efficiency and Conservation Plan 88
LAND USE AND TRANSPORTATION
SUMMARY
9.4% of total reduction 2010 to 2015
30.9% of cumulative reduction
by 2030
Land Use and Transportation MTCO2e
Action 1 Boost Bridgeport's Regional Train Ridership 590
Action 2 Transfer auto transit to bus transit 50,334
Action 3 Carpool, vanpool and car share options 1,499
Action 4 TOD‐lowered emissions in urban core 28,096
Of note Transit oriented development 626,579
Action 5 Walking and biking 246
Action 6 Reduce municipal fleet emissions 532
Action 7 Switch to alternate vehicle fuels 23,312
Action 8 Higher fuel efficiency community‐wide through CAFÉ standards 65,515
Annual Emissions Reduction by Full Implementation 2030 170,124

Bridgeport Energy Efficiency and Conservation Plan 89
SAVINGS (annual by full implementation)
Electricity ‐ $0.36 million
Gasoline/diesel $ 53.7 million
GAINS
Vehicle miles equivalent fuel reduction 714 million
Fulltime equivalent work‐years 10
Narrative Summary
Plan action items related to land use and transportation are estimated to have savings potential of $53
million in energy costs a year, upon full implementation. Emissions reduction is the equivalent of roughly
715 million VMT a year.
Land use and transportation are intertwined in their impact on carbon emissions. Bridgeport’s greatest
opportunity to effect regional emissions reductions is to redevelop. Households, employment centers,
cultural and entertainment venues can be located close to the City’s urban core and public transit.
Recently‐revised zoning enables this. Bridgeport emissions will increase from additional in‐use structures,
but emissions to the region may be avoided if development occurs “in‐city” in place of sprawled
development.
6,000 new households in the urban core will create lower net energy demand and emissions increases
than suburban development, owing to more energy‐efficient urban form and potential for reduced
dependence on automobile usage.

Bridgeport Energy Efficiency and Conservation Plan 90
Along with “in‐city” housing must come support services to decrease reliance on the automobile. These
include expanded bus service, shuttle vans to job sites and mechanisms for developing carpools and car
share and/or bike share programs.
An easy opportunity to reduce transportation emissions is to transfer work and non‐work trips under 1‐
mile immediately from automobile VMT to walk or bike VMT. Outreach will be needed to encourage this
shift. Schools can play a vital role in bringing students to neighborhood schools in walking or bicycling
groups in place of automobiles.
Flat topography in the City’s southern section makes Bridgeport easily‐bikeable, and the streets can be
made even more bike and pedestrian‐friendly through “Complete Streets” development, which is in its
nascent stage, under City‐direction.
Beyond Bridgeport’s control are the several hundred thousand vehicles that pass through the City on
interstate highways daily. Emissions from vehicles passing through the City will be reduced over time as
Federal CAFÉ standards prompt more fuel efficient cars and light trucks. Certain reductions will also
occur as alternate fueled vehicles begin to enter the market. Connecticut’s Electric Vehicles
Infrastructure Council (CEVIC) is currently targeting Connecticut for PEV development, although overall
market penetration will likely be small.237
Also beyond Bridgeport’s immediate control is investment in transit. Such investment must continue as
part of State and regional smart growth, transport, economic development, and environmental health
strategies. Transit alternatives must be provided to reduce single occupancy vehicle travel, congestion,
and poor air quality days, and to enable expanded opportunity to the job market for those unable to
afford cars.
In relation to Green Buildings and Renewable Energy, Transportation and Land Use strategies offer fewer
direct job opportunities, but many indirect job opportunities and economic development openings
result.
ACTION 1 BOOST BRIDGEPORT'S REGIONAL TRAIN RIDERSHIP
Sub Action 1.1 ‐ Shift workday travel from roadway to train
Goal: Transfer 10,000 vehicle miles of work‐related travel per year from roadway to train for Bridgeport
start point or end point.
Annual Savings Potential by 2030 258 MTCO2e
Per person (single driver) savings potential238

Bridgeport Energy Efficiency and Conservation Plan 91
‐878 KWh electricity ‐0.4 MTCO2e239
64.05 gallons gasoline 0.6 MTCO2e
Total 0.3 MTCO2e
1,000 VMT reduction
Implementation Summary
This action assumes 1,000 persons will transfer work‐related travel, averaging 4‐miles round trip to
Bridgeport start points or end points, from roadway to train.240
This action can be accomplished as follows:
Implementation unit: 20 persons (drivers)
Implementation units needed: 50
Implementation Schedule
2010‐15 2015‐20 2020‐25 2025‐30 2010 to 2030 Total
Percent 0.2 0.3 0.3 0.2 1.0
No. units 10 15 15 10 50
MTCO2e 52 77 77 52 258
Upon full implementation, this action may offer the following savings per year.241
Electricity ‐878077.4557 kWh increase ‐$210,700
Gasoline 64, 051 gallons $192,200
This action may result in annual average savings per person of $192 for gasoline for travel in Bridgeport
alone. More gasoline savings may be realized for continued travel beyond Bridgeport. Gasoline savings would
be offset in part by transit costs.
Additional Considerations
Redevelopment in Bridgeport’s downtown core will open up opportunities for increased train ridership into
the city by employees from neighboring towns and out of the city by new residents. Train ridership is usually
cost‐effective to riders, particularly when considering the cost of automobile insurance and maintenance, but
a shift to train ridership faces the real or perceived barrier of longer commute time, inconvenience and lack of
parking opportunity in surrounding town train stations. It will be important to market the cost benefits of
train ridership and also to ensure suitable transfers are available, if needed. Further, opportunities to park at,
or otherwise access, neighboring commuter train stops, to enable train ridership into Bridgeport, must be
addressed at local, regional and state levels.

Bridgeport Energy Efficiency and Conservation Plan 92
Train ridership can provide household savings, improved air quality, reduced congestion on roadways, access
to jobs for persons who do not own a car, and, in some cases, increased physical activity associated with
walking to train stops.
The American Public Transportation Association finds that households with two workers, one car and access
to transit can save over $6,000 a year.242
Employment potential for this action was not quantified.
Sub Action 1.2 ‐ Increase shuttle van service from transit center to employment centers to promote
train ridership
Goal: Transfer 1,000,000 vehicle miles of automobile travel to train travel by establishing 20 shuttle vans
to promote train ridership by 720 persons working, visiting, or attending school in Bridgeport.
Annual Savings Potential by 2030 332 MTCO2e
Savings potential per shuttle van (serves 36 persons with multiple trips)
kWh electricity ‐31,611243 ‐13.1 MTCO2e244
Gallons gasoline 3,059 29.7 MTCO2e
Total emissions savings 16.6 MTCO2e
1,000,000 VMT reduction per van
Implementation Summary
This action assumes 20 new shuttle vans will be established to transport 720 workers, students and/or
visitors to and from the train station and will promote train ridership as a result.
This action can be accomplished as follows:
Implementation unit: 4 shuttle vans
Implementation units needed: 5
Implementation Schedule
2010‐15 2015‐20 2020‐25 2025‐30 2010 to 2030 Total
Percent 0.1 0.3 0.3 0.3 1.0
No. units 0.5 1.50 1.50 1.50 5
MTCO2e 33 100 100 100 332
Upon full implementation, this action may offer the following savings per year.245
Electricity ‐632,218 kWh ‐$151,732
Gasoline 61,176 gallons $183,500

Bridgeport Energy Efficiency and Conservation Plan 93
This action may result in annual average savings per person of $192 for gasoline, which would be offset in
part by transit costs, but would be supported by reduced personal automobile maintenance costs.246
Additional Considerations
Several Bridgeport employers currently provide shuttle service between the train station and work locations.
Additional employers must partner in this effort. The Bridgeport Regional Business Council and City of
Bridgeport can, together, act as leaders in promoting the increase in van service. Bridgeport’s EID can help
focus study on additional businesses that may have shuttle van opportunities.
Similar to any effort aimed at increasing train ridership, this action item faces real or perceived barriers
associated with train travel, including longer commute time, inconvenience and lack of parking opportunity in
surrounding town train stations. It will be important to market the cost benefits of train ridership. Further,
opportunities to park at, or otherwise access, neighboring commuter train stops, to enable train ridership into
Bridgeport, must be addressed at local, regional and state levels.
Train ridership can provide household savings, improved air quality, reduced congestion on roadways, access
to jobs for persons who do not own a car, and, in some cases, increased physical activity associated with
walking to train stops.
Some municipalities are creating incentives for transit ridership over personal auto travel through both direct
transit incentives and parking disincentives.
Although transporting riders short distances, the value of shuttle van service will be apparent in cumulative
VMT reduction, reduced congestion and quality of street life in Bridgeport’s inner core.
Increased shuttle van service is estimated to create job potential for 10 fulltime equivalent work years.247
ACTION 2 TRANSFER AUTO TRANSIT TO BUS TRANSIT
Sub Action 2.1 ‐ Shift Automobile Transit to Bus Transit
Goal: Transfer 1,188,000 vehicle miles of work‐related travel per year from roadway to bus for
Bridgeport start point or end point.248
Annual Savings Potential by 2030 1,452 MTCO2e
Per person (driver) savings potential249
243 gallons gasoline 2.4 MTCO2e
1,980 VMT reduction per person
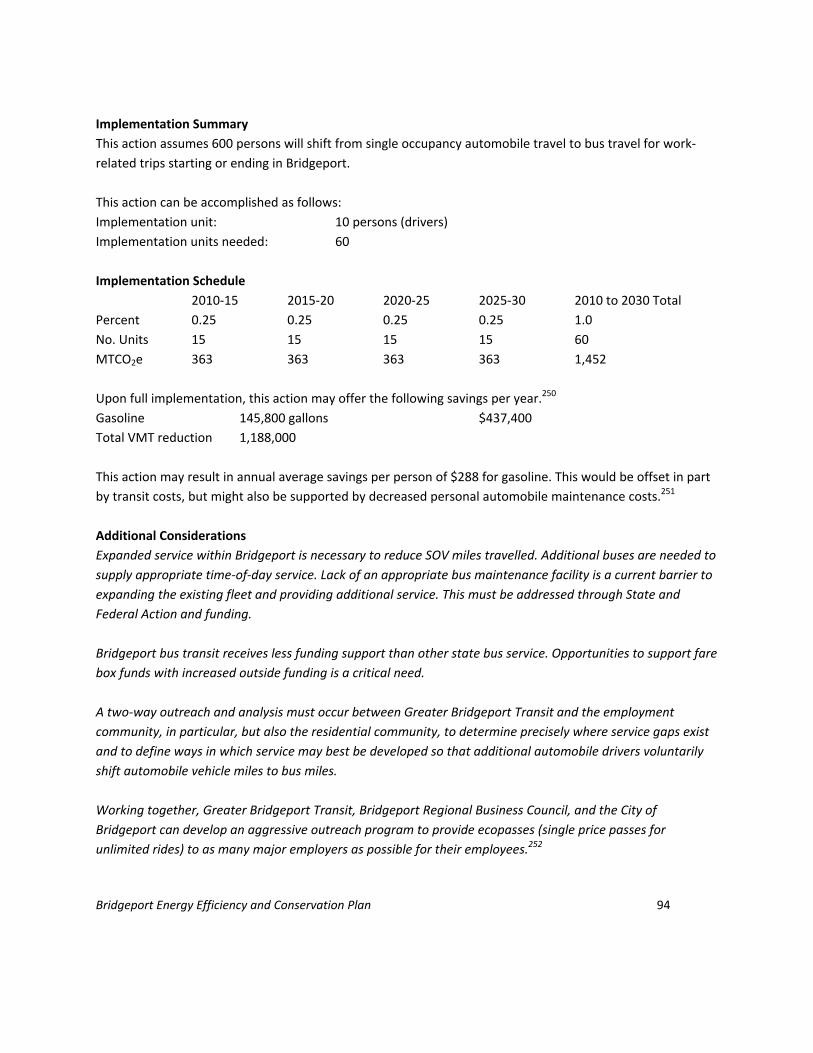
Bridgeport Energy Efficiency and Conservation Plan 94
Implementation Summary
This action assumes 600 persons will shift from single occupancy automobile travel to bus travel for work‐
related trips starting or ending in Bridgeport.
This action can be accomplished as follows:
Implementation unit: 10 persons (drivers)
Implementation units needed: 60
Implementation Schedule
2010‐15 2015‐20 2020‐25 2025‐30 2010 to 2030 Total
Percent 0.25 0.25 0.25 0.25 1.0
No. Units 15 15 15 15 60
MTCO2e 363 363 363 363 1,452
Upon full implementation, this action may offer the following savings per year.250
Gasoline 145,800 gallons $437,400
Total VMT reduction 1,188,000
This action may result in annual average savings per person of $288 for gasoline. This would be offset in part
by transit costs, but might also be supported by decreased personal automobile maintenance costs.251
Additional Considerations
Expanded service within Bridgeport is necessary to reduce SOV miles travelled. Additional buses are needed to
supply appropriate time‐of‐day service. Lack of an appropriate bus maintenance facility is a current barrier to
expanding the existing fleet and providing additional service. This must be addressed through State and
Federal Action and funding.
Bridgeport bus transit receives less funding support than other state bus service. Opportunities to support fare
box funds with increased outside funding is a critical need.
A two‐way outreach and analysis must occur between Greater Bridgeport Transit and the employment
community, in particular, but also the residential community, to determine precisely where service gaps exist
and to define ways in which service may best be developed so that additional automobile drivers voluntarily
shift automobile vehicle miles to bus miles.
Working together, Greater Bridgeport Transit, Bridgeport Regional Business Council, and the City of
Bridgeport can develop an aggressive outreach program to provide ecopasses (single price passes for
unlimited rides) to as many major employers as possible for their employees.252

Bridgeport Energy Efficiency and Conservation Plan 95
Cost savings of transit ridership is a built‐in incentive to bus ridership, but barriers or perceived barriers
related to extra travel time, added wait time, safety and convenience, must be overcome.
Employment potential associated with a shift of ridership from automobile to bus was not quantified by
this energy plan.
Sub Action 2.2 ‐ Create BRT to shift 40,000,000 VMT as expressway "thru" miles
Goal: Shift 40,000,000 VMT of “thru transit” on Bridgeport expressways to bus/BRT.
Annual Savings Potential by 2030 48,882 MTCO2e
Savings potential253 per 5‐mile trip
0.61 gallons gasoline254 0.001 MTCO2e
5 mile VMT reduction per trip
Implementation Summary
This action assumes bus transit will be developed to accommodate approximately 5% of expected 715 million
annual VMT in 2030 and transfer 22,000 vehicles per day traveling “thru” Bridgeport on I‐95 and Route 8/25
to bus transit.255
This action can be accomplished as follows:
Implementation unit: 5% shift in ridership from SOV to BRT
Implementation units needed: 20
Implementation Schedule
2010‐15 2015‐20 2020‐25 2025‐30 2010 to 2030 Total
Percent 0.1 0.4 0.5 0 1.0
No. units 2 8 10 0 20
MTCO2e 4,888 19,553 24,441 0 0 48,882
Upon full implementation, this action may offer the following savings per year.256
Gasoline 4,913,805 gallons $14,741,400
Total VMT reduction 40,000,000
Additional Considerations
A significant number of vehicle miles travelled within Bridgeport, and counted toward Bridgeport’s GHG
Inventory, are associated with travel “thru” Bridgeport and require regional and state action to reduce.
Increased transit service, to reduce “thru” miles may be provided through Bus Rapid Transit and/or train
ridership. Successful completion of this action requires State‐level leadership and action.

Bridgeport Energy Efficiency and Conservation Plan 96
A reduction of 40,000,000 VMT represents approximately 5% of the projected 715 Million VMT expected
under the High Growth scenario.257 Assuming this mileage is divided 50% I‐95 thru traffic and 50% Route 8/25
“thru” traffic, over 22,000 automobile trips could be eliminated each day.
Employment opportunities associated with this measure are anticipated, but were not quantified by this
energy plan.
ACTION 3 TRANSFER SOV VMT TO CARPOOL, VANPOOL AND CAR SHARE OPTIONS
Sub Action 3.1 ‐ Establish carpools to accommodate 400 riders on work‐related trips
Goal: Achieve 720,000 VMT reduction by replacing single occupancy automobile trips with carpools.
Annual Savings Potential by 2030 448 MTCO2e
Savings potential per car pool
115 gallons gasoline258 1.1 MTCO2e259
1,800 VMT reduction per car pool
Implementation Summary
This action assumes 400 drivers will switch from single driver vehicles to carpools for work‐related trips with
Bridgeport start or end point.
This action can be accomplished as follows:
Implementation unit: 5 car pools
Implementation units needed: 80
Implementation Schedule
2010‐15 2015‐20 2020‐25 2025‐30 2010 to 2030 Total
Percent 0.2 0.3 0.3 0.2 1.0
No. units 16 24 24 16 80
MTCO2e 90 134 134 90 448
Upon full implementation, this action may offer the following savings per year.260
Gasoline 46,117 gallons $138,400
Total VMT reduction: 720,000

Bridgeport Energy Efficiency and Conservation Plan 97
This action may result in annual average savings per person of $157 for gasoline for miles travelled in
Bridgeport.261 This would be supported by decreased personal automobile maintenance costs as well as by
savings that might result from carpooled miles, which are part of these trips, but are travelled beyond
Bridgeport.
Additional Considerations
The City of Bridgeport can take a leadership role in demonstrating the potential for carpooling, as well as
other green travel methods. Programs such as NuRide can provide participants rewards for participation.
The Bridgeport Regional Business Council can support City efforts through outreach to local employers. Many
businesses and employees may be unfamiliar with possible carpool rewards programs.
MetroPool has shown some success in helping regional employers to establish SOV‐alternatives, and may be
able to expand outreach specifically to Bridgeport employers.
Benefits of carpooling, in terms of energy and emissions reductions, would realistically be greater than what is
quantified in this Energy Plan since car pool travel would likely originate or end beyond Bridgeport boundaries
and include greater distance travelled than the “in‐Bridgeport” miles. Savings reported in this Energy Plan
only relate to VMT within Bridgeport, to allow consistency with GHG inventory protocol and Bridgeport’s 2007
GHG Inventory.
Indirect employment opportunities only may be associated with this action.
Sub Action 3.2 ‐ Transfer Single Occupancy VMT to vanpool VMT
Goal: Achieve 105,000 VMT reduction by establishing vanpools at Bridgeport employment hubs.
Annual Savings Potential by 2030 65 MTCO2e
Savings potential per vanpool262
673 gallons gasoline 6.5 MTCO2e263
Implementation Summary
This action assumes vanpools will be established by 10 Bridgeport employment hubs to serve 80 persons on
work‐related travel.
This action can be accomplished as follows:
Implementation unit: 2 van pools
Implementation units needed: 5
Implementation Schedule
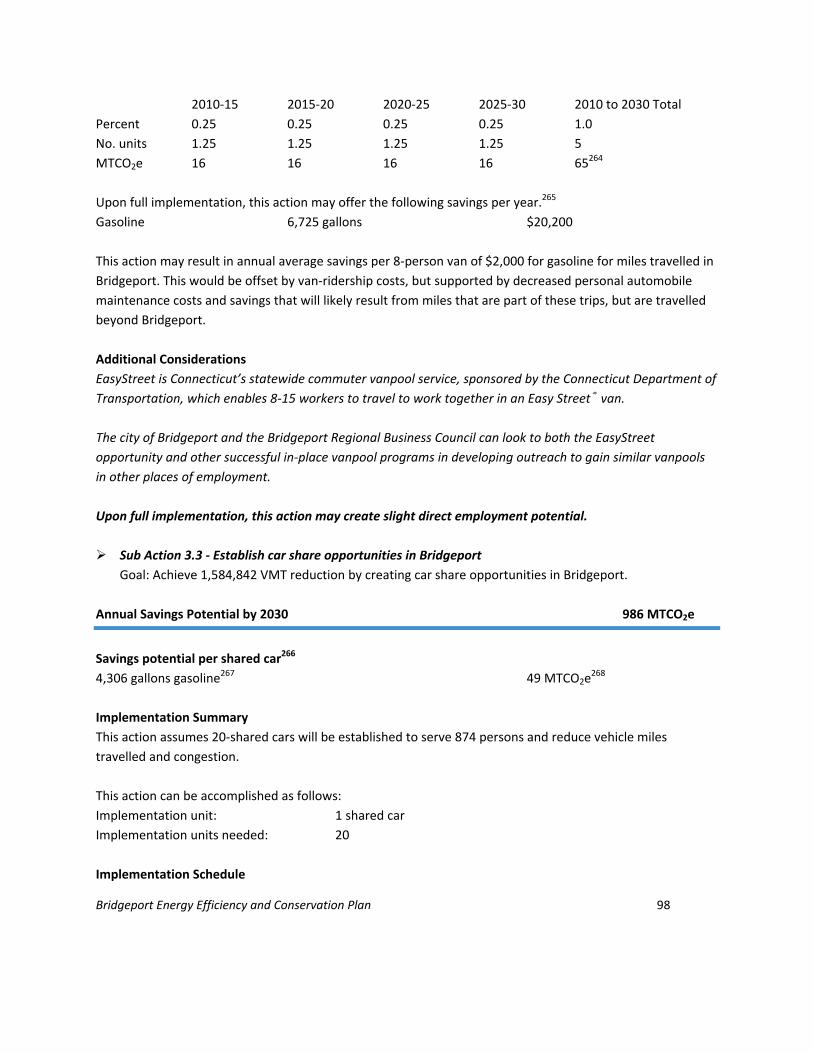
Bridgeport Energy Efficiency and Conservation Plan 98
2010‐15 2015‐20 2020‐25 2025‐30 2010 to 2030 Total
Percent 0.25 0.25 0.25 0.25 1.0
No. units 1.25 1.25 1.25 1.25 5
MTCO2e 16 16 16 16 65264
Upon full implementation, this action may offer the following savings per year.265
Gasoline 6,725 gallons $20,200
This action may result in annual average savings per 8‐person van of $2,000 for gasoline for miles travelled in
Bridgeport. This would be offset by van‐ridership costs, but supported by decreased personal automobile
maintenance costs and savings that will likely result from miles that are part of these trips, but are travelled
beyond Bridgeport.
Additional Considerations
EasyStreet is Connecticut’s statewide commuter vanpool service, sponsored by the Connecticut Department of
Transportation, which enables 8‐15 workers to travel to work together in an Easy Street® van.
The city of Bridgeport and the Bridgeport Regional Business Council can look to both the EasyStreet
opportunity and other successful in‐place vanpool programs in developing outreach to gain similar vanpools
in other places of employment.
Upon full implementation, this action may create slight direct employment potential.
Sub Action 3.3 ‐ Establish car share opportunities in Bridgeport
Goal: Achieve 1,584,842 VMT reduction by creating car share opportunities in Bridgeport.
Annual Savings Potential by 2030 986 MTCO2e
Savings potential per shared car266
4,306 gallons gasoline267 49 MTCO2e268
Implementation Summary
This action assumes 20‐shared cars will be established to serve 874 persons and reduce vehicle miles
travelled and congestion.
This action can be accomplished as follows:
Implementation unit: 1 shared car
Implementation units needed: 20
Implementation Schedule
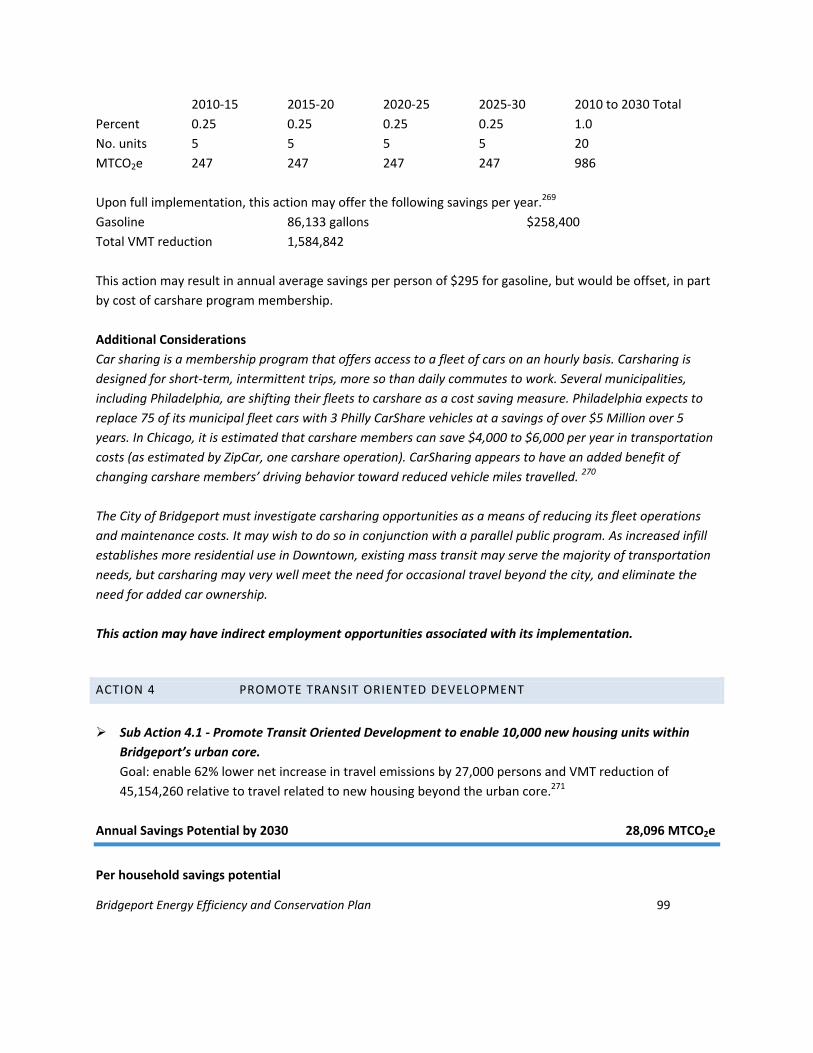
Bridgeport Energy Efficiency and Conservation Plan 99
2010‐15 2015‐20 2020‐25 2025‐30 2010 to 2030 Total
Percent 0.25 0.25 0.25 0.25 1.0
No. units 5 5 5 5 20
MTCO2e 247 247 247 247 986
Upon full implementation, this action may offer the following savings per year.269
Gasoline 86,133 gallons $258,400
Total VMT reduction 1,584,842
This action may result in annual average savings per person of $295 for gasoline, but would be offset, in part
by cost of carshare program membership.
Additional Considerations
Car sharing is a membership program that offers access to a fleet of cars on an hourly basis. Carsharing is
designed for short‐term, intermittent trips, more so than daily commutes to work. Several municipalities,
including Philadelphia, are shifting their fleets to carshare as a cost saving measure. Philadelphia expects to
replace 75 of its municipal fleet cars with 3 Philly CarShare vehicles at a savings of over $5 Million over 5
years. In Chicago, it is estimated that carshare members can save $4,000 to $6,000 per year in transportation
costs (as estimated by ZipCar, one carshare operation). CarSharing appears to have an added benefit of
changing carshare members’ driving behavior toward reduced vehicle miles travelled. 270
The City of Bridgeport must investigate carsharing opportunities as a means of reducing its fleet operations
and maintenance costs. It may wish to do so in conjunction with a parallel public program. As increased infill
establishes more residential use in Downtown, existing mass transit may serve the majority of transportation
needs, but carsharing may very well meet the need for occasional travel beyond the city, and eliminate the
need for added car ownership.
This action may have indirect employment opportunities associated with its implementation.
ACTION 4 PROMOTE TRANSIT ORIENTED DEVELOPMENT
Sub Action 4.1 ‐ Promote Transit Oriented Development to enable 10,000 new housing units within
Bridgeport’s urban core.
Goal: enable 62% lower net increase in travel emissions by 27,000 persons and VMT reduction of
45,154,260 relative to travel related to new housing beyond the urban core.271
Annual Savings Potential by 2030 28,096 MTCO2e
Per household savings potential

Bridgeport Energy Efficiency and Conservation Plan 100
289 gallons gasoline272 2.8 MTCO2e273
4,515‐vehicle mile reduction per household
Implementation Summary
This action assumes 10,000 new households will be created in Bridgeport’s urban core, close to transit and
employment opportunities.
Implementation unit: 10 households
Implementation units needed: 1,000
Implementation Schedule
2010‐15 2015‐20 2020‐25 2025‐30 2010 to 2030 Total
Percent 0.25 0.25 0.25 0.25 1.0
No. units 250 250 250 250 1,000
MTCO2e 7,024 7,024 7,024 7,024 28,096
Upon full implementation, this action may offer the following savings per year.274
Gasoline 2,892,218 gallons $8,676,700
This action may result in annual average savings per household of $860 for gasoline.
Additional Considerations
Residents in “smart growth” communities often enjoy cost savings over residents in more sprawled
communities due to decreased energy costs and less reliance on automobiles. Chicago metropolitan
households in transit‐served neighborhoods, for example, pay 15% of their income for transportation, as
opposed to 23% in households located in communities with no transit.275
Demand for TOD is rising with more households seeking to live close to commercial and entertainment
amenities. One source estimates the demand for housing near transit will reach 9 million households
nationally by 2020.276 Added benefits of “smart growth” development are decreased vehicle miles traveled,
improved air quality, reduced congestion, increased physical activity associated with walking to transit, and
increased access to jobs.
Transit is estimated to return $6 to a region for every $1 investment.277
Recent zoning changes in Bridgeport enable added mixed‐use development Downtown. Creating a second
train station represents untapped potential for additional TOD in the eastern half of the city. This action
requires Federal and State support.
Employment opportunity associated with this action was not quantified by this energy plan.

Bridgeport Energy Efficiency and Conservation Plan 101
Sub Action 4.2 ‐ Emissions avoidance by creating mixed‐use development within Bridgeport’s urban
core
626,579 metric tons CO2e of transportation‐related emissions may to be avoided by creating housing units
within Bridgeport's urban core.278 This item is included for informational purposes only. Emissions reduction
associated with this action is not numerically included in Bridgeport’s carbon reduction plan.
This estimate of emissions avoidance is the result of modeling done for a neighboring urban center, which
assumed development of 6,113 new households in the urban center versus an equal number of new
households in adjoining suburban locations.
Annual Savings Potential by 2030 Potential for avoided emissions 626,579 MTCO2e
For informational purposes only; savings are not
counted toward reduction goal
Total VMT reduction279 111,064,781 miles
Gasoline savings280 389 gallons
Emissions savings 626,579 MTCO2e
Additional Considerations
Demand for TOD is rising with more households seeking to live close to commercial and entertainment
amenities. One source estimates the demand for housing near transit will reach 9 million households
nationally by 2020.281
Added benefits of “smart growth” development are decreased vehicle miles traveled, improved air quality,
reduced congestion, increased physical activity associated with walking to transit, and increased access to
jobs.
Recent zoning changes in Bridgeport enable added mixed‐use development Downtown. Creating a second
train station represents untapped potential for additional TOD in the eastern half of the city. This action
requires Federal‐ and State‐level support.
Employment opportunity associated with this action was not quantified by this energy plan.
ACTION 5 REPLACE AUTOMOBILE TRIPS WITH WALKING OR BICYCLE TRIPS
Sub Action 5.1 ‐ Transfer in‐city work trips from automobile travel to walk or bike trips under 1 mile
Sub Action 5.2 ‐ Transfer in‐city non‐work trips from automobile travel to walk or bike trips under 2 mil

Bridgeport Energy Efficiency and Conservation Plan 102
Goal: Reduce automobile VMT by 125,265 miles by transferring 35% of citywide work trips within 1 mile
of destination to walk or bike trips and reduce automobile VMT by an additional 339,585 VMT by
transferring 24% of citywide non‐work trips within 1 mile of destination to walk or bike trips.282
Annual Savings Potential by 2030 (In‐city walk trips under 1 mile) 106 MTCO2e
Additional Annual Savings Potential by 2030 (In‐city bike trips under 2 miles) 140 MTCO2e
Per person savings potential
17.95 gallons gasoline 1‐mile trips283 0.2 MTCO2e284
330 annual vehicle‐mile reduction
35.85 gallons gasoline 2 mile‐trips 0.3 MTCO2e
660 annual vehicle mile reduction
Implementation summary for Sub Action 5.1
This action assumes 610 persons will walk (or bike), rather than drive, for 1‐mile in city travel trips.
Sub Action 5.1 can be accomplished as follows:
Implementation unit: 5 persons
Implementation units needed: 122
Implementation Schedule
2010‐15 2015‐20 2020‐25 2025‐30 2010 to 2030 Total
Percent 0.2 0.2 0.2 0.3 1.0
No. units 24 24 37 37 122
MTCO2e 21 21 32 32 106
Upon full implementation, this action may offer the following savings per year.285
Gasoline 10,950 gallons $32,800
This action may result in average annual savings per person of approximately $54.
Implementation Summary for Sub Action 5.2
This action assumes 400 persons will ride a bike, rather than drive, for 2‐mile in city travel trips.
Sub Action 5.2 can be accomplished as follows:
Implementation unit: 5 persons
Implementation units needed: 80
Implementation Schedule
2010‐15 2015‐20 2020‐25 2025‐30 2010 to 2030 Total

Bridgeport Energy Efficiency and Conservation Plan 103
Percent 0.2 0.2 0.3 0.3 1.0
No. units 16 16 24 24 80
MTCO2e 28 28 42 42 140
Upon full implementation, this action may offer the following savings per year.286
Gasoline 14,340 gallons $43,000
This action may result in average annual savings per person of approximately $108.
Additional Considerations
Benefits of increased walking and bicycling include reduced dependence on automobiles, lower cost of
transportation, reduced congestion, and reduced release of air pollutants.
A focused outreach and marketing campaign to promote a shift from automobile travel to walking and biking
can be implemented immediately. The Mayor’s Conservation Corps can help promote this endeavor. The
Bridgeport Regional Business Council’s first annual Workplace Walking Challenge supported this action, and
can be expanded. Local hospitals have a role to play in helping residents appreciate the health benefits
associated with a shift from automobile to walking and biking for short trips.
Schools can play a vital role in encouraging students to reach neighborhood schools in walking or bicycling
groups in place of automobile.
Flat roadways in the City’s southern section make bike riding easy. The City is currently developing several
pilot “Complete Streets” routes to facilitate a shift to biking and walking. Resident support of this action will
likely grow once these pilot projects are visible and usable.
A section of former railroad bed is already converted to a walking trail, but requires improved signage to bring
users to it. This can be an early action item.
In many cases, improving bike and pedestrian infrastructure will require substantial financial commitment on
the part the City, but this can be worked into ongoing maintenance funding.
Mircrobusiness development for bike sharing is a logical opportunity associated with this action item.
Employment opportunity associated with this action was not quantified by this energy plan.
ACTION 6 REDUCE MUNICIPAL FLEET EMISSIONS

Bridgeport Energy Efficiency and Conservation Plan 104
Sub Action 6.1 ‐ Reduce municipal motor vehicle and landscape equipment emissions by 10% from 2007
baseline
Goal: Enact a municipal fleet strategy, which relies on minimum efficiency standards, natural trade‐in to
more‐efficient vehicles and reduced VMT.
Annual Savings Potential by 2030 532 MTCO2e
The 2007 municipal transportation‐related energy and emissions were as follows:287
547,434 gallons gasoline 5,318 MTCO2e288
8,546,720 vehicle mile equivalent
10% savings would equal 532 MTCO2e.
Gasoline/diesel savings potential is 54,734 gallons of gasoline
Implementation Summary
This action assumes 10% reduction in emissions reduction will be achieved through reduced travel, natural
trade‐in to more efficient vehicles and minimum efficiency standards.
This action can be accomplished as follows:
Implementation unit: 1% reduction
Implementation units needed: 10
Implementation Schedule
2010‐15 2015‐20 2020‐25 2025‐30 2010 to 2030 Total
Percent 0.2 0.2 0.3 0.3 1.0
No. Units 2 2 3 3 10
MTCO2e 106 106 160 160 532
Upon full implementation, this action may offer the following savings per year. 289
Gasoline 54,743 gallons $164,200
Additional Considerations
Bridgeport is pursuing a municipal program to reduce VMT associated with the city fleet. GPS devices have
effectively increased driver awareness of VMT and prompted reductions. Take home vehicle usage is being
curbed by new city policy.
The City uses substantial landscape equipment to care for open space, parks, roadways and recreational
areas. Two‐cycle engines create oil‐related emissions, which were noted, but not quantified in the Bridgeport
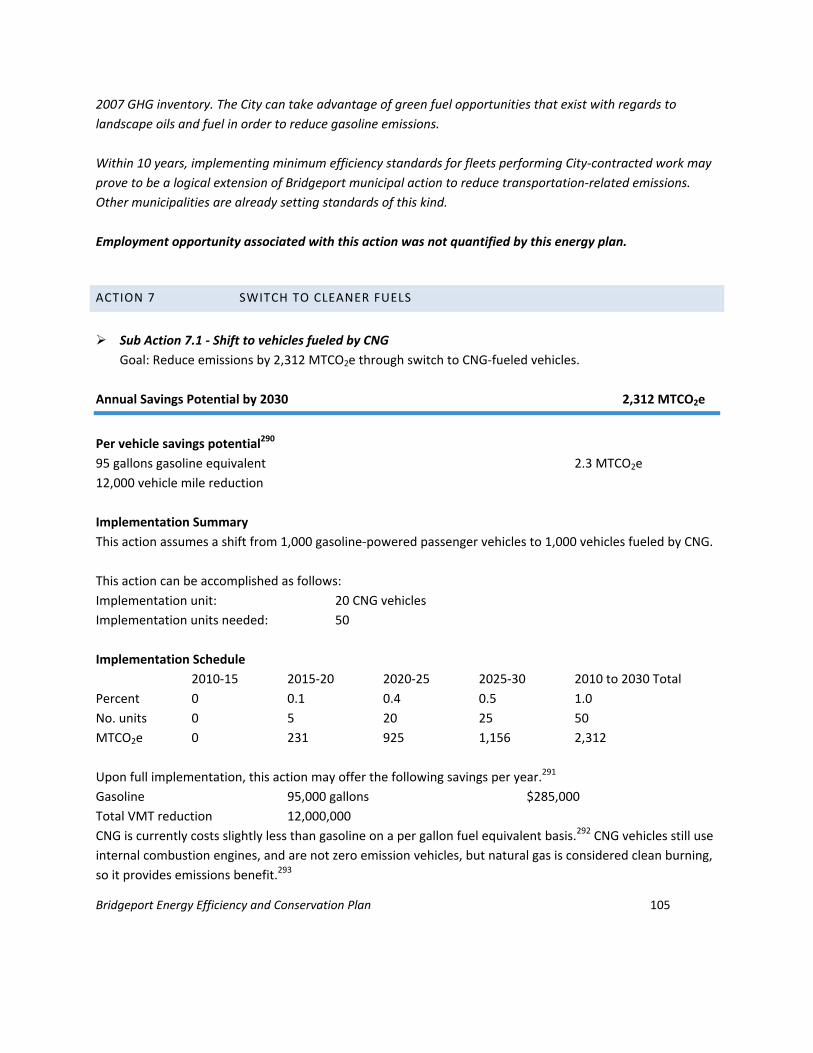
Bridgeport Energy Efficiency and Conservation Plan 105
2007 GHG inventory. The City can take advantage of green fuel opportunities that exist with regards to
landscape oils and fuel in order to reduce gasoline emissions.
Within 10 years, implementing minimum efficiency standards for fleets performing City‐contracted work may
prove to be a logical extension of Bridgeport municipal action to reduce transportation‐related emissions.
Other municipalities are already setting standards of this kind.
Employment opportunity associated with this action was not quantified by this energy plan.
ACTION 7 SWITCH TO CLEANER FUELS
Sub Action 7.1 ‐ Shift to vehicles fueled by CNG
Goal: Reduce emissions by 2,312 MTCO2e through switch to CNG‐fueled vehicles.
Annual Savings Potential by 2030 2,312 MTCO2e
Per vehicle savings potential290
95 gallons gasoline equivalent 2.3 MTCO2e
12,000 vehicle mile reduction
Implementation Summary
This action assumes a shift from 1,000 gasoline‐powered passenger vehicles to 1,000 vehicles fueled by CNG.
This action can be accomplished as follows:
Implementation unit: 20 CNG vehicles
Implementation units needed: 50
Implementation Schedule
2010‐15 2015‐20 2020‐25 2025‐30 2010 to 2030 Total
Percent 0 0.1 0.4 0.5 1.0
No. units 0 5 20 25 50
MTCO2e 0 231 925 1,156 2,312
Upon full implementation, this action may offer the following savings per year.291
Gasoline 95,000 gallons $285,000
Total VMT reduction 12,000,000
CNG is currently costs slightly less than gasoline on a per gallon fuel equivalent basis.292 CNG vehicles still use
internal combustion engines, and are not zero emission vehicles, but natural gas is considered clean burning,
so it provides emissions benefit.293
Bridgeport Energy Efficiency and Conservation Plan 106
Additional Considerations
The Connecticut Energy Advisory Board reports CNG vehicle sales are currently limited due to market
challenges. Their assessment determines “CNG vehicles may achieve significant market penetration through
some combination of the following events: low natural gas prices, sustained high oil prices, high battery costs,
high electric costs, and low gas pressure vessel costs (i.e. lower costs of high‐strength, light‐weight
composites)”.294
One CNG fueling station currently exists in Bridgeport, and Enviro Express, located in Bridgeport, expects to
open a CNG facility, which will be available to the public, at its facilities in the city in Fall 2010. This new
station, funded in part by DOE under AARA, as part of the Greater New Haven Clean Cities project, will have a
means for fueling Enviro Express’ heavy trucks with LNG and also a recapture system, which enables LNG to
be compressed to CNG. This new station may be one of the first, if not the first, public CNG stations open east
of the Mississippi River.295
Indirect employment opportunity may be associated with this action, but was not quantified by this energy
plan.
Sub Action 7.2 ‐ Shift to PEV
Goal: Reduce emissions by 21,000 MTCO2e through switch to PEV vehicles.
Annual Savings Potential by 2030 21,000 MTCO2e
Per vehicle savings potential296
506 gallons gasoline equivalent 4.2 MTCO2e
12,000 vehicle mile reduction
Implementation Summary
This action assumes a shift from 5,000 traditional fueled vehicles to 5,000 Plug in electric vehicles.
This action can be accomplished as follows:
Implementation unit: 20 plug in electric vehicles (PEV’s)
Implementation units needed: 250
Implementation Schedule
2010‐15 2015‐20 2020‐25 2025‐30 2010 to 2030 Total
Percent 0 0.1 0.4 0.5 1.0
No. units 0 50 100 125 250
MTCO2e 0 2,100 8,400 10,500 21,000

Bridgeport Energy Efficiency and Conservation Plan 107
Upon full implementation, this action may offer the following savings per year.297
Gasoline equivalent298 2,530,000 gallons $7,590,000
Total VMT reduction 60,000,000
Electricity consumption increases associated with this measure are not quantified by this energy plan.
Additional Considerations
The Connecticut Electric Distribution Companies report that PEV’s will likely achieve uncertain fleet
penetration over the next decade, and consider a five percent level by 2020 optimistic. Under optimistic
penetration, CO2 and NOX emissions are anticipated to decrease and SO2 emissions will decrease very
slightly.299
The Connecticut Electric Vehicles Infrastructure Council (CEVIC) is currently targeting Connecticut for PEV
development. Barriers to PEV development exist. The average cost of a PEV is $35,000‐$40,000. When
charged at regular electric retail rates, operating costs of PEV’s likely do not readily offset upfront prices,300 a
barrier to implementation for most Bridgeport residents. CEAB predicts EVs or PHEVs are only going to
achieve significant market penetration through some combination of low electric rates for charging, high
gasoline prices, lower battery costs, and government subsidies.301
The CEAB will monitor the Regional Electric Vehicle Initiative (“REVI”) and CEVIC activities for potential
impacts of PEV’s on electricity demand, grid and transmission.302
For the next 5 years, PEV’s are not anticipated to play a role in emissions reductions in Bridgeport. Following
2015, small impact may occur as a result of Bridgeport community purchasing decisions, but more impact will
likely result from decisions of a broader population and cars travelling through Bridgeport, not garaged in
Bridgeport.
Indirect employment opportunity may be associated with this action, but is not quantified by this energy
plan.
ACTION 8 ACHIEVE HIGHER FUEL EFFICIENCY COMMUNITY‐WIDE
Sub Action 8.1 ‐ Emissions gain from higher CAFÉ standards
Goal: Reduce emissions associated with 550,000,000 VMT through gradual phase‐in of vehicles having
improved efficiency standards as a result of new federal mandate.
Annual Savings Potential by 2030 65,515 MTCO2e
Per vehicle savings potential303

Bridgeport Energy Efficiency and Conservation Plan 108
Gasoline 191 gallons 1.8 MTCO2e
12,000 vehicle mile reduction
Implementation Summary
This action assumes a shift from 18.4 mpg average to 24 mpg average efficiency in cars travelling in (or thru)
Bridgeport and resulting in 550,000,000 VMT within city limits, or approximately 77% of 2030 expected VMT.
This action can be accomplished as follows:
Implementation unit: 100 five‐mile vehicle trips304
Implementation units needed: 1,100,000
Implementation Schedule
2010‐15 2015‐20 2020‐25 2025‐30 2010 to 2030 Total
Percent 0 0.1 0.2 0.7 1.0
No. units 0 110,000 220,000 770,000 1,100,000
MTCO2e 0 6,551 13,103 45,860 65,515
Upon full implementation, this action may offer the following savings per year.305
Gasoline 6,974,638 gallons $20,923,900
Vehicle mile reduction 550,000,000
This action may result in average annual savings per vehicle of approximately $189 for every 5,000 vehicle
miles travelled.306
Additional Considerations
The emissions gain from this action is expected to result, in large part, to a change in fuel efficiency in the
vehicles travelling “thru” Bridgeport on I‐95 and Route 8/25 as opposed to in‐city travel.
There is no direct employment opportunity associated with implementation of this action item.

Bridgeport Energy Efficiency and Conservation Plan 109
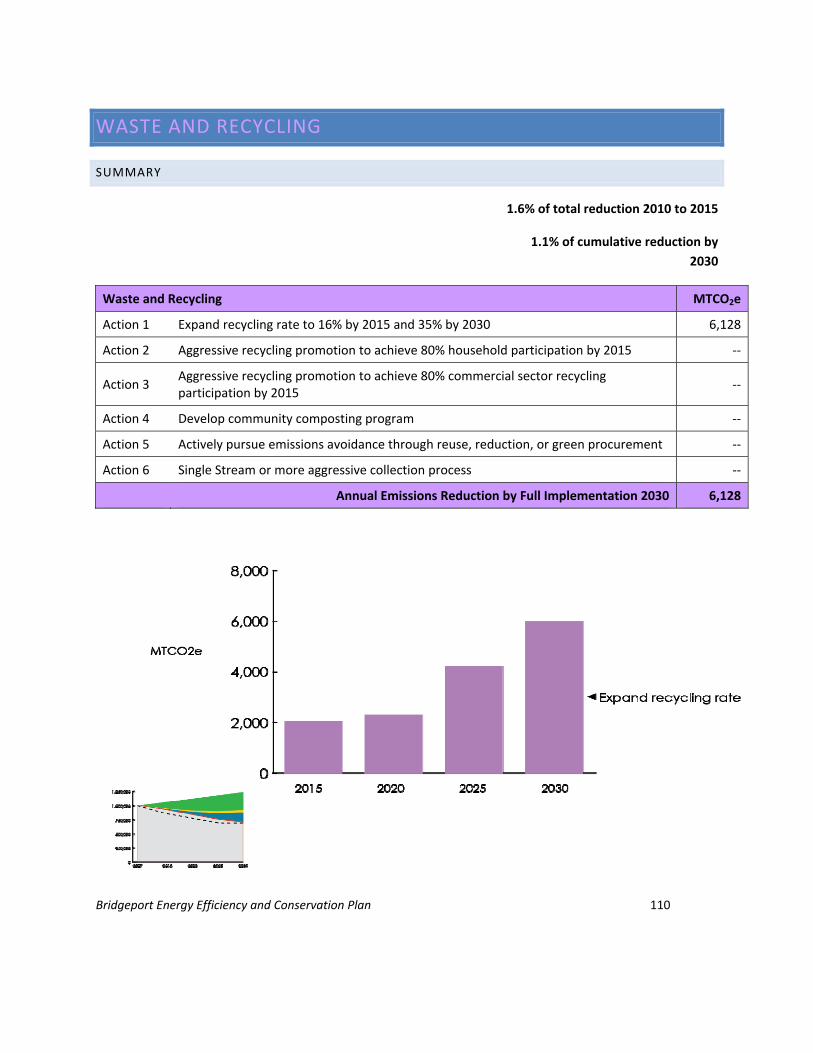
Bridgeport Energy Efficiency and Conservation Plan 110
WASTE AND RECYCLING
SUMMARY
1.6% of total reduction 2010 to 2015
1.1% of cumulative reduction by
2030
Waste and Recycling MTCO2e
Action 1 Expand recycling rate to 16% by 2015 and 35% by 2030 6,128
Action 2 Aggressive recycling promotion to achieve 80% household participation by 2015 ‐‐
Action 3 Aggressive recycling promotion to achieve 80% commercial sector recycling participation by 2015
‐‐
Action 4 Develop community composting program ‐‐
Action 5 Actively pursue emissions avoidance through reuse, reduction, or green procurement ‐‐
Action 6 Single Stream or more aggressive collection process ‐‐
Annual Emissions Reduction by Full Implementation 2030 6,128

Bridgeport Energy Efficiency and Conservation Plan 111
SAVINGS (annual by full implementation)
Tipping fees $1.73 million
GAINS
Fulltime equivalent work‐years Not quantified
Notable micro‐business opportunities Not quantified

Bridgeport Energy Efficiency and Conservation Plan 112
Narrative Summary
Bridgeport’s incineration of municipal solid waste (MSW) is technically a biomass‐fueled operation, in
part, and provides electricity‐generation, so increased recycling (meaning diversion from incineration)
does not show the same carbon reduction impacts as diversion from landfilling.
If life‐cycle is taken into account, impacts are greater (although they are not quantified by this energy
plan). Expanding reuse and recycle is a benefit to keeping many materials “in circulation.”
Increasing recycling participation is paramount to diverting tonnage from incineration to recycle and
reuse. This plan proposes a fast‐tracked and aggressive strategy for creating 80% recycling participation
by residents and businesses, quantified and monitored separately from tonnage diverted.
Residential participation will be bolstered by The Mayor’s Conservation Corps and Environmental Justice
community group outreach as well as by the City’s launch of a pilot recycling incentive program expected
to commence within the year.
The City, BRBC and DSSD will be pivotal to establishing more widespread commercial recycling. A
recycling and MSW Management Forum, sponsored by the City of Bridgeport, recently jumpstarted
focused attention on an expanded citywide recycling goal and a variety of micro‐business opportunities
related to solid waste management.
Composting on several scales will divert significant materials from incineration, although non‐commercial
composting may result in increased methane release. Larger scale commercial facilities can manage
waste and emissions, resulting in a net decrease.
“Single Stream” or more aggressive system has prompted greater diversion from incineration in many
towns, and will likely become a part of Bridgeport’s future MSW/Recycling operations.
Expanded recycling in schools, expected in pilot stage in Fall 2010, will establish a stronger recycling
mindset with carry‐over benefit to residential participation.
Employment opportunities linked to MSW and recycling are not identified in this plan, but it is certain
that many will evolve. Materials waste management is extremely varied and there is tremendous
potential to develop a host of associated micro‐businesses. Much of Bridgeport’s commercial building
space is well suited to associated start‐ups.

Bridgeport Energy Efficiency and Conservation Plan 113
ACTION 1 EXPAND RECYCLING RATE TO 16% BY 2015 AND 35% BY 2030
Sub Action 1.a ‐ Increase recycling rate to 16% by 2015 Low Growth; and increase recycling to 16% by 2015
High Growth
Goal: Increase the 2007 recycling rate by 400% by 2015 to reach 16% recycling target.
Annual Savings Potential by 2030 Low Growth (16% target) 2,564 MTCO2e
Additional Annual Savings High Growth (16% target) 181 MTCO2e
A. Current and projected emissions with no change in recycling rate
2007 MSW and recycling were as follows:307
MSW incinerated 63,081 tons
MSW recycled 2,548 tons
Total MSW 65,629 tons
Recycling rate 4.039 %
Emissions from incineration308 12,698 MTCO2e
Projected 2030 MSW and recycling Low Growth309 with continued 4.039% recycle rate
MSW incinerated 75,786 tons
MSW recycled 3,061 tons
Total MSW 78,847 tons
Projected emissions 15,872 MTCO2e
Projected 2030 MSW and recycling High Growth with continued 4.039% recycle rate
MSW incinerated 81,141 tons
MSW recycled 3,278
Total MSW 84,419 tons
Projected emissions 16,993 MTCO2e
Analysis:
In 2007, incineration of municipal solid waste created 12,698 MTCO2e.
With no change in recycling rate, by 2030 under the High Growth scenario, municipal solid waste will create 16,993
MTCO2e as a result of increased population and the trend toward increased municipal solid waste per capita.
B. Implementation of Increased Recycling
Increasing recycling to 16% (400% increase) assuming 2030 Low Growth310
MSW incinerated 66,108 tons
MSW recycled 12,739 tons
Total MSW 78,847 tons

Bridgeport Energy Efficiency and Conservation Plan 114
Projected emissions from incineration 13,307 MTCO2e
Emissions reduction over continued 4.039% recycle 2,564 MTCO2e
Increasing recycling to 16% (400% increase) – impact of High Growth
MSW incinerated 70,0779 tons
MSW recycled 13,640 tons
Total MSW 84,419 tons
Projected emissions from incineration 14,248 MTCO2e
Emissions reduction over continued 4.039% recycle, Low Growth growth 181 MTCO2e
Implementation Summary
This action can be accomplished as follows:
Implementation unit: 10% goal achievement
Implementation units needed: 10
Implementation Schedule Low Growth Scenario
2010‐15 2015‐20 2020‐25 2025‐30 2010 to 2030 Total
Percent 0.8 0.1 0.05 0.05 1.0
No. units 8 1 0.05 0.05 10
MTCO2e 2,052 256 128 128 2,564
Implementation Schedule High Growth Scenario
2010‐15 2015‐20 2020‐25 2025‐30 2010 to 2030 Total
Percent 0 0 0.5 0.5 1.0
No. units 0 0 5 5 10
MTCO2e 0 0 91 91 181
Annual Energy and Utility Cost Savings upon Full Implementation in 2030
Upon full implementation, this action may impact electricity generation and energy consumption. Diverting
municipal solid waste from incineration will alter the mix of biogenic/non‐biogenic material used to generate
electricity at the Bridgeport waste to energy plant. A shift to transporting recycled materials to recycling facilities
under the existing system has little impact on transportation‐related diesel truck emissions associated with hauling
by Bridgeport municipal trucks, but longer distance transport of recyclables could be impacted. Reduced ash
transport from incineration would be expected. These impacts are not quantified in this energy plan. Bridgeport
may have opportunities to create recycling facilities for a number of resource materials within the city. (See
Municipal Solid Waste and Recycling Action 6.)
Additional Considerations
Under the Low Growth scenario, increasing recycling from the current rate to 16% removes 9,678 tons of MSW
from incineration, which creates annual savings to the City of Bridgeport of $609,700 in tipping fees.311
Under the High Growth scenario, when 16% recycling is achieved, an additional 901 tons of MSW is recycled, which
saves the City an additional $56,763 in tipping fees.
Bridgeport Energy Efficiency and Conservation Plan 115
Critical to reaching emissions reduction goals associated with recycling will be increased participation in recycling
programs. Waste and Recycling Actions 2 and 3 of this Bridgeport Energy Plan outline a plan for achieving 80%
recycling participation by residents and businesses.
Sub Action 1b ‐ Increase Bridgeport's residential recycling rate to 35% by 2030 Low Growth Scenario; and
increase Bridgeport's residential recycling rate to 35% 2030 High Growth (additional savings)
Goal: Move forward from the interim 15% recycling rate to longer‐term 35% diversion from disposal.
Annual Savings Potential by 2030 (35% target) 2,991 MTCO2e
Additional Savings High Growth (35% target) 393 MTCO2e
Increasing recycling from 16% to 35% assuming 2030 Low Growth
MSW incinerated 51,251tons
MSW recycled 27,596 tons
Total MSW 78,847 tons
Emissions 10,317 MTCO2e
Decrease over current recycle rate 5,555 MTCO2e
Emissions reduction over 16% recycle, Low Growth 2,991 MCTO2e
Increasing recycling from 16% to 35%– impact of High Growth
MSW incinerated 54, 872 tons
MSW recycled 29,547 tons
Total MSW 84,419 tons
Emissions 11,045 MTCO2e
Decrease over current recycle rate 5,948 MTCO2e
Emissions reduction over 16% recycle, Low Growth 392 MTCO2e
This action can be accomplished as follows:
Implementation unit: 10% goal achievement
Implementation units needed: 10
Implementation Schedule for Low Growth
2010‐15 2015‐20 2020‐25 2025‐30 2010 to 2030 Total
Percent 0 0 0.5 0.5 1.0
No. units 0 0 5 5 10
MTCO2e 0 0 1,495 1,495 2,991
Implementation Schedule for High Growth
2010‐15 2015‐20 2020‐25 2025‐30 2010 to 2030 Total
Percent 0 0 0.5 0.5 1.0
No. units 0 0 5 5 10

Bridgeport Energy Efficiency and Conservation Plan 116
MTCO2e 0 0 196 196 392
Analysis:
Increasing recycling to 35% of total MSW results in projected emissions of 11,045 MTCO2e, which is a total
decrease of 5,948 over continued recycling at the current rate of roughly 4 percent. Upon full implementation, this
action may impact electricity generation and energy consumption. Diverting municipal solid waste from
incineration will alter the mix of biogenic/non‐biogenic material used to generate electricity at the Bridgeport
waste to energy plant. Transport of recycled materials to recycling facilities may increase diesel‐related emissions.
These impacts are not quantified in this energy plan. Bridgeport may have opportunities to create recycling
facilities for a number of resource materials within the city. (See Municipal Solid Waste and Recycling Action 6.)
Additional Considerations
Under the Low Growth scenario, increasing recycling from 16% to 35% removes an additional 14,857 tons from
incineration, which creates additional annual savings over the 15% savings to the City of Bridgeport of $936,000
per year in tipping fees.312
Under the High Growth scenario, when 35% recycling is achieved, an additional 1,951 tons of MSW is recycled,
which saves the City an additional annual savings over the 16% recycling level of $122,900 in tipping fees.
Critical to reaching these goals will be increased participation in recycling programs. Waste and Recycling Actions 2
and 3 outline strategies for achieving 80% recycling participation by residents and businesses.
ACTION 2 ACHIEVE 80% HOUSEHOLD PARTICIPATION IN RECYCLING BY 2015
Goal: Formalize a recycling outreach program to capture recycling participation by 38,035 households and enable
success of increased recycling goals.
Implementation Summary
Achieving 80% recycling participation can be targeted, and tracked, as follows:
Implementation Schedule*
Establish 80% household recycling participation rate (among currently
existing households) = 38,035 households by 2015 38,035 households
Household participation needed per year to achieve 80% confirmed
participation among existing households within 5 years ‐ by 2015
(some already confirmed) 7607
Households needed per week 146
Blocks of 20 households per week 7
Additional household participation needed to achieve 80%
participation rate among 2030 new households under Low Growth 6098 households

Bridgeport Energy Efficiency and Conservation Plan 117
(7,623 additional households by 2030)
Additional households needed per year (20 year average) 305
Households needed per week average 6
Additional household participation needed to achieve 80%
participation rate among new households under High Growth (8,000
additional households by 2030) 6,400 households
Additional household needed per year (20 year average) 320
Households needed per week average 6
*Rounding of numbers impacts totals
Additional Considerations
80% household participation in city recycling is challenging, but the materials currently accepted for recycling in
Bridgeport are limited, making it less burdensome. Recycling is mandated by the State. This action item must be
viewed as achievable.
A substantially visible citywide recycling campaign can become a continued focus of the Mayor’s Conservation
Corps door‐to‐door efforts. MCC outreach proved extremely effective in boosting recycling participation in targeted
neighborhoods during a pilot program in 2009. MCC efforts will easily be supplemented by neighborhood‐ and
school‐based initiatives. The role of city Recycling personnel will be to identify and remove logistical barriers, which
deter certain households from recycling.
One known deterrent to recycling participation is biweekly pick‐up of recyclables. This poses both a burden for
storage and creates confusion related to knowledge of proper pick‐up dates. With relatively little effort,
neighborhood recycling leaders and the small business community can assume leadership roles in notifying
residents of proper recycling pick‐up dates, if a viable campaign is put in place. Education is the only missing
element.
Within the year, a pilot recycling incentive program will target the lowest rate neighborhoods. This also is expected
to bolster recycling and save the City of Bridgeport money.
ACTION 3 INCREASE RECYCLING IN THE COMMERCIAL SECTOR TO ACHIEVE 80%
PARTICIPATION BY 2015
Goal: Formalize a commercial recycling education and outreach program to increase recycling participation and
enable success of increased recycling goals.
Implementation Summary
Achieving 80% business recycling participation can be targeted, and tracked, as follows:

Bridgeport Energy Efficiency and Conservation Plan 118
Implementation Schedule*
Establish 80% commercial recycling participation (among currently
existing C/I buildings) 1957 C/I buildings
Buildings needed per year to achieve 80% confirmed participation
within 5 years ‐ by 2015 (some already confirmed) 391
Buildings needed per week 8
Additional C/I building participation needed to achieve 80%
participation rate among new C/I buildings under Low Growth (231
additional buildings constructed by 2030) 185 buildings
Additional buildings needed per year (20 year average) 9
Additional C/I building participation needed to achieve 80%
participation rate among new C/I buildings under High Growth (195
additional buildings constructed by 2030) 156 buildings
Buildings needed per year (20 year average) 8
*Rounding of numbers impacts totals
Additional Considerations
A recent City‐sponsored community‐wide commercial recycling forum jumpstarted efforts to establish full‐fledged
commercial recycling in Bridgeport. While a number of Bridgeport companies currently run robust recycling
programs, other do not. This forum both provided resources to enable non‐participants to recycle, and identified
economic development opportunities related to solid waste diversion, recycle and reuse. A valuable piece of this
forum was inclusion of waste haulers in the discussions, since they form a critical link to recycling programs. The
City will likely provide continued leadership in promoting recycling’s value. Bridgeport Regional Business Council,
through its Green Business Resource Center, must assume educational outreach responsibility to the business
community.
The City of Bridgeport is exploring feasibility of expanding its residential recyclables pick‐up to include Downtown
Special Services District, as a demonstration pilot.
Bridgeport’s Energy Improvement District can join with the City of Bridgeport and the Bridgeport Regional Business
Council in developing a citywide commercial waste audit to identify wastes and determine any matches between
one business’s wastes and another business’s materials need. This effort can subsequently be expanded region
wide.
Bridgeport’s Energy Improvement District can also join with the City of Bridgeport, Bridgeport Regional Business
Council, the WorkPlace, and The Green Team, to develop a working list of viable micro‐business opportunities
associated with material recycling. Several initial opportunities became evident during the recent commercial
recycling forum.
ACTION 4 DEVELOP COMMUNITY COMPOSTING PROGRAM

Bridgeport Energy Efficiency and Conservation Plan 119
Goal: Explore opportunities for a managed commercial composting facility with release of oxidized methane
(biogenic CO2) only.
Annual Savings Potential by 2030 MTCO2e not quantified
Emissions increase/decrease is technology‐dependent.
An EPA grant is funding a feasibility study for a regional commercial composting center. Hospitals, supermarkets,
the BOE centralized food service prep site, and Bridgeport’s three universities offer readily‐accessible sources of
food waste. Additional compost sources can be added to operations.
Composting facility operations will easily link to a soil enhancement program for community gardens and other
sites. This tie‐in will provide opportunity for employment and development of a supportive (possibly nonprofit
ReEntry community) micro‐business.
A program for household and neighborhood composting is also achievable, but unlike a regulated commercial
facility, site‐specific composting on this scale may negatively impact emissions, due to methane release.
Employment opportunity is expected from establishing a commercial composting operation, but this Energy Plan
does not quantify this opportunity.
Implementation Schedule
2010‐15 2015‐20 2020‐25 2025‐30 2010 to 2030 Total
Feasibility study
Development and operation
ACTION 5 ACTIVELY PURSUE EMISSIONS AVOIDANCE THROUGH REUSE, REDUCTION,
OR GREEN PROCUREMENT
Sub Action 5.1 ‐ Model commercial procurement policies and programs after recently adopted Municipal
Procurement Policy
Sub Action 5.2 ‐ Expand municipal reuse, reduction or green procurement strategy
Goal: Jointly enable expansion of existing municipal and commercial reuse, reduction or green procurement
strategies through directed discussion and collaborative efforts.
Annual Savings Potential by 2030 MTCO2e not quantified
Implementation Summary
Bridgeport Energy Efficiency and Conservation Plan 120
In 2009, the City of Bridgeport adopted a formal Green Procurement Policy, based upon EPA green procurement
guidelines and with the efforts of a BGreen green procurement‐working group. The City’s leadership in establishing
this policy can benefit the Bridgeport business community, by means of the Green Resources Center at the
Bridgeport Regional Business Council. In turn, BRBC business members may provide additional examples of green
procurement opportunities to benefit both member businesses and the City. A forum on green procurement
would benefit all.
Opportunities for group purchase of green products and services should be pursued as another possible benefit of
increased public/private procurement discussions.
The City’s current tire recapping, and cleaning products and paper purchase programs, should be viewed as the
start of increased green procurement. One immediate area of opportunity is the purchase of “green” oils for single
engine landscape equipment.
Employment opportunities related to this action item, if any, are not quantified by this energy plan.
ACTION 6 SINGLE STREAM OR MORE AGGRESSIVE COLLECTION PROCESS
Goal: Expand materials reuse through single stream recycling or more aggressive municipal solid waste treatment
program.
Annual Savings Potential by 2030 MTCO2e not quantified
Implementation Summary and Considerations
Single stream recycling is enabling an increasing number of municipalities to notably ramp up recycling and
diversion from incineration or landfill.313 Recycling facilities used by Bridgeport may shift to single stream, enabling
greater recycling potential.
Bridgeport can also take regional leadership in establishing micro‐businesses associated with specialized materials
reuse. The majority of waste is re‐usable or – compostable. The work is labor‐intensive, which is an advantage to
Bridgeport.
The Energy Improvement District, Department of Economic Development, and City Recycling can jointly explore
feasibility of launching recycling microbusinesses in enclosed facilities Bridgeport to serve regional need and
redefine our region’s waste management.
Construction and demolition materials generally reach final disposal in landfill sites. The City can take a lead in
material reuse by creating strong C & D recycling policies and programs, which tie into business opportunities and
economic development.

Bridgeport Energy Efficiency and Conservation Plan 121
An increasing number of municipalities are evaluating zero waste policies. Life‐cycle savings of a zero waste policy
are substantial, and the majority of these savings come from reducing emissions associated with recycling
compared to using new materials. Zero waste reduces methane associated with landfilling, and reduces
transportation‐related emissions created by hauling trash from the city to landfills located out of state. Zero waste
policies will require changes to behavior, consumer packaging and infrastructure.314

Bridgeport Energy Efficiency and Conservation Plan 122

Bridgeport Energy Efficiency and Conservation Plan 123
WATER RESOURCES
SUMMARY
0.13% of total reduction, 2010 to 2015
0.15% of cumulative reduction
by 2030
Water Resources MTCO2e
Action 1 Water and energy conservation through efficiency (water‐related impact only) 478
Action 2 Build Green to reduce water usage by 40% 277
Action 3 Green Infrastructure 85
Annual Emissions Reduction by Full Implementation 2030 841
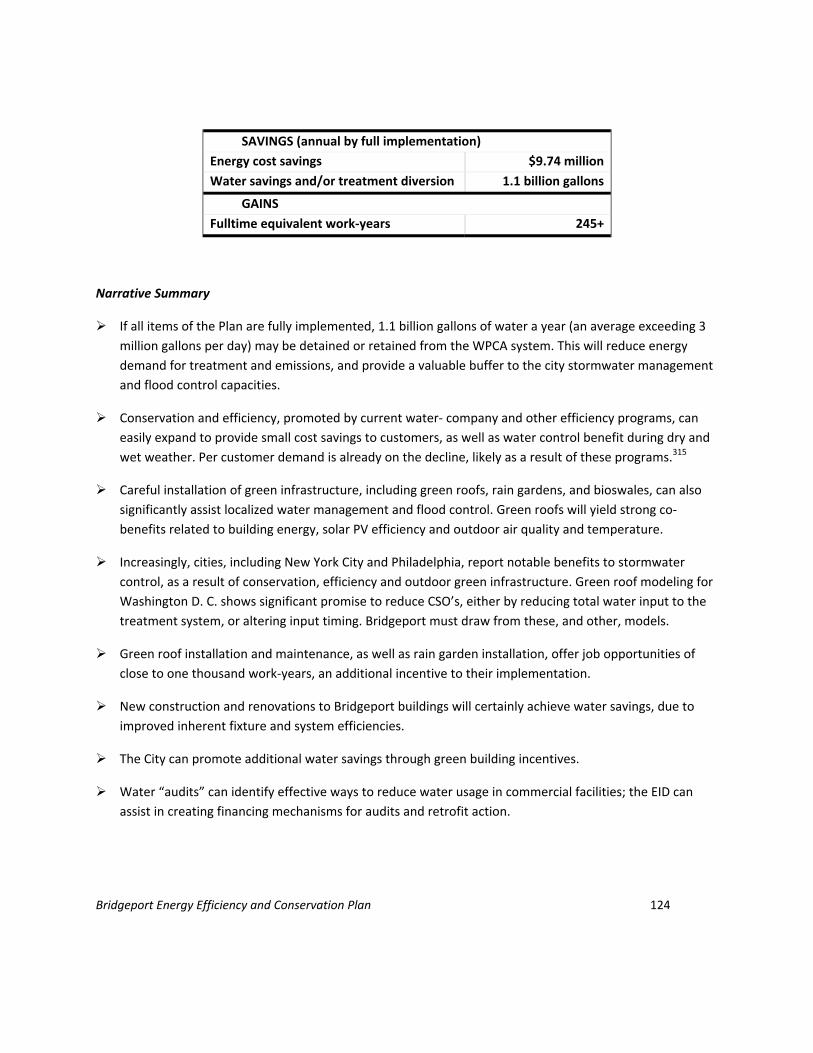
Bridgeport Energy Efficiency and Conservation Plan 124
SAVINGS (annual by full implementation)
Energy cost savings $9.74 million
Water savings and/or treatment diversion 1.1 billion gallons
GAINS
Fulltime equivalent work‐years 245+
Narrative Summary
If all items of the Plan are fully implemented, 1.1 billion gallons of water a year (an average exceeding 3
million gallons per day) may be detained or retained from the WPCA system. This will reduce energy
demand for treatment and emissions, and provide a valuable buffer to the city stormwater management
and flood control capacities.
Conservation and efficiency, promoted by current water‐ company and other efficiency programs, can
easily expand to provide small cost savings to customers, as well as water control benefit during dry and
wet weather. Per customer demand is already on the decline, likely as a result of these programs.315
Careful installation of green infrastructure, including green roofs, rain gardens, and bioswales, can also
significantly assist localized water management and flood control. Green roofs will yield strong co‐
benefits related to building energy, solar PV efficiency and outdoor air quality and temperature.
Increasingly, cities, including New York City and Philadelphia, report notable benefits to stormwater
control, as a result of conservation, efficiency and outdoor green infrastructure. Green roof modeling for
Washington D. C. shows significant promise to reduce CSO’s, either by reducing total water input to the
treatment system, or altering input timing. Bridgeport must draw from these, and other, models.
Green roof installation and maintenance, as well as rain garden installation, offer job opportunities of
close to one thousand work‐years, an additional incentive to their implementation.
New construction and renovations to Bridgeport buildings will certainly achieve water savings, due to
improved inherent fixture and system efficiencies.
The City can promote additional water savings through green building incentives.
Water “audits” can identify effective ways to reduce water usage in commercial facilities; the EID can
assist in creating financing mechanisms for audits and retrofit action.

Bridgeport Energy Efficiency and Conservation Plan 125
City streets and right‐of‐ways must be viewed as essential elements in water management, and must be
employed to significantly temper stormwater flow and benefit water quality in rivers and Long Island
Sound.
The City, as a property owner, has an opportunity to work with WPCA and private landowners, to create
water management zones to capture or divert stormwater and provide flood control. Private/public
partnership is essential to this effort’s success.
As the WPCA works with the State of Connecticut in creating a Long Term Control Plan, green
infrastructure inclusion will be essential. Baseline study is needed to quantify potential economic and
water quality impact of wide scale implementation. As already noted, action items in this Plan identify
means for conserving, retaining, or detaining over 1 Billion gallons of water a year, a small amount
compared to the City’s whole, but, 3 million gallons/day average being slowed or eliminated from storm
sewer systems can prove critical to localized flood control.
ACTION 1 WATER AND ENERGY CONSERVATION THROUGH EFFICIENCY
Sub Action 1.1 ‐ Install 1 low flow showerhead in 50% of existing households
Sub Action 1.2 ‐ Install one low flow showerhead in 80% of 7,623 new households316 2030 Low Growth
Sub Action 1.3 ‐ Install one low flow showerhead in 80% of 8,000 additional new households 2030 High
Growth
Goal: Reduce water use and emissions related to water supply, use, and treatment through installation of
efficient equipment.
Annual Savings Potential by 2030
Sub Action 1.1 Existing households 116 MTCO2e
Sub Action 1.2 Low Growth 30 MTCO2e
Sub Action 1.3 High Growth 32 MTCO2e
Annual energy savings potential per showerhead317
Electricity 11.8 kWh318 0.005 MTCO2e 319
Water 4,271 gallons320
Implementation Summary
This action assumes installation of 1 low flow showerhead in 23,771 existing households, 6,098 new
households under Low Growth scenario and 6,400 additional new households under the High Growth
scenario.321
Sub Action 1.1 can be accomplished as follows:
Implementation unit: 10 households

Bridgeport Energy Efficiency and Conservation Plan 126
Implementation units needed: 2,377
Implementation Schedule for Sub Action 1.1 Existing households
2010‐15 2015‐20 2020‐25 2025‐30 2010 to 2030 Total
Percent 0.4 0.3 0.2 0.1 1.0
No. units 951 713 475 238 2,377
MTCO2e 47 34 23 12 116
Upon full implementation, this action may offer the following savings per year.
Electricity 280,583 kWh $18,300 to utility for water supply
$24,000 to WPCA for water treatment
Water 101,525,941 gallons $746,200 to customers for water supply
$219,900 to customers for water
treatment
This action may result in average annual utility savings related to water supply and treatment per household
of approximately $40.
Sub Action 1.2 can be accomplished as follows:
Implementation unit: 10 households
Implementation units needed: 610
Implementation Schedule for Sub Action 1.2 New Households Low Growth
2010‐15 2015‐20 2020‐25 2025‐30 2010 to 2030 Total
Percent 0.25 0.25 0.25 0.25 1.0
No. units 153 153 152 152 6010
MTCO2e 7.47 7.47 7.47 7.47 29.88
Upon full implementation, this action may offer the following savings per year:
Electricity 71,974 kWh $4,700 to utility for water supply
$6,100 to WPCA for water treatment
Water 26,042,850 gallons $191,400 to customers for water supply
$56,400 to customers for water
treatment
This action may result in average annual utility savings related to water supply and treatment per household
of approximately $40.
Sub Action 1.3 can be accomplished as follows:
Implementation unit: 10 households

Bridgeport Energy Efficiency and Conservation Plan 127
Implementation units needed 640
Implementation Schedule for Sub Action 1.3 New Households High Growth
2010‐15 2015‐20 2020‐25 2025‐30 2010 to 2030 Total
Percent 0 0.2 0.4 0.4 1.0
No. units 0 128 256 256 640
MTCO2e 0 6.27 12.54 12.54 31.36
Upon full implementation, this action may offer the following savings per year:
Electricity 75,543 kWh $4,900 to utility for water supply
$6,500 to WPCA for water treatment
Water 27,334,400 gallons $200,900 to customers for water supply
$59,200 to customers for water
treatment
This action may result in average annual utility savings related to water supply and treatment per household
of approximately $40.
Additional Considerations
This measure is included in the UI Home energy Solutions (HES) and Income Eligible programs.
Labor and job potential associated with this action is attributed to an action detailed in another section of
this Energy Plan.
Sub Action 1.4 ‐ Install faucet aerators in 50% existing households
Sub Action 1.5 ‐ Install faucet aerators in 80% of new households under Low Growth scenario
Sub Action 1.6 ‐ Install faucet aerators in 80% of additional new households under High Growth
scenario
Goal: Reduce water use and emissions related to water supply, use and treatment through installation of
efficient equipment.
Annual Savings Potential by 2030
Sub Action 1.4 Existing households 14 MTCO2e
Sub Action 1.5 Low Growth 3.6 MTCO2e
Sub Action 1.6 High Growth 3.8 MTCO2e
Annual energy savings potential per installation of 2 aerators322
Electricity 1.4122 kWh323 0.0006 MTCO2e324
Water 511 gallons325
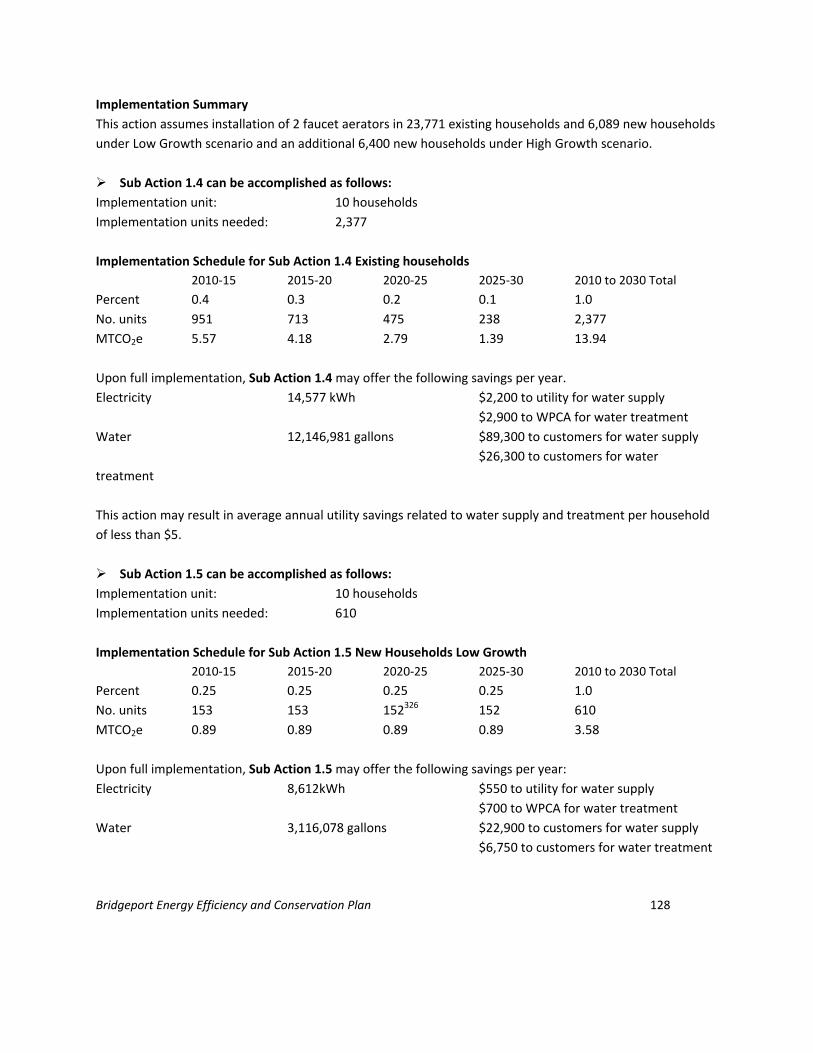
Bridgeport Energy Efficiency and Conservation Plan 128
Implementation Summary
This action assumes installation of 2 faucet aerators in 23,771 existing households and 6,089 new households
under Low Growth scenario and an additional 6,400 new households under High Growth scenario.
Sub Action 1.4 can be accomplished as follows:
Implementation unit: 10 households
Implementation units needed: 2,377
Implementation Schedule for Sub Action 1.4 Existing households
2010‐15 2015‐20 2020‐25 2025‐30 2010 to 2030 Total
Percent 0.4 0.3 0.2 0.1 1.0
No. units 951 713 475 238 2,377
MTCO2e 5.57 4.18 2.79 1.39 13.94
Upon full implementation, Sub Action 1.4 may offer the following savings per year.
Electricity 14,577 kWh $2,200 to utility for water supply
$2,900 to WPCA for water treatment
Water 12,146,981 gallons $89,300 to customers for water supply
$26,300 to customers for water
treatment
This action may result in average annual utility savings related to water supply and treatment per household
of less than $5.
Sub Action 1.5 can be accomplished as follows:
Implementation unit: 10 households
Implementation units needed: 610
Implementation Schedule for Sub Action 1.5 New Households Low Growth
2010‐15 2015‐20 2020‐25 2025‐30 2010 to 2030 Total
Percent 0.25 0.25 0.25 0.25 1.0
No. units 153 153 152326 152 610
MTCO2e 0.89 0.89 0.89 0.89 3.58
Upon full implementation, Sub Action 1.5 may offer the following savings per year:
Electricity 8,612kWh $550 to utility for water supply
$700 to WPCA for water treatment
Water 3,116,078 gallons $22,900 to customers for water supply
$6,750 to customers for water treatment
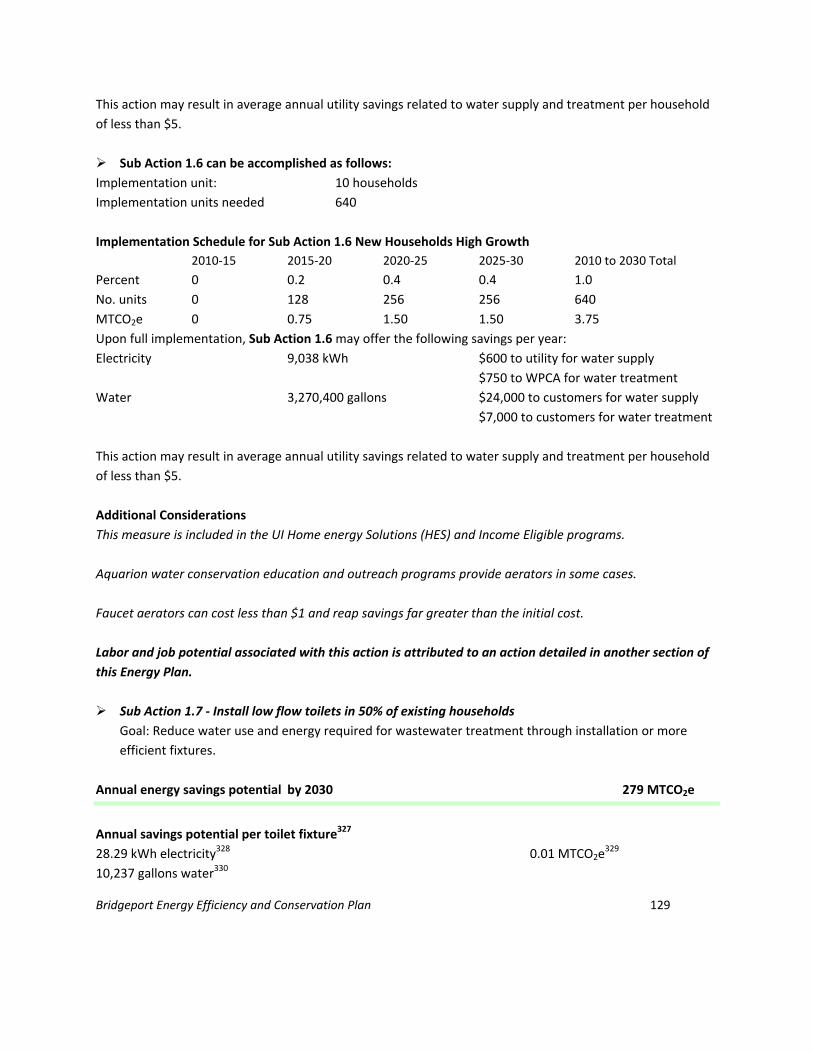
Bridgeport Energy Efficiency and Conservation Plan 129
This action may result in average annual utility savings related to water supply and treatment per household
of less than $5.
Sub Action 1.6 can be accomplished as follows:
Implementation unit: 10 households
Implementation units needed 640
Implementation Schedule for Sub Action 1.6 New Households High Growth
2010‐15 2015‐20 2020‐25 2025‐30 2010 to 2030 Total
Percent 0 0.2 0.4 0.4 1.0
No. units 0 128 256 256 640
MTCO2e 0 0.75 1.50 1.50 3.75
Upon full implementation, Sub Action 1.6 may offer the following savings per year:
Electricity 9,038 kWh $600 to utility for water supply
$750 to WPCA for water treatment
Water 3,270,400 gallons $24,000 to customers for water supply
$7,000 to customers for water treatment
This action may result in average annual utility savings related to water supply and treatment per household
of less than $5.
Additional Considerations
This measure is included in the UI Home energy Solutions (HES) and Income Eligible programs.
Aquarion water conservation education and outreach programs provide aerators in some cases.
Faucet aerators can cost less than $1 and reap savings far greater than the initial cost.
Labor and job potential associated with this action is attributed to an action detailed in another section of
this Energy Plan.
Sub Action 1.7 ‐ Install low flow toilets in 50% of existing households
Goal: Reduce water use and energy required for wastewater treatment through installation or more
efficient fixtures.
Annual energy savings potential by 2030 279 MTCO2e
Annual savings potential per toilet fixture327
28.29 kWh electricity328 0.01 MTCO2e329
10,237 gallons water330

Bridgeport Energy Efficiency and Conservation Plan 130
Implementation Summary
This action assumes installation of low flow toilets, which represent replacement of 3.5‐gallon fixtures with
1.6‐gallon low flow fixtures, in 23,771331 existing households.
This action can be accomplished as follows:
Implementation unit: 10 households
Implementation units needed: 2,377
Implementation Schedule
2010‐15 2015‐20 2020‐25 2025‐30 2010 to 2030 Total
Percent 0.2 0.3 0.3 0.2 1.0
No. units 475 713 713 475 2,377
MTCO2e 56 84 84 56 279332
Upon full implementation, this action may offer the following savings per year.
Electricity 672,540 kWh $43,800 to utility for water supply
$57,400 to WPCA for water treatment
Water 243,350,060 gallons $1,788,600 to customers for water supply
$527,000 to customers for water
treatment
This action may result in average annual utility savings related to water supply and treatment per household
of $100.
Additional Considerations
Toilet rebate programs have proven successful in numerous municipalities, including New York City. Programs
are either city‐, state‐ or utility‐sponsored.
Installation of low flow toilets, associated with this action, is estimated to create job potential for 47.5
fulltime equivalent work years.
Sub Action 1.8 ‐ Clothes washer trade‐ins
Goal: Reduce water use and energy required for wastewater treatment through installation of more
efficient clothes washers in 30% of 47,543 existing households.
Annual Savings Potential by 2030 0.05 MTCO2e
Annual savings potential per clothes washer
Electricity 0.01547 kWh333 0.000004 MTCO2e334

Bridgeport Energy Efficiency and Conservation Plan 131
Water 6 gallons335
Implementation Summary
This action assumes replacement of existing clothes washers with more water‐efficient clothes washers in
14,263 existing households.
This action can be accomplished as follows:
Implementation unit: 10 clothes washers
Implementation units needed: 1,426
Implementation Schedule
2010‐15 2015‐20 2020‐25 2025‐30 2010 to 2030 Total
Percent 0.25 0.3 0.2 0.1 1.0
No. units 357 357 357 357 1,426
MTCO2e 0.01 0.01 0.01 0.01 0.05336
Upon full implementation, this action may offer the following savings per year.
Electricity 221 kWh $14 to utility for water supply
$18 to WPCA for water treatment
Water 79,844 gallons $585 to customers for water supply
$170 to customers for water treatment
This action may result in very minimal annual utility savings (less than $1) related to water supply and
treatment per household.
Additional Considerations
United Illuminating has an in‐place program for Income Eligible participants, which enables clothes washer
trade‐in for more efficient appliances.
Numerous cities, states and/or water supply authorities offer clothes washer rebate programs.
Labor and job potential associated with this action is attributed to an action detailed in another section of
this Energy Plan.
Sub Action 1.9 ‐ Conservation policies and education
Goal: Create a water‐conservation consciousness, which runs the spectrum of water‐conservation
behavior, from utility scale decisions to household actions.
Annual Savings Potential by 2030 MTCO2e not quantified

Bridgeport Energy Efficiency and Conservation Plan 132
Savings Potential and Implementation Summary
This action is intended to create “new thinking” with regards to water use and conservation, by instilling
behavior, which addresses the need to use water wisely. Several actions support this goal:
Expand Aquarion water utility outreach programs to promote water‐saving measures in all households and
business operations, and save consumers money. The Bridgeport Regional Business Center’s Green Resources
Center, community centers and Lighthouse after‐school program sites are logical partners for this action.
Enact Green Building Guidelines and incentives for new construction and renovations, which include water‐
saving fixtures and measures.
Promote water audits of large customer and retrofit programs that help consumers reduce water
consumption and save money.
Promote water audits of Bridgeport municipal facilities and Board of Education facilities, which help the City
install measures to reduce water consumption and save money.
Additional Considerations
Initiate discussions related to rain water capture and re‐use for outdoor water needs.
Aquarion’s residential water audit kit is a valuable handout, which must reach additional homes to enable
savings. Kits include aerators and simple tools, which help residents check for water leaks.337 The city, using
the Mayor’s Conservation Corps and business community can partner with Aquarion in this outreach effort.
For the commercial community, water audits will also help save more, but audit costs of $15,000 to $20,000
are a deterrent to implementation. Water utilities lack a surcharge mechanism to enable financial support of
this measure. Bridgeport’s Energy Improvement District and Bridgeport Regional Business Council can work to
develop possible financing mechanisms and tie‐ins to full‐building retrofits and possible performance
contracting.
ACTION 2 BUILD GREEN TO REDUCE WATER USAGE
Sub Action 2.1 ‐ Green building construction in 6,098 new households under Low Growth scenario
Sub Action 2.2 ‐ Green building construction in 6,400 new households under High Growth scenario
Goal: Reduce water usage by 40% over traditional usage by performing green building measures in new
construction.338
Annual Savings Potential by 2030, Low Growth 135 MTCO2e
Additional Annual Savings Potential, Expanded growth 142 MTCO2e

Bridgeport Energy Efficiency and Conservation Plan 133
Annual Savings potential per household from green building
(Relates to energy for water supply and treatment only)
Electricity 53.38 kWh339 0.02 MTCO2e340
Water 44,480 gallons 341
Implementation Summary
This action assumes performance of water‐saving green building measures in 80% of 7,623 new households
(6,098 households) by 2030 under the Low Growth scenario and 80% of 8,000 additional new households
(6,400 households) under the High Growth scenario.342
Sub Action 2.1 Low Growth can be accomplished as follows:
Implementation unit: 10 households
Implementation units needed: 610
Implementation Schedule for Sub Action 2.1 Low Growth
2010‐15 2015‐20 2020‐25 2025‐30 2010 to 2030 Total
Percent 0.25 0.25 0.25 0.25 1.0
No. units 152 152 152 152 610343
MTCO2e 33.78 33.78 33.78 33.78 135.12
Upon full implementation, Sub Action 2.1 Low Growth may offer the following savings per year.
Electricity 325,508 kWh $48,800 to utility for water supply
$64,000 to WPCA for water treatment
Water 271,246,713 gallons $1,993,700 to customers for water supply
$587,500 to customers for water
treatment
This action may result in annual utility savings related to water supply and treatment per household of $425.
Sub Action 2.2 High Growth can be accomplished as follows:
Implementation unit: 10 households
Implementation units needed: 640
Implementation Schedule for Sub Action 2.2 High Growth
2010‐15 2015‐20 2020‐25 2025‐30 2010 to 2030 Total
Percent 0 0.2 0.4 0.4 1.0
No. units 0 128 256 256 640
MTCO2e 0 28.36 56.73 56.73 141.81

Bridgeport Energy Efficiency and Conservation Plan 134
Upon full implementation, Sub Action 2.2 High Growth may offer the following savings per year.
Electricity 341606 kWh $51,200 to utility for water supply
$67,200 to WPCA for water treatment
Water 284,672,000 gallons $2,092,300 to customers for water supply
$616,600 to customers for water
treatment
This action may result in annual utility savings related to water supply and treatment per household of $425.
Additional Considerations
Incorporating green building measures into construction has added 2% on average to costs, but returns far
more in savings over time, and some buildings are being built to LEED certified levels at little or no extra
cost.344 Overall, green building has been reported to have 20‐year net benefits ranging from $50 to $65 per
square foot.345
Labor and job potential associated with this action is attributed to an action detailed in another section of
this Energy Plan.
ACTION 3 GREEN INFRASTRUCTURE
Sub Action 3.1 ‐ Install rain gardens at residences with flat roofs
Sub Action 3.2 ‐ Install rain gardens at residences with pitched roofs
Goal: Protect water resources and reduce energy and emissions related to treatment of Bridgeport
stormwater by directing roof run‐off to residential rain gardens.
Annual Savings Potential by 2030 flat roof sites 0.9 MTCO2e
Annual Savings Potential by 2030 pitched roof sites 22 MTCO2e
WPCA annual per household savings potential average flat roof site
Electricity 23.7 kWh346 0.01 MTCO2e347
Water 15,157 gallons348
WPCA annual per household savings potential average pitched roof site
Electricity 24.33 kWh349 0.01 MTCO2e350
Water 15,559 gallons351
Implementation Summary
This action assumes installation of rain gardens at 93 properties, which have flat‐roof residences and at 2,193
properties, which have pitched roof residences.
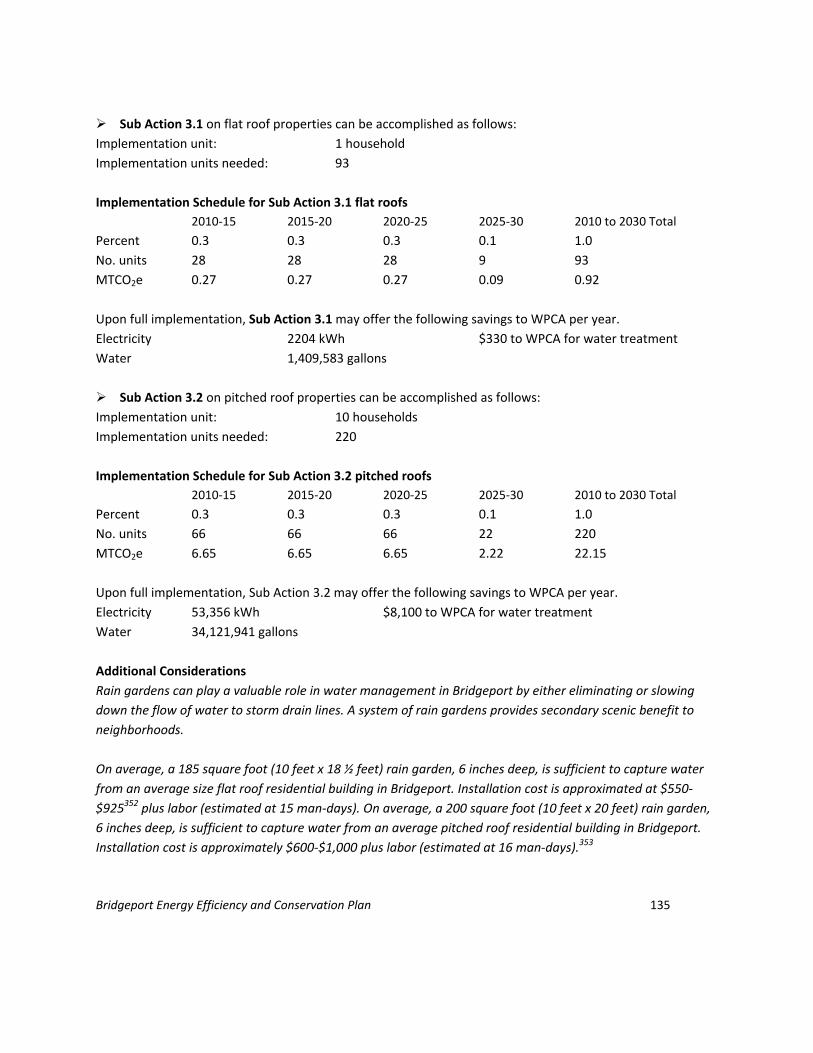
Bridgeport Energy Efficiency and Conservation Plan 135
Sub Action 3.1 on flat roof properties can be accomplished as follows:
Implementation unit: 1 household
Implementation units needed: 93
Implementation Schedule for Sub Action 3.1 flat roofs
2010‐15 2015‐20 2020‐25 2025‐30 2010 to 2030 Total
Percent 0.3 0.3 0.3 0.1 1.0
No. units 28 28 28 9 93
MTCO2e 0.27 0.27 0.27 0.09 0.92
Upon full implementation, Sub Action 3.1 may offer the following savings to WPCA per year.
Electricity 2204 kWh $330 to WPCA for water treatment
Water 1,409,583 gallons
Sub Action 3.2 on pitched roof properties can be accomplished as follows:
Implementation unit: 10 households
Implementation units needed: 220
Implementation Schedule for Sub Action 3.2 pitched roofs
2010‐15 2015‐20 2020‐25 2025‐30 2010 to 2030 Total
Percent 0.3 0.3 0.3 0.1 1.0
No. units 66 66 66 22 220
MTCO2e 6.65 6.65 6.65 2.22 22.15
Upon full implementation, Sub Action 3.2 may offer the following savings to WPCA per year.
Electricity 53,356 kWh $8,100 to WPCA for water treatment
Water 34,121,941 gallons
Additional Considerations
Rain gardens can play a valuable role in water management in Bridgeport by either eliminating or slowing
down the flow of water to storm drain lines. A system of rain gardens provides secondary scenic benefit to
neighborhoods.
On average, a 185 square foot (10 feet x 18 ½ feet) rain garden, 6 inches deep, is sufficient to capture water
from an average size flat roof residential building in Bridgeport. Installation cost is approximated at $550‐
$925352 plus labor (estimated at 15 man‐days). On average, a 200 square foot (10 feet x 20 feet) rain garden,
6 inches deep, is sufficient to capture water from an average pitched roof residential building in Bridgeport.
Installation cost is approximately $600‐$1,000 plus labor (estimated at 16 man‐days).353

Bridgeport Energy Efficiency and Conservation Plan 136
Rain garden installation proposed by Sub Action 3.1 is estimated to create job potential for 5.6 fulltime
equivalent work years. Rain garden installation proposed by Sub Action 3.2 is estimated to create job
potential for an additional 140 fulltime equivalent work years.354
Rain garden installation represents a tremendous opportunity for micro‐business development and/or re‐
entry employment. The City of Bridgeport, with assistance from EPA, provided a rain garden training
workshop in the spring of 2010 through the Bridgeport Small and Minority Business Development office.
Groundwork Bridgeport has taken a leadership role in stormwater education, through its 2010 summer
program to mark storm drains in the city. Coupling this storm drain effort with Groundwork’s traditional
grounds keeping, employment training and job placement mission makes Groundwork Bridgeport a logical
partner in rain garden development in Bridgeport.
Sub Action 3.3 ‐ Rain barrels at residences with flat roofs
Sub‐Action 3.4 ‐ Rain barrels at residences with pitched roofs
Goal: Protect water resources and reduce energy and emissions related to treatment of Bridgeport
stormwater by directing roof run‐off to residential rain barrels
Annual Savings Potential by 2030 for flat roofs 0.08 MTCO2e
Annual Savings Potential by 2030 for pitched roofs 1.96 MTCO2e
WPCA Annual Savings potential per average flat roof site
Electricity 4.3 kWh355 0.002 MTCO2e356
Water 2,500 gallons357
WPCA Annual Savings potential per average pitched roof site
Electricity 4.3 kWh358 0.002 MTCO2e359
Water 2,500 gallons360
Implementation Summary
This action assumes installation of rain barrels at 46 existing flat roof residential buildings (5% of total) and
1,097 existing pitched roof residential buildings (5% of total).361
Sub Action 3.3 on flat roof properties can be accomplished as follows:
Implementation unit: 1 household
Implementation units needed: 46
Implementation Schedule for Sub Action 3.3 flat roofs
2010‐15 2015‐20 2020‐25 2025‐30 2010 to 2030 Total
Percent 0.4 0.3 0.2 0.1 1.0
No. units 18 14 9 5 46
MTCO2e 0.03 0.02 0.02 0.01 0.08

Bridgeport Energy Efficiency and Conservation Plan 137
Upon full implementation, Sub Action 3.3 may offer the following savings per year.
Electricity 198 kWh $21 to utility for water supply
$27 to WPCA for water treatment
Water 115,000 gallons $850 to customers for water supply
$250 to customers for utility for water treatment
This action may result in annual utility savings related to water supply and treatment per household of $24.
Sub Action 3.4 on pitched roof properties can be accomplished as follows:
Implementation unit: 10 households
Implementation units needed: 110
Implementation Schedule for Sub Action 3.4 pitched roofs
2010‐15 2015‐20 2020‐25 2025‐30 2010 to 2030 Total
Percent 0.3 0.3 0.3 0.1 1.0
No. units 33 33 33 11 110
MTCO2e 0.59 0.59 0.59 0.20 1.96
Upon full implementation, Sub Action 3.4 may offer the following savings per year.
Electricity 4,717 kWh $20,200 to utility for water supply
$5,900 to WPCA for water treatment
Water 2,742,500 gallons $500 to customers for water supply
$600 to customers for water treatment
This action may result in annual utility savings related to water supply and treatment per household of $24.
Additional Considerations
Rain barrels can sometimes be acquired for $80.00 through a special Aquarion water company program or
State of Connecticut program, or for $150 without program support.
Installation of rain barrels at flat roof residential buildings is estimated to create job potential for 0.9
fulltime equivalent work years. Installation of rain barrels at pitched roof residential buildings is estimated
to create job potential for 48 fulltime equivalent work years.362
Sub Action 3.5 ‐ Green roofs on existing flat roof commercial buildings
Sub Action 3.6 ‐ Green roofs on new flat roof commercial buildings
Goal: Protect water resources and reduce energy and emissions related to treatment of Bridgeport
stormwater by capturing roof run‐off or reducing flow rates with green roofs at commercial buildings.

Bridgeport Energy Efficiency and Conservation Plan 138
Annual Savings Potential by 2030 Existing Buildings 23 MTCO2e
Additional Annual Savings Potential New Buildings 4.9 MTCO2e
WPCA Annual Savings potential per green roof
Electricity 123 kWh363 0.05 MTCO2e364
Water 78,570 gallons365
Implementation Summary
This action assumes installation of green roofs on 460 existing commercial flat roof buildings (30% of 1,531
existing buildings) and at 96 new commercial flat roof buildings (30% of projected new buildings) under the
Low Growth Scenario and High Growth Scenario combined (52 under Low Growth scenario plus 44 under
High Growth scenario).366
Sub Action 3.5 for existing buildings can be accomplished as follows:
Implementation unit: 10 buildings
Implementation units needed: 46
Implementation Schedule for Sub Action 3.5 Existing buildings
2010‐15 2015‐20 2020‐25 2025‐30 2010 to 2030 Total
Percent 0.1 0.4 0.3 0.2 1.0
No. units 5 14 18 9 46
MTCO2e 2.35 7.04 9.38 4.69 23.46
Upon full implementation, Sub Action 3.5 may offer the following savings per year.
Electricity 56,514 kWh $8,500 to WPCA for water treatment
Water 36,142,014 gallons
Sub Action 3.6 for new buildings can be accomplished as follows:
Implementation unit: 1 building
Implementation units needed: 96
Implementation Schedule for Sub Action 3.6 new buildings
2010‐15 2015‐20 2020‐25 2025‐30 2010 to 2030 Total
Percent 0.1 0.3 0.4 0.2 1.0
No. units 10 29 38 19 96
MTCO2e 0.49 1.47 1.96 0.98 4.90
Upon full implementation, Sub Action 3.6 may offer the following savings per year.
Electricity 11,794 kWh $1,800 to WPCA for water treatment
Water 7,542,681 gallons

Bridgeport Energy Efficiency and Conservation Plan 139
Additional Considerations
A Washington D.C study of green roof potential of roofs over 10,000 square feet reported a 69% reduction of
water discharge from 80% extensive/20% intensive green roof cover reduced water discharge by 69%.
Although coverage area was only 6% of total land cover, and total water flow involved was relatively small, in
areas of heavy flooding, this small cover percentage was predicted to be valuable to flood management. Even
as low as 20% roof cover was predicted to reduce CSO’s in associated micro‐watershed areas. In addition,
UFORE modeling predicted added benefit from air quality improvement.367
Washington D.C., working to expand green roof coverage, has a green roof subsidy program.368
Labor and job potential associated with this action is attributed to an action detailed in another section of
this Energy Plan.
Sub Action 3.7 ‐ Bioswales and detention/retention areas for flat roof commercial building sites
Sub Action 3.8 ‐ Bioswales and detention/retention areas for pitched roof commercial building sites
Goal: Protect water resources, reduce storm flow impact, and reduce energy and emissions related to
treatment of Bridgeport stormwater by capturing run‐off from commercial properties in commercial
detention or retention areas.
Annual Savings Potential by 2030 flat roof buildings 6 MTCO2e
Annual Savings Potential by 2030 pitched roof buildings 2.5 MTCO2e
WPCA Annual Savings potential per flat roof building
Electricity 189 kWh electricity369 0.08 MT370CO2e
Water 120,876 gallons371
WPCA Annual Savings potential per pitched roof building
Electricity 133 kWh electricity 0.06 MTCO2e
Water 85,178 gallons372
Implementation Summary
This action assumes installation of vegetated retention or detention facilities to capture rainwater from 5% of
existing flat roof commercial buildings (77 buildings) and 5% of existing pitched roof commercial buildings (46
buildings).373
Sub Action 3.7 flat roof buildings can be accomplished as follows:
Implementation unit: 1 building
Implementation units needed: 77

Bridgeport Energy Efficiency and Conservation Plan 140
Implementation Schedule for Sub Action 3.7 flat roof building sites
2010‐15 2015‐20 2020‐25 2025‐30 2010 to 2030 Total
Percent 0.3 0.3 0.3 0.3 1.0
No. units 23 23 23 8 77
MTCO2e 1.81 1.81 1.81 0.60 6.04
Upon full implementation, Sub Action 3.7 flat roof building sites may offer the following savings per year.
Electricity 14,469 kWh $2,200 to WPCA for water treatment
Water 9,253,081 gallons
Sub Action 3.8 pitched roof buildings can be accomplished as follows:
Implementation unit: 1 building
Implementation units needed: 46
Implementation Schedule for Sub Action 3.8 pitched roof building sites
2010‐15 2015‐20 2020‐25 2025‐30 2010 to 2030 Total
Percent 0.3 0.3 0.3 0.3 1.0
No. units 14 14 14 5 46
MTCO2e 0.76 0.76 0.76 0.25 2.54
Upon full implementation, Sub Action 3.8 pitched roof building sites may offer the following savings per year.
Electricity 6,127 kWh $925 to WPCA for water
treatment
Water 3,918,196 gallons
Additional Considerations
The City, as a property owner, has an opportunity to work with WPCA and private landowners, to create
water management zones to capture or divert stormwater and help provide flood control. Flood management
facilities can couple as parks and green space. Increasing numbers of cities are enabling water to become a
part of their cities, and an asset, through such facilities.
A 40‐foot square commercial water management area is estimated to accommodate water from a 1 inch
rainfall for the average size flat roof commercial building. A 32‐foot square commercial water management
area is estimated to accommodate water from a 1‐inch rainfall for the average size non‐flat commercial
building.374
Measures carried out under this green infrastructure action for flat roof commercial buildings are
estimated to create job potential for 39 fulltime equivalent work years.375

Bridgeport Energy Efficiency and Conservation Plan 141
Measures carried out under this green infrastructure action for non‐flat roof commercial buildings are
estimated to create job potential for an additional 14.7 fulltime equivalent work years.376
Sub Action 3.9 ‐ Vegetated or permeable pavement water management areas
Goal: Protect water resources, reduce storm flow impact, and reduce energy and emissions related to
treatment of Bridgeport stormwater by creating water management areas to capture and detain or
infiltrate street and other paved surface run‐off.
Annual Savings Potential by 2030 3.5 MTCO2e
WPCA Annual Savings potential per ½ acre
Electricity 425 kWh 0.2 MTCO2e
Water 271,543 gallons
Implementation Summary
This action assumes creation of 10 acres for water management with vegetation or permeable surface
materials to reduce flow of paved surface runoff or enable water infiltration.
This action can be accomplished as follows:
Implementation unit: ½ acre sites
Implementation units needed: 20
Implementation Schedule
2010‐15 2015‐20 2020‐25 2025‐30 2010 to 2030 Total
Percent 0.5 0.5 0 0 1.0
No. units 10 10 0 0 20
MTCO2e 1.76 1.76 0.00 0.00 3.53
Upon full implementation, this action may offer the following savings per year.
Electricity 8,492 kWh $1,300 to WPCA for water treatment
Water 5,430,857 gallons
Additional Considerations
Stormwater Management Regulations, in place, require on‐site water control for certain new construction.
The Bridgeport Building Department, WPCA, and Engineering advisor can together explore opportunities to
incorporate green infrastructure incentives into Stormwater Management Regulations to encourage the
creation of additional on‐site water management facilities or methods. The City Department of Planning and
Economic Development can assist with action item implementation by setting the tone for green building and
green infrastructure development by potential property developers.

Bridgeport Energy Efficiency and Conservation Plan 142
Permeable paving and porous surface materials are in place in many applications nationwide, including
Bridgeport.377 Additional demonstration pilots are being planned by the City. Particularly in Downtown, but
also in other flood‐prone areas, providing specific water management sites, and/or incorporating specific
water management materials into sites, will prove valuable.
The City’s successful efforts to install permeable surface materials can be shared with the business community
through the Bridgeport Regional Business Council enabling all members, and specifically those members in the
building trades, architects, engineers, landscape architects, and landscape trades, to promote similar
installations on private commercial properties.
Job potential from this action item was not calculated.
Sub Action 3.10 Complete streets with bioswales
Goal: Develop bioswales as part of complete streets to reduce storm flow impact, protect water
resources, and reduce energy and emissions related to stormwater treatment .
Annual Savings Potential by 2030 20 MTCO2e
WPCA Annual Savings potential per 20 homes (1,000 lineal feet)
Electricity 975 kWh 0.4 MTCO2e
Water 623,377 gallons378
Implementation Summary
This action assumes creation of complete streets, which include a four‐to‐six foot wide vegetative buffer
along 9.29 miles (5%) of the city’s roadways.
This action can be accomplished as follows:
Implementation unit: 1,000 feet street frontage (approximately 20 homes with 50 feet street frontage each)
Implementation units needed: 49379
Implementation Schedule
2010‐15 2015‐20 2020‐25 2025‐30 2010 to 2030 Total
Percent 0.2 0.4 0.2 0 1.0
No. units 12 25 12 0 49
MTCO2e 4.96 9.92 4.96 0.00 19.85
Upon full implementation, this action may offer the following savings per year.
Electricity 47,763 kWh $7,200 to WPCA for water treatment
Water 30,545,455 gallons

Bridgeport Energy Efficiency and Conservation Plan 143
Additional Considerations
City streets and right‐of‐ways should be viewed as a resource for water management, and used to temper
stormwater flow and benefit water quality in rivers and Long Island Sound.
Philadelphia, in particular, is establishing an extensive system of bioswales to assist with water management,
and provides a valuable model to Bridgeport.
As the WPCA works with the State of Connecticut in creating a Long Term Control Plan, green infrastructure
inclusion will be essential. Baseline study is needed to quantify potential economic and water quality impact
of wide scale implementation, but demonstration complete streets can be put in place immediately. The City
can easily incorporate bioswales into ongoing street maintenance programs.
Job potential from this action item was not calculated.
Sub Action 3.11 ‐ Green Infrastructure Inclusion in Long Term Stormwater Management Control Plan
Goal: Incorporate green infrastructure and LID in the city’s Long Term Control Plan to protect water
resources, reduce storm flow impact, and reduce energy and emissions related to stormwater.
Annual Savings Potential by 2030 MTCO2e not quantified
Implementation Summary and Considerations
As the WPCA works with the State of Connecticut in creating a Long Term Control Plan, LID and green
infrastructure inclusion will be essential. Baseline study is needed to more specifically quantify potential
economic, water control and water quality impact of wide‐scale implementation of measures such as these,
but savings over full system separation alone are expected to be worthwhile.
The Environmental Protection Agency encourages incorporation of green infrastructure as “prominent
components” of Combined and Separate Sewer Overflow (CSO & SSO) and municipal stormwater (MS4)
programs.380
The City can expand its green infrastructure demonstration measures, and establish policies and procedures
relative to the public realm, but must also work strongly with private property owners in this effort, since
significant property is privately‐owned.
As noted earlier in this Bridgeport Energy Plan, Stormwater Management Regulations, in place, regulate
certain new construction. The Bridgeport Building Department, WPCA, and Engineering advisor can together
explore opportunities to incorporate green infrastructure incentives into Stormwater Management
Regulations to encouraged additional on‐site water management.

Bridgeport Energy Efficiency and Conservation Plan 144
The City has created permeable paving and porous surface materials applications in several locations in
Bridgeport. Additional demonstration pilots are being planned. These can serve a role in educating the private
sector to potential application on private property, particularly in Downtown, but also in other flood‐prone
areas.
Leader disconnect programs are helping many cities reduce storm load. The City, WPCA and Energy
Improvement District can jointly explore advantages and disadvantages of pursuing this option in Bridgeport,
and establishing green infrastructure, which enables infiltration, as an alternative, and as an opportunity for
inclusion in Long Term Water Control Planning.
Vegetative cover analysis can be included in City and WPCA efforts associated with the development of a Long
Term Control Plan. UFORE and/or UTC analysis can assist the City to inventory vegetative cover and identify
opportunities for vegetative and green infrastructure enhancement, which will dovetail with hard
infrastructure modifications.
Green roof development will depend on participation by private property ownership. Bridgeport’s Energy
Improvement District and Bridgeport Regional Business Council can assist the City in providing the outreach
and financing mechanisms needed to assimilate commercial property green roof development into Long Term
Control Planning.
A potential green infrastructure demonstration project is currently under study at Seaside Village. Upon
completion of this study, this site may serve to illustrate the potential supportive roles that private property
owners and the City can play in creating green infrastructure measures, in a slightly larger geographic
application, to complement WPCA sewer separation measures.
_________
Appendix: Gallons of Water Conserved and/or Diverted from WPCA.

Bridgeport Energy Efficiency and Conservation Plan 145

Bridgeport Energy Efficiency and Conservation Plan 146

Bridgeport Energy Efficiency and Conservation Plan 147
REFERENCES
1 Bridgeport’s GHG inventory was completed using Clean Air and Climate Protection (CACP) software, developed by the National Association of Clean Air
Agencies (formerly STAPPA and ALAPCO), ICLEI‐Local Governments for Sustainability (formerly International Cities for Local Environmental Action
(ICLEI)), and Torrie Smith Associates Inc. Minor updates were made to the plan in 2009 to reflect input of additional information.
2 Bridgeport is predicted to add 14,916 jobs between 2007 and 2030 and increase its household population by more than 7,600 (RPA, based on
Rodriguez, Orlando, 2007, Bridgeport, CT Population Projection from 2010 to 2030 by Age, Ethnicity and Sex Distributions, Connecticut State Data
Center, University of Connecticut, Storrs, Connecticut, and assuming linear growth between 2005 and 2010).
3 2010 Connecticut Energy Advisory Board Procurement Plan, CEAB Technical Paper: Emerging Technologies,
http://www.ctenergy.org/pdf/2010CEABPPPart4b1.pdf.
4 Aquarion reports 2010 average residential customer usage in Bridgeport of 105,000 gallons of water, which is down from 2007 average residential
customer usage of 111,200 gallons.
5 City of Bridgeport and The Institute for Sustainable Energy at Eastern Connecticut State University, February 2010, Bridgeport City Buildings; Facilities
Benchmarking Analysis Utilizing the US Environmental Protection Agency’s Energy Star ‐ Portfolio Manager.
6 Upon recommendation of ICLEI, Bridgeport GHG Inventory conducted for calendar year 2007 used Egrid Subregion 1 – NPCC New England coefficient
figures for 2004 as follows: CO2 908.9 lbs/MWH; N20 0.015 lbs/MWH; CH4 0.080 lbs/MWH and criteria air pollutants as follows: NOX 0.677 lbs/MWH;
SOX 1.262 lbs/MWH; CO 1.216 lbs/MWH; VOC 0.136 lbs/MWH; PM10 0.982 lbs/MWH. Electricity default metric tons/kWh is based on Bridgeport
inventory, which had input of 762,419,176 total kWh community‐wide and reported 316,511 MTCO2e of electricity‐related emissions community‐wide
for average of 0.000415141 MTCO2e/kWh.
7 Bridgeport GHG Inventory for calendar year 2007 had input of 3,998,557 thousand cubic feet total natural gas community‐wide and reported 228,616
MTCO2e of natural gas‐related emissions community‐wide for an average of 0.057175 MTCO2e/thousand cf.
8 Dollar savings are calculated using 2010 utility costs of $0.24/kWh electricity (includes all fees); $9.18/thousand cf natural gas for
commercial/industrial and $14.81/thousand cf natural gas for residential; $2.65/ gallon #2 light fuel oil; $3.00/gallon gasoline/diesel (assumes 1 average
price per gallon); $0.00735/ gallon water residential supply and $0.005/gallon water commercial/industrial supply; $0.002166/gallon cost to residents
and businesses for water treatment; $0.00018/gallon cost to utility associated with electricity to supply water; $0.000234/gallon cost associated with
electricity used to WPCA to treat water.
9 The Institute for Sustainable Energy at Eastern Connecticut State University, 2010, Bridgeport Public Schools; Facilities Benchmarking Analysis Utilizing
the US Environmental Protection Agency’s Energy Star ‐ Portfolio Manager.
10 Upon recommendation of ICLEI, Bridgeport GHG Inventory conducted for calendar year 2007 used Egrid Subregion 1 – NPCC New England coefficient
figures for 2004 as follows: CO2 908.9 lbs/MWH; N20 0.015 lbs/MWH; CH4 0.080 lbs/MWH and criteria air pollutants as follows: NOX 0.677 lbs/MWH;
SOX 1.262 lbs/MWH; CO 1.216 lbs/MWH; VOC 0.136 lbs/MWH; PM10 0.982 lbs/MWH. Electricity default from metric tons/kWh based on Bridgeport
inventory, which had input of 762,419,176 total kWh community‐wide and reported 316,511 MTCO2e of electricity‐related emissions community‐wide
for average of 0.000415141 MTCO2e/kWh.
11 Bridgeport GHG Inventory for calendar year 2007 had input of 3,998,557 thousand cubic feet total natural gas community‐wide and reported 228,616
MTCO2e of natural gas‐related emissions community‐wide for average of 0.057175 MTCO2e/thousand cf.
12 Dollar savings are calculated using 2010 utility costs of $0.24/kWh electricity (includes all fees); $9.18/thousand cf natural gas for
commercial/industrial and $14.81/thousand cf natural gas for residential; $2.65/ gallon #2 light fuel oil; $3.00/gallon gasoline/diesel (assumes 1 average
price per gallon); $0.00735/ gallon water residential supply and $0.005/gallon water commercial/industrial supply; $0.002166/gallon cost to residents
and businesses for water treatment; $0.00018/gallon cost to utility associated with electricity to supply water; $0.000234/gallon cost associated with
electricity used to WPCA to treat water.

Bridgeport Energy Efficiency and Conservation Plan 148
13 Energy inputs and emissions outputs from Bridgeport 2007 GHG Inventory for commercial sector are as follows:
Electricity 432,003,521 kWh 179,342 MTCO2e
Light Fuel Oil 4,942 thousand gallons 51,856 MTCO2e
Natural Gas 2,300,709 thousand cf 131,542 MTCO2e
Total emissions 362,740 MTCO2e
25% reduction goal
Electricity 108,000,880 kWh 44.835.50 MTCO2e
Light Fuel Oil 1235.50 thousand gallons 12,964 MTCO2e
Natural Gas 575177.25 thousand gallons 32.885.50 MTCO2e
Total C/I building emissions reduction goal 90,685 MTCO2e
14 Per building average annual savings potential derived from 2010 Electric and Natural Gas Conservation and Load Management Plan. UI Small business
energy advantage savings per project of 23,314kWh/yr calculated from 2010 projection data in The Connecticut Light and Power Company, The United
Illuminating Company, Yankee Gas Services Company, Connecticut Natural Gas Corporation and The Southern Connecticut Gas Company, Docket No. 09‐
10‐10, Docket No. 08‐10‐02, October 1, 2009, 2010 Electric and Natural Gas Conservation and Load Management Plan; page 192: UI 2010 goal of
11,657,000 kWh savings/500 projects = 23,314 kWh savings/project/year.
15 Upon recommendation of ICLEI, Bridgeport GHG Inventory conducted for calendar year 2007 used Egrid Subregion 1 – NPCC New England coefficient
figures for 2004 as follows: CO2 908.9 lbs/MWH; N20 0.015 lbs/MWH; CH4 0.080 lbs/MWH and criteria air pollutants as follows: NOX 0.677 lbs/MWH;
SOX 1.262 lbs/MWH; CO 1.216 lbs/MWH; VOC 0.136 lbs/MWH; PM10 0.982 lbs/MWH. Electricity default from metric tons/kWh based on Bridgeport
inventory, which had input of 762,419,176 total kWh community‐wide and reported 316,511 MTCO2e of electricity‐related emissions community‐wide
for average of 0.000415141 MTCO2e/kWh.
16 Dollar savings are calculated using 2010 utility costs of $0.24/kWh electricity (includes all fees); $9.18/thousand cf natural gas for
commercial/industrial and $14.81/thousand cf natural gas for residential; $2.65/ gallon #2 light fuel oil; $3.00/gallon gasoline/diesel (assumes 1 average
price per gallon); $0.00735/ gallon water residential supply and $0.005/gallon water commercial/industrial supply; $0.002166/gallon cost to residents
and businesses for water treatment; $0.00018/gallon cost to utility associated with electricity to supply water; $0.000234/gallon cost associated with
electricity used to WPCA to treat water.
17 See Appendix for financing options reported by the Connecticut Energy Advisory Board in its 2010 report.
18 Job potential estimate is based on the following: average job creation for energy efficiency projects is 9.1 job‐years per $1 million spent (Navigant
Consulting, CT Renewable Energy / Energy Efficiency Economy Baseline Study, Phase 1, March 27, 2009). This Bridgeport Energy Plan assumes average
investment equals $25,000 per job site. Job creation equals 0.2275 job‐years per site.
19 UI Energy Opportunities savings per project of 97,478 kWh per year calculated from 2010 projection data in The Connecticut Light and Power
Company, The United Illuminating Company, Yankee Gas Services Company, Connecticut Natural Gas Corporation and The Southern Connecticut Gas
Company, Docket No. 09‐10‐10, Docket No. 08‐10‐02, October 1, 2009, 2010 Electric and Natural Gas Conservation and Load Management Plan; Page
177: UI 2010 goal of 17,058,612 kWh savings/175 projects (including 10 comprehensive projects) = 97,478 kWh/project
20 Upon recommendation of ICLEI, Bridgeport GHG Inventory conducted for calendar year 2007 used Egrid Subregion 1 – NPCC New England coefficient
figures for 2004 as follows: CO2 908.9 lbs/MWH; N20 0.015 lbs/MWH; CH4 0.080 lbs/MWH and criteria air pollutants as follows: NOX 0.677 lbs/MWH;
SOX 1.262 lbs/MWH; CO 1.216 lbs/MWH; VOC 0.136 lbs/MWH; PM10 0.982 lbs/MWH. Electricity default from metric tons/kWh based on Bridgeport
inventory, which had input of 762,419,176 total kWh community‐wide and reported 316,511 MTCO2e of electricity‐related emissions community‐wide
for average of 0.000415141 MTCO2e/kWh.
21 SCG Energy Opportunities savings per project of 8,504 ccf per year calculated from 2010 projection data in The Connecticut Light and Power Company,
The United Illuminating Company, Yankee Gas Services Company, Connecticut Natural Gas Corporation and The Southern Connecticut Gas Company,
Docket No. 09‐10‐10, Docket No. 08‐10‐02, October 1, 2009, 2010 Electric and Natural Gas Conservation and Load Management Plan; Page 181: SCG
2010 goal of 195,604 ccf annual savings/23 projects = 8,504 ccf/project

Bridgeport Energy Efficiency and Conservation Plan 149
22 Bridgeport GHG Inventory for calendar year 2007 had input of 3,998,557 thousand cubic feet total natural gas community‐wide and reported 228,616
MTCO2e of natural gas‐related emissions community‐wide for average of 0.057175 MTCO2e/thousand cf.
23 Dollar savings are calculated using 2010 utility costs of $0.24/kWh electricity (includes all fees); $9.18/thousand cf natural gas for
commercial/industrial and $14.81/thousand cf natural gas for residential; $2.65/ gallon #2 light fuel oil; $3.00/gallon gasoline/diesel (assumes 1 average
price per gallon); $0.00735/ gallon water residential supply and $0.005/gallon water commercial/industrial supply; $0.002166/gallon cost to residents
and businesses for water treatment; $0.00018/gallon cost to utility associated with electricity to supply water; $0.000234/gallon cost associated with
electricity used to WPCA to treat water.
24 See Appendix for financing options reported by the Connecticut Energy Advisory Board in its 2010 report.
25 Job potential estimate is based on the following: average job creation for energy efficiency projects is 9.1 job‐years per $1 million spent (Navigant
Consulting, CT Renewable Energy / Energy Efficiency Economy Baseline Study, Phase 1, March 27, 2009). This Bridgeport Energy Plan assumes average
investment equals $800,000 per job site. Job creation equals 7.28 job‐years per site.
26 Richard Carroll, Siemens – guaranteed savings for 2,500 units combined.
27 Dollar savings are calculated using 2010 utility costs of $0.24/kWh electricity (includes all fees); $9.18/thousand cf natural gas for
commercial/industrial and $14.81/thousand cf natural gas for residential; $2.65/ gallon #2 light fuel oil; $3.00/gallon gasoline/diesel (assumes 1 average
price per gallon); $0.00735/ gallon water residential supply and $0.005/gallon water commercial/industrial supply; $0.002166/gallon cost to residents
and businesses for water treatment; $0.00018/gallon cost to utility associated with electricity to supply water; $0.000234/gallon cost associated with
electricity used to WPCA to treat water.
28 2007 Households derived from CT State Data Center: Rodriguez, Orlando, 2007; Bridgeport, CT Population Projection from 2010 to 2030 by Age,
Ethnicity and Sex Distributions, Connecticut State Data Center, University of Connecticut, Storrs, Connecticut, and assuming linear growth between 2005
and 2010.
29 Home Energy Solutions savings per household (not building) of 1,070 kWh per year calculated from 2010 projection data in The Connecticut Light and
Power Company, The United Illuminating Company, Yankee Gas Services Company, Connecticut Natural Gas Corporation and The Southern Connecticut
Gas Company, Docket No. 09‐10‐10, Docket No. 08‐10‐02, October 1, 2009, 2010 Electric and Natural Gas Conservation and Load Management Plan;
page 114: UI 2010 goal of 4,324,000 kWh savings / 4043 projects = 1,070 kWh/project/year
30 Upon recommendation of ICLEI, Bridgeport GHG Inventory conducted for calendar year 2007 used Egrid Subregion 1 – NPCC New England coefficient
figures for 2004 as follows: CO2 908.9 lbs/MWH; N20 0.015 lbs/MWH; CH4 0.080 lbs/MWH and criteria air pollutants as follows: NOX 0.677 lbs/MWH;
SOX 1.262 lbs/MWH; CO 1.216 lbs/MWH; VOC 0.136 lbs/MWH; PM10 0.982 lbs/MWH. Electricity default from metric tons/kWh based on Bridgeport
inventory, which had input of 762,419,176 total kWh community‐wide and reported 316,511 MTCO2e of electricity‐related emissions community‐wide
for average of 0.000415141 MTCO2e/kWh.
31 Home Energy Solutions gas savings per household (not building) per year‐ 65 ccf calculated from 2010 projection data in The Connecticut Light and
Power Company, The United Illuminating Company, Yankee Gas Services Company, Connecticut Natural Gas Corporation and The Southern Connecticut
Gas Company, Docket No. 09‐10‐10, Docket No. 08‐10‐02, October 1, 2009, 2010 Electric and Natural Gas Conservation and Load Management Plan;
Page 117: SCG 2010 goal of 123,219 ccf savings / 1,895 sites = 65 ccf savings/project/year
32 Bridgeport GHG Inventory for calendar year 2007 had input of 3,998,557 thousand cubic feet total natural gas community‐wide and reported 228,616
MTCO2e of natural gas‐related emissions community‐wide for average of 0.057175 MTCO2e/thousand cf.
33 Home Energy Solutions gallons light fuel oil per year per residence assumes 15% savings on 375 gallons/household used in Bridgeport GHG inventory
or 56.25 gallons.
34 Bridgeport GHG Inventory for calendar year 2007 had input of 9,585 thousand gallons of light fuel oil community wide and reported 100,588 MTCO2e
of light fuel oil‐related emissions community wide for average of 9.367 MTCO2e/thousand gallons of fuel oil.
35 Dollar savings are calculated using 2010 utility costs of $0.24/kWh electricity (includes all fees); $9.18/thousand cf natural gas for
commercial/industrial and $14.81/thousand cf natural gas for residential; $2.65/ gallon #2 light fuel oil; $3.00/gallon gasoline/diesel (assumes 1 average

Bridgeport Energy Efficiency and Conservation Plan 150
price per gallon); $0.00735/ gallon water residential supply and $0.005/gallon water commercial/industrial supply; $0.002166/gallon cost to residents
and businesses for water treatment; $0.00018/gallon cost to utility associated with electricity to supply water; $0.000234/gallon cost associated with
electricity used to WPCA to treat water.
36 See Appendix for CEAB analysis of numerous potential funding mechanisms.
37 Labor estimate assumes 2 installers for a half day per household, which equals 1 man day per job.
38 47,543 households derived from Connecticut State Data Center data: RPA derived from Rodriguez, Orlando, 2007; Bridgeport, CT Population
Projection from 2010 to 2030 by Age, Ethnicity and Sex Distributions, Connecticut State Data Center, University of Connecticut, Storrs, Connecticut, and
assuming linear growth between 2005 and 2010.
39 Income eligible residential WRAP/UI Helps program electricity savings per household per year = 1,031 kWh calculated from 2010 projection data in
The Connecticut Light and Power Company, The United Illuminating Company, Yankee Gas Services Company, Connecticut Natural Gas Corporation and
The Southern Connecticut Gas Company, Docket No. 09‐10‐10, Docket No. 08‐10‐02, October 1, 2009, 2010 Electric and Natural Gas Conservation and
Load Management Plan; Page 134: UI 2010 goal of 7,115,000 kWh savings / 6,093 sites = 1,031 kWh/site/year
40 Upon recommendation of ICLEI, Bridgeport GHG Inventory conducted for calendar year 2007 used Egrid Subregion 1 – NPCC New England coefficient
figures for 2004 as follows: CO2 908.9 lbs/MWH; N20 0.015 lbs/MWH; CH4 0.080 lbs/MWH and criteria air pollutants as follows: NOX 0.677 lbs/MWH;
SOX 1.262 lbs/MWH; CO 1.216 lbs/MWH; VOC 0.136 lbs/MWH; PM10 0.982 lbs/MWH. Electricity default from metric tons/kWh based on Bridgeport
inventory, which had input of 762,419,176 total kWh community‐wide and reported 316,511 MTCO2e of electricity‐related emissions community‐wide
for average of 0.000415141 MTCO2e/kWh.
41 Income eligible SCG Limited Income Weatherization and Heating System residential ccf gas savings per residence per year = 123.98 (round to 124) ccf
calculated from 2010 projection data in The Connecticut Light and Power Company, The United Illuminating Company, Yankee Gas Services Company,
Connecticut Natural Gas Corporation and The Southern Connecticut Gas Company, Docket No. 09‐10‐10, Docket No. 08‐10‐02, October 1, 2009, 2010
Electric and Natural Gas Conservation and Load Management Plan; Page 138: SCG 2010 goal of 105,631 ccf / 852 sites = 124 ccf/site/year
42 Bridgeport GHG Inventory for calendar year 2007 had input of 3,998,557 thousand cubic feet total natural gas community‐wide and reported 228,616
MTCO2e of natural gas‐related emissions community‐wide for average of 0.057175 MTCO2e/thousand cf.
43 Income Eligible gallons light fuel oil per year per household assumes 15% savings on 375 gallons/household used in Bridgeport GHG inventory or 56.25
gallons.
44 Bridgeport GHG Inventory for calendar year 2007 had input of 9,585 thousand gallons of light fuel oil community‐wide and reported 100,588 MTCO2e
of light fuel oil‐related emissions community‐wide for average of 9.367 MTCO2e/thousand gallons of fuel oil.
45 Dollar savings are calculated using 2010 utility costs of $0.24/kWh electricity (includes all fees); $9.18/thousand cf natural gas for
commercial/industrial and $14.81/thousand cf natural gas for residential; $2.65/ gallon #2 light fuel oil; $3.00/gallon gasoline/diesel (assumes 1 average
price per gallon); $0.00735/ gallon water residential supply and $0.005/gallon water commercial/industrial supply; $0.002166/gallon cost to residents
and businesses for water treatment; $0.00018/gallon cost to utility associated with electricity to supply water; $0.000234/gallon cost associated with
electricity used to WPCA to treat water.
46 Center for Neighborhood Technology, 2008, Chicago Greenhouse Gas Emissions: An Inventory, Forecast, and Mitigation Analysis for Chicago and the
Metropolitan Region; An assessment prepared for the City of Chicago; http://www.chicagoclimateaction.org/filebin/pdf/FINALALL091708_1‐118.pdf
47 See Appendix for CEAB analysis of numerous potential funding mechanisms.
48 Labor estimate assumes 2 installers for a half day per household, which equals 1 man day per job.
49 Assumes a mid‐range change from 15 to 27 R value (range is 0 to 45).
50Assumes installation of ceiling insulation with new R value of 27 and old R value of 15 (a mid‐range shift in the full range of 0 to 45 R values). UI and
CL&P Program Savings Documentation for 2010 Program Year, page 165 notes savings from Installation of Ceiling Insulations (HES and Low Income) as

Bridgeport Energy Efficiency and Conservation Plan 151
noted equals 78 kWh savings/year per 100 square feet for Electric Resistance Heat. The average residential building footprint in Bridgeport is 1,064
square feet (Bridgeport Tax Assessor information). 78 kWh/100 square feet X 1,064 square feet = 829.92 kWh/year/building.
51 Upon recommendation of ICLEI, Bridgeport GHG Inventory conducted for calendar year 2007 used Egrid Subregion 1 – NPCC New England coefficient
figures for 2004 as follows: CO2 908.9 lbs/MWH; N20 0.015 lbs/MWH; CH4 0.080 lbs/MWH and criteria air pollutants as follows: NOX 0.677 lbs/MWH;
SOX 1.262 lbs/MWH; CO 1.216 lbs/MWH; VOC 0.136 lbs/MWH; PM10 0.982 lbs/MWH. Bridgeport inventory had input of 762,419,176 total kWh
community‐wide and reported 316,511 MTCO2e of electricity‐related emissions for community‐wide average of 0.000415141 MTCO2e/kWh.Ceiling
insulation installation emissions savings from electricity savings MTCO2e/100 square feet electric heat = (829.92 kWh/year/building) X 0.000415141 =
0.032380978 metric tons/100 square feet. Average residential building footprint = 1,064 square feet. Emissions savings per building = (0.032380978
metric tons/100 square feet) X (1,064 square feet/building) = 0.344533604 MTCO2e per building for electric heat.
52Assumes installation of ceiling insulation with new R value of 27 and old R value of 15 (a mid‐range shift in the full range of 0 to 45 R values). UI and
CL&P Program Savings Documentation for 2010 Program Year, page 167 notes savings from Installation of Ceiling Insulations (HES and Low Income) as
described equals 3.5 therms per year per 100 square feet in gas savings if gas heated. The average residential building footprint in Bridgeport is 1,064
square feet (Bridgeport Tax Assessor information). 1 therm = 100 cf gas. (0.35 thousand cf gas/100 square feet) X (1064 square feet/building) = 3.724
thousand cf gas/year/building savings.
53 Bridgeport GHG Inventory for calendar year 2007 had input of 3,998,557 thousand cubic feet of natural gas community‐wide and reported 228,616
MTCO2e of natural gas‐related emissions community‐wide for average of 0.057175 MTCO2e/thousand cf. Using this conversion, (3.724 thousand cf gas)
X (0.057175 MTCO2e/thousand cf) = 0.212918692 MTCO2e per building per year.
54 Assumes installation of ceiling insulation with new R value of 27 and old R value of 15 (a mid‐range shift in the full range of 0 to 45 R values). UI and
CL&P Program Savings Documentation for 2010 Program Year, page 166 notes savings from Installation of Ceiling Insulations (HES and Low Income) as
described equals 2.5 gallons heating fuel oil /year per 100 square feet for oil‐heated household. The average residential building footprint in Bridgeport
is 1,064 square feet (Bridgeport Tax Assessor information). (1,064 square feet/building) X (2.5 gallons/100 square feet) = 0.0266 thousand gallons
oil/building.
55 Bridgeport GHG Inventory for calendar year 2007 had input of 9,585 thousand gallons of light fuel oil community‐wide and reported 100,588 MTCO2e
of light fuel oil‐related emissions community‐wide for average of 9.367 MTCO2e/thousand gallons of fuel oil. Using this conversion: (0.0266 thousand
gallons oil/building) X (9.367 MTCO2e/thousand gallons) =0.2491622 MTCO2e/building annual savings.
56 Total emissions savings per building assumes 50/50 split of oil and gas heating units and disregards electrical heat to reflect heating split of 47% oil
heating and 52 % gas heating as reported from Bridgeport Tax Assessor data.
57 Total residential buildings (not households) from Bridgeport Tax Assessor equal 22,866. This number excludes condominiums.
58 Dollar savings are calculated using 2010 utility costs of $0.24/kWh electricity (includes all fees); $9.18/thousand cf natural gas for
commercial/industrial and $14.81/thousand cf natural gas for residential; $2.65/ gallon #2 light fuel oil; $3.00/gallon gasoline/diesel (assumes 1 average
price per gallon); $0.00735/ gallon water residential supply and $0.005/gallon water commercial/industrial supply; $0.002166/gallon cost to residents
and businesses for water treatment; $0.00018/gallon cost to utility associated with electricity to supply water; $0.000234/gallon cost associated with
electricity used to WPCA to treat water.
59 See Appendix for CEAB analysis of numerous potential funding mechanisms.
60 Job development estimate assumes labor of 2 man‐days per job.
61 Assumes insulation creates 10% reduction in average household energy demand. This assumes heating and cooling energy equals 56% of total building
energy use (U.S. DOE, Home Energy tips, http://www.energy.gov/heatingcooling.htm). Assumes insulation creates savings of between 15% and 20% of
heating and cooling energy demand. Residential energy demand from Bridgeport 2007 GHG Inventory data is as follows: residential electricity
consumption equaled 330,415,655 kWh; residential light fuel oil consumption equaled 4,643 thousand gallons; and residential natural gas consumption
equaled 1,697,848 thousand cf. Per household average based on 47,543 Bridgeport households (RPA derived from Rodriguez, Orlando, 2007.
Bridgeport, CT Population Projection from 2010 to 2030 by Age, Ethnicity and Sex Distributions, Connecticut State Data Center, University of
Connecticut, Storrs, Connecticut, and assuming linear growth between 2005 and 2010).

Bridgeport Energy Efficiency and Conservation Plan 152
62 Residential building emissions from 2007 Bridgeport GHG Inventory are 137,169 MTCO2e for electricity, 48,732 MTCO2e for light fuel oil, and 97,074
MTCO2e for natural gas. Per household averages are based on 47,543 Bridgeport households (RPA derived from Rodriguez, Orlando, 2007; Bridgeport,
CT Population Projection from 2010 to 2030 by Age, Ethnicity and Sex Distributions, Connecticut State Data Center, University of Connecticut, Storrs,
Connecticut, and assuming linear growth between 2005 and 2010).
63 Dollar savings are calculated using 2010 utility costs of $0.24/kWh electricity (includes all fees); $9.18/thousand cf natural gas for
commercial/industrial and $14.81/thousand cf natural gas for residential; $2.65/ gallon #2 light fuel oil; $3.00/gallon gasoline/diesel (assumes 1 average
price per gallon); $0.00735/ gallon water residential supply and $0.005/gallon water commercial/industrial supply; $0.002166/gallon cost to residents
and businesses for water treatment; $0.00018/gallon cost to utility associated with electricity to supply water; $0.000234/gallon cost associated with
electricity used to WPCA to treat water.
64Assumes installation of 4 cfl bulbs with each having the electricity savings averaged between expected savings of a hallway bulb and expected savings
of a study/den bulb, or 61.3413 kWh per year. CFL in a study/den has assumed average savings of 48.8 kWh/year (calculated based on UI and CL&P
Program Savings Documentation for 2010 Program Year, pages 80‐81: Annual Gross Energy Savings for a 15 watt CFL with 2.97 hours/day usage (average
for Den/Office, kitchen, Living Room, Dining Room) with net realization of 81% (UI and CL&P Program Savings Documentation for 2010 Program Year,
page 210: Net Realization for General Service CFL Bulbs, Non‐General Service CFL Bulbs, and CFL Giveaway Programs each = 81%) resulting in average
savings of 39.53 kWh per year per study/den bulb. CFL in a hallway has assumed average savings of 102.66 kWh/year (calculated based on UI and CL&P
Program Savings Documentation for 2010 Program Year, pages 80‐81: Annual Gross Energy Savings for 15 watt CFL with 6.25 hours/day usage (average
for hallway) = (3 incandescent to CFL wattage factor)(15 watts/bulb)(6.25 hours/day)(365 days/year) / 1000 = 102.66 kWh) with a net realization of
81% (UI and CL&P Program Savings Documentation for 2010 Program Year, page 210: Net Realization for General Service CFL Bulbs, Non‐General Service
CFL Bulbs, and CFL Giveaway Programs each) resulting in (81%)( 102.66) = 83.15 kWh/year savings per year per hallway bulb.
65 Emissions calculated based on 2007 Bridgeport GHG Inventory average emissions per kilowatt hour. Upon recommendation of ICLEI, Bridgeport GHG
Inventory conducted for calendar year 2007 used Egrid Subregion 1 – NPCC New England coefficient figures for 2004 as follows: CO2 908.9 lbs/MWH;
N20 0.015 lbs/MWH; CH4 0.080 lbs/MWH and criteria air pollutants as follows: NOX 0.677 lbs/MWH; SOX 1.262 lbs/MWH; CO 1.216 lbs/MWH; VOC
0.136 lbs/MWH; PM10 0.982 lbs/MWH. Bridgeport inventory had input of 762,419,176 total kWh community‐wide and reported 316,511 MTCO2e of
electricity‐related emissions for community‐wide average of 0.000415141 MTCO2e/kWh. Emissions savings calculated based upon this coefficient equal
0.0164096832276304 MTCO2e per study bulb and 0.0345208622981257 MTCO2e per hallway bulb. This Bridgeport Energy Plan assumes 4 bulbs, with
each having average of the two emissions or 4 (0.025465273 MTCO2e) equals 0.101861091 MTCO2e for installation of 4 cfl bulbs.
66 Household number based on Connecticut State Data Center data (Rodriguez, Orlando, 2007; Bridgeport, CT Population Projection from 2010 to 2030
by Age, Ethnicity and Sex Distributions, Connecticut State Data Center, University of Connecticut, Storrs, Connecticut, and assuming linear growth
between 2005 and 2010).
67 Dollar savings are calculated using 2010 utility costs of $0.24/kWh electricity (includes all fees); $9.18/thousand cf natural gas for
commercial/industrial and $14.81/thousand cf natural gas for residential; $2.65/ gallon #2 light fuel oil; $3.00/gallon gasoline/diesel (assumes 1 average
price per gallon); $0.00735/ gallon water residential supply and $0.005/gallon water commercial/industrial supply; $0.002166/gallon cost to residents
and businesses for water treatment; $0.00018/gallon cost to utility associated with electricity to supply water; $0.000234/gallon cost associated with
electricity used to WPCA to treat water.
68 Connecticut Climate Change website home page for homes and individuals; Shining Solutions page;
http://www.shiningsolutionsfundraiser.com/fqs.html
69 Center for Neighborhood Technology, 2008, Chicago Greenhouse Gas Emissions: An Inventory, Forecast, and Mitigation Analysis for Chicago and the
Metropolitan Region; An assessment prepared for the City of Chicago http://www.chicagoclimateaction.org/filebin/pdf/FINALALL091708_1‐118.pdf).
70 The Connecticut Light and Power Company, The United Illuminating Company, Yankee Gas Services Company, Connecticut Natural Gas Corporation
and The Southern Connecticut Gas Company, Docket No. 09‐10‐10, Docket No. 08‐10‐02, October 1, 2009, 2010 Electric and Natural Gas Conservation
and Load Management Plan; Page 56.
71 Assumes refrigerator trade in for Energy Star, Low Income kWh savings/unit/year (20% savings) as noted in UI and CL&P Program Savings
Documentation for 2010 Program Year, pages 134‐136: Refrigerator Retirement‐ for Low Income annual difference between old and new Energy Star

Bridgeport Energy Efficiency and Conservation Plan 153
2008 of 24 kWh /year. Note: this Bridgeport Energy Plan uses this single year figure for all annual savings figures, and does not include a separate early
retirement savings.
72 Upon recommendation of ICLEI, Bridgeport GHG Inventory conducted for calendar year 2007 used Egrid Subregion 1 – NPCC New England coefficient
figures for 2004 as follows: CO2 908.9 lbs/MWH; N20 0.015 lbs/MWH; CH4 0.080 lbs/MWH and criteria air pollutants as follows: NOX 0.677 lbs/MWH;
SOX 1.262 lbs/MWH; CO 1.216 lbs/MWH; VOC 0.136 lbs/MWH; PM10 0.982 lbs/MWH. Bridgeport inventory had input of 762,419,176 total kWh
community‐wide and reported 316,511 MTCO2e of electricity‐related emissions for community‐wide average of 0.000415141 MTCO2e/kWh. Emissions
savings calculated based upon this coefficient.
73 Dollar savings are calculated using 2010 utility costs of $0.24/kWh electricity (includes all fees); $9.18/thousand cf natural gas for
commercial/industrial and $14.81/thousand cf natural gas for residential; $2.65/ gallon #2 light fuel oil; $3.00/gallon gasoline/diesel (assumes 1 average
price per gallon); $0.00735/ gallon water residential supply and $0.005/gallon water commercial/industrial supply; $0.002166/gallon cost to residents
and businesses for water treatment; $0.00018/gallon cost to utility associated with electricity to supply water; $0.000234/gallon cost associated with
electricity used to WPCA to treat water.
74 Some sources report replacing a 10‐year‐old refrigerator can save $40 annually (see Center for Neighborhood Technology, 2008, Chicago Greenhouse
Gas Emissions: An Inventory, Forecast, and Mitigation Analysis for Chicago and the Metropolitan Region; An assessment prepared for the City of Chicago
http://www.chicagoclimateaction.org/filebin/pdf/FINALALL091708_1‐118.pdf). This Bridgeport Energy Plan estimates the lower $6 annual utility savings
based on calculations described above.
75 Center for Neighborhood Technology, 2008, Chicago Greenhouse Gas Emissions: An Inventory, Forecast, and Mitigation Analysis for Chicago and the
Metropolitan Region; An assessment prepared for the City of Chicago, http://www.chicagoclimateaction.org/filebin/pdf/FINALALL091708_1‐118.pdf).
76 Lowe’s, www.lowes.com, as cited in Center for Neighborhood Technology, 2008, Chicago Greenhouse Gas Emissions: An Inventory, Forecast, and
Mitigation Analysis for Chicago and the Metropolitan Region; An assessment prepared for the City of Chicago
http://www.chicagoclimateaction.org/filebin/pdf/FINALALL091708_1‐118.pdf).
77 This employment opportunity calculation assumes 2 installers for ¼ day, or 0.5 man‐days per refrigerator installation.
78 Assumes freezer trade in for energy Star, Low Income kWh savings/unit/year as noted in UI and CL&P Program Savings Documentation for 2010
Program Year, pages 137‐138: Freezer Retirement‐ for Low Income annual difference between old and new Energy Star 2008 of 36kWh /year. Note: this
Bridgeport Energy Plan uses this single year figure for all annual savings figures, and does not include a separate early retirement savings.
79 Upon recommendation of ICLEI, Bridgeport GHG Inventory conducted for calendar year 2007 used Egrid Subregion 1 – NPCC New England coefficient
figures for 2004 as follows: CO2 908.9 lbs/MWH; N20 0.015 lbs/MWH; CH4 0.080 lbs/MWH and criteria air pollutants as follows: NOX 0.677 lbs/MWH;
SOX 1.262 lbs/MWH; CO 1.216 lbs/MWH; VOC 0.136 lbs/MWH; PM10 0.982 lbs/MWH. Bridgeport inventory had input of 762,419,176 total kWh
community‐wide and reported 316,511 MTCO2e of electricity‐related emissions for community‐wide average of 0.000415141 MTCO2e/kWh. Emissions
savings calculated based upon this coefficient.
80 Rounding accounts for difference.
81 Dollar savings are calculated using 2010 utility costs of $0.24/kWh electricity (includes all fees); $9.18/thousand cf natural gas for
commercial/industrial and $14.81/thousand cf natural gas for residential; $2.65/ gallon #2 light fuel oil; $3.00/gallon gasoline/diesel (assumes 1 average
price per gallon); $0.00735/ gallon water residential supply and $0.005/gallon water commercial/industrial supply; $0.002166/gallon cost to residents
and businesses for water treatment; $0.00018/gallon cost to utility associated with electricity to supply water; $0.000234/gallon cost associated with
electricity used to WPCA to treat water.
82 This employment opportunity calculation assumes 2 installers for ¼ day, or 0.5 man‐days per freezer installation.
83 Assumes air conditioner trade in for Energy Star unit as noted in UI and CL&P Program Savings Documentation for 2010 Program Year, pages 130‐133:
Room AC Retirement (Turn‐In & Low Income) annual difference between old and new Energy Star unit, default values of 51 kWh for turned‐in unit
versus the Federal standard (4 years) and 26.3 kWh for the Federal standard verses the new CEE Tier I unit savings (12 years) for total savings of 77.3
kWh annual savings per unit.

Bridgeport Energy Efficiency and Conservation Plan 154
84 Upon recommendation of ICLEI, Bridgeport GHG Inventory conducted for calendar year 2007 used Egrid Subregion 1 – NPCC New England coefficient
figures for 2004 as follows: CO2 908.9 lbs/MWH; N20 0.015 lbs/MWH; CH4 0.080 lbs/MWH and criteria air pollutants as follows: NOX 0.677 lbs/MWH;
SOX 1.262 lbs/MWH; CO 1.216 lbs/MWH; VOC 0.136 lbs/MWH; PM10 0.982 lbs/MWH. Bridgeport inventory had input of 762,419,176 total kWh
community‐wide and reported 316,511 MTCO2e of electricity‐related emissions for community‐wide average of 0.000415141 MTCO2e/kWh. Emissions
savings calculated based upon this coefficient.
85 Dollar savings are calculated using 2010 utility costs of $0.24/kWh electricity (includes all fees); $9.18/thousand cf natural gas for
commercial/industrial and $14.81/thousand cf natural gas for residential; $2.65/ gallon #2 light fuel oil; $3.00/gallon gasoline/diesel (assumes 1 average
price per gallon); $0.00735/ gallon water residential supply and $0.005/gallon water commercial/industrial supply; $0.002166/gallon cost to residents
and businesses for water treatment; $0.00018/gallon cost to utility associated with electricity to supply water; $0.000234/gallon cost associated with
electricity used to WPCA to treat water.
86 Some sources report replacing a 10‐year‐old air conditioner can save $25 annually (see Center for Neighborhood Technology, 2008, Chicago
Greenhouse Gas Emissions: An Inventory, Forecast, and Mitigation Analysis for Chicago and the Metropolitan Region; An assessment prepared for the
City of Chicago http://www.chicagoclimateaction.org/filebin/pdf/FINALALL091708_1‐118.pdf). This Bridgeport Energy Plan estimates the lower $19
annual utility savings based on calculations described above.
87 Center for Neighborhood Technology, 2008, Chicago Greenhouse Gas Emissions: An Inventory, Forecast, and Mitigation Analysis for Chicago and the
Metropolitan Region; An assessment prepared for the City of Chicago http://www.chicagoclimateaction.org/filebin/pdf/FINALALL091708_1‐118.pdf).
88 Lowe’s, www.lowes.com, as cited in Center for Neighborhood Technology, 2008, Chicago Greenhouse Gas Emissions: An Inventory, Forecast, and
Mitigation Analysis for Chicago and the Metropolitan Region; An assessment prepared for the City of Chicago
http://www.chicagoclimateaction.org/filebin/pdf/FINALALL091708_1‐118.pdf).
89 Assumes energy savings based on Clothes Washer, Energy Star for Income Eligible, unknown fuels in UI and CL&P Program Savings Documentation for
2010 Program Year, pages 123‐125: Clothes Washer (Retail Products, HES & Low Income) annual difference between old and new Energy Star (July 2009)
for Early Retirement gross Annual Savings Water Heater and Dryer Fuel Type Unknown i.e. Retail Sales, which includes 17 kWh electricity, 0.12 ccf gas,
0.18 gallons of oil and 4,154 BTU’s unknown fuels (other hot water fuel) as well as 0.22 ccf unknown fuels ccf gas for dryer. This Energy Report uses this
single year figure for all annual savings figures, and does not include a separate early retirement savings. Energy savings related to water savings are not
included in these figures, but are included in separate section of Bridgeport Energy Plan, which address water savings and related energy savings.
90 Upon recommendation of ICLEI, Bridgeport GHG Inventory conducted for calendar year 2007 used Egrid Subregion 1 – NPCC New England coefficient
figures for 2004 as follows: CO2 908.9 lbs/MWH; N20 0.015 lbs/MWH; CH4 0.080 lbs/MWH and criteria air pollutants as follows: NOX 0.677 lbs/MWH;
SOX 1.262 lbs/MWH; CO 1.216 lbs/MWH; VOC 0.136 lbs/MWH; PM10 0.982 lbs/MWH. Bridgeport inventory had input of 762,419,176 total kWh
community‐wide and reported 316,511 MTCO2e of electricity‐related emissions for community‐wide average of 0.000415141 MTCO2e/kWh. Electricity
emissions savings are calculated based upon this coefficient. Bridgeport GHG Inventory for calendar year 2007 had input of 9,585 thousand gallons of
light fuel oil community‐wide and reported 100,588 MTCO2e of light fuel oil‐related emissions community‐wide for average of 9.367 MTCO2e/thousand
gallons of fuel oil. Oil‐related emissions savings are calculated based upon this coefficient. Bridgeport GHG Inventory for calendar year 2007 had input of
3,998,557 thousand cubic feet of natural gas community‐wide and reported 228,616 MTCO2e of natural gas‐related emissions community‐wide for
average of 0.057175 MTCO2e/thousand cf. Gas‐related emissions savings are calculated based upon this coefficient.
91 Dollar savings are calculated using 2010 utility costs of $0.24/kWh electricity (includes all fees); $9.18/thousand cf natural gas for
commercial/industrial and $14.81/thousand cf natural gas for residential; $2.65/ gallon #2 light fuel oil; $3.00/gallon gasoline/diesel (assumes 1 average
price per gallon); $0.00735/ gallon water residential supply and $0.005/gallon water commercial/industrial supply; $0.002166/gallon cost to residents
and businesses for water treatment; $0.00018/gallon cost to utility associated with electricity to supply water; $0.000234/gallon cost associated with
electricity used to WPCA to treat water.
92 This employment opportunity calculation assumes 2 installers for ¼ day, or 0.5 man‐days per clothes washer installation. This assumption discounts
the fact that some clothes washers may be self‐installed.
93 Assumes energy savings based on Dishwasher, Energy Star unknown fuels in UI and CL&P Program Savings Documentation for 2010 Program Year,
pages 126‐127: Dishwasher (Retail Products, HES & Low Income) annual difference between old and CEE Tier 2 for Gross Annual Savings (New Units)

Bridgeport Energy Efficiency and Conservation Plan 155
Fuel Type Unknown i.e. Retail Sales of 3 kWh electricity, 0.16 ccf natural gas, 0.36 gallons oil, and 5,391 BTU’s other fossil fuel. This Energy Report uses
this single year figure for all annual savings figures, and does not include a separate early retirement savings.
94 Upon recommendation of ICLEI, Bridgeport GHG Inventory conducted for calendar year 2007 used Egrid Subregion 1 – NPCC New England coefficient
figures for 2004 as follows: CO2 908.9 lbs/MWH; N20 0.015 lbs/MWH; CH4 0.080 lbs/MWH and criteria air pollutants as follows: NOX 0.677 lbs/MWH;
SOX 1.262 lbs/MWH; CO 1.216 lbs/MWH; VOC 0.136 lbs/MWH; PM10 0.982 lbs/MWH. Bridgeport inventory had input of 762,419,176 total kWh
community‐wide and reported 316,511 MTCO2e of electricity‐related emissions for community‐wide average of 0.000415141 MTCO2e/kWh. Electricity
emissions savings are calculated based upon this coefficient. Bridgeport GHG Inventory for calendar year 2007 had input of 9,585 thousand gallons of
light fuel oil community‐wide and reported 100,588 MTCO2e of light fuel oil‐related emissions community‐wide for average of 9.367 MTCO2e/thousand
gallons of fuel oil. Oil‐related emissions savings are calculated based upon this coefficient. Bridgeport GHG Inventory for calendar year 2007 had input of
3,998,557 thousand cubic feet of natural gas community‐wide and reported 228,616 MTCO2e of natural gas‐related emissions community‐wide for
average of 0.057175 MTCO2e/thousand cf. Gas‐related emissions savings are calculated based upon this coefficient.
95 Dollar savings are calculated using 2010 utility costs of $0.24/kWh electricity (includes all fees); $9.18/thousand cf natural gas for
commercial/industrial and $14.81/thousand cf natural gas for residential; $2.65/ gallon #2 light fuel oil; $3.00/gallon gasoline/diesel (assumes 1 average
price per gallon); $0.00735/ gallon water residential supply and $0.005/gallon water commercial/industrial supply; $0.002166/gallon cost to residents
and businesses for water treatment; $0.00018/gallon cost to utility associated with electricity to supply water; $0.000234/gallon cost associated with
electricity used to WPCA to treat water.
96 Hot water heating impact only. The impact on energy demand and emissions associated with water supply and treatment is addressed in a separate
Water Resources section of this Bridgeport Energy Plan.
97 Assumes installation of 1 showerhead per household with average change from 4 to 2.2 GPM water flow and reflects Bridgeport’s residential heating
oil split (including condominiums) of 4.76% electric, 48.42% gas, and 46.70% oil (from Bridgeport Tax Assessor data). Energy savings are derived from UI
and CL&P Program Savings Documentation for 2010 Program Year, pages 161‐162: Low Flow Showerheads, HES and Low Income; average 4 to 2.2 GPM
savings of 577 kWh/year savings per showerhead for electric water heater, 3.08 MBTU/year of gas savings per showerhead for gas water heater, and
25.6 gallons/year of oil savings per showerhead for oil water heater.
98 Upon recommendation of ICLEI, Bridgeport GHG Inventory conducted for calendar year 2007 used Egrid Subregion 1 – NPCC New England coefficient
figures for 2004 as follows: CO2 908.9 lbs/MWH; N20 0.015 lbs/MWH; CH4 0.080 lbs/MWH and criteria air pollutants as follows: NOX 0.677 lbs/MWH;
SOX 1.262 lbs/MWH; CO 1.216 lbs/MWH; VOC 0.136 lbs/MWH; PM10 0.982 lbs/MWH. Bridgeport inventory had input of 762,419,176 total kWh
community‐wide and reported 316,511 MTCO2e of electricity‐related emissions for community‐wide average of 0.000415141 MTCO2e/kWh. Electricity
emissions savings are calculated based upon this coefficient. Bridgeport GHG Inventory for calendar year 2007 had input of 9,585 thousand gallons of
light fuel oil community‐wide and reported 100,588 MTCO2e of light fuel oil‐related emissions community‐wide for average of 9.367 MTCO2e/thousand
gallons of fuel oil. Oil‐related emissions savings are calculated based upon this coefficient. Bridgeport GHG Inventory for calendar year 2007 had input of
3,998,557 thousand cubic feet of natural gas community‐wide and reported 228,616 MTCO2e of natural gas‐related emissions community‐wide for
average of 0.057175 MTCO2e/thousand cf. Gas‐related emissions savings are calculated based upon this coefficient.
99 Dollar savings are calculated using 2010 utility costs of $0.24/kWh electricity (includes all fees); $9.18/thousand cf natural gas for
commercial/industrial and $14.81/thousand cf natural gas for residential; $2.65/ gallon #2 light fuel oil; $3.00/gallon gasoline/diesel (assumes 1 average
price per gallon); $0.00735/ gallon water residential supply and $0.005/gallon water commercial/industrial supply; $0.002166/gallon cost to residents
and businesses for water treatment; $0.00018/gallon cost to utility associated with electricity to supply water; $0.000234/gallon cost associated with
electricity used to WPCA to treat water.
100 This employment opportunity calculation assumes this measure would require 1 man‐day per installation of 1 showerhead in 10 households, but also
assumes 50% would be self installed, for net employment need of 0.5 man‐days per 10 households.
101 Hot water heating impact only. The impact on energy demand and emissions associated with water supply and treatment is addressed in a separate
Water Resources section of this Bridgeport Energy Plan. Assumes installation of two faucet aerators per household.
102 This employment opportunity calculation assumes installation of 2 faucet aerators per household with change from 2.2 to 1.5 GPM and reflects
Bridgeport’s residential heating oil split (including condominiums) of 4.76% electric, 48.42% gas, and 46.70% oil (from Bridgeport Tax Assessor data).

Bridgeport Energy Efficiency and Conservation Plan 156
Energy savings are derived from UI and CL&P Program Savings Documentation for 2010 Program Year, pages 163‐164: Faucet Aerator 2.2 to 1.5 GPM
average savings of 17.26 kWh/year/faucet electricity savings, 0.09 MBTU/year/faucet gas savings, and 0.77 gallons/year/faucet oil savings.
103 Upon recommendation of ICLEI, Bridgeport GHG Inventory conducted for calendar year 2007 used Egrid Subregion 1 – NPCC New England coefficient
figures for 2004 as follows: CO2 908.9 lbs/MWH; N20 0.015 lbs/MWH; CH4 0.080 lbs/MWH and criteria air pollutants as follows: NOX 0.677 lbs/MWH;
SOX 1.262 lbs/MWH; CO 1.216 lbs/MWH; VOC 0.136 lbs/MWH; PM10 0.982 lbs/MWH. Bridgeport inventory had input of 762,419,176 total kWh
community‐wide and reported 316,511 MTCO2e of electricity‐related emissions for community‐wide average of 0.000415141 MTCO2e/kWh. Electricity
emissions savings are calculated based upon this coefficient. Bridgeport GHG Inventory for calendar year 2007 had input of 9,585 thousand gallons of
light fuel oil community‐wide and reported 100,588 MTCO2e of light fuel oil‐related emissions community‐wide for average of 9.367 MTCO2e/thousand
gallons of fuel oil. Oil‐related emissions savings are calculated based upon this coefficient. Bridgeport GHG Inventory for calendar year 2007 had input of
3,998,557 thousand cubic feet of natural gas community‐wide and reported 228,616 MTCO2e of natural gas‐related emissions community‐wide for
average of 0.057175 MTCO2e/thousand cf. Gas‐related emissions savings are calculated based upon this coefficient.
104 Dollar savings are calculated using 2010 utility costs of $0.24/kWh electricity (includes all fees); $9.18/thousand cf natural gas for
commercial/industrial and $14.81/thousand cf natural gas for residential; $2.65/ gallon #2 light fuel oil; $3.00/gallon gasoline/diesel (assumes 1 average
price per gallon); $0.00735/ gallon water residential supply and $0.005/gallon water commercial/industrial supply; $0.002166/gallon cost to residents
and businesses for water treatment; $0.00018/gallon cost to utility associated with electricity to supply water; $0.000234/gallon cost associated with
electricity used to WPCA to treat water.
105 Calculated from 2010 projection data in The Connecticut Light and Power Company, The United Illuminating Company, Yankee Gas Services
Company, Connecticut Natural Gas Corporation and The Southern Connecticut Gas Company, Docket No. 09‐10‐10, Docket No. 08‐10‐02, October 1,
2009, 2010 Electric and Natural Gas Conservation and Load Management Plan, Page 142: SCG 2010 goal of 18,924 ccf annual savings / 311 units = 60.85
ccf/unit/year.
106 Bridgeport GHG Inventory for calendar year 2007 had input of 3,998,557 thousand cubic feet of natural gas community‐wide and reported 228,616
MTCO2e of natural gas‐related emissions community‐wide for average of 0.057175 MTCO2e/thousand cf. Gas‐related emissions savings are calculated
based upon this coefficient.
107 Dollar savings are calculated using 2010 utility costs of $0.24/kWh electricity (includes all fees); $9.18/thousand cf natural gas for
commercial/industrial and $14.81/thousand cf natural gas for residential; $2.65/ gallon #2 light fuel oil; $3.00/gallon gasoline/diesel (assumes 1 average
price per gallon); $0.00735/ gallon water residential supply and $0.005/gallon water commercial/industrial supply; $0.002166/gallon cost to residents
and businesses for water treatment; $0.00018/gallon cost to utility associated with electricity to supply water; $0.000234/gallon cost associated with
electricity used to WPCA to treat water.
108 American Council for an Energy Efficient Economy, Consumer Guide to Home Energy Savings: Condensed Online Version, Water Heating,
http://www.aceee.org/consumerguide/waterheating.htm
109 This employment opportunity calculation assumes this measure would require 3 installers for 2 days per unit or 6 man‐days/unit.
110 This assumes 25% reduction in energy use per household from current level. Per household energy consumption in each of 47,543 households, as
calculated from Bridgeport 2007 GHG Inventory is 6949.82763 kWh electricity, 35.71183981 thousand cubic feet of gas, and 0.097658961 thousand
gallons of fuel oil.
111 Emissions calculated from Bridgeport 2007 GHG inventory averages. Upon recommendation of ICLEI, Bridgeport GHG Inventory conducted for
calendar year 2007 used Egrid Subregion 1 – NPCC New England coefficient figures for 2004 as follows: CO2 908.9 lbs/MWH; N20 0.015 lbs/MWH; CH4
0.080 lbs/MWH and criteria air pollutants as follows: NOX 0.677 lbs/MWH; SOX 1.262 lbs/MWH; CO 1.216 lbs/MWH; VOC 0.136 lbs/MWH; PM10 0.982
lbs/MWH. Bridgeport inventory had input of 762,419,176 total kWh community‐wide and reported 316,511 MTCO2e of electricity‐related emissions for
community‐wide average of 0.000415141 MTCO2e/kWh. Electricity emissions savings are calculated based upon this coefficient. Bridgeport GHG
Inventory for calendar year 2007 had input of 9,585 thousand gallons of light fuel oil community‐wide and reported 100,588 MTCO2e of light fuel oil‐
related emissions community‐wide for average of 9.367 MTCO2e/thousand gallons of fuel oil. Oil‐related emissions savings are calculated based upon
this coefficient. Bridgeport GHG Inventory for calendar year 2007 had input of 3,998,557 thousand cubic feet of natural gas community‐wide and
reported 228,616 MTCO2e of natural gas‐related emissions community‐wide for average of 0.057175 MTCO2e/thousand cf. Gas‐related emissions
savings are calculated based upon this coefficient.

Bridgeport Energy Efficiency and Conservation Plan 157
112 Dollar savings are calculated using 2010 utility costs of $0.24/kWh electricity (includes all fees); $9.18/thousand cf natural gas for
commercial/industrial and $14.81/thousand cf natural gas for residential; $2.65/ gallon #2 light fuel oil; $3.00/gallon gasoline/diesel (assumes 1 average
price per gallon); $0.00735/ gallon water residential supply and $0.005/gallon water commercial/industrial supply; $0.002166/gallon cost to residents
and businesses for water treatment; $0.00018/gallon cost to utility associated with electricity to supply water; $0.000234/gallon cost associated with
electricity used to WPCA to treat water.
113 Greg Kats, Sustainable Building Task Force. “The Cost and Financial Benefits of Green Buildings.” October 2003.
www.ciwmb.ca.gov/GreenBuilding/Design/CostBenefit/Report.pdf.
114 Greg Kats, Massachusetts Technology Collaborative, “Green Building Costs and Financial Benefits,” 2003,
http://www.google.com/search?sourceid=navclient&ie=UTF8&rlz=1T4HPND_en___US236&q=Green+Building+Costs+and+Financial+Benefits.
115 Residential building sales for 5‐year period represented 4.28% of the building stock per year (from Bridgeport Tax Assessor data). Over the 2007‐2010
time period, this translates to sales equal to 98% of the residential building stock, although repeat sales of single buildings would likely reduce this
number. Commercial building sales for 5‐year period represented 5.61% of the building stock per year (Bridgeport Tax Assessor data). Over the 2007‐
2030 time period, this translates to sales of over 100% of commercial building stock, although repeat sales of single buildings would likely reduce this
number.
116 This employment opportunity calculation assumes this measure would require the following: a) new boiler and controls: 3 installers for 2 days = 6
man days; b) window replacement: 1 man day/4 windows and assume16 windows (because this is per household not per building) = 4 man‐days; c)
ceiling and wall insulation: 2 man‐days insulation; d) lighting retrofits hardwire: 1 man‐day; e)water fixtures: 1 man‐day. Assume 14 man‐days per
complete job (1 household).
117 Assumes 30% reduction in energy use per household from current level. Per household energy consumption in each of 47,543 households, as
calculated from Bridgeport 2007 GHG Inventory is 6949.82763 kWh electricity, 35.71183981 thousand cubic feet of gas, and 0.097658961 thousand
gallons of fuel oil.
118 Emissions calculated from Bridgeport 2007 GHG inventory averages. Upon recommendation of ICLEI, Bridgeport GHG Inventory conducted for
calendar year 2007 used Egrid Subregion 1 – NPCC New England coefficient figures for 2004 as follows: CO2 908.9 lbs/MWH; N20 0.015 lbs/MWH; CH4
0.080 lbs/MWH and criteria air pollutants as follows: NOX 0.677 lbs/MWH; SOX 1.262 lbs/MWH; CO 1.216 lbs/MWH; VOC 0.136 lbs/MWH; PM10 0.982
lbs/MWH. Bridgeport inventory had input of 762,419,176 total kWh community‐wide and reported 316,511 MTCO2e of electricity‐related emissions for
community‐wide average of 0.000415141 MTCO2e/kWh. Electricity emissions savings are calculated based upon this coefficient. Bridgeport GHG
Inventory for calendar year 2007 had input of 9,585 thousand gallons of light fuel oil community‐wide and reported 100,588 MTCO2e of light fuel oil‐
related emissions community‐wide for average of 9.367 MTCO2e/thousand gallons of fuel oil. Oil‐related emissions savings are calculated based upon
this coefficient. Bridgeport GHG Inventory for calendar year had input of 3,998,557 thousand cubic feet of natural gas community‐wide and reported
228,616 MTCO2e of natural gas‐related emissions community‐wide for average of 0.057175 MTCO2e/thousand cf. Gas‐related emissions savings are
calculated based upon this coefficient.
119 Rounding accounts for difference.
120 Dollar savings are calculated using 2010 utility costs of $0.24/kWh electricity (includes all fees); $9.18/thousand cf natural gas for
commercial/industrial and $14.81/thousand cf natural gas for residential; $2.65/ gallon #2 light fuel oil; $3.00/gallon gasoline/diesel (assumes 1 average
price per gallon); $0.00735/ gallon water residential supply and $0.005/gallon water commercial/industrial supply; $0.002166/gallon cost to residents
and businesses for water treatment; $0.00018/gallon cost to utility associated with electricity to supply water; $0.000234/gallon cost associated with
electricity used to WPCA to treat water.
121 Dollar savings are calculated using 2010 utility costs of $0.24/kWh electricity (includes all fees); $9.18/thousand cf natural gas for
commercial/industrial and $14.81/thousand cf natural gas for residential; $2.65/ gallon #2 light fuel oil; $3.00/gallon gasoline/diesel (assumes 1 average
price per gallon); $0.00735/ gallon water residential supply and $0.005/gallon water commercial/industrial supply; $0.002166/gallon cost to residents
and businesses for water treatment; $0.00018/gallon cost to utility associated with electricity to supply water; $0.000234/gallon cost associated with
electricity used to WPCA to treat water.

Bridgeport Energy Efficiency and Conservation Plan 158
122 Greg Kats, Sustainable Building Task Force. “The Cost and Financial Benefits of Green Buildings.” October 2003.
www.ciwmb.ca.gov/GreenBuilding/Design/CostBenefit/Report.pdf.
123 Greg Kats, Massachusetts Technology Collaborative, “Green Building Costs and Financial Benefits,” 2003,
http://www.google.com/search?sourceid=navclient&ie=UTF8&rlz=1T4HPND_en___US236&q=Green+Building+Costs+and+Financial+Benefits.
124 Electricity savings calculated from 2010 projection data for major renovations or new construction C and I ‐ Energy Conscious BluePrint program ‐ in
The Connecticut Light and Power Company, The United Illuminating Company, Yankee Gas Services Company, Connecticut Natural Gas Corporation and
The Southern Connecticut Gas Company, Docket No. 09‐10‐10, Docket No. 08‐10‐02, October 1, 2009, 2010 Electric and Natural Gas Conservation and
Load Management Plan, pages 161‐162: UI 2010 goal of 10,066,859 kWh / 175 projects = 57,524.91 kWh savings/project/year. Gas savings calculated
from 2010 projection data for major renovations or new construction C and I – energy conscious BluePrint program ‐ in The Connecticut Light and Power
Company, The United Illuminating Company, Yankee Gas Services Company, Connecticut Natural Gas Corporation and The Southern Connecticut Gas
Company, Docket No. 09‐10‐10, Docket No. 08‐10‐02, October 1, 2009, 2010 Electric and Natural Gas Conservation and Load Management Plan, page
165: 2010 SCG goal of 118,166 ccf / 48 projects = 2,461.79 ccf savings/project/year.
125 Emissions calculated from Bridgeport 2007 GHG inventory averages. Upon recommendation of ICLEI, Bridgeport GHG Inventory conducted for
calendar year 2007 used Egrid Subregion 1 – NPCC New England coefficient figures for 2004 as follows: CO2 908.9 lbs/MWH; N20 0.015 lbs/MWH; CH4
0.080 lbs/MWH and criteria air pollutants as follows: NOX 0.677 lbs/MWH; SOX 1.262 lbs/MWH; CO 1.216 lbs/MWH; VOC 0.136 lbs/MWH; PM10 0.982
lbs/MWH. Bridgeport inventory had input of 762,419,176 total kWh community‐wide and reported 316,511 MTCO2e of electricity‐related emissions for
community‐wide average of 0.000415141 MTCO2e/kWh. Electricity emissions savings are calculated based upon this coefficient. Bridgeport GHG
Inventory for calendar year 2007 had input of 3,998,557 thousand cubic feet of natural gas community‐wide and reported 228,616 MTCO2e of natural
gas‐related emissions community‐wide for average of 0.057175 MTCO2e/thousand cf. Gas‐related emissions savings are calculated based upon this
coefficient.
126 Dollar savings are calculated using 2010 utility costs of $0.24/kWh electricity (includes all fees); $9.18/thousand cf natural gas for
commercial/industrial and $14.81/thousand cf natural gas for residential; $2.65/ gallon #2 light fuel oil; $3.00/gallon gasoline/diesel (assumes 1 average
price per gallon); $0.00735/ gallon water residential supply and $0.005/gallon water commercial/industrial supply; $0.002166/gallon cost to residents
and businesses for water treatment; $0.00018/gallon cost to utility associated with electricity to supply water; $0.000234/gallon cost associated with
electricity used to WPCA to treat water.
127 Dollar savings are calculated using 2010 utility costs of $0.24/kWh electricity (includes all fees); $9.18/thousand cf natural gas for
commercial/industrial and $14.81/thousand cf natural gas for residential; $2.65/ gallon #2 light fuel oil; $3.00/gallon gasoline/diesel (assumes 1 average
price per gallon); $0.00735/ gallon water residential supply and $0.005/gallon water commercial/industrial supply; $0.002166/gallon cost to residents
and businesses for water treatment; $0.00018/gallon cost to utility associated with electricity to supply water; $0.000234/gallon cost associated with
electricity used to WPCA to treat water.
128 Greg Kats, Sustainable Building Task Force. “The Cost and Financial Benefits of Green Buildings.” October 2003.
www.ciwmb.ca.gov/GreenBuilding/Design/CostBenefit/Report.pdf.
129 Greg Kats, Massachusetts Technology Collaborative, “Green Building Costs and Financial Benefits,” 2003,
http://www.google.com/search?sourceid=navclient&ie=UTF8&rlz=1T4HPND_en___US236&q=Green+Building+Costs+and+Financial+Benefits.
130 This energy plan assumes three percent reduction is possible based upon the following research (reported in McPherson, Gregory and James R.
Simpson, March/April 1995, Shade Trees as a Demand‐Side Resource, Home Energy Magazine Online,
http://www.homeenergy.org/archive/hem.dis.anl.gov/eehem/95/950307.html): from multi location simulations these authors determine that a single
mature tree reduces annual air conditioning use by 2%‐8%, that its evapotranspirational cooling reduces annual cooling energy by 2%‐8%, and that its
wind shielding reduces annual use of natural gas for space heating by 1%‐5%. Chicago, in its greenhouse has inventory and energy plan, used a range of
1.5% to 3% of annual energy use on residential building stock less than or equal to 3 stories tall. See: Center for Neighborhood Technology, 2008,
Chicago Greenhouse Gas Emissions: An Inventory, Forecast, and Mitigation Analysis for Chicago and the Metropolitan Region; An assessment prepared
for the City of Chicago http://www.chicagoclimateaction.org/filebin/pdf/FINALALL091708_118‐266.pdf. This was based on above research as well as
the following: McPherson, E. Gregory; Nowak, David J.; Rowntree, Rowan A. eds. 1994. Chicago's urban forest ecosystem: results of the Chicago Urban
Forest Climate Project. Gen. Tech. Rep. NE‐186. Radnor, PA: U.S. Department of Agriculture, Forest Service, Northeastern Forest Experiment Station: 201
p. http://www.nrs.fs.fed.us/pubs/gtr/gtr_ne186.pdf

Bridgeport Energy Efficiency and Conservation Plan 159
131 Percent Bridgeport residential stock, excluding condominiums, under 3 stories is 96% or 22,009 buildings (derived from City of Bridgeport Tax
Assessor data). Energy Plan assumes 50% of residential buildings are already “fully‐stocked.” Additional tree inventory may be used to fine‐tune this
assumption.
132 Assumes heating and cooling energy is 56% of total building energy (U.S. DOE, Home Energy tips, http://www.energy.gov/heatingcooling.htm).
Energy consumption figures are per building, not household, and are based on Bridgeport 2007 GHG Inventory and 22,009 building number (derived
from City of Bridgeport Tax Assessor data).
133 Emissions calculated from Bridgeport 2007 GHG inventory averages. Upon recommendation of ICLEI, Bridgeport GHG Inventory conducted for
calendar year 2007 used Egrid Subregion 1 – NPCC New England coefficient figures for 2004 as follows: CO2 908.9 lbs/MWH; N20 0.015 lbs/MWH; CH4
0.080 lbs/MWH and criteria air pollutants as follows: NOX 0.677 lbs/MWH; SOX 1.262 lbs/MWH; CO 1.216 lbs/MWH; VOC 0.136 lbs/MWH; PM10 0.982
lbs/MWH. Bridgeport inventory had input of 762,419,176 total kWh community‐wide and reported 316,511 MTCO2e of electricity‐related emissions for
community‐wide average of 0.000415141 MTCO2e/kWh. Electricity emissions savings are calculated based upon this coefficient. Bridgeport GHG
Inventory for calendar year 2007 had input of 9,585 thousand gallons of light fuel oil community‐wide and reported 100,588 MTCO2e of light fuel oil‐
related emissions community‐wide for average of 9.367 MTCO2e/thousand gallons of fuel oil. Oil‐related emissions savings are calculated based upon
this coefficient. Bridgeport GHG Inventory for calendar year 2007 had input of 3,998,557 thousand cubic feet of natural gas community‐wide and
reported 228,616 MTCO2e of natural gas‐related emissions community‐wide for average of 0.057175 MTCO2e/thousand cf. Gas‐related emissions
savings are calculated based upon this coefficient.
134 Tree stocking potential developed based upon the following: average residential building footprint (excluding condominiums) equals 1,064 (derived
from Bridgeport Tax Assessor data); average length of one side in average residential perimeter equals 33 feet; average length of two sides in average
residential perimeter equals 65 feet. Optimal and realistic tree stocking potential is two sides per building. At 1 tree/30 feet, average tree stocking per
residential building on 2 sides equals 2, and at 1 tree/20 feet, average tree stocking per residential building equals 3. Tree stocking calculations assume a
50/50 mix of 2 and 3 trees for each residential building.
135 Dollar savings are calculated using 2010 utility costs of $0.24/kWh electricity (includes all fees); $9.18/thousand cf natural gas for
commercial/industrial and $14.81/thousand cf natural gas for residential; $2.65/ gallon #2 light fuel oil; $3.00/gallon gasoline/diesel (assumes 1 average
price per gallon); $0.00735/ gallon water residential supply and $0.005/gallon water commercial/industrial supply; $0.002166/gallon cost to residents
and businesses for water treatment; $0.00018/gallon cost to utility associated with electricity to supply water; $0.000234/gallon cost associated with
electricity used to WPCA to treat water.
136 Assumes heating and cooling energy is 56% of total building energy (U.S. DOE, Home Energy tips, http://www.energy.gov/heatingcooling.htm).
Energy consumption figures are per building, not household, and are based on Bridgeport 2007 GHG Inventory and 22,009 building number (derived
from City of Bridgeport Tax Assessor data).
137Emissions calculated from Bridgeport 2007 GHG inventory averages. Upon recommendation of ICLEI, Bridgeport GHG Inventory conducted for
calendar year 2007 used Egrid Subregion 1 – NPCC New England coefficient figures for 2004 as follows: CO2 908.9 lbs/MWH; N20 0.015 lbs/MWH; CH4
0.080 lbs/MWH and criteria air pollutants as follows: NOX 0.677 lbs/MWH; SOX 1.262 lbs/MWH; CO 1.216 lbs/MWH; VOC 0.136 lbs/MWH; PM10 0.982
lbs/MWH. Bridgeport inventory had input of 762,419,176 total kWh community‐wide and reported 316,511 MTCO2e of electricity‐related emissions for
community‐wide average of 0.000415141 MTCO2e/kWh. Electricity emissions savings are calculated based upon this coefficient. Bridgeport GHG
Inventory for calendar year 2007 had input of 9,585 thousand gallons of light fuel oil community‐wide and reported 100,588 MTCO2e of light fuel oil‐
related emissions community‐wide for average of 9.367 MTCO2e/thousand gallons of fuel oil. Oil‐related emissions savings are calculated based upon
this coefficient. Bridgeport GHG Inventory for calendar year 2007 had input of 3,998,557 thousand cubic feet of natural gas community‐wide and
reported 228,616 MTCO2e of natural gas‐related emissions community‐wide for average of 0.057175 MTCO2e/thousand cf. Gas‐related emissions
savings are calculated based upon this coefficient.
138 Tree stocking potential developed based upon the following: average commercial building footprint equals 8,328 square feet (derived from
Bridgeport Tax Assessor data); average length of one side in average commercial perimeter equals 91 feet; average length of two sides in average
commercial perimeter equals 182 feet. Optimal and realistic tree stocking potential is two sides per building. At 1 tree/30 feet, average tree stocking per
commercial building on 2 sides equals 6, and at 1 tree/20 feet, average tree stocking per commercial building equals 9. Tree stocking calculations
assume a 50/50 mix of 6 and 9 trees for each commercial building. 1,943 buildings (or 79%) of commercial buildings are 3 stories tall or less. Energy
savings calculated only for a portion of buildings equal to or less than 3 stories tall as recommended by Chicago Climate Plan (Center for Neighborhood
Technology, 2008, Chicago Greenhouse Gas Emissions: An Inventory, Forecast, and Mitigation Analysis for Chicago and the Metropolitan Region; An

Bridgeport Energy Efficiency and Conservation Plan 160
assessment prepared for the City of Chicago; http://www.chicagoclimateaction.org/filebin/pdf/FINALALL091708_118‐266.pdf ). Average tree stocking
per C/I building at 1 tree per 30 feet on 2 sides equals 6. Average tree stocking per C/I building at 1 tree per 20 feet equals 9.
139 Dollar savings are calculated using 2010 utility costs of $0.24/kWh electricity (includes all fees); $9.18/thousand cf natural gas for
commercial/industrial and $14.81/thousand cf natural gas for residential; $2.65/ gallon #2 light fuel oil; $3.00/gallon gasoline/diesel (assumes 1 average
price per gallon); $0.00735/ gallon water residential supply and $0.005/gallon water commercial/industrial supply; $0.002166/gallon cost to residents
and businesses for water treatment; $0.00018/gallon cost to utility associated with electricity to supply water; $0.000234/gallon cost associated with
electricity used to WPCA to treat water.
140 2007 Bridgeport commercial energy use was 432,003,521 kWh, 4,942 thousand gallons fuel oil, and 2,300,709 thousand cf natural gas and emissions
were 179,342 MTCO2e electricity‐related emissions, 52,856 MTCO2e oil‐related emissions, and 131,542 MTCO2e gas‐related emissions from 2007 GHG
inventory. Total commercial living space of 41,693,810 derived from Bridgeport Tax Assessor data. Energy and emissions per square foot living space
calculated from above. Total flat roof commercial building living space derived from Bridgeport Tax Assessor data equals 31,702,631 square feet. Energy
consumption and emissions per square foot commercial living space determined from above. Assume heating and cooling energy and emissions equals
56% of total building energy (U.S. DOE, Home Energy tips, http://www.energy.gov/heatingcooling.htm). Assume low‐end 20% savings in heating and
cooling energy as a result of green roof installation (Center for Neighborhood Technology, 2008, Chicago Greenhouse Gas Emissions: An Inventory,
Forecast, and Mitigation Analysis for Chicago and the Metropolitan Region; An assessment prepared for the City of Chicago;
http://www.chicagoclimateaction.org/filebin/pdf/FINALALL091708_118‐266.pdf). Potential savings per building based upon 1,531 flat roof commercial
building number (Bridgeport Tax Assessor data).
141 460 buildings equal 30% of existing flat‐roof commercial buildings. 2007 flat roof living area equals 76% of total commercial living area (flat plus non‐
flat) (Bridgeport Tax Assessor data). For Low Growth scenario, assume 14,916 total job increase is split as 500 industrial jobs and 14,416 commercial
jobs. Square footage increase is calculated using 1.5 employee/1000 square feet for industrial jobs and 4 employees/1000 square feet for commercial
jobs. Increased commercial square footage divided by Bridgeport average commercial/industrial living space of 17,046 square feet (Bridgeport Tax
Assessor data) yields 231 new commercial buildings projected 2007‐2030 under Low Growth scenario. Assume 76% of new buildings are flat‐roof, so
new flat roof C/I building number equals 175 for Low Growth scenario. Similar calculations yield additional C/I building increase of 195 total buildings
under High Growth scenario, based on 27,500 total projected job increase and assumed split of 922 industrial/26,578 commercial jobs. Assume 76% of
195 additional commercial buildings under High Growth scenario are flat roof, yielding 148 additional new flat roof CI buildings. Green roofs proposed
for 30% of new buildings under Low Growth and High Growth scenarios.
142 Dollar savings are calculated using 2010 utility costs of $0.24/kWh electricity (includes all fees); $9.18/thousand cf natural gas for
commercial/industrial and $14.81/thousand cf natural gas for residential; $2.65/ gallon #2 light fuel oil; $3.00/gallon gasoline/diesel (assumes 1 average
price per gallon); $0.00735/ gallon water residential supply and $0.005/gallon water commercial/industrial supply; $0.002166/gallon cost to residents
and businesses for water treatment; $0.00018/gallon cost to utility associated with electricity to supply water; $0.000234/gallon cost associated with
electricity used to WPCA to treat water.
143 Dollar savings are calculated using 2010 utility costs of $0.24/kWh electricity (includes all fees); $9.18/thousand cf natural gas for
commercial/industrial and $14.81/thousand cf natural gas for residential; $2.65/ gallon #2 light fuel oil; $3.00/gallon gasoline/diesel (assumes 1 average
price per gallon); $0.00735/ gallon water residential supply and $0.005/gallon water commercial/industrial supply; $0.002166/gallon cost to residents
and businesses for water treatment; $0.00018/gallon cost to utility associated with electricity to supply water; $0.000234/gallon cost associated with
electricity used to WPCA to treat water.
144 Dollar savings are calculated using 2010 utility costs of $0.24/kWh electricity (includes all fees); $9.18/thousand cf natural gas for
commercial/industrial and $14.81/thousand cf natural gas for residential; $2.65/ gallon #2 light fuel oil; $3.00/gallon gasoline/diesel (assumes 1 average
price per gallon); $0.00735/ gallon water residential supply and $0.005/gallon water commercial/industrial supply; $0.002166/gallon cost to residents
and businesses for water treatment; $0.00018/gallon cost to utility associated with electricity to supply water; $0.000234/gallon cost associated with
electricity used to WPCA to treat water.
145 Green Roofs for Healthy Cities, “About Green Roofs,” http://www.greenroofs.net/index.php?option=com_content&task=view&id=26&Itemid=40;
and City of Chicago, Department of Planning and Development, “Extensive Green Roof Fact Sheet,”
http://egov.cityofchicago.org/webportal/COCWebPortal/COC_ATTACH/Green_Roof_Fact_Sheet.pdf.

Bridgeport Energy Efficiency and Conservation Plan 161
146 Labor estimate is calculated based upon the following: labor for green roof construction equals $3 to $8 per square foot (School of Freshwater
Sciences, Great Lakes Water Institute, University of Wisconsin, Milwaukee, Great Lakes WATER Institute Green Roof Project, Green Roof Installation,
Green Roof Costs: An Example of the Typical Extensive Green Roof; http://www.glwi.uwm.edu/research/genomics/ecoli/greenroof/roofinstall.php). This
Energy Plan assumes installation labor cost equals $5/square foot. Average footprint/roofprint of Bridgeport commercial flat roof property equals 9,695
square feet (Bridgeport Tax Assessor data), so installation cost equals $48,475. At $15/hr wage, installation requires 3,232man‐hours, or 404 man‐days
per site.
147 Urban Forest Protocol range is 16 kg/year (35 lbs/year) slow growing 8‐15 cm DBH to 270 kg (60 lbs/year) larger growing at max height (California
Climate Action Registry, Urban Forest Project Reporting Protocol Version 1.0 For Board Approval August 12, 2008;
http://www.fs.fed.us/psw/programs/cufr/UrbanForestProtocol0812081ForBoardApproval.pdf). Midpoint of 16 kg per year and 270 kg per year is 71.5
kg per tree per year. This Bridgeport Energy Plan assumes the maximum potential, mid life, is at top of lowest quartile of range due to lack of longevity
and stunting from urban stress and assumes 35 kg/tree/year carbon sequestration potential.
148 This may be quantified at a future date. Michigan State University, among other institutions, is researching carbon sequestration potential of green
roofs. See: http://www.hrt.msu.edu/greenroof/#Benefits%20of%20green%20, roofs and research update to USDA:
http://www.reeis.usda.gov/web/crisprojectpages/180269.html
149 Energy and emissions savings are calculated from Bridgeport 2007 GHG inventory averages. Upon recommendation of ICLEI, Bridgeport GHG
Inventory conducted for calendar year 2007 used Egrid Subregion 1 – NPCC New England coefficient figures for 2004 as follows: CO2 908.9 lbs/MWH;
N20 0.015 lbs/MWH; CH4 0.080 lbs/MWH and criteria air pollutants as follows: NOX 0.677 lbs/MWH; SOX 1.262 lbs/MWH; CO 1.216 lbs/MWH; VOC
0.136 lbs/MWH; PM10 0.982 lbs/MWH. Bridgeport inventory had input of 762,419,176 total kWh community‐wide and reported 316,511 MTCO2e of
electricity‐related emissions for community‐wide average of 0.000415141 MTCO2e/kWh. Electricity emissions savings are calculated based upon this
coefficient. Bridgeport GHG Inventory for calendar year 2007 had input of 9,585 thousand gallons of light fuel oil community‐wide and reported 100,588
MTCO2e of light fuel oil‐related emissions community‐wide for average of 9.367 MTCO2e/thousand gallons of fuel oil. Oil‐related emissions savings are
calculated based upon this coefficient. Bridgeport GHG Inventory for calendar year 2007 had input of 3,998,557 thousand cubic feet of natural gas
community‐wide and reported 228,616 MTCO2e of natural gas‐related emissions community‐wide for average of 0.057175 MTCO2e/thousand cf. Gas‐
related emissions savings are calculated based upon this coefficient. This Bridgeport Energy Plan assumes action 1) changing heating and cooling by 3
degrees creates 9% savings in heating and cooling energy (Center for Neighborhood Technology, 2008, Chicago Greenhouse Gas Emissions: An
Inventory, Forecast, and Mitigation Analysis for Chicago and the Metropolitan Region; An assessment prepared for the City of Chicago,
http://www.chicagoclimateaction.org/filebin/pdf/FINALALL091708_1‐118.pdf) and calculates this reduction based on assumption that heating and
cooling represent 56% of household energy consumption (U.S. DOE, Home Energy tips, http://www.energy.gov/heatingcooling.htm). This Bridgeport
Energy Plan assumes action 2) changing filters on air conditioners results in 10% reduction in cooling emissions based on City of Chicago greenhouse gas
inventory (Center for Neighborhood Technology, 2008, Chicago Greenhouse Gas Emissions: An Inventory, Forecast, and Mitigation Analysis for Chicago
and the Metropolitan Region; An assessment prepared for the City of Chicago, http://www.chicagoclimateaction.org/filebin/pdf/FINALALL091708_1‐
118.pdf). Assumes heating and cooling electricity is 56% of total electricity use and emissions (U.S. DOE, Home Energy tips,
http://www.energy.gov/heatingcooling.htm). Related to action 3) turn off three sixty‐watt light bulbs for 2 hours a day, this Bridgeport Energy Plan
assumes 131.4 kWh savings total per year for this action per household and determines emissions based on Bridgeport average from Bridgeport GHG
Inventory average of 0.000415141 MTCO2e per kWh. For action 4) savings from turning off appliances that contribute to phantom load, this Bridgeport
Energy Plan assumes phantom load accounts for 4% of total household electricity use and electricity related emissions (Center for Neighborhood
Technology, 2008, Chicago Greenhouse Gas Emissions: An Inventory, Forecast, and Mitigation Analysis for Chicago and the Metropolitan Region; An
assessment prepared for the City of Chicago http://www.chicagoclimateaction.org/filebin/pdf/FINALALL091708_1‐118.pdf).
150 Dollar savings are calculated using 2010 utility costs of $0.24/kWh electricity (includes all fees); $9.18/thousand cf natural gas for
commercial/industrial and $14.81/thousand cf natural gas for residential; $2.65/ gallon #2 light fuel oil; $3.00/gallon gasoline/diesel (assumes 1 average
price per gallon); $0.00735/ gallon water residential supply and $0.005/gallon water commercial/industrial supply; $0.002166/gallon cost to residents
and businesses for water treatment; $0.00018/gallon cost to utility associated with electricity to supply water; $0.000234/gallon cost associated with
electricity used to WPCA to treat water.
151 Dollar savings are calculated using 2010 utility costs of $0.24/kWh electricity (includes all fees); $9.18/thousand cf natural gas for
commercial/industrial and $14.81/thousand cf natural gas for residential; $2.65/ gallon #2 light fuel oil; $3.00/gallon gasoline/diesel (assumes 1 average
price per gallon); $0.00735/ gallon water residential supply and $0.005/gallon water commercial/industrial supply; $0.002166/gallon cost to residents
and businesses for water treatment; $0.00018/gallon cost to utility associated with electricity to supply water; $0.000234/gallon cost associated with
electricity used to WPCA to treat water.

Bridgeport Energy Efficiency and Conservation Plan 162
152 Dollar savings are calculated using 2010 utility costs of $0.24/kWh electricity (includes all fees); $9.18/thousand cf natural gas for
commercial/industrial and $14.81/thousand cf natural gas for residential; $2.65/ gallon #2 light fuel oil; $3.00/gallon gasoline/diesel (assumes 1 average
price per gallon); $0.00735/ gallon water residential supply and $0.005/gallon water commercial/industrial supply; $0.002166/gallon cost to residents
and businesses for water treatment; $0.00018/gallon cost to utility associated with electricity to supply water; $0.000234/gallon cost associated with
electricity used to WPCA to treat water.
153 Energy and emissions savings are calculated from Bridgeport 2007 GHG inventory averages. Upon recommendation of ICLEI, Bridgeport GHG
Inventory conducted for calendar year 2007 used Egrid Subregion 1 – NPCC New England coefficient figures for 2004 as follows: CO2 908.9 lbs/MWH;
N20 0.015 lbs/MWH; CH4 0.080 lbs/MWH and criteria air pollutants as follows: NOX 0.677 lbs/MWH; SOX 1.262 lbs/MWH; CO 1.216 lbs/MWH; VOC
0.136 lbs/MWH; PM10 0.982 lbs/MWH. Bridgeport inventory had input of 762,419,176 total kWh community‐wide and reported 316,511 MTCO2e of
electricity‐related emissions for community‐wide average of 0.000415141 MTCO2e/kWh. Electricity emissions savings are calculated based upon this
coefficient. Bridgeport GHG Inventory for calendar year 2007 had input of 9,585 thousand gallons of light fuel oil community‐wide and reported 100,588
MTCO2e of light fuel oil‐related emissions community‐wide for average of 9.367 MTCO2e/thousand gallons of fuel oil. Oil‐related emissions savings are
calculated based upon this coefficient. Bridgeport GHG Inventory for calendar year 2007 had input of 3,998,557 thousand cubic feet of natural gas
community‐wide and reported 228,616 MTCO2e of natural gas‐related emissions community‐wide for average of 0.057175 MTCO2e/thousand cf. Gas‐
related emissions savings are calculated based upon this coefficient. This Bridgeport Energy Plan assumes action 1) changing heating and cooling by 3
degrees creates 9% savings in heating and cooling energy (Center for Neighborhood Technology, 2008, Chicago Greenhouse Gas Emissions: An
Inventory, Forecast, and Mitigation Analysis for Chicago and the Metropolitan Region; An assessment prepared for the City of
Chicago,http://www.chicagoclimateaction.org/filebin/pdf/FINALALL091708_1‐118.pdf) and calculates this reduction based on assumption that heating
and cooling represent 56% of household energy consumption (U.S. DOE, Home Energy tips, http://www.energy.gov/heatingcooling.htm). This
Bridgeport Energy Plan assumes action 2) changing filters on air conditioners results in 10% reduction in cooling emissions based on City of Chicago
greenhouse gas inventory (Center for Neighborhood Technology, 2008, Chicago Greenhouse Gas Emissions: An Inventory, Forecast, and Mitigation
Analysis for Chicago and the Metropolitan Region; An assessment prepared for the City of Chicago,
http://www.chicagoclimateaction.org/filebin/pdf/FINALALL091708_1‐118.pdf). Assumes heating and cooling electricity is 56% of total electricity use and
emissions (U.S. DOE, Home Energy tips, http://www.energy.gov/heatingcooling.htm). Related to action 3) turn off three sixty‐watt light bulbs for 2
hours a day, this Bridgeport Energy Plan assumes 131.4 kWh savings total per year for this action per household and determines emissions based on
Bridgeport average from Bridgeport GHG Inventory average of 0.000415141 MTCO2e per kWh.
154 Dollar savings are calculated using 2010 utility costs of $0.24/kWh electricity (includes all fees); $9.18/thousand cf natural gas for
commercial/industrial and $14.81/thousand cf natural gas for residential; $2.65/ gallon #2 light fuel oil; $3.00/gallon gasoline/diesel (assumes 1 average
price per gallon); $0.00735/ gallon water residential supply and $0.005/gallon water commercial/industrial supply; $0.002166/gallon cost to residents
and businesses for water treatment; $0.00018/gallon cost to utility associated with electricity to supply water; $0.000234/gallon cost associated with
electricity used to WPCA to treat water.
155 Dollar savings are calculated using 2010 utility costs of $0.24/kWh electricity (includes all fees); $9.18/thousand cf natural gas for
commercial/industrial and $14.81/thousand cf natural gas for residential; $2.65/ gallon #2 light fuel oil; $3.00/gallon gasoline/diesel (assumes 1 average
price per gallon); $0.00735/ gallon water residential supply and $0.005/gallon water commercial/industrial supply; $0.002166/gallon cost to residents
and businesses for water treatment; $0.00018/gallon cost to utility associated with electricity to supply water; $0.000234/gallon cost associated with
electricity used to WPCA to treat water.
156 Dollar savings are calculated using 2010 utility costs of $0.24/kWh electricity (includes all fees); $9.18/thousand cf natural gas for
commercial/industrial and $14.81/thousand cf natural gas for residential; $2.65/ gallon #2 light fuel oil; $3.00/gallon gasoline/diesel (assumes 1 average
price per gallon); $0.00735/ gallon water residential supply and $0.005/gallon water commercial/industrial supply; $0.002166/gallon cost to residents
and businesses for water treatment; $0.00018/gallon cost to utility associated with electricity to supply water; $0.000234/gallon cost associated with
electricity used to WPCA to treat water.
157 Energy and emissions savings are calculated from Bridgeport 2007 GHG inventory averages. Upon recommendation of ICLEI, Bridgeport GHG
Inventory conducted for calendar year 2007 used Egrid Subregion 1 – NPCC New England coefficient figures for 2004 as follows: CO2 908.9 lbs/MWH;
N20 0.015 lbs/MWH; CH4 0.080 lbs/MWH and criteria air pollutants as follows: NOX 0.677 lbs/MWH; SOX 1.262 lbs/MWH; CO 1.216 lbs/MWH; VOC
0.136 lbs/MWH; PM10 0.982 lbs/MWH. Bridgeport inventory had input of 762,419,176 total kWh community‐wide and reported 316,511 MTCO2e of
electricity‐related emissions for community‐wide average of 0.000415141 MTCO2e/kWh. Electricity emissions savings are calculated based upon this
coefficient. Bridgeport GHG Inventory for calendar year 2007 had input of 9,585 thousand gallons of light fuel oil community‐wide and reported 100,588
MTCO2e of light fuel oil‐related emissions community‐wide for average of 9.367 MTCO2e/thousand gallons of fuel oil. Oil‐related emissions savings are

Bridgeport Energy Efficiency and Conservation Plan 163
calculated based upon this coefficient. Bridgeport GHG Inventory for calendar year 2007 had input of 3,998,557 thousand cubic feet of natural gas
community‐wide and reported 228,616 MTCO2e of natural gas‐related emissions community‐wide for average of 0.057175 MTCO2e/thousand cf. Gas‐
related emissions savings are calculated based upon this coefficient. This Bridgeport Energy Plan assumes action 1) changing heating and cooling by 3
degrees creates 9% savings in heating and cooling energy (Center for Neighborhood Technology, 2008, Chicago Greenhouse Gas Emissions: An
Inventory, Forecast, and Mitigation Analysis for Chicago and the Metropolitan Region; An assessment prepared for the City of Chicago ,
http://www.chicagoclimateaction.org/filebin/pdf/FINALALL091708_1‐118.pdf) and calculates this reduction based on assumption that heating and
cooling represent 56% of commercial building energy consumption (U.S. DOE, Home Energy tips, http://www.energy.gov/heatingcooling.htm). This
Bridgeport Energy Plan assumes action 2) installing a programmable thermostat achieves 15% savings on heating and cooling energy based on City of
Chicago greenhouse gas inventory (Center for Neighborhood Technology, 2008, Chicago Greenhouse Gas Emissions: An Inventory, Forecast, and
Mitigation Analysis for Chicago and the Metropolitan Region; An assessment prepared for the City of
Chicago,http://www.chicagoclimateaction.org/filebin/pdf/FINALALL091708_1‐118.pdf).
158 Dollar savings are calculated using 2010 utility costs of $0.24/kWh electricity (includes all fees); $9.18/thousand cf natural gas for
commercial/industrial and $14.81/thousand cf natural gas for residential; $2.65/ gallon #2 light fuel oil; $3.00/gallon gasoline/diesel (assumes 1 average
price per gallon); $0.00735/ gallon water residential supply and $0.005/gallon water commercial/industrial supply; $0.002166/gallon cost to residents
and businesses for water treatment; $0.00018/gallon cost to utility associated with electricity to supply water; $0.000234/gallon cost associated with
electricity used to WPCA to treat water.
159 Dollar savings are calculated using 2010 utility costs of $0.24/kWh electricity (includes all fees); $9.18/thousand cf natural gas for
commercial/industrial and $14.81/thousand cf natural gas for residential; $2.65/ gallon #2 light fuel oil; $3.00/gallon gasoline/diesel (assumes 1 average
price per gallon); $0.00735/ gallon water residential supply and $0.005/gallon water commercial/industrial supply; $0.002166/gallon cost to residents
and businesses for water treatment; $0.00018/gallon cost to utility associated with electricity to supply water; $0.000234/gallon cost associated with
electricity used to WPCA to treat water.
160 Dollar savings are calculated using 2010 utility costs of $0.24/kWh electricity (includes all fees); $9.18/thousand cf natural gas for
commercial/industrial and $14.81/thousand cf natural gas for residential; $2.65/ gallon #2 light fuel oil; $3.00/gallon gasoline/diesel (assumes 1 average
price per gallon); $0.00735/ gallon water residential supply and $0.005/gallon water commercial/industrial supply; $0.002166/gallon cost to residents
and businesses for water treatment; $0.00018/gallon cost to utility associated with electricity to supply water; $0.000234/gallon cost associated with
electricity used to WPCA to treat water.
161 Air and Water, Inc., Honeywell Products, http://air‐n‐ water.stores.yahoo.net/newhonther.html.
162 The Electric Distribution Companies Integrated Resource Plan for Connecticut. Prepared by the Brattel Group for EDC’s.
http://www.ctenergy.org/pdf/2010IRP.pdf
163 The Electric Distribution Companies Integrated Resource Plan for Connecticut. Prepared by the Brattel Group for EDC’s.
http://www.ctenergy.org/pdf/2010IRP.pdf
164 2010 Comprehensive Plan For the Procurement of Energy Resources. Prepared by the Energy Management Advisory Board, April 27, 2010;
http://ctenergy.org/pdf/2010FullPlan.pdf
165 kWh savings calculated based on 1,200 kWh/year per1 KW installed solar versus 8,760 kWh/year for 1 KW installed standard grid delivery (UI
Company).
166 Upon recommendation of ICLEI, Bridgeport GHG Inventory conducted for calendar year 2007 used Egrid Subregion 1 – NPCC New England coefficient
figures for 2004 as follows: CO2 908.9 lbs/MWH; N20 0.015 lbs/MWH; CH4 0.080 lbs/MWH and criteria air pollutants as follows: NOX 0.677 lbs/MWH;
SOX 1.262 lbs/MWH; CO 1.216 lbs/MWH; VOC 0.136 lbs/MWH; PM10 0.982 lbs/MWH. Electricity emissions calculated from Bridgeport GHG Inventory,
which had input of 762,419,176 total kWh community‐wide and reported 316,511 MTCO2e of electricity‐related emissions community‐wide for average
of 0.000415141 MTCO2e/kWh.
167 Dollar savings are calculated using 2010 utility costs of $0.24/kWh electricity (includes all fees); $9.18/thousand cf natural gas for
commercial/industrial and $14.81/thousand cf natural gas for residential; $2.65/ gallon #2 light fuel oil; $3.00/gallon gasoline/diesel (assumes 1 average
price per gallon); $0.00735/ gallon water residential supply and $0.005/gallon water commercial/industrial supply; $0.002166/gallon cost to residents

Bridgeport Energy Efficiency and Conservation Plan 164
and businesses for water treatment; $0.00018/gallon cost to utility associated with electricity to supply water; $0.000234/gallon cost associated with
electricity used to WPCA to treat water.
168 California Electricity Analysis Office, “Comparative Cost Of California Central Station, Electricity Generation Technologies” Energy Policy Report
Proceeding, Docket 02‐IEP‐01, Publication No. 100‐03‐001SD, February 2003; cited in Center for Neighborhood Technology, 2008, Chicago Greenhouse
Gas Emissions: An Inventory, Forecast, and Mitigation Analysis for Chicago and the Metropolitan Region; An assessment prepared for the City of
Chicago; http://www.chicagoclimateaction.org/filebin/pdf/FINALALL091708_1‐118.pdf.
169 Connecticut Energy Advisory Board (CEAB) Technical Paper: Renewable Energy; http://www.ctenergy.org/pdf/2010CEABPPPart4b2.pdf. Cited in this
paper, and referenced here, is information from Lawrence Berkeley National Laboratory, Tracking the Sun II (LBNL report), October 2009.
170 Assumes generation of 25% nameplate capacity, or 25% of 8,760kwh/yr per KW installed (Connecticut Energy Advisory Board, 2010 Comprehensive
Plan for the Procurement of Energy Resources, http://www.ctenergy.org/pdf/2010CEABPPParts1‐3.pdf).
171 This is same generation size as windmill constructed at Phoenix Press in New Haven in 2010.
172 Dollar savings are calculated using 2010 utility costs of $0.24/kWh electricity (includes all fees); $9.18/thousand cf natural gas for
commercial/industrial and $14.81/thousand cf natural gas for residential; $2.65/ gallon #2 light fuel oil; $3.00/gallon gasoline/diesel (assumes 1 average
price per gallon); $0.00735/ gallon water residential supply and $0.005/gallon water commercial/industrial supply; $0.002166/gallon cost to residents
and businesses for water treatment; $0.00018/gallon cost to utility associated with electricity to supply water; $0.000234/gallon cost associated with
electricity used to WPCA to treat water.
173 Connecticut wind potential is estimated by Truewind for NREL in Estimates of Windy Land Area and Wind Energy Potential by State for Areas >= 30%
Capacity Factor at 80m; February 4, 2010.
174 CEAB Technical Paper: Renewable Energy;http://www.ctenergy.org/pdf/2010CEABPPPart4b2.pdf
175 Combined “green” electricity purchase in 2007 equaled 8,900,000 kWh, resulting from Public Facilities purchase of 4,200,000 kWh and Board of
Education purchase of 4,700,000 kWh (Bridgeport Public Facilities).
176 This does not include any adjustment for increase or decrease in consumption as a result of closing of facilities or construction of new facilities.
177 Upon recommendation of ICLEI, Bridgeport GHG Inventory conducted for calendar year 2007 used Egrid Subregion 1 – NPCC New England coefficient
figures for 2004 as follows: CO2 908.9 lbs/MWH; N20 0.015 lbs/MWH; CH4 0.080 lbs/MWH and criteria air pollutants as follows: NOX 0.677 lbs/MWH;
SOX 1.262 lbs/MWH; CO 1.216 lbs/MWH; VOC 0.136 lbs/MWH; PM10 0.982 lbs/MWH. Electricity emissions calculated from Bridgeport GHG Inventory,
which had input of 762,419,176 total kWh community‐wide and reported 316,511 MTCO2e of electricity‐related emissions community‐wide for average
of 0.000415141 MTCO2e/kWh.
178 Dollar savings are calculated using 2010 utility costs of $0.24/kWh electricity (includes all fees); $9.18/thousand cf natural gas for
commercial/industrial and $14.81/thousand cf natural gas for residential; $2.65/ gallon #2 light fuel oil; $3.00/gallon gasoline/diesel (assumes 1 average
price per gallon); $0.00735/ gallon water residential supply and $0.005/gallon water commercial/industrial supply; $0.002166/gallon cost to residents
and businesses for water treatment; $0.00018/gallon cost to utility associated with electricity to supply water; $0.000234/gallon cost associated with
electricity used to WPCA to treat water.
179 Connecticut Clean Energy Fund notes that Bridgeport has 183 CTCEO Customers, which equals 0.4% of Bridgeport households (Connecticut Clean
Energy Fund website (May 2010 search) http://www.ctcleanenergy.com/default.aspx?tabid=170).
180 The 47,543 household number for 2007 is derived from CT State Data Center: Rodriguez, Orlando, 2007; Bridgeport, CT Population Projection from
2010 to 2030 by Age, Ethnicity and Sex Distributions, Connecticut State Data Center, University of Connecticut, Storrs, Connecticut, and assuming linear
growth between 2005 and 2010. Electricity consumption per household calculated from Bridgeport 2007 GHG inventory, which had residential
electricity consumption of 330,415,655 kWh.

Bridgeport Energy Efficiency and Conservation Plan 165
181 Upon recommendation of ICLEI, Bridgeport GHG Inventory conducted for calendar year 2007 used Egrid Subregion 1 – NPCC New England coefficient
figures for 2004 as follows: CO2 908.9 lbs/MWH; N20 0.015 lbs/MWH; CH4 0.080 lbs/MWH and criteria air pollutants as follows: NOX 0.677 lbs/MWH;
SOX 1.262 lbs/MWH; CO 1.216 lbs/MWH; VOC 0.136 lbs/MWH; PM10 0.982 lbs/MWH. Electricity emissions calculated from Bridgeport GHG Inventory,
which had input of 762,419,176 total kWh community‐wide and reported 316,511 MTCO2e of electricity‐related emissions community‐wide for average
of 0.000415141 MTCO2e/kWh.
182 Rounding accounts for difference in figures.
183 Initial conceptual design study indicates that Bridgeport can offset up to 1 MW electricity or 1,750 gallons of gasoline equivalents per day depending
upon exact retrofit measures taken and system installed (Conceptual Design of Renewable Energy Recovery Systems from Sewage Sludge and Other
Waste Solids; Fuss and O’Neill; O’Brien & Gere, September 1, 2009). Energy savings and emissions used in this Energy Plan assume a 50% share of each
of these two measures.
184 Upon recommendation of ICLEI, Bridgeport GHG Inventory conducted for calendar year 2007 used Egrid Subregion 1 – NPCC New England coefficient
figures for 2004 as follows: CO2 908.9 lbs/MWH; N20 0.015 lbs/MWH; CH4 0.080 lbs/MWH and criteria air pollutants as follows: NOX 0.677 lbs/MWH;
SOX 1.262 lbs/MWH; CO 1.216 lbs/MWH; VOC 0.136 lbs/MWH; PM10 0.982 lbs/MWH. Electricity emissions are calculated from Bridgeport GHG
Inventory, which had input of 762,419,176 total kWh community‐wide and reported 316,511 MTCO2e of electricity‐related emissions community‐wide
for average of 0.000415141 MTCO2e/kWh. Gasoline equivalent emissions are calculated from Bridgeport 2007 GHG Inventory, which had gasoline input
of 27,018 thousand gallons (U.S) and diesel input of 5,301 thousand gallons for total input of 32,319 thousand gallons. This Bridgeport Energy Plan
assumes a single emissions average for gasoline and diesel combined. Based on reported emissions of 313,960 MTCO2e for citywide roadway
transportation, average roadway emissions equal 0.009714409 MT/gallon of “gasoline”. Bridgeport 2007 GHG inventory had input of 475,513,500
gasoline‐powered vehicle miles traveled (VMT) and 29,061,450 diesel‐powered VMT for total input of 504,574,950 VMT. Average emissions based on
Bridgeport citywide roadway VMT for gasoline and diesel VMT combined, and single fuel consumption figure for gasoline and diesel combined equals
0.000622227 MT per vehicle mile travelled.
185 Dollar savings are calculated using 2010 utility costs of $0.24/kWh electricity (includes all fees); $9.18/thousand cf natural gas for
commercial/industrial and $14.81/thousand cf natural gas for residential; $2.65/ gallon #2 light fuel oil; $3.00/gallon gasoline/diesel (assumes 1 average
price per gallon); $0.00735/ gallon water residential supply and $0.005/gallon water commercial/industrial supply; $0.002166/gallon cost to residents
and businesses for water treatment; $0.00018/gallon cost to utility associated with electricity to supply water; $0.000234/gallon cost associated with
electricity used to WPCA to treat water.
186 Conceptual Design of Renewable Energy Recovery Systems from Sewage Sludge and Other Waste Solids; Fuss and O’Neill; O’Brien & Gere, September
1, 2009
187 Connecticut Energy Advisory Board, 2010 Comprehensive Plan for the Procurement of Energy Resources; April 27, 2010;
http://ctenergy.org/pdf/2010FullPlan.pdf and The Electric Distribution Companies Integrated Resource Plan for Connecticut; Prepared by the Brattel
Group for the Electric Distribution Companies; http://www.ctenergy.org/pdf/2010IRP.pdf
188 The Electric Distribution Companies Integrated Resource Plan for Connecticut; Prepared by the Brattel Group for the Electric Distribution Companies;
http://www.ctenergy.org/pdf/2010IRP.pdf
189 Connecticut Energy Advisory Board, 2010 Comprehensive Plan for the Procurement of Energy Resources; April 27, 2010;
http://ctenergy.org/pdf/2010FullPlan.pdf
190 2010 Comprehensive Plan For the Procurement of Energy Resources, Prepared by the Energy Advisory Board, April 27, 2010
http://ctenergy.org/pdf/2010FullPlan.pdf
191 2010 Comprehensive Plan For the Procurement of Energy Resources, Prepared by the Energy Advisory Board, April 27, 2010
http://ctenergy.org/pdf/2010FullPlan.pdf
192 Total residential buildings in Bridgeport equal 22,866 (Bridgeport Tax Assessor data). Average electricity use and electricity‐related emissions per
building calculated from Bridgeport 2007 GHG Inventory data which had input of 330,415,655 kWh for residential sector electricity use and related
emissions of 137,169 MTCO2e, which yield per building electricity consumption average of 14,450 kWh/year and electricity‐related emissions equal to

Bridgeport Energy Efficiency and Conservation Plan 166
6.0 MTCO2e. This Energy Plan assumes a 4KW solar pv system supplies 4,800 kWh electricity (derived from personal conversation with Sunlight Solar
Energy, which indicates an average sized system of 5KW installed (for average site use of 1,000 kWh/month, or 12,000 kWh/year) delivers annual
electricity equal to 5,800 to 6,000 kWh per year and a 5KW system installed averages 28 to 30 panels and requires 450 to 500 square feet installation
space.)
193 This Energy Plan assumes an average 4 KW residential system supplies 4,800 kWh per year and requires 100 square feet per KW installed, or 400
square feet roof space (based on numbers from Sunlight Solar Energy which indicate an average sized system of 5KW installed (for average site use of
1,000 kWh/month, or 12,000 kWh/year) delivers annual electricity equal to 5,800 to 6,000 kWh and that a 5KW system installed averages 28 to 30
panels and requires roof space of 450 to 500 square feet for installation). Bridgeport has 934 residential flat roof buildings, with total footprint (roof
print) of 1,135,466 square feet (Bridgeport Tax Assessor data). Average footprint per building equals 1,216 square feet. This Energy Plan assumes loss of
50% roof space in calculating potential square footage available for solar installation, leaving 608 square feet potential per building for solar installation.
194 Upon recommendation of ICLEI, Bridgeport GHG Inventory conducted for calendar year 2007 used Egrid Subregion 1 – NPCC New England coefficient
figures for 2004 as follows: CO2 908.9 lbs/MWH; N20 0.015 lbs/MWH; CH4 0.080 lbs/MWH and criteria air pollutants as follows: NOX 0.677 lbs/MWH;
SOX 1.262 lbs/MWH; CO 1.216 lbs/MWH; VOC 0.136 lbs/MWH; PM10 0.982 lbs/MWH. Electricity emissions are calculated from Bridgeport GHG
Inventory, which had input of 762,419,176 total kWh community‐wide and reported 316,511 MTCO2e of electricity‐related emissions community‐wide
for average of 0.000415141 MTCO2e/kWh.
195 Bridgeport Tax Assessor data for building number and square foot data.
196 Dollar savings are calculated using 2010 utility costs of $0.24/kWh electricity (includes all fees); $9.18/thousand cf natural gas for
commercial/industrial and $14.81/thousand cf natural gas for residential; $2.65/ gallon #2 light fuel oil; $3.00/gallon gasoline/diesel (assumes 1 average
price per gallon); $0.00735/ gallon water residential supply and $0.005/gallon water commercial/industrial supply; $0.002166/gallon cost to residents
and businesses for water treatment; $0.00018/gallon cost to utility associated with electricity to supply water; $0.000234/gallon cost associated with
electricity used to WPCA to treat water.
197 The Connecticut Energy Advisory Board reports that solar module prices are expected to drop as much as 30 percent in the next year or two, which
would reduce installed costs about 15 percent from the current average installed cost of $7.50/watt for all systems. (Smaller systems cost more than this
average per watt; larger systems cost less per watt.) The CEAB also notes that industry goals reported by SolarBuzz are a drop from $4+/watt to $1.5 to
$2/watt by 2020 for module costs. Installed costs declined from $7.8/watt in 2007 to $7.5/watt in 2008. As a result of current and projected solar
economics, CEAB currently recommends a delay in implementing significant solar installation as a means of meeting Connecticut’s electricity supply.
(CEAB Technical Paper: Renewable Energy; http://www.ctenergy.org/pdf/2010CEABPPPart4b2.pdf. Cited in this paper, and referenced here, is
information from Lawrence Berkeley National Laboratory, Tracking the Sun II (LBNL report), October 2009.)
198 Employment calculation assumes installation requirements are as follows: 13 man‐days per residential site for installation of a 4KW system. This
figure does not include employment opportunity associated with design work.
199 Total residential buildings in Bridgeport equal 22,866 (Bridgeport Tax Assessor data). Average electricity use and electricity‐related emissions per
building are calculated from Bridgeport 2007 GHG Inventory data which had input of 330,415,655 kWh for residential sector electricity use and related
emissions of 137,169 MTCO2e, to yield a per building electricity consumption average of 14,450 kWh/year and electricity‐related emissions equal to 6.0
MTCO2e. This Energy Plan assumes a 4KW solar pv system supplies 4,800 kWh electricity (derived from conversation with Sunlight Solar Energy, which
indicates an average sized system of 5KW installed (for average site use of 1,000 kWh/month, or 12,000 kWh/year) delivers annual electricity equal to
5,800 to 6,000 kWh and a 5KW system installed averages 28 to 30 panels and requires roof space of 450 to 500 square feet for installation).
200 Upon recommendation of ICLEI, Bridgeport GHG Inventory conducted for calendar year 2007 used Egrid Subregion 1 – NPCC New England coefficient
figures for 2004 as follows: CO2 908.9 lbs/MWH; N20 0.015 lbs/MWH; CH4 0.080 lbs/MWH and criteria air pollutants as follows: NOX 0.677 lbs/MWH;
SOX 1.262 lbs/MWH; CO 1.216 lbs/MWH; VOC 0.136 lbs/MWH; PM10 0.982 lbs/MWH. Electricity emissions are calculated from Bridgeport GHG
Inventory, which had input of 762,419,176 total kWh community‐wide and reported 316,511 MTCO2e of electricity‐related emissions community‐wide
for average of 0.000415141 MTCO2e/kWh.
201Rounding accounts for difference in figures.

Bridgeport Energy Efficiency and Conservation Plan 167
202 Dollar savings are calculated using 2010 utility costs of $0.24/kWh electricity (includes all fees); $9.18/thousand cf natural gas for
commercial/industrial and $14.81/thousand cf natural gas for residential; $2.65/ gallon #2 light fuel oil; $3.00/gallon gasoline/diesel (assumes 1 average
price per gallon); $0.00735/ gallon water residential supply and $0.005/gallon water commercial/industrial supply; $0.002166/gallon cost to residents
and businesses for water treatment; $0.00018/gallon cost to utility associated with electricity to supply water; $0.000234/gallon cost associated with
electricity used to WPCA to treat water.
203 The Connecticut Energy Advisory Board reports that solar module prices are expected to drop as much as 30 percent in the next year or two, which
would reduce installed costs about 15 percent from the current average installed cost of $7.50/watt for all systems. (Smaller systems cost more than this
average per watt; larger systems cost less per watt.) The CEAB also notes that industry goals reported by SolarBuzz are a drop from $4+/watt to $1.5 to
$2/watt by 2020 for module costs. Installed costs declined from $7.8/watt in 2007 to $7.5/watt in 2008. As a result of current and projected solar
economics, CEAB currently recommends a delay in implementing significant solar installation as a means of meeting Connecticut’s electricity supply.
(CEAB Technical Paper: Renewable Energy; http://www.ctenergy.org/pdf/2010CEABPPPart4b2.pdf. Cited in this paper, and referenced here, is
information from Lawrence Berkeley National Laboratory, Tracking the Sun II (LBNL report), October 2009.)
204 Employment calculation assumes installation requirements are as follows: 13 man‐days per residential site for installation of a 4KW system. This
figure does not include employment opportunity associated with design work.
205 Connecticut Clean Energy Fund website indicates 70% of hot water heating needs at typical home may be met through solar thermal installation, with
a fuel savings equivalent of 7.7 gallons of heating oil and nearly 3.5 MTCO2e avoidance (Connecticut Clean Energy Fund, http://www.ctcleanenergy.com;
searched June 2010).
206 Residential building number from Bridgeport Tax Assessor data.
207 Assumes fuel savings of 7.7 gallons of heating oil equivalent per building. For this Bridgeport Energy Plan, energy savings are calculated assuming a
50%/50% oil/natural gas contribution based on 47%/52% split between oil heat and gas heat in Bridgeport residential heating systems (Bridgeport Tax
Assessor).
208 Emissions calculated from Bridgeport 2007 GHG inventory averages. Bridgeport GHG Inventory for calendar year 2007 had input of 3,998,557
thousand cubic feet of natural gas community‐wide and reported 228,616 MTCO2e of natural gas‐related emissions community‐wide for average of
0.057175 MTCO2e/thousand cf. Bridgeport GHG Inventory for calendar year 2007 had input of 9,585 thousand gallons of light fuel oil community‐wide
and reported 100,588 MTCO2e of light fuel oil‐related emissions community‐wide for average of 9.367 MTCO2e/thousand gallons of fuel oil
209 This Bridgeport Energy Plan assumes installation of a 3‐collector solar thermal system on residential buildings. A 3‐collector solar thermal system is
considered sufficient for 3‐4 person house, is capable of producing 13.75 MMBtu's per year and requires 25 square feet roof space, or a total of 75
square feet of roof space for system installation. A 2‐collector system is considered sufficient for a 2‐ to 3‐person house, generates 9.3 MMBtu's per
year, and requires 50 square feet of roof space for installation (Sunlight Solar Energy).
210 Dollar savings are calculated using 2010 utility costs of $0.24/kWh electricity (includes all fees); $9.18/thousand cf natural gas for
commercial/industrial and $14.81/thousand cf natural gas for residential; $2.65/ gallon #2 light fuel oil; $3.00/gallon gasoline/diesel (assumes 1 average
price per gallon); $0.00735/ gallon water residential supply and $0.005/gallon water commercial/industrial supply; $0.002166/gallon cost to residents
and businesses for water treatment; $0.00018/gallon cost to utility associated with electricity to supply water; $0.000234/gallon cost associated with
electricity used to WPCA to treat water.
211 The Connecticut Energy Advisory Board reports that solar module prices are expected to drop as much as 30 percent in the next year or two, which
would reduce installed costs about 15 percent from the current average installed cost of $7.50/watt for all systems. (Smaller systems cost more than this
average per watt; larger systems cost less per watt.) The CEAB also notes that industry goals reported by SolarBuzz are a drop from $4+/watt to $1.5 to
$2/watt by 2020 for module costs. Installed costs declined from $7.8/watt in 2007 to $7.5/watt in 2008. As a result of current and projected solar
economics, CEAB currently recommends a delay in implementing significant solar installation as a means of meeting Connecticut’s electricity supply.
(CEAB Technical Paper: Renewable Energy; http://www.ctenergy.org/pdf/2010CEABPPPart4b2.pdf. Cited in this paper, and referenced here, is
information from Lawrence Berkeley National Laboratory, Tracking the Sun II (LBNL report), October 2009.)
212 The calculation of employment opportunity assumes the following: for a 3‐panel system, 3 installers for 3 days are required for total of 9 man‐days
per installation (Mercury Solar Systems rough guideline).

Bridgeport Energy Efficiency and Conservation Plan 168
213 Flat roof commercial buildings equal 1,531 (63%) of 2,446 total commercial buildings (Bridgeport Tax Assessor data) but have living space equal to
76% of total commercial living area (from Bridgeport Tax Assessor data). The per building energy use, calculated based upon 76% of total commercial
electricity consumption: (76% X 432,003,521 kWh)/1,531 building number, yields 214,450‐kWh/year per flat roof commercial building. kWh savings from
solar pv installation are calculated to be 87,258 kWh per flat roof commercial building, or 41% of electricity consumption, based on following
assumptions: total footprint of 1,531 flat roof commercial buildings equals 14,843,484 square feet (from Bridgeport Tax Assessor data) for per building
average footprint of 148,435 square feet. Space required for installation of 1KW solar PV system equals 100 square feet (Mercury Solar Systems).
Maximum installed potential on Bridgeport commercial flat roof buildings, based on roof space available, equals 148,435 KW, having generation
potential of 178,121,808 kWh (assuming 1,200 kWh generation per 1 KW installed (United Illuminating)). Total installed capacity per building equals
97KW and total annual generation potential per building equals 116,343 kWh. This Energy Plan assumes 25% reduction from maximum potential,
yielding 87,258 kWh per building adjusted savings potential from 73 KW installed solar PV per building average. This equals 40.69% of 2007 electricity
consumption per building average for flat roof commercial buildings and carries an associated 20% reduction in per building electricity‐related emissions
(36.22 MTCO2e versus 180.1 MTCO2e per flat roof commercial building average from Bridgeport GHG Inventory data).
214 Flat roof commercial buildings equal 1,531 (63%) of 2,446 total commercial buildings) (Bridgeport Tax Assessor data) but have living space equal to
76% of total commercial living area (from Bridgeport Tax Assessor data). Per building energy use calculated based upon 76% of total commercial
electricity consumption (76% X 432,003,521 kWh)/1,531 building number, yielding 214,450‐kWh/year per flat roof commercial building. kWh savings
from solar pv installation calculated to be 87,258 kWh per flat roof commercial building, or 20% of electricity consumption, based on following
assumptions: total footprint of 1,531 flat roof commercial buildings equals 14,843,484 square feet (from Bridgeport Tax Assessor data) for per building
average of 148,435 square feet. Space required for installation of 1KW solar PV equals 100 square feet (Mercury Solar Systems). Total installed potential
on Bridgeport commercial flat roof buildings equals 148,435 KW, having generation potential of 178,121,808 kWh based on 1,200 kWh generation per 1
KW installed (United Illuminating), or total installed capacity per building of 97KW and total annual generation per building of 116,343 kWh. This Energy
Plan assumes 25% reduction from maximum potential, yielding 87,258 kWh per building adjusted savings potential from 73 KW installed solar PV per
building average. This equals 40.69% of 2007 per building electricity consumption average for flat roof commercial buildings.
215 Upon recommendation of ICLEI, Bridgeport GHG Inventory conducted for calendar year 2007 used Egrid Subregion 1 – NPCC New England coefficient
figures for 2004 as follows: CO2 908.9 lbs/MWH; N20 0.015 lbs/MWH; CH4 0.080 lbs/MWH and criteria air pollutants as follows: NOX 0.677 lbs/MWH;
SOX 1.262 lbs/MWH; CO 1.216 lbs/MWH; VOC 0.136 lbs/MWH; PM10 0.982 lbs/MWH. Electricity emissions are calculated from Bridgeport GHG
Inventory, which had input of 762,419,176 total kWh community‐wide and reported 316,511 MTCO2e of electricity‐related emissions community‐wide
for average of 0.000415141 MTCO2e/kWh. Savings per flat roof commercial building represent 20% electricity‐related emissions savings per flat roof
commercial building: 36.22 MTCO2e savings / 180.07 MTCO2e building average for flat roof commercial buildings from Bridgeport 2007 GHG Inventory
data.
216 Total footprint of 1,531 flat roof commercial buildings equals 14,843,484 square feet (from Bridgeport Tax Assessor data) for a per building average of
148,435 square feet. Space required for installation of 1KW solar PV equals 100 square feet (Mercury Solar Systems). Total installed potential on
Bridgeport commercial flat roof buildings equals 148,435 KW, having generation potential of 178,121,808 kWh based on 1,200 kWh generation per 1 KW
installed (United Illuminating), or total installed capacity per building of 97KW and total annual generation per building of 116,343 kWh. This Energy Plan
assumes 25% reduction from maximum potential; yielding 87,258 kWh per building adjusted savings potential from 73 KW installed solar PV per building
average.
217 Dollar savings are calculated using 2010 utility costs of $0.24/kWh electricity (includes all fees); $9.18/thousand cf natural gas for
commercial/industrial and $14.81/thousand cf natural gas for residential; $2.65/ gallon #2 light fuel oil; $3.00/gallon gasoline/diesel (assumes 1 average
price per gallon); $0.00735/ gallon water residential supply and $0.005/gallon water commercial/industrial supply; $0.002166/gallon cost to residents
and businesses for water treatment; $0.00018/gallon cost to utility associated with electricity to supply water; $0.000234/gallon cost associated with
electricity used to WPCA to treat water.
218 The Connecticut Energy Advisory Board reports that solar module prices are expected to drop as much as 30 percent in the next year or two, which
would reduce installed costs about 15 percent from the current average installed cost of $7.50/watt for all systems. (Smaller systems cost more than this
average per watt; larger systems cost less per watt.) The CEAB also notes that industry goals reported by SolarBuzz are a drop from $4+/watt to $1.5 to
$2/watt by 2020 for module costs. Installed costs declined from $7.8/watt in 2007 to $7.5/watt in 2008. As a result of current and projected solar
economics, CEAB currently recommends a delay in implementing significant solar installation as a means of meeting Connecticut’s electricity supply.
(CEAB Technical Paper: Renewable Energy; http://www.ctenergy.org/pdf/2010CEABPPPart4b2.pdf. Cited in this paper, and referenced here, is
information from Lawrence Berkeley National Laboratory, Tracking the Sun II (LBNL report), October 2009.)

Bridgeport Energy Efficiency and Conservation Plan 169
219 This employment opportunity calculation assumes this measure would require 3 installers for 2 to 2.25 months = 50 days/installer, or 150 man‐days
per installation, and does not include design‐related employment opportunity (Mercury Solar Systems, rough guideline).
220 Pitched roof commercial buildings equal 915 (37%) of 2,446 total commercial buildings (Bridgeport Tax Assessor data) but have living space equal to
24% of total commercial living area (from Bridgeport Tax Assessor data). The per building energy use, calculated based upon 24% of total commercial
electricity consumption: (24% X 432,003,521 kWh)/915 building number, yields 113,312 kWh/year per pitched roof commercial building. kWh savings
from solar pv installation are calculated to be 54,358 kWh per pitched roof commercial building, or 48% of electricity consumption, based on following
assumptions: total footprint of 915 flat roof commercial buildings equals 5,526,364 square feet (from Bridgeport Tax Assessor data) for per building
average footprint of 6,040 square feet. Space required for installation of 1KW solar PV system equals 100 square feet (Mercury Solar Systems). Assumed
maximum installed potential on Bridgeport commercial pitched roof buildings is 25%, based on 50% elimination for roof orientation and 50% reduction
of remaining based on shading or other factors, resulting in adjusted maximum installed potential of 13,816 KW, having generation potential of
16,579,092 kWh (assuming 1,200 kWh generation per 1 KW installed (United Illuminating)). Total installed capacity per building equals 60KW and total
annual generation potential per building equals 72,477 kWh. This Energy Plan assumes 25% reduction from maximum potential; yielding 54,358 kWh per
building adjusted savings potential from 45 KW installed solar PV per building average. This equals 48% of 2007 electricity consumption per building
average for pitched roof commercial buildings and carries an associated 24% reduction in per building electricity‐related emissions (22.57MTCO2e
versus 95.14 MTCO2e per pitched roof commercial building average from Bridgeport GHG Inventory data).
221 Pitched roof commercial buildings equal 915 (37%) of 2,446 total commercial buildings (Bridgeport Tax Assessor data) but have living space equal to
24% of total commercial living area (from Bridgeport Tax Assessor data). The per building energy use, calculated based upon 24% of total commercial
electricity consumption: (24% X 432,003,521 kWh)/915 building number, yields 113,312 kWh/year per pitched roof commercial building. kWh savings
from solar pv installation are calculated to be 54,358 kWh per pitched roof commercial building, or 48% of electricity consumption, based on following
assumptions: total footprint of 915 flat roof commercial buildings equals 5,526,364 square feet (from Bridgeport Tax Assessor data) for per building
average footprint of 6,040 square feet. Space required for installation of 1KW solar PV system equals 100 square feet (Mercury Solar Systems). Assumed
maximum installed potential on Bridgeport commercial pitched roof buildings is 25%, based on 50% elimination for roof orientation and 50% reduction
of remaining based on shading or other factors, resulting in adjusted maximum installed potential of 13,816 KW, having generation potential of
16,579,092 kWh (assuming 1,200 kWh generation per 1 KW installed (United Illuminating)). Total installed capacity per building equals 60KW and total
annual generation potential per building equals 72,477 kWh. This Energy Plan assumes 25% reduction from maximum potential; yielding 54,358 kWh per
building adjusted savings potential from 45 KW installed solar PV per building average. This equals 48% of 2007 electricity consumption per building
average for pitched roof commercial buildings and carries an associated 24% reduction in per building electricity‐related emissions (22.57MTCO2e
versus 95.14 MTCO2e per pitched roof commercial building average from Bridgeport GHG Inventory data).
222 Upon recommendation of ICLEI, Bridgeport GHG Inventory conducted for calendar year 2007 used Egrid Subregion 1 – NPCC New England coefficient
figures for 2004 as follows: CO2 908.9 lbs/MWH; N20 0.015 lbs/MWH; CH4 0.080 lbs/MWH and criteria air pollutants as follows: NOX 0.677 lbs/MWH;
SOX 1.262 lbs/MWH; CO 1.216 lbs/MWH; VOC 0.136 lbs/MWH; PM10 0.982 lbs/MWH. Electricity emissions are calculated from Bridgeport GHG
Inventory, which had input of 762,419,176 total kWh community‐wide and reported 316,511 MTCO2e of electricity‐related emissions community‐wide
for average of 0.000415141 MTCO2e/kWh. Savings per pitched roof commercial building represent 24% electricity‐related emissions savings per pitched
roof commercial building: 22.57 MTCO2e savings / 95.14 MTCO2e pitched roof commercial building average from Bridgeport GHG Inventory data.
223 Total footprint of 915 pitched roof commercial buildings equals 5,526,364 square feet (from Bridgeport Tax Assessor data) for per building average
footprint of 6,040 square feet. Space required for installation of 1KW solar PV system equals 100 square feet (Mercury Solar Systems). Assumed
maximum installed potential on Bridgeport commercial pitched roof buildings is 25%, based on 50% elimination for roof orientation and 50% reduction
of remaining based on shading or shape factors, resulting in adjusted maximum installed potential of 13,816 KW, having generation potential of
16,579,092 kWh (assuming 1,200 kWh generation per 1 KW installed (United Illuminating)). Total installed capacity per building equals 60KW and total
annual generation potential per building equals 72,477 kWh. This Energy Plan assumes 25% reduction from maximum potential; yielding 54,358 kWh per
building adjusted savings potential from 45 KW installed solar PV per building average.
224 Dollar savings are calculated using 2010 utility costs of $0.24/kWh electricity (includes all fees); $9.18/thousand cf natural gas for
commercial/industrial and $14.81/thousand cf natural gas for residential; $2.65/ gallon #2 light fuel oil; $3.00/gallon gasoline/diesel (assumes 1 average
price per gallon); $0.00735/ gallon water residential supply and $0.005/gallon water commercial/industrial supply; $0.002166/gallon cost to residents
and businesses for water treatment; $0.00018/gallon cost to utility associated with electricity to supply water; $0.000234/gallon cost associated with
electricity used to WPCA to treat water.

Bridgeport Energy Efficiency and Conservation Plan 170
225 The Connecticut Energy Advisory Board reports that solar module prices are expected to drop as much as 30 percent in the next year or two, which
would reduce installed costs about 15 percent from the current average installed cost of $7.50/watt for all systems. (Smaller systems cost more than this
average per watt; larger systems cost less per watt.) The CEAB also notes that industry goals reported by SolarBuzz are a drop from $4+/watt to $1.5 to
$2/watt by 2020 for module costs. Installed costs declined from $7.8/watt in 2007 to $7.5/watt in 2008. As a result of current and projected solar
economics, CEAB currently recommends a delay in implementing significant solar installation as a means of meeting Connecticut’s electricity supply.
(CEAB Technical Paper: Renewable Energy; http://www.ctenergy.org/pdf/2010CEABPPPart4b2.pdf. Cited in this paper, and referenced here, is
information from Lawrence Berkeley National Laboratory, Tracking the Sun II (LBNL report), October 2009.)
226 This employment opportunity calculation assumes this measure would require 3 installers for 2 to 2.25 months = 50 days/installer, or 150 man‐days
per installation, and does not include design‐related employment opportunity (Mercury Solar Systems, rough guideline).
227 This Bridgeport Energy Plan assumes installation of solar under Low Growth scenario on flat roof buildings only. Flat roof commercial buildings equal
1,531 (63%) of 2,446 total commercial buildings (Bridgeport Tax Assessor data) but have living space equal to 76% of total commercial living area (from
Bridgeport Tax Assessor data). The per building energy use, calculated based upon 76% of total commercial electricity consumption: (76% X 432,003,521
kWh)/1,531 building number, yields 214,450‐kWh/year per flat roof commercial building. kWh savings from solar pv installation are calculated to be
87,258 kWh per flat roof commercial building, or 41% of electricity consumption, based on following assumptions: total footprint of 1,531 flat roof
commercial buildings equals 14,843,484 square feet (from Bridgeport Tax Assessor data) for per building average footprint of 148,435 square feet. Space
required for installation of 1KW solar PV system equals 100 square feet (Mercury Solar Systems). Maximum installed potential on Bridgeport commercial
flat roof buildings, based on roof space available, equals 148,435 KW, having generation potential of 178,121,808 kWh (assuming 1,200 kWh generation
per 1 KW installed (United Illuminating)). Total installed capacity per building equals 97KW and total annual generation potential per building equals
116,343 kWh. This Energy Plan assumes 25% reduction from maximum potential, yielding 87,258 kWh per building adjusted savings potential from 73
KW installed solar PV per building average. This equals 40.69% of 2007 electricity consumption per building average for flat roof commercial buildings
and carries an associated 20% reduction in per building electricity‐related emissions (36.22 MTCO2e versus 180.1 MTCO2e per flat roof commercial
building average from Bridgeport GHG Inventory data).
228 Flat roof commercial buildings equal 1,531 (63%) of 2,446 total commercial buildings(Bridgeport Tax Assessor data) but have living space equal to
76% of total commercial living area (from Bridgeport Tax Assessor data). Per building energy use calculated based upon 76% of total commercial
electricity consumption (76% X 432,003,521 kWh)/1,531 building number, yielding 214,450‐kWh/year per flat roof commercial building. kWh savings
from solar pv installation calculated to be 87,258 kWh per flat roof commercial building, or 20% of electricity consumption, based on following
assumptions: total footprint of 1,531 flat roof commercial buildings equals 14,843,484 square feet (from Bridgeport Tax Assessor data) for per building
average of 148,435 square feet. Space required for installation of 1KW solar PV equals 100 square feet (Mercury Solar Systems). Total installed potential
on Bridgeport commercial flat roof buildings equals 148,435 KW, having generation potential of 178,121,808 kWh based on 1,200 kWh generation per 1
KW installed (United Illuminating), or total installed capacity per building of 97KW and total annual generation per building of 116,343 kWh. This Energy
Plan assumes 25% reduction from maximum potential, yielding 87,258 kWh per building adjusted savings potential from 73 KW installed solar PV per
building average. This equals 40.69% of 2007 per building electricity consumption average for flat roof commercial buildings.
229 Upon recommendation of ICLEI, Bridgeport GHG Inventory conducted for calendar year 2007 used Egrid Subregion 1 – NPCC New England coefficient
figures for 2004 as follows: CO2 908.9 lbs/MWH; N20 0.015 lbs/MWH; CH4 0.080 lbs/MWH and criteria air pollutants as follows: NOX 0.677 lbs/MWH;
SOX 1.262 lbs/MWH; CO 1.216 lbs/MWH; VOC 0.136 lbs/MWH; PM10 0.982 lbs/MWH. Electricity emissions are calculated from Bridgeport GHG
Inventory, which had input of 762,419,176 total kWh community‐wide and reported 316,511 MTCO2e of electricity‐related emissions community‐wide
for average of 0.000415141 MTCO2e/kWh. Savings per flat roof commercial building represent 20% electricity‐related emissions savings per flat roof
commercial building: 36.22 MTCO2e savings / 180.07 MTCO2e building average for flat roof commercial buildings from Bridgeport 2007 GHG Inventory
data.
230 Dollar savings are calculated using 2010 utility costs of $0.24/kWh electricity (includes all fees); $9.18/thousand cf natural gas for
commercial/industrial and $14.81/thousand cf natural gas for residential; $2.65/ gallon #2 light fuel oil; $3.00/gallon gasoline/diesel (assumes 1 average
price per gallon); $0.00735/ gallon water residential supply and $0.005/gallon water commercial/industrial supply; $0.002166/gallon cost to residents
and businesses for water treatment; $0.00018/gallon cost to utility associated with electricity to supply water; $0.000234/gallon cost associated with
electricity used to WPCA to treat water.
231 Rounding impacts total.

Bridgeport Energy Efficiency and Conservation Plan 171
232 Dollar savings are calculated using 2010 utility costs of $0.24/kWh electricity (includes all fees); $9.18/thousand cf natural gas for
commercial/industrial and $14.81/thousand cf natural gas for residential; $2.65/ gallon #2 light fuel oil; $3.00/gallon gasoline/diesel (assumes 1 average
price per gallon); $0.00735/ gallon water residential supply and $0.005/gallon water commercial/industrial supply; $0.002166/gallon cost to residents
and businesses for water treatment; $0.00018/gallon cost to utility associated with electricity to supply water; $0.000234/gallon cost associated with
electricity used to WPCA to treat water.
233 The Connecticut Energy Advisory Board reports that solar module prices are expected to drop as much as 30 percent in the next year or two, which
would reduce installed costs about 15 percent from the current average installed cost of $7.50/watt for all systems. (Smaller systems cost more than this
average per watt; larger systems cost less per watt.) The CEAB also notes that industry goals reported by SolarBuzz are a drop from $4+/watt to $1.5 to
$2/watt by 2020 for module costs. Installed costs declined from $7.8/watt in 2007 to $7.5/watt in 2008. As a result of current and projected solar
economics, CEAB currently recommends a delay in implementing significant solar installation as a means of meeting Connecticut’s electricity supply.
(CEAB Technical Paper: Renewable Energy; http://www.ctenergy.org/pdf/2010CEABPPPart4b2.pdf. Cited in this paper, and referenced here, is
information from Lawrence Berkeley National Laboratory, Tracking the Sun II (LBNL report), October 2009.)
234 New England Governors’ Renewable Energy Blueprint, 2009; http://www.negc.org/documents/2009/Renewable_Energy.pdf
235 2010 Comprehensive Plan For the Procurement of Energy Resources Prepared by the Connecticut Energy Advisory Board, April 27, 2010;
http://ctenergy.org/pdf/2010FullPlan.pdf
236 2010 Comprehensive Plan For the Procurement of Energy Resources Prepared by the Connecticut Energy Advisory Board, April 27, 2010;
http://ctenergy.org/pdf/2010FullPlan.pdf
237 2010 Connecticut Energy Advisory Board Procurement Plan, CEAB Technical Paper: Emerging Technologies,
http://www.ctenergy.org/pdf/2010CEABPPPart4b1.pdf.
238 Negative energy and emissions savings for electricity reflect increase in electricity and related emissions resulting from added train travel. Measure
includes only vehicle miles travelled within Bridgeport boundaries, for consistency with Bridgeport 2007 GHG Inventory. Maximum regional rail service
(MetroNorth) trip length in Bridgeport is assumed to be 4 miles round trip (2 miles between Bridgeport station and Bridgeport/Fairfield border or 2
miles between Bridgeport station and Bridgeport/Stratford boarder. Increased electricity use from rail use derived from Bridgeport 2007 GHG Inventory,
which used input of 2,996 Btu/passenger‐mile and 3,412 Btu/kWh for 0.878077374 kWh/passenger mile. Gasoline savings are calculated based on
Bridgeport 2007 GHG Inventory, which had gasoline input of 27,018 thousand gallons (U.S) and diesel input of 5,301 thousand gallons for total input of
32,319 thousand gallons and VMT input of 475,513,500 gasoline‐powered vehicle miles traveled (VMT) and 29,061,450 diesel‐powered VMT for total
input of 504,574,950 VMT.
239 Upon recommendation of ICLEI, Bridgeport GHG Inventory conducted for calendar year 2007 used Egrid Subregion 1 – NPCC New England coefficient
figures for 2004 as follows: CO2 908.9 lbs/MWH; N20 0.015 lbs/MWH; CH4 0.080 lbs/MWH and criteria air pollutants as follows: NOX 0.677 lbs/MWH;
SOX 1.262 lbs/MWH; CO 1.216 lbs/MWH; VOC 0.136 lbs/MWH; PM10 0.982 lbs/MWH. Electricity emissions are calculated from Bridgeport GHG
Inventory, which had input of 762,419,176 total kWh community‐wide and reported 316,511 MTCO2e of electricity‐related emissions community‐wide
for average of 0.000415141 MTCO2e/kWh. Gasoline equivalent emissions are calculated from Bridgeport 2007 GHG Inventory, which had gasoline input
of 27,018 thousand gallons (U.S) and diesel input of 5,301 thousand gallons for total input of 32,319 thousand gallons. This Bridgeport Energy Plan
assumes a single emissions average for gasoline and diesel combined. Based on reported emissions of 313,960 MTCO2e for citywide roadway
transportation, average roadway emissions equal 0.009714409 metric tons/gallon of “gasoline”. Bridgeport 2007 GHG inventory had input of
475,513,500 gasoline‐powered vehicle miles traveled (VMT) and 29,061,450 diesel‐powered VMT for total input of 504,574,950 VMT. Average emissions
based on Bridgeport citywide roadway VMT for gasoline and diesel VMT combined, and single fuel consumption figure for gasoline and diesel combined
equals 0.000622227 MTCO2e per vehicle mile travelled.
240 The 4‐mile roundtrip distance is used because a trip east or west on the MetroNorth railway with Bridgeport as the starting point will travel roughly 2
miles within Bridgeport to the border with either Stratford or Fairfield.
241 Dollar savings are calculated using 2010 utility costs of $0.24/kWh electricity (includes all fees); $9.18/thousand cf natural gas for
commercial/industrial and $14.81/thousand cf natural gas for residential; $2.65/ gallon #2 light fuel oil; $3.00/gallon gasoline/diesel (assumes 1 average
price per gallon); $0.00735/ gallon water residential supply and $0.005/gallon water commercial/industrial supply; $0.002166/gallon cost to residents

Bridgeport Energy Efficiency and Conservation Plan 172
and businesses for water treatment; $0.00018/gallon cost to utility associated with electricity to supply water; $0.000234/gallon cost associated with
electricity used to WPCA to treat water.
242 ICF International and American Public Transportation Association, Public Transportation and Petroleum Savings in the U.S.: Reducing Dependence on
Foreign Oil. 2007, cited in Center for Neighborhood Technology, 2008, Chicago Greenhouse Gas Emissions: An Inventory, Forecast, and Mitigation
Analysis for Chicago and the Metropolitan Region; an assessment prepared for the City of Chicago
http://www.chicagoclimateaction.org/filebin/pdf/FINALALL091708_1‐118.pdf).
243 Negative energy and emissions savings for electricity reflect increase in electricity and related emissions resulting from added train travel. Measure
includes only vehicle miles travelled within Bridgeport boundaries, for consistency with Bridgeport 2007 GHG Inventory. Measure assumes one 9‐person
occupancy van travels 8 roundtrips/day (4 morning and 4 afternoon.) X 2 miles X 250 days/year = 4000 VMT per year, carrying 36 persons for net annual
VMT savings of 14,000. Assumes van fuel efficiency is 10 mpg so gallons of fuel used by van per year are 4000/10 =400 for annual savings of 753 gallons.
Maximum regional rail service (MetroNorth) trip length in Bridgeport is assumed to be 4 miles round trip (2 miles between Bridgeport station and
Bridgeport/Fairfield border or 2 miles between Bridgeport station and Bridgeport/Stratford boarder. Increased electricity use from rail use derived from
Bridgeport 2007 GHG Inventory, which used input of 2,996 Btu/passenger‐mile and 3,412 Btu/kWh for 0.878077374 kWh/passenger mile. Gasoline
savings are calculated based on Bridgeport 2007 GHG Inventory, which had gasoline input of 27,018 thousand gallons (U.S) and diesel input of 5,301
thousand gallons for total input of 32,319 thousand gallons and VMT input of 475,513,500 gasoline‐powered vehicle miles traveled (VMT) and
29,061,450 diesel‐powered VMT for total input of 504,574,950 VMT.
244 Upon recommendation of ICLEI, Bridgeport GHG Inventory conducted for calendar year 2007 used Egrid Subregion 1 – NPCC New England coefficient
figures for 2004 as follows: CO2 908.9 lbs/MWH; N20 0.015 lbs/MWH; CH4 0.080 lbs/MWH and criteria air pollutants as follows: NOX 0.677 lbs/MWH;
SOX 1.262 lbs/MWH; CO 1.216 lbs/MWH; VOC 0.136 lbs/MWH; PM10 0.982 lbs/MWH. Electricity emissions are calculated from Bridgeport GHG
Inventory, which had input of 762,419,176 total kWh community‐wide and reported 316,511 MTCO2e of electricity‐related emissions community‐wide
for average of 0.000415141 MTCO2e/kWh. Gasoline equivalent emissions are calculated from Bridgeport 2007 GHG Inventory, which had gasoline input
of 27,018 thousand gallons (U.S) and diesel input of 5,301 thousand gallons for total input of 32,319 thousand gallons. This Bridgeport Energy Plan
assumes a single emissions average for gasoline and diesel combined. Based on reported emissions of 313,960 MTCO2e for citywide roadway
transportation, average roadway emissions equal 0.009714409 metric tons CO2e/gallon of “gasoline.” Bridgeport 2007 GHG inventory had input of
475,513,500 gasoline‐powered vehicle miles traveled (VMT) and 29,061,450 diesel‐powered VMT for total input of 504,574,950 VMT. Average emissions
based on Bridgeport citywide roadway VMT for gasoline and diesel VMT combined, and single fuel consumption figure for gasoline and diesel combined
equals 0.000622227 MTCO2e per vehicle mile travelled.
245 Dollar savings are calculated using 2010 utility costs of $0.24/kWh electricity (includes all fees); $9.18/thousand cf natural gas for
commercial/industrial and $14.81/thousand cf natural gas for residential; $2.65/ gallon #2 light fuel oil; $3.00/gallon gasoline/diesel (assumes 1 average
price per gallon); $0.00735/ gallon water residential supply and $0.005/gallon water commercial/industrial supply; $0.002166/gallon cost to residents
and businesses for water treatment; $0.00018/gallon cost to utility associated with electricity to supply water; $0.000234/gallon cost associated with
electricity used to WPCA to treat water.
246 Annual gasoline/diesel savings per person for transfer from single rider auto trip to Bridgeport 4‐mile roundtrip train trip is calculated from
Bridgeport GHG Inventory data as follows: (250 day) X (5 days/week) = 1,000 vehicle miles/year. (1,000 vehicle miles) X (0.000622227 MTCO2e average
from GHG inventory report) = 0.22226 MTCO2e, which is divided by 0.009714409 metric tons CO2e/gallon average from Bridgeport GHG Inventory, to
yield 64.05 gallons per person/year. At assumed $3/gallon, savings per person equals $192.15. Note that the average vehicle efficiency per vehicle
generated by the Bridgeport 2007 GHG Inventory is 15.61 mpg.
247 Labor potential calculation assumes 1 driver per van per half day for 5 days per week; so 1 FT equivalent per 2 vans.
248 This measure assumes shift per person from SOV to bus for 6‐mile roundtrip X 330 days/year =19,800 VMT per person per year. It also assumes shift
from 21.3 mpg passenger vehicle to 5.6 mpg bus and shift in occupancy factor from 1.60 to 10.6.
249 Fuel savings and emissions from this measure were calculated with Clean Air and Climate Protection (CACP) software, developed by the National
Association of Clean Air Agencies (formerly STAPPA and ALAPCO), ICLEI‐Local Governments for Sustainability (formerly International Cities for Local
Environmental Action (ICLEI)), and Torrie Smith Associates Inc. Default values for software are 0.009393 metric tons CO2e/gallon gasoline and 0.009791
metric tons CO2e/gallon diesel.

Bridgeport Energy Efficiency and Conservation Plan 173
250 Dollar savings are calculated using 2010 utility costs of $0.24/kWh electricity (includes all fees); $9.18/thousand cf natural gas for
commercial/industrial and $14.81/thousand cf natural gas for residential; $2.65/ gallon #2 light fuel oil; $3.00/gallon gasoline/diesel (assumes 1 average
price per gallon); $0.00735/ gallon water residential supply and $0.005/gallon water commercial/industrial supply; $0.002166/gallon cost to residents
and businesses for water treatment; $0.00018/gallon cost to utility associated with electricity to supply water; $0.000234/gallon cost associated with
electricity used to WPCA to treat water.
251 Savings calculation based on annual gasoline/diesel savings per person for transfer from single rider auto trip to Bridgeport 4‐mile roundtrip train trip,
which is calculated from Bridgeport GHG Inventory data as follows: (250 day) X (5 days/week) = 1,000 vehicle miles/year. (1,000 vehicle miles) X
(0.000622227 MTCO2e average from GHG inventory report) = 0.22226 MTCO2e, which is divided by 0.009714409 metric tons CO2e/gallon average from
Bridgeport GHG Inventory, to yield 64.05 gallons per person/year. At assumed $3/gallon, savings per person equals $192.15. A similar transfer of six‐mile
trips, as proposed by this measure, would save ($192/4) X (6) = $288. Note that the average vehicle efficiency per vehicle generated by the Bridgeport
2007 GHG Inventory is 15.61 mpg.
252 An ecopass currently costs $80 (Greater Bridgeport Transit).
253 This measure assumes shift from passenger car with average 1.6 occupancy factor and 21.3 mpg fuel efficiency to bus with 10.6 occupancy factor and
5.6 mpg average fuel efficiency.
254 Fuel savings and emissions from this measure were calculated with Clean Air and Climate Protection (CACP) software, developed by the National
Association of Clean Air Agencies (formerly STAPPA and ALAPCO), ICLEI‐Local Governments for Sustainability (formerly International Cities for Local
Environmental Action (ICLEI)), and Torrie Smith Associates Inc. Default values for software are 0.009393 metric tons CO2e/gallon gasoline and 0.009791
metric tons CO2e/gallon diesel.
255 The number of automobiles removed from the roadway was estimated based on the following assumptions: East/West trip on I‐95 equals 4 miles and
N/S trip on Route 8/25 equals 6 miles. Assume 50/50 reduction of number of trips between the two routes to yield 5,000,000 trips removed (and
decrease of 20,000,000 SOV VMT) from I‐95; and 3,333,333 trips removed (and decrease of 20,000,000 SOV VMT) from Route 8/25. Cars per day
removed equals 13,699 for I‐95 and 9,132 for Route 8/25 for combined total of 22,831 cars based on these mileage/trip assumptions.
256 Dollar savings are calculated using 2010 utility costs of $0.24/kWh electricity (includes all fees); $9.18/thousand cf natural gas for
commercial/industrial and $14.81/thousand cf natural gas for residential; $2.65/ gallon #2 light fuel oil; $3.00/gallon gasoline/diesel (assumes 1 average
price per gallon); $0.00735/ gallon water residential supply and $0.005/gallon water commercial/industrial supply; $0.002166/gallon cost to residents
and businesses for water treatment; $0.00018/gallon cost to utility associated with electricity to supply water; $0.000234/gallon cost associated with
electricity used to WPCA to treat water.
257 VMT projection is based on increasing trend in per capita VMT.
258 Energy and emissions savings assume workday carpooling for 3‐mile round trip travel within Bridgeport X 250 days per year; and assume 4:1 ratio of
2‐person to 3‐person carpools. Miles travelled energy savings and emissions savings associated with carpooling beyond Bridgeport boundaries are not
quantified or included in Bridgeport savings potential. Gasoline savings are calculated based on Bridgeport 2007 GHG Inventory, which had gasoline
input of 27,018 thousand gallons (U.S) and diesel input of 5,301 thousand gallons for total input of 32,319 thousand gallons and VMT input of
475,513,500 gasoline‐powered vehicle miles traveled (VMT) and 29,061,450 diesel‐powered VMT for total input of 504,574,950 VMT.
259 Gasoline equivalent emissions are calculated from Bridgeport 2007 GHG Inventory, which had gasoline input of 27,018 thousand gallons (U.S) and
diesel input of 5,301 thousand gallons for total input of 32,319 thousand gallons. This Bridgeport Energy Plan assumes a single emissions average for
gasoline and diesel combined. Based on reported emissions of 313,960 MTCO2e for citywide roadway transportation, average roadway emissions equal
0.009714409 metric tons CO2e/gallon of “gasoline.” Bridgeport 2007 GHG inventory had input of 475,513,500 gasoline‐powered vehicle miles traveled
(VMT) and 29,061,450 diesel‐powered VMT for total input of 504,574,950 VMT. Average emissions based on Bridgeport citywide roadway VMT for
gasoline and diesel VMT combined, and single fuel consumption figure for gasoline and diesel combined equals 0.000622227 MTCO2e per vehicle mile
travelled.
260 Dollar savings are calculated using 2010 utility costs of $0.24/kWh electricity (includes all fees); $9.18/thousand cf natural gas for
commercial/industrial and $14.81/thousand cf natural gas for residential; $2.65/ gallon #2 light fuel oil; $3.00/gallon gasoline/diesel (assumes 1 average
price per gallon); $0.00735/ gallon water residential supply and $0.005/gallon water commercial/industrial supply; $0.002166/gallon cost to residents

Bridgeport Energy Efficiency and Conservation Plan 174
and businesses for water treatment; $0.00018/gallon cost to utility associated with electricity to supply water; $0.000234/gallon cost associated with
electricity used to WPCA to treat water.
261 Five carpools with a ratio of 4:1 2‐person to 3‐person are estimated to have savings of $1,729 based on $3/gallon gasoline cost and 576‐gallon savings
per year. Using these figures, the price per person for 11 persons equals $157.
262 Energy and emissions savings assume the establishment of one 8‐person vanpool at 10 Bridgeport employment hubs to service 80 persons; and
assumes travel of 6‐miles round trip X 250 days/year = 1,500 VMT per person.
263 Gasoline equivalent emissions are calculated from Bridgeport 2007 GHG Inventory, which had gasoline input of 27,018 thousand gallons (U.S) and
diesel input of 5,301 thousand gallons for total input of 32,319 thousand gallons. This Bridgeport Energy Plan assumes a single emissions average for
gasoline and diesel combined. Based on reported emissions of 313,960 MTCO2e for citywide roadway transportation, average roadway emissions equal
0.009714409 metric tons CO2e/gallon of “gasoline.” Bridgeport 2007 GHG inventory had input of 475,513,500 gasoline‐powered vehicle miles traveled
(VMT) and 29,061,450 diesel‐powered VMT for total input of 504,574,950 VMT. Average emissions based on Bridgeport citywide roadway VMT for
gasoline and diesel VMT combined, and single fuel consumption figure for gasoline and diesel combined equals 0.000622227 MTCO2e per vehicle mile
travelled.
264 Rounding impacts total number
265 Dollar savings are calculated using 2010 utility costs of $0.24/kWh electricity (includes all fees); $9.18/thousand cf natural gas for
commercial/industrial and $14.81/thousand cf natural gas for residential; $2.65/ gallon #2 light fuel oil; $3.00/gallon gasoline/diesel (assumes 1 average
price per gallon); $0.00735/ gallon water residential supply and $0.005/gallon water commercial/industrial supply; $0.002166/gallon cost to residents
and businesses for water treatment; $0.00018/gallon cost to utility associated with electricity to supply water; $0.000234/gallon cost associated with
electricity used to WPCA to treat water.
266 This action assumes 20‐shared cars are established to serve 874 persons, which equals 43.7 persons per car. Car‐share assumes gasoline savings
factor versus non‐car share equals 10. These assumptions mirror assumptions of the Chicago Climate Mitigation Analysis (Center for Neighborhood
Technology, 2008, Chicago Greenhouse Gas Emissions: An Inventory, Forecast, and Mitigation Analysis for Chicago and the Metropolitan Region; An
assessment prepared for the City of Chicago; http://www.chicagoclimateaction.org/filebin/pdf/FINALALL091708_118‐266.pdf) which cites the GHG
reduction potential of car sharing used is calculated based on the long‐term study of City CarShare in San Francisco carried out by Robert Cervero et al,
which found that the average car share member consumes just 0.03 gallons of gasoline per day for all trips in all modes, while the average nonmember
consumes 0.31 gallons, or ten times more. At the time of the study, City CarShare had 3,800 active members and 87 vehicles, for an average of 43.7
active members per vehicle (Robert Cervero, Aaron Golub, and Brendan Nee, Institute of Urban and Regional Development, University of California at
Berkeley, “San Francisco City CarShare: Longer‐Term Travel‐Demand and Car Ownership Impacts,” Department of Transportation and Parking, City of
San Francisco, http://www‐iurd.ced.berkeley.edu/pub/WP‐2006‐07.pdf.)
267 AT 0.3 gallons per day, one non‐car share driver would use 109.5 gallons of gasoline per year, log 20,14.8 VMT (assuming 18.4 mpg fuel efficiency)
and emit 1.2537 MTCO2e (assuming Bridgeport average transportation roadway emissions of 0.000622227 MTCO2e/gallon of gasoline derived from
Bridgeport 2007 GHG Inventory input of 32,319 thousand gallons gasoline and diesel and software‐generated emissions of 313,960 MTCO2e). 43.7 non‐
car‐share drivers would use 4,785.15 gallons of gasoline, log 88,046.76 VMT and emit 54.78504387 MT of CO2e per year. In comparison, a single car‐
share driver, assuming .03 gallons of gasoline per day, would use 10.95 gallons of gasoline per year, log 201.48 VMT per year and emit 0.12537 MT of
CO2e per year. 43.7 car‐share drivers would use 478.52 gallons of gasoline per year, log 8,804.68 VMT per year and emit 5.4785 MTCO2e per year. The
per driver difference between a non‐car share driver and a car‐share driver, and used for these Bridgeport Energy Plan calculations, is 4,306.635 gallons
per year, 79,242.084 VMT and 49.30653948 MTCO2e.
268 Gasoline equivalent emissions are calculated from Bridgeport 2007 GHG Inventory, which had gasoline input of 27,018 thousand gallons (U.S) and
diesel input of 5,301 thousand gallons for total input of 32,319 thousand gallons. This Bridgeport Energy Plan assumes a single emissions average for
gasoline and diesel combined. Based on reported emissions of 313,960 MTCO2e for citywide roadway transportation, average roadway emissions equal
0.009714409 metric tons CO2e/gallon of “gasoline.” Bridgeport 2007 GHG inventory had input of 475,513,500 gasoline‐powered vehicle miles traveled
(VMT) and 29,061,450 diesel‐powered VMT for total input of 504,574,950 VMT. Average emissions based on Bridgeport citywide roadway VMT for
gasoline and diesel VMT combined, and single fuel consumption figure for gasoline and diesel combined equals 0.000622227 MTCO2e per vehicle mile
travelled.

Bridgeport Energy Efficiency and Conservation Plan 175
269 Dollar savings are calculated using 2010 utility costs of $0.24/kWh electricity (includes all fees); $9.18/thousand cf natural gas for
commercial/industrial and $14.81/thousand cf natural gas for residential; $2.65/ gallon #2 light fuel oil; $3.00/gallon gasoline/diesel (assumes 1 average
price per gallon); $0.00735/ gallon water residential supply and $0.005/gallon water commercial/industrial supply; $0.002166/gallon cost to residents
and businesses for water treatment; $0.00018/gallon cost to utility associated with electricity to supply water; $0.000234/gallon cost associated with
electricity used to WPCA to treat water.
270 As cited in Center for Neighborhood Technology, 2008, Chicago Greenhouse Gas Emissions: An Inventory, Forecast, and Mitigation Analysis for
Chicago and the Metropolitan Region; An assessment prepared for the City of Chicago;
http://www.chicagoclimateaction.org/filebin/pdf/FINALALL091708_1‐118.pdf): ZipCar, www.zipcar.com\/chicago/is‐it/compare‐own; and Philly Car
Share, www.phillycarshare.org/24/news/press‐room.
271 This measure assumes transportation‐related emissions associated with new housing units located in Bridgeport’s inner core will elicit 62% lower net
increase due to TOD versus new construction in outlying suburbs. Modeling for Stamford, Connecticut showed this result for hypothetical construction
of 6,113 new housing units in Stamford Downtown and serves as the basis for this assumption (RPA and ICLEI, Mayors Institute on Climate Change,
2009). Modeling used ICLEI transportation and land use software. This Energy Plan assumes 2.7 persons per household, for total of 27,000 persons in
projected 10,000 new households under the High Growth scenario. Per person (and per household) VMT is calculated based upon 2007 population of
137,463 population and 2007 citywide VMT of 504,574,950, for 2007 per capita average of 3,671 VMT/person, and is then adjusted to reflect the state
trend (19.90% projected increase 2007 to 2030 as derived from State of Connecticut sector emissions trends for years 1990 to 2007 and comparison of
5‐year averages of 1990‐1994 and 2003‐2007). The 2030 projected VMT/person used in this Bridgeport Energy Plan is 4,401. Projected emissions are
based upon this figure and no adjustment is made for changes in fuel efficiency. Under these assumptions, projected VMT from 10,000 additional
households is 118,827,000 vehicle miles. A 62% lower net increase is 73,672,740 vehicle miles for a difference of 45,154,260 VMT.
272 Gasoline equivalent emissions are calculated from Bridgeport 2007 GHG Inventory, which had gasoline input of 27,018 thousand gallons (U.S) and
diesel input of 5,301 thousand gallons for total input of 32,319 thousand gallons. This Bridgeport Energy Plan assumes a single emissions average for
gasoline and diesel combined. Based on reported emissions of 313,960 MTCO2e for citywide roadway transportation, average roadway emissions equal
0.009714409 metric tons CO2e/gallon of “gasoline.” Bridgeport 2007 GHG inventory had input of 475,513,500 gasoline‐powered vehicle miles traveled
(VMT) and 29,061,450 diesel‐powered VMT for total input of 504,574,950 VMT. Average emissions based on Bridgeport citywide roadway VMT for
gasoline and diesel VMT combined, and single fuel consumption figure for gasoline and diesel combined equals 0.000622227 MTCO2e per vehicle mile
travelled.
273 Gasoline equivalent emissions are calculated from Bridgeport 2007 GHG Inventory, which had gasoline input of 27,018 thousand gallons (U.S) and
diesel input of 5,301 thousand gallons for total input of 32,319 thousand gallons. This Bridgeport Energy Plan assumes a single emissions average for
gasoline and diesel combined. Based on reported emissions of 313,960 MTCO2e for citywide roadway transportation, average roadway emissions equal
0.009714409 metric tons CO2e/gallon of “gasoline.” Bridgeport 2007 GHG inventory had input of 475,513,500 gasoline‐powered vehicle miles traveled
(VMT) and 29,061,450 diesel‐powered VMT for total input of 504,574,950 VMT. Average emissions based on Bridgeport citywide roadway VMT for
gasoline and diesel VMT combined, and single fuel consumption figure for gasoline and diesel combined equals 0.000622227 MTCO2e per vehicle mile
travelled.
274 Dollar savings are calculated using 2010 utility costs of $0.24/kWh electricity (includes all fees); $9.18/thousand cf natural gas for
commercial/industrial and $14.81/thousand cf natural gas for residential; $2.65/ gallon #2 light fuel oil; $3.00/gallon gasoline/diesel (assumes 1 average
price per gallon); $0.00735/ gallon water residential supply and $0.005/gallon water commercial/industrial supply; $0.002166/gallon cost to residents
and businesses for water treatment; $0.00018/gallon cost to utility associated with electricity to supply water; $0.000234/gallon cost associated with
electricity used to WPCA to treat water.
275 Peter M. Haas, et. al., “Housing & Transportation Cost Trade‐offs and Burdens of Working Households in 28 Metros,” Center for Neighborhood
Technology and Virginia Tech, http://www.cnt.org/repository/H‐T‐Tradeoffs‐for‐Working‐Families‐n‐28‐Metros‐FULL.pdf.; cited in Center for
Neighborhood Technology, 2008, Chicago Greenhouse Gas Emissions: An Inventory, Forecast, and Mitigation Analysis for Chicago and the Metropolitan
Region; An assessment prepared for the City of Chicago; http://www.chicagoclimateaction.org/filebin/pdf/FINALALL091708_1‐118.pdf).
276 Dena Belzer, et. al., “Preserving and Promoting Diverse Transit‐Oriented Development,” Center for Neighborhood Technology,
http://www.cnt.org/repository/diverseTOD_FullReport.pdf.; cited in Center for Neighborhood Technology, 2008, Chicago Greenhouse Gas Emissions: An
Inventory, Forecast, and Mitigation Analysis for Chicago and the Metropolitan Region; An assessment prepared for the City of Chicago;
http://www.chicagoclimateaction.org/filebin/pdf/FINALALL091708_1‐118.pdf).

Bridgeport Energy Efficiency and Conservation Plan 176
277 Center for Neighborhood Technology, 2008, Chicago Greenhouse Gas Emissions: An Inventory, Forecast, and Mitigation Analysis for Chicago and the
Metropolitan Region; An assessment prepared for the City of Chicago; http://www.chicagoclimateaction.org/filebin/pdf/FINALALL091708_1‐118.pdf).
278 In 2009, as part of a regional emissions evaluation, Regional Plan Association and ICLEI conducted modeling for Stamford, Connecticut, using ICLEI’s
transportation and land use software. Modeling results showed that hypothetical construction of 6,113 new housing units in Stamford Downtown, as
opposed to construction in surrounding municipalities, resulted in a 62% lower net increase in transportation‐related emissions. Development outside of
the urban center was predicted to result in an additional 178,859,913 VMT annually compared to 67,795,133 additional VMT per year resulting from
Downtown development (RPA and ICLEI, Mayors Institute on Climate Change,2009).
279 RPA and ICLEI, Mayors Institute on Climate Change, 2009.
280 Gasoline equivalent emissions are calculated from Bridgeport 2007 GHG Inventory, which had gasoline input of 27,018 thousand gallons (U.S) and
diesel input of 5,301 thousand gallons for total input of 32,319 thousand gallons. This Bridgeport Energy Plan assumes a single emissions average for
gasoline and diesel combined. Based on reported emissions of 313,960 MTCO2e for citywide roadway transportation, average roadway emissions equal
0.009714409 metric tons CO2e/gallon of “gasoline.” Bridgeport 2007 GHG inventory had input of 475,513,500 gasoline‐powered vehicle miles traveled
(VMT) and 29,061,450 diesel‐powered VMT for total input of 504,574,950 VMT. Average emissions based on Bridgeport citywide roadway VMT for
gasoline and diesel VMT combined, and single fuel consumption figure for gasoline and diesel combined equals 0.000622227 MTCO2e per vehicle mile
travelled. Calculation yields 389.87 gallons of gasoline/diesel.
281Dena Belzer, et. al., “Preserving and Promoting Diverse Transit‐Oriented Development,” Center for Neighborhood Technology,
http://www.cnt.org/repository/diverseTOD_FullReport.pdf.; cited in Center for Neighborhood Technology, 2008, Chicago Greenhouse Gas Emissions: An
Inventory, Forecast, and Mitigation Analysis for Chicago and the Metropolitan Region; An assessment prepared for the City of Chicago;
http://www.chicagoclimateaction.org/filebin/pdf/FINALALL091708_1‐118.pdf).
282 The proposed program participation and VMT reduction targets in this goal are based upon RPA analysis of Bridgeport’s in‐city travel patterns, but
actual action items are developed independently. Census tract information reveals 357,901 VMT for work‐related trips within 1 mile of the destination.
This Bridgeport Energy Plan assumes work‐related travel equals 20% of total travel and assumes the same proportion of non‐work trips is located within
1 mile of the destination. Regardless of adherence to Census‐tract‐derived data and targets, this Bridgeport Energy Plan proposes transfer of trips under
1‐mile to reduce automobile VMT by 201,300 miles and transfer of additional trips under 2‐miles to reduce automobile VMT by 264,000 miles, for a total
combined savings of 465,300 VMT (approximately equal to 464,850 VMT in action item’s goal).
283 Gasoline equivalent emissions are calculated from Bridgeport 2007 GHG Inventory, which had gasoline input of 27,018 thousand gallons (U.S) and
diesel input of 5,301 thousand gallons for total input of 32,319 thousand gallons. This Bridgeport Energy Plan assumes a single emissions average for
gasoline and diesel combined. Based on reported emissions of 313,960 MTCO2e for citywide roadway transportation, average roadway emissions equal
0.009714409 metric tons/gallon of “gasoline”. Bridgeport 2007 GHG inventory had input of 475,513,500 gasoline‐powered vehicle miles traveled (VMT)
and 29,061,450 diesel‐powered VMT for total input of 504,574,950 VMT. Average emissions based on Bridgeport citywide roadway VMT for gasoline
and diesel VMT combined, and single fuel consumption figure for gasoline and diesel combined equals 0.000622227 MT per vehicle mile travelled.
284 Gasoline equivalent emissions are calculated from Bridgeport 2007 GHG Inventory, which had gasoline input of 27,018 thousand gallons (U.S) and
diesel input of 5,301 thousand gallons for total input of 32,319 thousand gallons. This Bridgeport Energy Plan assumes a single emissions average for
gasoline and diesel combined. Based on reported emissions of 313,960 MTCO2e for citywide roadway transportation, average roadway emissions equal
0.009714409 metric tons CO2e/gallon of “gasoline.” Bridgeport 2007 GHG inventory had input of 475,513,500 gasoline‐powered vehicle miles traveled
(VMT) and 29,061,450 diesel‐powered VMT for total input of 504,574,950 VMT. Average emissions based on Bridgeport citywide roadway VMT for
gasoline and diesel VMT combined, and single fuel consumption figure for gasoline and diesel combined equals 0.000622227 MTCO2e per vehicle mile
travelled.
285 Dollar savings are calculated using 2010 utility costs of $0.24/kWh electricity (includes all fees); $9.18/thousand cf natural gas for
commercial/industrial and $14.81/thousand cf natural gas for residential; $2.65/ gallon #2 light fuel oil; $3.00/gallon gasoline/diesel (assumes 1 average
price per gallon); $0.00735/ gallon water residential supply and $0.005/gallon water commercial/industrial supply; $0.002166/gallon cost to residents
and businesses for water treatment; $0.00018/gallon cost to utility associated with electricity to supply water; $0.000234/gallon cost associated with
electricity used to WPCA to treat water.

Bridgeport Energy Efficiency and Conservation Plan 177
286 Dollar savings are calculated using 2010 utility costs of $0.24/kWh electricity (includes all fees); $9.18/thousand cf natural gas for
commercial/industrial and $14.81/thousand cf natural gas for residential; $2.65/ gallon #2 light fuel oil; $3.00/gallon gasoline/diesel (assumes 1 average
price per gallon); $0.00735/ gallon water residential supply and $0.005/gallon water commercial/industrial supply; $0.002166/gallon cost to residents
and businesses for water treatment; $0.00018/gallon cost to utility associated with electricity to supply water; $0.000234/gallon cost associated with
electricity used to WPCA to treat water.
287 Input data for Bridgeport 2007 GHG Inventory, RPA, 2008 was gallons of gasoline or gallons of diesel, and VMT was derived from these inputs.
288 Gasoline equivalent emissions are calculated from Bridgeport 2007 GHG Inventory, which had gasoline input of 27,018 thousand gallons (U.S) and
diesel input of 5,301 thousand gallons for total input of 32,319 thousand gallons. This Bridgeport Energy Plan assumes a single emissions average for
gasoline and diesel combined. Based on reported emissions of 313,960 MTCO2e for citywide roadway transportation, average roadway emissions equal
0.009714409 metric tons CO2e/gallon of “gasoline.” Bridgeport 2007 GHG inventory had input of 475,513,500 gasoline‐powered vehicle miles traveled
(VMT) and 29,061,450 diesel‐powered VMT for total input of 504,574,950 VMT. Average emissions based on Bridgeport citywide roadway VMT for
gasoline and diesel VMT combined, and single fuel consumption figure for gasoline and diesel combined equals 0.000622227 MTCO2e per vehicle mile
travelled.
289 Dollar savings are calculated using 2010 utility costs of $0.24/kWh electricity (includes all fees); $9.18/thousand cf natural gas for
commercial/industrial and $14.81/thousand cf natural gas for residential; $2.65/ gallon #2 light fuel oil; $3.00/gallon gasoline/diesel (assumes 1 average
price per gallon); $0.00735/ gallon water residential supply and $0.005/gallon water commercial/industrial supply; $0.002166/gallon cost to residents
and businesses for water treatment; $0.00018/gallon cost to utility associated with electricity to supply water; $0.000234/gallon cost associated with
electricity used to WPCA to treat water.
290 Fuel savings and emissions from this measure were calculated with Clean Air and Climate Protection (CACP) software, developed by the National
Association of Clean Air Agencies (formerly STAPPA and ALAPCO), ICLEI‐Local Governments for Sustainability (formerly International Cities for Local
Environmental Action (ICLEI)), and Torrie Smith Associates Inc. Default values for software are 0.009393 metric tons CO2e/gallon gasoline and 0.009791
metric tons CO2e/gallon diesel. This action uses 12,000 VMT input per vehicle. Fuel savings are reported in gasoline equivalent savings, and do not split
into gasoline savings and CNG increased consumption.
291 Dollar savings are calculated using 2010 utility costs of $0.24/kWh electricity (includes all fees); $9.18/thousand cf natural gas for
commercial/industrial and $14.81/thousand cf natural gas for residential; $2.65/ gallon #2 light fuel oil; $3.00/gallon gasoline/diesel (assumes 1 average
price per gallon); $0.00735/ gallon water residential supply and $0.005/gallon water commercial/industrial supply; $0.002166/gallon cost to residents
and businesses for water treatment; $0.00018/gallon cost to utility associated with electricity to supply water; $0.000234/gallon cost associated with
electricity used to WPCA to treat water.
292 Center for Neighborhood Technology, 2008, Chicago Greenhouse Gas Emissions: An Inventory, Forecast, and Mitigation Analysis for Chicago and the
Metropolitan Region; An assessment prepared for the City of Chicago; http://www.chicagoclimateaction.org/filebin/pdf/FINALALL091708_1‐118.pdf.
293 2010 CEAB Procurement Plan, CEAB Technical Paper: Emerging Technologies http://www.ctenergy.org/pdf/2010CEABPPPart4b1.pdf.
294 2010 CEAB Procurement Plan, CEAB Technical Paper: Emerging Technologies http://www.ctenergy.org/pdf/2010CEABPPPart4b1.pdf.
295 Enviro Express, conversation.
296 Fuel savings and emissions from this measure were calculated with Clean Air and Climate Protection (CACP) software, developed by the National
Association of Clean Air Agencies (formerly STAPPA and ALAPCO), ICLEI‐Local Governments for Sustainability (formerly International Cities for Local
Environmental Action (ICLEI)), and Torrie Smith Associates Inc. Default values for software are 0.009393 metric tons CO2e/gallon gasoline and 0.009791
metric tons CO2e/gallon diesel. Upon recommendation of ICLEI, Bridgeport GHG Inventory conducted for calendar year 2007 used Egrid Subregion 1 –
NPCC New England coefficient figures for 2004 as follows: CO2 908.9 lbs/MWH; N20 0.015 lbs/MWH; CH4 0.080 lbs/MWH and criteria air pollutants as
follows: NOX 0.677 lbs/MWH; SOX 1.262 lbs/MWH; CO 1.216 lbs/MWH; VOC 0.136 lbs/MWH; PM10 0.982 lbs/MWH. Electricity emissions are calculated
from Bridgeport GHG Inventory, which had input of 762,419,176 total kWh community‐wide and reported 316,511 MTCO2e of electricity‐related
emissions community‐wide for average of 0.000415141 MTCO2e/kWh. This action uses 12,000 VMT input per vehicle. Fuel savings are reported in
gasoline equivalent savings, and do not split into gasoline savings and kWh electricity increased consumption.

Bridgeport Energy Efficiency and Conservation Plan 178
297 Dollar savings are calculated using 2010 utility costs of $0.24/kWh electricity (includes all fees); $9.18/thousand cf natural gas for
commercial/industrial and $14.81/thousand cf natural gas for residential; $2.65/ gallon #2 light fuel oil; $3.00/gallon gasoline/diesel (assumes 1 average
price per gallon); $0.00735/ gallon water residential supply and $0.005/gallon water commercial/industrial supply; $0.002166/gallon cost to residents
and businesses for water treatment; $0.00018/gallon cost to utility associated with electricity to supply water; $0.000234/gallon cost associated with
electricity used to WPCA to treat water.
298 Fuel savings are based on information generated by Clean Air and Climate Protection (CACP) software, developed by the National Association of Clean
Air Agencies (formerly STAPPA and ALAPCO), ICLEI‐Local Governments for Sustainability (formerly International Cities for Local Environmental Action
(ICLEI)), and Torrie Smith Associates Inc. and do not provide detailed split of gasoline savings and increased kWh purchase. Energy savings and cost
savings are based solely on gasoline equivalents and gasoline cost of $3.00/gallon.
2992010 CEAB Procurement Plan, CEAB Technical Paper: Emerging Technologies http://www.ctenergy.org/pdf/2010CEABPPPart4b1.pdf .
300 2010 CEAB Procurement Plan, CEAB Technical Paper: Emerging Technologies http://www.ctenergy.org/pdf/2010CEABPPPart4b1.pdf.
301 2010 CEAB Procurement Plan, CEAB Technical Paper: Emerging Technologies http://www.ctenergy.org/pdf/2010CEABPPPart4b1.pdf.
302 2010 CEAB Procurement Plan, CEAB Technical Paper: Emerging Technologies http://www.ctenergy.org/pdf/2010CEABPPPart4b1.pdf.
303 Fuel savings and emissions reductions are based on information generated by Clean Air and Climate Protection (CACP) software, developed by the
National Association of Clean Air Agencies (formerly STAPPA and ALAPCO), ICLEI‐Local Governments for Sustainability (formerly International Cities for
Local Environmental Action (ICLEI)), and Torrie Smith Associates Inc. Per vehicle energy and emissions savings are based on 12,000 annual VMT per
vehicle and shift from 18.4 mpg to 24 mpg for average passenger vehicle.
304 This is approximately 100 five mile “thru” trips, if 6 mile Route 8/25 trip is averaged with 4 mile Route I95 trip. Reducing emissions in 110,000,000 5‐
mile thru trips per year is equivalent to reducing emissions in 301,370 thru trips per day. This number of trips exceeds current Route 8/25 and I95 trip
number, but citywide VMT is projected by this Bridgeport Energy Plan to increase with upward trend of 19.90% by 2030 (derived from State of
Connecticut sector emissions trends for years 1990 to 2007 and comparison of 5‐year averages of 1990‐1994 and 2003‐2007).
305 Dollar savings are calculated using 2010 utility costs of $0.24/kWh electricity (includes all fees); $9.18/thousand cf natural gas for
commercial/industrial and $14.81/thousand cf natural gas for residential; $2.65/ gallon #2 light fuel oil; $3.00/gallon gasoline/diesel (assumes 1 average
price per gallon); $0.00735/ gallon water residential supply and $0.005/gallon water commercial/industrial supply; $0.002166/gallon cost to residents
and businesses for water treatment; $0.00018/gallon cost to utility associated with electricity to supply water; $0.000234/gallon cost associated with
electricity used to WPCA to treat water.
306 Savings calculation of gasoline savings is based on a shift from 18.4 mpg to 24 mpg. This shift saves 63 gallons of gasoline for every 5,000 vehicle miles
travelled. Cost savings are calculated at $3 per gallon.
307 MSW incinerated and recycled tonnage from Bridgeport 2007 GHG Inventory, RPA, 2008, with input from Bridgeport Public Facilities Recycling and
RESCO.
308 Emissions calculated for Bridgeport 2007 GHG Inventory using Clean Air and Climate Protection (CACP) software, developed by the National
Association of Clean Air Agencies (formerly STAPPA and ALAPCO), ICLEI‐Local Governments for Sustainability (formerly International Cities for Local
Environmental Action (ICLEI)), and Torrie Smith Associates Inc. (Bridgeport 2007 GHG Inventory, RPA, 2008)
309 See Appendix for calculations associated with projections related to recycling and associated emissions. Recycling projections for Bridgeport assume a
population increase from 137, 463 to 151,740 (increase of 14,277 persons) between 2007 to 2030 under the Low Growth scenario and a population
increase to 162,463 persons (increase of 25,000 persons over 2007 baseline, and increase of 10,723 over Low Growth projected population) under the
High Growth scenario.
310 Full implementation is targeted to a 2015 completion, but percentages noted in this implementation schedule include certain action beyond 2015 to
account for future household creation under the Low Growth scenario.
311 Cost savings for recycling result from savings of tipping fee at incineration facility equal to $63/ton MSW.

Bridgeport Energy Efficiency and Conservation Plan 179
312 Cost savings for recycling result from savings of tipping fee at incineration facility equal to $63/ton MSW.
313 In less than a year, Stamford, CT increased municipal recycling tonnage 39%, as a result of a switch to single stream. Magdalene Perez, Single‐stream
system lifts recycling 39 percent in Stamford, The Stamford Advocate, July 26, 2010.
314 Center for Neighborhood Technology, 2008, Chicago Greenhouse Gas Emissions: An Inventory, Forecast, and Mitigation Analysis for Chicago and the
Metropolitan Region; An assessment prepared for the City of Chicago; http://www.chicagoclimateaction.org/filebin/pdf/FINALALL091708_1‐118.pdf).
315 Aquarion reports 2010 average residential customer usage in Bridgeport of 105,000 gallons of water, which is down from 2007 average residential
customer usage of 111,200 gallons.
316 2007 Households derived from CT State Data Center: Rodriguez, Orlando, 2007. Bridgeport, CT Population Projection from 2010 to 2030 by Age,
Ethnicity and Sex Distributions, Connecticut State Data Center, University of Connecticut, Storrs, Connecticut, and assuming linear growth between 2005
and 2010.
317 This action assumes installation of one low flow showerhead, which represents a switch from an average of 4 GPM to 2.2 GPR rate of flow.
318 Energy required to treat water through Bridgeport’s water treatment system is calculated from the following: total electricity used by Bridgeport
WPCA in 2007 (WPCA for Bridgeport 2007 GHG Inventory input) equaled 16,836,833 kWh and average flow for total system equaled 29.5 million gallons
per day, which equals 10,767,500,000 gallons per year, for average of 0.001563672 kWh/gallon of water required for water treatment. Energy used for
water supply is calculated from customer usage figures from Aquarion, which reports 111,200 gallons/residential customer usage in 2007 and 105,000
gallons/residential customer usage in 2010. System‐wide, Aquarion reports energy required to supply and distribute water averages 1,200 kWh/million
gallons water (=0.0012 kWh/gallon). Combined energy requirement for supply/distribution and treatment is the sum of these two numbers, which
equals 0.002763672 kWh/gallon. Electricity savings are calculated based upon water savings reported in UI and CL&P Program Savings Documentation
for 2010 Program Year, pages 161‐162, which equal 4,271 gallons/showerhead per year.
319 Upon recommendation of ICLEI, Bridgeport GHG Inventory conducted for calendar year 2007 used Egrid Subregion 1 – NPCC New England coefficient
figures for 2004 as follows: CO2 908.9 lbs/MWH; N20 0.015 lbs/MWH; CH4 0.080 lbs/MWH and criteria air pollutants as follows: NOX 0.677 lbs/MWH;
SOX 1.262 lbs/MWH; CO 1.216 lbs/MWH; VOC 0.136 lbs/MWH; PM10 0.982 lbs/MWH. Bridgeport inventory had input of 762,419,176 total kWh
community‐wide and reported 316,511 MTCO2e of electricity‐related emissions for community‐wide average of 0.000415141 MTCO2e/kWh. Electricity
emissions savings are calculated based upon this coefficient.
320 Energy savings recorded here are only for energy required for supply and treatment of water. See the Green Buildings section of this Bridgeport
Energy plan for energy and emissions savings related to decreased fuel use resulting from efficient appliances. Water savings potential from Low Flow
Showerhead installation are from UI and CL&P Program Savings Documentation for 2010 Program Year, pages 161‐162: HES and Low Income; average 4
to 2.2 GPM low flow showerheads, water savings equals 4,271 gallons/year per head.
321 Water, water‐related‐energy savings, and emissions savings reported in this Water Resources section of the Bridgeport Energy Plan may result from
actions detailed in separate parts of this energy plan.
322 Assumes installation of two faucet aerators which each reduce flow from 2.2 to 1.5 GPM.
323 Energy required to treat water through Bridgeport’s water treatment system is calculated from the following: total electricity used by Bridgeport
WPCA in 2007 (WPCA for Bridgeport 2007 GHG Inventory input) equaled 16,836,833 kWh and average flow for total system equaled 29.5 million gallons
per day, which equals 10,767,500,000 gallons per year, for average of 0.001563672 kWh/gallon of water required for water treatment. Energy used for
water supply is calculated from customer usage figures from Aquarion, which reports 111,200 gallons/residential customer usage in 2007 and 105,000
gallons/residential customer usage in 2010. System‐wide, Aquarion reports energy required to supply and distribute water averages 1,200 kWh/million
gallons water (=0.0012 kWh/gallon). Combined energy requirement for supply/distribution and treatment is the sum of these two numbers, which
equals 0.002763672 kWh/gallon. Electricity savings are calculated based upon water savings reported in UI and CL&P Program Savings Documentation
for 2010 Program Year, pages 163‐164, which equals 255.5 gallons per aerator per year.
324 Upon recommendation of ICLEI, Bridgeport GHG Inventory conducted for calendar year 2007 used Egrid Subregion 1 – NPCC New England coefficient
figures for 2004 as follows: CO2 908.9 lbs/MWH; N20 0.015 lbs/MWH; CH4 0.080 lbs/MWH and criteria air pollutants as follows: NOX 0.677 lbs/MWH;
SOX 1.262 lbs/MWH; CO 1.216 lbs/MWH; VOC 0.136 lbs/MWH; PM10 0.982 lbs/MWH. Bridgeport inventory had input of 762,419,176 total kWh

Bridgeport Energy Efficiency and Conservation Plan 180
community‐wide and reported 316,511 MTCO2e of electricity‐related emissions for community‐wide average of 0.000415141 MTCO2e/kWh. Electricity
emissions savings are calculated based upon this coefficient.
325 Energy savings recorded here are only for energy required for supply and treatment of water. See the Green Buildings section of this Bridgeport
Energy plan for energy and emissions savings related to decreased fuel use resulting from efficient appliances. Water savings potential from faucet
aerator installation is from UI and CL&P Program Savings Documentation for 2010 Program Year, pages 163‐164: Faucet Aerator 2.2 to 1.5 GPM water
savings gallons/year/faucet; water savings equals 255.5 gallons per aerator.
326 Rounding accounts for numerical difference.
327 Electricity savings and related emissions reduction calculated from assumed water savings of 10,237 gallons/year per fixture for change out of 3.5
gallons fixture to 1.6 gallon fixture. This assumes water savings of 3,541 gallons/person/year and 2.89 persons per household.
328 Energy required to treat water through Bridgeport’s water treatment system is calculated from the following: total electricity used by Bridgeport
WPCA in 2007 (WPCA for Bridgeport 2007 GHG Inventory input) equaled 16,836,833 kWh and average flow for total system equaled 29.5 million gallons
per day, which equals 10,767,500,000 gallons per year, for average of 0.001563672 kWh/gallon of water required for water treatment. Energy used for
water supply is calculated from customer usage figures from Aquarion, which reports 111,200 gallons/residential customer usage in 2007 and 105,000
gallons/residential customer usage in 2010. System‐wide, Aquarion reports energy required to supply and distribute water averages 1,200 kWh/million
gallons water (=0.0012 kWh/gallon). Combined energy requirement for supply/distribution and treatment is the sum of these two numbers, which
equals 0.002763672 kWh/gallon. Electricity savings for this action are calculated based upon assumed water savings of 10,237 gallons/fixture/year.
329 Upon recommendation of ICLEI, Bridgeport GHG Inventory conducted for calendar year 2007 used Egrid Subregion 1 – NPCC New England coefficient
figures for 2004 as follows: CO2 908.9 lbs/MWH; N20 0.015 lbs/MWH; CH4 0.080 lbs/MWH and criteria air pollutants as follows: NOX 0.677 lbs/MWH;
SOX 1.262 lbs/MWH; CO 1.216 lbs/MWH; VOC 0.136 lbs/MWH; PM10 0.982 lbs/MWH. Bridgeport inventory had input of 762,419,176total kWh
community‐wide and reported 316,511 MTCO2e of electricity‐related emissions for community‐wide average of 0.000415141 MTCO2e/kWh. Electricity
emissions savings are calculated based upon this coefficient.
330 Water savings of 10,237 gallons/year per fixture for change out of 3.5 gallons fixture to 1.6 gallon fixture are calculated based upon 3,541
gallons/person/years savings and 2.89 persons per household (DeOreo, et. al. 2001, H2ouse website, “Toilet water use rates, non‐ conserving and
conserving homes,” reports a 9.7 gallon reduction per person per day, resulting from shift from 3.6 gallon/flush to 1.54 gallon/flush). Household number
derived from Bridgeport 2007 population of 137,463 and household number of 47,543 from Connecticut Data Center (Rodriguez, Orlando, 2007.
Bridgeport, CT Population Projection from 2010 to 2030 by Age, Ethnicity and Sex Distributions, Connecticut State Data Center, University of
Connecticut, Storrs, Connecticut, and assuming linear growth between 2005 and 2010).
331 This represents 50% of households (2007 Households derived from CT State Data Center: Rodriguez, Orlando, 2007. Bridgeport, CT Population
Projection from 2010 to 2030 by Age, Ethnicity and Sex Distributions, Connecticut State Data Center, University of Connecticut, Storrs, Connecticut, and
assuming linear growth between 2005 and 2010).
332 Rounding contributes to difference in total.
333Energy required to treat water through Bridgeport’s water treatment system is calculated from the following: total electricity used by Bridgeport
WPCA in 2007 (WPCA for Bridgeport 2007 GHG Inventory input) equaled 16,836,833 kWh and average flow for total system equaled 29.5 million gallons
per day, which equals 10767500000 gallons per year, for average of 0.001563672 kWh/gallon of water required for water treatment. Energy used for
water supply is calculated from customer usage figures from Aquarion, which reports 111,200 gallons/residential customer usage in 2007 and 105,000
gallons/residential customer usage in 2010. System‐wide, Aquarion reports energy required to supply and distribute water averages 1,200 kWh/million
gallons water (=0.0012 kWh/gallon). Combined energy requirement for supply/distribution and treatment is the sum of these two numbers, which
equals 0.002763672 kWh/gallon. Electricity savings are calculated based upon water savings reported in UI and CL&P Program Savings Documentation
for 2010 Program Year, pages 123‐125: equals 5.598 gallons/year.
334 Upon recommendation of ICLEI, Bridgeport GHG Inventory conducted for calendar year 2007 used Egrid Subregion 1 – NPCC New England coefficient
figures for 2004 as follows: CO2 908.9 lbs/MWH; N20 0.015 lbs/MWH; CH4 0.080 lbs/MWH and criteria air pollutants as follows: NOX 0.677 lbs/MWH;
SOX 1.262 lbs/MWH; CO 1.216 lbs/MWH; VOC 0.136 lbs/MWH; PM10 0.982 lbs/MWH. Bridgeport inventory had input of 762,419,176total kWh

Bridgeport Energy Efficiency and Conservation Plan 181
community‐wide and reported 316,511 MTCO2e of electricity‐related emissions for community‐wide average of 0.000415141 MTCO2e/kWh. Electricity
emissions savings are calculated based upon this coefficient.
335 Energy savings recorded here are only for energy required for supply and treatment of water. See the Green Buildings section of this Bridgeport
Energy plan for energy and emissions savings related to decreased fuel use resulting from efficient appliances. Water savings potential from clothes
washer trade‐in are from UI and CL&P Program Savings Documentation for 2010 Program Year, pages123‐125: Clothes Washer (Retail Products, HES &
Low Income) annual difference between old and new Energy Star (July 2009) for Early Retirement gross Annual Savings Water Heater and Dryer Fuel
Type Unknown i.e. Retail Sales. This Energy Report uses this single year figure for all annual savings figures, and does not include a separate early
retirement savings; water savings equals 5.598 gallons/year.
336 Rounding contributes to difference in total.
337 Aquarion reports kits include aerator, dye tablets to check for leaks, bags for leak check, and informational brochure on water conservation
measures.
338 This action assumes 40% water savings potential based on USGBC reports (U.S. Green Building Council, Why Build Green?
http://www.usgbc.org/DisplayPage.aspx?CMSPageID=1720)
339 Energy required to treat water through Bridgeport’s water treatment system is calculated from the following: total electricity used by Bridgeport
WPCA in 2007 (WPCA for Bridgeport 2007 GHG Inventory input) equaled 16,836,833 kWh and average flow for total system equaled 29.5 million gallons
per day, which equals 10767500000 gallons per year, for average of 0.001563672 kWh/gallon of water required for water treatment. Energy used for
water supply is calculated from customer usage figures from Aquarion, which reports 111,200 gallons/residential customer usage in 2007 and 105,000
gallons/residential customer usage in 2010. System‐wide, Aquarion reports energy required to supply and distribute water averages 1,200 kWh/million
gallons water (=0.0012 kWh/gallon). Combined energy requirement for supply/distribution and treatment is the sum of these two numbers, which
equals 0.002763672 kWh/gallon. Electricity savings are calculated based upon water consumption as follows: 2007 water consumption equals 111,200
gallons average/residential customer (Aquarion). 2007 Bridgeport population equals 137,463 in 47543 households (Household number based on
Connecticut State Data Center data (Rodriguez, Orlando, 2007. Bridgeport, CT Population Projection from 2010 to 2030 by Age, Ethnicity and Sex
Distributions, Connecticut State Data Center, University of Connecticut, Storrs, Connecticut, and assuming linear growth between 2005 and 2010)) for
2.89 persons/household and average consumption of 38,460 gallons/person per year. Forty percent savings for 7,623 households equals 339,058,391
gallons/year (0.4 X 7,623 households X 111,200 gallons/household) or per household savings of 44,480 gallons/year. Savings in 80% of these households
equals 271,246,713 gallons/year. Forty percent savings for 8,000 households equals 44,480 gallons/household per year X 8,000 = 355,840,000 gallons.
Savings for this action are applied to 80% of the High Growth, for savings of 284,672,000 gallons/year. Note: this Sub Action relies on 2007 consumption
figures and per household population figures only, even though Bridgeport’s 2010 household consumption data of 105,000 gallons/residential customer
(Aquarion) indicates a decline and household population projections also indicate an expected decline from 2007 figure of 2.89 persons/household
(from population of 137,463 and 47,543 households (Connecticut State Data Center data (Rodriguez, Orlando, 2007, Bridgeport, CT Population
Projection from 2010 to 2030 by Age, Ethnicity and Sex Distributions, Connecticut State Data Center, University of Connecticut, Storrs, Connecticut, and
assuming linear growth between 2005 and 2010)) to 2.75 persons/household (from population projection of 151,740 and 55,166 households (Rodriguez,
Orlando, 2007; Bridgeport, CT Population Projection from 2010 to 2030 by Age, Ethnicity and Sex Distributions, Connecticut State Data Center,
University of Connecticut, Storrs, Connecticut, and assuming linear growth between 2005 and 2010).
340 Upon recommendation of ICLEI, Bridgeport GHG Inventory conducted for calendar year 2007 used Egrid Subregion 1 – NPCC New England coefficient
figures for 2004 as follows: CO2 908.9 lbs/MWH; N20 0.015 lbs/MWH; CH4 0.080 lbs/MWH and criteria air pollutants as follows: NOX 0.677 lbs/MWH;
SOX 1.262 lbs/MWH; CO 1.216 lbs/MWH; VOC 0.136 lbs/MWH; PM10 0.982 lbs/MWH. Bridgeport inventory had input of 762,419,176 total kWh
community‐wide and reported 316,511 MTCO2e of electricity‐related emissions for community‐wide average of 0.000415141 MTCO2e/kWh. Electricity
emissions savings are calculated based upon this coefficient.
341 Energy savings recorded here are only for energy required for supply and treatment of water. See the Green Buildings section of this Bridgeport
Energy plan for energy and emissions savings related to decreased fuel use resulting from other aspects of Green Building actions.
342 Low Growth projection of 47,543 households derived from Connecticut State Data Center data (Rodriguez, Orlando, 2007; Bridgeport, CT Population
Projection from 2010 to 2030 by Age, Ethnicity and Sex Distributions, Connecticut State Data Center, University of Connecticut, Storrs, Connecticut, and
assuming linear growth between 2005 and 2010); additional households for High Growth reflects possible household additions from increased

Bridgeport Energy Efficiency and Conservation Plan 182
development predominantly in Bridgeport’s urban core, as promoted by Bridgeport Plan of Conservation and Development revised in 2009 and as also
enabled by 2009 revisions to Bridgeport’s zoning regulations.
343 Rounding contributes to difference in total.
344 Greg Kats, Sustainable Building Task Force, “The Cost and Financial Benefits of Green Buildings,” October 2003.
www.ciwmb.ca.gov/GreenBuilding/Design/CostBenefit/Report.pdf.
345 Greg Kats, Massachusetts Technology Collaborative, “Green Building Costs and Financial Benefits,” 2003,
http://www.google.com/search?sourceid=navclient&ie=UTF8&rlz=1T4HPND_en___US236&q=Green+Building+Costs+and+Financial+Benefits.
346 Energy required to treat water through Bridgeport’s water treatment system is calculated from the following: total electricity used by Bridgeport
WPCA in 2007 (WPCA for Bridgeport 2007 GHG Inventory input) equaled 16,836,833 kWh and average flow for total system equaled 29.5 million gallons
per day, which equals 10,767,500,000 gallons per year, for average of 0.001563672 kWh/gallon of water required for water treatment.
347 Upon recommendation of ICLEI, Bridgeport GHG Inventory conducted for calendar year 2007 used Egrid Subregion 1 – NPCC New England coefficient
figures for 2004 as follows: CO2 908.9 lbs/MWH; N20 0.015 lbs/MWH; CH4 0.080 lbs/MWH and criteria air pollutants as follows: NOX 0.677 lbs/MWH;
SOX 1.262 lbs/MWH; CO 1.216 lbs/MWH; VOC 0.136 lbs/MWH; PM10 0.982 lbs/MWH. Bridgeport inventory had input of 762,419,176 total kWh
community‐wide and reported 316,511 MTCO2e of electricity‐related emissions for community‐wide average of 0.000415141 MTCO2e/kWh. Electricity
emissions savings are calculated based upon this coefficient.
348 This action assumes capture and 100% infiltration of 20 inches of precipitation, which is less than 50% of Bridgeport annual average precipitation of
44.15 inches. Calculations are based on the average residential flat roof size of 1,216 square feet (Bridgeport Tax Assessor data): (1,216 square feet) X
(144 square inches/square foot) X (20 inches precipitation) = (175,061) X (20) = 3,501,223 cubic inches water. Converting to gallons: (3,501,223 cubic
inches water)/231 = 15,156.81 gallons per roof per year under given capture assumptions.
349 Energy required to treat water through Bridgeport’s water treatment system is calculated from the following: total electricity used by Bridgeport
WPCA in 2007 (WPCA for Bridgeport 2007 GHG Inventory input) equaled 16,836,833 kWh and average flow for total system equaled 29.5 million gallons
per day, which equals 10,767,500,000 gallons per year, for average of 0.001563672 kWh/gallon of water required for water treatment.
350 Upon recommendation of ICLEI, Bridgeport GHG Inventory conducted for calendar year 2007 used Egrid Subregion 1 – NPCC New England coefficient
figures for 2004 as follows: CO2 908.9 lbs/MWH; N20 0.015 lbs/MWH; CH4 0.080 lbs/MWH and criteria air pollutants as follows: NOX 0.677 lbs/MWH;
SOX 1.262 lbs/MWH; CO 1.216 lbs/MWH; VOC 0.136 lbs/MWH; PM10 0.982 lbs/MWH. Bridgeport inventory had input of 762,419,176 total kWh
community‐wide and reported 316,511 MTCO2e of electricity‐related emissions for community‐wide average of 0.000415141 MTCO2e/kWh. Electricity
emissions savings are calculated based upon this coefficient.
351 This action assumes capture and 100% infiltration of 20 inches of precipitation, which is less than 50% of Bridgeport annual average precipitation of
44.15 inches. Calculations are based on the average usable residential pitched roof size of 1,248 square feet. Bridgeport Tax Assessor data shows
average footprint for pitched roof residential buildings as 1,103 square feet. Surface area of the roof is calculated to reflect greater catchment potential
over a flat roof with similar “footprint”, but no adjustment is made for varying roofing materials (see Office of the State Engineer, State of New Mexico,
Chapter 7 Water Collection, http://www.ose.state.nm.us/water‐info/conservation/pdf‐manuals/Roof‐Reliant‐Landscaping/RRL‐Chapter‐7.pdf ).The
1,248 figure used for this Energy Plan represents the combined roof size of both roof sides, which is calculated to be 1,560 square feet based on 1,103
footprint/roofprint, adjusted downward by 20% to reflect rainfall loss from roof shape. (1,248 square feet) X (144 square inches/square foot) X (20
inches precipitation) = (179,712) X (20) = 3,594,240 cubic inches water. Converting to gallons: (3,594,240 cubic inches water)/231 = 15,559 gallons per
roof per year under given capture assumptions.
352 Materials costs of $3‐$5 per square foot are noted in Connecticut Department of Environmental Protection, Bureau of Water Resources and Land
Reuse, Planning and Standards Division, “Rainfall as a Resource; a Resident’s Guide to Rain Gardens in Connecticut,”
http://www.ct.gov/dep/lib/dep/water/watershed_management/wm_plans/lid/what_is_a_rain_garden.pdf
353 Labor calculations are detailed in following note.
354 Labor calculation for flat roof rain garden assumes the following: 8 man days/100 square feet average labor (an average of 4 installers for 2 days is
assumed average based on case study information presented in “Rain Garden Costs, Case Studies,” Madeline Flahive DiNardo, Agricultural Agent,

Bridgeport Energy Efficiency and Conservation Plan 183
Rutgers Cooperative Extension; http://www.water.rutgers.edu/Rain_Gardens/RGWebsite/FlahiveDiNardo_RGCosts.pdf). Required size for rain garden,
which is 6 inches deep, equals 185 sq ft based on 1,103 square foot average roof size (from Bridgeport Tax Assessor data) sized to collect precipitation
from 1” rain event (contributing roof size/6 is reported as sufficient to collect 1 inch rainfall by UCONN Cooperative Extension, Rain Gardens,
http://www.sustainability.uconn.edu/pdf/raingardenbroch.pdf). Calculating: (185 square feet/100 square feet) X (8 man days/100 square feet) = 14.8
man‐days/site; this employment estimate assumes 15 man‐days per site. Labor calculation for pitched roof residential building is developed based on
the same assumptions and average roof size of 1,216 square feet (derived from Bridgeport Tax Assessor data). Labor required for rain garden on pitched
roof residential property equals (200 square feet/100 square feet) x (8 man‐days per 100 square feet) = 16 man‐days.
355 Energy required to treat water through Bridgeport’s water treatment system is calculated from the following: total electricity used by Bridgeport
WPCA in 2007 equaled 16,836,833 kWh (figure from WPCA for Bridgeport 2007 GHG Inventory input) and average flow for total system equaled 29.5
million gallons per day, which equals 10,767,500,000 gallons per year, for average of 0.001563672 kWh/gallon of water required for water treatment.
This Energy Plan recognizes this single gallon average must be considered a rough figure as many variables impact flow rate, treatment demand and
energy demand.
356 Upon recommendation of ICLEI, Bridgeport GHG Inventory conducted for calendar year 2007 used Egrid Subregion 1 – NPCC New England coefficient
figures for 2004 as follows: CO2 908.9 lbs/MWH; N20 0.015 lbs/MWH; CH4 0.080 lbs/MWH and criteria air pollutants as follows: NOX 0.677 lbs/MWH;
SOX 1.262 lbs/MWH; CO 1.216 lbs/MWH; VOC 0.136 lbs/MWH; PM10 0.982 lbs/MWH. Bridgeport inventory had input of 762,419,176 total kWh
community‐wide and reported 316,511 MTCO2e of electricity‐related emissions for community‐wide average of 0.000415141 MTCO2e/kWh. Electricity
emissions savings are calculated based upon this coefficient.
357 This assumes a 2,500‐gallon collection potential per building per year. Connecticut DEP notes that in the six months from April and September,
Connecticut receives 25 inches of rainfall, and that 1 inch of rain on a 1,000 square foot roof yields 623 gallons of water (Pollution Prevention View;
Connecticut DEP, Summer 2007; http://www.ct.gov/dep/lib/dep/p2/newsletter/p2viewsummer07.pdf).
The proposed formula: ((Roof size in square feet X 623)/1,000) is used for Bridgeport flat roof residential buildings having average footprint of 1,216
square feet to yield 15,148 gallon collection potential. This Bridgeport Energy plan assumes only a 5% capture of this, however, due to expected loss
from too much rain at one time (excess flow that cannot be captured) and incomplete capture during rain events because barrels are already filled.
Review of Bridgeport rain events for parts of two growing seasons (June 2009 to October 2009 and March 2010 to May 2010) showed a significant
number of successive rain events with greater than ¼ inch of rainfall (the amount required to fill a rain barrel from an average roof), which might result
in “non‐capture.” (Bridgeport precipitation –Weather Underground,
http://www.wunderground.com/history/airport/KBDR/2009/6/21/MonthlyHistory.html#calendar).
358 Energy required to treat water through Bridgeport’s water treatment system is calculated from the following: total electricity used by Bridgeport
WPCA in 2007 equaled 16,836,833 kWh (figure from WPCA for Bridgeport 2007 GHG Inventory input) and average flow for total system equaled 29.5
million gallons per day, which equals 10,767,500,000 gallons per year, for average of 0.001563672 kWh/gallon of water required for water treatment.
This Energy Plan recognizes this single gallon average must be considered a rough figure as many variables impact flow rate, treatment demand and
energy demand.
359 Upon recommendation of ICLEI, Bridgeport GHG Inventory conducted for calendar year 2007 used Egrid Subregion 1 – NPCC New England coefficient
figures for 2004 as follows: CO2 908.9 lbs/MWH; N20 0.015 lbs/MWH; CH4 0.080 lbs/MWH and criteria air pollutants as follows: NOX 0.677 lbs/MWH;
SOX 1.262 lbs/MWH; CO 1.216 lbs/MWH; VOC 0.136 lbs/MWH; PM10 0.982 lbs/MWH. Bridgeport inventory had input of 762,419,176 total kWh
community‐wide and reported 316,511 MTCO2e of electricity‐related emissions for community‐wide average of 0.000415141 MTCO2e/kWh. Electricity
emissions savings are calculated based upon this coefficient.
360 This assumes a 2,500‐gallon collection potential per building per year. Connecticut DEP notes that in the six months from April and September,
Connecticut receives 25 inches of rainfall, and that 1 inch of rain on a 1,000 square foot roof yields 623 gallons of water (Pollution Prevention View;
Connecticut DEP, Summer 2007; http://www.ct.gov/dep/lib/dep/p2/newsletter/p2viewsummer07.pdf). The proposed formula: ((Roof size in square
feet X 623)/1,000) is used for Bridgeport pitched roof residential buildings having average footprint of 1,103 square feet to yield 13,743 gallon collection
potential. This Bridgeport Energy plan assumes only a 5% capture of this, however, due to expected loss from too much rain at one time (excess flow
that cannot be captured) and incomplete capture during rain events because barrels are already filled.
361 Bridgeport existing flat roof residential buildings equals 934 and Bridgeport existing pitched roof residential buildings equals 21,932 (Bridgeport Tax
Assessor data).

Bridgeport Energy Efficiency and Conservation Plan 184
362 Labor estimate assumes the following: 0.5 man‐day per barrel installation for hook up and barrel and rain leader modification (or new installation).
363 Energy required to treat water through Bridgeport’s water treatment system is calculated from the following: total electricity used by Bridgeport
WPCA in 2007 equaled 16,836,833 kWh (figure from WPCA for Bridgeport 2007 GHG Inventory input) and average flow for total system equaled 29.5
million gallons per day, which equals 10,767,500,000 gallons per year, for average of 0.001563672 kWh/gallon of water required for water treatment.
This Energy Plan recognizes this single gallon average must be considered a rough figure as many variables impact flow rate, treatment demand and
energy demand.
364 Upon recommendation of ICLEI, Bridgeport GHG Inventory conducted for calendar year 2007 used Egrid Subregion 1 – NPCC New England coefficient
figures for 2004 as follows: CO2 908.9 lbs/MWH; N20 0.015 lbs/MWH; CH4 0.080 lbs/MWH and criteria air pollutants as follows: NOX 0.677 lbs/MWH;
SOX 1.262 lbs/MWH; CO 1.216 lbs/MWH; VOC 0.136 lbs/MWH; PM10 0.982 lbs/MWH. Bridgeport inventory had input of 762,419,176 total kWh
community‐wide and reported 316,511 MTCO2e of electricity‐related emissions for community‐wide average of 0.000415141 MTCO2e/kWh. Electricity
emissions savings are calculated based upon this coefficient.
365 Potential for water capture by green roofs and deferral from Bridgeport water treatment facility is developed based upon full capture of 20 inches of
rain from a single flat roof commercial building but then only includes 65% of water volume to reflect the fact that a certain volume of water may be
detained but not retained and that certain roof space may be set aside for other purposes such as heating and cooling equipment or possibly solar pv
systems. Annual precipitation in Bridgeport is more than double the 20‐inch capture figure upon which calculation is made, but it is believed the 20‐inch
figure better accounts for loss due to events during which precipitation exceeds green roof retention capacity. Modeling studies of Washington D.C.
green roof potential report 80% extensive/20% intensive green roof materials can reduce water discharge by 69%, and also report significant beneficial
impact to reducing rate of runoff from roofs and CSO’s, even at 20% total potential coverage (Deutsch, Barbara et.al., Casey Trees Endowment Fund and
Limno‐Tech, Inc., 2005, Re‐Greening Washington D.C.: A Green Roof Vision Based on Quantifying Storm Water and Air Quality Benefit). Specific to
Bridgeport, 1,531 existing commercial flat roof buildings have a combined footprint equal to 14,843,484 square feet, for an average of 9,695 square
feet/building (Bridgeport Tax Assessor data). Twenty inches of precipitation on an average 9,695 square foot roof is calculated as follows: (roof size in
square feet) X (144 inches/square foot) X 20 inches = cubic inches of water, which is then divided by 231 to yield volume of water in gallons. ((9,695
square feet)X(144 inches/square feet) X (20 inches precipitation) )/231 = 27,922,426/231 = 120,876 gallons of water from 20 inches of precipitation per
year per average size (footprint) commercial building. Assuming 65% rate of capture that leads to complete deferral from water treatment, the volume
of water deferred per building equals 78,570 gallons/building per year.
366 Existing flat roof commercial building number equals 1,531(Bridgeport Tax Assessor data). 460 buildings equal 30% of existing flat‐roof commercial
buildings. 2007 flat roof living area equals 76% of total commercial living area (flat plus non‐flat) (Bridgeport Tax Assessor data). For Low Growth
scenario, assume 14,916 total job increase is split as 500 industrial jobs and 14,416 commercial jobs. Square footage increase is calculated using 1.5
employee/1000 square feet for industrial jobs and 4 employees/1000 square feet for commercial jobs. Increased commercial square footage divided by
Bridgeport average commercial/industrial living space of 17,046 square feet (Bridgeport Tax Assessor data) yields 231 new commercial buildings
projected 2007‐2030 under Low Growth scenario. Assume 76% of new buildings are flat‐roof, so new flat roof C/I building number equals 175 for Low
Growth scenario. Similar calculations yield additional C/I building increase of 195 total buildings under High Growth scenario, based on 27,500 total
projected job increase and assumed split of 922 industrial/26,578 commercial jobs. Assume 76% of 195 additional commercial buildings under High
Growth scenario are flat roof, yielding 148 additional new flat roof CI buildings. Green roofs proposed for 30% of new buildings under Low Growth and
High Growth scenarios.
367 Barbara Deutsch, et. al, Casey Trees Endowment Fund and Limno‐Tech, Inc., Re‐Greening Washington, D.C.: A Green Roof Vision Based on
Quantifying Storm Water and Air Quality Benefits, 8/24/05, http://www.greenroofs.org/resources/greenroofvisionfordc.pdf
368 Washington D.C. green roof subsidy program: D.C. Greenworks; http://www.dcgreenworks.org/index.php?option=com_content&task=view&id=72
369 Energy required to treat water through Bridgeport’s water treatment system is calculated from the following: total electricity used by Bridgeport
WPCA in 2007 equaled 16,836,833 kWh (figure from WPCA for Bridgeport 2007 GHG Inventory input) and average flow for total system equaled 29.5
million gallons per day, which equals 10,767,500,000 gallons per year, for average of 0.001563672 kWh/gallon of water required for water treatment.
This Energy Plan recognizes this single gallon average must be considered a rough figure as many variables impact flow rate, treatment demand and
energy demand.
370 Upon recommendation of ICLEI, Bridgeport GHG Inventory conducted for calendar year 2007 used Egrid Subregion 1 – NPCC New England coefficient
figures for 2004 as follows: CO2 908.9 lbs/MWH; N20 0.015 lbs/MWH; CH4 0.080 lbs/MWH and criteria air pollutants as follows: NOX 0.677 lbs/MWH;

Bridgeport Energy Efficiency and Conservation Plan 185
SOX 1.262 lbs/MWH; CO 1.216 lbs/MWH; VOC 0.136 lbs/MWH; PM10 0.982 lbs/MWH. Bridgeport inventory had input of 762,419,176 total kWh
community‐wide and reported 316,511 MTCO2e of electricity‐related emissions for community‐wide average of 0.000415141 MTCO2e/kWh. Electricity
emissions savings are calculated based upon this coefficient.
371 Potential for water detention and deferral from Bridgeport water treatment facility is developed based upon full capture of 20 inches of rain from a
single flat roof commercial building. Annual precipitation in Bridgeport is more than double the 20‐inch capture figure upon which calculation is made,
but it is believed the 20‐inch figure better accounts for loss due to events during which precipitation exceeds detention/retention capacity. In
Bridgeport, 1,531 existing commercial flat roof buildings have a combined footprint equal to 14,843,484 square feet, for an average of 9,695 square
feet/building (Bridgeport Tax Assessor data). Twenty inches of precipitation on an average 9,695 square foot roof is calculated as follows: (roof size in
square feet) X (144 inches/square foot) X 20 inches = cubic inches of water, which is then divided by 231 to yield volume of water in gallons. ((9,695
square feet) X(144 inches/square feet) X (20 inches precipitation) )/231 = 27,922,426/231 = 120,876 gallons of water from 20 inches of precipitation per
year per average size (footprint) commercial building.
372 Potential for water detention and deferral from Bridgeport water treatment facility is developed based upon full capture of 20 inches of rain from a
single pitched roof commercial building. Annual precipitation in Bridgeport is more than double the 20‐inch capture figure upon which calculation is
made, but it is believed the 20‐inch figure better accounts for loss due to events during which precipitation exceeds detention/retention capacity. In
Bridgeport, 915 existing commercial flat roof buildings have a combined footprint equal to 5,526,364 square feet for an average of 6,040 square
feet/building (Bridgeport Tax Assessor data). Pitched roof “roof print”/surface area is calculated from footprint, assuming 45‐degree pitch to yield
commercial pitched roof average footprint for 1 side of roof equal to 4,269. Commercial pitched roof average roof footprint 2 sides (not basement)
square feet equals 8,540, but this Energy Plan assumes additional 20% loss to account for non‐capture related to roof shape/overhang, etc., to yield
6,832 square feet average. Twenty inches of precipitation on an average 6,832 square foot roof is calculated as follows: (roof size in square feet) X (144
inches/square foot) X 20 inches = cubic inches of water, which is then divided by 231 to yield volume of water in gallons. ((6,832 square feet) X(144
inches/square feet) X (20 inches precipitation) )/231 = 19,676,160/231 = 85,178 gallons of water from 20 inches of precipitation per year per average
size (footprint) commercial building
373 Building count from Bridgeport Tax Assessor data.
374 This estimate assumes 6 inch depth.
375 Labor estimate assumes the following: the average footprint of a flat roof commercial building in Bridgeport equals 9,695 square feet (calculated
from Tax Assessor data). The capture area required for a 1 inch rainfall equals square foot contributing roof area/6 (formula from UCONN Cooperative
Extension, Rain Gardens, http://www.sustainability.uconn.edu/pdf/raingardenbroch.pdf). Calculating, the required detention area for 1 building
equals1, 600 square feet. 8 man days/100 square feet average labor is assumed labor (an average of 4 installers for 2 days is assumed average based on
case study information presented in Rain Garden Costs, Case Studies, Madeline Flahive DiNardo, Agricultural Agent, Rutgers Cooperative Extension;
http://www.water.rutgers.edu/Rain_Gardens/RGWebsite/FlahiveDiNardo_RGCosts.pdf). Calculating 8 man‐days/100 square feet for 9,695 square feet
equals 128 man‐days per site.
376 Labor estimate assumes the following: the average footprint of a flat roof commercial building in Bridgeport equals 6,039 square feet (calculated
from Tax Assessor data). The capture area required for a 1 inch rainfall equals square foot contributing roof area/6 (formula from UCONN Cooperative
Extension, Rain Gardens, http://www.sustainability.uconn.edu/pdf/raingardenbroch.pdf). Calculating, the required detention area for 1 building equals
1,000 square feet. 8 man days/100 square feet average labor is assumed labor (an average of 4 installers for 2 days is assumed average based on case
study information presented in Rain Garden Costs, Case Studies, Madeline Flahive DiNardo, Agricultural Agent, Rutgers Cooperative Extension;
http://www.water.rutgers.edu/Rain_Gardens/RGWebsite/FlahiveDiNardo_RGCosts.pdf). Calculating 8 man‐days/100 square feet for 1,000square feet
equals 80 man‐days per site.
377 The City of Bridgeport has installed permeable paving materials at the Beardsley Zoo and Fairchild Wheeler golf course.
378 This action assumes the creation of a 4‐to‐6‐foot wide vegetative buffer on 5% of City's roadways, or 9.29 miles of roadway (derived from ConnDot
data supplied for Bridgeport 2007 GHG inventory; local, “City‐controlled” roadway total equals 185.8 miles). This action assumes creation of a vegetative
swale 6 inches deep on one side of the street only, or situated as a central swale, and assumes a 50‐foot wide street. Water capture requirement is
calculated as follows: total street surface area of 9.29 miles of roadway, which is 50 feet wide = (50 feet) X (5,280 feet/mile) X (9.29 miles) = 2,452,560

Bridgeport Energy Efficiency and Conservation Plan 186
square feet. Water volume from ½ inch rain falling on given street surface equals (2,452,560 square feet) X (144 inches/square foot) X (0.5 inch) =
176,584,320 cubic inches water. Conversion to gallons: (176,584,320 cubic inches)/231 = 764,434 gallons water. Swale width required to collect an equal
volume of water is calculated as follows, assuming swale is 6 inches deep: (surface area of roadway accepting precipitation) / (6 inch swale depth/1/2
inch precipitation) = (2,452,560)/(12) = 204,380 square feet of space required having 6 inch depth. Determining swale width: (Square feet of potential
bioswale space)/(length of swale) = (204,380 square feet)/(9.29 miles X 5,280 feet/mile) = 4.1666 feet. A 4.17‐foot wide swale in front of 20 houses with
1,000 lineal feet frontage combined, would provide the effective benefit of collecting 623,336 gallons of water. Slightly more than 49 sections of 1,000
lineal feet (40.0512) are required, but this length decreases as swale width increases. This Bridgeport Energy Plan assumes 20 inches of precipitation is
the cumulative total of forty ½ inch rain events.
This action assumes savings based on cumulative saving of forty 1/2inch precipitation events, for a total of 20 inches of precipitation per year. This is less
than half total average annual precipitation, which equals 44.15 inches per year. This Bridgeport Energy Plan assumes certain rain events will exceed
capacity of bioswales associated with complete streets to accept all water, but that all water accepted will benefit water treatment facilities’ capability
to manage water capacity and reduce incidences of stormwater overflows.
379 49 units (groups of 20 households with combined total of 1,000 lineal feet street frontage) fall slightly short of goal due to rounding impact associated
with decimal placement; 50 exceed it.
380 The EPA, National Association of Clean Water Agencies, Natural Resources Defense Council, the Low Impact Development Center, and the Association
of State and Interstate Water Pollution Control Administrators have formalized a collaborative effort to “promote the benefits of using green
infrastructure in protecting drinking water supplies and public health, mitigating overflows from combined and separate sewers and reducing
stormwater pollution, and to encourage the use of green infrastructure by cities and wastewater treatment plants as a prominent component of their
Combined and Separate Sewer Overflow (CSO & SSO) and municipal stormwater (MS4) programs”. (U.S. Environmental Protection Agency, American
Rivers, Association of State and Interstate Water Pollution Control Administrators, National Association of Clean Water Agencies, Natural Resources
Defense Council, The Low Impact Development Center, Managing Wet Weather With Green Infrastructure, Action Strategy 2008,
http://www.epa.gov/npdes/pubs/gi_action_strategy.pdf).