ENERGY EFFICIENCY · 2019-06-26 · Energy Efficiency in California’s Public Power Sector: 11th...
322
E NERGY E FFICIENCY in California’s Public Power Sector 11 th Edition — 2017
Transcript of ENERGY EFFICIENCY · 2019-06-26 · Energy Efficiency in California’s Public Power Sector: 11th...

ENERGY EFF IC I ENCY
in California’s Public Power Sector
11th Edition — 2017
Energy Efficiency in California’s Public Power Sector: 11th Edition — 2017
TABLE OF CONTENTS Acknowledgements 1
Executive Summary 2
Introduction 3
Methodologies 9
Program Results 12
Policy Considerations 17
Appendix A Description of Utility Programs
Appendix B 2018-2027 Energy Efficiency Targets
Navigant Description of the Potential Studies

Energy Efficiency in California’s Public Power Sector: 11th Edition — 2017 1
ACKNOWLEDGEMENTS
This report would not be possible without the substantial contributions of the following individuals: Project Managers: Jonathan Changus, Northern California Power Agency
Bryan Cope, Southern California Public Power Authority Dan Griffiths, California Municipal Utilities Association
Meredith Owens & Kelly Birdwell,
Alameda Municipal Power Phil Hayes, Earl Lasley & Ed Murdock,
Anaheim Public Utilities Paul Reid,
Azusa Light & Water Jim Steffens & Veronica Craghead,
City of Banning Marlee Mattos,
City of Biggs Jeanette Meyer & Kapil Kulkarni,
Burbank Water & Power Jessica Sutorus & Adrianne Rogers,
City of Colton Craig Kuennen & Herbert Garcia,
Glendale Water & Power Meg Patterson,
City of Healdsburg Maritza Nunez, Bob Balzar,
Imperial Irrigation District Theresa Phillips,
Lassen Municipal Utility District Adam Brucker,
City of Lodi Jennifer Main,
City of Lompoc Paul Costa & David Jacot,
Los Angeles Department of Water & Power Vanessa Lara,
Merced Irrigation District Peter Govea & Bob Hondeville,
Modesto Irrigation District Michael McLellan,
City of Moreno Valley Rainie Torrance,
City of Needles Bruce Lesch, Lena Perkins & Dixon Yee,
City of Palo Alto Utilities
Wendy De Leon & Amanda Stevens, Pasadena Water & Power
Vanessa Xie, City of Pittsburg
Corby Erwin, Plumas-Sierra Rural Electric Cooperative
Basil Wong, Port of Oakland
Trina Valdez, City of Rancho Cucamonga
Lowell Watros, Redding Electric Utility
Kevin Palmer & Rebecca Cortez, Riverside Public Utilities
Renee Laffey, Roseville Electric
Rachel Radell-Harris, Sacramento Municipal Utility District
James Hendry & Lori Mitchell, San Francisco Public Utilities Commission
Tom Miller, City of Shasta Lake
Mary Medeiros McEnroe, Silicon Valley Power
Paul Hauser, Trinity Public Utility District
Steven Poncelet & Lauren Schaake Hudson, Truckee Donner Public Utilities District
Willie Manuel & Monique Hampton, Turlock Irrigation District
Anthony Serrano, City of Vernon Light & Power
Marcy Newbern, City of Victorville
Len Viejo, ASTRUM Utility Services
Mark Gosvener & Miranda Boutelle, Efficiency Services Group

Energy Efficiency in California’s Public Power Sector: 11th Edition — 2017 2
EXECUTIVE SUMMARY
California’s publicly owned utilities (POUs) have collaborated since 2006 on evaluating energy efficiency programs and reporting annual results in a consistent and comprehensive manner. This eleventh report explores the latest results from public power’s wide range of energy efficiency programs. During the 2016 reporting cycle, POUs spent over $154 million on programs, resulting in more than 825,000,000 kWh of gross annual energy savings. When added to the total investments since the signing of SB 1037, public power has spent over $1.37 billion on energy efficiency and achieved nearly 63.6 billion kWh in lifecycle energy savings. As a whole public power is becoming more efficient at energy efficiency. From 2014 to 2016, annual energy savings grew by 3.7%, while program costs declined by 11.3%. As the state looks to double the energy savings from energy efficiency by 2030, the ingenuity and collaborative spirit of public power will be even more critical. The continued success of the past year provides an excellent foundation on which public power looks to build upon.

Energy Efficiency in California’s Public Power Sector: 11th Edition — 2017 3
INTRODUCTION
This report reflects public power’s response to a number of key pieces of legislation. Assembly Bill 1890 (Brulte, 1996), infamous for facilitating the Energy Crisis in 2001, also plays a prominent role in California’s energy efficiency legacy. The bill established the Public Goods Charge through which publicly owned utilities (POUs) have funded energy efficiency programs for over two decades. Senate Bill 1037 (Kehoe, 2005) required each POU to report annually to its customers and the Energy Commission on its energy efficiency and demand reduction programs. Assembly Bill 2021 (Levine, 2006) directed each POU to identify all potentially achievable cost-effective, reliable, and feasible electricity efficiency savings and establish 10-year energy efficiency targets. Assembly Bill 2227 (Bradford, 2012) changed the frequency of the 10-year energy efficiency potential studies from once every three years to once every four years to be consistent with the State’s Integrated Energy Planning process. Senate Bill 350 (De León, 2015) required the annual report to include a comparison of actual energy efficiency savings to the annual target adopted in the most recent 10-year potential study. The bill also directed POUs to develop energy efficiency targets consistent with the statewide energy efficiency targets adopted by the Energy Commission.
This report compiles the required data from individual POUs into a single, comprehensive document in compliance with §9505 of the Public Utilities Code. Furthermore, this compilation fosters analysis of broader energy efficiency trends and offers policymakers data-driven considerations regarding the practical impacts of their policies. The purpose of this report is not only to look back on the success of the past year, but also to look ahead and inform discussions on how to achieve additional energy savings in the future.
“Energy eff ic iency i s an endur ing
chal lenge. Ineff ic ient use of energy and
hence waste of money and resources wi l l
mer i t our attent ion for the foreseeable future, and I bel ieve the same
can be said of the threat of c l imate
change.”
Arthur H. Rosenfeld

Energy Efficiency in California’s Public Power Sector: 11th Edition — 2017 4
As California looks to double the energy savings from energy efficiency by 2030, it is critical that policies and programs aim to remove barriers for, and encourage voluntary action by, customers to reduce their energy usage to realize all cost-effective and feasible potential energy savings. Whether the state adopts codes and standards that are more stringent for existing building retrofits or a utility offers rebates for more efficient appliances, the customer is ultimately responsible for the decision to comply, manage, invest, or otherwise implement an energy efficiency measure. This guiding principle of energy efficiency – that the customer is key to savings – drives POU program design and implementation as a natural extension of public power’s broader mission of tailoring utility services to the specific needs of their unique community. Locally elected boards, such as a city council, govern POUs and are accountable to the customers they serve. While harnessing proven global innovations and, in many cases, helping advance emerging technologies, POUs are first and foremost responsive to local concerns regarding energy efficiency programs. California POUs serve a diverse range of customers and communities. Key characteristics include building climate zone, customer class, annual retail sales, and customer economic conditions. Based on these factors, POUs develop energy efficiency programs to
optimize benefits in and for their local communities. Bui lding Cl imate Zones Building climate zones are one of the primary factors driving energy efficiency program design. California is divided into 16 separate and distinct climate zones, defined by multiple factors, including summer temperature range, record temperature highs and lows, annual precipitation, and seasonal differences. POUs are located in 13 of the 16 climate zones, ranging from Truckee Donner PUD over the Sierra Crest to Merced Irrigation District in the heart of the Central Valley to downtown Los Angeles, the nation’s second largest city. Customer heating and cooling needs vary significantly among climate zones. As a result, the energy savings from HVAC retrofits differ dramatically across utilities and climate zones. For example, an HVAC retrofit in the City of Needles in Climate Zone 15 – characterized as extremely hot and dry – yields considerably greater energy savings than a similar HVAC retrofit in a coastal community like Lompoc (Climate Zone 5). The climatic conditions that make for a cost-effective energy efficiency investment in one POU community may not deliver the same energy benefits and cost savings for a similarly situated customer of another POU.
Customers are ultimately responsible for achieving savings from energy efficiency.

Energy Efficiency in California’s Public Power Sector: 11th Edition — 2017 5
Customer Class Customer class (i.e., residential, commercial, industrial) distributions vary from utility to utility, and affects energy efficiency planning and program efforts. Residential customers consumed approximately one-third (33.9%) of all electricity delivered by California POUs in 2015. Traditional programs for residential customers are increasingly not cost-effective. State and federal standards have made modern appliances and HVAC units so efficient that the energy savings from ultra-efficient models compared to base models is much less significant than in previous years. To be clear, there remains a great deal of cost-effective energy efficiency potential in the residential sector. However, significant barriers, including customer access to financing, additional code requirements, and building owner interest, make deeper energy retrofits in the residential sector challenging. The report discusses these barriers further in the Po l i c y Con s i de ra t i o n s section. Non-residential customers consume more energy per account than residential customers do. In 2015, the average POU non-residential account consumed 115.1 megawatt hours; in comparison, the average POU residential customer consumed 7.2 megawatt hours.1 By virtue of their higher usage per account, non-residential customers present the greatest opportunity to achieve cost-effective energy savings.
1 Data from forms EIA-861 and EIA-861S. Available: http://www.eia.gov/electricity/
To deliver a cost-effective portfolio of energy efficiency programs, POUs balance their program offerings for non-residential customers and residential customers. This ensures the portfolio is cost-effective, even if individual programs are not. More importantly, it ensures all customers have access incentives for energy efficiency. Figure 2. Percent of Retail Sales, 2015
Source: U.S. EIA and California Energy Commission

Energy Efficiency in California’s Public Power Sector: 11th Edition — 2017 6
Annual Retai l Sales California is home to POUs of all shapes and sizes. Figure 3 below depicts POU retail sales grouped by size:
• LADWP & SMUD • IRP POUs: the 14 POUs, in addition to
LADWP & SMUD, subject to the Integrated Resource Plan (IRP) provisions of SB 350
• Non-IRP POUs: 23 smallest POUs not subject to the IRP requirements
Figure 3. Retail Sales (MWh), 2015
Source: U.S. EIA and California Energy Commission
At the larger end of the spectrum, Los Angeles Department of Water and Power (LADWP) and Sacramento Municipal Utility District (SMUD) together represent over half (55.1%) of all public power retail sales. On the other end of the spectrum, the 23 smallest POUs constitute about 1/10 of the retail sales of LADWP and SMUD (5.9%). With regard to the total retail sales for the state, including investor owned utilities, the 23 smallest POUs constitute only 1.6% of statewide retail sales. In general, larger utilities serve a more diverse customer base and offer a larger portfolio of incentives and rebates. In contrast, smaller utilities with fewer overall customers and customer types focus on fewer programs that best fit their particular customer needs. Annual retail sales are a relative indicator of a utility’s resources for managing energy efficiency programs. Program administration can be a challenge for smaller utilities with limited resources. In some cases, a POU may have a single staff member manage their energy efficiency programs, among other duties. The collaborative nature of the public power community allows for the development of joint resources and sharing of best practices. CMUA, NCPA, and SCPPA serve as forums for discussing and pursuing projects on behalf of groups of or all POUs. The tools developed to support this report’s compilation are an example of public power collaboration.

Energy Efficiency in California’s Public Power Sector: 11th Edition — 2017 7
Customer Economic Factor s Customer economic factors also inform public power decisions regarding energy efficiency programs. Many POUs serve low-income communities in which unemployment is relatively high and the median income is low. POUs that serve rural communities in the inland and northern parts of the state tend to have higher unemployment rates compared to Bay Area and LA metro areas. Figure 4. Unemployment Rate by POU, 2016
Source: California Employment Development Department
Income is one of the most critical factors influencing the programs a POU offers to its customers. Low-income customers typically have limited disposable funds and access to capital, so higher incentives will be necessary to support low-income customers for energy efficiency improvements. Low-income renters in multifamily dwellings face additional challenges as the building owner, not the customer, frequently determines whether energy retrofits are made to the building. Figure 5. Median Income by POU, 2010-14
Source: U.S. Census Bureau

Energy Efficiency in California’s Public Power Sector: 11th Edition — 2017 8
SB 350 provided a bold vision for California – to double the energy savings from energy efficiency by 2030. This goal is the latest addition to California’s suite of programs advancing energy efficiency. SB 350 identifies a number of these current policies as sources of energy savings, including public power customer programs, needed to achieve the statewide target.
These policies, when coordinated, work together to facilitate customer investments in energy efficiency. Public power actively participates in the many energy efficiency forums to provide perspective from our diverse communities. POUs look forward to continuing to work with the Energy Commission and the growing universe of stakeholders on the successful implementation of these programs.
Public power programs support the statewide effort to double energy savings by 2030.

Energy Efficiency in California’s Public Power Sector: 11th Edition — 2017 9
METHODOLOGIES
This section provides a brief overview of the technical resources and analytical tools used or developed by public power to evaluate its energy efficiency program and develop energy efficiency targets. Database for Energy Ef f icient Resources The California Public Utilities Commission (CPUC) oversees the development of the Database for Energy Efficient Resources (DEER) to provide estimates of energy and peak demand savings values, measure costs, and effective useful life (EUL) for measures. While DEER primarily exists to inform IOU programs, POUs historically relied on DEER for consistency. However, a number of stakeholders, including the IOUs, have expressed concerns with the DEER database in recent years. Due to DEER deficiencies, IOUs increasingly rely upon workpapers that are more representative of their actual results. The DEER database continues to provide energy savings estimates for many measures that align with results from POU EM&V reports. However, for some programs, DEER savings estimates are not consistent with the actual results, so POUs must rely on other sources or studies. Furthermore, the process for updating DEER measures, and the basis for making these changes, is opaque and complex. For more information on DEER, visit the CPUC webpage: http://www.deeresources.com/
Technical Reference Manual Recognizing that the DEER database is not a viable resource for public power to continue to use, in 2013 POUs contracted for the development of a technical reference manual (TRM) modeled after the Northwest Regional Technical Forum resource. Public power retained Energy & Resource Solutions (ERS) to develop the TRM to be used by utilities across the state’s different building climate zones. ERS completed the TRM in 2014 and an update in 2016. The TRM has replaced DEER as the basis for which most POUs calculate the energy savings of their programs. The TRM provides the methods, formulas, and default assumptions used for estimating energy savings and peak demand impacts from energy efficiency measures and projects in a very clear and open format. POUs use the energy savings estimates to report program accomplishments and measure progress towards program goals. Energy efficiency measures are documented and classified as either unit energy savings (UES) measures, semi-custom measures, or custom measures. The TRM includes both nonresidential and residential measures, and presents each measure type in separate sections, grouped by technology type.

Energy Efficiency in California’s Public Power Sector: 11th Edition — 2017 10
The TRM includes the main manual as well as supporting spreadsheets. The TRM also includes spreadsheets that provide detailed and transparent measure calculations and, for semi-custom measures, energy savings calculators for estimating energy savings for project-specific measures. As needed, each section also contains supplementary tables and charts to provide additional measure details. Measures with multiple savings values (savings by size, building use, varying levels of efficiency, etc.) will have both savings and cost data listed in a supplementary table. The last section of the TRM provides the custom measure protocol, which outlines a process for estimating and documenting custom measure savings. The TRM includes energy savings calculators, which are Excel spreadsheet-based engineering models for estimating semi-custom measures per the described methodology. They provide a consistent, transparent, and user-friendly approach for estimating project-specific energy savings. The TRM provides a much higher degree of transparency for public power, policymakers, and interested stakeholders regarding the energy savings estimates underpinning public power’s energy efficiency programs. For more information on the 2016 TRM, visit the CMUA webpage: http://cmua.org/energy-efficiency-technical-resource-manual-2016/ Energy Ef f ic iency Repor ting Tool Energy and Environmental Economics (E3) designed the Energy Efficiency (EE) Reporting Tool for POUs to analyze and report on the
energy savings results from energy efficiency programs. POUs may also use the tool to analyze the savings from potential new programs and determine whether they are likely to prove cost effective. The EE Reporting Tool contains the TRM database of energy efficiency measures. POUs select the measures that reflect their programs and enter the relevant data. E3 designed the EE Reporting Tool to minimize the data input required by the utilities. Relying on default TRM values and assumptions, POUs may enter as little as the number of units installed, the incentive provided to the customer and overhead costs to report meaningful results. Alternatively, utilities may modify or enter their own assumptions and create customized measures that best reflect their programs or service territory. The EE Reporting Tool then provides summary tables by program category that report the units installed, achieved savings, program costs and cost effectiveness. E3 maintains the Distributed Energy Resources Avoided Cost Model and E3 Calculator adopted by the CPUC to report on the cost-effectiveness IOU programs. The EE Reporting Tool is a simplified version of that model that uses the same avoided costs and cost-tests adopted by the CPUC. Avoided costs and EE measure load shapes in the EE Reporting Tool are represented using six time-of-use periods (rather than 8,760 hourly resolution). In addition, the TRM measures are a consolidated and representative subset of the much larger number of measures in the DEER database. Both of these simplifications

Energy Efficiency in California’s Public Power Sector: 11th Edition — 2017 11
make the model much simpler and user-friendly for the diverse range of public power utilities. Electr ic Resource Assessment Model POUs contracted with Navigant Consulting, Inc. (Navigant) to support their efforts to identify all potentially achievable cost-effective electricity efficiency savings and establish annual targets for energy efficiency savings for 2018-2027. Navigant utilized the Electric Resource Assessment Model (ELRAM) to develop estimates of technical, economic, and market potential for each POU. The ELRAM is substantively similar to the Navigant model used by the CPUC to establish annual targets for the IOUs. POUs worked with Navigant in 2012 to develop 2014-2023 annual energy efficiency targets. Navigant used ELRAM for both the 2012 and current targets. The new ELRAM is more powerful in its computational capabilities and agile in its scenario development capabilities. It also now includes a robust and easy to use output viewer, which allows the client to view potential savings estimates in a variety of ways without loading the entire ELRAM. For additional background on the ELRAM and the technical assumptions of the model, see Append ix B . Evaluation, Measurement & Verif ica tion Section 9505(d) of the Public Utilities Code requires each POU to make available to its customers and to the Energy Commission the results of any independent evaluation that measures and verifies the energy efficiency
savings and the reduction in energy demand achieved by its energy efficiency. The Evaluation, Measurement & Verification (EM&V) process used to provide POU program managers with feedback relies on the approaches articulated in the National Action Plan for Energy Efficiency, adopted CPUC protocols, and the innovation and expertise of firms experienced in program evaluation. In addition, public power worked with the Energy Commission to develop a consistent set of EM&V guidelines for third-party consultants retained to evaluate utility programs. EM&V reports help to define the effectiveness of individual programs with the intent of improving future offerings. Key findings from the EM&V reports confirm high realization rates for reported energy savings. This indicates that this annual report provides a reliable source of data to help policymakers gauge the progress of the state’s overall energy efficiency efforts. At the time this report was published, the public power community had made available more than 80 separate EM&V studies. To review the EM&V reports, visit the NCPA webpage: http://www.ncpa.com/policy/reports/emv/ A number of utilities are currently in the process of completing EM&V studies for FY2015-2016 programs. These and other subsequent EM&V reports will be posted to the above URL as they become available.

Energy Efficiency in California’s Public Power Sector: 11th Edition — 2017 12
PROGRAM RESULTS
This section provides an overview of the energy efficiency program results for public power in California. Append ix A contains detailed review of each POU’s program descriptions, expenditures, and energy savings. Most POUs manage programs on a fiscal year basis and programs results reported are for FY 2015-16. For Imperial Irrigation District, Merced Irrigation District, Modesto Irrigation District, Plumas-Sierra REC, SMUD, Truckee Donner PUD, and Turlock Irrigation District, results are for calendar year 2016. Figure 6 provides a comprehensive summary of energy efficiency program savings for all POUs. LADWP alone represents nearly half (49.9%) of the total gross annual energy savings for public power. Figure 7 reviews results by program category. Excluding Codes and Standards, lighting programs once again account for the largest share of the gross annual energy savings (39.2%), although the share of savings attributable to lighting continues to decrease. Two years ago, lighting represented over half (52.5%) of POU program savings (excluding Codes and Standards). At the same time, compared to FY 2013-2014, the total gross annual energy savings (excluding Codes and Standards) has increased by over 20,000,000 kWh, indicating that POU programs are achieving savings “beyond the bulb”.
Figure 8 provides data for the utilities subject to the integrated resource plan requirements of SB 350. These 16 utilities provided 97.3% of the public power’s gross annual energy savings, which is roughly these utilities’ share of POU retail sales (94.1% in CY 2015). Figures 9, 10, and 11 summarize program results since the first annual report in 2006. During the 2016 reporting cycle, POUs spent over $154 million on programs, resulting in more than 825,000,000 kWh of gross annual energy savings. When added to the total investments since the signing of SB 1037, public power has spent over $1.37 billion on energy efficiency and achieved nearly 63.6 billion kWh in lifecycle energy savings. As a whole, public power is becoming more efficient at energy efficiency. From 2014 to 2016, the gross annual energy savings from programs (excluding Codes and Standards) grew by 3.7%, while program costs declined by 11.3%. Driving these trends was increased customer participation in residential and commercial comprehensive programs, such as direct install and whole building retrofits. Customer rebates account for the overwhelming majority of program expenditures (77.1%), with the remaining costs (22.9%) dedicated to utility marketing, administrative and reporting costs, as well as evaluation, measurement, and verification (EM&V) efforts.

Figure 6. Energy Efficiency Program Results by POU, FY 2015-2016*
Energy Efficiency in California’s Public Power Sector: 11th Edition — 2017 13
POU SUMMARY Resource Savings Summary Cost Test Ratios
Utility
Gross Coincident
Peak Savings (kW)
Gross Annual Energy Savings
(kWh)
Gross Lifecycle Energy Savings
(kWh)
Net Coincident Peak Savings
(kW)
Net Annual Energy Savings
(kWh)
Net Lifecycle Energy Savings
(kWh)
Net Lifecycle GHG
Reductions (Tons)
Utility Incentives Cost
($)
Utility Mktg, EM&V, and
Admin Cost ($)
Total Utility Cost ($)
PAC TRC Utility ($/kWh)
Alameda 661 4,572,041 37,218,254 598 4,197,172 32,714,136 18,083 532,761 931,070 1,463,831 2.47 1.42 0.06$ Anaheim 9,299 29,448,778 269,151,224 9,299 29,448,778 269,151,224 162,881 4,731,858 - 4,731,858 8.36 8.36 0.02$
Azusa 919 5,023,330 46,687,959 814 4,323,250 40,376,957 24,154 657,479 228,729 886,208 4.62 2.55 0.03$ Banning 2,110 319,202 3,262,526 1,273 267,488 2,738,384 1,686 97,729 69,751 167,480 2.47 2.22 0.08$
Biggs 18 18,815 28,161 14 14,706 19,284 - 1,391 3,117 4,508 0.14 0.13 0.35$ Burbank 3,156 12,725,118 98,125,833 3,156 12,725,118 98,125,833 59,230 3,033,467 1,472,044 4,505,512 3.30 1.87 0.06$
Colton 742 2,456,418 14,180,949 733 2,425,764 13,908,447 - 475,847 572,678 1,048,524 0.15 0.14 0.10$ Corona 28 126,528 894,640 23 100,786 708,243 420 21,369 283 21,652 4.30 1.18 0.04$
Glendale 10,550 17,925,292 71,745,379 10,518 17,601,880 70,287,446 42,898 1,491,103 109,092 1,600,195 5.87 2.65 0.03$ Gridley 18 217,151 2,330,460 11 167,978 1,767,166 978 61,550 47,633 109,183 1.93 1.36 0.08$
Healdsburg 55 986,602 14,558,125 43 820,306 12,161,783 6,580 286,082 58,800 344,882 3.84 3.29 0.04$ Imperial ID 4,809 29,516,511 146,422,395 3,905 25,950,801 122,309,283 74,770 2,770,630 1,306,396 4,077,026 3.68 1.73 0.05$
LADWP 23,146 412,191,134 7,280,496,830 23,146 412,191,134 7,280,496,830 4,358,319 53,830,873 19,408,944 73,239,817 4.73 2.64 0.02$ Lassen 38 63,808 722,072 28 47,361 536,588 296 21,307 31,661 52,968 1.18 0.91 0.13$
Lodi 334 2,432,062 28,092,962 224 1,841,271 20,817,841 11,339 455,028 393,746 848,774 2.72 1.75 0.05$ Lompoc 8 184,828 2,018,362 6 144,172 1,585,304 876 18,361 67,861 86,222 2.09 0.92 0.07$ Merced 1 1,036,921 7,665,036 0 1,034,086 7,619,247 4,197 85,118 167,000 252,118 3.62 1.53 0.04$
Modesto 2,553 13,602,431 163,526,770 2,025 11,028,723 131,162,715 71,931 2,118,684 1,441,462 3,560,146 4.48 2.10 0.04$ Moreno Valley 211 1,758,388 10,514,510 211 1,521,781 10,235,520 6,369 78,125 59,944 138,069 9.73 2.46 0.02$
Needles 0 4,655 26,300 0 4,655 26,300 16 139,195 4,421 143,616 0.03 0.03 6.49$ Oakland 21 601,866 7,910,004 16 492,953 6,499,906 3,776 36,969 10,158 47,127 20.20 4.67 0.01$
Palo Alto 666 6,729,711 49,428,954 534 5,600,135 39,525,605 - 511,602 1,347,180 1,858,782 1.34 0.78 0.06$ Pasadena 2,411 19,596,302 153,897,739 2,336 19,419,573 151,634,630 90,237 2,921,509 562,618 3,484,128 5.51 2.22 0.03$ Pittsburg 144 483,358 5,373,331 115 386,687 4,298,665 - 47,355 13,120 60,475 0.74 0.15 0.02$
Plumas-Sierra 22 132,074 2,018,276 17 82,873 1,281,807 688 26,018 63,845 89,863 1.35 0.59 0.10$ Rancho Cucamonga 48 171,454 2,740,064 48 171,454 2,740,064 1,589 26,791 32,000 58,791 0.09 0.16 1.54$
Redding 1,511 1,978,635 30,463,668 1,167 1,369,142 20,774,368 12,428 2,822,861 341,254 3,164,115 1.18 1.30 0.19$ Riverside 5,950 16,843,515 248,263,917 5,018 14,598,795 204,801,514 125,544 4,181,940 - 4,181,940 6.43 3.61 0.03$ Roseville 5,554 17,435,256 152,310,641 5,499 17,109,780 148,299,316 - 2,900,946 1,209,220 4,110,166 1.63 1.50 0.03$
Sacramento 35,879 182,532,405 1,403,670,073 35,879 150,076,945 1,154,610,553 447,886 29,328,277 3,158,630 32,486,907 2.65 0.82 0.03$ San Francisco PUC 190 1,099,699 17,260,484 146 1,043,701 16,140,524 8,627 1,094,555 190,315 1,284,870 1.82 0.99 0.12$
Shasta Lake 26 90,638 1,240,321 14 62,660 829,479 461 54,135 52,890 107,025 0.93 0.71 0.18$ Silicon Valley 1,371 21,948,770 300,083,112 560 18,636,212 255,017,701 140,032 2,131,880 1,857,994 3,989,874 6.86 1.07 0.02$
Trinity PUD 1 56,607 566,070 0 33,964 339,642 182 59,400 5,740 65,140 0.52 0.45 0.25$ Truckee Donner 126 1,504,013 21,398,785 95 1,053,606 15,619,455 8,164 396,859 312,974 709,833 2.16 1.96 0.07$
Turlock ID 51 13,603,546 103,562,594 35 13,354,051 100,468,104 55,843 1,108,931 305,591 1,414,522 8.41 2.38 0.02$ Ukiah 34 149,146 1,871,942 27 112,854 1,388,176 774 51,319 41,582 92,901 1.83 1.26 0.09$
Vernon 1,245 7,132,471 15,701,175 389 2,129,871 12,614,888 7,439 196,052 111,566 307,618 5.18 3.36 0.03$ Victorville - - - - - - - - - - - - -$
Summary 113,905 826,699,479 10,715,429,895 107,925 771,592,466 10,253,632,926 5,748,691 $118,805,358 $35,991,310 $154,796,668 4.62 2.49 0.024$
Cost Summary
* Imperial ID, Merced, Modesto, Plumas-Sierra, SMUD, Turlock ID, and Truckee Donner all operate on a calendar year basis; data is for CY 2016.

Figure 7. Energy Efficiency Program Results by Program Category, FY 2015-2016*
Energy Efficiency in California’s Public Power Sector: 11th Edition — 2017 14
POU SUMMARY
Category Units Installed
Gross Coincident
Peak Savings (kW)
Gross Annual Energy
Savings (kWh)
Gross Lifecycle Energy Savings
(kWh)
Net Coincident Peak Savings
(kW)
Net Annual Energy
Savings (kWh)
Net Lifecycle Energy Savings
(kWh)
Net Lifecycle GHG
Reductions (Tons)
Utility Incentives Cost ($)
Utility Mktg, EM&V, and
Admin Cost ($)
Total Utility Cost ($)
Res Clothes Washers 5,640 280 757,267 10,301,598 259 536,742 7,449,794 3,340 270,573 126,708 397,281Res Cooling 83,835 18,437 20,348,256 229,797,439 17,464 15,908,515 173,578,194 98,965 7,015,711 1,589,968 8,605,679
Res Dishwashers 1,605 51 60,287 626,583 43 46,252 483,563 274 111,704 6,894 118,598Res Electronics 1,181 68 228,461 2,216,905 68 184,529 1,799,047 762 39,714 43,008 82,722
Res Heating 115 9 19,839 331,995 8 15,089 257,775 122 16,200 12,637 28,837Res Lighting 1,858,769 13,774 76,682,594 697,117,886 13,234 62,443,509 573,145,666 209,074 6,991,857 1,184,578 8,176,435
Res Pool Pump 11,416 2,427 10,978,110 120,309,857 2,376 10,058,407 109,284,105 58,246 4,391,702 1,855,303 6,247,005Res Refrigeration 15,656 3,105 20,972,993 180,953,063 3,034 19,542,950 173,153,875 93,860 10,210,349 925,836 11,136,186
Res Shell 2,796,958 3,259 13,341,592 365,663,193 2,677 12,518,813 349,777,818 200,669 2,844,982 1,292,392 4,137,374Res Water Heating 2,382 511 687,469 12,050,719 501 521,050 9,346,379 3,961 214,952 95,461 310,412Res Comprehensive 186,433 17,734 46,916,388 294,772,571 17,721 43,629,527 268,066,348 163,126 15,824,297 701,378 16,525,675
Res Behavior 61,185 5,020 23,666,631 50,766,631 5,020 20,956,409 42,636,409 4,208 416,500 916,497 1,332,997Non-Res Cooking 7 34 94,270 1,237,037 34 92,098 1,210,968 412 24,734 4,045 28,779Non-Res Cooling 10,438 8,442 41,056,147 450,357,684 8,271 37,247,203 402,707,560 218,114 6,098,771 1,772,278 7,871,049Non-Res Heating 41 193 881,411 9,802,269 193 877,741 9,758,234 5,803 255,142 27,388 282,530Non-Res Lighting 38,557 23,144 148,512,252 1,605,879,052 21,468 135,848,710 1,512,669,580 785,496 31,405,298 8,908,011 40,313,309Non-Res Motors 63 618 5,174,169 70,794,088 548 4,661,565 64,091,200 33,128 1,412,733 373,612 1,786,345Non-Res Pumps 8 76 58,134,094 859,640,487 75 58,051,030 860,805,466 478,753 149,487 1,052,904 1,202,391
Non-Res Refrigeration 4,227 1,098 7,878,089 77,060,629 1,063 6,596,893 64,443,591 29,480 1,149,338 382,118 1,531,457Non-Res Shell 5,126 1,099 5,393,635 18,256,421 1,060 5,328,505 17,122,063 10,371 377,804 57,894 435,698
Non-Res Process 72 597 11,843,987 136,256,486 526 9,993,960 114,426,127 53,861 1,116,175 659,198 1,775,373Non-Res Comprehensive 662,768 11,858 78,064,510 935,478,579 11,052 76,710,231 916,078,062 516,257 28,343,811 6,966,502 35,310,313
Non-Res BehaviorOther 18,874 2,126,383 19,139,773 65,801,238 19,137,329 11,737 400 62 462
SubTotal 5,765,356 111,835 573,818,835 6,148,810,944 106,694 587,570,966 5,691,429,156 2,980,019 118,682,233$ 28,954,672$ 147,636,904$
T&D 3 10 654,633 4,721,190 10 654,633 4,721,190 659 123,125$ 56,297$ 179,422$ Codes and Standards 6 2,059 252,008,333 4,562,385,914 1,221 247,041,875 4,557,970,733 2,768,012 0$ 6,980,341$ 6,980,341$
Total 5,765,365 113,905 826,481,801 10,715,918,048 107,925 835,267,474 10,254,121,079 5,748,691 118,805,358$ 35,991,310$ 154,796,668$
TRC Test 2.49 PAC Test 4.62
TRC & PAC excludes T&D and Codes and Standards
Cost SummaryResource Savings Summary
* Imperial ID, Merced, Modesto, Plumas-Sierra, SMUD, Turlock ID, and Truckee Donner all operate on a calendar year basis; data is for CY 2016.

Energy Efficiency in California’s Public Power Sector: 11th Edition — 2017 15
Figure 8. Share of Total Energy Savings by IRP POU
Figure 9 below updates similar tables from previous reports to reflect public power’s increasing contribution to the development of the Title 24 Building Energy Efficiency Standards (Title 24). The need for public power support of Title 24 is increasing as the state moves to zero net energy homes by
2020, and non-residential buildings by 2030. However, POUs wish to avoid confusion as the Energy Commission also accounts for energy savings from Title 24. Previous annual reports did not differentiate between support for Title 24 and customer incentive programs and as such, Figure 8 provides corrected totals.
Figure 9. Energy Efficiency Program Results by Year
49.9%
22.1%
3.6%
3.6%
2.7%
2.4%
2.2%
2.1%
2.0%
1.6%
1.6%
1.5%
0.9%
0.8%
0.2%
0.1%
0% 10% 20% 30% 40% 50%
LADWPSacramento
ImperialAnaheim
Silicon ValleyPasadenaGlendaleRosevilleRiverside
TurlockModestoBurbankVernon
Palo AltoRedding
San Francisco PUC
Annual Savings (MWh)
Lifecycle Savings (MWh)
Total Expenditures ($)
Annual Savings (MWh)
Lifecycle Savings (MWh)
Total Expenditures ($)
Annual Savings (MWh)
Lifecycle Savings (MWh)
Total Expenditures ($)
2006* 169,303 2,249,214 54,412,728$ 169,303 2,249,214 54,412,728$ 2007* 254,332 3,062,361 63,151,647$ 254,332 3,062,361 63,151,647$ 2008* 401,919 4,473,801 103,907,266$ 401,919 4,473,801 103,907,266$ 2009* 644,260 6,749,912 146,093,107$ 644,260 6,749,912 146,093,107$ 2010* 522,929 5,586,299 123,433,250$ 522,929 5,586,299 123,433,250$ 2011* 459,459 4,604,364 132,372,795$ 459,459 4,604,364 132,372,795$ 2012* 439,710 4,638,521 126,936,631$ 439,710 4,638,521 126,936,631$ 2013 505,946 5,034,915 130,475,230$ 65,071 1,301,424 4,000,000$ 571,017 6,336,339 134,475,230$ 2014 555,232 5,537,397 165,743,723$ 71,182 1,423,632 4,197,012$ 626,414 6,961,029 169,940,735$ 2015 561,303 5,775,970 156,323,280$ 121,781 2,435,626 6,573,713$ 683,084 8,211,596 162,896,993$ 2016 574,691 6,153,044 147,913,703$ 252,008 4,562,386 6,882,964$ 826,699 10,715,430 154,796,668$
TOTAL 5,089,084 53,865,798 1,350,763,361$ 510,042 9,723,068 21,653,689$ 5,599,126 63,588,866 1,372,417,050$ *2006-2013: Annual Savings and Lifecycle Savings are reported in net savings
POU Programs - Excluding C&S Title 24 Codes & Standards All POU ProgramsFiscal Year

Energy Efficiency in California’s Public Power Sector: 11th Edition — 2017 16
Figure 10. Program Expenditures ($), by Year
Figure 11. Program Annual Energy Savings (MWh), by Year
* 2006-2013: Annual Energy Savings (MWh) are reported as net savings.
$-
$25,000,000
$50,000,000
$75,000,000
$100,000,000
$125,000,000
$150,000,000
$175,000,000
2006 2007 2008 2009 2010 2011 2012 2013 2014 2015 2016
-
170,000
340,000
510,000
680,000
850,000
2006 2007 2008 2009 2010 2011 2012 2013 2014 2015 2016

Energy Efficiency in California’s Public Power Sector: 11th Edition — 2017 17
POLICY CONSIDERATIONS
The past year brought many challenges and new opportunities for public power programs. As the California energy efficiency policies and market evolve, POUs continue to innovate and develop programs tailored to the changing needs of their community. As the state looks to double the
energy savings from energy efficiency by 2030, the ingenuity and collaborative spirit of public power will be even more critical. The continued success of the past year provides an excellent foundation on which public power looks to build upon.

Energy Efficiency in California’s Public Power Sector: 11th Edition — 2017 18
In the development of updates to Title 24 Building Energy Efficiency Standards, the Energy Commission evaluates the cost-effectiveness of proposed mandatory measures and prescribed measures. Essentially, if the cost to comply with a measure is less than the value of energy that otherwise would have been consumed over the lifecycle of the measure, then the measure is deemed to be cost-effective. For Title 24 measures, the lifecycle is 15-30 years. POUs, in procuring energy to serve its customers, are directed to first acquire all available energy efficiency and demand reduction resources that are cost effective, reliable, and feasible.2 The levelized utility cost (i.e., $ per lifecycle MWh saved) of energy efficiency measures provides the most useful metric for evaluating cost-effectiveness and for making comparisons to generation resources. For POU programs, the lifecycle, or expected useful life, of many measures ranges from 5-15 years. Return on investment (ROI) best defines cost-effectiveness from a non-residential customer perspective. According to a Siemens survey of commercial facilities executives,3 54% responded that the payback period for energy efficiency projects needed to be 5 years or less; only 3% said 6-8 years or less, and another 3% said 9 years or more.
2 Cal. Public Utilities Code § 9615 and § 454.5(b)(9)(C). 3 Siemans / Building Operating Management. August 2010. Economic of Energy Upgrades – Breaking Through Barriers.
In many cases, a residential customer’s decision to make energy efficiency improvements is not primarily motivated by reducing their monthly utility bill or a specific attitude towards energy efficiency. Arthur Rosenfeld, former CEC Commissioner and renowned as the “godfather of energy efficiency”, co-authored research that framed customer motivations as follows:
From a consumer perspective, it is often the non-energy benefits [i.e., improved indoor environment, comfort, health, and safety] that motivate (or can be used to promote) decisions to adopt energy-efficient technologies… From the perspective of energy consumers, non-energy benefits can equal or even exceed the importance of the energy cost avoided, thus meriting greater consideration in private investment decisions, marketing strategies, design and evaluation of utility programs, and government policies designed to promote energy efficiency.4
Understanding customer value propositions for energy efficiency is particularly relevant when developing policies and programs targeting energy savings in existing buildings; 15-30 year payback periods for a project will probably not attract high levels of customer interest.
4 Mills, E. and Rosenfeld, A. 1996. “Consumer Non-Energy Benefits as a Motivation for Making Energy-Efficiency Improvements.” Energy (21)7-8: 707-720.
Customers, utilities and policymakers define “cost-effectiveness” differently.

Energy Efficiency in California’s Public Power Sector: 11th Edition — 2017 19
Whereas non-energy benefits can motivate customers to invest in energy efficiency, transaction costs can deter participation. An Energy Institute at Haas working paper5 explored the impact of non-monetary costs on customer participation in a free weatherization program. The Weatherization Assistance Program study provided participating households with an energy audit and a home retrofit that typically included some combination of insulation, window replacements, furnace replacement, and infiltration reduction. The average value of the efficiency retrofits provided to participating households in the study exceeded $5,000 per home. The research found that the process of applying for weatherization programs is onerous and time intensive. Applicants must submit extensive paperwork documenting their eligibility. Despite being eligible for an average of $5,000 in improvements, the paper concluded that there is “striking evidence that individuals and households bypass opportunities to improve energy efficiency that require zero out-of-pocket expenditures and are widely believed to be privately beneficial.” The researchers also noted that participation only modestly increased by extraordinary education and outreach efforts.
5 Fowlie, M., Greenstone, M., and Wolfram, C. 2015. “Are the Non-Monetary Costs of Energy Efficiency Investments Large? Understanding Low Take-up of a Free Energy Efficiency Program.” Energy Institute at Haas WP 256.
The rate at which households pursued a weatherization retrofit increased nominally from less than 1% to almost 6% when provided the additional education and outreach. On average, it cost an additional $1,000 per household in program administration for the education and outreach efforts. In a similar vein, the SB 350 Low Income Barriers Study notes that the processes associated with securing energy efficiency financing can be onerous for customers and may pose major obstacles to participation. These hurdles limit a customer’s interest in securing financing. Low-income working persons, many of whom already find their time and energy spread thin, could find these hidden costs to participating in energy retrofit programs untenable.6 Public power supports the SB 350 Low Income Barriers Report recommendation seeking greater coordination of state agencies administering energy and related programs for low-income customers and disadvantaged communities. POUs welcome efforts to align eligibility requirements and reduce redundancies and administrative overhead, particularly if this effort encourages collaboration, standardization, streamlining, integration, and co-funding opportunities across government agencies.
6 California Energy Commission. 2016. Low-Income Barriers Study, Part A. Pub. # CEC-300-2016-009-CMF.
Complicated application processes deter customer participation in programs.

Energy Efficiency in California’s Public Power Sector: 11th Edition — 2017 20
The challenge and complexity of achieving a doubling of statewide energy efficiency savings by 2030 cannot be understated. Failure to accurately assess and incorporate customer perspectives may lead to the establishment of annual targets for statewide energy efficiency savings that grossly mischaracterize energy efficiency market and economic potential. Whereas programs, such as the Title 24 Building Energy Efficiency Standards, and utility incentive programs, have established methodologies for forecasting potential energy savings that consider customer acceptance and participation, other non-utility programs and market activities have not been previously modeled. SB 350 directs the Energy Commission to establish annual targets for statewide energy efficiency savings based on additional achievable energy efficiency (AAEE) savings, which captures the energy efficiency potential for investor owned utilities, and public power’s 10-year energy efficiency potential studies. Taken together, AAEE and the POU potential studies model all cost-effective and feasible energy efficiency program savings for utilities. In order to achieve a statewide doubling of energy efficiency savings, nonutility programs, which do not factor into the AAEE or POU potential studies, must be a significant source of new energy efficiency savings.
The strategies outlined in the California’s Existing Buildings Energy Efficiency Action Plan (EBEE Action Plan), “aim to mobilize market-based activity in California such that the existing $1.1 billion in annual ratepayer-funded programs is leveraged to activate sufficient private capital to reach an annual investment of at least $8 billion per year.” As such, the EBEE Action Plan plays a critical role in setting annual statewide targets and achieving the doubling of energy efficiency savings by 2030. To this end, the Commission will need to develop forecasts for the anticipated energy and demand savings, as well as the costs and benefits, for each of the strategies outlined in the EBEE Action Plan to include in the statewide energy efficiency savings doubling targets. In contrast to the robust modeling completed for utility programs, public power is unaware of forecasts of the energy efficiency savings and demand reduction potential for a number of nonutility programs, including the EBEE Action Plan, the California Clean Energy Jobs Creation Act, the Building Energy Use Benchmarking and Public Disclosure Program, and Property Assessed Clean Energy (“PACE”) programs. Public power strongly encourages the Energy Commission to prioritize their resources towards modeling the energy efficiency savings from nonutility programs. Without this data, it is not possible to set meaningful annual statewide targets as required by SB 350.
Non-Utility programs are essential to achieving the 2030 Doubling of Energy Efficiency Goal.

Energy Efficiency in California’s Public Power Sector: 11th Edition — 2017
APPENDIX A
This appendix consists of detailed narratives of each POU’s energy efficiency programs, as well as general descriptions of the utilities. Utility-specific summaries of their energy programs for FY 2015-2016, compiled using the E3 Reporting Tool, are at the end of each utility’s narrative.
All POUs – Summary of Energy Efficiency Programs, FY 2015-2016
POU SUMMARY Resource Savings Summary Cost Test Ratios
Utility
Gross Coincident
Peak Savings
(kW)
Gross Annual Energy Savings
(kWh)
Gross Lifecycle Energy Savings
(kWh)
Net Lifecycle GHG
Reductions (Tons)
Utility Incentives Cost
($)
Utility Mktg, EM&V, and
Admin Cost ($)
Total Utility Cost ($)
PAC TRCUtility
($/kWh)
Alameda 661 4,572,041 37,218,254 18,083 532,761 931,070 1,463,831 2.47 1.42 0.06$ Anaheim 9,299 29,448,778 269,151,224 162,881 4,731,858 - 4,731,858 8.36 8.36 0.02$
Azusa 919 5,023,330 46,687,959 24,154 657,479 228,729 886,208 4.62 2.55 0.03$ Banning 2,110 319,202 3,262,526 1,686 97,729 69,751 167,480 2.47 2.22 0.08$
Biggs 18 18,815 28,161 - 1,391 3,117 4,508 0.14 0.13 0.35$ Burbank 3,156 12,725,118 98,125,833 59,230 3,033,467 1,472,044 4,505,512 3.30 1.87 0.06$
Colton 742 2,456,418 14,180,949 - 475,847 572,678 1,048,524 0.15 0.14 0.10$ Corona 28 126,528 894,640 420 21,369 283 21,652 4.30 1.18 0.04$
Glendale 10,550 17,925,292 71,745,379 42,898 1,491,103 109,092 1,600,195 5.87 2.65 0.03$ Gridley 18 217,151 2,330,460 978 61,550 47,633 109,183 1.93 1.36 0.08$
Healdsburg 55 986,602 14,558,125 6,580 286,082 58,800 344,882 3.84 3.29 0.04$ Imperial ID 4,809 29,516,511 146,422,395 74,770 2,770,630 1,306,396 4,077,026 3.68 1.73 0.05$
LADWP 23,146 412,191,134 7,280,496,830 4,358,319 53,830,873 19,408,944 73,239,817 4.73 2.64 0.02$ Lassen 38 63,808 722,072 296 21,307 31,661 52,968 1.18 0.91 0.13$
Lodi 334 2,432,062 28,092,962 11,339 455,028 393,746 848,774 2.72 1.75 0.05$ Lompoc 8 184,828 2,018,362 876 18,361 67,861 86,222 2.09 0.92 0.07$ Merced 1 1,036,921 7,665,036 4,197 85,118 167,000 252,118 3.62 1.53 0.04$
Modesto 2,553 13,602,431 163,526,770 71,931 2,118,684 1,441,462 3,560,146 4.48 2.10 0.04$ Moreno Valley 211 1,758,388 10,514,510 6,369 78,125 59,944 138,069 9.73 2.46 0.02$
Needles 0 4,655 26,300 16 139,195 4,421 143,616 0.03 0.03 6.49$ Oakland 21 601,866 7,910,004 3,776 36,969 10,158 47,127 20.20 4.67 0.01$
Palo Alto 666 6,729,711 49,428,954 - 511,602 1,347,180 1,858,782 1.34 0.78 0.06$ Pasadena 2,411 19,596,302 153,897,739 90,237 2,921,509 562,618 3,484,128 5.51 2.22 0.03$ Pittsburg 144 483,358 5,373,331 - 47,355 13,120 60,475 0.74 0.15 0.02$
Plumas-Sierra 22 132,074 2,018,276 688 26,018 63,845 89,863 1.35 0.59 0.10$ Rancho Cucamonga 48 171,454 2,740,064 1,589 26,791 32,000 58,791 0.09 0.16 1.54$
Redding 1,511 1,978,635 30,463,668 12,428 2,822,861 341,254 3,164,115 1.18 1.30 0.19$ Riverside 5,950 16,843,515 248,263,917 125,544 4,181,940 - 4,181,940 6.43 3.61 0.03$ Roseville 5,554 17,435,256 152,310,641 - 2,900,946 1,209,220 4,110,166 1.63 1.50 0.03$
Sacramento 35,879 182,532,405 1,403,670,073 447,886 29,328,277 3,158,630 32,486,907 2.65 0.82 0.03$ San Francisco PUC 190 1,099,699 17,260,484 8,627 1,094,555 190,315 1,284,870 1.82 0.99 0.12$
Shasta Lake 26 90,638 1,240,321 461 54,135 52,890 107,025 0.93 0.71 0.18$ Silicon Valley 1,371 21,948,770 300,083,112 140,032 2,131,880 1,857,994 3,989,874 6.86 1.07 0.02$
Trinity PUD 1 56,607 566,070 182 59,400 5,740 65,140 0.52 0.45 0.25$ Truckee Donner 126 1,504,013 21,398,785 8,164 396,859 312,974 709,833 2.16 1.96 0.07$
Turlock ID 51 13,603,546 103,562,594 55,843 1,108,931 305,591 1,414,522 8.41 2.38 0.02$ Ukiah 34 149,146 1,871,942 774 51,319 41,582 92,901 1.83 1.26 0.09$
Vernon 1,245 7,132,471 15,701,175 7,439 196,052 111,566 307,618 5.18 3.36 0.03$ Victorville - - - - - - - - - -$
Summary 113,905 826,699,479 10,715,429,895 5,748,691 $118,805,358 $35,991,310 $154,796,668 4.62 2.49 0.024$
Cost Summary
* Imperial ID, Merced, Modesto, Plumas-Sierra, SMUD, Turlock ID, and Truckee Donner all operate on a calendar year basis; data is for CY 2016.

ALAMEDA MUNICIPAL POWER Alameda Municipal Power at a Glance
• Climate Zone – 3A • Number of retail customer connections – 35,336 (88% residential, 12% commercial) • FY15-16 total retail sales - $53,759,746 ($19,869,104 - residential,
$33,890,642 - commercial) • FY15-16 total budget for energy-efficiency programs - $1,973,000 • FY15-16 total amount actually expended for energy-efficiency programs - $1,463,831
Alameda Municipal Power Overview
• Due to Alameda’s temperate climate and small amount of industry, the peak demand for electricity is in the winter (December and January) in the early evening. AMP’s electric load is relatively flat compared to most California utilities and there is no residential air conditioning.
• More than 9% of AMP’s load is maritime, which includes a Coast Guard Base, the Maritime Administration with nine ships home ported in Alameda, and a large ship yard.
• In FY 2016 AMP finished installing advanced metering infrastructure (AMI) on its 300 largest commercial customers and about 1,700 residential customers. The AMI commercial customers have access to a portal with their energy-use data, including 15-minute interval data, kW, kWh, kVA, power factor, and weather data. Complete build out for all AMP customers will be completed in 2018.
• AMP has committed to spending much of our cap-and-trade and renewable energy credit (REC) funds to reduce greenhouse gas emissions in its service area.
• The average residential energy use has been declining annually since 2011. With the exception of FY 2016, total energy sales have been decreasing also. This trend is similar to other utilities both in California and nationally.
AMP Electric Sales and Average Residential Electric Use
Year Actual Electric Sales (MWh/yr.)
Residential Average Annual Electric Use
(kWh/yr.)
2011 382,634 4,651 2012 373,787 4,555 2013 363,444 4,434 2014 353,913 4,265 2015 342,203 4,053 2016 348,820 3,989

• This downward trend is likely due to several factors, including: • Increase in customer energy efficiency • Increase in customer-owned distributed generation • Increase in energy efficiency in codes and standards, particularly CA Title 24 – the
CA Building Standards, and Title 20 the 2012 Appliance Efficiency Regulations • Decreased energy use in consumer products. For example, LED TVs , which use 130
watts, have largely replaced plasma TVs, which used 400 watts. Also lap top computers, which use 5 watts, have largely replaced desktop computers, which used 32 watts.
• Increase in the efficiency requirements for the Energy Star label Major Program Changes
• Residential LEDs: AMP offered three different LED rebates in FY 2016. The first was a continuation of LED MANIA, a mail-in rebate offer from FY 2015 with very attractive rebates. This program concluded with products purchased on July 31, 2015. Next, AMP participated in an upstream program with other Northern California Power Agency (NCPA) member utilities. This program ran from February through May. Finally, AMP’s online rebate program went live in March with rebates for LED bulbs and fixtures.
• Residential Online Rebates: In March 2016, all residential rebates were moved to an online system. The $45,000 program set-up fee were a major contributor to the administration costs for this fiscal year. AMP expects to see lower administration figures for the online rebate program in FY 2017. The online rebate program allowed AMP to add new rebate categories, including electric clothes dryers, washing machines, and heat pump water heaters.
• Non-residential Direct Install Programs: The Commercial Lighting Program ended December 2015. Based upon the success of that program, AMP started the Energy Plus Program to include all non-residential customers and refrigeration measures.
Program Highlights
• Total residential sector lighting savings was nearly 235 MWh (gross). Alamedans purchased more than 12,000 LEDs in FY 2016 – 40% of all residences could have installed a new LED. In FY 2015, customers purchased or received nearly 60,000 LEDs. AMP will continue to promote LEDs to residential customers, though it is expected that growth will slow as LEDs have become ubiquitous in Alameda. LEDs were purchased through three venues: LEDMANIA, a mail-in rebate program, the upstream, or Instant Rebate program, or AMP’s new online rebate.
o LEDMANIA, AMP’s mail-in rebate program, was only available for one month, and was just the continuation of a short-term program offered in FY 2015.
o The upstream program was very successful and offered from February to July. Customers purchased more than 7,500 LEDs during this five month period. There is some concern that a small percentage of these LEDs were installed outside of Alameda, but AMP also recognizes that with Alameda’s proximity to Pacific Gas &

Electric’s (PG&E) territory, it is very likely that Alamedans also purchased LEDs from PG&E’s upstream program. AMP may consider repeating this program during another year. AMP’s online rebate program started in March 2016. In its first four months, more than 100 LEDs and fixtures with integrated LEDs have been incentivized. Rebates are lower than the mail-in rebate, which reflects recent decreases in LED prices. AMP expects to see continued participation in this program over time.
• Commercial Lighting Program A direct-install lighting program, the goals of the program were to remove customer barriers to lighting retrofits such as knowledge of lighting technologies, project management, quality of contractors and fair pricing, first costs, compliance with Title 24, and reach customers that have not participated in energy efficiency programs previously. The majority of the lighting retrofits were LEDs replacing various high-intensity discharge fixtures. More than 70% of the participants were small commercial customers who had never participated before in efficiency programs and the program rebates covered an average of 56% of the project cost. With a budget of $600,000 the Program resulted in energy savings of 1,660 MWh/year and a demand savings of 406.8 kW.
• Energy Plus Program Based upon the success of Commercial Lighting Program, AMP started the Energy Plus Program in FY 2016 with a budget of $1.1 million to include all non-residential customers and refrigeration measures. This direct install program has a goal of 3,013 MWh energy savings and will run for two years or until the funds expire.
• Street Light Retrofit The LED retrofit of all Alameda cobra head and shoebox street lights, 3,202 lights, was completed resulting in savings of 868,224 kWh per year. The annual energy cost savings for retrofitting the 3,202 fixtures is $203,346, and the AMP rebate was $86,822.36. The remaining historic and decorative street lights, 1,877 lights, will be retrofitted with LEDs in FY 2017 and 2018.
Program Descriptions Residential Lighting
• LEDMANIA: AMP offered two LED rebate programs in FY 2016. The first, a mail-in rebate program, LED MANIA, was closed to purchases made after July 31, 2015. LED MANIA’s rebates were available for both fixtures and lamps--$5 for LEDs less than 1,000 lumens and $10 for 1,000 lumens and greater.
• LED Upstream Program: AMP partnered with other NCPA utilities and local Alameda retailers to offer pre-rebated LEDs. This program, which AMP called the Instant Rebate program, ran from February through July (meaning that one month of this program will be captured in FY 2017). The program offered five types of LEDs: a candelabra, BR 30 flood, and A-lamps with 800, 1100, and 1600 lumen outputs.
• Online Rebate Program: AMP launched their online rebate program in March 2016. This program offers different rebates for LED lamps and fixtures. Lamps are rebated at $3 if
less than 1,000 lumens and $10 if 1,000 lumens and greater. Fixture rebates are set at $8, and $15, respectively.
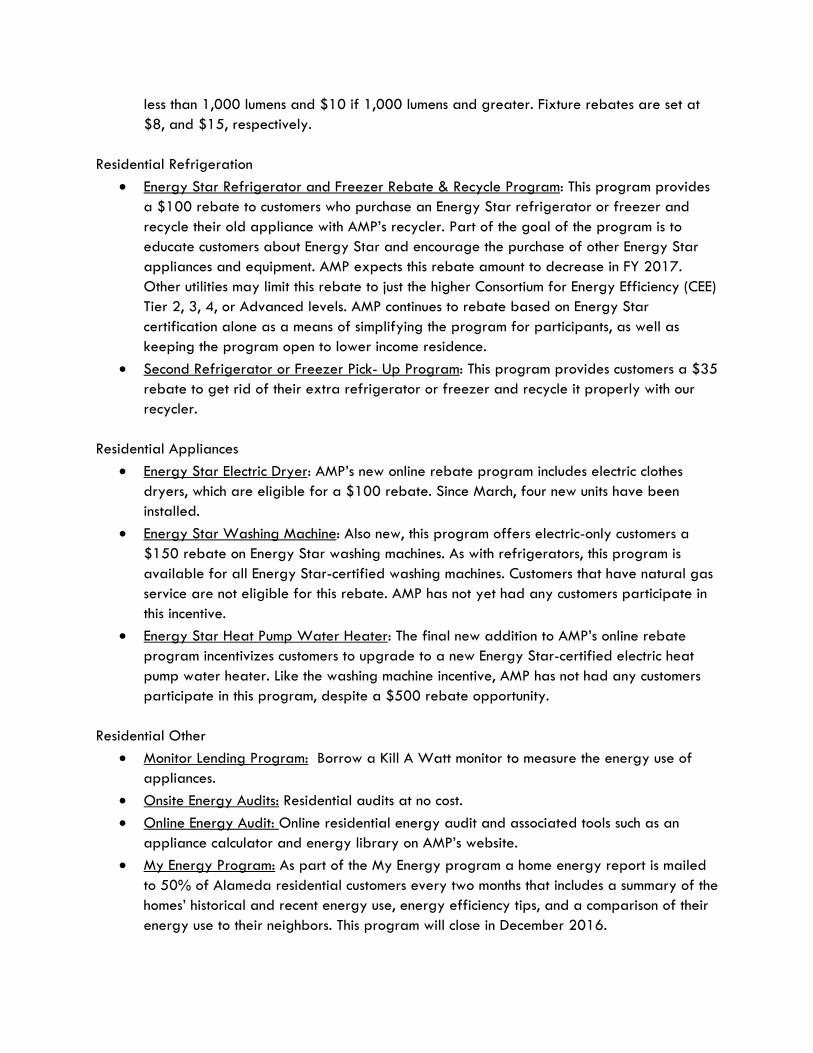
Residential Refrigeration
• Energy Star Refrigerator and Freezer Rebate & Recycle Program: This program provides a $100 rebate to customers who purchase an Energy Star refrigerator or freezer and recycle their old appliance with AMP’s recycler. Part of the goal of the program is to educate customers about Energy Star and encourage the purchase of other Energy Star appliances and equipment. AMP expects this rebate amount to decrease in FY 2017. Other utilities may limit this rebate to just the higher Consortium for Energy Efficiency (CEE) Tier 2, 3, 4, or Advanced levels. AMP continues to rebate based on Energy Star certification alone as a means of simplifying the program for participants, as well as keeping the program open to lower income residence.
• Second Refrigerator or Freezer Pick- Up Program: This program provides customers a $35 rebate to get rid of their extra refrigerator or freezer and recycle it properly with our recycler.
Residential Appliances
• Energy Star Electric Dryer: AMP’s new online rebate program includes electric clothes dryers, which are eligible for a $100 rebate. Since March, four new units have been installed.
• Energy Star Washing Machine: Also new, this program offers electric-only customers a $150 rebate on Energy Star washing machines. As with refrigerators, this program is available for all Energy Star-certified washing machines. Customers that have natural gas service are not eligible for this rebate. AMP has not yet had any customers participate in this incentive.
• Energy Star Heat Pump Water Heater: The final new addition to AMP’s online rebate program incentivizes customers to upgrade to a new Energy Star-certified electric heat pump water heater. Like the washing machine incentive, AMP has not had any customers participate in this program, despite a $500 rebate opportunity.
Residential Other • Monitor Lending Program: Borrow a Kill A Watt monitor to measure the energy use of
appliances. • Onsite Energy Audits: Residential audits at no cost. • Online Energy Audit: Online residential energy audit and associated tools such as an
appliance calculator and energy library on AMP’s website. • My Energy Program: As part of the My Energy program a home energy report is mailed
to 50% of Alameda residential customers every two months that includes a summary of the homes’ historical and recent energy use, energy efficiency tips, and a comparison of their energy use to their neighbors. This program will close in December 2016.

Non-residential Direct Install Programs • Commercial Lighting Direct Install Program: Started in FY 2015 and ended December
2015 (FY 2016) the Commercial Lighting Direct Install Program was administered by a third-party vendor.
• Energy Plus Program: The Energy Plus Program is an expansion of the Commercial Lighting Direct Install program that includes all non-residential customers and refrigeration measures. The program started in January 2016, funded for $1.1 million, is expected to run for two years.
Non-Residential Cooling
• Commercial HVAC Retrofit Program: Prescriptive rebates for retrofitting existing buildings with energy-efficient HVAC equipment.
Non-Residential Lighting
• Commercial Lighting Retrofit Program: A program with rebates, both prescriptive and custom, for retrofitting lighting with energy-efficient equipment.
Non-Residential Process
• Commercial Customized Rebate Program: A program with customized rebates based upon the kWh/year savings not covered by the lighting or HVAC program
Non-Residential New Construction
• New Construction Design Assistance: Grants of up to $10,000 for energy-efficient design work.
• New Construction Rebates: Whole building and systems rebates for energy-efficient new construction.
• Commercial On-Site audits: Free energy audits for lighting, HVAC, refrigeration, process systems, etc.
EM&V AMP completes the evaluation, measurement, and verification (EM&V) process every two years. This method is an economical use of staff resources. The most recent EM&V focused on three FY 2015 residential programs. The typical budget for EM&V is $40,000 for two years. The next EM&V will be for FY 2016 and 2017 and may focus more on commercial programs. The following three programs were studied:
• “Great Light Bulb Change Out:” All residential service addresses in Alameda were mailed two 800 lumen LEDs, packaged as a gift from AMP. Alamedans received their LEDs February – March 2015. Residents were encouraged to replace their high-use incandescent lights with these new long-lasting energy-efficient LEDs.

• LEDMANIA: After customers received their LEDs in the mail, AMP simplified their LED rebate process. The pre- and post-install and savings based on kWh savings was replaced with a prescriptive rebate and a simple mail or email application.
• Refrigerator/Freezer Recycle Program: This program encourages Alamedans to disconnect and remove an extra refrigerator or freezer. AMP arranges a pick up (and proper recycling) of the old appliance and provides a rebate to the customer.
The following are highlights of the EM&V study:
• The installation rate for the Direct Mail Lighting Campaign is high. 90% of those surveyed indicated that the LED light bulbs provided by AMP were installed.
• The reported energy savings for the Direct Mail Lighting Campaign is a conservative estimate of the actual savings achieved. Verified savings indicate a 175% realization rate, but this estimate is likely overstated due to uncertainties associated with preexisting lamp sizes reported by customers.
• The installation rate for the LED Rebate Lighting Program participants is also high; 89% of the lamps expected to be installed were verified on-site. The verified savings for these participants is 114,785 kWh. Compared to the reported savings of 115,389 kWh, the realization rate is 99.5%.
• The refrigerator recycling program verified savings for program year 2015 is 7,392 kWh with a realization rate of 57%. Verified savings are based on recycler records, which were incomplete and likely underrepresent the number of recycled refrigerators.
• Customer satisfaction with the LED light bulbs installed was generally very high. • The majority of customers across both lighting programs were satisfied with the LED lamps
installed, including the quantity and quality of light emitted.
The EM&V study helped inform staff’s need to keep records for the freezer and refrigerator hauler/recycler. AMP will now send a yearly electronic back up of pick up information back to the hauler because a member of their staff was regularly disposing of paper records. The high realization rate (99.5%) for the LED Rebate Lighting Program creates confidence in AMP’s unique a baseline of one-third compact fluorescent and two-thirds incandescent as existing. This data shows that Alamedans have not moved to halogen incandescent lighting. AMP expects to update this to match the “Technical Resource Manual” (TRM) in future program years. The report can be found here. Sources of Energy Savings With a goal of getting the most accurate energy savings, AMP staff used a variety of sources. For the residential lighting energy savings, AMP used historical AMP customer program data, buoyed by a high realization rate in the FY 2015 EM&V report. The energy savings figures for the residential refrigerator programs were from the “Technical Resource Manual” (TRM 2016) for the CA Municipal Utility Association. The electric clothes dryer savings was from an Energy Star

report. Energy savings from My Energy, AMP’s residential behavior program, were from actual AMP billing records and compared the test group, those that received the printed HER, to the control group that did not receive HERs. Opower, the vendor responsible for My Energy, handled these calculations. The City of Alameda Public Utilities Board requested that staff use a net-to-gross ratio of 1.0 for the My Energy program. All of the energy savings from the commercial lighting measures are from the actual pre- and post-installation inspections. The energy savings from the refrigeration retrofit and the variable frequency drive were from the TRM 2016. The energy savings from the commercial new construction projects were from the Title 24 reports and the TRM 2016, and all were field-verified. Lastly, the commercial HVAC energy savings for the chiller retrofit were based upon calculations from Salas O’Brien Engineers. Complimentary Programs
• Renewable Energy Programs: Alameda Green, AMP’s voluntary green power program, provides customers with the option to choose 100% renewable energy at an additional cost of $0.015/kWh. As of the end of FY 2016, there were 2,113 residential and 70 commercial customers enrolled in Alameda Green. AMP staff encouraged enrollment through Alameda Green mentions in AMP’s customer newsletter, four bill inserts, social media, an outreach program, “Shop Clean & Local” week during Public Power Week, and a contest among customer service representatives. In May 2016, AMP earned a national ranking for green utility programs from the U.S. Department of Energy’s National Renewable Energy Laboratory (NREL). AMP’s “Alameda Green” program made NREL’s “Top 10” list for its high participation rate in 2015.
• Low-Income Programs: AMP continues to provide financial assistance to Alameda's low-income families through the EASE (Energy Assistance through Supportive Efforts) and EAP (Energy Assistance Program) programs. For FY 2016, EASE, an emergency relief program, helped 82 households receive a total of $7,078.12 in electric bill assistance. A maximum amount of $200 is available per household within a three-year period through the EASE program. The EAP provides a 25 percent monthly discount on the electric bill. A total of $73,973.46 was allocated to 601 Alameda households. These programs are funded through the public purpose component of AMP's energy charge.
• Electric Vehicles: In FY 2016 there were a total of 381 AMP customers registered to receive the electric vehicle (EV) discount, up from 291 registered in FY 2015 and 58 in 2014. AMP purchased two EVs and one plug-in hybrid for fleet vehicles in FY 2016.
• Energy Storage: AMP does not have any onsite storage and an evaluation of energy storage was done in 2014 as required by California AB 2514. The evaluation concluded that energy storage was not cost effective at this time. However, AMP continues to evaluate the potential for this technology.

Alameda Energy Efficiency Program Results, FY 2015-16
Alameda
CategoryUnits
Installed
Gross Coincident
Peak Savings (kW)
Gross Annual Energy Savings
(kWh)
Gross Lifecycle Energy Savings
(kWh)
Net Coincident Peak Savings
(kW)
Net Annual Energy Savings
(kWh)
Net Lifecycle Energy Savings
(kWh)
Net Lifecycle GHG
Reductions (Tons)
Utility Incentives Cost
($)
Utility Mktg, EM&V, and
Admin Cost ($)
Total Utility Cost ($)
Utility ($/kWh)
Res Clothes WashersRes CoolingRes DishwashersRes ElectronicsRes HeatingRes Lighting 12,057 234,498 2,813,971 126,629 1,519,544 765 $69,640 $33,452 $103,092 $0.09Res Pool PumpRes Refrigeration 110 14 72,809 857,664 10 50,966 600,365 326 $9,115 $16,753 $25,868 $0.06Res ShellRes Water HeatingRes ComprehensiveRes Behavior 11,182 1,599,026 1,599,026 1,599,026 1,599,026 902 $267,377 $267,377 $0.18Non-Res CookingNon-Res Cooling 2 5 42,790 641,850 4 36,372 545,573 335 $3,832 $12,626 $16,458 $0.04Non-Res HeatingNon-Res Lighting 16 637 2,581,323 30,681,486 582 2,359,242 28,075,393 15,559 $445,235 $596,555 $1,041,789 $0.05Non-Res MotorsNon-Res PumpsNon-Res Refrigeration 1 5 41,263 618,945 3 24,758 371,367 196 $4,539 $4,245 $8,784 $0.03Non-Res ShellNon-Res ProcessNon-Res ComprehensiveNon-Res BehaviorOther 4 332 5,312 179 2,868 1 $400 $62 $462 $0.24
23,372 661 4,572,041 37,218,254 598 4,197,172 32,714,136 18,083 $532,761 $931,070 $1,463,831 $0.06
T&DCodes and Standards
Total 23,372 661 4,572,041 37,218,254 598 4,197,172 32,714,136 18,083 $532,761 $931,070 $1,463,831
TRC Test 1.42 PAC Test 2.47 Excluding T&D
Resource Savings Summary Cost Summary

ANAHEIM PUBLIC UTILITIES
Anaheim Public Utilities at a Glance • Established in 1894 • Climate Zone 8 • 181,440 meters. 117,593 are electric and 63,847 are water • Percent of electric retail sales by customer class - 25.7% residential, 34.2% commercial,
36.8% industrial and 3.4% miscellaneous • Budgeted amount for energy efficiency programs: $5,052,599 • Amount expended: $4,731,858 • Funding source: Electric Revenue
Anaheim Public Utilities Overview Anaheim Public Utilities (APU) provides electricity and water to a community of 358,000 residents, over 10,000 businesses and more than 25 million annual visitors over an area that covers more than 50 square miles. The Anaheim Resort, Anaheim Canyon and the Platinum Triangle account for a large proportion of the energy and water consumed in Anaheim, and contribute significant energy use and tax based revenues to the City's General Fund. There was a continued growth and economic development in FY15-16 and it is anticipated that approximately $4.5 billion will be invested in the Platinum Triangle and Anaheim Resort areas in the next 2 years. Four new hotels were completed in the Anaheim Resort Area in 2016. The Anaheim Convention Center has made great progress in the 200,000 square foot expansion to increase the number of convention shows and visitors to the City; its anticipated completion date is Fall of 2017. In FY15-16, nearly 800 new apartments and condominiums were completed and over 2,100 dwelling units are under construction in the Platinum Triangle. At full build out, the Platinum Triangle will be host to 28,000 residents, 19,000 apartments and condominiums, 14 million square feet of office space and 4.7 million square feet of commercial, retail and hotel space. The California 2013 Title 24 Building Energy Efficiency Standards continued to impact the quantity and types of energy efficiency projects undertaken by APU customers, particularly in the area of commercial lighting projects. The increased costs for additional equipment and controls resulted in fewer large scale commercial lighting retrofits in fiscal year 2015-16.
APU customers continued to pursue their interest in alternative sources of electricity to meet their personal and business needs. This was achieved predominantly through the installation of solar energy systems. APU estimates that over 2,500 solar energy systems totaling about 25 megawatts will be built throughout Anaheim by the end of 2017. Fuel cells are also making their impact in Anaheim with a number of large commercial customers installing or considering the installation of systems to

offset their load, some as much as 50% or more. While APU strongly recommends that customers incorporate energy efficiency into their overall property performance prior to installing a solar system or a fuel cell, customer interest in alternative energy sources remains high.
Major Program Changes APU modified its energy efficiency program portfolio in FY15-16 to take advantage of the successful partnering with the Southern California Gas Company by doubling the funds allocated to this income qualified program. Income qualified customers receive the value of a one stop approach that provides electric, gas and water savings through a host of resource efficiency measures, equipment and appliances.
Program Highlights APU's Customized Energy Incentives Program provides its commercial and industrial customers with the greatest flexibility in selecting energy efficiency projects that provide them with the greatest return on their investment. Customers appreciate the opportunity to select improvements that are specific to their operation, particularly if their greatest energy savings strategies may not be for measures that fall into a prescriptive menu. In addition to the incentives offered for new construction and retrofit applications, customers can also receive a free specialized or comprehensive energy audit for their facility. This assists them in identifying the greatest energy consuming end uses as well as the energy savings potential and payback for their investment. This comprehensive approach provides the greatest overall energy savings for our customers and provides APU with a significant contribution towards its overall energy savings goal.
In the partnership with the Southern California Gas Company, both utilities benefitted from the jointly delivered programs and services to their mutual customers. The working relationship between the two utilities streamlined implementation, facilitated the use of common contractors to implement electricity, water and natural gas efficiency measures, and allowed the utilities to cross-promote each other’s conservation programs.
Current Commercial Customer Programs Descriptions Total annual program cost: $2,431,104 Resulting in 5,302 kilowatt demand reduction and 21,492,070 kilowatt-hour savings
Non-Res Cooling
• Customized Energy Incentives Program - Customized financial incentives for installation of high-efficiency air conditioning. motor controls and other production related equipment.
• Comprehensive Energy Audits - Customized on-site audits and recommendations designed to improve energy operating efficiency and help customers reduce costs.
• Operations Program - Produces energy savings by turning off large transformers that are not serving customers' loads.

• Codes and Standards - Savings are drawn from the Statewide allocation of energy savings credits for FY 2015/2016 due to Codes and Standards and based on Anaheim's percent share of statewide load.
• Upstream HVAC - Provides rebates to the sales channel that most influences the stocking and selling of qualifying high efficiency equipment; the goal is to facilitate the purchase of the high efficiency equipment by the end-use customer.
Non-Res Heating
• Heat Pump Incentives Program - Encourage installation of high-efficiency heat pumps.
Non-Res Lighting • Lighting Incentives - Provides incentives to improve energy efficiency for a variety of
lighting applications. • Small Business Energy Management Assistance Program - Provides customers of less
than 50 kilowatt demand with energy use evaluations, retrofit funding and installation assistance; focusing on lighting upgrades, programmable thermostats, air conditioning and refrigeration tune ups.
• Small/Medium Business Audits · Customized on-site audits and recommendations designed to improve operating energy efficiency and help customers reduce costs.
Non-Res Comprehensive
• Air Compressor Program - Provides free comprehensive audits which approach this technology and its operation on a systemic basis and awards incentives for installing qualifying system components which improve energy system efficiency.
Other Resulting in 2,126,051 kilowatt-hour savings (water/energy nexus)
• Commercial & Residential Water Savings Resulting from Equipment Rebates -Businesses and residents are eligible for rebates by installing or retrofitting with qualifying water-saving devices through the "SoCal Water$mart" Program in partnership with Metropolitan Water District. Water savings result from the application of measures such as; o Landscape Performance o Rotating Nozzle Rebates o SmarTimer Rebates o Home Utility Checkup direct installs of water saving devices
Current Residential Customer Programs Descriptions Total annual Program Costs: $2,300,754 Resulting in 3,997 kilowatt demand reduction and 5,830,656 kilowatt-hour savings.
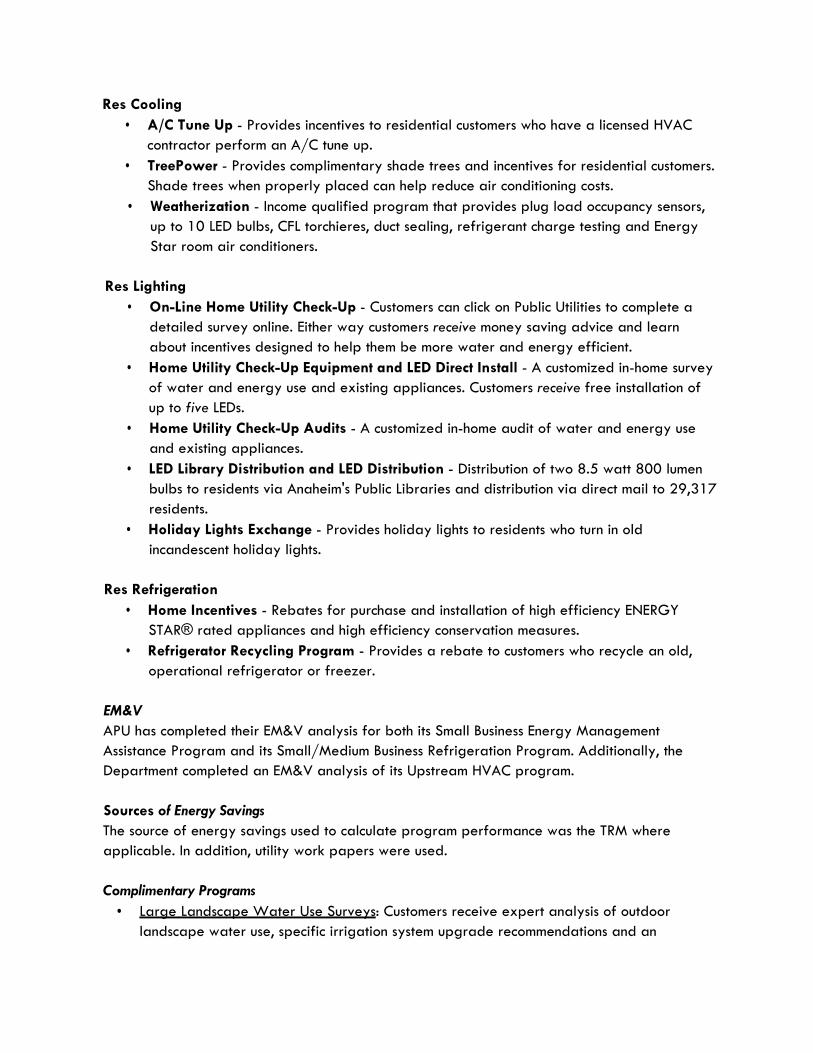
Res Cooling • A/C Tune Up - Provides incentives to residential customers who have a licensed HVAC
contractor perform an A/C tune up. • TreePower - Provides complimentary shade trees and incentives for residential customers.
Shade trees when properly placed can help reduce air conditioning costs. • Weatherization - Income qualified program that provides plug load occupancy sensors,
up to 10 LED bulbs, CFL torchieres, duct sealing, refrigerant charge testing and Energy Star room air conditioners.
Res Lighting
• On-Line Home Utility Check-Up - Customers can click on Public Utilities to complete a detailed survey online. Either way customers receive money saving advice and learn about incentives designed to help them be more water and energy efficient.
• Home Utility Check-Up Equipment and LED Direct Install - A customized in-home survey of water and energy use and existing appliances. Customers receive free installation of up to five LEDs.
• Home Utility Check-Up Audits - A customized in-home audit of water and energy use and existing appliances.
• LED Library Distribution and LED Distribution - Distribution of two 8.5 watt 800 lumen bulbs to residents via Anaheim's Public Libraries and distribution via direct mail to 29,317 residents.
• Holiday Lights Exchange - Provides holiday lights to residents who turn in old incandescent holiday lights.
Res Refrigeration
• Home Incentives - Rebates for purchase and installation of high efficiency ENERGY STAR® rated appliances and high efficiency conservation measures.
• Refrigerator Recycling Program - Provides a rebate to customers who recycle an old, operational refrigerator or freezer.
EM&V APU has completed their EM&V analysis for both its Small Business Energy Management Assistance Program and its Small/Medium Business Refrigeration Program. Additionally, the Department completed an EM&V analysis of its Upstream HVAC program.
Sources of Energy Savings The source of energy savings used to calculate program performance was the TRM where applicable. In addition, utility work papers were used.
Complimentary Programs
• Large Landscape Water Use Surveys: Customers receive expert analysis of outdoor landscape water use, specific irrigation system upgrade recommendations and an

explanation how incentives may help fund improvements. • Economic Development/Business Retention Rate: Qualifying businesses receive rate
discounts with an efficiency measures installation component. • New Construction: Customers receive design assistance and incentives for new construction
and facility expansions that install energy-efficient equipment that exceed Title 24.
Renewable Energy Programs: • Green Power Program: Customers pay an extra charge to support renewables. The funds
go towards purchasing solar, wind, geothermal, hydroelectric and other forms of renewable generation.
Low-Income Programs: • Income-Qualified Senior, Military, Veteran or Disabled Customer Energy Credit: Provides a
10 percent reduction on the electric portion of bills to seniors, military veterans or long-term disabled customers at or below 80 percent of the Orange County median income.
• Dusk to Dawn Income-Qualified Assistance: In addition to receiving a free outdoor light, income qualified residents may also have the light installed by one of Anaheim's approved and licensed electrical contractors free of charge.
• Emergency Assistance: Provides a one-time electric utility payment for customers in economic hardship.
Electric Vehicles: • Public Access Electric Vehicle Charging Station Rebates - Commercial, Industrial, and
Municipal customers who install a plug-in electric vehicle (EV) chargers at locations accessible to patrons, multi-family dwelling residents, commuters and visitors are reimbursed for out-of-pocket expenses up to $5,000 per charging station for public access locations, or $10,000 for school or affordable housing locations. Eligible expenses include the charger purchase price and installation costs. In addition to the rebate, the City’s permit application fee for the EV charger is waived.
• Plug-in Electric Vehicles Incentives - Customers are reimbursed for out-of-pocket expenses
up to $500 per charger. Eligible expenses include the charger purchase price and installation costs. In addition to the $500 rebate, permit application fees for the installation of the EV charger are waived.

Anaheim Energy Efficiency Program Results, FY 2015-16
Anaheim
CategoryUnits
Installed
Gross Coincident
Peak Savings (kW)
Gross Annual Energy Savings
(kWh)
Gross Lifecycle Energy Savings
(kWh)
Net Coincident Peak Savings
(kW)
Net Annual Energy Savings
(kWh)
Net Lifecycle Energy Savings
(kWh)
Net Lifecycle GHG
Reductions (Tons)
Utility Incentives Cost
($)
Utility Mktg, EM&V, and
Admin Cost ($)
Total Utility Cost ($)
Utility ($/kWh)
Res Clothes WashersRes Cooling 5,721 386 664,291 6,501,063 386 664,291 6,501,063 4,147 $978,595 $978,595 $0.21Res DishwashersRes ElectronicsRes HeatingRes Lighting 66,794 3,293 4,447,363 71,924,825 3,293 4,447,363 71,924,825 40,797 $837,976 $837,976 $0.02Res Pool PumpRes Refrigeration 2,540 299 697,573 5,919,356 299 697,573 5,919,356 3,341 $478,468 $478,468 $0.10Res ShellRes Water HeatingRes ComprehensiveRes BehaviorNon-Res CookingNon-Res Cooling 1,115 3,340 14,625,382 93,457,269 3,340 14,625,382 93,457,269 60,174 $942,100 $942,100 $0.01Non-Res Heating 7 191 840,963 9,250,593 191 840,963 9,250,593 5,619 $69,376 $69,376 $0.01Non-Res Lighting 1,294 1,681 5,463,842 56,539,088 1,681 5,463,842 56,539,088 33,487 $1,223,399 $1,223,399 $0.03Non-Res MotorsNon-Res PumpsNon-Res Refrigeration 251 108 581,279 6,394,069 108 581,279 6,394,069 3,564 $186,715 $186,715 $0.04Non-Res ShellNon-Res ProcessNon-Res Comprehensive 2 1 2,033 30,500 1 2,033 30,500 19 $15,230 $15,230 $0.70Non-Res BehaviorOther 18,870 2,126,051 19,134,461 2,126,051 19,134,461 11,735
96,594 9,299 29,448,778 269,151,224 9,299 29,448,778 269,151,224 162,881 $4,731,858 $4,731,858 $0.02
T&DCodes and Standards
Total 96,594 9,299 29,448,778 269,151,224 9,299 29,448,778 269,151,224 162,881 $4,731,858 $4,731,858
TRC Test 8.36 PAC Test 8.36 Excluding T&D
Resource Savings Summary Cost Summary

AZUSA LIGHT & WATER Azusa Light & Water at a Glance
• The City of Azusa was incorporated in 1898, the water utility established in 1900 and the electric utility followed shortly after in 1904
• Climate Zone 9 • The utility serves approximately 16,740 retail electric customers in a community of
approximately 47,842 residents (2013) • Percent of retail sales by customer class – 40% residential, 60% commercial/industrial • Budgeted amount for energy efficiency programs was ($818,500), amount actually
expended ($886,208) and customer line item utility charge funding sources ($1,071,027); specify if unused, EE dollars are reallocated to other Public Benefits program (no excess)
• Annual load growth was approximately -1.4% Azusa Light & Water Overview Since inception of the energy efficiency programs, Azusa Light & Water has expended over $11 Million toward providing energy conservation information to the Azusa community and rewarding businesses and residents for upgrading inefficient energy consuming equipment with more energy efficient equipment. These efforts have resulted in an annual peak demand and energy use reductions of approximately one percent. Major Program Changes Over the last fiscal year the energy efficiency programs have been maintained at about the same levels of participation, however they have been refined by reducing the amount of incentives for the less cost effective measures. Program Highlight The Small Business Audit/Retrofit Program and the “Keep Your Cool” direct install programs continue to provide the greatest impact on meeting the needs of the harder to reach businesses and small retailers within the service territory. These hard to reach customers have a very tight cash flow and in many times are unable to participate in the rebate programs unless there is little to no up-front monetary outlay. Both of these programs allow the customers to immediately see the savings and avoid the initial cash outlay associated with the typical rebate type programs. Commercial and Industrial Customer Programs:
• Business Partnership Program: Retrofit existing buildings and factories with high efficiency lighting, air conditioning and process equipment.
• Free Energy Audits: Provide suggestions on the most energy efficient equipment and more cost effective methods of operations.
• New Business Retrofit Program: Encourage the use of the most energy efficient equipment in the design and construction of new buildings and factories.

• Small Business Audit/Retrofit Program: Provide free utility audit, free CFL retrofit, free packaged A/C tune-ups, the first $1,500 free lighting retrofit and recommendations for further energy saving measures with a corresponding 50% rebate up to a maximum rebate of $10,000 per customer account.
• “Keep Your Cool Audit/Retrofit Program”: Provide free utility audit, free LED case lighting retrofits, free refrigeration tune-ups, free case seal replacements, auto door closers and fan controllers.
Residential Programs Descriptions
• Home Weatherization Rebate Program: Rebates are offered for a variety of home weatherization measures.
• EnergyStar® Appliance Program: Rebates are offered for most high efficiency appliances that have the EnergyStar® rating, including but not limited to, refrigerators, air conditions, LED Televisions and computer monitors, dishwashers, clothes washers, pool pumps, ceiling fans and various lighting measures.
• Free Home-in-Home Energy Audits: Provide recommendations for the effective use of energy within the residence.
• Free On-Line Home Energy Audit Program: Customers can enter various parameters that match their home and lifestyle, and receive an immediate list of conservation recommendations and measures along with an estimate of what each appliance within the home is using in the way of energy.
Public Facilities Program Description
• Program guidelines are essentially the same as the current commercial and industrial programs; therefore they are included in that category for funding and savings.
City Schools Program Description
• LivingWise: Provide an interactive 6th grade conservation education program to all 6th grade classes within the City of Azusa, both private and public.
EM&V Azusa Light & Water contracted with Lincus Energy in 2010 to complete a study of the various FY 2008-09 energy efficiency programs and associated savings. The Lincus study is available on the CMUA website and the Azusa light & Water website (http://www.ci.azusa.ca.us/DocumentCenter/View/26058). Azusa Light & Water will continue to make EM&V reports available to the CEC and other parties as they are completed and will continue with its EM&V programs and practices in the future. Sources of Energy Savings For savings, Azusa Light & Water uses a combination of figures from TRM, E3, utility work papers and custom savings analysis and vendor calculations when applicable.

Complimentary Programs • Low-Income Programs: The Azusa Light & Water Low Income Assistance Program is
outlined in Rule No. 18 of Azusa Light & Water’s Rules and Regulations. Interested customers are required to fill out an application and provide documentation of income. In general, Azusa Light & Water’s guidelines for qualifying customers follow the low income thresholds used by the State.
• Research, Development, and Demonstration: Azusa Light & Water, jointly with the Southern California Public Power Authority (SCPPA), is an active member of the APPA DEED Program.

Azusa Energy Efficiency Program Results, FY 2015-16
Azusa
CategoryUnits
Installed
Gross Coincident
Peak Savings (kW)
Gross Annual Energy Savings
(kWh)
Gross Lifecycle Energy Savings
(kWh)
Net Coincident Peak Savings
(kW)
Net Annual Energy Savings
(kWh)
Net Lifecycle Energy Savings
(kWh)
Net Lifecycle GHG
Reductions (Tons)
Utility Incentives Cost
($)
Utility Mktg, EM&V, and
Admin Cost ($)
Total Utility Cost ($)
Utility ($/kWh)
Res Clothes WashersRes CoolingRes DishwashersRes ElectronicsRes HeatingRes LightingRes Pool PumpRes RefrigerationRes Shell 1 4 4,443 133,290 4 4,443 133,290 79 $18,456 $578 $19,035 $0.28Res Water HeatingRes Comprehensive 3 26 442,291 1,690,053 21 353,833 1,352,042 805 $58,037 $7,101 $65,138 $0.06Res BehaviorNon-Res CookingNon-Res Cooling 7 154 231,012 3,458,994 154 231,012 3,458,994 2,213 $27,068 $23,426 $50,495 $0.02Non-Res HeatingNon-Res Lighting 32 233 1,318,977 15,215,630 211 1,151,859 13,711,568 8,121 $158,691 $72,442 $231,133 $0.02Non-Res Motors 1 11 27,500 412,500 11 27,500 412,500 230 $10,000 $1,819 $11,819 $0.04Non-Res Pumps 1 55 857,221 2,571,663 55 857,221 2,571,663 1,433 $12,055 $12,055 $0.01Non-Res Refrigeration 11 22 193,578 2,007,498 22 193,578 2,007,498 1,119 $61,803 $9,137 $70,939 $0.05Non-Res Shell 7 142 436,463 6,067,805 139 433,477 6,014,057 3,653 $263,430 $35,933 $299,362 $0.07Non-Res Process 3 4 12,108 133,156 4 12,108 133,156 74 $4,429 $604 $5,033 $0.05Non-Res Comprehensive 1 28 75,485 754,850 28 75,485 754,850 458 $55,566 $4,682 $60,248 $0.10Non-Res BehaviorOther
67 679 3,599,078 32,445,439 648 3,340,516 30,549,618 18,185 $657,479 $167,777 $825,257 $0.03
T&DCodes and Standards 1 240 1,424,252 14,242,520 166 982,734 9,827,339 5,969 $60,952 $60,952
Total 68 919 5,023,330 46,687,959 814 4,323,250 40,376,957 24,154 $657,479 $228,729 $886,208
TRC Test 2.55 PAC Test 4.62 Excluding T&D
Resource Savings Summary Cost Summary

CITY OF BANNING City of Banning At a Glance
• Established in 1922. • Climate Zone 15 • 27 employees. • Of the 12,111 customers, 91% are residential • Average demand during FY 15/16 was 16.75 MW, down 0.3% from the prior period. • Peak demand during FY 15/16 was 44.5 MW, up 4.9% from the prior period. Peak
demand is primarily due to air conditioning load during the summer. • Retail energy sales in FY 15/16 were 139,950,565 kWh, down 3.5% from the prior
period. Retail sales are broken down as 48 percent residential and 52 percent commercial/industrial/institutional.
City of Banning Overview During FY 15/16, Banning spent $167,480 in Energy Efficiency programs, which have provided 319,202 kWh energy savings. It should be noted that the City of Banning is located in an economically disadvantaged area. A significant portion of the City’s population is either low income or senior citizens living on a fixed income. Due to the economic demographics of Banning’s population, a significant portion of Public Benefits dollars are utilized to provide low-income assistance through reduced rates. Major Program Changes One of Banning’s main goals for FY 2015/16 is to expand participation in its commercial retrofit and refrigeration programs, primarily through the adoption of significantly increased monetary incentives for our small commercial businesses. To accomplish this goal Banning increased the budget and worked with community organizations to further increase awareness and overall participation of the Business Energy Efficiency Funds, or “B.E.E.F” program. Program Descriptions
• Business Energy Efficiency Fund: Monetary incentives for commercial customers to install energy efficiency upgrades/retrofits such as lighting, refrigeration, motors, air conditioning tune-ups, etc.
• Air Conditioner: Monetary incentives to replace an existing central air conditioning unit with a new high-efficiency unit.
• EnergyStar® Appliances: Monetary incentives for purchasing products that meet the Energy Star®” criteria.
• EnergyStar® Refrigerator: A monetary incentive for replacing an old inefficient refrigerator with a new energy efficient unit.
• Recycle: Rebates offered to remove and recycle operating old and inefficient refrigerators and freezers.

• Energy Weatherization: Monetary incentives to replace inefficient materials with products that will improve the energy efficiency of their facility and reduce energy use.
• Shade Tree: Rebates offered to plant shade trees around homes to help reduce the amount of energy used for air conditioning.
• Commercial Programs: Monetary incentives for commercial customers to install more energy-efficient equipment such as lighting, signage, refrigeration, etc.
• New Construction: Monetary incentives for new construction projects that exceed the energy efficiency above California’s Title 24 standards.
• Energy Audits: Provides customers with a variety of recommendations for reducing energy consumption.
• Low Income Assistance: An electric utility reduced Baseline Rate for qualified customers. As mentioned above, a large portion of the Public Benefits funds are spent providing low-income assistance.
EM&V The City of Banning Electric Utility has hired third-party firms, such as Lincus, Inc., to perform EM&V studies in previous years. The City will continue with its EM&V programs and practices. Complimentary Programs Renewable Portfolio Standard. The City of Banning is set to reach greater than 70 percent renewables by 2018. In support of this goal, Banning is doing all of the following:
• The City has contracted for geothermal energy from two generating facilities. Together they supply approximately 19 percent of the City’s energy need.
• The City has reached an agreement to divest itself of its interest in the San Juan Generating Station Unit 3 by December 31, 2017. Once this divestiture is complete, the City will be replacing this coal-based energy with renewable energy. The City has already entered into long-term renewable energy contracts that will increase the City’s renewables to greater than 70% of retail sales by 2018.
• Banning has met its California SB1 requirements by providing $2.4 million in rebates for the installation of solar photovoltaic systems in its service territory. The rebates have helped install approximately 0.75MW of customer-owned solar photovoltaic capacity in the city.
Electric Vehicles. The State of California has set a goal of having 1.5 million zero emission vehicles on the roads by 2025. It is anticipated that the majority of these zero emission vehicles will be electric vehicles. As battery storage technology improves, the costs for electric vehicles will continue to decline, which will result in a higher participation in electrical vehicle ownership within the Utility’s territory.
• The City received a grant to have an electrical vehicle public charging station constructed in the McDonald’s parking lot, which is now completed, and running.

Banning Energy Efficiency Program Results, FY 2015-16
Banning
CategoryUnits
Installed
Gross Coincident
Peak Savings (kW)
Gross Annual Energy Savings
(kWh)
Gross Lifecycle Energy Savings
(kWh)
Net Coincident Peak Savings
(kW)
Net Annual Energy Savings
(kWh)
Net Lifecycle Energy Savings
(kWh)
Net Lifecycle GHG
Reductions (Tons)
Utility Incentives Cost
($)
Utility Mktg, EM&V, and
Admin Cost ($)
Total Utility Cost ($)
Utility ($/kWh)
Res Clothes Washers 19 667 7,341 634 6,973 4 $950 $137 $1,087 $0.20Res Cooling 84 16 174,594 1,641,654 15 165,865 1,559,571 987 $30,100 $45,938 $76,038 $0.06Res Dishwashers 27 8,856 97,416 8,413 92,545 55 $1,350 $1,711 $3,061 $0.04Res ElectronicsRes HeatingRes LightingRes Pool Pump 1 365 4,015 347 3,814 2 $100 $81 $181 $0.06Res Refrigeration 45 7,849 109,887 7,457 104,393 59 $3,010 $1,862 $4,872 $0.06Res ShellRes Water HeatingRes ComprehensiveRes BehaviorNon-Res CookingNon-Res Cooling 37 2 10,175 152,625 2 9,666 144,994 90 $3,750 $3,210 $6,960 $0.07Non-Res HeatingNon-Res Lighting 856 2,091 115,382 1,231,485 1,256 74,318 815,231 483 $57,417 $16,627 $74,044 $0.12Non-Res MotorsNon-Res PumpsNon-Res Refrigeration 5 1 1,313 18,103 1 788 10,862 6 $1,052 $185 $1,237 $0.16Non-Res ShellNon-Res ProcessNon-Res ComprehensiveNon-Res BehaviorOther
1,074 2,110 319,202 3,262,526 1,273 267,488 2,738,384 1,686 $97,729 $69,751 $167,480 $0.08
T&DCodes and Standards
Total 1,074 2,110 319,202 3,262,526 1,273 267,488 2,738,384 1,686 $97,729 $69,751 $167,480
TRC Test 2.22 PAC Test 2.47 Excluding T&D
Resource Savings Summary Cost Summary

CITY OF BIGGS Biggs Municipal Utilities at a Glance
• Electric utility established in 1904 • Biggs is located in climate zone 11 • The electric utility has 736 retail customer connections servicing 698 retail customers • Percent of retail sales by customer class are as follows: residential, 43%, commercial, 7%
and industrial, 50% • Budgeted amount for energy efficiency programs for FY 15/16 was $9166.91 The
amount actually expended was $4668.11, funded through a 2.85% Public Benefits Surcharge. Unallocated funds were re-appropriated to augment funding for our Solar PV Incentive Program.
Utility Overview City of Biggs experienced a 9% load increase in FY 2016, reversing the trend of the last several years. Multiple factors contributed to the increase, including the addition of 20 single-family residential units and increased activity at our industrial customer, Sunwest Milling. Economic conditions in Biggs and the surrounding communities remain depressed, dampening customer enthusiasm for any investments in energy efficiency measures. Our customers who do have disposable income are choosing to invest in solar P.V. rather than energy efficiency measures. Of the 40 commercial properties we serve, 16 are empty and 9 are simply relay stations for cable, telephone service or rail road signals. An additional 4 are church properties used once or twice a week, so rebates for upgrades to their efficiency levels is not cost effective. Our summer cooling load is relatively high, due to our high summer temperatures and aging housing stock, but customers will not work with the city to replace aging systems unless rebate levels rise far beyond what is currently offered. We have yet to identify a cost effective way to make HVAC rebates available to our customers. Major Program Changes There have been no major changes in programs offered or budgeted funds for energy efficiency programs during this reporting cycle. With low customer participation, budgets were lowered and some unused funds were re-appropriated to support our Solar PV Program. Program Descriptions
• Referral to Community Action Agency for LiHEAP grants. • Commercial Lighting Program: Customized Lighting Retrofit Rebate Program available to
all commercial customers and educational facilities.

• Commercial HVAC Program : Customized HVAC Retrofit & Optimization Program provides generous incentives for businesses and educational facilities to update aging HVAC units or tune-up units that don’t need replacement.
• Residential Appliance Program: This program offers incentives to residential customers for the purchase of Energy-Star rated refrigerators and the recycling older units.
• Residential HVAC Program: Tiered incentives for replacement of aging HVAC units at residential properties. The greater the SEER level above Title 24 requirements, the greater the potential incentive. The Res. HVAC program also provides incentives for tune-ups of HVAC units, the installation of 7-day programmable thermostats and the installation of whole-house fans.
• Residential Shell Program: This program offers incentives for increasing insulation levels and installation of dual-pane, low E windows to replace existing single-pane. Future programs may include whole-house air sealing.
EM&V In 2007, in response to AB 2021, Biggs hired a third-party contractor to formulate an EM & V plan. In 2008, 2009 & 2010, Biggs contracted with Navigant Consulting to perform Energy Efficiency Program Evaluation studies of all programs the city offers. Those studies can be found on the NCPA website and our city website. With the understanding that all programs need not be evaluated every year, Biggs moved to evaluation of all programs, in three year blocks. Biggs is currently working to find a consultant to perform multiple years worth of EM&V reports and have budgeted $10,000 toward fulfilling our EM&V requirement. Sources of Energy Savings Data 2015 TRM and 2011 DEER were used to calculate savings. Complimentary Public Benefits Programs
• Renewable Energy Programs: Biggs offers incentives to customers who install up to 3 kW of solar PV capacity for residential service and custom incentive programs for commercial customers.
• Low-Income Programs: Biggs works with Community Action Agency of Butte County to provide weatherization, appliance replacement, lighting replacement and HEAP grants to income-qualified household within our service territory.
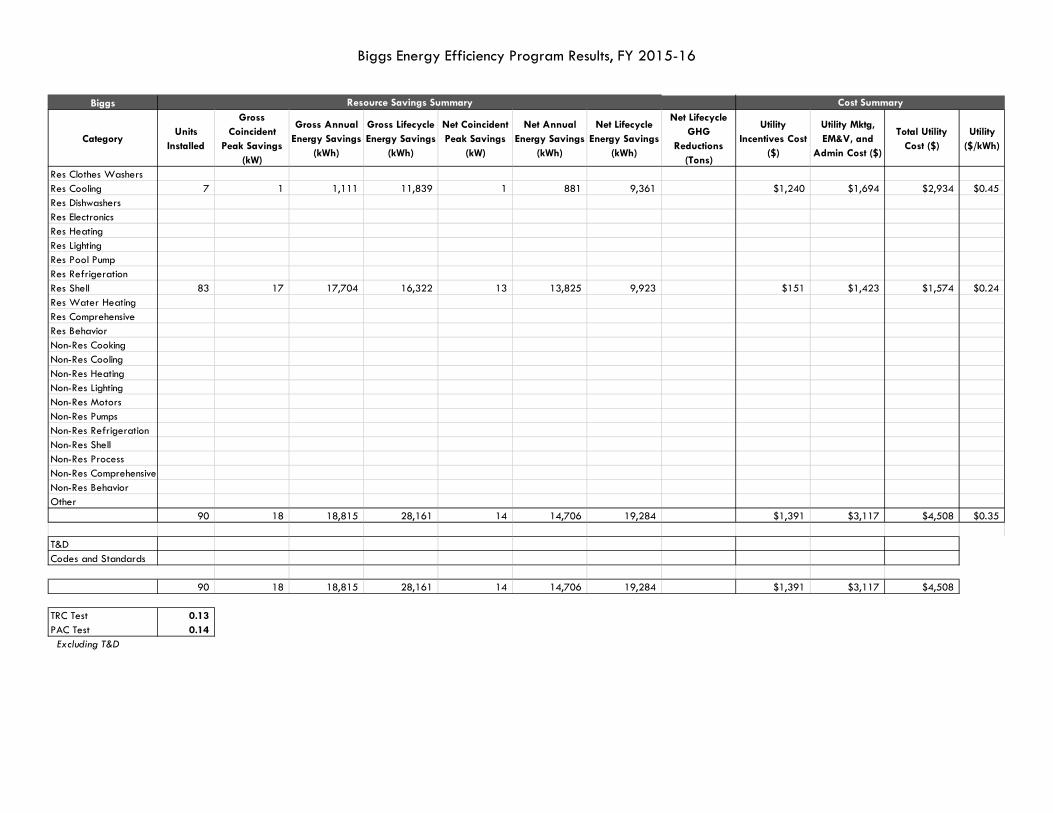
Biggs Energy Efficiency Program Results, FY 2015-16
Biggs
CategoryUnits
Installed
Gross Coincident
Peak Savings (kW)
Gross Annual Energy Savings
(kWh)
Gross Lifecycle Energy Savings
(kWh)
Net Coincident Peak Savings
(kW)
Net Annual Energy Savings
(kWh)
Net Lifecycle Energy Savings
(kWh)
Net Lifecycle GHG
Reductions (Tons)
Utility Incentives Cost
($)
Utility Mktg, EM&V, and
Admin Cost ($)
Total Utility Cost ($)
Utility ($/kWh)
Res Clothes WashersRes Cooling 7 1 1,111 11,839 1 881 9,361 $1,240 $1,694 $2,934 $0.45Res DishwashersRes ElectronicsRes HeatingRes LightingRes Pool PumpRes RefrigerationRes Shell 83 17 17,704 16,322 13 13,825 9,923 $151 $1,423 $1,574 $0.24Res Water HeatingRes ComprehensiveRes BehaviorNon-Res CookingNon-Res CoolingNon-Res HeatingNon-Res LightingNon-Res MotorsNon-Res PumpsNon-Res RefrigerationNon-Res ShellNon-Res ProcessNon-Res ComprehensiveNon-Res BehaviorOther
90 18 18,815 28,161 14 14,706 19,284 $1,391 $3,117 $4,508 $0.35
T&DCodes and Standards
90 18 18,815 28,161 14 14,706 19,284 $1,391 $3,117 $4,508
TRC Test 0.13 PAC Test 0.14 Excluding T&D
Resource Savings Summary Cost Summary

BURBANK WATER AND POWER Burbank Water and Power (BWP) At a Glance
• Located in Climate Zone 9 • More than 46,000 residential and more than 6,500 commercial electric service
connections, serving a total population of about 105,000 residents and more than 3,300 businesses.
• 1,086,100 MWh in total retail sales. Percent of retail sales by customer class – 26% residential, 74% non-residential.
• The Fiscal Year (FY) 2015-16 budget for energy efficiency (including EM&V, admin/overhead, incentives) was $3,507,400. Of this, $3,007,420 (86%) was spent. BWP’s funding source for energy efficiency programs is the Public Benefits Charge. BWP can reallocate unspent budgeted dollars to other Public Benefits programs or, more typically, invests them in the following fiscal year. In FY 2016-17, BWP has budgeted $3,618,000 for energy efficiency programs.
Burbank Water and Power Overview Burbank is known as the Media Capital of the World, and is home to two of the world’s largest studios, Warner Bros. and Disney. The city is also home to thousands of smaller businesses, many of whom moved to Burbank in the early 1990s after the aerospace industry contracted and real estate became plentiful and cheap. From BWP, these businesses have come to expect cost-effective and reliable electric service, as well as additional services such as fiber optic networking. At the same time, Burbank has a vibrant residential community, with a housing mix of about 18,500 single family homes that ranges from post-war bungalows to two story view homes. There are also about 27,000 multifamily homes, a figure that continues to increase with infill and high-density development. As a result of nearly 20 years of energy efficiency history, increasingly stringent codes and standards, and a community ethos of sustainability, the average Burbank household uses about 500 kWh per month. This efficient baseline makes it a challenge to design programs that can squeeze more energy efficiency juice out of an increasingly shrinking lemon. BWP’s energy efficiency portfolio has been designed to reflect our organizational goal of continuing to provide sustainable, affordable, and reliable service to all of our residents and businesses. At the same time, BWP is adjusting to changes in the utility industry, including concepts such as:
1. “Negative Load Growth,” where energy efficiency and subsidized distributed generation are “fully” offsetting economic growth; and,
2. The “Duck Curve”, where customer solar PV generation in the afternoon leads to a steep ramp up in the amount of electricity required to be supplied by the utility in the evening. This results in a daily load profile that resembles a duck, invalidating current Time Of Use (TOU) rate design and resource planning criteria.
To address the operational challenges of the Duck Curve, in FY 2014-15, BWP implemented a first-of-its kind policy to restrict solar PV rebates to systems that are westerly-facing. By orienting solar panels to the west, customers can increase their solar energy output during the afternoon peak hours while reducing output during the morning hours. The effect of these new initiatives,

along with an Electric Vehicle (EV) charger rebate and higher rebates for ENERGY STAR central air conditioners and variable speed pool pumps, to address these challenges are discussed in further detail below. Major Program Changes BWP has consistently led the way in innovation and quality especially during periods of industry change and transitions. FY 2015-16 has presented unique opportunities for the utility to grow and adapt to current events. On October 23, 2015, the Aliso Canyon Storage Facility north of Porter Ranch, CA suffered an unprecedented gas leak losing over 100,000 metric tons of methane gas in a four month period. Since 60 percent of the electricity used in Southern California is generated by natural gas and 17 power plants (including the Magnolia Power Plant operated by BWP and jointly owned with five other SCPPA members) are served by the Aliso facility, BWP had concerns that the leak might affect service in Burbank. In anticipation of potential shortages in service, BWP instituted a broad communications campaign to keep residents informed. BWP’s increased reliance on digital communications has resulted in increased engagement with, and more convenience for, customers. The following table shows the results of these efforts. In addition, BWP’s The Wire newsletter continues to offer business owners access to online energy efficiency tips, business cost savings, productivity increase advice and readily accessible information on “industry-specific utility” research topics in order to assist them to succeed while reducing energy expenditures. Website portals Visits for FY 2014-
15 Visits for FY 2015-16
Increase
burbankwaterandpower.com 368,228 687,416 87% BWP Twitter 1,289 1,645 28% Lighting Web Calculator 273 443 62% Home Energy Reports 907 6,379 603% The HVAC Upstream Program for commercial customers was BWP’s new innovative approach toward changing the commercial HVAC market itself by influencing market supply. Four key players are involved in HVAC supply—manufacturers, distributors, contractors, and commercial customers. Normally, commercial customers receive utility rebates for installing high-efficiency equipment, which is referred to as a “downstream” incentive. The “upstream” incentive works in reverse; whereby, incentives are given to distributors to stock and supply high-efficiency products for customers to install in their businesses. Industry research has shown that the “upstream” approach results in greater participation than its conventional incentive counterpart. BWP contracted with Energy Solutions, who is responsible for distributor outreach, collaboration, and incentive processing to provide above-code, high efficiency HVAC equipment, with incentives paid per ton based on the type of HVAC unit and the efficiency level. In FY 2015-16, the first year of implementation, the program achieved more than 300,000 annual kWh savings along with 160 kW peak demand annual savings that directly mitigates the impact of the Duck Curve. BWP provided rebates for more than 700 tons of cooling, while reducing the per unit cost by nearly 40 percent, and plans to expand the program in upcoming years. Also in FY 2015-16, BWP implemented EV Charger rebates in order to promote clean energy use and encourage residents to manage their electric load by charging their EVs at home and during off-peak hours. The new rebates are up to $500 for Level 2 chargers installed in residential homes and up to $1,000 for multi-family and commercial properties. In addition, residents who

receive the rebate are required to participate in TOU electric rates. TOU is an electric billing rate schedule designed to encourage customers to use electricity during the most cost-effective periods in the day. As a result of BWP’s complete Automated Meter Infrastructure (AMI), all commercial customers are already on TOU rates. In addition to addressing both negative load growth and the Duck Curve, BWP hopes that the rebates will encourage an increase in EV sales for customers, thus reducing harmful greenhouse gas emissions and helping to meet the state’s climate goals, and improving the environment for the Burbank community. Program Highlight For residents, BWP’s flagship program is the Home Improvement Program (HIP). Previously called the Green Home House Call (but later changed to better reflect what the program offered customers), HIP is available at no charge to participants. BWP introduced the program in November 2009 as a whole house, direct install program and has been expanding it ever since. The program was designed to reduce electric use and BWP has partnered with the Southern California Gas Company and the Metropolitan Water District of Southern California to leverage additional funding and reduce natural gas and water use as well. The program has several components, including an in-home audit with energy and water education and installation of CFL and LED lamps and water savings devices. In addition, BWP assesses single family homes for additional services including the installation of attic insulation, duct testing and sealing, central air conditioning tune-ups and air sealing, as well as outdoor water conservation measures. In FY 2015-16, the program served nearly 1,100 households, resulting in annual savings of nearly 700,000 kWh. With the current program, many of our participating residents are now qualified to receive incentives through the state’s Advanced Energy Upgrade California Program. Program Descriptions The following is a sampling of BWP’s largest programs by end-use: Residential Cooling and Non-Residential Cooling: BWP provides services that address all aspects of space cooling for residential homes and commercial buildings, including rebates for the purchase of high-efficiency air conditioners and heat pumps, and free HVAC tune-ups. For FY 2015-16, BWP increased the residential HVAC equipment rebate by $20 per ton, resulting in a 20 percent increase in participation. Residential Lighting: BWP provides free compact fluorescent and LED lamps to residents through our Home Improvement Program (HIP), as well as to participants in our Refrigerator Roundup program. In FY 2015-16, BWP provided residents with 2,000 LED lamps – 29% more lamps compared to the previous fiscal year. The use of LED lamps is another proven strategy for mitigating the effects of the Duck Curve. Residential Pool Pump: For FY 2015-16, BWP doubled the rebate for residential pool pumps from $200 to $400, resulting in an 85 percent increase in participation. Residential Refrigeration: BWP provides rebates for the purchase of ENERGY STAR refrigerators, including 230 in FY 2015-16. BWP also provides new ENERGY STAR refrigerators at no cost to income-qualified customers. In addition, BWP also removes and recycles residents’ second refrigerators at no cost in order to reduce their bills and lessen these older appliances’ impact on the grid. Through both of these replacement programs, 250 inefficient refrigerators were replaced with more efficient models generating nearly 130,000 kWh in annual electricity savings.

Non-Residential Lighting: BWP provides free direct installation services, including for high efficiency lighting, to all qualified small businesses in Burbank. In addition, BWP provides rebates per annual electricity saved for customized lighting projects, including $0.10 per kWh saved for LED lighting. Through these efforts, BWP generated 4.4 million kWh in annual electricity savings for our commercial customers. EM&V Along with most other POUs in California, BWP uses the E3 Reporting Tool to ensure accurate reporting of electricity and peak demand savings and cost-effectiveness. In order to verify these savings, and meet the requirements of AB 2021, BWP also builds evaluation, measurement, and verification elements into every program and facilitates independent third-party studies. BWP’s previous EM&V studies can be found at http://www.ncpa.com/current-issues/energy-efficiency-reports.html. Sources of Energy Savings The majority of energy savings values used to evaluate BWP’s program performance were obtained from the TRM developed for California’s POU by a third-party firm, ERS. In the case where an installed measure was not available in the TRM, BWP relied on vendor or other third-party data to estimate energy savings. Complementary Programs
• Low-Income Programs: BWP offers a Lifeline rate to about 2,000 income-qualified customers, a 40 percent discount off the standard residential electric rate, making it among the most generous programs in the state. BWP also offers the Refrigerator Exchange program for Lifeline customers.
• Renewable Energy Programs: BWP continues to offer its Solar Support Rebate program to both residential and commercial customers. In FY 2015-16, the rebate for residential customers was $0.64 per watt installed, and $0.49 per watt installed for commercial customers. During the current fiscal year, 28 rebates were provided for solar PV systems that are westerly-facing, in order to minimize the effects of the Duck Curve. Due to falling equipment prices, our Solar Support program continues to be very popular and has been fully subscribed. At the same time, 142 systems, or more than 80 percent of new residential solar photovoltaic (PV) systems were installed without a rebate, which demonstrates the increasing cost-effectiveness of solar PV systems.
• Research, Development, and Demonstration: BWP operates a demonstration program of 23 Ice Bear units installed at City-owned buildings and large businesses. The Ice Bear is a peak-shifting thermal energy storage unit that works with air conditioners. The unit is simply a tank containing water that is frozen during off-peak hours; the ice is then used to provide cooling, in substitution of the air conditioner’s compressor, during peak hours. In FY 2015-16, the units provided about 250 kW of peak demand capacity reduction, directly mitigating the impact of the Duck Curve.
• Energy Storage: In addition to the Ice Bear units, and investment opportunities at utility-
scale, BWP is investigating distribution-level and customer-owned energy storage in a number of ways, through Requests for Information and Proposals through SCPPA’s Energy Storage Working Group.

Burbank Energy Efficiency Program Results, FY 2015-2016
Burbank
CategoryUnits
Installed
Gross Coincident
Peak Savings (kW)
Gross Annual Energy Savings
(kWh)
Gross Lifecycle Energy Savings
(kWh)
Net Coincident Peak Savings
(kW)
Net Annual Energy Savings
(kWh)
Net Lifecycle Energy Savings
(kWh)
Net Lifecycle GHG
Reductions (Tons)
Utility Incentives Cost
($)
Utility Mktg, EM&V, and
Admin Cost ($)
Total Utility Cost ($)
Utility ($/kWh)
Res Clothes Washers 374 13,838 152,218 13,838 152,218 91 $32,790 $1,581 $34,371 $0.27Res Cooling 1,207 208 307,167 4,601,495 208 307,167 4,601,495 2,969 $195,704 $215,733 $411,437 $0.12Res Dishwashers 314 8,164 81,640 8,164 81,640 48 $19,020 $803 $19,823 $0.29Res ElectronicsRes HeatingRes Lighting 2,581 4 62,874 839,034 4 62,874 839,034 476 $21,128 $29,458 $50,586 $0.08Res Pool Pump 112 4 75,488 754,880 4 75,488 754,880 451 $37,100 $8,430 $45,530 $0.07Res Refrigeration 480 16 159,828 1,505,784 16 159,828 1,505,784 850 $109,980 $27,554 $137,534 $0.11Res Shell 237,862 233 206,270 3,810,044 233 206,270 3,810,044 2,268 $208,518 $125,477 $333,995 $0.12Res Water HeatingRes Comprehensive 2,137 5,418,204 12,012,664 5,418,204 12,012,664 7,151 $467,199 $163,927 $631,126 $0.06Res BehaviorNon-Res CookingNon-Res Cooling 8 1,211 1,492,281 19,693,069 1,211 1,492,281 19,693,069 12,597 $340,007 $307,568 $647,574 $0.04Non-Res HeatingNon-Res Lighting 5 1,180 4,525,971 49,671,305 1,180 4,525,971 49,671,305 29,419 $882,248 $537,905 $1,420,153 $0.03Non-Res Motors 4 17 218,120 2,487,350 17 218,120 2,487,350 1,386 $624,848 $22,829 $647,677 $0.33Non-Res PumpsNon-Res Refrigeration 1 2 12,791 102,328 2 12,791 102,328 57 $720 $930 $1,650 $0.02Non-Res Shell 1 6 9,318 55,908 6 9,318 55,908 34 $4,091 $691 $4,782 $0.10Non-Res ProcessNon-Res Comprehensive 5 273 214,805 2,358,114 273 214,805 2,358,114 1,432 $90,115 $29,159 $119,274 $0.06Non-Res BehaviorOther
245,091 3,156 12,725,118 98,125,833 3,156 12,725,118 98,125,833 59,230 $3,033,467 $1,472,044 $4,505,512 $0.06
T&DCodes and Standards
Total 245,091 3,156 12,725,118 98,125,833 3,156 12,725,118 98,125,833 59,230 $3,033,467 $1,472,044 $4,505,512
TRC Test 1.87 PAC Test 3.30 Excluding T&D
Resource Savings Summary Cost Summary

CITY COLTON ELECTRIC DEPARTMENT Colton Electric Utility at a Glance
• Colton Electric Department (CED) was established in 1895 by the City of Colton. • CED is in Climate Zone 10. • CED has 18,032 retail customer connections. 16,138 Residential, 2,033 Commercial, 76
Industrial, and 210 Municipal. • Percent of retail sales by customer class – Residential-28%, Commercial-19%, Industrial-
51%, and other 2%. • CED budgeted amount for energy efficiency programs was $1,244,000. The amount
actually expended was $813,912.75. All unused EE dollars are reallocated to other Public Benefits programs the following fiscal year.
Colton Electric Utility Overview Fiscal year 2015/2016 expenditures increased 109% ($388,744.31 to $813,912.75) from the previous reporting year. To help increase the number of participants CED expanded its selection of rebates and increased the direct installation budgets for commercial energy efficiency projects. Major Program Changes CED continues to expand its program development by entering into additional Southern California Public Power Authority (SCPPA) contract agreements to provide more EE programs for residential and commercial customers. This reporting year CED entered into an agreement with Southern California Gas Company to provide a joint low income direct installation program for manufactured homes in CED service territory. CED has also been able to increase its residential participation with additional rebate programs that support the water/energy nexus during this time of drought. Program Highlight The small business direct installation program made the greatest impact in terms of energy savings. The program provided 359,251 kWh’s of EE savings. These savings were a result of replacing T12 fluorescents to LED lights. 37 small businesses in Colton participated in the program and were satisfied with the decrease in their bill. The program that continues to provide the greatest community impact and support is the Living Wise school program. This program provided Energy and Water Efficiency kits for all 6th grade students and curriculum to the teachers in the service territory of the CED. This was the first funded educational outreach program to students from CED that provides a water energy nexus. The positive feedback from the teachers and students has made this program part of the ongoing growing portfolio of EE for CED.

Program Descriptions • EE Rebates Non-Res: Commercial and industrial customers participated in lighting and
equipment upgrades offering $0.075 per kWh saved on the projected first year’s savings.
• EE Rebates Res: Residential customers participated in varying energy efficient upgrades installed in their homes such as A/C upgrade rebates. Rebates all have different refund amounts depending on measure installed.
• Refrigerator Replacement Program (ARCA): CED assisted customers with replacing old inefficient refrigerator with new energy efficient models. The utility provided the new unit for $15 a month, billed for 12 consecutive months on the customer’s account. Total unit cost to the customer is $180.
• A/C Tune-Up: CED Changed this program to a rebate program from • KYC: Keep Your Cool was a new program offered to small commercial businesses with
inefficient refrigeration, lighting and cooling. The program provided $5,000 per location in EE upgrades.
• RHA Res: Residential customers with annual energy usage of over 10,000 kWh or previously participated in an energy audit received direct install EE measures.
• Synergy Non-Res: Small business customers with peak demands less than 20 kW participated in an energy audit and direct install of EE measures.
• Hospitality: Commercial program for lodging/hotels that provides a whole building approach for energy efficiency. EE measures included in this program are: retrofits for lighting to LED’s, insulation, HVAC controls, duct test and seal and pool and spa pump upgrades
• Living Wise Program: School based energy efficiency education program, designed to generate long term resource savings by bringing interactive take home kits containing high efficiency measures they use to install within their home.
EM&V CED contracted with AESC in this reporting year to complete a study of the residential direct install program and associated savings. The AESC study is available on CED website, (www.ci.colton.ca.us/DocumentCenter/View/3225). CED will continue to make EM&V reports available to the CEC and other parties as they are completed and will continue with its EM&V programs and practices in the future. Sources of Energy Savings The sources used to calculate program performance were the Technical Reference Manual (TRM) and Database for Energy Efficiency Resources (DEER).. The TRM was utilized for all measures that had not been updated in the 2014 Title 24 code changes. Complimentary Programs
• Renewable Energy Programs: This reporting year Public Benefit Funds did not fund any renewable energy programs. The Electric Utility enterprise fund, funded solar photovoltaic

rebates for residential customers and funded the planning and construction of a community solar project expected to be completed end of FY2015/2016.
• Low-Income Programs: Low Income applicants were provided a monthly credit of 139 kWh added to tier 1 at lower the lower .08 rate. This program change was the result of a program evaluation completed the previous reporting year.
• Research, Development, and Demonstration (RD&D): This reporting year CED is partnered with SCPPA to take part in a solar heat pump application on a water well location to cool down the city’s Water Department pumping station. This will be a joint study shared with other SCPPA utilities.
• Electric Vehicles: This reporting year CED was awarded grant funding from the South Coast Air Quality Management District to install three Electric vehicle charging stations curbside at two multifamily housing complexes. The installation is expected to be completed the end of 2016. Two additional chargers are also being planned to be installed to provide additional City departments EV charging.
• Energy Storage: Colton Electric Utility participated in an energy storage working group through SCPPA. Energy storage is not cost effective for the Utility at this time.

Colton Energy Efficiency Program Results, FY 2015-16
Colton
CategoryUnits
Installed
Gross Coincident
Peak Savings (kW)
Gross Annual Energy Savings
(kWh)
Gross Lifecycle Energy Savings
(kWh)
Net Coincident Peak Savings
(kW)
Net Annual Energy Savings
(kWh)
Net Lifecycle Energy Savings
(kWh)
Net Lifecycle GHG
Reductions (Tons)
Utility Incentives Cost
($)
Utility Mktg, EM&V, and
Admin Cost ($)
Total Utility Cost ($)
Utility ($/kWh)
Res Clothes Washers 21 2,877 31,647 892 9,811 $1,575 $377 $1,952 $0.26Res Cooling 35 17 9,989 66,872 16 9,642 62,467 $14,118 $10,414 $24,532 $0.49Res Dishwashers 16 416 4,160 250 2,496 $1,200 $79 $1,279 $0.66Res ElectronicsRes HeatingRes Lighting 4 18 173,656 1,969,823 18 173,656 1,969,823 $68,360 $47,762 $116,122 $0.08Res Pool Pump 8 5,392 53,920 3,235 32,352 $3,200 $1,597 $4,797 $0.19Res Refrigeration 184 11 65,875 434,383 8 46,113 304,068 $43,280 $9,975 $53,255 $0.22Res Shell 2,720 6 8,407 124,949 2 2,606 38,760 $4,208 $1,399 $5,606 $0.21Res Water HeatingRes ComprehensiveRes BehaviorNon-Res CookingNon-Res Cooling 10 2 2,900 43,500 1 2,465 36,975 $1,000 $2,497 $3,497 $0.14Non-Res HeatingNon-Res Lighting 5 428 618,642 8,047,384 428 618,642 8,047,384 $239,082 $346,406 $585,488 $0.10Non-Res Motors 1 26 183,605 2,019,653 26 183,605 2,019,653 $99,823 $54,796 $154,620 $0.10Non-Res PumpsNon-Res RefrigerationNon-Res ShellNon-Res ProcessNon-Res ComprehensiveNon-Res BehaviorOther
3,004 508 1,071,759 12,796,290 499 1,041,105 12,523,788 $475,847 $475,301 $951,148 $0.10
T&DCodes and Standards 1 234 1,384,659 1,384,659 234 1,384,659 1,384,659 $97,377 $97,377
Total 3,005 742 2,456,418 14,180,949 733 2,425,764 13,908,447 $475,847 $572,678 $1,048,524
TRC Test 0.14 PAC Test 0.15 Excluding T&D
Resource Savings Summary Cost Summary
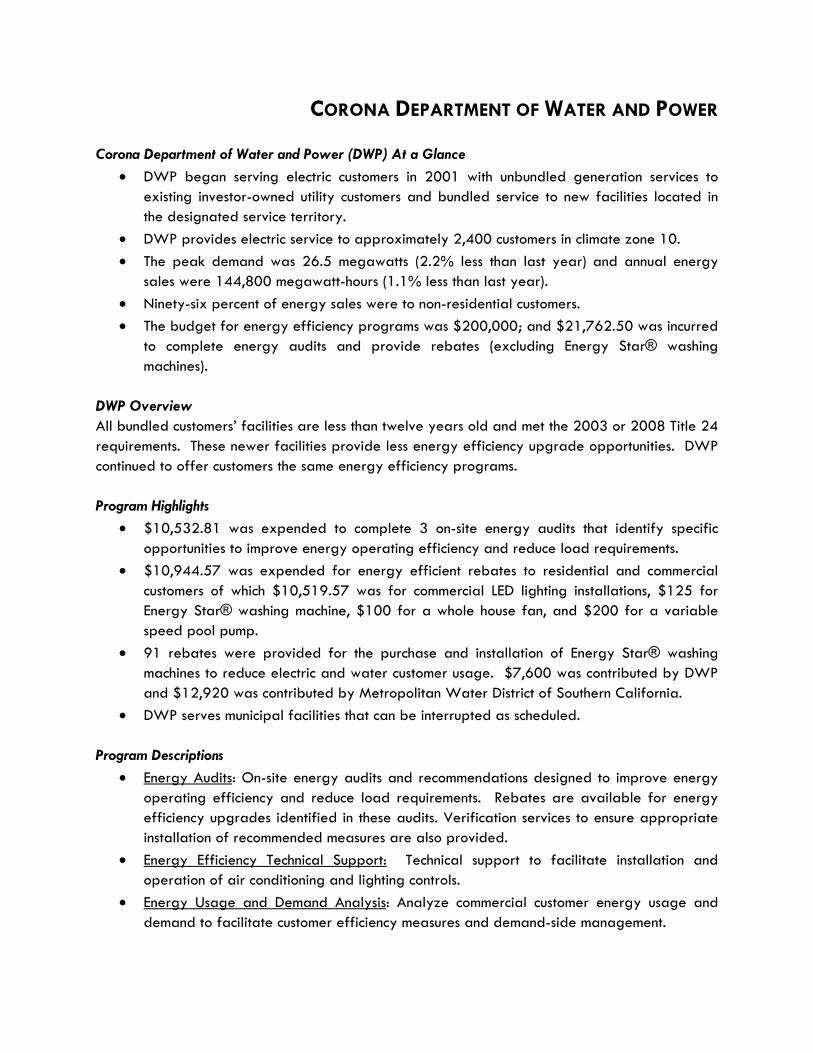
CORONA DEPARTMENT OF WATER AND POWER
Corona Department of Water and Power (DWP) At a Glance • DWP began serving electric customers in 2001 with unbundled generation services to
existing investor-owned utility customers and bundled service to new facilities located in the designated service territory.
• DWP provides electric service to approximately 2,400 customers in climate zone 10. • The peak demand was 26.5 megawatts (2.2% less than last year) and annual energy
sales were 144,800 megawatt-hours (1.1% less than last year). • Ninety-six percent of energy sales were to non-residential customers. • The budget for energy efficiency programs was $200,000; and $21,762.50 was incurred
to complete energy audits and provide rebates (excluding Energy Star® washing machines).
DWP Overview All bundled customers’ facilities are less than twelve years old and met the 2003 or 2008 Title 24 requirements. These newer facilities provide less energy efficiency upgrade opportunities. DWP continued to offer customers the same energy efficiency programs. Program Highlights
• $10,532.81 was expended to complete 3 on-site energy audits that identify specific opportunities to improve energy operating efficiency and reduce load requirements.
• $10,944.57 was expended for energy efficient rebates to residential and commercial customers of which $10,519.57 was for commercial LED lighting installations, $125 for Energy Star® washing machine, $100 for a whole house fan, and $200 for a variable speed pool pump.
• 91 rebates were provided for the purchase and installation of Energy Star® washing machines to reduce electric and water customer usage. $7,600 was contributed by DWP and $12,920 was contributed by Metropolitan Water District of Southern California.
• DWP serves municipal facilities that can be interrupted as scheduled. Program Descriptions
• Energy Audits: On-site energy audits and recommendations designed to improve energy operating efficiency and reduce load requirements. Rebates are available for energy efficiency upgrades identified in these audits. Verification services to ensure appropriate installation of recommended measures are also provided.
• Energy Efficiency Technical Support: Technical support to facilitate installation and operation of air conditioning and lighting controls.
• Energy Usage and Demand Analysis: Analyze commercial customer energy usage and demand to facilitate customer efficiency measures and demand-side management.

• Energy Efficiency Kits: Energy efficiency kits for all residential customers that include low flow showerheads, low flow faucet aerators, toilet dye tabs, and energy conservation tips brochure.
• Appliances: Rebates are provided to customers who purchase and install Energy Star® washing machines.
• Lighting Incentives: Provides incentives to improve energy efficiency for a variety of lighting applications, which reduce energy usage by a specified amount.
• Custom Energy Efficiency Incentives: Offers financial incentives for cost-effective energy-savings opportunities, not served by existing offerings, (including HVAC, motors, pumps, refrigeration, process and other) which reduce energy usage or load requirements by a specified amount.
• Utility-Side Projects/Activities: Direct funding for projects/activities on the utility-side of the meter that promote customers benefits in terms of improved safety, system integrity, energy efficiency, conservation, or research and development.
Evaluation, Measurement and Verification:
• Engineering analysis programs are the basis for energy savings and incentive calculations. • The budget for energy efficiency was $200,000; and $21,762.50 was incurred for the
period July 1, 2015 – June 30, 2016. Three on-site energy audits were completed and $10,944.57 in energy efficiency incentive payments were disbursed.
Sources of Energy Savings: The TRM provided energy savings estimates for DWP programs. Energy efficiency incentive payments were funded from the Public Purpose Programs Charge fund. Complimentary Public Benefit Programs: Low-Income Programs: DWP does not offer low-income programs. Renewable Energy Programs:
• Solar Initiative Program: The Solar Incentive Program provides financial incentives to qualifying customers to reduce the cost of renewable energy generation. The 2015 rebate incentive is equal to the estimated performance of the installed solar system multiplied by $0.78/watt AC.
• Net Metering Program: A net metering tariff schedule is available to qualifying customers. • DWP Solar Installations: DWP has installed 350 kW of photovoltaic systems.
Electric Vehicles: DWP is in the process of installing nine electric charging vehicle stations. Energy Storage: DWP’s energy storage goal is to procure cost-effective energy storage applications equal to one percent (1%) of its peak load during calendar year 2020, with installations occurring no later than the end of calendar years 2021. No specific cost-effective energy storage application has been identified to date.

Corona Energy Efficiency Program Results, FY 2015-16
Corona
CategoryUnits
Installed
Gross Coincident
Peak Savings (kW)
Gross Annual Energy Savings
(kWh)
Gross Lifecycle Energy Savings
(kWh)
Net Coincident Peak Savings
(kW)
Net Annual Energy Savings
(kWh)
Net Lifecycle Energy Savings
(kWh)
Net Lifecycle GHG
Reductions (Tons)
Utility Incentives Cost
($)
Utility Mktg, EM&V, and
Admin Cost ($)
Total Utility Cost ($)
Utility ($/kWh)
Res Clothes Washers 1 184 2,024 57 627 $125 $12 $137 $0.29Res CoolingRes DishwashersRes ElectronicsRes HeatingRes LightingRes Pool Pump 1 674 6,740 404 4,044 2 $200 $81 $281 $0.09Res RefrigerationRes Shell 1 522 10,440 146 2,923 2 $100 $49 $149 $0.08Res Water HeatingRes Comprehensive 3 300 1,500 300 1,500 1 $10,533 $10,533 $8.11Res BehaviorNon-Res CookingNon-Res CoolingNon-Res HeatingNon-Res Lighting 578 28 124,848 873,936 23 99,878 699,149 414 $10,411 $142 $10,553 $0.02Non-Res MotorsNon-Res PumpsNon-Res RefrigerationNon-Res ShellNon-Res ProcessNon-Res ComprehensiveNon-Res BehaviorOther
584 28 126,528 894,640 23 100,786 708,243 420 $21,369 $283 $21,652 $0.04
T&DCodes and Standards
Total 584 28 126,528 894,640 23 100,786 708,243 420 $21,369 $283 $21,652
TRC Test 1.18 PAC Test 4.30 Excluding T&D
Resource Savings Summary Cost Summary

GLENDALE WATER & POWER Glendale Water & Power At a Glance
• Established in 1909 • Climate Zone 9 • 87,347 electric meters and 34,086 water meters. • Total retail sale of electricity for FY 2015-16 of 1,090,851 MWh • Retail sales (MWh) by customer class – Residential (35.18%), Commercial (30.71%),
Industrial (33.26%), Street lighting (.84%) • Budgeted amount for energy efficiency programs: $1,533,000, amount actually
expended: $1,491,103 and funding source: Electric Revenue. The unused budget is maintained in a fund balance to be applied towards qualifying projects, programs and services.
Utility Overview With the installation of digital meters, Glendale Water & Power (GWP) has developed new innovative energy efficiency, load management, and demand response programs for its customers. Our customers are eager to take advantage of the many benefits and new programs a modernized utility offers. Trends in utilities are leading towards digital communications, need for real time and near real time usage information that will help consumers take charge of their energy use and give them the tools to manage it. A modernized electric grid greatly expands data acquisition and data sharing across business units, lowers system losses, prevents energy theft and dramatically improves outage and asset management, reducing maintenance and capital costs with the goal of keeping downward pressure on consumer prices. For the current FY 2015-16 reporting year, GWP‘s energy efficiency programs saved 17,602 MWh (1.61% of retail sales) and reduced peak demand by 10.52 MW (3.17% of peak demand). With a modernized utility system, GWP will offer more programs and increase customer engagement through mobile applications to enable our customers to be stewards in conservation by giving them the tools to empower them. Major Program Changes In FY 2015-2016 we continued the implementation of two pilot programs. The Behavioral Demand Response pilot program which greatly contributed with peak demand reduction and the Conservation Voltage Reduction pilot program which was expanded and yielded an increase on energy savings. Program Highlights Our Home Energy Reports from OPOWER, the Large Business Energy Solutions program and the Conservation Voltage Reduction pilot program produced the most energy savings from our portfolio. The Home Energy Reports had the greatest impact on our residential customers, we are currently among the top reporting energy efficiency utilities from OPOWER’s portfolio. This program also reached the majority of our customers and provides constant communication and engagement. Our Business Energy Solutions program is a CMUA award winning program that is designed to allow GWP large business customers the flexibility to define their own needs and

develop their own energy efficiency projects. The Conservation Voltage Reduction pilot program was expanded to include two additional transformers which contributed to our increased annual energy savings. Program Descriptions Glendale Water & Power is a leader in many aspects of the utility industry. Along with aggressive conservation efforts, GWP has been giving back to the Community through its Public Benefit Programs. These programs not only assist low-income customers with their electric bills, they also provide funding and education for all customers to invest in new technologies helping them save money and lower their energy and water consumption. Residential Customer Programs
• OPOWER Home Energy Reports - Provides six print paper reports annually to 50,000 residential customers on their energy use. Reports also include action steps for each household to help them reduce their electricity consumption. Currently, the program is integrating the existing two month billing data and a wealth of external data sources to educate customers on how they can save energy. With the installation of digital meters throughout Glendale’s service territory, customers are mailed a home energy report that includes their Smart Grid data and access to the website where they can review their energy usage. (Res Comprehensive)
• OPOWER Web Portal - Provides up to 75,000 customers with web-access to electric usage information from their digital meters. The software analytics engine enables the coupling of insightful messaging with specific, targeted action steps for each household to help the customer reduce their electricity consumption. The addition of interval electric usage data has given customers the ability to view their usage in monthly, weekly, daily or hourly intervals. Access to granular information coupled with the analytic engine will provide customers with greater insight into their usage and provide more in-depth ways for them to save energy and money.
• Behavioral Demand Response Pilot Program - GWP partnered with Opower to design a residential Behavioral Demand Response (BDR) program which leveraged AMI data analytics, behavioral science, and multi-channel communications to give customers personalized insights on how to best trim their electricity use during peak events. This program targeted 40,000 utility residential customers to receive electronic, IVR, and paper communication using a behavioral science approach. The communications encourages customers to adjust their energy consumption during periods of peak energy demand. BDR is an innovative approach to residential demand response because it gives customers personalized feedback on their performance shortly after a peak event is complete. Customers no longer have to wait until their monthly bill to see how much they saved and this is paramount to locking in positive peak shaving behaviors for future events. (Res Cooling)
• Smart Home Energy and Water Savings Rebates - Provides incentives to promote the purchase of approved energy and water saving appliances and devices. Anticipate having a web portal for residents to submit their rebate applications online available during FY 2016-17 (Res Shell, Res Cooling, Res Dishwasher, Res Pool Pump, Res Refrigerator, Res Clothes Washers)

• Smart Home AC Tune-Ups - Provided by Proctor Engineering, helps residential customers save energy by ensuring that their air conditioning and duct systems are functioning at their optimal level. (Res Shell)
• Livingwise® - Provides energy and water conservation education materials for Glendale public and private school students. These materials support 10 hours of intensive energy education as well as in-home installation of energy saving devices including compact florescent light bulbs. (Res Comprehensive, Res Lighting)
• Tree Power - Provides up to three free shade trees and arborist services to ensure that the trees are planted correctly. When properly sited and cared for, a healthy, mature shade tree helps provide shade that cools the home and helps reduce air conditioning use. (Res Cooling)
• Conservation Voltage Reduction (CVR) - GWP partnered with Dominion Voltage, Inc. to provide their EDGE solution, a conservation voltage reduction (CVR) program, as a pilot. CVR conserves electricity by operating electric customer voltages in the lower half of the ten percent (10%) voltage band required by ANSI equipment standards. (Res Cooling)
• Mobile My Connect - CMUA award winning program that provides residential customers a free mobile application through GWP’s Smart Customer Mobile engagement program which offers residential customers an interactive app called GWP- Mobile My Connect to better manage their energy and water usage on a smart phone, tablet and web anytime and anywhere. The user-friendly portal platform, provided by Smart Utility Systems (SUS), delivers real-time usage information and two-way communication between the customer and GWP. GWP – Mobile My Connect, allows residential customers to view current and historical bills as well as pay bills, set budget goals, submit service requests, view/report outages, send messages directly to GWP and obtain electric vehicle or solar panel usage information.
• In-Home Display/Thermostat Program - GWP partnered with CEIVA Energy, LLC to provide a unique In-Home Display (IHD) solution for residential customers. The CEIVA IHD is a digital picture frame that integrates customer’s personal photographs with meaningful and useful historical water usage information and near real time electric consumption information. The CEIVA IHD works as a home gateway that simultaneously communicates with GWP’s electric digital meters as well as the customer’s existing home networks via Wi–Fi or Ethernet. In addition to providing interval energy and water consumption usage information, GWP has the ability to enhance outreach, by pushing energy efficiency program, conservation and event messages directly to the IHD. In FY 2014-15 GWP’s pilot consisted of 72 IHD’s with a broad cross section of residential customers. GWP expanded our current pilot with CEIVA from 72 to 187 customers in FY 2015-16, and integrated smart thermostats, and remote provisioning/web portal software. Currently in FY 2016-17 there are a total of 558 IHD’s and smart thermostats installed in customers’ homes and planning to install an additional 742 by the end of the fiscal year.
Commercial Customer Programs
• Smart Business Energy Saving Upgrades - CMUA award winning program that provides small business customers with comprehensive no‐cost energy surveys, customized written reports, energy education, and directly installs as much as $2,000 worth of cost‐effective energy conservation measures. (Non-Res Comprehensive, Non-Res Lighting)

• Smart Business AC Tune-Ups - Provided by Proctor Engineering, helps small business customers save energy by ensuring that their air conditioning systems are functioning at their optimal level. (Non-Res Shell)
• Business Energy Solutions (BES) - CMUA award winning program that provides incentives for medium and large businesses to complete pre‐approved energy saving retrofit projects. Qualified customers can receive up to $50,000 in incentives per fiscal year. Projects must be cost-effective from the customer’s perspective based on the value of total estimated energy savings over the life of the installed measures. Incentives for approved retrofit projects are limited to 20% of eligible project cost or 100% of the incremental costs necessary to bring a remodeling and/or new construction project above the minimum Title 24 energy standard. In no case will an incentive exceed the value saved energy over the life of the measures assuming $0.06 per kWh saved. (Non-Res Lighting, Non-Res Cooling, Non-Res Motors)
New Programs – FY 2016-2017 • Unusual Usage Alerts - GWP and Opower are partnering to launch Unusual Usage
Alerts (UUAs) to all GWP customers that sign up for the service. UUAs are designed to analyze AMI data to help customers save energy and money when they are likely to consume more energy than usual for a billing period. Before the end of a billing period, UUAs inform customers that they are likely to have high energy use, and they provide insights to help customers reduce their consumption before the billing period ends.
• Small and Medium Business Analytics - The business website portal and mobile platform will seek to engage small to medium-sized business customers over a mobile platform that provides comprehensive energy management information designed to provide insight and business customer interaction related to energy and water usage, energy efficiency and conservation, and device/appliance management for continuous improvement on energy management and energy decisions.
EM&V Glendale Water & Power plans to initiate EM&V analysis of energy efficient programs in FY 2016-17 in support of AB2021. For FY 2016-17 Glendale has budgeted $50,000 to its energy efficiency budget to conduct EM&V studies that will be conducted through the use of a third-party contractor. GWP will select energy efficiency programs based on the kWh savings. The purpose of the EM&V study is to ensure that measures are installed as claimed by GWP and to lend credibility to GWP’s savings reports as compared to the industry standards that were available at the time of GWP’s program processing and implementation. It is Glendale’s plan to review all energy efficiency programs in terms of cost effectiveness, customer participation and administration. Glendale Water & Power consistently performs the following in support of EM&V activities:
• A pre-and post-inspection of 100% of all large commercial retrofit projects under the Business Energy Solutions program, including a review of their energy-saving calculations.
• All residential and commercial solar PV installations are field inspected and verified by city personnel for program compliance.

• Audits and installations performed by third-party contractors for Glendale’s direct install Smart Business Energy Saving Upgrades program have high inspection rates that are performed by the consultant.
Sources of Energy Savings The sources of energy savings used to calculate program performance was a combination of using the TRM, work papers and third party EE verifications. Complimentary Public Benefits Programs Renewable Energy Programs: These programs provide incentives to install solar photovoltaic systems in Glendale. Funding supported by Public Benefit Funds and distributed between residential, small business and large business customers. GWP has budgeted for the Smart Home Solar Solutions program beyond the SB1 sunset date.
• Smart Home Solar Solutions - This program provides incentives to promote the installation of grid-connected solar photovoltaic systems in Glendale. A total of .9704 MW in grid-connected residential solar photovoltaic installations in FY 2015-16.
• Business Solar Solutions - This program provides incentives to promote the installation of grid-connected solar photovoltaic systems on small businesses in Glendale. A total of .8893 MW in grid-connected small business solar photovoltaic installations in FY 2015-16.
• Large Business Solar Solutions - This program provides incentives to promote the installation of grid-connected solar photovoltaic systems on large businesses in Glendale. An existing total of .0812 MW in grid-connected large business solar photovoltaic installations in FY 2015-16.
Low-Income Programs:
• Senior Care - This program provides electric bill discounts for low-income seniors and disabled customers 55 and older. Senior Care was closed to new participants in 2009 when Glendale Care was implemented.
• Glendale Care - This program offers all eligible low-income customers a discount of $13 on their electric bills.
• Guardian - This program provides bill discounts for households with special electrically powered medical equipment needs.
• Helping Hand - This program provides bill payment and deposit assistance for low-income customers.
Research, Development, and Demonstration:
• Codes & Standards - GWP has included our respective share of the energy savings that are attributable to the State’s Building Codes and Appliance Standards that are applied and enforced by the City of Glendale.
Electric Vehicles:
• Electric Vehicles - Received approval from Glendale’s City Council to invest in our EV infrastructure. We seek to expand GWP’s EV charging station infrastructure throughout the City by adding 10 level II public charging stations.

• EV Level II Charger Rebate - Offer a maximum of $500 rebate to residential and commercial customers who install a Level II (240V) EV charger in Glendale.
Energy Storage:
• Battery Energy Storage System - Currently installing a new 2 MW Battery Energy Storage System (BESS), at Glendale’s Grandview Substation. This BESS will help to regulate our interconnection to operate within threshold demands. In addition, the system will help mitigate the intermittence of the renewable resources such as solar generation. This project is scalable so that we can gain experience on how to use the storage technology to determine full scale energy storage projects in the future. The scale projects will increase the redundancy and resiliency of our power system.

Glendale Energy Efficiency Program Results, FY 2015-16
Glendale
CategoryUnits
Installed
Gross Coincident
Peak Savings (kW)
Gross Annual Energy Savings
(kWh)
Gross Lifecycle Energy Savings
(kWh)
Net Coincident Peak Savings
(kW)
Net Annual Energy Savings
(kWh)
Net Lifecycle Energy Savings
(kWh)
Net Lifecycle GHG
Reductions (Tons)
Utility Incentives Cost
($)
Utility Mktg, EM&V, and
Admin Cost ($)
Total Utility Cost ($)
Utility ($/kWh)
Res Clothes Washers 249 21,563 237,193 6,685 73,530 44 $16,339 $101 $16,440 $0.30Res Cooling 522 8,234 1,327,616 2,766,218 8,221 1,068,988 2,219,870 1,432 $113,211 $5,578 $118,789 $0.07Res Dishwashers 171 5,534 55,340 3,320 33,204 20 $5,629 $43 $5,673 $0.22Res ElectronicsRes HeatingRes Lighting 1,453 198,770 1,987,704 198,770 1,987,704 1,127 $59,980 $2,371 $62,351 $0.04Res Pool Pump 55 2 37,070 370,700 1 22,242 222,420 133 $5,875 $330 $6,205 $0.04Res Refrigeration 257 23,259 325,619 16,281 227,933 129 $17,209 $280 $17,489 $0.11Res Shell 737 256 152,251 1,540,548 252 147,161 1,476,663 879 $53,321 $2,033 $55,354 $0.05Res Water HeatingRes Comprehensive 1,454 119 7,697,193 8,804,379 119 7,697,193 8,804,379 5,242 $558,000 $12,288 $570,288 $0.07Res BehaviorNon-Res CookingNon-Res Cooling 5 616 1,395,152 23,011,520 616 1,395,152 23,011,520 14,719 $160,145 $39,060 $199,205 $0.01Non-Res HeatingNon-Res Lighting 184 432 2,465,930 26,661,300 432 2,465,930 26,661,300 15,791 $451,657 $37,835 $489,491 $0.02Non-Res MotorsNon-Res PumpsNon-Res RefrigerationNon-Res Shell 196 802 4,457,558 5,554,667 788 4,436,761 5,138,732 3,121 $20,936 $8,442 $29,378 $0.01Non-Res ProcessNon-Res Comprehensive 141 89 143,397 430,191 89 143,397 430,191 261 $28,801 $731 $29,532 $0.08Non-Res BehaviorOther
5,424 10,550 17,925,292 71,745,379 10,518 17,601,880 70,287,446 42,898 $1,491,103 $109,092 $1,600,195 $0.03
T&DCodes and Standards
Total 5,424 10,550 17,925,292 71,745,379 10,518 17,601,880 70,287,446 42,898 $1,491,103 $109,092 $1,600,195
TRC Test 2.65 PAC Test 5.87 Excluding T&D
Resource Savings Summary Cost Summary

GRIDLEY MUNICIPAL UTILITY Gridley Municipal Utility At a Glance
• Year Established: 1910 • Climate Zone: 11 • Number of Retail Customers Served: 2881 • Percent of Retail Sales by Customer Class: 45% Residential, 55% Commercial/Industrial • Energy Efficiency Program Budget: $140,000 • Energy Efficiency Program Expenditures: $119.979. The balance of the budgeted funds
was used to cover internal administrative expenses at GMU. Gridley Municipal Utility Overview GMU feels a significant responsibility to its community to invest their Public Benefits funds in such a way as to impact both energy savings and financial savings/positive economics in Gridley. GMU offers a comprehensive menu of rebates to all of our customers. GMU’s customer demographic has historically resulted in lower customer participation in programs that require capital investment by the customer. To compensate for this, GMU has offered direct install programs that provide energy efficiency measures to customers at little or no cost to them. In FY16, GMU offered a Residential Direct Install program that provided screw-in based LEDs and advanced smart power strips to customers at no charge. This is a very popular program, and the benefits have been helpful and appreciated by Gridley citizens. Program Highlight The Commercial Lighting Program delivered the greatest percentage of savings in FY16, accounting for 76% of the total savings. The residential direct install program accounted for 13% of energy savings. There were also a variety of residential rebates processed for appliances, insulation and windows. The net annual kWh savings of 167,978 in FY16 represents 98.8% of GMU’s AB2021 goal 170,000 kWhs. Looking forward to FY17, GMU plans to continue offering the popular direct install programs to commercial and residential customers, as well as a comprehensive list of commercial and residential rebate programs. Program Descriptions GMU manages a comprehensive energy efficiency incentive program for residential and commercial customers focusing on energy efficiency and peak load reduction. For residential customers, rebates are offered for the installation of various energy efficiency measures, such as lighting, HVAC, appliances, and weatherization. For commercial customers, rebates are available for upgraded lighting, HVAC, appliances, refrigeration equipment, electronics, and in cases where an analysis is performed rebates can be offered for additional equipment that reduces energy

use and/or demand. On-site energy audits are provided by GMU energy specialists. Energy efficiency measures are recommended and additional visits are completed upon request.
• Residential Lighting Program [Res Lighting]: GMU offers rebates to homeowners who install ENERGY STAR® qualified LED lamps/bulbs, ceiling fans and LED holiday lights.
• Residential HVAC Program [Res Cooling]: GMU offers rebates to homeowners who install high performance heat pumps, central air-conditioners, room air-conditioners, whole house fans, or evaporative coolers that exceed current state requirements. GMU also offers a rebate for duct sealing when not required by code.
• Residential Equipment Program [Res Clothes Washers; Res Dishwashers; Res Pool Pump; Res Refrigeration]: GMU offers rebates to homeowners who purchase new ENERGY STAR
qualified products, including clothes washers, room air conditioners, dishwashers, pool pumps, and refrigerators.
• Residential Weatherization Program [Res Shell]: GMU offers rebates to homeowners who invest in weatherizing their homes, including attic/wall/duct insulation, window treatments/replacement, air/duct sealing and radiant barriers.
• Residential Water Heater Rebate Program [Res Water Heating]: GMU offers rebates to homeowners who purchase a new, energy efficient electric water heater.
• Residential Direct Install Program [Res Electronics; Res Lighting]: Audits are performed on residential homes and advanced smart power strips and ENERGY STAR rated LEDs are installed at no cost to the homeowner.
• Commercial Lighting Program [Non-Res Lighting]: GMU offers rebates to business owners who invest in the installation of energy efficiency lighting upgrades. There is a prevalence of inefficient lighting throughout the city and most high bay lighting uses high intensity discharge fixtures instead of more efficiency fluorescent or LED fixtures.
• Commercial Custom Program [Non-Res Comprehensive]: GMU offers rebates to business owners based on site-specific consumption. Rebates are tailored to the individual business owner’s needs based on the audit and the potential energy savings associated with the customer project.
EM&V GMU’s last EM&V report was performed on work completed between July 1, 2008 and June 30, 2009. GMU has budgeted $5,000 in FY2017 for evaluation of our programs. GMU is currently exploring the opportunity of partnering with a group of other NCPA utilities on this EM&V effort in order to gain economies of scale. Sources of Energy Savings For FY16, GMU has relied heavily on the savings listed in the Technical Resource Manual. The Commercial Lighting and Commercial Custom programs rely on custom savings calculations. Complimentary Programs
• Energy Storage: GMU is participating in the NCPA/SCPPA joint contract with DNV GL to provide an updated evaluation of energy storage technologies.

Gridley Energy Efficiency Program Results, FY 2015-16
Gridley
CategoryUnits
Installed
Gross Coincident
Peak Savings (kW)
Gross Annual Energy Savings
(kWh)
Gross Lifecycle Energy Savings
(kWh)
Net Coincident Peak Savings
(kW)
Net Annual Energy Savings
(kWh)
Net Lifecycle Energy Savings
(kWh)
Net Lifecycle GHG
Reductions (Tons)
Utility Incentives Cost
($)
Utility Mktg, EM&V, and
Admin Cost ($)
Total Utility Cost ($)
Utility ($/kWh)
Res Clothes Washers 3 852 9,372 264 2,905 1 $300 $3,512 $3,812 $1.74Res Cooling 4 257 3,851 205 3,081 2 $593 $1,899 $2,491 $1.17Res DishwashersRes Electronics 100 21,200 106,000 16,960 84,800 48 $8,000 $1,394 $9,394 $0.13Res HeatingRes Lighting 1,051 1 8,138 122,070 1 4,395 65,918 33 $15,755 $2,190 $17,945 $0.39Res Pool PumpRes Refrigeration 2 259 3,632 182 2,542 1 $200 $4,083 $4,283 $2.38Res Shell 6,070 6 6,592 127,417 2 2,170 42,156 24 $4,703 $10,253 $14,956 $0.57Res Water HeatingRes ComprehensiveRes BehaviorNon-Res CookingNon-Res Cooling 12 1 1,500 22,500 1 1,275 19,125 12 $1,500 $513 $2,013 $0.15Non-Res HeatingNon-Res Lighting 1 9 158,978 1,907,741 8 127,183 1,526,193 846 $26,579 $23,480 $50,059 $0.04Non-Res MotorsNon-Res PumpsNon-Res Refrigeration 1 773 9,276 464 5,566 3 $200 $73 $273 $0.07Non-Res ShellNon-Res ProcessNon-Res Comprehensive 1 18,601 18,601 14,881 14,881 8 $3,720 $238 $3,958 $0.28Non-Res BehaviorOther
7,245 18 217,151 2,330,460 11 167,978 1,767,166 978 $61,550 $47,633 $109,183 $0.08
T&DCodes and Standards
Total 7,245 18 217,151 2,330,460 11 167,978 1,767,166 978 $61,550 $47,633 $109,183
TRC Test 1.36 PAC Test 1.93 Excluding T&D
Resource Savings Summary Cost Summary
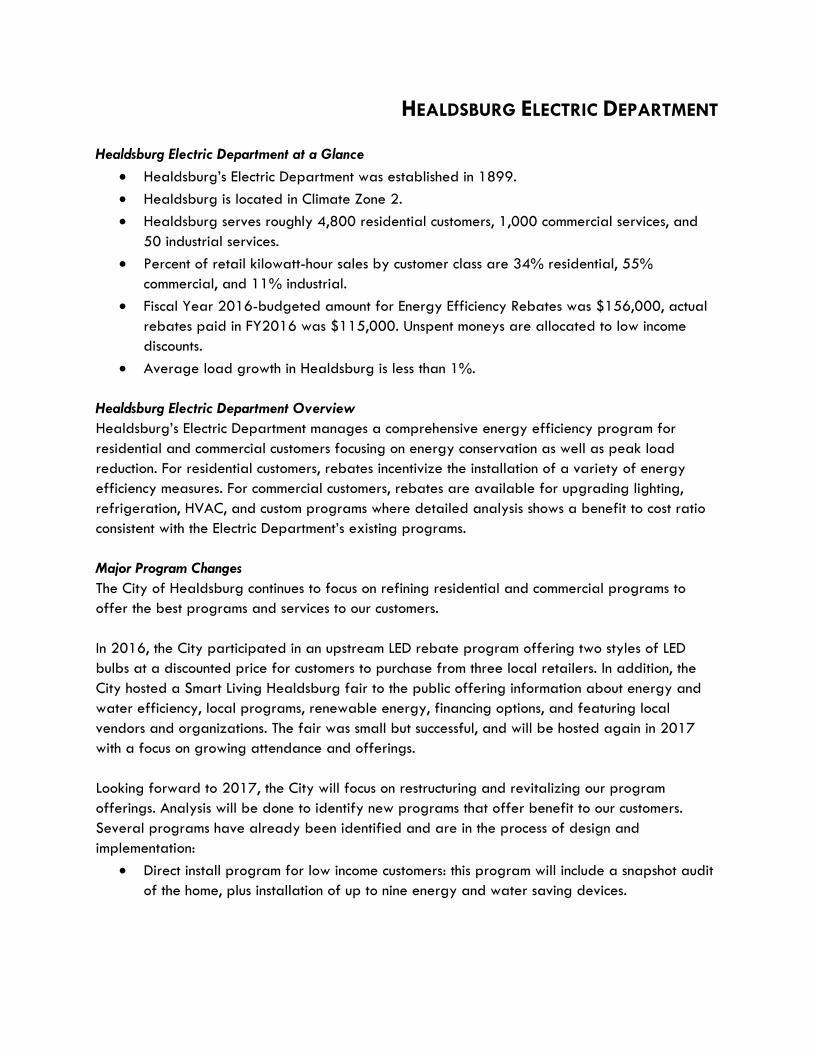
HEALDSBURG ELECTRIC DEPARTMENT Healdsburg Electric Department at a Glance
• Healdsburg’s Electric Department was established in 1899. • Healdsburg is located in Climate Zone 2. • Healdsburg serves roughly 4,800 residential customers, 1,000 commercial services, and
50 industrial services. • Percent of retail kilowatt-hour sales by customer class are 34% residential, 55%
commercial, and 11% industrial. • Fiscal Year 2016-budgeted amount for Energy Efficiency Rebates was $156,000, actual
rebates paid in FY2016 was $115,000. Unspent moneys are allocated to low income discounts.
• Average load growth in Healdsburg is less than 1%. Healdsburg Electric Department Overview Healdsburg’s Electric Department manages a comprehensive energy efficiency program for residential and commercial customers focusing on energy conservation as well as peak load reduction. For residential customers, rebates incentivize the installation of a variety of energy efficiency measures. For commercial customers, rebates are available for upgrading lighting, refrigeration, HVAC, and custom programs where detailed analysis shows a benefit to cost ratio consistent with the Electric Department’s existing programs. Major Program Changes The City of Healdsburg continues to focus on refining residential and commercial programs to offer the best programs and services to our customers. In 2016, the City participated in an upstream LED rebate program offering two styles of LED bulbs at a discounted price for customers to purchase from three local retailers. In addition, the City hosted a Smart Living Healdsburg fair to the public offering information about energy and water efficiency, local programs, renewable energy, financing options, and featuring local vendors and organizations. The fair was small but successful, and will be hosted again in 2017 with a focus on growing attendance and offerings. Looking forward to 2017, the City will focus on restructuring and revitalizing our program offerings. Analysis will be done to identify new programs that offer benefit to our customers. Several programs have already been identified and are in the process of design and implementation:
• Direct install program for low income customers: this program will include a snapshot audit of the home, plus installation of up to nine energy and water saving devices.

• LED instant rebate pilot program: this program will offer an instant rebate at the point of sale for a variety of LED bulbs. Depending on the success of the pilot, the program could be expanded.
• Green business program: In partnership with the County of Sonoma’s Energy Independence program, the City will offer a green business certification to commercial customers. This program will offer services and assistance identifying and making energy efficiency improvements.
Program Highlight The City’s commercial energy efficiency program continues to be our most successful program. Calendar year 2016 saw rebates for new and different technologies, primarily in the wine processing industry. The City will continue to focus on developing commercial projects, especially with our wine industry customers, as there are large potentials for energy efficiency projects in these applications. The City of Healdsburg’s commercial energy efficiency program is completely customizable, based on the customer’s need and proposed project, and offers an incentive per kilowatt-hour as well as an adder (“kicker”) for peak demand reduction. The incentive for demand reduction provides higher value to projects that reduce system peak demands. This, as well as the residential programs, led to 986,602 kWh saved; roughly 1% of Healdsburg annual sales. Program Descriptions The City offers the following residential programs: • Energy Efficiency Hotline: The City’s electrical customers can call the City’s Utility Conservation
Analyst to answer questions and provide information on energy efficiency related matters.
• Free Home Audits: On-site energy and water audits are available to residential customers. Energy efficiency measures are recommended based on each audit and upon request, the customer is provided a written report summarizing findings and recommendations to reduce the customer’s monthly energy consumption.
• Appliance Rebates: The City provides rebates for the purchase of several ENERGY STAR® rated appliances.
• Residential Heat Pump and Efficient Air Conditioning Rebates: The City offers rebates for residential and small business customers who install high performance heat pumps, central air-conditioners or evaporative coolers that exceed current state requirements.
• Residential Lighting Rebates: The City offers rebates to homeowners who install ENERGY STAR® qualified LED lamps and LED string lights.
• Residential Electric Water Heater: The City offers customers a rebate toward the installation of new, energy efficient electric water heaters.

• Weatherization/Window Incentives: The City provides financial incentives for homeowners who invest in home weatherization and window replacement projects.
The City offers the following commercial programs: • Energy Audits and Rebates: This program offers complementary, on-site energy audits for
both commercial and industrial customers. Energy efficiency recommendations and follow up visits support implementation of recommended energy efficiency measures. Energy efficiency rebates are available for upgrades identified through these audits.
• Commercial Lighting: This program engages local lighting and electrical contractors to promote and install energy efficient lighting upgrades through technical assistance and financial incentives available from Healdsburg’s Electric Department.
• Commercial Refrigeration and HVAC: The City offers commercial customers a wide selection of refrigeration and HVAC rebates. These rebates are performance based and provided greater reward to projects that reduce system peak demand.
• Custom Energy Efficiency Programs: The Healdsburg Electric Department will consider custom energy efficiency programs for site-specific consumption. The Electric Department will require that the City’s contractor review and endorse all custom programs. This review may result in a small cost adder to the proposed project but validates the benefit to cost ratio of the program. The Healdsburg Electric Department retains the sole right to approve or deny custom projects.
EM&V Past EM&V reports can be found through the following link: http://www.ncpa.com/current-issues/energy-efficiency-reports.html. The City plans to complete additional EM&V reports in calendar year 2017. Sources of Energy Savings The City of Healdsburg relies on TRM data to calculate energy savings. Complimentary Programs
• Renewable Energy Programs: Although the City of Healdsburg reached its Net Energy Metering (NEM) installed capacity goal in January 2016, the City’s NEM program continues as designed, minus the rebate, for all customers interesting in pursuing solar installations. As a lower cost alternative, the City provides a “Green Rate” for customers choosing to fully cover their energy use from non-carbon sources.
• Low-Income Programs: The City of Healdsburg actively supports a low-income discount for low-income customers. Annually, this discount supports over 410 customers, or about 8.5% of the City’s residential customers.

• Research, Development, and Demonstration: In 2016, the City of Healdsburg worked to implement energy savings rebates and programs for vineyard and winery customers to help achieve large reduction in energy usage and demand. The City will continue to work on development and further implementation of this program.
• Electric Vehicles: The City of Healdsburg has one plug-in hybrid in its fleet and includes analysis of plug-in hybrid and eV alternatives when considering new fleet purchases. In addition, the City continues to provide and maintain six charging stations located at City Hall. These stations, four installed in 2015 and two in 2013, have supplied 89 MWh of energy and saved more than 37 metric tons of GHG. The City plans to install 12 new electric vehicle charging stations in 2017 as well as continue to grow our electric vehicle fleet.
• Energy Storage: The City of Healdsburg has not pursued energy storage projects as they continue to be cost prohibitive. Instead, the City incentivizes energy efficiency programs to promote the reduction of peak demand which has effectively limited the City’s historical growth in peak demand. The City does include energy storage as a consideration for new projects and, at such time that energy storage technologies become less expensive, our incentive programs no longer effectively reduce peak demand, or additional capacity is no longer available or cost effective to purchase, the City will pursue energy storage projects.

Healdsburg Energy Efficiency Program Results, FY 2015-16
Healdsburg
CategoryUnits
Installed
Gross Coincident
Peak Savings (kW)
Gross Annual Energy Savings
(kWh)
Gross Lifecycle Energy Savings
(kWh)
Net Coincident Peak Savings
(kW)
Net Annual Energy Savings
(kWh)
Net Lifecycle Energy Savings
(kWh)
Net Lifecycle GHG
Reductions (Tons)
Utility Incentives Cost
($)
Utility Mktg, EM&V, and
Admin Cost ($)
Total Utility Cost ($)
Utility ($/kWh)
Res Clothes Washers 11 3,197 35,167 991 10,902 5 $150 $3,219 $3,369 $0.40Res Cooling 19 581 8,715 465 6,972 4 $1,310 $6,100 $7,410 $1.48Res Dishwashers 7 406 4,060 244 2,436 1 $420 $720 $1,140 $0.59Res ElectronicsRes HeatingRes Lighting 504 4 31,496 472,370 3 24,228 363,378 183 $12,635 $7,400 $20,035 $0.08Res Pool Pump 8 5,392 53,920 3,235 32,352 16 $1,000 $2,300 $3,300 $0.13Res Refrigeration 13 1,559 21,822 1,091 15,275 8 $975 $5,961 $6,936 $0.62Res Shell 5,567 1 3,796 62,630 1,063 17,537 10 $5,516 $2,900 $8,416 $0.71Res Water Heating 1,431 9 40,638 406,375 5 24,383 243,825 130 $3,000 $6,700 $9,700 $0.05Res ComprehensiveRes BehaviorNon-Res CookingNon-Res CoolingNon-Res HeatingNon-Res Lighting 8 41 428,926 6,433,889 34 364,587 5,468,805 3,031 $166,955 $12,112 $179,067 $0.05Non-Res Motors 1 21,317 319,755 18,119 271,792 145 $4,263 $516 $4,779 $0.02Non-Res PumpsNon-Res RefrigerationNon-Res ShellNon-Res Process 1 449,295 6,739,422 381,901 5,728,509 3,046 $89,859 $10,872 $100,731 $0.02Non-Res ComprehensiveNon-Res BehaviorOther
7,570 55 986,602 14,558,125 43 820,306 12,161,783 6,580 $286,082 $58,800 $344,882 $0.04
T&DCodes and Standards
Total 7,570 55 986,602 14,558,125 43 820,306 12,161,783 6,580 $286,082 $58,800 $344,882
TRC Test 3.29 PAC Test 3.84 Excluding T&D
Resource Savings Summary Cost Summary

IMPERIAL IRRIGATION DISTRICT Imperial Irrigation District At a Glance
• Climate Zone: 15 • Number of retail customer connections: 149,431 • Public Programs Budget for CY 2016:
o Energy Efficiency – $6,155,795 o Low income/rate assistance programs - $6,737,000
• CY16 total retail sales by customer class o Residential – 51.91% o Commercial – 42.76% o Industrial – 0.24% o Agricultural – 2.20% o Other – 2.89%
Imperial Irrigation District Overview As the third largest power provider in California, Imperial Irrigation District utilizes more than 1,200 megawatts of energy derived from a diverse resource portfolio that includes its own generation, and long- and short-term power purchases. IID’s Energy Department provides electric power to more than 149,000 customers in the Imperial Valley and parts of Riverside and San Diego counties. As a consumer-owned utility, IID works to provide reliable, efficient and affordably priced energy services to meet customers’ demands. The district’s diverse resource portfolio provides their customers with some of the lowest rates in Southern California, which is critical given the unemployment rates within the service territory continue to be among the highest in the nation. IID’s energy efficiency programs are a key factor in the utility’s overall goal of maintaining system reliability for the sustained benefit of the regional economy, the environment and the communities it serves. These programs provide a positive impact on utility costs by stabilizing energy consumption and reducing purchases of expensive peak power. Additionally, customers are provided with an opportunity to take charge of their energy utilization and by doing so, reducing their electricity consumption and cost. Major Program Changes The program portfolio and rebate levels remained consistent from previous years. Program Highlight IID’s Quality A/C Tune-Up Program, which offers refrigerant charge adjustment and duct test and seal measures at no cost for residential and small commercial account customers lead the path in popularity amongst participants. In 2016, over 3,500 customers participated in the program. Living in climate zone 15, routine HVAC maintenance is a necessity for IID customers. Not only

does the program offer the service at no cost to the customer, the cost per kilowatt hour saved is amongst the lowest in IID’s portfolio. Program Descriptions Commercial Customer Programs
• Commercial Audits: This program provides commercial customers with onsite energy evaluations of their facilities and helps the business owner identify opportunities for energy conservation. This service is offered at no cost to the customer and is recommended as the first step towards their energy conservation journey.
• Custom Energy Solutions Program (CESP): This program is designed to promote energy efficiency by offering financial incentives to commercial customers who install energy-efficiency equipment. The larger commercial customers that participate generally have their own energy efficiency specialists they’ve consulted with for their upgrades and have identified the details of their project prior to applying for the rebate. However, for all other commercial customers that may not have access to an energy efficiency specialist, IID offers technical expertise to assist them in identifying the energy efficiency measures and cost saving opportunities. Measures incentivized include interior and exterior lighting, process loads and HVAC/refrigeration.
• New Construction Energy Efficiency Program (NCEEP): This program combines an integrated design process with financial incentives for energy saving design at least 10 percent above the current Title 24 requirements for a building envelope; or as a systems approach method for individual measures.
• Energy Rewards Rebate Program: This program offers commercial customers prescriptive rebates for qualified energy efficient measures. Qualifying measures must retrofit, replace or upgrade old equipment with new, energy-efficient technologies that meet and/or exceed the Title 24 standards in effect at the time of installation.
• Quality A/C Tune-Up Program: Through this program participating small commercial account customers receive HVAC services which may include duct test and seal (DTS), refrigerant charge adjustment (RCA), inspection of all electrical connections and tightening, inspection of all moving parts and lubrication, inspection of condensate drain, inspection of system controls and thermostat setting, and cleaning of evaporator and condenser air conditioning coils.
Residential Customer Programs:
• Energy Rewards Rebate Program: This program offers residential customers prescriptive rebates for qualified energy efficient measures. Qualifying residential measures must retrofit, replace or upgrade old equipment with new, energy-efficient technologies that meet and/or exceed the Title 24 standards in effect at the time of installation.
• Quality A/C Tune-Up Program: Through this program participating residential account customers receive HVAC services which may include duct test and seal (DTS), refrigerant charge adjustment (RCA), inspection of all electrical connections and tightening, inspection of all moving parts and lubrication, inspection of condensate drain, inspection of system

controls and thermostat setting, and cleaning of evaporator and condenser air conditioning coils.
• Residential Audits: Customers may receive a free home energy assessment once every three years. An assessment will identify problems that may, when corrected, save the customer a significant amount of money over time.
• Refrigerator Recycling: This program is designed to encourage customers to recycle their old refrigerators rather than using them as a secondary refrigerator usually located either in uninsulated garages or outdoors. Through the program a customer’s refrigerator will be picked-up and recycled, in addition to them receiving a $50 incentive per unit.
Codes and Standards Beginning in 2016, through IID’s participation with SCPPA, IID will account for codes and standards savings, which are drawn from the statewide allocation of energy savings credits attributed to codes and standards. The codes and standards savings claimed by IID are pro-rated based on the district’s percent share of statewide load. EM&V IID completes quality assurance on all programs which includes pre and post inspections on a sampling of projects. The district also contracts with an independent third party to complete an Evaluation Measurement & Verification (EM&V) of a sampling of energy efficiency programs. Programs evaluated vary each cycle. IID budgets an average of $70,000 for the external EM&V. IID is scheduled to perform an evaluation of the 2015 and 2016 programs within the next calendar year. The results will be submitted to SCPPA and incorporated in the SB1037 report accordingly. Copies of IID’s past EM&V reports are available at http://www.ncpa.com/policy/reports/emv/. Sources of Energy Savings IID utilized a combination of savings from the TRM, KEMA 2009 report, utility work papers and custom savings when applicable. For the prescriptive rebate program, the district relied on the deemed savings provided by the TRM as the individual efficiency measure’s performance characteristics and use conditions were well known and consistent. Subsequently for the custom programs, custom savings were calculated taking into account the properties of existing equipment, replacement equipment and future use. Complimentary Programs
• Low-Income Programs As a large number of IID’s residential customers participate in its income-qualified programs, a significant portion of revenue generated through the public benefits charge is allocated towards these programs. Program expenditures for the 2016 year totaled over $6.3M, with an average enrollment of 13,900 customers.

o Residential Energy Assistance Program (REAP) – This program provides customers with a discounted rate on their electric bill. Qualification is based on the number of residents per household and the total gross income of all the income sources in the home. Qualifying customers may receive a 20 percent discount on their monthly bill. Qualifying seniors 60 or older may apply to receive a 30 percent discount.
o Emergency Energy Assistance Program (EEAP) – This program provides financial assistance to customers in a financial crisis, facing disconnection for nonpayment.
o Medical Equipment Energy Assistance Program (MEEUAP) – This is an assistance program that reduces the electric rate for a defined quantity of electricity used to operate medical equipment by a household that has a full-time resident who requires specific medically necessary electric equipment to sustain life or prevent deterioration of a person’s medical condition.
• Energy Storage: The District’s first ever battery energy storage system went online in November 2016. The project is a 30-megawatt, 20-megawatt-hour lithium-ion battery storage system that will increase reliability across the IID grid by providing the ability to balance power and integrate solar while providing spinning reserve and black start power restoration capabilities. IID anticipates its customers will benefit from reduced operating costs throughout the lifetime of the project, providing a significant cost savings to ratepayers. The project is one of the largest of its kind in the western United States.
• Renewable Energy Programs: o SB1 Solar Solutions Program – IID offers incentives to customers who install solar
systems. Two types of incentives are offered: Expected Performance Based Incentive (EPBI) and Performance Based Incentive (PBI). The EPBI incentive is a one-time payment based on verified solar energy system characteristics such as location, system size, shading and orientation. The PBI incentive is a flat cents-per-kWh paid annually, for all verified output from a solar energy system over its initial five-year operation. The program sunset in 2016.
o Net Energy Metering – IID pays net-surplus customers for excess generation electricity produced by eligible solar or wind power systems. Customers can also elect to receive a kilowatt credit rather than monetary compensation at rates established by the utility. This program sunset in 2016 as it achieved its state mandated MW cap.
o Net Billing – The Net Billing Program is NEMs successor program and also compensates net-surplus customers in accordance with the Distributive Self-Generation Service Rate.

Imperial Energy Efficiency Program Results, CY 2016
Imperial ID
CategoryUnits
Installed
Gross Coincident
Peak Savings (kW)
Gross Annual Energy Savings
(kWh)
Gross Lifecycle Energy Savings
(kWh)
Net Coincident Peak Savings
(kW)
Net Annual Energy Savings
(kWh)
Net Lifecycle Energy Savings
(kWh)
Net Lifecycle GHG
Reductions (Tons)
Utility Incentives Cost
($)
Utility Mktg, EM&V, and
Admin Cost ($)
Total Utility Cost ($)
Utility ($/kWh)
Res Clothes Washers 250 43,250 475,750 37,628 413,903 246 $24,928 $3,896 $28,824 $0.09Res Cooling 12,755 3,016 9,768,680 38,792,683 2,411 7,355,072 31,200,063 19,742 $1,773,238 $526,625 $2,299,864 $0.10Res DishwashersRes ElectronicsRes HeatingRes LightingRes Pool Pump 273 60 333,330 3,333,300 52 289,997 2,899,971 1,732 $54,600 $29,813 $84,413 $0.04Res Refrigeration 493 27 168,895 1,170,140 19 124,487 906,749 512 $31,650 $24,294 $55,944 $0.08Res Shell 331,717 426 664,287 13,183,305 371 577,929 11,469,475 6,828 $152,562 $99,645 $252,207 $0.04Res Water HeatingRes Comprehensive 346 24 108,698 326,140 17 78,266 234,836 140 $112,817 $71,895 $184,711 $0.87Res BehaviorNon-Res CookingNon-Res Cooling 5,481 493 1,747,608 10,553,673 402 1,370,508 7,633,820 4,748 $354,370 $102,601 $456,971 $0.08Non-Res HeatingNon-Res Lighting 4 708 3,156,189 62,246,580 588 2,621,391 51,690,977 30,615 $225,996 $416,287 $642,282 $0.02Non-Res MotorsNon-Res PumpsNon-Res Refrigeration 1 49 174,634 2,968,781 41 146,693 2,493,776 1,390 $36,539 $16,200 $52,739 $0.03Non-Res ShellNon-Res ProcessNon-Res Comprehensive 9 6 10,551 31,653 5 8,441 25,322 15 $3,931 $9,374 $13,305 $0.58Non-Res BehaviorOther
351,328 4,809 16,176,121 133,082,005 3,905 12,610,411 108,968,893 65,969 $2,770,630 $1,300,629 $4,071,259 $0.05
T&DCodes and Standards 1 13,340,390 13,340,390 13,340,390 13,340,390 8,801 $5,767 $5,767
Total 351,329 4,809 29,516,511 146,422,395 3,905 25,950,801 122,309,283 74,770 $2,770,630 $1,306,396 $4,077,026
TRC Test 1.73 PAC Test 3.68 Excluding T&D
Resource Savings Summary Cost Summary

LASSEN MUNICIPAL UTILITY DISTRICT Lassen Municipal Utility District At a Glance
• Climate Zone 16 • Number of retail customer connections 10,500 • FY15-16 total retail sales by customer class (69,787 MWh residential, 47,269 MWh
commercial, 8,790 MWh agricultural, 3,965 MWh industrial) • FY15-16 total budget for energy efficiency programs (including EM&V, admin/overhead,
incentives) $214,000 • FY15-16 total amount actually expended for energy efficiency programs $52,698
Lassen Municipal Utility District Overview LMUD remains committed to helping customers manage their energy use through energy education and a comprehensive offering of energy efficiency incentives. For residential customers, rebates are offered for the installation of various energy efficiency measures. For commercial customers, rebates are available for upgraded lighting, refrigeration equipment, HVAC equipment, and in cases where an analysis is performed rebates can be offered for additional equipment that reduces energy use and/or demand. Many customers are not able to participate in standard rebate programs that require significant capital investment of their own. To compensate for this, LMUD periodically offers direct install programs at no cost to commercial and residential customers that provide energy saving and other benefits. Major Program Changes LMUD completed a complete review of all programs in FY16. Several new measures were added to provide more opportunities for customer participation, including several new commercial refrigeration, commercial kitchen equipment, and agricultural project incentives. Program Highlight The Commercial Lighting Program delivered the greatest percentage of savings in FY16, accounting for 82% of the total savings. This program provides much needed energy savings equaling reduced electricity bills for small businesses in our service territory. This economic boost helps relieve some pressure on these businesses and allows them to utilize the money they save to improve services or upgrade facilities. Program Descriptions LMUD manages a comprehensive energy efficiency incentive program for residential and commercial customers.
• Residential Lighting Program [Res Lighting]: LMUD offers rebates to homeowners who install ENERGY STAR® qualified LED lamps/bulbs, ceiling fans and LED holiday lights.
• Residential HVAC Program [Res Cooling]: LMUD offers rebates to homeowners who install high performance heat pumps, central air-conditioners, whole house fans, evaporative
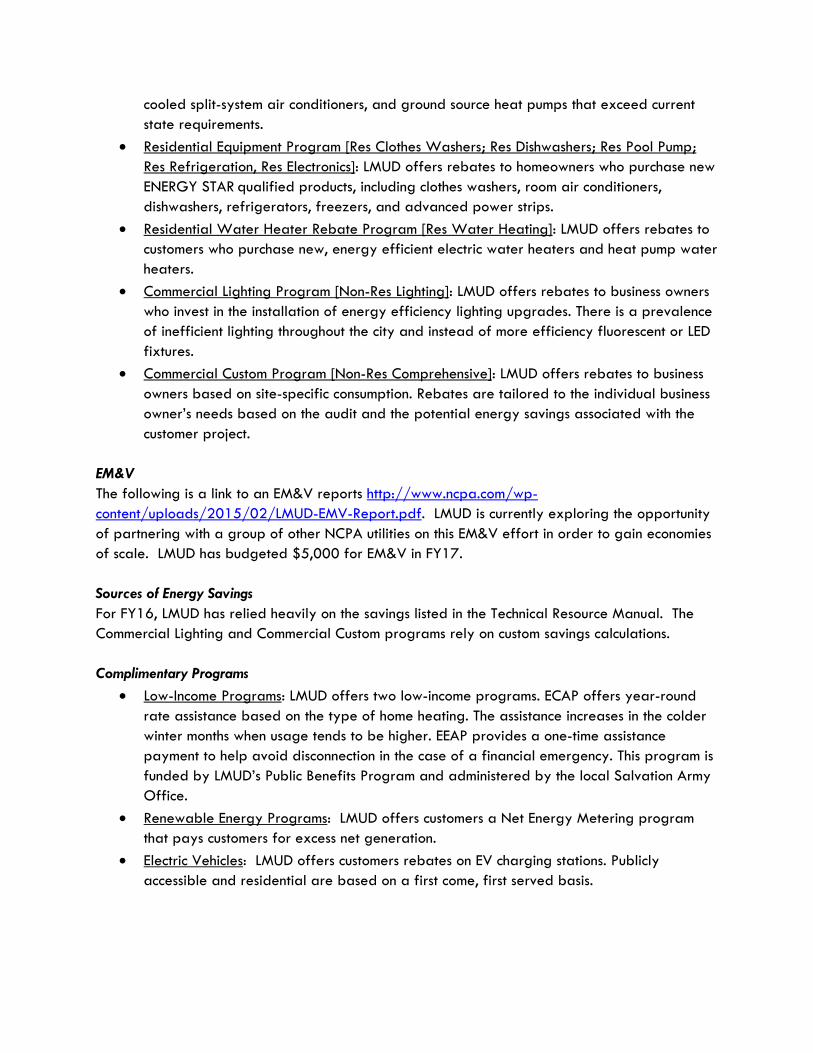
cooled split-system air conditioners, and ground source heat pumps that exceed current state requirements.
• Residential Equipment Program [Res Clothes Washers; Res Dishwashers; Res Pool Pump; Res Refrigeration, Res Electronics]: LMUD offers rebates to homeowners who purchase new ENERGY STAR qualified products, including clothes washers, room air conditioners, dishwashers, refrigerators, freezers, and advanced power strips.
• Residential Water Heater Rebate Program [Res Water Heating]: LMUD offers rebates to customers who purchase new, energy efficient electric water heaters and heat pump water heaters.
• Commercial Lighting Program [Non-Res Lighting]: LMUD offers rebates to business owners who invest in the installation of energy efficiency lighting upgrades. There is a prevalence of inefficient lighting throughout the city and instead of more efficiency fluorescent or LED fixtures.
• Commercial Custom Program [Non-Res Comprehensive]: LMUD offers rebates to business owners based on site-specific consumption. Rebates are tailored to the individual business owner’s needs based on the audit and the potential energy savings associated with the customer project.
EM&V The following is a link to an EM&V reports http://www.ncpa.com/wp-content/uploads/2015/02/LMUD-EMV-Report.pdf. LMUD is currently exploring the opportunity of partnering with a group of other NCPA utilities on this EM&V effort in order to gain economies of scale. LMUD has budgeted $5,000 for EM&V in FY17. Sources of Energy Savings For FY16, LMUD has relied heavily on the savings listed in the Technical Resource Manual. The Commercial Lighting and Commercial Custom programs rely on custom savings calculations. Complimentary Programs
• Low-Income Programs: LMUD offers two low-income programs. ECAP offers year-round rate assistance based on the type of home heating. The assistance increases in the colder winter months when usage tends to be higher. EEAP provides a one-time assistance payment to help avoid disconnection in the case of a financial emergency. This program is funded by LMUD’s Public Benefits Program and administered by the local Salvation Army Office.
• Renewable Energy Programs: LMUD offers customers a Net Energy Metering program that pays customers for excess net generation.
• Electric Vehicles: LMUD offers customers rebates on EV charging stations. Publicly accessible and residential are based on a first come, first served basis.

Lassen Energy Efficiency Program Results, FY 2015-16
Lassen
CategoryUnits
Installed
Gross Coincident
Peak Savings (kW)
Gross Annual Energy Savings
(kWh)
Gross Lifecycle Energy Savings
(kWh)
Net Coincident Peak Savings
(kW)
Net Annual Energy Savings
(kWh)
Net Lifecycle Energy Savings
(kWh)
Net Lifecycle GHG
Reductions (Tons)
Utility Incentives Cost
($)
Utility Mktg, EM&V, and
Admin Cost ($)
Total Utility Cost ($)
Utility ($/kWh)
Res Clothes Washers 11 3,124 34,364 968 10,653 5 $385 $1,051 $1,436 $0.18Res Cooling 13 2 1,555 33,680 1 1,244 26,944 16 $10,100 $2,090 $12,190 $0.77Res Dishwashers 7 406 4,060 244 2,436 1 $245 $241 $486 $0.26Res ElectronicsRes HeatingRes Lighting 276 4 3,209 40,043 2 1,733 21,623 11 $1,052 $3,347 $4,399 $0.29Res Pool PumpRes Refrigeration 13 1,600 22,264 1,122 15,609 8 $650 $2,029 $2,679 $0.24Res ShellRes Water Heating 26 7 5,403 54,030 4 3,242 32,418 17 $4,883 $2,704 $7,588 $0.30Res ComprehensiveRes BehaviorNon-Res CookingNon-Res CoolingNon-Res HeatingNon-Res Lighting 1 26 48,512 533,632 21 38,810 426,906 237 $3,992 $20,199 $24,190 $0.08Non-Res MotorsNon-Res PumpsNon-Res RefrigerationNon-Res ShellNon-Res ProcessNon-Res ComprehensiveNon-Res BehaviorOther
346 38 63,808 722,072 28 47,361 536,588 296 $21,307 $31,661 $52,968 $0.13
T&DCodes and Standards
Total 346 38 63,808 722,072 28 47,361 536,588 296 $21,307 $31,661 $52,968
TRC Test 0.91 PAC Test 1.18 Excluding T&D
Resource Savings Summary Cost Summary

LODI ELECTRIC UTILITY Lodi Electric Utility At a Glance
• Climate Zone 12 • Number of retail customer connections 26,012 • Residential Customer sales: 151,137,940 kWh (34%) • Commercial Customer sales: 161,089,550 kWh (37%) • Industrial Customer sales: 125,018,845 kWh (29%) • Budgeted amount for Energy Efficiency programs: $868,440 • Energy Efficiency Program Expenditures: $848,774
Lodi Electric Utility Overview Lodi’s non-residential customers (commercial and industrial) continue to produce the majority of energy savings achieved in Lodi Electric Utility’s (LEU’s) energy efficiency program portfolio. For the FY16, non-residential lighting upgrades and custom projects accounted for 84% of the acquired energy savings. Due to the age of Lodi’s housing stock, residential customers continue to achieve the greatest energy savings through HVAC replacements, improvements to insulation and by purchasing ENERGY STAR ® certified appliances, including refrigerators, dishwashers, clothes washers and pool pumps. The greatest opportunity for residential energy efficiency savings continues to be with low-income and rental property. Lodi’s median household income is estimated at $49,844 and renter occupied property comprises approximately 45 percent of all Lodi housing units. Program Highlights The Residential Direct Install and Snapshot Audit program offered installation of LEDs, advanced power strips, thermostatic shower valves, shower heads, and aerators in customers’ homes at no cost. The intent was to provide a program for residential customers that do not traditionally participate in energy efficiency rebate programs. While open to all residential customers, the program specifically targeted multi-family and low-income properties, as they are not likely to benefit from traditional energy efficiency programming, as well as serving single family homes. The Keep Your Cool Commercial Refrigeration program provided upgrades to commercial refrigeration equipment at no cost to LEU customers. The program included a variety of measures such as motors, motor controls, LED case lighting, anti-sweat heater controls, strip curtains, door gaskets and closers. The Non-Residential Rebate Program continues to be the main driver in regards to overall energy savings achieved. Through key accounts management, the utility maintains a proactive and positive relationship with Lodi’s largest energy consumers. These relationships are vital to Lodi’s overall economic development strategy and through them our large commercial and industrial
customers have been effectively encouraged to engage and make investments in lighting retrofits, process equipment improvements, behavioral modification, etc. Program Descriptions LEU manages a comprehensive energy efficiency incentive program for residential and commercial customers focusing on energy efficiency and peak load reduction. For residential customers, rebates are offered for the installation of various energy efficiency measures, such as lighting, HVAC, appliances, and weatherization. For commercial customers, rebates are available for upgraded lighting, HVAC, appliances, refrigeration equipment, electronics, and in cases where an analysis is performed rebates can be offered for additional equipment that reduces energy use and/or demand. On-site energy audits are provided by LEU energy specialists. Energy efficiency measures are recommended and additional visits are completed upon request.
• Residential Lighting [Res Lighting]: LEU offers rebates to homeowners who install ENERGY STAR qualified LED lamps/bulbs, ceiling fans and LED holiday lights.
• Residential HVAC [Res Cooling]: LEU offers rebates to homeowners who install high performance heat pumps and air-conditioners, or evaporative coolers that exceed current state requirements. LEU also offers a rebate for duct sealing when not required by code.
• Residential Equipment [Res Clothes Washers; Res Dishwashers; Res Pool Pump; Res Refrigeration; Res Electronics]: LEU offers rebates to homeowners who purchase new ENERGY STAR qualified products, including clothes washers, dishwashers, pool pumps, refrigerators and advanced power strips.
• Residential Weatherization [Res Shell]: LEU offers rebates to homeowners who invest in weatherizing their homes, including attic and wall insulation, window treatments, solar attic fans, and air sealing.
• Residential Water Heater Rebate [Res Water Heating]: LEU offers rebates to homeowners who purchase a new, energy efficient electric water heater.
• Residential Direct Install [Res Electronics; Res Lighting]: Audits are performed on residential homes and advanced smart power strips, faucet aerators, thermostatic shower valves, and ENERGY STAR rated LEDs are installed at no cost to the homeowner.
• Commercial Lighting [Non-Res Lighting]: LEU offers rebates to business owners who invest in the installation of energy efficiency lighting upgrades. There is a prevalence of inefficient lighting throughout the city instead of more efficiency fluorescent or LED fixtures.
• Commercial Custom [Non-Res Comprehensive]: LEU offers rebates to business owners based on site-specific consumption. Rebates are tailored to the individual business owner’s needs based on the audit and the potential energy savings associated with the customer project.
EM&V LEU has implemented an Evaluation, Measurement & Verification (EM&V) Plan, and has completed eight consecutive annual assessments (reports) of randomly selected programs and large rebates

as part of the designed EM&V Plan. Our EM&V reports are available for review at: www.ncpa.com/policy/reports/emv/ Note: The annual assessment for FY16 is expected to be completed by June 30, 2017. Sources of Energy Savings For FY16, LEU has relied heavily on the savings listed in the Technical Resource Manual. The Commercial Lighting and Commercial Custom programs use custom savings calculations. Complimentary Programs
• Low-Income Programs: o Lodi C.A.R.E. Package Program: Provides grants to very low-income customers in
need of assistance paying their electric utility account; the program coordination/customer screening is performed by the Lodi Salvation Army.
o Lodi SHARE Discount Rate: LEU provides a rate discount of 30% for qualifying residential customers on their electric utility monthly billing statement; $400,000 annually is budgeted for this rate discount from the Lodi Public Benefits Program fund.
• Renewable Energy Programs: Since 2008 LEU has offered solar rebates to residential and non-residential customers. FY17 will be the final year of the incentive program.
• Research, Development, and Demonstration: LEU evaluated a thermal energy storage solution as a potential pilot project for Research, Development and Demonstration purposes. The project was to be a component of a larger public improvement project for the Lodi Public Library and would have augmented the existing air conditioning system by storing energy in the form of ice during off-peak hours and subsequently releasing the stored energy to cool the building, thereby reducing typical peak cooling loads. Unfortunately, implementation of the evaluated Ice Bear energy storage system was determined to be a financially infeasible solution for the project after the Library’s mechanical engineers completed their evaluation of the existing air conditioning systems and compared the costs of traditional improvement measures with the estimated the costs of implementing the ice bear energy storage system.
• Electric Vehicles: LEU is a proud partner with the California Municipal Utilities Association, the California Center for Sustainable Energy and the Clean Vehicle Rebate Project in the promotion of PEVs in our community and in California. LEU continues to provide a total of seven free Level 2 charging stations at five municipal parking facilities. LEU also offers customers a discounted EV charging rate.
• Energy Storage: LEU is participating in the NCPA/SCPPA joint contract with DNV GL to provide an updated evaluation of energy storage technologies.
• Educational Outreach: Lodi LivingWise Program: Provided curriculum to 16 teachers and home energy efficiency “kits” and manuals to 430 6th grade students in Lodi schools; the program is designed to teach the students the basics of energy and water conservation and allows them to install and experience energy efficient devices within their own homes.
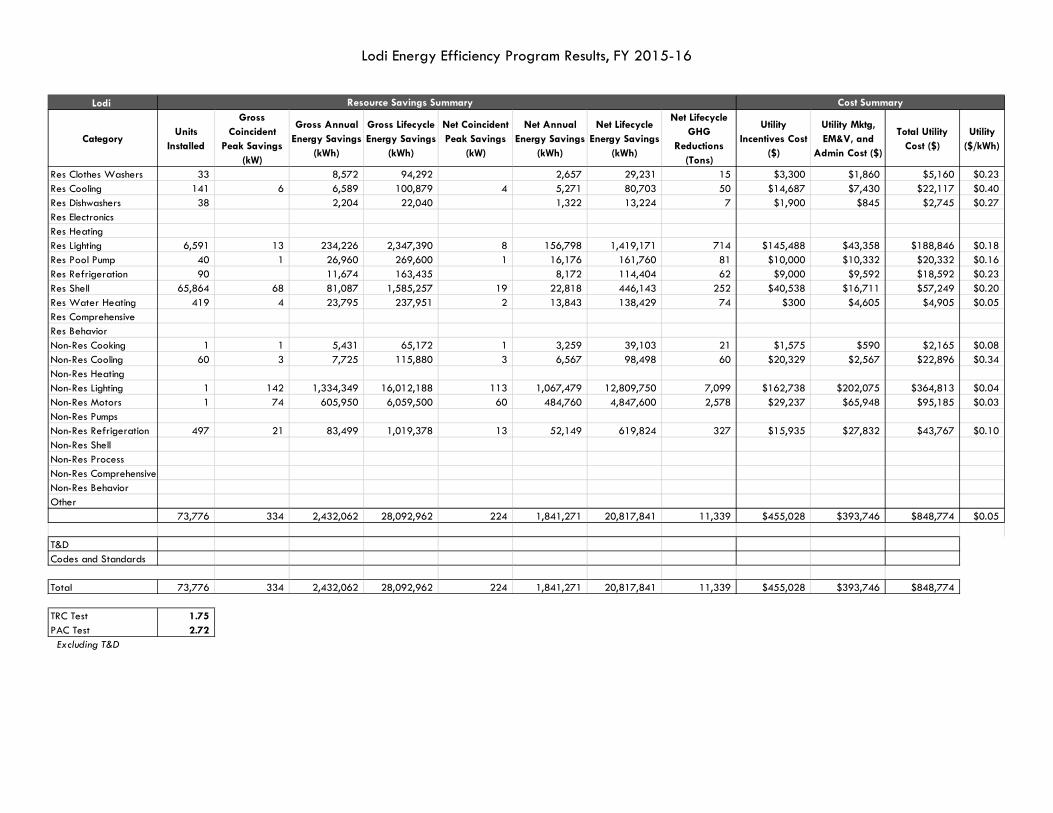
Lodi Energy Efficiency Program Results, FY 2015-16
Lodi
CategoryUnits
Installed
Gross Coincident
Peak Savings (kW)
Gross Annual Energy Savings
(kWh)
Gross Lifecycle Energy Savings
(kWh)
Net Coincident Peak Savings
(kW)
Net Annual Energy Savings
(kWh)
Net Lifecycle Energy Savings
(kWh)
Net Lifecycle GHG
Reductions (Tons)
Utility Incentives Cost
($)
Utility Mktg, EM&V, and
Admin Cost ($)
Total Utility Cost ($)
Utility ($/kWh)
Res Clothes Washers 33 8,572 94,292 2,657 29,231 15 $3,300 $1,860 $5,160 $0.23Res Cooling 141 6 6,589 100,879 4 5,271 80,703 50 $14,687 $7,430 $22,117 $0.40Res Dishwashers 38 2,204 22,040 1,322 13,224 7 $1,900 $845 $2,745 $0.27Res ElectronicsRes HeatingRes Lighting 6,591 13 234,226 2,347,390 8 156,798 1,419,171 714 $145,488 $43,358 $188,846 $0.18Res Pool Pump 40 1 26,960 269,600 1 16,176 161,760 81 $10,000 $10,332 $20,332 $0.16Res Refrigeration 90 11,674 163,435 8,172 114,404 62 $9,000 $9,592 $18,592 $0.23Res Shell 65,864 68 81,087 1,585,257 19 22,818 446,143 252 $40,538 $16,711 $57,249 $0.20Res Water Heating 419 4 23,795 237,951 2 13,843 138,429 74 $300 $4,605 $4,905 $0.05Res ComprehensiveRes BehaviorNon-Res Cooking 1 1 5,431 65,172 1 3,259 39,103 21 $1,575 $590 $2,165 $0.08Non-Res Cooling 60 3 7,725 115,880 3 6,567 98,498 60 $20,329 $2,567 $22,896 $0.34Non-Res HeatingNon-Res Lighting 1 142 1,334,349 16,012,188 113 1,067,479 12,809,750 7,099 $162,738 $202,075 $364,813 $0.04Non-Res Motors 1 74 605,950 6,059,500 60 484,760 4,847,600 2,578 $29,237 $65,948 $95,185 $0.03Non-Res PumpsNon-Res Refrigeration 497 21 83,499 1,019,378 13 52,149 619,824 327 $15,935 $27,832 $43,767 $0.10Non-Res ShellNon-Res ProcessNon-Res ComprehensiveNon-Res BehaviorOther
73,776 334 2,432,062 28,092,962 224 1,841,271 20,817,841 11,339 $455,028 $393,746 $848,774 $0.05
T&DCodes and Standards
Total 73,776 334 2,432,062 28,092,962 224 1,841,271 20,817,841 11,339 $455,028 $393,746 $848,774
TRC Test 1.75 PAC Test 2.72 Excluding T&D
Resource Savings Summary Cost Summary

CITY OF LOMPOC City of Lompoc Electric at a Glance
• Established in 1923 • Climate Zone 5 • 15,060 retail customer connections – 88% residential; 11% commercial, 1%
municipal/street lights • Retail sales by customer class – Residential - 55,691,428 kWh; Commercial - 66,121,906
kWh; Municipal 11,943,080 kWh; Street Lights and Traffic - 1,066,424 kWh • The budgeted amount for energy efficiency programs for FY15 -16 was $177,000. The
amount expended was $86,222. Any collected fees not expended are restricted and carried over to succeeding years.
Utility Overview Energy efficiency program participation remains flat over recent years due to a combination of trends in the local community such as the climate, continued drought conditions, demographics and market saturation. The City of Lompoc is located in the Central Coast region which provides a mild Mediterranean climate year round. Due to the mild climate, air conditioning is not typically installed in residential buildings and is limited in commercial buildings. Heating is done primarily with gas. The average residential electric consumption per month is 325 kWh. The peak demand for electricity is in the winter in the early evening. Since there is little need for air conditioning in our coastal climate and heating is primarily done with gas, the majority of rebate programs are focused on lighting and refrigeration retrofits. The Commercial Lighting program continued to have less participation than in previous years due to market saturation and the impact of building code requirements and Title 24 Building Energy Efficiency Standards requirements. The increased codes and standards requirements have discouraged many of the small commercial customers with limited funds from participating. Due to the continued drought and a fourth year of water and sewer rate increases, conservation staff assisted more customers with water conservation programs than with energy efficiency programs. Customers are choosing to spend available funds on retrofits that will help them save water. The City of Lompoc also provides water service to its customer and provides a variety of water conservation incentive programs. Programs offered include clothes washer and dishwasher replacements, toilet retrofits, rain barrel and landscape conversions. Because water conservation programs are not funded by Public Goods charges, energy savings are not reported. Major Program Changes No major changes were made to energy efficiency programs in this reporting period. The City will continue to survey the needs of its customers to provide additional opportunities for energy

efficiency savings. In 2016, the City entered into a Support Services Program Agreement with NCPA. By entering into the agreement, the City hopes to be able to provide more energy efficiency programs to customers at greater economies of scales. Programs being considered are direct install programs for low income, multi-family and commercial customers as well as an LED lighting upstream rebate program. Program Highlight A parking lot LED lighting retrofit project at a community college contributed to a large percent of the savings reported. The college received money from a grant to help them with the costs. Because the majority of customers are residential customers, the most popular programs were Residential Energy Star and Low Income Energy Star Refrigerator Recycle programs. The low income program is popular due to a larger incentive. In order to encourage participation in residential energy efficiency programs, the City will continue to provide programs that heavily subsidize the initial purchase. Customer audits continue to be successful in meeting customers’ needs. An increased number of customers are taking advantage of free energy audits. Many customers are able to implement staff suggestions from the audits and reduce energy use without the need to spend money on energy efficiency upgrades. Program Descriptions Res Refrigeration:
• Energy Star Refrigerator and Freezer Recycle Program: This program provides a rebate to customers who purchase an Energy Star refrigerator or freezer and recycle their old appliance at the City of Lompoc landfill.
• Buy Back Refrigerator and Freezer Recycle Program: This program provides customers a rebate to dispose of their extra refrigerator or freezer and recycle it properly at the City of Lompoc landfill.
• Income Qualifying Energy Star Refrigerator & Recycle Program: In this program, the City purchases an Energy Star refrigerator to replace a customer’s working primary refrigerator from a participating dealer. The customer must participate in the Electric Rate Assistance Program and pay a portion of the cost back to the City over a year. Appliances must be recycled at the City of Lompoc landfill.
Res Lighting:
• LED Bulb Exchange Rebate Program: Rebates are available to exchange an incandescent bulb with an Energy Star LED bulb.
• LED Holiday Light Rebate Program: The City offers a rebate to purchase up to 5 LED light strands per year.
Non-Res Lighting:

• Commercial Lighting Rebate Program: Provides rebates for energy efficient lighting upgrades from T12 to T8, T5 or LED lighting.
• Exit Sign Rebate Program: Provides a rebate to replace an incandescent exit sign with an LED exit sign.
• Customized Rebate Program: Provides a rebate for retrofits not covered by existing lighting or appliance rebate programs.
EM&V All appliance, lighting and custom rebate programs require a staff member to perform inspections before and after the installation. An on-site energy audit is performed. All appliance and lighting rebates require a verification of disposal from the City of Lompoc landfill. Lompoc’s EM&V reports can be found at http://www.ncpa.com/policy/reports/emv/. Sources of Energy Savings The City of Lompoc generally relies on the TRM as the primary source for deemed energy savings used in the calculating and reporting of annual program performance. Complimentary Programs
• Low Income Programs: The City provides financial assistance to customers that are below low to moderate income levels (as determined by HUD). The assistance is paid toward their electric usage charge. These customers are eligible for the Income Qualifying Refrigerator Recycle program and Clothes Washer Replacement program (not funded by Public Goods Charges).
• Renewable Energy Programs: Lompoc offered residential and commercial customers a rebate of $1.00 per watt in 2015 and $.50 per watt in 2016 to install a solar PV system. Rebates ended December 31, 2016.
• Energy Audits: Residential and commercial phone and onsite audits are available at no cost. During the audit, customers are informed about conservation rebate programs that are available.
• School and Community Education Programs: Energy conservation and electric safety programs are provided to schools and community organizations.
• Watt Meter Lending Program: Customers can borrow a watt meter to measure the energy use of appliances and electronics.
• Electric Vehicles: The City currently owns 2 electric vehicles and 1 dual port charging station for City vehicles use only. The City is participating in an EV Charging work group through NCPA.
• Energy Storage: As of this report, the City has not identified any cost-effective energy storage projects for our customers. The City is participating in an energy storage potential study through NCPA.

Lompoc Energy Efficiency Program Results, FY 2015-16
Lompoc
CategoryUnits
Installed
Gross Coincident
Peak Savings (kW)
Gross Annual Energy Savings
(kWh)
Gross Lifecycle Energy Savings
(kWh)
Net Coincident Peak Savings
(kW)
Net Annual Energy Savings
(kWh)
Net Lifecycle Energy Savings
(kWh)
Net Lifecycle GHG
Reductions (Tons)
Utility Incentives Cost
($)
Utility Mktg, EM&V, and
Admin Cost ($)
Total Utility Cost ($)
Utility ($/kWh)
Res Clothes WashersRes CoolingRes DishwashersRes ElectronicsRes HeatingRes Lighting 203 4,231 63,465 2,285 34,271 17 $1,119 $1,006 $2,125 $0.09Res Pool PumpRes Refrigeration 42 5 25,899 128,852 4 18,129 90,196 49 $9,443 $3,695 $13,138 $0.17Res ShellRes Water HeatingRes ComprehensiveRes BehaviorNon-Res CookingNon-Res CoolingNon-Res HeatingNon-Res Lighting 171 2 154,698 1,826,045 2 123,758 1,460,836 810 $7,800 $63,160 $70,959 $0.07Non-Res MotorsNon-Res PumpsNon-Res RefrigerationNon-Res ShellNon-Res ProcessNon-Res ComprehensiveNon-Res BehaviorOther
416 8 184,828 2,018,362 6 144,172 1,585,304 876 $18,361 $67,861 $86,222 $0.07
T&DCodes and Standards
Total 416 8 184,828 2,018,362 6 144,172 1,585,304 876 $18,361 $67,861 $86,222
TRC Test 0.92 PAC Test 2.09 Excluding T&D
Resource Savings Summary Cost Summary

LOS ANGELES DEPARTMENT OF WATER & POWER (LADWP) LADWP At A Glance
• Established in 1902 to deliver water to the City of Los Angeles. Electricity distribution began in 1916.
• Climate Zones primarily include CZ6 and CZ9. • Serves over 4 million people via 1.46 million electric and 676,000 water connections.
Nearly 70% of electricity usage is by the commercial/industrial sectors and over 30% by residential customers.
• Budgeted amount for FY 16-17 energy efficiency programs is $168,054,610. • FY15-16 total amount actually expended for energy efficiency programs was
$73,239,817 • A peak demand of 6,396 MW was registered in the September 16, 2014. • Annual energy use is 24.6 million megawatt-hours. • Load for the years 2001 to 2012 grew by 0.55. When taking into consideration energy
efficiency programs, load growth is forecasted to average 0.3% between 2013 and 2033.
Overview
LADWP is the largest municipal utility in the nation, and the third largest utility in California. The utility faces significant challenges as it works to comply with environmental and code mandates while maintaining quality delivery of services. Increasing renewable energy to 33% by 2020, the continued rebuilding of coastal generation units, replacement of coal, infrastructure reliability investments, and ramping up energy efficiency and other demand side programs are all critical and concurrent strategic actions that LADWP has to carry out over the coming decade. As part of its planning process, LADWP has committed to a number of energy efficiency activities to meet regulatory mandates and to meet the City’s energy needs, including the following goals:
∗ Leverage energy efficiency as part of the strategy for eliminating coal from LADWP’s energy portfolio
∗ Achieve an energy efficiency goal of 15% by 2020 ∗ Contribute to greenhouse gas emissions reduction through reduced energy usage
Major Program Changes
LADWP is continuing with a dramatic ramp-up in energy efficiency investments and results over previous years. In FY 2016-17, LADWP:
Increased the annual EE budget to $168M

Continued to implement the 8 guiding principles adopted in 2012 to guide this increased investment to ensure equity of access to EE for all customers, leverage this investment for job creation, commitment to transparency, and leverage community groups to reach hard- to- reach customers (guiding principles may be found in the LADWP Portfolio Business Plan)
Updated the detailed Business Plans for the portfolio that are comparably specific to what the IOUs create for their EE funding requests to the CPUC. These plans include the continuation of roughly 20 existing programs and 10 new programs. Water Conservation Programs have been added to the Fiscal Year 2014/15 – 2019/20 Portfolio Business Plan for the first time
Continued LADWP’s partnership with SoCal Gas to deliver joint programs in order to offer mutual customers electric, gas, and water savings in a "one stop shop". Eleven new programs have been launched under this successful partnership, with 5 more pending
Dedicated over $60M of the EE portfolio to Direct Install programs (equipment and installation completely free) to serve LADWP’s low- moderate- and fixed-income customers, both residential and non-residential. These include the Home Energy Improvement Program, Commercial Direct Install, and LAUSD Direct Install Program
Achieved 28% more energy savings in FY 15/16 than in FY 14/15. Mass Market Programs
• Commercial Direct Install: The Commercial Direct Install Program is a free direct-install program available to qualifying businesses whose average monthly electrical demand is 200 kilowatts (kW) or less. LADWP is partnering with Southern California Gas Company on this Program to offer a tri-resource efficiency program aiming to reduce the use of electricity, water and natural gas. (Non-Res Lighting)
• Los Angeles Unified School District Direct Install (LAUSD DI): The Los Angeles Unified School District Direct Install Program is designed to improve energy and water efficiency throughout LAUSD’s facilities through upgrades in electric, water and natural gas consuming systems, in partnership with the Southern California Gas Company (SoCalGas). This Program provides energy efficiency design assistance, project management experience and retrofitting installation, utilizing LADWP engineering and ISS (Integrated Support Staff), to assist LAUSD facilities in need of aid in reducing energy usage and corresponding utility expenses. (Non-Res Lighting)
• Home Energy Improvement Program (HEIP): The Home Energy Improvement Program is a comprehensive direct install whole-house retrofit program that offers residential customers a full suite of free products and services to improve the energy and water efficiency in the home by upgrading/retrofitting the home’s envelope and core systems. While not limited to low-income customers, HEIP’s priority is to serve the neediest customers. (Res Shell, Res Lighting)

• Refrigerator Exchange Program (REP): The Refrigerator Exchange Program is a free refrigerator replacement program designed to target customers that qualify on either LADWP’s Low-Income or its Senior Citizen/Disability Lifeline Rates as well as Multi-Residential or Non-Profit customers. This Program leverages a 3rd Party Contractor, ARCA (Appliance Recycling Centers of America), to administer the delivery of the Program and provides energy efficient refrigerators for this customer segment to replace older, inefficient, but operational models.(Res Refrigeration)
• Refrigerator Turn-in and Recycle (RETIRE)Program: The Refrigerator Turn-in and Recycle Program offers a $50 rebate, along with free pick-up, to residential customers to turn-in old refrigerators and freezers, for recycling. Eligible units must be fully operational and satisfy certain age and size requirements. LADWP leverages a 3rd Party Contractor, ARCA (Appliance Recycling Centers of America), to administer the delivery of the Program. (Res Refrigeration)
• Consumer Rebate Program (CRP): The Consumer Rebate Program offers incentives of up to $500 or more, to its residential customers to promote and advance comprehensive energy efficiency measures, including whole house solutions, plug load efficiency, performance standards and opportunities for integration. CRP is designed to offer and promote specific and comprehensive energy solutions within the residential market sector. (Res Cooling, Res Shell, Res Refrigeration, Res Pool Pump)
• Energy Upgrade California™ (EUCA): The Energy Upgrade California™ Program is a collaborative effort among California counties, cities, non-profit organizations, the state’s investor-owned utilities, and publicly owned utilities to deliver a California statewide “whole house” residential retrofit energy efficiency program, in which LADWP partners with Southern California Gas Company (SoCalGas). EUCA offers incentives to homeowners who complete selected energy-saving home improvements on single-family residences or 2-4 unit buildings, such as townhouses, condominiums, etc. (Res Cooling, Res Comprehensive, Res Lighting, Res Water Heating, Res Shell) Commercial, Industrial, Institutional (CII) Programs Descriptions
• Commercial Lighting Incentive Program (CLIP): The Commercial Lighting Incentive Program, launched October 1, 2014, is designed to leverage the previous lighting program successes while offering greater flexibility to lighting projects. This new design is intended to make CLIP as user friendly as possible, streamlining the application and administration process, leveraging participating contractors and the Trade Ally Program, to the degree possible and to capture the maximum energy savings and enhance the customer experience. (Non-Res Lighting)
• Savings By Design (SBD): The Savings By Design (SBD) Program is a California statewide non-residential new construction program, in which LADWP will partner with Southern California Gas Company (SoCalGas) to offer a uniform, multi-faceted program designed to consistently serve the needs of the commercial building community. SBD encourages energy-efficient building design and construction practices, promoting the efficient use of

energy by offering up-front design assistance, owner incentives, design team incentives, and energy design resources. (Non-Res Comprehensive)
• Retrocommissioning (RCx): The Retrocommissioning Program offers cash incentives to customers who undertake a “tune-up” of their existing building system equipment to restore equipment to its original performance level, as designed, if not higher. Incentives are offered for measures on a prescriptive menu of options, including replacement or repair of certain lighting sensors, air conditioning economizers, restoration of fan and pump variable frequency drives, operations set point strategies for supply air, temperature or duct pressure, chilled water and condenser water, operating schedules and boiler lockout. (Non-Res Comprehensive)
• Food Service Program: LADWP in cooperation with the Southern California Gas Company (SoCalGas®) offers incentives to encourage retrofit measures and technologies to reduce energy consumption in supermarkets, liquor stores, convenience stores, restaurants, etc. Rebates are offered for ovens, griddles, steam cookers, holding cabinets, glass and solid door refrigerators/freezers, ice makers, and kitchen demand ventilation controls. (Non-Res Refrigeration, Non-Res Cooking)
• Custom Performance Program (CPP): The Custom Performance Program offers cash incentives for energy saving measures not covered by existing prescriptive programs, such as equipment controls, industrial processes and other innovative energy saving strategies exceeding Title 24 or Industry Standards that are not included in other LADWP non-residential energy efficiency programs. In addition, the Chiller Efficiency Program is now part of the CPP; employing energy modeling using LADWP approved software in calculating energy savings for incentives. Other program offerings include incentives for equipment controls, CO monitoring systems, hotel guest room controls, variable frequency drives, cutting edge high-efficiency lighting technologies, and other innovative strategies. (Non-Res Cooling, Non-Res Comprehensive, Non-Res Motors, Non-Res Lighting, Non-Res Refrigeration)
• California Advanced Home Program (CAHP): The California Advanced Home Program is an incentive program that utilizes the statewide CAHP through its partner utility, Southern California Gas Company, to incentivize cost-effective energy efficiency upgrades in residential new construction. CAHP targets high density residential new construction, including single and multi-family high rise buildings, as this is the area with the greatest new construction energy savings potential in LADWP’s service territory. (Res Comprehensive)
• Energy Efficiency Technical Assistance Program (EETAP): The Energy Efficiency Technical Assistance Program is a non-resource program that goes a step beyond the assistance offered by standard programs. EETAP was designed to assist commercial, industrial, and institutional customers in closing the gap between project development and implementation for more complex building systems. By providing incentives for project development services including energy auditing and project management, through this program, LADWP aims to help its customers to strategically plan, follow through and realize energy savings in the most cost-effective manner. (Non-Res Comprehensive)
Cross Cutting Programs Descriptions • Codes, Standards & Ordinances (CSO): The Codes, Standards & Ordinances Program
conducts advocacy activities to improve building, appliance and water use efficiency regulations. These activities include monitoring and active participation in code and standard development, compliance and enforcement support with our sister agency LA Department of Building and Safety, legislative review, sponsorship of local ordinances, and participation in policy efforts with other City departments, state agencies, and utilities. The goal of this program is to promote sustainability with regard to water and energy use. The principal audience includes the LA City Department of Building and Safety, LA City Planning, LA City Department of Public Works, and the LA City Council, which together develop and adopt codes and standards specific to Los Angeles that go beyond state and federal regulation. Other audiences include state agencies, which conduct periodic rulemakings to update energy efficiency and water conservation regulations and standards, and industry groups that conduct research and develop industry specific standards. (Non-Res Process)
• Million Trees Program (MTP): The Million Trees Program provides free shade trees for residents and property owners in Los Angeles to promote the planting of trees to improve building energy efficiency. This is a joint program managed by Million Trees LA and supported by LADWP. Through this partnership, MTLA is able to provide free shade trees for residents and property owners in the City of Los Angeles along with information on where to plant the trees for maximum energy efficiency benefits. MTP currently focuses on providing trees for residential customers but will also provide trees to commercial customers. (Res Cooling, Res Shell)
• LADWP Facilities Upgrade: The LADWP Facilities Upgrade Program strives to improve energy and water efficiency throughout LADWP’s facilities with energy efficiency upgrades in HVAC and lighting and water efficiency upgrades in plumbing fixtures, leak correction and landscaping improvements. It identifies and assists those LADWP facilities to reduce energy and water usage, which will result in a reduction in energy and water consumption and procurement expense for LADWP that would otherwise be borne by LADWP customers. (Non-Residential Cooling)
• LADWP Emerging Technologies Program (ETP): The LADWP Emerging Technologies Program is designed to accelerate the introduction of innovative energy and water efficient technologies, applications, and analytical tools that are not yet widely adopted in California. By reducing both the performance uncertainties associated with new products, as well as institutional barriers, the ultimate goal of this Program is to increase the probability that promising energy and water efficiency technologies will be commercialized and adopted throughout Los Angeles.
• Program Outreach & Community Partnerships: The Program Outreach & Community Partnerships Program is an advocacy program that strives to improve customer awareness among “Hard-to-Reach” customers of LADWP on electric and natural gas energy efficiency and water conservation programs through community based outreach organizations. In FY 2013/14, this Program offers $45,000 grants to 17 local non-profit

organizations that are selected to work in each Los Angeles Council District or on an at-large basis to provide community/customer awareness of LADWP’s core energy efficiency and water conservation programs.
Evaluation, Measurement &Verification Results are published on LADWP Website: https://www.ladwp.com/cs/idcplg?IdcService=GET_FILE&dDocName=OPLADWPCCB436019&RevisionSelectionMethod=LatestReleased LADWP EM&V activities cover the programs and program years as described below:
Program
Commercial Lighting Efficiency Offer (CLEO) – FY 11-12 Custom Performance Program (CPP) – FY 11-12 Small Business Direct Install Program– FY 11-12
Chiller Efficiency Program (CEP) – FY 11-12 Refrigeration Program (Commercial Grocery Related) – FY 11-12
Consumer Rebate Program (CRP) – FY 11-12 Low Income Refrigerator Exchange Program– FY 11-12
RETIRE Program– FY 11-12 Codes & Standards (C&S) Program – FY 14-15
Energy Upgrade California (EUCA) Program – Process Only– FY 14-15 Retrocommissioning (RCx) Express Program– FY 14-15
Home Efficiency Improvement Program (HEIP) – FY 14-15 LADWP Facilities (Lighting & HVAC) Upgrade Program– FY 14-15
Savings By Design Program (Commercial New Construction) - Process Only– FY 14-15
California Advanced Home Program (CAHP) – FY 14-15 Commercial Lighting Incentive Program (CLIP) – FY 14-15
Custom Performance Program and Energy Efficiency Technical Assistance Program (CPP + EETAP) – FY 14-15
Market Transformation Preliminary Evaluation and future EM&V Plan The total budget for EM&V over the 3 year contract period is $3,705,437 which is equivalent to 0.74% of the total portfolio budget on an annual basis. LADWP has opted to evaluate its programs and activities from a holistic standpoint. Moving forward, LADWP will be tasking its third party EM&V consultants to evaluate the energy

efficiency market impacts of all the combined efforts of City of Los Angeles (inclusive of LADWP’s efficiency programs). The final EM&V report includes the preliminary Market Transformation (MT) evaluation plan. One of the end results of the MT evaluation quantifies the incremental energy savings potential due to market intervention introduced by the City of Los Angeles and a plan to track market indicators to recalibrate early projections moving forward. Sources of Energy Savings Sources of energy savings include custom engineering calculations using industry standard modeling software such as EnergyPro and eQuest. LADWP’s Custom Program uses this approach. For direct install and residential programs, deemed savings supported by a combination of the latest Technical Reference Manual as well as utility workpapers are used. Examples of programs using this approach include the Consumer Rebate Program, the Food Service Program, Refrigerator Exchange and Refrigerator Recycling Programs. Complimentary Programs
• Low-Income Programs: Refrigerator Exchange Program and Home Energy Improvement Program (described above).
• Solar Incentive Program (SIP): The Solar Incentive Program offers incentives to offset the cost of installing a solar rooftop system on your home or business. LADWP has been helping our customers to go solar since 1999. In September 2007, the LADWP revised its earlier SIP guidelines to comply with Senate Bill 1 (SB 1), the California Solar Initiative. Under this legislation, the LADWP has committed to providing $313 million to support solar photovoltaic (PV) projects over 10 years—through 2016—with a goal of achieving 280 megawatts (MW) of solar PV by the end of that period.
• Green Power for a Green L.A. Program: The Green Power for a Green L.A. Program gives Los Angeles residents, businesses, and governmental agencies a stake in helping to preserve and protect our environment through their voluntary contribution to support additional renewable energy. Customers who sign up for Green Power choose to have all, or a portion, of their electricity needs generated from renewable energy sources.
• Research, Development, and Demonstration: o LADWP has promoted thermal energy storage (TES) technology since the
early1990s and paid incentives for the installation of TES. o In August 2016, LADWP issued a solicitation for a pilot test plant to evaluate the
performance of a 100 kW lithium-ion battery system and 100 kW flow battery. o In November 2016, after thorough testing and review, LADWP approved the
SolarMax FLEX Energy Storage System (lithium-ion battery) for installation by customers, which may be of particular interest to customers with solar PV arrays.
o LADWP is involved in energy storage studies and projects using various technologies and use cases, including lithium-ion, flow batteries, compressed air, thermal energy storage at levels of the power system, including generation, transmission, distribution, and behind the meter.
• Electric Vehicles Electric Vehicle Charger Rebate Program: LADWP introduced the Electric Vehicle Charger Rebate Program, “Charge Up L.A.!” to encourage the installation of convenient electric vehicle (EV) charging stations at residential and commercial locations to support the purchase and use of EVs. This program benefits the environment and helps EV users save on fuel costs at the same time. The rebate is offered to qualifying commercial customers who purchase and install Level 2 (240-volt) chargers at their place of business for employees and public use. Commercial customers can receive up to $4,000 for hardwired wall or pedestal mounted or EV chargers. One (1) EV charger rebate is available to commercial customers who have a minimum of three (3) parking spaces available to employees, customers, visitors, and/or tenants. One (1) additional EV charger rebate is available for each additional 10 parking spaces. Residential customers can receive a rebate of up to $500 toward their out-of-pocket expenses for an EV charger. The rebate does not cover the cost of installation. Customers who choose to install an optional dedicated time-of-use (TOU) meter will qualify for the LADWP’s EV discount of 2.5 cents per kilowatt-hour (kWh), plus receive an additional $250 bonus. This dedicated service will add additional cost to the installation process but will yield lower electricity costs for off peak charging.
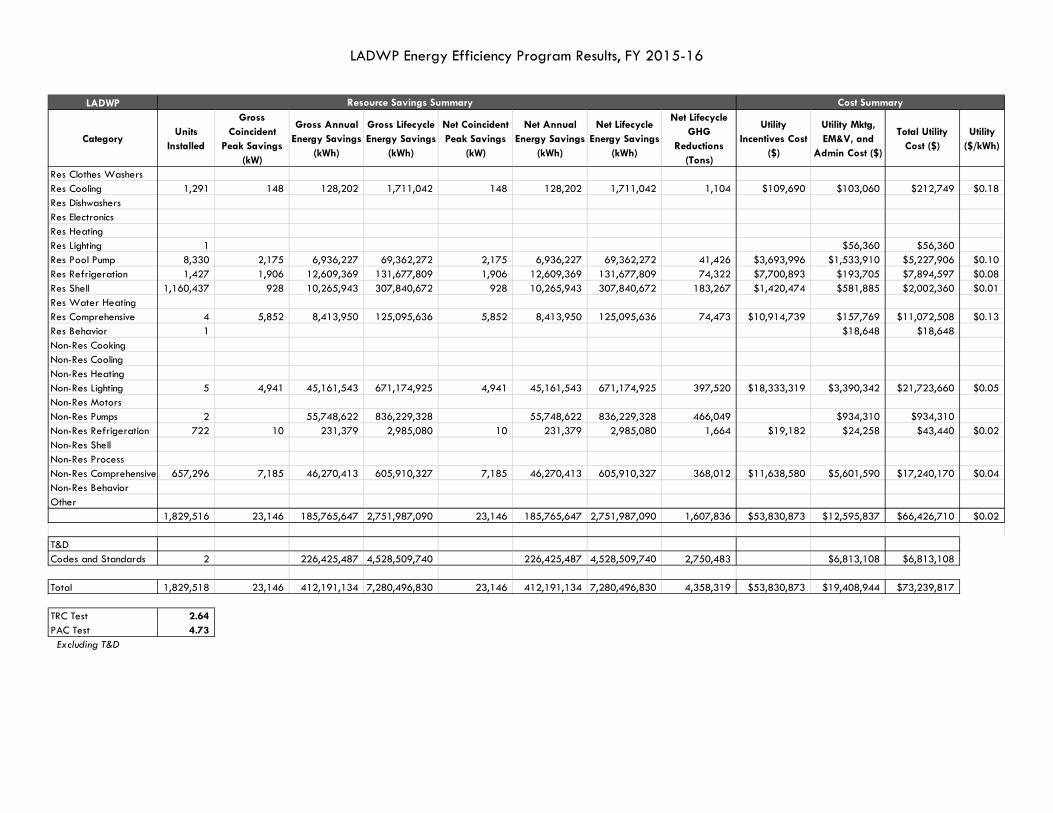
LADWP Energy Efficiency Program Results, FY 2015-16
LADWP
CategoryUnits
Installed
Gross Coincident
Peak Savings (kW)
Gross Annual Energy Savings
(kWh)
Gross Lifecycle Energy Savings
(kWh)
Net Coincident Peak Savings
(kW)
Net Annual Energy Savings
(kWh)
Net Lifecycle Energy Savings
(kWh)
Net Lifecycle GHG
Reductions (Tons)
Utility Incentives Cost
($)
Utility Mktg, EM&V, and
Admin Cost ($)
Total Utility Cost ($)
Utility ($/kWh)
Res Clothes WashersRes Cooling 1,291 148 128,202 1,711,042 148 128,202 1,711,042 1,104 $109,690 $103,060 $212,749 $0.18Res DishwashersRes ElectronicsRes HeatingRes Lighting 1 $56,360 $56,360Res Pool Pump 8,330 2,175 6,936,227 69,362,272 2,175 6,936,227 69,362,272 41,426 $3,693,996 $1,533,910 $5,227,906 $0.10Res Refrigeration 1,427 1,906 12,609,369 131,677,809 1,906 12,609,369 131,677,809 74,322 $7,700,893 $193,705 $7,894,597 $0.08Res Shell 1,160,437 928 10,265,943 307,840,672 928 10,265,943 307,840,672 183,267 $1,420,474 $581,885 $2,002,360 $0.01Res Water HeatingRes Comprehensive 4 5,852 8,413,950 125,095,636 5,852 8,413,950 125,095,636 74,473 $10,914,739 $157,769 $11,072,508 $0.13Res Behavior 1 $18,648 $18,648Non-Res CookingNon-Res CoolingNon-Res HeatingNon-Res Lighting 5 4,941 45,161,543 671,174,925 4,941 45,161,543 671,174,925 397,520 $18,333,319 $3,390,342 $21,723,660 $0.05Non-Res MotorsNon-Res Pumps 2 55,748,622 836,229,328 55,748,622 836,229,328 466,049 $934,310 $934,310Non-Res Refrigeration 722 10 231,379 2,985,080 10 231,379 2,985,080 1,664 $19,182 $24,258 $43,440 $0.02Non-Res ShellNon-Res ProcessNon-Res Comprehensive 657,296 7,185 46,270,413 605,910,327 7,185 46,270,413 605,910,327 368,012 $11,638,580 $5,601,590 $17,240,170 $0.04Non-Res BehaviorOther
1,829,516 23,146 185,765,647 2,751,987,090 23,146 185,765,647 2,751,987,090 1,607,836 $53,830,873 $12,595,837 $66,426,710 $0.02
T&DCodes and Standards 2 226,425,487 4,528,509,740 226,425,487 4,528,509,740 2,750,483 $6,813,108 $6,813,108
Total 1,829,518 23,146 412,191,134 7,280,496,830 23,146 412,191,134 7,280,496,830 4,358,319 $53,830,873 $19,408,944 $73,239,817
TRC Test 2.64 PAC Test 4.73 Excluding T&D
Resource Savings Summary Cost Summary

MERCED IRRIGATION DISTRICT Utility Overview
• For more than 75 years, the Merced Irrigation District (MID) has been in the business of generating wholesale electrical power.
• Fourteen years ago, MID determined the best way to leverage its investment in low-cost generating facilities, and to benefit Eastern Merced County communities was to develop its own electric delivery system.
• In 1996, MID created the Electric Services Department, and Foster Farms in Livingston, CA became the District’s first electric customer.
• MID’s electric distribution system has continued to grow with the addition of a 34-mile transmission loop and a sophisticated distribution system supporting customers in Eastern Merced County.
• MID sells electricity generated at its New Exchequer hydro power plant to PG&E.
MID Energy Efficiency Program Highlights In 2000, MID-Electric Services created and implemented the Public Benefit Programs. These programs promote, assist and educate all electric customers to participate and install energy efficiency measures. Commercial Customer Programs
• Commercial/Industrial Lighting Program: The Commercial Lighting Program is a turnkey lighting retrofit rebate program with a financial rebate menu for energy saving lighting equipment retrofits. The menu includes generous rebates for the replacement of T-12 lamps, Metal Halide Fixtures, Incandescent Lighting, and Exit Signs. The program also provides rebates for the addition of lighting controls including Photocells and Occupancy Sensors.
• Commercial/Industrial Mechanical Equipment Program: The Commercial/Industrial Retrofit Program is a turnkey mechanical equipment rebate program with a financial rebate menu for energy saving mechanical equipment retrofits. The menu includes generous rebates for the replacement of mechanical equipment with more energy efficiency equipment including: Refrigeration Equipment, Air Conditioning Equipment, Chillers, Motors, and Pumps. The program also provides rebates for Variable Frequency Drives on pumps, motors, and fans. Rebates are also available for Cooling Load Reduction measures to include Duct Sealing, Cool Roofs, Window Film, and Programmable Thermostats.
• Customized Commercial/Industrial Retrofit Program: The Customized/Industrial Retrofit Program enables qualifying commercial and industrial customers to apply for financial incentives on more specialized and comprehensive energy saving measures that do not fall under the Commercial Lighting Program or the Mechanical Equipment Retrofit Program. Applications for this program are evaluated and approved on an individual per application basis. Financial incentives for qualifying customer projects are paid for annual kilowatt hour savings in a one year period on approved projects.

Residential Customer Programs
• Residential Rebate Program: This program encourages residential customers to purchase EnergyStar® labeled products, home appliances and energy-efficient compact fluorescent light bulbs.
• Residential Energy Assistance Program (CARE): Since 2000, MID has been providing a 20 percent discount on monthly energy bills for Low-Income Families, and the Medical Baseline and Life-Support Program for those who depend on electrically powered medical equipment.
Complimentary Program: • Solar Incentive Program: The Solar Incentive Program provides financial incentives to
qualifying customers to buy down installed solar generation projects and to help offset the customer’s investment in renewable energy generation. The rebate incentive is equal to the estimated performance of the installed solar system multiplied by $.50/wattAC. The rebate incentive for commercial/industrial solar systems are capped at $12,500 (25kW) and $1,500 (3kW) for residential.

Merced Energy Efficiency Program Results, CY 2016
Merced
CategoryUnits
Installed
Gross Coincident
Peak Savings (kW)
Gross Annual Energy
Savings (kWh)
Gross Lifecycle Energy
Savings (kWh)
Net Coincident Peak Savings
(kW)
Net Annual Energy
Savings (kWh)
Net Lifecycle Energy
Savings (kWh)
Net Lifecycle GHG
Reductions (Tons)
Utility Incentives Cost
($)
Utility Mktg, EM&V, and
Admin Cost ($)
Total Utility Cost ($)
Utility ($/kWh)
Res Clothes Washers 7 259 2,849 80 883 $525 $13 $538 $0.81Res Cooling 7 959 14,385 767 11,508 7 $4,305 $439 $4,744 $0.60Res Dishwashers 22 572 5,720 343 3,432 2 $1,650 $50 $1,700 $0.64Res ElectronicsRes HeatingRes LightingRes Pool PumpRes Refrigeration 26 3,372 47,214 2,361 33,050 18 $2,600 $630 $3,230 $0.14Res Shell 3 1,701 34,020 476 9,526 5 $300 $193 $493 $0.08Res Water HeatingRes ComprehensiveRes BehaviorNon-Res CookingNon-Res CoolingNon-Res HeatingNon-Res Lighting 3 913,244 6,392,708 913,244 6,392,708 3,543 $67,561 $143,869 $211,430 $0.04Non-Res Motors 1 116,814 1,168,140 116,814 1,168,140 621 $8,177 $21,806 $29,983 $0.03Non-Res PumpsNon-Res RefrigerationNon-Res ShellNon-Res ProcessNon-Res ComprehensiveNon-Res BehaviorOther
69 1 1,036,921 7,665,036 1,034,086 7,619,247 4,197 $85,118 $167,000 $252,118 $0.04
T&DCodes and Standards
Total 69 1 1,036,921 7,665,036 1,034,086 7,619,247 4,197 $85,118 $167,000 $252,118
TRC Test 1.53 PAC Test 3.62 Excluding T&D
Resource Savings Summary Cost Summary

MODESTO IRRIGATION DISTRICT Modesto Irrigation District (MID) At a Glance
• Climate Zone 12 (entire service area) • 121,000 active retail service connections/customers served (approx.) • Total retail electric sales by customer class are: 34% residential; 29% commercial; 32%
industrial; 4% agricultural and pumping; 1% other (based on 2016 GWH) • $5.6 million budgeted for Energy Efficiency (EE) programs (including EM&V, admin /
overhead, incentives) • $3.6 million actually expended for EE programs
MID Overview MID electric sales have remained essentially “flat” over the past decade. The last major increase in energy sales occurred in 2004 (+3%) and significant reductions occurred in the recession years of 2009 and 2010 (-3% and -4%, respectively). Regarding capacity, MID hit an all-time system peak in 2006 of 687 MW (controlled), whereas the peak for 2016 was only 662 MW (uncontrolled). Load growth for 2016 was +0.8% (based on Total System Input GWH). Clearly, the economy in the central valley continues to affect MID and its customers, which in turn impacts EE program participation and results. Another trend in the MID service area is a significant installation of leased solar systems, which require little or no out-of-pocket cost for the homeowner. The customer motivation for installing these systems includes high utility rates and the perceived certainty of reduced future electric bills. Installation of these systems has reduced system load growth and may also dampen residential customer interest in pursuing EE projects. Major Program Changes In 2016 MID introduced two new pilot programs. The first was a LED bill credit rebate for the purchase of qualified LED lamps for residential and small commercial customers. The second was a mobile home direct install energy efficiency program. Both programs were very popular with their target markets. Program Highlight The Mobile Home direct install energy efficiency pilot program was an attempt to better serve a demographic dominated predominately by senior low and fixed income customers. MID selected a contractor who was qualified to implement direct install energy measures in mobile homes and was also able to offer no-cost utility weatherization services for qualifying MID electric and PG&E gas customers. This “one-stop” approach to combine programs and utility services received excellent feedback from customers.
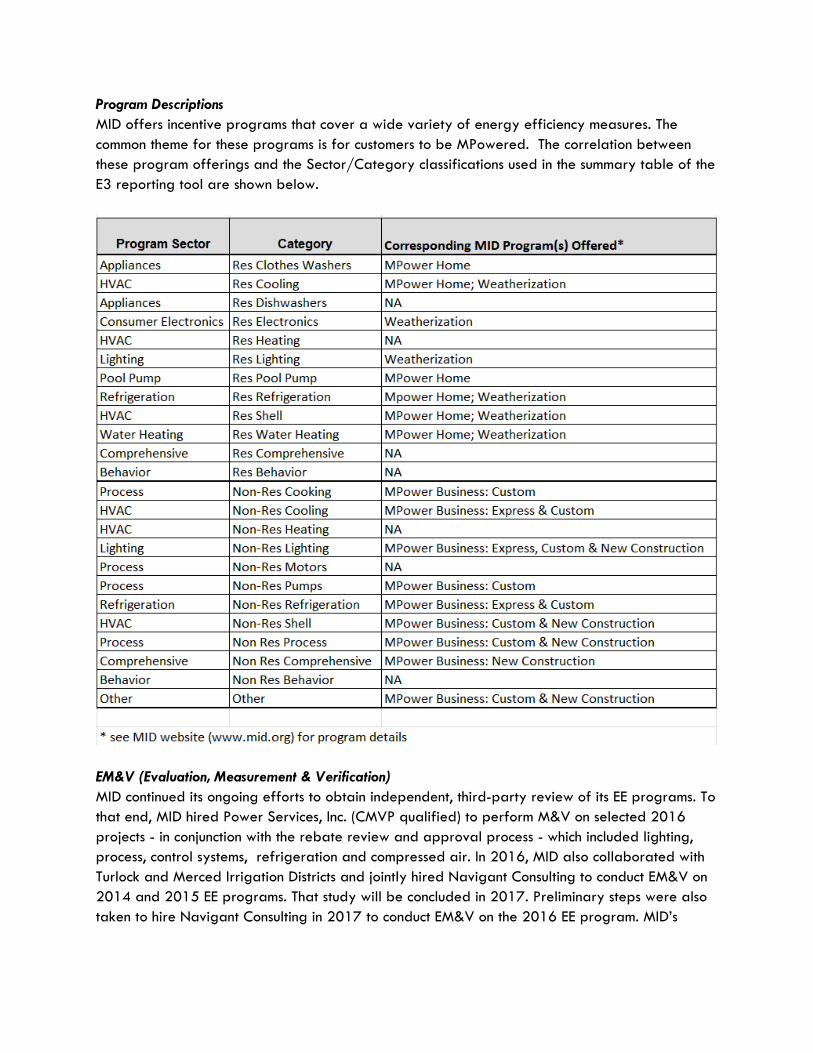
Program Descriptions MID offers incentive programs that cover a wide variety of energy efficiency measures. The common theme for these programs is for customers to be MPowered. The correlation between these program offerings and the Sector/Category classifications used in the summary table of the E3 reporting tool are shown below.
EM&V (Evaluation, Measurement & Verification) MID continued its ongoing efforts to obtain independent, third-party review of its EE programs. To that end, MID hired Power Services, Inc. (CMVP qualified) to perform M&V on selected 2016 projects - in conjunction with the rebate review and approval process - which included lighting, process, control systems, refrigeration and compressed air. In 2016, MID also collaborated with Turlock and Merced Irrigation Districts and jointly hired Navigant Consulting to conduct EM&V on 2014 and 2015 EE programs. That study will be concluded in 2017. Preliminary steps were also taken to hire Navigant Consulting in 2017 to conduct EM&V on the 2016 EE program. MID’s

annual budget for EM&V work is $75,000 and completed studies can be found at: http://www.ncpa.com/policy/reports/emv The independent studies have consistently found the Realization Rate for MID’s EE program portfolio to be within a few percentage points of 100%. Those results demonstrate that MID is accurately reporting the savings from its EE programs. The accuracy of reporting is due in part to the quality assurance practices MID staff applies on an ongoing basis throughout the review and approval cycle of applications for its EE programs. Sources of Energy Savings MID offers two types of rebates: express and performance, which are based on deemed and calculated savings, respectively. The deemed savings for the express rebates are based on a combination of TRM, KEMA, DEER and IOU work paper data. The calculated savings for the performance rebates are based on ex-anti and ex-post data from the specific project. Complimentary Programs
• Low-Income Programs MID’s low income programs are comprised of weatherization, CARE rate discount and educational outreach. Energy savings from the weatherization program are included in the results for the SB1037 report. Customer demand for weatherization exceeds the annual amount budgeted and the rate discount alone represents a substantial portion of the total public benefits funding allocation. However, MID continues to facilitate new partnerships with other organizations and agencies to increase its outreach and provide additional weatherization services to low-income customers.
• Renewable Energy Programs MID’s renewable energy programs are no longer funded from public benefits. Rather, they are conducted in accord with subsequent legislative or regulatory mandates, such as the Renewable Portfolio Standard (RPS) and the California Solar Initiative (CSI/SB1). To date, MID has procured enough renewable energy to satisfy the renewable energy trajectory that was established by the CEC for the three compliance periods through 2020, and is currently considering its options for meeting the newly established post-2020 targets.
• Energy Storage In 2014, the MID board of directors adopted a policy determining that energy storage targets are not appropriate for MID. However, MID continues to evaluate the energy storage benefits that are applicable to its system and will consider updating this policy if warranted by operational and/or economic needs.

Modesto Energy Efficiency Program Results, CY 2016
Modesto
CategoryUnits
Installed
Gross Coincident
Peak Savings (kW)
Gross Annual Energy Savings
(kWh)
Gross Lifecycle Energy Savings
(kWh)
Net Coincident Peak Savings
(kW)
Net Annual Energy Savings
(kWh)
Net Lifecycle Energy Savings
(kWh)
Net Lifecycle GHG
Reductions (Tons)
Utility Incentives Cost
($)
Utility Mktg, EM&V, and
Admin Cost ($)
Total Utility Cost ($)
Utility ($/kWh)
Res Clothes Washers 134 21 8,308 99,696 18 7,062 84,742 43 $4,690 $1,040 $5,730 $0.09Res Cooling 1,285 63 67,859 1,015,444 55 56,741 849,275 523 $194,662 $33,010 $227,672 $0.38Res DishwashersRes Electronics 109 8,175 122,625 8,175 122,625 62 $10,985 $2,830 $13,816 $0.16Res HeatingRes Lighting 7,559 23 299,609 1,992,391 20 281,899 1,903,842 958 $108,944 $41,433 $150,377 $0.09Res Pool Pump 185 6 124,690 1,246,900 4 74,814 748,140 376 $37,000 $9,202 $46,202 $0.08Res Refrigeration 141 105,892 1,906,056 105,892 1,906,056 1,034 $782,730 $57,299 $840,029 $0.65Res Shell 1,557 398 210,044 3,680,101 294 145,541 2,498,158 1,410 $124,873 $51,634 $176,507 $0.11Res Water Heating 260 14,915 143,896 14,007 130,866 70 $4,679 $3,233 $7,912 $0.08Res Comprehensive 21,979 21,979 219,790 21,979 219,790 124 $26,814 $7,733 $34,548 $0.20Res BehaviorNon-Res CookingNon-Res Cooling 345 138 224,956 3,374,340 110 179,965 2,699,472 1,641 $64,658 $46,622 $111,280 $0.06Non-Res HeatingNon-Res Lighting 16,732 1,551 8,927,066 104,154,849 1,241 7,141,546 83,321,934 46,176 $411,337 $858,224 $1,269,561 $0.02Non-Res Motors 2 20,989 313,230 16,791 250,584 133 $1,647 $2,156 $3,802 $0.02Non-Res PumpsNon-Res Refrigeration 2,578 27 171,584 2,541,567 23 144,619 2,141,924 1,129 $27,262 $18,364 $45,626 $0.03Non-Res Shell 4,089 69,519 695,195 55,616 556,156 309 $4,089 $5,605 $9,694 $0.02Non-Res Process 2 325 2,763,846 41,457,690 260 2,211,077 33,166,152 17,638 $191,189 $293,490 $484,679 $0.02Non-Res ComprehensiveNon-Res BehaviorOther
56,957 2,553 13,039,431 162,963,770 2,025 10,465,723 130,599,715 71,626 $1,995,559 $1,431,875 $3,427,434 $0.04
T&D 1 563,000 563,000 563,000 563,000 305 $123,125 $9,587 $132,712Codes and Standards
Total 56,958 2,553 13,602,431 163,526,770 2,025 11,028,723 131,162,715 71,931 $2,118,684 $1,441,462 $3,560,146
TRC Test 2.10 PAC Test 4.48 Excluding T&D
Resource Savings Summary Cost Summary
MORENO VALLEY UTILITY (MVU) Moreno Valley Utility (MVU) At a Glance
• Climate Zone: 10 • Number of retail customer connections: approximately 6100 • FY15-16 total retail sales by customer class: 20% residential, 80% commercial &
industrial • FY15-16 total budget for energy efficiency programs: $1,000,000 • FY15-16 total amount actually expended for energy efficiency programs: $285,000
Moreno Valley Utility (MVU) Overview MVU continues to experience modest load growth attributed to the successful business attraction efforts of the City’s economic development group and an expanding local economy. MVU’s peak demand increased by nearly 20 percent from last year’s report of 39 megawatts to 46 megawatts. The peak occurred on June 20th, which was highly unusual because it was unseasonably early and it happened on a Monday. Although MVU has seen double-digit load growth in the last few years, this trend may be mitigated by high levels of solar penetration – specifically large systems proposed by commercial customers. Some of these same commercial customers are also planning large LED lighting retrofits which, if approved and installed, will further erode MVU’s retail sales. Major Program Changes With the addition of residential programs last year, MVU has seen a slight increase in customer program interest and submitted rebate applications. It is clear that effective marketing efforts will be required to drive higher participation levels and that will be the focus this fiscal year. Due to the newer already-efficient housing stock in MVU’s service territory, the utility will add Tier 2 plug load devices to the list of Direct Install measures to capture additional energy savings. MVU might also develop programs targeting low-income residents and possibly some educational outreach to local schools. Program Highlights For the last two consecutive years, MVU’s Lighting Retrofits Program has been the most successful energy efficiency program and yielded the highest reportable kilowatt hour savings. The lower price and greater performance of new LED lighting technologies make large T5 high-bay replacement projects attractive, often with simple paybacks of about three years. MVU created a Demand Response pilot program by providing Ecobee smart thermostats to a small group of interested residential and small commercial customers. The installation is free and the customers will be allowed to ‘opt-out’ of demand response events but ‘opt-out’ customers will not receive compensation in the form of a bill credit for participation in the event.

Program Descriptions MVU offers many rebate programs to residential and commercial/industrial customers, only descriptions of the most popular are listed:
• Lighting Retrofits – Non-Res Lighting: rebates are available to commercial customers for LED lighting retrofits, other energy efficient lighting replacements, and for LED or photo-luminescent exit signs.
• Commercial Energy Efficiency Program – Non-Res Comprehensive: this Direct Install program provides small to medium-sized customers with an onsite energy audit and energy saving measures at no cost to the customer.
• Commercial Heating, Ventilation and Air Conditioning (HVAC) Retrofits – Non-Res Cooling: customers that install new high SEER HVAC units or replace older inefficient units can participate in this rebate program. The installation of new chillers that exceed Title 24 requirements or load-shifting Thermal Energy Storage (TES) systems may also qualify for rebates.
• Motor Replacements – Non-Res Motors: commercial customers that install premium efficiency motors are eligible for rebates under this program. Motors covered under this program must be new, three-phase induction motors (1hp to 200hp in size) and operate for at least 2,000 hours per year.
• New Construction and Major Tenant Renovation – Non-Res Shell: this program offers incentives for projects exceeding Title 24 by at least ten percent. Eligible customers are responsible for providing documentation of energy savings using energy modeling software and all calculations must be signed by a licensed mechanical engineer.
• Outreach Programs – Non-Res Behavior: the utility contracts with Automated Energy to provide the largest commercial customers with detailed energy usage information to help efficiently manage their energy consumption and evaluate potential energy efficiency projects.
• Residential Energy Audit & Direct Install – Res Comprehensive: this program targets very high energy use customers and participants in our Low Income Program. The program provides eligible residential customers with a full in-home energy audit and specific recommendations for their home plus a fixed set of maintenance and upgrades at no cost to the customer.
• Energy Star Appliance Rebates – Res Clothes Washers/Dishwashers/Etc.: customers who purchase Energy Star Qualified appliances can apply for a fixed rebate amount under this program.
EM&V Engineering analysis programs such as DOE-2 are the basis for calculated energy savings and incentive calculations. MVU requires both pre-inspections and post-inspections for all projects that result in a commercial rebate over $5000. The utility uses a third-party consultant to verify energy savings for complex projects and custom measures when necessary. As energy efficiency programs evolve and participation levels increase MVU will contract with one of the SCPPA-preferred EM&V service providers to create a plan.

Sources of Energy Savings MVU relied primarily on the TRM values from the E3 model but also used reported energy savings from trusted engineering contractors to calculate program performance.
• Commercial Codes & Standards – MVU has recorded its share of the energy savings that are attributable to the State’s Building Codes and Appliance Standards (Title-24) that are applied and enforced by the City of Moreno Valley.
Complimentary Programs
• Low-Income Programs: MVU’s Low-Income Assistance program provides qualified low-income residents with a 20% discount on monthly energy charges; this year’s expenditures were over $65,000.
• Renewable Energy Programs: The Solar Incentive Program has been extremely successful having expended over $1M to provide rebates for 200 solar projects during the last fiscal year. The results were over 3.6MW installed with an annual estimated production of more than 7.8 megawatt hours. MVU’s largest commercial customer solar installation was completed in July at a size of 2.5MW. The first MVU-owned solar project has been approved and is in the design phase. It will be an approximately 500kW solar carport located at City Hall.
• Research, Development, and Demonstration: with the assistance of a CEC grant, MVU installed its first utility-owned electric vehicle charging stations at a customer location, the Walmart parking lot. The chargers consist of one DCFC fast charger and four L2 chargers on the Greenlots network.
• Electric Vehicles: compliments of a SCAQMD grant, this year additional utility-owned charging stations will be added to City Hall for workplace and visitor charging. So far there has been little interest from MVU customers in electric vehicle and charging station installations or incentives.
• Energy Storage: battery storage will be included in the City Hall solar carport project. There have been a few proposals by commercial customers to include battery storage with new solar installations but none have actually been installed. To date, there have been no battery systems installed on MVU’s distribution grid.

Moreno Valley Energy Efficiency Program Results, FY 2015-16
Moreno Valley
CategoryUnits
Installed
Gross Coincident
Peak Savings (kW)
Gross Annual Energy Savings
(kWh)
Gross Lifecycle Energy Savings
(kWh)
Net Coincident Peak Savings
(kW)
Net Annual Energy Savings
(kWh)
Net Lifecycle Energy Savings
(kWh)
Net Lifecycle GHG
Reductions (Tons)
Utility Incentives Cost
($)
Utility Mktg, EM&V, and
Admin Cost ($)
Total Utility Cost ($)
Utility ($/kWh)
Res Clothes WashersRes Cooling 9 2,349 23,490 1,879 18,792 12 $3,465 $63 $3,528 $0.24Res DishwashersRes ElectronicsRes HeatingRes Lighting 1,000 39,000 585,000 21,060 315,900 179 $4,510 $435 $4,945 $0.02Res Pool PumpRes RefrigerationRes ShellRes Water HeatingRes Comprehensive 1 1,621 16,210 1,297 12,968 8 $460 $21 $481 $0.05Res BehaviorNon-Res CookingNon-Res Cooling 5 975 9,750 780 7,800 5 $1,925 $54 $1,979 $0.32Non-Res HeatingNon-Res Lighting 3 113 878,624 8,786,240 113 878,624 8,786,240 5,204 $41,574 $49,172 $90,746 $0.01Non-Res MotorsNon-Res PumpsNon-Res RefrigerationNon-Res ShellNon-Res ProcessNon-Res Comprehensive 2 24 129,988 1,093,820 24 129,988 1,093,820 664 $26,191 $7,061 $33,252 $0.04Non-Res BehaviorOther
1,020 137 1,052,557 10,514,510 137 1,033,628 10,235,520 6,072 $78,125 $56,806 $134,932 $0.02
T&DCodes and Standards 74 488,153 488,153 74 488,153 488,153 296 $3,138 $3,138
Total 1,020 211 1,758,388 10,514,510 211 1,521,781 10,235,520 6,369 $78,125 $59,944 $138,069
TRC Test 2.46 PAC Test 9.73 Excluding T&D
Resource Savings Summary Cost Summary
CITY OF NEEDLES City of Needles at a Glance
• Needles Public Utilities Authority (NPUA) was established in 1982. • Needles has 2,840 meters, 2,418 residential customers, 485 commercial customers, 1
municipal customer and 4 master metered. • Total energy sales were 54,090,085 kilowatt-hours (FY2015-16); 46% is residential sales
and 54% is commercial (includes business, schools, parks ect..) • The City has entered into a contract (Contract No. 87-BCA-10098) with the United States
Department of Energy Western Area Power Administration (“WAPA”) to purchase Federal hydro power from the Parker-Davis generating facility. The contract with WAPA expires in 2019. Approximately 55% of the City’s current electric energy is purchased from WAPA.
• The Public Benefits program funds the Low-Income and the Solar Rebate programs for $200,000.00
Overview The City of Needles is a severely disadvantaged community. The average household income is $43,372. The EE program(s) not only assist the NPUA’s load factor, but assist the community residences with lower monthly utility bills. Major Program Changes The Low-Income program was expanded to include Energy Star Appliances, which will use 10 to 50 percent less energy than standard appliances. Program Highlight The Low-Income program reduces Needles’s peak load factor. High temperatures in the summer cause the peak load to be mostly air conditioning loads, which are lessened by the more efficient HVAC installations. Program Descriptions
• Low Income Energy Efficiency Program: Provides rebates to low-income customers for HVAC, ENERGYSTAR® appliances, and the sun shade program.
Sources of Energy Savings Needles relies on the TRM for energy savings estimates for its programs.

Needles Energy Efficiency Program Results, FY 2015-16
Needles
CategoryUnits
Installed
Gross Coincident
Peak Savings (kW)
Gross Annual Energy Savings
(kWh)
Gross Lifecycle Energy Savings
(kWh)
Net Coincident Peak Savings
(kW)
Net Annual Energy Savings
(kWh)
Net Lifecycle Energy Savings
(kWh)
Net Lifecycle GHG
Reductions (Tons)
Utility Incentives Cost
($)
Utility Mktg, EM&V, and
Admin Cost ($)
Total Utility Cost ($)
Utility ($/kWh)
Res Clothes Washers 1 136 1,496 136 1,496 1 $922 $176 $1,098 $0.97Res Cooling 21 4,189 20,945 4,189 20,945 13 $128,666 $3,813 $132,479 $7.30Res DishwashersRes ElectronicsRes HeatingRes LightingRes Pool PumpRes Refrigeration 2 140 1,959 140 1,959 1 $1,950 $208 $2,158 $1.56Res Shell 1 190 1,900 190 1,900 1 $7,657 $225 $7,882 $5.37Res Water HeatingRes ComprehensiveRes BehaviorNon-Res CookingNon-Res CoolingNon-Res HeatingNon-Res LightingNon-Res MotorsNon-Res PumpsNon-Res RefrigerationNon-Res ShellNon-Res ProcessNon-Res ComprehensiveNon-Res BehaviorOther
25 4,655 26,300 4,655 26,300 16 $139,195 $4,421 $143,616 $6.49
T&DCodes and Standards
Total 25 4,655 26,300 4,655 26,300 16 $139,195 $4,421 $143,616
TRC Test 0.03 PAC Test 0.03 Excluding T&D
Resource Savings Summary Cost Summary

CITY OF PALO ALTO UTILITIES City of Palo Alto Utilities at a Glance
• Climate Zone(s): 4 • Number of retail customer connections: 29,500 electric retail customers • FY15-16 total retail sales by customer class
o Residential 19% o Commercial 59% o Industrial 22%
• FY15-16 total budget for electric efficiency programs (including EM&V, admin/overhead, incentives): $5.69 million
• FY15-16 total amount actually expended for electric efficiency programs: $2.43 million City of Palo Alto Utilities Overview CPAU has implemented a variety of energy efficiency programs since the 1970s. In 1998, in response to California’s landmark energy legislation (AB 1890), CPAU established the Electric Public Benefits (PB) Program and increased the Electric PB program budget to 2.85 percent of projected annual revenue to fund energy efficiency programs. CPAU’s electric efficiency program budget can be supplemented with supply funds in order to meet state requirements that publicly owned electric utilities, in procuring energy, shall first acquire all available energy efficiency and demand reduction resources that are cost effective, reliable, and feasible. CPAU is committed to supporting environmental sustainability through promoting efficiency programs, promoting distributed renewable generation, and influencing consumer demand through incentives and education. In March 2013, Palo Alto City Council approved a Carbon Neutral Electric Resource Plan committing CPAU to a carbon neutral electric portfolio beginning in 2013.
Major Program Changes FY 2016 was a year of transition for the efficiency programs at CPAU. Many EE programs were updated or initiated, which resulted in a ramp-up period to get the programs into full swing. In addition, California had unprecedented mandatory water restrictions in place due to the historic drought for nearly all of FY 2016. This required more staff focus on water efficiency, and resulted in less staff time for our new electric efficiency programs. Program Highlight Our Commercial and Industrial Energy Efficiency Program is the flagship of our commercial portfolio. With three engineering firms working closely with our Key Accounts, this is where we get the bulk of our energy savings. The consultants assist our customers with audits, engineering studies, vendor selection, rebate processing and post installation inspection. They make the process as easy as possible for the customer. We are working on taking this program design into our residential market with the Home Energy Genie as the customer advocate.

Program Descriptions Commercial Programs:
• Commercial Advantage Program (CAP): Incentives offered to commercial customers for investments in efficiency lighting, motors, HVAC and custom projects that target peak demand and energy reductions. In FY 2016, CAP recorded a net annual electric savings of 334,645 kWh.
• Commercial and Industrial Energy Efficiency Program (CIEEP): This is the first year that CPAU expanded this program to offer Key Accounts the option of picking one of three engineering consulting firms to assist in helping them evaluate and implement energy efficiency projects. In FY 2016, CIEEP recorded net annual electric savings of 3,334,244 kWh.
• Empower: This is an ongoing program focusing on energy efficiency savings from mostly lighting retrofits in the small/medium commercial sector. In FY 2016, Empower recorded net annual electric savings of 372,598 kWh.
• Business New Construction (BNC): This program ended in FY 2016 due to the more stringent Title 24 requirements and our Palo Alto Green Building Ordinance (10% more efficient than Title 24) which make finding savings above our local code very difficult. Although the program is closed, we do have some customers with projects that are still on the books to be completed. During FY 2016, BNC recorded a net annual electric savings of 24,273 kWh.
• Commercial Benchmarking: This pilot program with GreenTraks, Inc. was implemented to assist 22 businesses with using the US EPA’s Portfolio Manager online energy management tool. Each building is benchmarked against similar buildings based on its energy usage using an Energy Star rating of 1 to 100. The goal of the pilot is to help a mixture of small, medium and large commercial customers benchmark their building and determine the best ways to remove barriers and encourage more customers to use Portfolio Manager.
Residential Programs: • MultiFamily Residence Plus+: This program provides no cost, direct installation of EE
measures to multifamily residences with 4 or more units including hospices, care centers, rehab facilities, and select small and medium commercial properties. The program has focused on energy efficient lighting and insulation upgrades. In FY 2016, the MultiFamily Residence Plus+ program recorded net annual electric savings of 105,514 kWh. In FY 2017, the program was revamped to include more LED lighting upgrades as the price of LED’s has decreased and the quality of the lights has greatly improved. We expect the savings to greatly increase for this program in FY2017, with a focus on upgrading below market rate apartment complexes.
• Home Efficiency Genie: The Home Efficiency Genie is our flagship residential program. Launched in June 2015, our residents can call the ‘Genie’ to get free utility bill reviews and phone consultations. For a fee, residents also have the option to receive an in-depth home assessment which includes air leakage testing, duct inspections, insulation analysis, energy modeling and a one-on-one review of assessment reports with an energy expert.
This package is followed up with guidance and support throughout home improvement projects. This program has a high educational value for Palo Alto residents. During FY 2016, the Home Efficiency Genie program recorded a net annual electric savings of 3,513 kWh.
• Smart Energy: This is a comprehensive energy efficiency incentive program for residential customers. The City gives rebates to residents who install energy efficient measures and equipment in their homes. Among these are attic insulation, heat pump water heaters, clothes washers, pool pumps, smart power strips and whole house fans. Due to federal minimum manufacturing standards for appliance efficiency, the number of appliances meeting rebate qualifying standards dropped significantly during FY2016. Compared to FY 2015, CPAU paid out 50.5% less in rebates under the Smart Energy Program. CPAU projects that this downward trend will continue. In FY 2016, Smart Energy achieved net annual electric savings of 48,564 kWh.
• Residential Energy Assistance Program (REAP): This program provides weatherization and equipment replacement services to low-income residents and those with certain medical conditions with no cost to the residents. This program has equal focus on efficiency as well as comfort, and therefore is not meant to be cost effective. In FY 2016, REAP recorded net annual electric savings of 22,907 kWh.
• Home Energy Report: CPAU stopped providing residents with individualized reports comparing their home energy use with neighbors in similarly sized homes in FY 2016. However, based on the results of behavior studies on Home Energy Reports, savings persist with a decay rate of 20% per year for 5 years after the program has ended. In FY 2016, the Home Energy Report recorded first year persistence annual electric savings of 1,283,418 kWh.
• Appliance Recycling: CPAU provided residents a $35 rebate to residents who recycle old, operational refrigerators with JACO Environmental which offered free pick-up and recycling services. In late November 2015, JACO Environmental went into receivership and shut down its operations. No energy savings for this program have been recorded for the FY16 period. Utilities staff is looking for a new program vendor and is working with the City Attorney’s office to terminate this contract.
Community Resource Education Programs: • CPAU offers free energy efficiency advice and energy education programs to the
community. Activities include hosting commercial Facility Manager Meetings for key account customers, residential energy workshops, participation in Chamber of Commerce meetings, neighborhood association events, local fairs and special events.
• In April 2014, CPAU announced its intent to compete for the Georgetown University Energy Prize, a national competition that aims to challenge communities across the U.S. to dramatically rethink their energy use. On January 14, 2015, CPAU was selected as one of the 50 communities in the U.S. leading the way on energy efficiency. The competition stretched over a two year period, ending December 2016, with a $5 million prize to be awarded to the winner of the competition. During this competition, CPAU developed an

online energy portal and worked closely with students and Cool Block participants to promote our programs and continue to save energy.
Public School Program: • CPAU provides an annual grant of up to $50,000 to the Palo Alto Unified School District
(17 schools with 12,000 students total) to support teacher training programs and the development of curriculums and education projects promoting energy and water efficiency. CPAU participates in monthly sustainable schools committee meetings and give educational presentations to classes on energy efficiency, renewable energy, and safety.
Complimentary Programs Customer-side Renewable Energy:
• Solar Water Heating Program: CPAU offers rebates to residential and commercial customers who install qualifying solar water heating (SWH) systems. The program is governed by state law in regard to development, implementation and administration.
• The PV Partners Program: Rebate funds were fully reserved in April 2016. The last PV installations are expected to be constructed by April 2018.
• SunShares Solar Discount Programs: Palo Alto has participated in regional group-buy solar programs in 2015 and 2016. These programs are administered by a non-profit agency and offer discounted prices for residential solar PV systems from a few pre-qualified contractors. The Peninsula SunShares program was offered to residents in 2015 (May through August) and resulted in 54 new solar PV installations in Palo Alto for a total of 236 kW. The Bay Area SunShares program was offered in 2016 (August to November) and resulted in 5 new solar PV installations in Palo Alto for a total of 28 kW.
Utility-interconnected Renewable Generation in Palo Alto:
• Palo Alto CLEAN: The CLEAN (Clean Local Energy Accessible Now) program offers a feed-in tariff for any sized renewable generation systems installed on the utility-side of the electric meter where all of the generated electricity is procured for use in Palo Alto’s Renewable Portfolio Standard (RPS). For fiscal year 2017, the prices are 16.5 ¢/kWh fixed for 20 or 25 years for solar renewable energy resources, up to a capacity limit of 3 MW (and 8.9 ¢/kWh for a 20-year contract term, or 9.1 ¢/kWh for a 25-year contract term beyond that limit), and 8.4 ¢/kWh for a 20-year contract term and 8.5 ¢/kWh for a 25-year contract term for non-solar eligible renewable energy resources.
• Community Solar Program: CPAU is currently developing a community solar program, which typically enable an electric utility’s customers to buy or lease solar panels in a centralized solar PV array and receive regular credits for the solar generation on their utility bill.
Research, Development & Demonstration: • The Customer Connect pilot program uses advanced meters to help residential customers
evaluate changes in their energy and water use and view their consumption through an online portal. This program has 400 participating customers, of which 96 customers have

enrolled in the pilot Time-of-Use electricity rate. Enrolled customers are able to save money by shifting electric usage to off-peak hours. The pilot also offers water leak detection and alert, staff notifies customers of both small and burst water leaks detected by the advanced meter system. Since November 2014, 222 individual water leak incidents have been detected. Staff communicated with the homeowners to resolve the leaks on over a quarter of the incidents, saving thousands of gallons of water from being lost and saving customers money. The pilot is planned to be extended until the end of 2020.
Program for Emerging Technologies (PET): CPAU’s Program for Emerging Technologies program (www.cityofpaloalto.org/UTLInnovation) provides the opportunity for local businesses to submit proposals to CPAU for review and potential pilot testing. The goal is to find and nurture creative products and services that will manage and better use electricity, gas, water, and fiber optic services. From its inception in June 2012 through July 2016, the PET program received 57 applications. PET pilot programs from FY 2016 include:
• linkAges Connect: Using Utility Data to Help Seniors and their Caregivers • Assessing the Environmental Value and Economic Performance of Residential Solar Water
Heating • Advanced Distribution Management System Testbed Development • Integrated Energy Storage System and Customer Portal consultation • Community Solar Program Management Software Suite
Demand Reduction Pilot:
• CPAU’s Demand Response (DR) pilot program offers incentives to large commercial customers to voluntarily reduce their electricity use during periods of high demand in the summer months. In the past three years, 1.4 MW (2014), 0.6-1 MW (2015) and 0.27 MW (2016) of loads were reduced during the peak demand period of the summer. This program has become an integral part of CPAU’s effort to reduce the reliance on fossil fuel generation and to lower purchase cost.
Evaluation, Measurement & Verification (EM&V) For FY 2016, CPAU contracted with TRC Engineers to undertake impact and process evaluation for the Commercial Advantage Program, Empower (Small & Medium Commercial) Program, CIEEP (Enovity & Ecology Action), MultiFamily Residence Plus+ Program and the Home Energy Report Program. A final EM&V report is expected to be available by March 2016.

Palo Alto Energy Efficiency Program Results, FY 2015-16
Palo Alto
CategoryUnits
Installed
Gross Coincident
Peak Savings (kW)
Gross Annual Energy Savings
(kWh)
Gross Lifecycle Energy Savings
(kWh)
Net Coincident Peak Savings
(kW)
Net Annual Energy Savings
(kWh)
Net Lifecycle Energy Savings
(kWh)
Net Lifecycle GHG
Reductions (Tons)
Utility Incentives Cost
($)
Utility Mktg, EM&V, and
Admin Cost ($)
Total Utility Cost ($)
Utility ($/kWh)
Res Clothes Washers 110 19,910 278,740 6,172 86,409 $10,035 $1,046 $11,082 $0.16Res Cooling 1 161 3,220 45 902 $50 $25 $75 $0.12Res DishwashersRes ElectronicsRes Heating 40 5,584 55,777 3,685 36,801 $300 $7,805 $8,105 $0.26Res Lighting 2,611 150 132,166 1,441,666 119 97,796 1,034,289 $127,907 $127,907 $0.15Res Pool Pump 3 5,133 51,330 3,080 30,798 $600 $382 $982 $0.04Res Refrigeration 125 55,162 276,279 44,110 220,750 $3,458 $11,494 $14,952 $0.08Res Shell 14,485 77,304 1,543,681 25,610 510,347 $1,145 $81,502 $82,647 $0.23Res Water HeatingRes Comprehensive 57,221 1,283,418 1,283,418 1,283,418 1,283,418 $18,260 $18,260 $0.01Res BehaviorNon-Res CookingNon-Res Cooling 31 60 3,154,829 13,668,459 48 2,524,232 10,940,299 $310,870 $524,218 $835,088 $0.10Non-Res Heating 33 18,348 220,176 14,678 176,141 $1,902 $4,406 $6,308 $0.04Non-Res Lighting 27 443 1,852,256 26,279,808 354 1,482,864 21,039,732 $172,512 $506,525 $679,037 $0.04Non-Res Motors 45 5 47,880 718,200 4 38,304 574,560 $10,019 $14,115 $24,135 $0.05Non-Res PumpsNon-Res Refrigeration 3 7,100 85,200 5,680 68,160 $710 $2,785 $3,495 $0.06Non-Res ShellNon-Res ProcessNon-Res ComprehensiveNon-Res BehaviorOther
74,735 658 6,659,251 45,905,954 526 5,529,675 36,002,605 $511,602 $1,300,470 $1,812,072 $0.06
T&D 1 8 70,460 3,523,000 8 70,460 3,523,000 $46,710 $46,710Codes and Standards
Total 74,736 666 6,729,711 49,428,954 534 5,600,135 39,525,605 $511,602 $1,347,180 $1,858,782
TRC Test 0.78 PAC Test 1.34 Excluding T&D
Resource Savings Summary Cost Summary

PASADENA WATER AND POWER Pasadena Water and Power
• Climate Zone 9 • Number of retail customer connections: 65,308 • Retail Sales: 1,094.9 GWh ($181.3 million)
o Residential connections: 56,674 (32.9% of retail sales) o Commercial and Industrial connections: 8,629 (66.0% of retail sales) o Other: 1.1% of retail sales
• Budget for energy-efficiency programs: o $3.5 million expended for energy efficiency programs (includes incentives as well
as administration, program marketing costs and EM&V) o Funding Source: Public Benefits Charge (“PBC”) as authorized under Public Utilities
Codes 385(1) funds all AB1890 programs (current PBC revenue rate = $0.00685 per kWh)
o Energy-efficiency programs (rebates, distribution, direct install, marketing, administration, and program evaluation, measurement and verification) represent approximately 50% of Pasadena’s PBC expenditures. Solar incentive program represents 38%, Research Development and Demonstration (RD&D) represents 2%, and income-qualified rate assistance represents 11%.
Pasadena Water and Power Overview Trends in Pasadena which impact energy-efficiency programs include:
• Pasadena’s local economy continues to grow. o Rising real estate property values result in continued gentrification of older, lower
income residential neighborhoods; resulting in fewer income qualified households on rate assistance and eligible for income qualified efficiency programs
• New power rates became effective July 1, 2014 with an additional rate increases in July 2015 and July 2016.
• Given the ongoing draught in California, PWP has continued to focus on community outreach and awareness and creating innovative solutions for improving water efficiency and reducing customer water use.
• Aggressive energy-efficiency and demand reduction goals, adopted in 2013 by Pasadena’s City Council, combined with other changes in the market (e.g., new codes and standards) have continued to lead to flat energy load projections in the future.
Major Program Changes Major changes to the PWP energy-efficiency programs during FY2015/16 program year include:
• Implemented a successful LED promotion for customized energy-efficiency projects that was launched in Spring 2016 and subsequently extended until October 2016, to help

alleviate possible shortages from the unavailability of Aliso Canyon gas storage facility. This promotion successfully stimulated a large number of LED retrofits among Pasadena businesses; the majority of the savings will be reported in next year’s annual report.
• For residential customers, PWP launched a “Summer Readiness” Promotion with double rebates for residential customers in July 2016. This promotion will be reflected in next year’s annual report.
• Added additional measures to the LED WebShop, including smart thermostats and advanced power strips and added a smart thermostat rebate to the Home Energy Rebate program.
• Added several new programs including: to PWP’s portfolio of energy-efficiency programs including a non-residential Upstream HVAC program, and an income-qualified Energy Savings Assistance Program that is implemented through a partnership with the Southern California Gas Company (SoCalGas).
As additional PBC funding is becoming available as the funds required for large solar rebates decline, PWP anticipates launching a new residential direct install program in 2017. This program would provide comprehensive no-cost home energy and water audits by a trained efficiency specialist and install free energy and water products services, for residential customers, and support PWP’s focus on strong customer and community engagement. Measures and services planned include high quality LED light bulbs, showerheads, faucet aerators, toilet replacements, HVAC system ‘check ups’, and weatherization services such as ceiling insulation and weather-stripping, plus tips and customized guidance on additional energy and water upgrades with links to available incentives that will help customers save on their utility bills. This program would leverage co-funding through a partnership with SoCalGas and rebates available from the Metropolitan Water District. To further support small business and achieve additional water savings, PWP is also working to enhance the current energy and water direct install program (WeDIP) in 2017. PWP applied for a $1.2 million grant to expand this program over 2 years. This grant funding would allow additional water and energy saving product, to be available through the program, at no cost to participating customers. If the grant application is successful, PWP plans to target these benefits to small and mid-size businesses located in disadvantaged communities. Program Highlight In summary, below are the FY 2015/16 energy savings results by customer type (also see Tables 1 and 2 below):
Residential: 6,171 MWh Non-Residential: 8,807 MWh T&D and C&S: 4,442 MWh Total: 19,420 MWh

Table 1. PWP Energy Efficiency Program Results (by program)
PWP’s energy efficiency programs with the greatest impacts in FY2015/16 were:
• Energy Efficiency Partnering Program (“EEP”) (7,769 MWh savings): Commercial efficiency incentive program providing customers with customized incentives to encourage energy saving and load reduction projects.
• Home Energy Reports (5,553 MWh savings): Originally launched in June 2011, the Home Energy Reports program completed its fifth year. In FY 2015/16, four printed reports were mailed to approximately 40,000 customers, reminding them of efficiency and rankings to encourage reductions in their energy usage; savings are tracked from actual metered data; no cost to participant. PWP established a new contract for home energy report services in July 2016.
• Water & Energy Direct Install Program (“WeDIP”) (1,027 MWh savings): Small businesses direct install program to conduct retrofits for lighting, plumbing and refrigeration; no cost to participant.
Program Descriptions PWP provides summaries of major programs by the associated sector-category classifications used in the E3 Reporting Tool.
• Residential Lighting o PWP’s LED WebShop enables residential customers to purchase LED light bulbs online
at a lower-cost, reflecting a $5 per light bulb buy down from PWP. PWP residential customers purchased or redeemed vouchers for approximately 4,800 LED lightbulbs in FY2015/16.
Units Installed
Net Coincident
Peak Savings (kW)
Net Annual Energy
Savings (kWh)
Net Lifecycle Energy
Savings (kWh)Utility
Incentives ($)TOTAL EE PORTFOLIO 88,670 2,336 19,419,573 151,634,630 2,921,509$ Residential Rebates 78,641 58 121,615 1,634,101 121,584$ Home Energy Reports 1 5,553,051 5,553,051 416,500$ Residential Recycling 233 20 100,678 498,436 28,475$ Commercial Direct Install WeDIP 136 248 1,026,945 5,489,077 483,847$ T&D 1 2 21,173 635,190 0$ C&S 1 747 4,420,452 4,420,452 0$ Commercial Rebates (EEP and PE 49 1,206 7,769,037 130,481,591 1,624,444$ Low Income Product Giveaways 3,528 7 67,032 1,005,480 24,997$ Low Income Energy Savings Assist 650 3 6,771 66,332 7,150$ Low Income Refrigerator Exchange 294 18 113,946 780,270 122,516$ Residential Audits 309 17 36,904 36,904 14,300$ LED WebShop 4,825 5 49,862 743,558 28,012$ Upstream HVAC 1 4 11,291 169,371 7,728$ LivingWise 1 120,817 120,817 41,957$
Print Results(Ctrl+Shft+P)

o PWP expanded the WebShop to include Advanced Power Strips and Smart Thermostats, and renamed it the “PWP WebShop” in 2016.
o As part of the residential distributions and giveaway activities, PWP provides vouchers for efficient light bulbs upon request as well as a reward for participating in income-qualified rate assistance, electric vehicle and refrigerator recycling programs and for completing an online energy audit.
• Residential Refrigeration:
o PWP provides rebates for the purchase of new ENERGY STAR® certified refrigerators through the Home Energy Rebate Program and also provides new ENERGY STAR refrigerators at no cost to income-qualified customers. In addition, PWP provides a rebate to encourage customers to remove and recycle older refrigerators and freezers, to reduce their energy bill and lessen the impact that these older appliances have on the grid, and to ensure units are recycled in a safe and environmentally-responsible manner.
• Residential Pool Pump
o PWP’s Home Energy Rebate Program provides rebates for the purchase of variable speed pool pumps.
• Residential Cooling o PWP’s Home Energy Rebate Program provides prescriptive rebates for the installation
of efficient air conditioning equipment (central AC/HP, window air conditioners, and mini/multi splits), as well as related shell improvement measures such as insulation, solar attic and whole house ventilation fans, cool roof, skylights/windows, window films, sun shade screens, and shade trees.
• Residential Comprehensive o Home Energy Reports are mailed to approximately 40,000 customers providing them
with information on their energy usage, including comparison with similar households, and information on efficiency opportunities and PWP programs in order to encourage reductions in their energy usage.
• Non-Residential Lighting, Refrigeration, Shell and Cooling o PWP’s non-residential EEP program provides custom incentives to business customers.
The WeDIP program, designed to serve small businesses, provides no-cost audits and direct installation of lighting equipment, water saving measures such as low flow toilets and aerators, and simple refrigeration upgrades.
• Non-Residential Pumps
o PWP’s water efficiency programs saved 466 acre-feet, resulting in 1,203 MWh annual energy savings (shown on the E3 as “Non-Res Pumps”); PWP’s PBC Fund provides a rebate to PWP’s Water Conservation Fund for the value of these savings.

• T&D Efficiency o Distribution system upgrades yielded energy savings of 21 MWh.
• Other
o Under Codes and Standards (“C&S”), PWP has 4,420 MWh and 747 kW of energy and peak demand savings that are occurring in our service territory due to the State building codes that are encouraged and enforced by the City’s Building Department and appliance standards. In collaboration with SCPPA members, PWP is working on expanding prior PWP-funded research on efficient laboratory fume hoods to support a proposal for new code requirements on fume hoods. SCPPA members will submit the study results and new fume hood code recommendations to the CEC as part of the next triennial update to the Title 24 Building Codes.
EM&V PWP expended $98,658 on energy efficiency program EM&V to justify program design, expenditures and verify results:
• Residential Rebate Program: Contractors performed site verifications on 10% of all residential energy-efficient equipment purchases and installations, and on 100% of refrigerator/freezer recycling and refrigerator exchange program participants.
• Non-Residential Programs: o EEP Program: Utility staff and contractors performed pre-and post-installation
equipment and installation verification, on site, for 100% of customer projects with rebates exceeding $5,000.
o Of the 48 non-residential custom projects completed, all had an independent engineering analysis conducted by a PWP engineering consultant Mechanical Equipment Retrofits: PWP’s engineering contractor calculated
energy savings and demand reduction using accepted engineering analysis such as DOE’s eQuest building modeling software and the DOE Motor Master.
Lighting: Engineer-certified Excel workbook used to calculate lighting retrofit project energy savings based on the actual hours of operation.
Data Loggers: Data loggers and CT’s were occasionally used to verify operating hours and equipment savings. All mechanical projects and a majority of lighting projects had both pre- and post-inspections.
o WeDIP Program: All water and energy direct install projects completed were pre- and post-inspected.
Sources of Energy Savings PWP relies on the POU TRM data, where available, supplemented by best available technical data from independent engineering analysis where TRM measures are not yet available. For commercial programs, as discussed above, PWP relies on independent engineering analysis conducted by PWP’s engineering consultant and industry models (e.g., DOE’s eQuest building modeling software). The EEP program provide commercial customers with the ability to participate with any proven technology that saves energy, provided it meets the program requirements and the energy savings can be demonstrated.

Complimentary Programs • Low-Income Programs: PWP has offered electric rate assistance programs to eligible low
income seniors or disabled customers for several decades. The current Electric Utility Assistance Program (“EUAP”) became effective in 2006 and provides monthly assistance to low income, seniors, and medically-qualifying customers. Project APPLE (“Assisting Pasadena People with Limited Emergencies” provides a one-time utility bill payment assistance program that provides eligible customers who need help paying their bills, up to $100 per year. Funding for Project APPLE is provided through donations from PWP customers as well as PBC revenues. In addition, PWP in partnership with other City departments offers specific income-qualified services under the Under One Roof program to income qualified customers including low-to-no interest loans, exterior house painting, wheel chair ramps, weatherization services, an ENERGY STAR refrigerator exchange, solar energy systems, and turf replacement to drought tolerant landscapes, free of charge.
• Renewable Energy Programs: PWP’s Pasadena Solar Initiative (“PSI”) aims to install 14 MW of customer owned solar photovoltaic by December 31, 2017 in line with Senate Bill 1, California’s “Million Solar Rooftops” initiative. PWP offers incentives to encourage customers to install solar photovoltaic systems on their home or business. PSI incentives are paid upfront through an Expected Performance Based Buydown (“EPBB”) for smaller systems, whereas all systems larger than 100 kilowatts (“kW”) are now paid over two-years based on metered output through a Performance Based Incentive (“PBI”). Since the program started in 2008 and through June 2016, 872 PWP customers have participated in the PSI program installing 7.73 MW of solar power PWP also offers a Green Power Program, where customers can opt to pay a premium (2.5 cents/kWh) on their electricity bill for clean, renewable power. This program is open to both residential and commercial customers. As part of the 2015 PWP Integrated Resource Plan, approved by City Council in June 2015, PWP committed to support local renewable energy resources and community solar efforts and is currently developing a Community Solar pilot project and a feed-in tariff.
• Research, Development, and Demonstration: Throughout the years PWP has invested resources in a variety of different RD&D projects. This year, PWP continued to focus its support on Plug-in Electric Vehicle (“EV”) development by providing funding of City fleet electric vehicles. PWP has also secured grant funding from the American Public Power Authority’s Demonstration of Energy & Efficiency Developments program to install four solar powered heat pumps in Pasadena. Energy use related to heating and cooling indoor space makes up almost half of our customer’s total energy consumption. This project introduces a new technology featuring solar-powered heat pump air conditioning systems. Four units were installed at Pasadena Unified School District sites in December 2016. PWP is working with SCPPA and member utilities, to evaluate their effectiveness and to measure the product’s potential to reduce energy usage from heating and cooling. The evaluation is expected to be completed in March 2017.
• Electric Vehicles: PWP provided incentives for individuals who purchase an EV and/or install a Level 2 EV Charger at their Pasadena address. PWP provides up to $200 worth of LED light bulbs to residential customers for notifying PWP about their new electric vehicle. In

addition, PWP offers a bill credit of up to $400 to customers who install a Level 2 (240V) “wall mounted” or “hard-wired” charging station at their home, multi-unit complex, or business. The EV Charger incentive is also available to commercial customers and institutions for employees’ vehicle charging.
• PWP will continue to support the development of EV infrastructure in Pasadena and installed the City’s first Direct Current (“DC”) Fast Charger through grant funding that was received from the CEC. During FY 15/16, PWP installed the DC Fast Charger at the Del Mar Gold Line Station Parking Structure. The DC Fast charger enables rapid charging. Based on battery type and vehicle, DC Fast Charger can add about 60-80 miles of range to an EV in 20 minutes of charging time. This Fast Charger, currently free of charge, has proven very popular with EV drivers since it went into operation in December of 2015. Its use has increased and is now averaging 700-800 charging sessions per month.

Pasadena Energy Efficiency Program Results, FY 2015-16
Pasadena
CategoryUnits
Installed
Gross Coincident
Peak Savings (kW)
Gross Annual Energy Savings
(kWh)
Gross Lifecycle Energy Savings
(kWh)
Net Coincident Peak Savings
(kW)
Net Annual Energy Savings
(kWh)
Net Lifecycle Energy Savings
(kWh)
Net Lifecycle GHG
Reductions (Tons)
Utility Incentives Cost
($)
Utility Mktg, EM&V, and
Admin Cost ($)
Total Utility Cost ($)
Utility ($/kWh)
Res Clothes WashersRes Cooling 253 10 20,770 265,547 8 18,277 229,196 148 $27,551 $5,718 $33,269 $0.20Res Dishwashers 25 650 6,500 390 3,900 2 $710 $47 $757 $0.25Res Electronics 26 624 4,992 624 4,992 3 $0 $41 $41 $0.01Res HeatingRes Lighting 8,340 18 162,009 2,449,115 14 120,066 1,819,966 1,032 $53,554 $13,194 $66,748 $0.05Res Pool Pump 114 4 76,836 768,360 2 46,102 461,016 275 $53,600 $6,293 $59,893 $0.16Res Refrigeration 672 47 276,579 1,755,633 38 227,789 1,463,024 826 $164,331 $29,747 $194,078 $0.16Res Shell 78,741 107 96,950 1,711,027 49 46,656 746,083 444 $32,988 $8,930 $41,918 $0.08Res Water HeatingRes Comprehensive 310 17 157,721 157,721 17 157,721 157,721 94 $56,257 $10,248 $66,505 $0.44Res Behavior 1 5,553,273 5,553,273 5,553,051 5,553,051 3,306 $416,500 $76,277 $492,777 $0.09Non-Res Cooking 1 24 46,705 700,575 24 46,705 700,575 390 $11,959 $1,370 $13,329 $0.03Non-Res Cooling 10 666 1,925,877 38,451,120 665 1,923,884 38,421,231 24,576 $431,189 $110,749 $541,938 $0.02Non-Res HeatingNon-Res Lighting 151 648 4,458,413 61,012,681 648 4,458,413 61,012,681 36,136 $1,369,702 $217,213 $1,586,915 $0.04Non-Res Motors 2 111 848,534 13,576,544 111 848,534 13,576,544 7,567 $132,368 $26,402 $158,770 $0.02Non-Res Pumps 1 1,203,371 19,253,936 1,203,371 19,253,936 10,731 $108,303 $37,443 $145,746 $0.01Non-Res Refrigeration 20 10 88,588 797,292 10 88,588 797,292 444 $35,878 $12,481 $48,360 $0.08Non-Res Shell 1 237,778 2,377,780 237,778 2,377,780 1,444 $26,620 $6,466 $33,086 $0.02Non-Res ProcessNon-Res ComprehensiveNon-Res BehaviorOther
88,668 1,661 15,154,677 148,842,097 1,586 14,977,948 146,578,988 87,419 $2,921,509 $562,618 $3,484,128 $0.03
T&D 1 2 21,173 635,190 2 21,173 635,190 354 $0 $0Codes and Standards 1 747 4,420,452 4,420,452 747 4,420,452 4,420,452 2,464 $0 $0
Total 88,670 2,411 19,596,302 153,897,739 2,336 19,419,573 151,634,630 90,237 $2,921,509 $562,618 $3,484,128
TRC Test 2.22 PAC Test 5.51 Excluding T&D
Resource Savings Summary Cost Summary

PITTSBURG POWER DBA ISLAND ENERGY Island Energy At a Glance
• Year established: 1996 • Climate Zone(s): 3 • Number of retail customer connections: 538 • Percent of retail sales by customer class: 9% residential, 91% commercial • All Energy Efficiency Programs are funded by Island Energy’s Public Benefits Fund (PBF).
During Fiscal Year 2015-2016, the annual PBF collection is $124,952 from electricity sales and $3,985 from natural gas sales. During Fiscal Year 2015-2016, $47,135 was expended on Commercial Lighting Retrofit Program and $45,266 was spent on Solar Incentive Program in the form of utility rebates. Unused fund in each program is carried forward to next year’s respective program.
Utility Overview Island Energy is a very small publically owned utility provides electric and natural gas distribution services to a decommissioned Navy base named Mare Island, which now hosts many different kinds of businesses and 287 residential homes. Most of the residential units were built in 2007 and 2008 with good insulation and high energy efficient appliances. Residential Energy Efficiency Programs include free onsite energy audits to make sure residents reach their energy efficiency goals. Most commercial buildings were built over 60 years ago. Now many of them have been refurbished and re-purposed for different kinds of businesses. Island Energy tailored its Commercial Energy Efficiency Programs to meet the needs of business owners on Mare Island. Island Energy provides rebates to these improvements to help lower business owners’ initial investments and shorten their payback period. Major Program Changes To encourage uses of electric vehicles on Mare Island, Island Energy has implemented rebate program for EV charging stations. Island Energy not only provides rebates for electric vehicle charger installations at residential/commercial premises, but also provides a block of energy at the lowest rate to electric vehicle customers. Program Highlight The Commercial Lighting program has the greatest impact among all Energy Efficiency Programs and contributes over 85% of energy savings to Island Energy’s Annual Energy Reduction Goal. Most commercial buildings on Mare Island have outdated lighting layouts and fixtures. Island Energy provides rebates for one-for-one lighting fixture replacement, as well as customized lighting retrofit projects. Most commercial lighting projects update the whole lighting layout with fewer and much more efficient lights or LEDs, resulted in 65% -80% wattage reductions and energy savings. With the rebates that Island Energy offers, the payback period for such lighting

project is usually 1-2 years. The Commercial Lighting Program is definitely the most cost-effective energy saving measure on Mare Island. Program Descriptions
• Commercial Lighting Program: Lighting Redesign, Overhaul or Retrofit Projects for Commercial Buildings. Incentive is based on one-for-one replacement or calculated based on expected annual energy Savings.
• Commercial Motors & Process Improvement: Replacement of Old Motors with NEMA Premium Efficiency Motors
• Compressed Air System: Installation of New Compress Air System or Redesign/Retrofit of Old Compress Air System
• Commercial Solar Incentive Program: Rebate for photovoltaic solar systems for commercial buildings and parking structures
• Residential Home Energy Audit: Free On-Site Energy Advisory Service to Residential Customers
• Residential Retail Lighting: Free CFL Light Bulbs & LED Lights to Residential Customers • Residential Appliance Efficiency: Rebates for Energy Star Qualified Clothes Washers,
Dishwashers, Air Conditioners and Refrigerators. • Residential Solar Incentive Program: Rebate for photovoltaic solar systems for residential
properties. • Residential Net Energy Metering Program: Allow solar customers to bank their energy
generation credits and to choose to be compensated at a rate equal to the Utility’s avoided energy cost
• LED Lighting: Rebates for LED Street Lights • EV Charging Station: Rebate for electric vehicle charger installations
EM&V The utility files EM&V reports as part of public utilities reporting compliance. Coming into year 2015, staff will focus more resources on R&D demonstration and educational programs on renewable energy resources and technologies for the public interests, such as community solar and green-energy programs. Sources of Energy Savings Staff review Energy efficiency applications and monitor closely on energy consumption changes after EE measures are installed. Utility has dedicated staff time to monitor and maintain spreadsheets and data for energy savings from energy efficiency and solar incentive programs. Complimentary Programs
• Low-Income Programs: Island Energy offers 20% discount on electric and natural gas charges to qualified low-income customers.

Pittsburg Energy Efficiency Program Results, FY 2015-16
Pittsburg
CategoryUnits
Installed
Gross Coincident
Peak Savings (kW)
Gross Annual Energy Savings
(kWh)
Gross Lifecycle Energy Savings
(kWh)
Net Coincident Peak Savings
(kW)
Net Annual Energy Savings
(kWh)
Net Lifecycle Energy Savings
(kWh)
Net Lifecycle GHG
Reductions (Tons)
Utility Incentives Cost
($)
Utility Mktg, EM&V, and
Admin Cost ($)
Total Utility Cost ($)
Utility ($/kWh)
Res Clothes WashersRes CoolingRes DishwashersRes ElectronicsRes HeatingRes LightingRes Pool PumpRes RefrigerationRes ShellRes Water HeatingRes ComprehensiveRes BehaviorNon-Res CookingNon-Res CoolingNon-Res HeatingNon-Res Lighting 1,311 144 483,358 5,373,331 115 386,687 4,298,665 $47,355 $13,120 $60,475 $0.02Non-Res MotorsNon-Res PumpsNon-Res RefrigerationNon-Res ShellNon-Res ProcessNon-Res ComprehensiveNon-Res BehaviorOther
1,311 144 483,358 5,373,331 115 386,687 4,298,665 $47,355 $13,120 $60,475 $0.02
T&DCodes and Standards
Total 1,311 144 483,358 5,373,331 115 386,687 4,298,665 $47,355 $13,120 $60,475
TRC Test 0.15 PAC Test 0.74 Excluding T&D
Resource Savings Summary Cost Summary

PLUMAS-SIERRA RURAL ELECTRIC COOPERATIVE Plumas-Sierra Rural Electric Cooperative At a Glance
• Climate Zone 16 • 7,861 retail customers • Retail sales by customer class:
residential 45.2%; commercial 11.5%; industrial 37.3%; Agricultural 6% • 2016 total budget for energy efficiency programs was $110,936 • 2016 total amount actually expended for energy efficiency programs was $89,863
Plumas-Sierra Rural Electric Cooperative Overview The local economy is starting to recover from the Great Recession and homeowners are upgrading their homes to improve efficiency and comfort with new windows, upgraded insulation and efficient air source and ground source heat pumps. These upgrades by homeowners have increased participation in programs offered by PSREC. An important aspect to note is PSREC’s unique peak demand occurs during winter. Therefore, the most cost-effective program concentration is to reduce demand in the winter. The E3 model has limitations in how coincident peak demand savings are reported since PG&E’s load profile is applied as the default. Major Program Changes There were no major program changes for PSREC in 2016. Program Highlight The programs that had the greatest impact and participation by members were the weatherization and HVAC rebate programs. These programs were successful because many homes that were vacant are now selling, and the new homeowners are making upgrades to improve comfort and efficiency. There are also homeowners who are making upgrades to their homes after beginning to recover from the Great Recession. Program Descriptions
• Geothermal Heating/Cooling Loans: HVAC – Res Heating, Res Cooling: - 0% interest ground source heat pump loop loans available for installation of ground-source heat pumps.
• HVAC Rebates: HVAC – Res Heating, Res Cooling: PSREC provides members with rebate options to encourage installation of energy-efficient electric heat pumps and ground-source heat pumps in new construction and existing homes and small businesses. Upgrading to an energy-efficient heating and cooling system will contribute to increased comfort in
homes or businesses while helping to reduce overall energy use.
• ENERGY STAR® Rebates: Appliances, Consumer Electronics, Refrigeration – Res Clothes Washers, Res Dishwashers, Res Electronics, Res Refrigeration: Rebates available for the purchase of an ENERGY STAR® refrigerator, dishwasher, clothes washer or other small electronics.
• Appliance Recycling: Refrigeration – Res Refrigeration: Non-essential Freezer/Fridge Retirement: Rebates offered for recycling a non-essential freezer or refrigerator.
• ENERGY STAR® Lighting Rebates and Giveaways: Lighting – Res Lighting: ENERGY STAR® LED Lamp Program: Offers rebates for the purchase and installation of LED lamps. PSREC also provided free LED lamps to members at its annual membership meeting. LED Holiday Light Rebate: Provides an incentive to replace incandescent holiday light strands with qualified new ENERGY STAR LED holiday light strands.
• Water Heater Sales and Rebates: Water Heating – Res Water Heating: Discounted sales of, and rebates for the purchase of high-efficiency electric water heaters.
• Weatherization Rebates: HVAC – Res Shell: PSREC offers members rebates for upgrading windows and insulation in their homes. By retrofitting a home to above-code R-Values, and upgrading windows to double-pane high-performance windows, members not only realize the added comfort, but also gain increased home values. PSREC encourages members to invest in weatherization measures prior to, or in addition to, investing in a new heating source for energy conservation.
• Agricultural Irrigation Rebates: Process – Non-Res Pumps: To encourage the installation of energy efficient equipment in agricultural irrigation systems PSREC offers rebates for pump tests and efficiency improvements.
• Efficiency Education - Education/Outreach: PSREC provides energy efficiency and conservation information to interested members to help them reduce their bill, understand their energy consumption and make their home more efficient. This program has successfully addressed high bill concerns by empowering members to use information such as our ‘Do-It-Yourself Energy Audit’ to learn more about their home and how they use energy.
• Efficiency Education - Energy Audits: PSREC provides free comprehensive energy audits to assist members with energy conservation and troubleshooting high energy consumption in their home. This program has been successful in educating members about efficiency and conservation and assisting in reduction of energy use, especially in low-income homes. Commercial Energy Audits: PSREC provides free energy audits to businesses to assist with energy conservation and troubleshooting high energy consumption. This program has been successful in assisting business owners in making decisions in efficiency upgrades and conservation.
EM&V PSREC EM&V reports can be found online at: http://www.ncpa.com/policy/reports/emv/.

PSREC performs a yearly internal review to evaluate program effectiveness and improvement areas. PSREC has committed to seek third party evaluation of its programs every five years, dependent upon budget. Sources of Energy Savings PSREC used the TRM as the source of reported energy savings. Complimentary Programs
• Low Income Winter Rate Assistance Program: Income-qualified members can apply for a discounted rate during the heating season. In conjunction, a home energy audit is offered, and efficiency information is provided to assist members with energy conservation.
• Net Metering Program: PSREC offers net-metering for members who install renewable energy generation systems.
• Community Shared Solar: PSREC will be breaking ground in 2017 on a 250KW community shared solar installation to offer solar energy to our members who currently cannot install solar on their homes or businesses due to cost, location or ownership status.
• Meter Lending Program: Members can borrow the PSREC WattsUp® meter to plug in 120-volt appliances, helping them identify energy use of specific appliances. This program has helped members understand just how much an appliance or space heater really uses and helps them make the choice of unplugging or reducing energy use.
• Lending Library and Resource Center: Provides energy efficiency and renewable energy resources to members through a book lending library and resource center in our office lobby.
• Research, Development, and Demonstration: PSREC is researching electric vehicle charging infrastructure.

Plumas-Sierra Energy Efficiency Program Results
Plumas-Sierra
CategoryUnits
Installed
Gross Coincident
Peak Savings (kW)
Gross Annual Energy Savings
(kWh)
Gross Lifecycle Energy Savings
(kWh)
Net Coincident Peak Savings
(kW)
Net Annual Energy Savings
(kWh)
Net Lifecycle Energy Savings
(kWh)
Net Lifecycle GHG
Reductions (Tons)
Utility Incentives Cost
($)
Utility Mktg, EM&V, and
Admin Cost ($)
Total Utility Cost ($)
Utility ($/kWh)
Res Clothes Washers 13 3,692 40,612 1,145 12,590 6 $455 $465 $920 $0.10Res Cooling 9 149 2,235 119 1,788 1 $1,850 $143 $1,993 $1.61Res Dishwashers 8 464 4,640 278 2,784 1 $280 $103 $383 $0.18Res Electronics 2 222 888 178 710 $40 $61 $101 $0.16Res Heating 16 6 6,240 156,000 5 4,992 124,800 63 $9,600 $4,317 $13,917 $0.20Res Lighting 534 3 6,688 95,840 1 3,612 51,754 26 $873 $3,360 $4,233 $0.12Res Pool PumpRes Refrigeration 28 4,344 49,346 3,041 34,542 19 $3,200 $1,711 $4,911 $0.20Res Shell 4,265 6 3,745 74,906 5 2,538 50,758 29 $4,770 $2,678 $7,448 $0.24Res Water Heating 5 1 825 8,250 1 495 4,950 3 $750 $231 $981 $0.26Res ComprehensiveRes BehaviorNon-Res CookingNon-Res CoolingNon-Res HeatingNon-Res LightingNon-Res MotorsNon-Res Pumps 2 6 105,704 1,585,560 5 66,475 997,131 540 $4,200 $50,776 $54,976 $0.08Non-Res RefrigerationNon-Res ShellNon-Res ProcessNon-Res ComprehensiveNon-Res BehaviorOther
4,882 22 132,074 2,018,276 17 82,873 1,281,807 688 $26,018 $63,845 $89,863 $0.10
T&DCodes and Standards
Total 4,882 22 132,074 2,018,276 17 82,873 1,281,807 688 $26,018 $63,845 $89,863
TRC Test 0.59 PAC Test 1.35 Excluding T&D
Resource Savings Summary Cost Summary

PORT OF OAKLAND Port of Oakland At a Glance
• Year established: 1985 • Climate Zone(s): 3 • Number of retail customer connections: 130-150 • Percent of retail sales by customer class – residential, commercial, industrial, agriculture:
100% Commercial / Industrial • All Energy Efficiency Programs are funded by AB 1890 funds. AB 1890 revenue for this
year (FY15-16) was $256,564. • FY15-16 total actual amount expended for energy efficiency programs (including EM&V,
admin/overhead, incentives) was $47,127. Port of Oakland Overview The Port of Oakland oversees the Oakland seaport, Oakland International Airport, and 20 miles of waterfront. Together with its business partners, the Port supports more than 73,000 jobs in the region and nearly 827,000 jobs nationwide. The Port exemplifies a unique combination of public/private endeavors. It encompasses a world-class container port, a thriving airport, an array of retail and commercial buildings and acres of recreational and open space. The Port has approximately 130-150 commercial electric customers. Major Program Changes In FY15-16, the Port of Oakland hired a consultant to manage the Port’s EE programs including marketing and administering rebates and certifying the improvements. The effort has led to lower overhead cost and greater marketing of the Port’s program. Program Highlight In FY15-16, the Non-Residential Lighting Program delivered 60% of the net annual energy savings. Our revised procedures for the lighting program made it easy for the Port’s tenants to participate, and resulted in total net annual savings of 492,953 kWhs. Program Descriptions
• Energy Audits: The Port provides Energy Audits that focus on five major energy saving retrofit/improvement projects that will result in load reduction and more efficient use of energy. The proposed energy efficiency projects are prioritized by highest to lowest energy savings. Rebates are provided upon project completion, up to 100 percent of the total energy audit cost.
• Energy Saving Measures Exceeding Title 24 Standards: Port will provide a rebate for any new facility constructed within the Port by its electricity customers that exceed the title

24 standards in energy saving measures. Eligible facility must reduce energy usage by a minimum of 10% compared to the standard title 24 facility.
• Energy Saving Equipment Retrofits/Improvements Rebates: The Port has implemented a program that provides generous rebates and solid technical support for the installation of new energy efficiency equipment/improvements by our commercial customers.
• Lighting Retrofit: A program providing rebates for the installation of energy efficiency lighting upgrades. This rebate is based on a single flat incentive rate of $.05 per first year annual kWh saved.
Sources of Energy Savings Reported savings for the Commercial Lighting Program are based on a lighting calculator spreadsheet that was developed for use by our customers and contractors.

Port of Oakland Energy Efficiency Program Results, FY 2015-16
Oakland
CategoryUnits
Installed
Gross Coincident
Peak Savings (kW)
Gross Annual Energy Savings
(kWh)
Gross Lifecycle Energy Savings
(kWh)
Net Coincident Peak Savings
(kW)
Net Annual Energy Savings
(kWh)
Net Lifecycle Energy Savings
(kWh)
Net Lifecycle GHG
Reductions (Tons)
Utility Incentives Cost
($)
Utility Mktg, EM&V, and
Admin Cost ($)
Total Utility Cost ($)
Utility ($/kWh)
Res Clothes WashersRes CoolingRes DishwashersRes ElectronicsRes HeatingRes LightingRes Pool PumpRes RefrigerationRes ShellRes Water HeatingRes ComprehensiveRes BehaviorNon-Res CookingNon-Res Cooling 1 229,204 3,438,060 194,823 2,922,351 1,793 $18,336 $5,934 $24,270 $0.01Non-Res HeatingNon-Res Lighting 1 21 372,662 4,471,944 16 298,130 3,577,555 1,983 $18,633 $4,224 $22,857 $0.01Non-Res MotorsNon-Res PumpsNon-Res RefrigerationNon-Res ShellNon-Res ProcessNon-Res ComprehensiveNon-Res BehaviorOther
2 21 601,866 7,910,004 16 492,953 6,499,906 3,776 $36,969 $10,158 $47,127 $0.01
T&DCodes and Standards
Total 2 21 601,866 7,910,004 16 492,953 6,499,906 3,776 $36,969 $10,158 $47,127
TRC Test 4.67 PAC Test 20.20 Excluding T&D
Resource Savings Summary Cost Summary
RANCHO CUCAMONGA MUNICIPAL UTILITY Rancho Cucamonga Municipal Utility At a Glance
• Climate Zone(s): 10 • Number of retail customer connections: 896 • FY15-16 total retail sales by customer class: Commercial $9,810,000, Industrial $637,200,
Residential $292,112 • FY15-16 total budget for energy efficiency programs: $140,000 • FY15-16 total amount actually expended for energy efficiency programs: $47,162
Rancho Cucamonga Municipal Utility Overview The amount of energy efficiency rebates in fiscal year 2016 have remained comparable to previous years with the main trend being lighting retrofits replacing inefficient lamps with LEDs. RCMU promotes the rebate programs and educates customers on energy efficiency practices in a customer newsletter, bill inserts and online. Free energy audits are currently being utilized to educate customers on energy savings and potential upgrades on existing equipment. RCMU continues to expand the existing distribution lines for projected future development and growth. Program Highlight The Energy Efficiency Rebate program continues to have the greatest impact and participation among RCMU customers. Lighting rebates continue to be the main focus with LED installations; however, RCMU has seen an increase in refrigeration and HVAC rebates and inquiries over the past year. Participation in the direct installation program has continued to be steady and popular with small businesses. The program has been a success because everything is taken care of for the customer and they can receive the benefits of the energy savings almost immediately with little to no cost to them. Program Descriptions
• Direct Savings Program – Non-Res Lighting: To encourage and assist small and medium sized businesses to reduce their energy usage, RCMU will pay and install up to $1,500 of recommended retrofit items that are determined from the complimentary energy audit. Any cost above the $1,500 limit is paid by the customer.
• Energy Efficiency Rebate Program – Non-Res Lighting, Non-Res Refrigeration, Non-Res AC: RCMU has adopted an “Express Solution” model for energy efficiency rebates. Customers receive a rebate for estimated kilowatt hour savings for the first year in the following categories: Lighting, Interior LED, Exterior LED, Delamping, HVAC, Motors and Refrigeration.

Complimentary Programs • Energy Audits: RCMU offers free, customized energy audits including lighting, HVAC and
equipment assessment and a review of energy usage. Specific cost-effective recommendations to improve energy efficiency and reduce energy use are provided.
• Renewable Energy Programs: In FY 2016, RCMU added three new solar customers into the service area that are estimated to save a total of 1,219,873 kWh per year. The program is currently open to small solar installations (<30kW).
• Low Income Program: The program is intended to assist customers with their bill and will be funded by the RCMU Public Benefit Fund. The household size and gross income requirements will be based off of the San Bernardino County Income Limits and Documentation system. Qualified residents will need to provide an application with supporting documentation annually to receive a credit on their bill each month.
• Medical Support Assistance Program: The program will assist eligible residential customers where a full time resident of the household regularly requires the use of essential medical support equipment. An application with supporting documentation from the patient’s doctor is required to receive the credit each month.
• New Development Incentive: This incentive is for new development that is built to exceed a minimum of 15% above Title 24 Code. The incentive payment is based off of the final Title 24 report created by a Certified Energy Plans Examiner (CEPE) and verified by a third party certified Home Energy Rating System (HERS) Rater.

Rancho Cucamonga Energy Efficiency Program Results, FY 2015-16
Rancho Cucamonga
CategoryUnits
Installed
Gross Coincident
Peak Savings (kW)
Gross Annual Energy Savings
(kWh)
Gross Lifecycle Energy Savings
(kWh)
Net Coincident Peak Savings
(kW)
Net Annual Energy Savings
(kWh)
Net Lifecycle Energy Savings
(kWh)
Net Lifecycle GHG
Reductions (Tons)
Utility Incentives Cost
($)
Utility Mktg, EM&V, and
Admin Cost ($)
Total Utility Cost ($)
Utility ($/kWh)
Res Clothes WashersRes CoolingRes DishwashersRes ElectronicsRes HeatingRes LightingRes Pool PumpRes RefrigerationRes ShellRes Water HeatingRes ComprehensiveRes BehaviorNon-Res CookingNon-Res Cooling 5 15 3,200 48,000 15 3,200 48,000 30 $1,441 $706 $2,146 $3.02Non-Res HeatingNon-Res Lighting 764 26 105,142 1,682,272 26 105,142 1,682,272 996 $19,666 $20,821 $40,488 $1.73Non-Res MotorsNon-Res PumpsNon-Res Refrigeration 56 7 63,112 1,009,792 7 63,112 1,009,792 563 $5,685 $10,473 $16,157 $1.15Non-Res ShellNon-Res ProcessNon-Res ComprehensiveNon-Res BehaviorOther
825 48 171,454 2,740,064 48 171,454 2,740,064 1,589 $26,791 $32,000 $58,791 $1.54
T&DCodes and Standards
Total 825 48 171,454 2,740,064 48 171,454 2,740,064 1,589 $26,791 $32,000 $58,791
TRC Test 0.16 PAC Test 0.09 Excluding T&D
Resource Savings Summary Cost Summary

REDDING ELECTRIC UTILITY (REU) Redding at a Glance
• Climate Zone -11 • Number of retail customer connections – 44,039 • Percent of retail sales by customer class – Residential 48%, Commercial 50%, Industrial
2% • Energy Efficiency (EE) Budget - $3.4 million. The EE programs are funded from REU
revenues as follows: $3.0 million Public Benefits charges, $ 0.4 million from general revenues. Expended $3.2 million, with remaining unspent funds carried over to the next budget year.
• Load Overview – Total sales for FY 2016 were 749 million kWhs, a 0.05 percent decrease compared to FY 2015. The forecasted average annual decrease for the next five years is 0.60 percent.
Utility Overview For the last few years, the Redding service area has experienced, as many other electric utilities have, a reduction in kWh sales compared to the level of electricity sales before the recent multi-year recession. Total sales for FY 2016 were 749 million kWhs - a 0.05 percent decrease compared to FY 2015. The slightly lower year-over-year sales figures for 2016 can be attributed to relatively mild weather, low economic activity and the impacts of EE programs. The forecasted average annual decrease for the next five years is 0.60 percent. This is mainly a result of a no-growth outlook based on population expectations, effective EE programs, and local economic conditions. Since the inception of REU’s Public Benefits Program and throughout the recent and continued challenging economic times, REU’s Public Benefits Program has been successful and well received in the Redding community. To date, around 70 percent (or more than two-thirds) of REU’s Public Benefits Program expenditures have been directed towards energy efficiency improvements. Because Redding is a relatively small and somewhat isolated service territory, REU has been able to build strong relationships with local businesses, including trade allies and the development community, to increase the awareness of cost-effective energy efficiency opportunities in new construction and remodeling projects throughout the community. These ties have proven to be most valuable when there is a viable need to increase or decrease a certain program and also in evaluating the addition of new programs. All EE programs need adjusting from time to time as building standards and technologies change. REU has an effective community outreach effort through the Energy Services Division’s (ESD) direct engagement with local energy product vendors, which makes it possible to have a continuously evolving and adaptable EE program. Major Program Changes To continue working toward improving REU’s operating efficiency and to further provide cost-effective efficiency improvements in our system, the Utility’s Thermal Energy Storage (TES)

program was expanded in FY 2014 to include new construction in addition to existing buildings within REU’s service territory. For FY2016 the amount of projects has maintained a constant pace. REU’s TES program focuses mainly on the 5 ton, direct expansion air-conditioning (DX-AC) market. This application of TES technology is provided with the addition of the Ice Bear® TES unit to qualified AC systems. In June of 2012, Redding entered into a multi-year, multi-million dollar contract to provide several megawatts of peak load shifting capability by 2017. Prior to 2012, Redding had been installing the Ice Bear® technology for several years to validate the application of this technology to REU’s customer base and unique (high peak demand, very low load factor) service territory requirements. With that considerable in-depth TES experience, it was apparent in 2012 an expansion of the program was warranted. In 2012 Redding was forecasting continual load growth and was faced with the expiration of a large power purchase agreement in 2015. Resource planning analysis was performed to find the best overall method to satisfy the forecasted increase in load growth and to fulfill the power supply shortfall. TES was identified as a cost-effective use of Public Benefits funds to partially fill that supply gap by shifting on-peak demand to off-peak periods and utilizing existing resources to fulfill the load requirements while at the same time helping to improve Redding’s deteriorating system load factor. Going forward, June 30th, 2017 marks the end of the 5 year TES contract and with the most recent load forecast indicating little to no growth, REU will be reviewing what role TES will play in future when considering all the expectations for statewide EE and Demand Side Management (DSM) goals under Senate Bill 350 (SB350). SB350 requires California’s load serving entities with annual sales exceeding 700GWh to conduct a comprehensive Integrated Resource Plan (IRP). The IRPs are to be designed to find the best approach in serving load in the most efficient, reliable and environmentally manner possible by utilizing a balanced combination of both supply-side resources and EE. It is expected that all current and future EE/DSM programs will be analyzed under REU’s IRP process. Even without the new IRP requirement, REU has always exercised sound business practices to routinely review the cost effectiveness of all resources used to provide all aspects of electric service to our customers. Program Highlight As mentioned above, REU’s operating efficiency is directly impacted by our summer air-conditioning driven peak system demand. The Utility’s Thermal Energy Storage (TES) program was significantly expanded in FY 2013 and continued to expand through FY2016. REU’s TES program focuses on the 5 ton, direct expansion air-conditioning (DX-AC) market. Redding’s commercial customer base has a significant amount of these types of units operating in a variety of businesses throughout the service territory.

The Ice Bears® serve to reduce the applicable AC systems’ peak demand on REU’s electric system by diverting the vapor/gas refrigerant in the DX unit away from the compressor and into a coil that runs through the systems’ ice block during the peak period. By relying on the temperature differential in the ice to condense the refrigerant back to the liquid state, rather than the mechanically driven compressor, the compressor does not run during the peak period of the day, and the AC load for the system is reduced by 95 percent for as much as six hours per day. Further, because the TES compressor is used during off-peak hours to re-freeze the storage systems’ water and make the ice that will later be used to provide cooling, the Utility “shifts” the load from on-peak to off-peak hours, thereby allowing the Utility to purchase or generate electricity during the cooler nighttime hours when it is more economically and environmentally efficient to do so. Shifting load to the nighttime hours also allows the Utility to consider more wind power (RPS qualified), which is more plentiful at night. With this nighttime operation, the compressor will typically run more efficiently than the same compressor running during the hottest hours of the day. Therefore, the customer will see a reduced amount of energy consumption (efficiency improvement) to provide a higher level of cooling comfort, and the Utility will see reduced operating costs as our load profile is flattened (operating efficiency/load factor improvement), a true win-win, cost-effective solution for all parties. This continued focus on peak load reduction will be increasingly important for REU because more than half of our demand is driven by air-conditioner load. With the required use of the newer refrigerant R-410A in DX/AC units, the new AC units being installed in California will be at least 5 to10 percent less efficient than older units that use R-22 when the temperatures exceed 105 to 115°F. Therefore, even though appliance standards require high SEER unit installation, these new units using R-410A will perform less efficiently at peak load times than older units with lower SEER ratings because the new refrigerant’s performance degrades substantially when ambient outdoor temperatures reach 105°F or more – a regular summertime occurrence in Redding. In FY 2016 REU installed 34 Ice Bear® TES systems. This brings the total systems in service to 251, providing nearly three megawatts of permanent load shift (PLS) capability. These systems are dispatchable, low maintenance (energy storage material is water), and long-lived, with at least a 20-year service life. Program Descriptions
• Appliances: Rebates for dishwashers, clothes washers, and dryers. Only makes and models on the current ENERGY STAR eligibility list qualify for a rebate.
• HVAC: Rebates for Heating, Ventilation, Air Conditioning, Duct Repair, Swamp Coolers, and Whole House Fans.
• Pool Pump: Pool Pump Program is only for programmable variable speed drive pumps installed on existing or new in-ground pools.

• Refrigeration: Rebates for Large and Small Refrigerators. Only makes and models on the current ENERGY STAR eligibility list qualify for a rebate.
• HVAC, Residential Shell: Weatherization Program – Consists of Insulation, Window Treatments, and Radiant Barrier.
• HVAC, Non-Residential Cooling: Rebates for Heating, Ventilation, Air Conditioning, Duct Repair, and Swamp Coolers. Commercial projects rebate levels are evaluated on a case by case basis.
• Lighting, Non-Residential: Lighting retrofit program has a pre-approval requirement that evaluates existing light vs. proposed new lighting to see if the project is eligible and is used as part of the process to determine the level of the rebate.
EM&V During the reporting period, REU had a third party review it’s Rebate Program during the first half of the 2016 calendar year. Adjustments were made to our Lighting program as a result of that review. REU is continuing to look at all of its programs for optimization and plans to update as appropriate rebate levels/program scopes in July 2017. Redding EM&V reports are available on NCPA’s Website: http://www.ncpa.com/current-issues/energy-efficiency-reports.html. Sources of Energy Savings REU, for the vast amount of its EE programs, uses the standard measures as constructed within the E3 reporting tool. For REU’s three unique programs (TES and Home Performance, and High Performance –New Construction) REU used the custom measure feature in E3 to model the energy and demand impacts of those programs. Complimentary Public Benefits Programs
• Renewable Energy Programs: REU’s Solar Program has been a great success. REU has seen significant interest in solar PV despite the lack of available rebates from the Utility through this reporting period. Though REU did not provide solar rebates over this reporting period, REU had 111 PV installations with an installed capacity of 862kW. Most of our PBI solar rebate commitments have been fulfilled freeing up additional solar rebate monies. REU will launch another round of rebates in September 2016. REU suspended photovoltaic installations on some (3) circuits/feeders. Distributed generation penetrations (including solar PV) greater than 25% have the potential to have a significant impact REU’s (and all utilities) ability to comply with Federal and State reliability requirements regarding both over voltage and under voltage issues as well as over frequency and under frequency cut out. Unfortunately, there will still be a limitation in certain areas. REU is working closely with local solar PV integrators/contractors on this issue as it continues to develop.
ESD staff, on a monthly basis, monitors the amount of funds collected and how they are disbursed (since program inception). This process enables REU staff to ensure compliance with SB 1 requirements and to make plans for an optimal program completion in 2017-2018.

Almost all of REU’s renewable resource development efforts are in the solar photovoltaic (PV) development area. PV development is currently a separate program in and of itself, as mandated by State Senate Bill 1’s passage and implementation. As a result, SB 1 funding has allowed REU to redirect dollars previously devoted to renewable development to low-income assistance.
• Low-Income Programs: Low-income assistance spending (through the CARES program and Lifeline Rate Discounts) continues to be the second largest area of our Public Benefits Program expenditures. During FY 2016, Lifeline support continued at the same amount, about $1.2 million. Low-income programs have been most beneficial to a significant portion of our customer base that has limited situational and/or financial means to participate in direct EE programs.
• Electric Vehicle(EV) Charging Infrastructure: In 2015 and 2016, to support electric vehicles in REU’s service territory, REU has held both internal and external committee meetings to work on determining suitable charging locations and procuring infrastructure to support this new and growing electric service. The external committee, Upstate Plug-in Electric Vehicle Coordinating Council (Council) is charged with bringing vehicle charging stations infrastructure to the Siskiyou, Shasta, and Tehama counties area. The Council’s main near-term goal is to facilitate installation of some of the first charging stations near main roadways running through the tri-county region. REU has had an increasing interest in services from customers who are buying electric vehicles. This new utility load may have impacts in several areas related to EE and DSM, both at the customer and utility supply and distribution levels. For example, whether electric vehicles are charged during the day or night may impact the cost and benefits of EE programs already in place. Redding will continue to work on this and other areas as to how electric vehicles will impact various utility operations. During the calendar year 2017, it is anticipated that at least one fast DC charger will be installed in Redding’s service area as a result of the efforts mentioned above. Additionally, REU staff is completing a comprehensive review of City of Redding’s fleet vehicle requirements with the expectation to have an EV plan proposal created the middle of 2017.
• High Performance –New Home Construction: A new housing subdivision was started in 2015, REU worked with the developer/contractor to incorporate innovative energy efficiency measures into the home designs similar to the measures used in our Home Performance Program. 13 homes were completed during this reporting period. These measures resulted in an Energy Code compliance margin or 45% to 50% above-code compliance. Some of the special features included HVAC equipment installed in conditioned space, deep buried ducts with R-50 insulation when not installed in conditioned space, Heat Recovery Ventilation (HRV) installed to provide both local and whole building ventilation, reduced air infiltration to an average of 1.6 ACH50. These measures help to reduce the needed HVAC system size to 1 ton of heating and cooling capacity for every 1500sqft of floor area. In addition to the HVAC system and envelope

measures, we also installed Heat Pump Water Heaters with a properly sized radial supply design. This shortened the time it takes for hot water to reach the fixture and reduces water wasted down the drain waiting for hot water to arrive. With a small 4kW to 4.5kW photovoltaic PV system, these home can be Zero Net Energy (ZNE) Homes. All homes were tested, air balanced and commissioned by REU and Consultant to verify all measure were installed according to project design and manufacture specifications.

Redding Energy Efficiency Program Results, FY 2015-16
Redding
CategoryUnits
Installed
Gross Coincident
Peak Savings (kW)
Gross Annual Energy Savings
(kWh)
Gross Lifecycle Energy Savings
(kWh)
Net Coincident Peak Savings
(kW)
Net Annual Energy Savings
(kWh)
Net Lifecycle Energy Savings
(kWh)
Net Lifecycle GHG
Reductions (Tons)
Utility Incentives Cost
($)
Utility Mktg, EM&V, and
Admin Cost ($)
Total Utility Cost ($)
Utility ($/kWh)
Res Clothes Washers 366 48,012 528,132 14,884 163,721 82 $39,499 $1,419 $40,917 $0.33Res Cooling 2,522 191 311,281 4,421,499 167 259,281 3,742,327 2,287 $633,642 $81,130 $714,772 $0.28Res Dishwashers 466 16,596 165,960 9,958 99,576 50 $54,000 $866 $54,866 $0.71Res ElectronicsRes HeatingRes LightingRes Pool Pump 230 8 155,020 1,550,200 5 93,012 930,120 468 $115,200 $8,089 $123,289 $0.17Res Refrigeration 248 40,871 572,189 28,609 400,532 217 $33,608 $4,611 $38,219 $0.14Res Shell 683,002 494 463,564 9,109,493 230 196,341 3,881,523 2,190 $274,128 $47,558 $321,686 $0.13Res Water Heating 30 3 23,651 236,510 2 14,191 141,906 76 $14,050 $1,557 $15,607 $0.14Res Comprehensive 19 43 65,804 1,316,080 43 65,804 1,316,080 743 $157,500 $39,176 $196,676 $0.24Res BehaviorNon-Res CookingNon-Res Cooling 239 532 79,861 953,951 529 67,881 810,858 1,167 $1,430,809 $74,186 $1,504,995 $0.47Non-Res HeatingNon-Res Lighting 38 239 773,977 11,609,655 191 619,182 9,287,724 5,147 $70,426 $82,662 $153,088 $0.02Non-Res MotorsNon-Res PumpsNon-Res RefrigerationNon-Res ShellNon-Res ProcessNon-Res ComprehensiveNon-Res BehaviorOther
687,160 1,511 1,978,635 30,463,668 1,167 1,369,142 20,774,368 12,428 $2,822,861 $341,254 $3,164,115 $0.19
T&DCodes and Standards
Total 687,160 1,511 1,978,635 30,463,668 1,167 1,369,142 20,774,368 12,428 $2,822,861 $341,254 $3,164,115
TRC Test 1.30 PAC Test 1.18 Excluding T&D
Resource Savings Summary Cost Summary

RIVERSIDE PUBLIC UTILITIES Riverside Public Utilities (RPU) At a Glance
• Riverside Public Utilities (RPU) was established in 1895 • Riverside is the 12th largest City in California • RPU’s service territory of approximately 82 square miles • RPU’s service territory is located entirely within Climate Zone 10 • Percent of retail sales by customer class is approximately 90% residential and 10%
commercial, industrial and agricultural. • Approximately 109,000 electric and 65,000 water retail customers serving a total
population of approximately 325,000 residents • Approximately $12,000,000 in total Public Benefit Funds in FY 15/16 was budgeted for
all programs, administration and marketing. Approximately $4 million was expended on energy efficiency programs. In addition, approximately $3 million was expended in FY 15/16 on Low Income Assistance, Research Demonstration and Development, Renewable Energy, and other Public Benefits Activities (See below under Complimentary Public Benefits Activities)
• Load growth for FY 15/16 was approximately 1% • RPU Annual energy use is approximately 2,200 gigawatt-hours • System peak demand of 604 megawatts occurred on September 15, 2014 • RPU employs approximately 500 full time employees
Riverside Public Utilities Overview The regional economy has generally improved overall with the local unemployment rate within the City of Riverside falling to an annual average of approximately 6% for FY 15/16. Although showing a positive employment trend, these unemployment figures still remain somewhat higher than both the statewide and the national averages. RPU achieved 71% of the annual kWh savings goal of 1% of retail sales for FY 15/16. RPU assisted its customers in saving a total of 14.6 million kWh for FY 15/16. Although RPU did not reach its annual kWh savings goal in FY 15/16, the utility is cumulatively at 111% of the annual 1% goal since FY 10/11. The primary reason why RPU did not achieve the 1% kWh savings target in FY 15/16 was largely due to the ongoing statewide drought. RPU is a water provider as well as an electric provider. Therefore, it has been necessary to divert staff resources from energy efficiency to water efficiency programs in response to the aggressive water conservation goals established under the Governor’s mandatory drought regulations. This shift in resources had a substantial impact on reaching energy efficiency goals in FY 15/16. On a positive note, increased water savings has translated into some additional kWh savings as a result of the embedded energy in water production and delivery that has been avoided as a result of reduced customer consumption and aggressive water conservation efforts. The current rainfall

trend this winter is very encouraging and will hopefully result in the Governor lifting or relaxing the current water conservation regulations when the matter is reviewed in spring, 2017. RPU is a very important part of the local economy with a significant, positive economic and social impact. In an effort to measure this impact RPU commissioned an independent study in 2016 conducted by the UC Riverside Economic Forecasting Center. This comprehensive study estimated that the total economic impact that RPU generates in the local economy is nearly $500 million annually. This analysis also included the $7-10 million in annual expenditures of public benefit charge funding that also contributes to RPU’s economic impact in the local economy. Riverside Public Utilities is currently operating under an electric rate freeze originally adopted in 2010 by the City Council. This rate freeze has provided customers with stable and predictable rates; however the rate freeze is beginning to erode utility revenue in certain rate classifications. Public Benefit Fund revenue has also been impacted by this rate freeze. In FY 16/17 RPU will complete a comprehensive cost of service study of all electric rate classifications to determine if future rate adjustments should be recommended to the Board and City Council. RPU has experienced a modest expansion in the customer base and a 1% increase in load growth. Utility load growth has also lead to a 1% increase in retail sales. Major Program Changes RPU continues to enhance and expand its already extensive array of energy efficiency program offerings to its customers. The overall portfolio is examined quarterly for program requirements and incentive levels are adjusted up or down as necessary at the direction of the Utility General Manager. Although the local economy is much more stable and generally in a slow expansion mode, RPU is experiencing stagnant participation in energy efficiency rebate programs. Overall program participation has remained flat over recent program years at approximately 23,000 rebates per year. This flattening demand for energy efficiency programs is likely due to a combination of market saturation, overall cautious consumer confidence and customer perception that solar energy is more attractive than energy efficiency. Major changes or trends that impacted kWh savings in FY 15/16 include:
• RPU continues to see the rapid growth of customer participation in Property Assessed
Clean Energy (PACE) programs to fund energy efficiency and renewable energy projects. PACE programs can offer an important alternative financing vehicle for customers. In response to this popularity the Riverside City Council authorized an additional 10 PACE program providers in 2016 to enhance competition in the PACE financing market. One of the challenges is that PACE funded projects don’t necessarily increase participation in utility programs. Furthermore, PACE financing has not proven to be an appropriate or attractive energy efficiency financing vehicle for commercial customers. Other creative financing tools should be explored to specifically target the needs of commercial customers.
• Proposition 39 is resulting in some additional energy efficiency projects from local school districts and community colleges. Unfortunately these projects have been slow to complete

and have resulted in more modest kWh savings than had originally been projected. RPU continues to work with local schools using rebate programs to leverage Prop 39 funding.
• There is a growing trend in the energy efficiency field regarding the use of behavioral programs in order to enhance customer engagement and drive energy efficiency through impacting customer behavior. In 2016 the Riverside City Council approved a new customer engagement program and associated budget for a pilot program. RPU will be launching this new program to approximately 15,000 residential customers in FY 16/17.
• RPU successfully launched a 5MW thermal energy storage program using Ice Energy’s Ice Bear thermal energy storage technology. Approximately 40 Ice Bear units have been installed to date resulting in over 1 MW of peak load reduction and demand response in the first phase of the project.
• RPU’s Key Account Energy Efficiency Program (KEEP) is beginning to demonstrate substantial results. This program created several years ago was designed to go beyond the typical commercial customer facility audit and provide a comprehensive facility energy efficiency plan along with the technical expertise to assist the customer in implementing complex energy efficiency projects to drive substantial kWh savings. In FY 15/16 the KEEP Program assisted large commercial customers in saving over 2.3 million kWh.
• RPU’s LED retail buy-down program continues to grow in customer participation. Through local participating retailers, Public Benefit Funds are combined with GreenLite’s distribution platform allowing RPU to offer several LED lighting products at substantially discounted pricing for its customers. In FY 15/16 RPU customers purchased close to 35,000 energy efficient LED light bulbs through this program.
• RPU continues to experience increased activity and program participation in its multi-family and mobile home direct installation program. This program has allowed RPU to reach a market segment that was previously underserved. In addition, this program also focuses on the often overlooked energy efficiency opportunities such as lighting in the common areas associated with apartment complexes and mobile home parks.
Program Highlight RPU’s Small Business Direct Installation (SBDI) Program and Keep Your Cool (KYC) Direct Installation Programs continue to be a highlight of the overall program portfolio in terms of both customer acceptance and kWh savings. Although commercial customers only represent 10% of the total RPU customer base, the combined load of all commercial customers represents approximately 66% of the total utility consumption. With commercial customers representing the majority of the utility electric load, RPU has dedicated more programs and resources to assist the commercial customer segment in achieving energy efficiency goals. RPU’s small business customers have often been reluctant to participate in traditional rebate programs due to the lack of upfront capital and the lack of experience or technical ability to implement energy efficiency projects. In addition, small businesses often do not own their buildings, introducing barriers and motivational factors into the decision making process on whether to implement energy efficiency projects.

RPU’s Small Business Direct Installation Program was designed to address these primary customer concerns. The SBDI program is a comprehensive direct installation program combining measures such as high efficiency lighting retrofits and controls, HVAC tune-ups, LED exit and “open” signs, Tier 2 advanced power strips and various weatherization measures. The program is now available throughout the service territory and has been expanded to medium sized customers. SBDI offers businesses up to $2000 in free energy efficiency upgrades annually. Each project starts with an energy audit of the business facility to prioritize recommended energy efficiency measures that customers can pay for through a co-payment to the utility’s contractor for work above RPU’s incentive amount. RPU direct installation contractors continue to find that the market potential is substantial and that there is no shortage of businesses that can realize significant savings from energy efficiency upgrades provided through this program. Customer feedback regarding this program has been very positive with approximately 1500 commercial customers served in FY 15/16. The Keep Your Cool (KYC) Program is similar to the SBDI program, but specifically focuses on direct installation of cooling and refrigeration measures in mini-markets, delis, convenience stores and restaurants. Combined, the KYC and SBDI Direct Installation Programs have resulted in over 3.2 million kWh saved in this reporting year. Although on the higher end of measure costs within RPU’s program portfolio, the direct installation programs are still relatively cost effective at an average of $.50 cents per kWh saved. In addition, RPU receives additional benefits beyond energy efficiency from increased customer engagement and program participation as well as enhanced customer satisfaction through the direct installation programs. Program Descriptions
Commercial Rebate Programs • Air Conditioning Incentives – rebates for replacement of energy efficient AC units (Non-
Res Cooling). • Energy Star Appliances – rebates for purchase of Energy Star rated refrigerators,
dishwashers, commercial clothes washers, solid door refrigerator/freezers, ceiling fans and televisions (Non Res-Lighting, Non Res-Cooling, and Non-Res Refrigeration).
• Lighting Incentive – rebates for kWh savings on installation of more energy efficient lighting and controls (Non-Res Lighting).
• Tree Power – rebates for purchase and planting of up to 5 qualifying shade trees per year (Non-Res Cooling).
• Weatherization – rebates for installation of insulation, window film and cool roofs (Non-Res Shell).
• Performance Based Incentive – rebates for customers who can demonstrate a kWh savings based on custom energy-efficiency measures (Non-Res Comprehensive).
• Commercial Food Service Program – This program is specifically targeted to commercial food service customers such as restaurants, hospitality providers, institutional,

medical/hospital customers, schools and government customers. The program is offered in conjunction with Southern California Gas Company and provides customers with a comprehensive facility audit offering recommendations on specific energy efficiency measures, estimated return on investment and applicable utility incentives. In FY 15/16, 15 businesses participated in the program and many were referred to the KYC Direct Installation Program (Non-Res Comprehensive).
• Key Account Energy Efficiency Program (KEEP) – This program is targeted to RPU’s largest Time of Use (TOU) Customers. This customer segment includes the top 300 RPU customers in terms of consumption. KEEP is intended to provide these Key Account customers with a comprehensive energy efficiency plan including a priority list of recommended energy efficiency measures along with an estimated return on investment and applicable utility incentives. RPU is also coordinating with Southern California Gas Company on this program. Customers are also offered additional technical and contracting assistance to bring large energy efficiency projects from concept to completion. In FY 15/16 this program resulted in the completion of several large energy efficiency projects totaling over 2.3 million kWh saved (Non-Res Comprehensive).
• Custom Energy Technology Grants – Grants are awarded for research, development, and demonstration of energy efficiency and renewable energy projects that are unique to the business or manufacturing process and can demonstrate energy savings, demand reduction or renewable power generation (RD&D Program)
• Energy Innovation Grants – Grants are available to public or private universities within RPU’s service territory for the purpose of research, development and demonstration of energy efficiency, renewable energy, energy storage, strategic energy research and electric transportation (RD&D Program).
• Upstream HVAC Rebate Program – This program offers a rebate incentive for commercial high efficiency HVAC equipment purchases that exceed Title 24 requirements. The incentive is provided upstream at the wholesale distribution channel level, thereby encouraging distributors to stock and sell more efficient HVAC equipment (Non-Res Cooling).
• Energy Management Systems – rebates for the purchase and installation of energy management systems for monitoring and controlling facility energy load (None claimed this FY).
• New Construction and LEED construction Incentives – rebates for energy savings exceeding Title 24 standards for new construction projects pre-approved by Riverside Public Utilities. Higher Title 24 standards have reduced participation in this program as energy efficiency measures in excess of Title 24 are often not cost effective (None claimed this FY).
• Pool and Spa Pumps Incentive – rebates for purchase of qualifying multi-flow or variable speed high-efficiency pumps and motors (None claimed this FY).
• Premium Motor Incentives – rebates for the purchase of premium high efficiency electric motors (None claimed this FY).
• Thermal Energy Storage Incentive – feasibility study and incentives available for use of thermal energy storage based on program guidelines (None claimed this FY).
• Ice Energy Thermal Energy Storage Pilot Program – This is a combined thermal energy storage program and energy efficiency program. Public Benefit Funds will be used to replace old HVAC equipment with new high efficiency HVAC equipment installed concurrently with Ice Bear thermal energy storage equipment that will result in peak load reduction and demand response (Non-Res Cooling).
Residential Rebate Programs • Energy Star Appliances – rebates for purchase of Energy Star rated refrigerators,
dishwashers, clothes washers, room air conditioners, ceiling fans, televisions and electric water heaters (Res Cooling, Res dishwashers, Res Clothes Washers, Res Electronics).
• Cool Cash – rebates for replacing Central Air Conditioners with a SEER rating of 15 or higher (Res Cooling)
• Tree Power – rebates for purchasing and planting of up to 5 qualifying shade trees per year and 1 free qualifying shade tree coupon printed on the March back of the bill (Res Cooling).
• Pool Saver – rebates for purchase and installation of high efficiency, variable speed or multi-flow pool pump motors (Res Pool Pump).
• Weatherization – rebates for installing attic insulation or wall insulation, standard rebates for duct replacement, duct testing/sealing, window film, shade screens, solar and standard attic fans, whole house fans and cool roofs (Res Shell, Res Cooling).
• Appliance Recycling – free recycling service for old inefficient refrigerators and freezers (Res Refrigeration).
• Whole House Rebate Program – rebates for completing multiple energy efficiency measures as one project. Points are awarded for each type of measure and then multipliers are given at specific point intervals on a sliding scale to encourage implementation of multiple energy efficiency measures as one project under one application (Res Comprehensive).
Residential Direct Installation Programs • Multi-Family and Mobile Home Direct Installation – This program offers multi-family and
mobile home residents the direct installation of a specific list of measures including HVAC tune-ups, lighting efficiency upgrades, weatherization and Tier 2 advanced power strips. The program also addresses energy efficiency measures in multi-family and mobile home park common areas (Res Lighting).
• Energy Savings Assistance Program (ESAP) – This direct installation is targeted specifically to low income RPU customers. The program is offered in partnership and cooperation with The Southern California Gas Company. Measures include lighting efficiency upgrades, HVAC tune-ups, smart power strips and refrigerator replacement and recycling (low income assistance, Res Lighting, Res Cooling, and Res Refrigeration).

Commercial Direct Installation Programs • Small Business Direct Installation (SBDI) Program – This program provides small and
medium sized businesses with energy audits and direct installation of energy efficiency measures such as lighting upgrades and controls, HVAC tune-ups, exit and open/closed signs advanced power strips and weatherization measures (Non-Res Comprehensive, Non-Res Lighting, Non-Res Cooling).
• Keep Your Cool (KYC) Program– This program is targeted to specific small businesses such as mini-marts, delis and convenience stores and restaurants that have a significant amount of refrigerated food and beverages storage. The program offers the direct installation of energy efficiency measures such as air curtains, cooler gaskets, automatic door closures, LED case lighting retrofits and high efficiency motor upgrades (Non-Res Cooling).
EM&V
Riverside Public Utilities is committed to providing cost effective, ongoing evaluation, measurement and verification efforts for its energy efficiency programs. EM&V costs are covered in the individual program budgets.
In addition to periodic program audits, RPU consistently performs the following in support of EM&V activities:
• An onsite inspection rate of no less than 10 percent for all residential program
participants, performed by RPU staff and contractors. • In FY 15/16 RPU hired auditors, Baker Tilly to perform a comprehensive program
audit of all public benefit funded programs. The audit resulted in positive report with no major program findings.
• A pre- and post-inspection of 100% of commercial rebate participants, including a review of historical energy usage, energy-saving calculations and post measure bill analysis.
• All residential and commercial solar PV installations are field inspected and verified by city personnel for program compliance, system inter-connection standards and rated system production output.
• RPU contracts with the engineering firm Partner Energy to verify claimed energy savings on large, complex or technical commercial projects prior to issuing rebate incentives.
• Audits and installations performed by third-party contractors for RPU direct installation programs have high inspection rates that are performed by both the contractor and RPU staff.
• Refrigerator recycling program administered by Appliance Recycling Centers of America (ARCA) assures full inspection when the contractor picks up old appliances.

Sources of Energy Savings RPU Generally relies on the Technical Reference Manual (TRM) as adopted by the Public Utilities in California as the primary source for deemed energy savings used in the calculating and reporting annual program performance. If a specific measure cannot be found in the TRM, RPU will generally use a verified utility work paper or appropriate engineering/manual calculation as back-up documentation to justify claimed kWh savings and the specific measure is entered into the E3 reporting tool as a custom measure. Complimentary Programs
• Solar Rebate Program (SB 1) – RPU continues to promote residential and commercial participation in its solar rebate program to reduce peak load and offset customer electricity bills. In support of Senate Bill 1 (SB1) RPU has allocated a budget of $2.5 million annually through December 31, 2017 for customer installed systems. During FY 15/16, RPU issued rebates for 260 residential installations totaling 1646 kW AC and 10 non-residential systems generating 1170 kW AC of renewable solar energy.
• SHARE – This low income assistance program credits $150 annually toward electric deposit or bill payment assistance for qualified low-income RPU customers. In FY 15/16, RPU served approximately 4700 low income customers through the SHARE program for a total of over $700,000 in Public Benefit Funds credited to low income families for bill payment assistance.
• Research, Demonstration and Development (RD&D) – RPU continues to invest in RD&D programs through partnerships with both businesses and local higher education institutions. RPU has expended over $1,000,000 in Public Benefit Funds over the last ten years through its Energy Innovation Grant Program (see description above) to support energy research at local institutions of higher learning. Additional RD&D funding is provided to local commercial customers under the Custom Energy Technology Grant Program (see description above). RPU also participates in Southern California Public Power Authority (SCPPA) directed RD&D efforts and will continue to explore future RD&D opportunities as they occur on a case by case basis.
• Demand Response – RPU continues to manage a highly successful voluntary demand response program. This program, known as Power Partners, was developed in partnership with RPU’s largest commercial customers. These important Key Account customers agree to voluntarily shed or shift electric load during critical on-peak hours. This program became even more important in FY 15/16 due to the temporary closure of the Aliso Canyon natural gas storage facility impacting natural gas supplies in Southern California. Public Utilities like RPU rely on natural gas for internal generation power plants to manage summer peak electric loads. In response to this critical situation, RPU expanded the Power Partners Program resulting in a combined customer total of 23 MW of electric load that could be voluntarily shifted or shed in emergency situations. The Power Partners Program is effective during the peak summer months from June-September

if it is deemed necessary to call on this resource by RPU in cooperation with the CAISO and Southern California Gas Company.
• Pool Pump Timer Credit Load Shift Program – This program offers a bill credit of $5 per month for customers who agree to install and program their residential pool pump timer so that the pump operates only during off-peak hours. RPU has implemented an ongoing inspection program to inspect 100% of these timers for program compliance.
• GreenLite LED Retail Buy-down Program – RPU uses Public Benefit Funding to contract with GreenLite to buy-down the retail cost of certain LED light bulbs at participating local retailers to incentivize customers to purchase and install these high efficiency lighting products in their homes and businesses.
• Load Profiler Program (LPP) – RPU offers this program to all large Time of Use (TOU) customers. The service provides interval data as well as rate and usage analysis tools so that customers can view how and when they are using the most energy allowing them to make operational and behavioral changes to reduce consumption and avoid excessive demand charges.

Riverside Energy Efficiency Program Results, FY 2015-16
Riverside
CategoryUnits
Installed
Gross Coincident
Peak Savings (kW)
Gross Annual Energy Savings
(kWh)
Gross Lifecycle Energy Savings
(kWh)
Net Coincident Peak Savings
(kW)
Net Annual Energy Savings
(kWh)
Net Lifecycle Energy Savings
(kWh)
Net Lifecycle GHG
Reductions (Tons)
Utility Incentives Cost
($)
Utility Mktg, EM&V, and
Admin Cost ($)
Total Utility Cost ($)
Utility ($/kWh)
Res Clothes Washers 686 109 42,532 510,384 93 36,152 433,826 258 $51,450 $51,450 $0.16Res Cooling 17,254 1,436 3,758,446 103,671,734 1,147 2,793,634 75,045,186 48,417 $706,658 $706,658 $0.02Res Dishwashers 484 51 14,859 163,447 43 12,630 138,930 82 $24,200 $24,200 $0.23Res ElectronicsRes HeatingRes Lighting 63,400 2,536 2,013,342 30,200,130 2,057 1,632,108 24,481,620 13,886 $334,368 $334,368 $0.02Res Pool Pump 158 5 50,718 507,180 5 43,110 431,103 257 $31,600 $31,600 $0.09Res Refrigeration 2,237 234 1,099,225 6,456,964 208 975,830 5,699,628 3,217 $220,248 $220,248 $0.05Res Shell 511 99 179,189 3,288,683 84 152,311 2,795,381 1,664 $62,097 $62,097 $0.03Res Water Heating 1 356 4,628 303 3,934 2 $50 $50 $0.02Res Comprehensive 33,584 4 530,920 5,762,834 3 479,749 5,152,341 3,067 $318,804 $318,804 $0.08Res BehaviorNon-Res CookingNon-Res Cooling 2,053 282 777,190 13,408,006 259 766,727 13,229,912 8,379 $349,019 $349,019 $0.04Non-Res HeatingNon-Res Lighting 70 14 4,648,455 46,484,552 13 4,183,610 41,836,097 24,778 $353,648 $353,648 $0.01Non-Res MotorsNon-Res PumpsNon-Res Refrigeration 9 3 208,575 1,256,288 3 198,085 1,192,627 665 $170,276 $170,276 $0.17Non-Res Shell 831 148 182,953 3,504,238 126 155,510 2,978,602 1,809 $58,537 $58,537 $0.03Non-Res ProcessNon-Res Comprehensive 5,249 1,030 3,336,756 33,044,850 978 3,169,037 31,382,326 19,061 $1,500,984 $1,500,984 $0.06Non-Res BehaviorOther
126,527 5,950 16,843,515 248,263,917 5,018 14,598,795 204,801,514 125,544 $4,181,940 $4,181,940 $0.03
T&DCodes and Standards
Total 126,527 5,950 16,843,515 248,263,917 5,018 14,598,795 204,801,514 125,544 $4,181,940 $4,181,940
TRC Test 3.61 PAC Test 6.43 Excluding T&D
Resource Savings Summary Cost Summary

ROSEVILLE ELECTRIC UTILITY Roseville Electric Utility at a Glance FY 15-16
• Climate Zone 11 • 58,002 retail electric accounts • Total customer sales were 1,189,977 MWh
o Residential 439,495 o Commercial 451,839 o Industrial 294,643
• Total energy saved from energy efficiency - 17,435 MWh • Total budget for energy efficiency programs - $4,552,385 • Total spent on energy efficiency rebates and educational programs - $5,230,081
Roseville Electric Utility Overview Roseville Electric Utility and the City of Roseville are prime economic drivers in the South Placer County region. Roseville ranks in the top 50 housing markets nationwide with over 800 new home permits issued in FY 2016. Commercial occupancy rates are strong across all sectors, most notably in Retail, Roseville Electric’s largest commercial sector. The strong economic climate supported residential and business investment in energy efficient exterior and interior LED lighting in FY 16 with 64% of the energy efficiency savings reported in FY16 coming from LED measures alone. This strong demand for LED lighting rebates resulted in Roseville Electric reporting 11,148 MWH from LED lighting retrofits in FY 16. Residential customers participating in the home energy reports behavioral program contributed an additional 17% of Roseville Electric’s energy efficiency savings for FY 16. Through the home energy reports program, Roseville Electric is able to educate customers with tips on conserving energy and about emerging technologies for the home. Roseville Electric will offer this program to all residential customers beginning in FY 18. Roseville Electric recognizes that customers perceived value in receiving incentives for energy efficiency upgrades. We will continue to design and deliver programs that offer a range of cost effective energy efficiency measures that are of interest to our customers and contribute towards achieving our energy efficiency targets while reaching out to educate customers on emerging technologies and behavior changes they can make at no cost. Major Program Changes Roseville Electric did not make any major changes to the energy efficiency programs in FY 16, however, changes made to the lighting programs in FY 15 in combination with a strong economy influenced customers to invest in LED lighting in FY 16. Several large commercial projects contributed significantly to the lighting savings reported in FY 16.

Roseville Electric expects LEDs to remain popular through FY 17 and FY 18 but anticipates a significant decline shortly thereafter as market saturation is reached. Program Highlight Roseville Electric began offering a few LED lighting measures to residential and commercial customers in FY 14. In FY 15, LED lighting represented 38% of the total kWh saved. In FY 16, LED lighting represents 64% of the reported savings. This represents lamps sold to residential customers upstream rebate programs at local retail locations (1,299,658 kWh) as well as indoor and outdoor LED retrofits of incandescent lighting in commercial buildings and parking lots (9,849,214 kWh). The Roseville Electric branded LED lamps sold through local retailers were well received by customers and successful primarily due to the low cost, high quality and variety of lamps sold through the retailer. Commercial customers were influenced to change out incandescent lighting to LEDs primarily because of the rebate offered by Roseville Electric. For many years, Roseville Electric residential customers requested rebates for whole house fans to assist with reducing summer cooling costs. In 2015, the measure was included in the POU technical resource manual allowing us to introduce rebates for our residential customers. Through education and promotion of whole house fans, participation in the rebate program doubled in 2016 and saved Roseville Electric 7,675 MWh. EM&V performed on the program in 2016 reported "Whole house fan survey respondents rated the incentive as the most important factor in their decision to install the product". Program Descriptions
• Residential Home Energy Reports: Industry-recognized, contractor-managed energy efficiency behavior program providing education, feedback and tips to residential customers.
• Residential HVAC: Incentives to install higher efficiency systems upon retrofit.
• Residential Shade Tree: Rebate program designed to incent and educate customers to
plant drought-tolerant shade trees to keep their home cool. There are two rebate levels and they are directly tied to the savings associated with each tree; trees are selected from the SMUD tree calculator.
• Residential Pool Pump: Rebate program designed to incent customers to upgrade from a
single speed to a variable speed pool pump.
• Residential Sunscreens: Rebate program designed to incent customers to install permanent sunscreens on their windows to keep their home cool.
• Residential New Construction: Program that incents two paths. Preferred homes must
achieve 20% better cooling efficiency than code while the BEST (Blueprint for Energy and
Solar Technology) Homes must achieve 15% total efficiency above code and include a Photovoltaic system. Roseville Electric will transition this program in FY 17 to a program modeled after the California Advanced Home Program.
• Residential LED Lighting: Upstream, vendor-managed program providing discounted LED
lamps through local retail outlets in Roseville.
• Commercial LED and other Lighting: Offers business customers a wide variety of energy efficient LED interior and exterior LED lighting retrofits and control options for updating their facilities.
• Commercial Food Service Equipment: Program provides rebates to commercial restaurants
to install energy efficient electric food service equipment listed on the PG&E food technology website.
• Commercial HVAC: Includes package and split system retrofits along with several
measures to reduce heat gain in the facility, including shade trees, window film and VFD and VSM retrofits to existing HVAC supply and return fans.
• Commercial New Construction: Program that is based on current Title 24 requirements.
The designed structure must exceed Title 24 specifications by at least 10%. The rebate is based on KW reduced in the design.
• Commercial Custom: Customer driven rebate option targets projects that reduce peak
loads and energy consumption and offers unlimited energy efficiency technology opportunities for the large and key account customers.
Evaluation, Measurement and Verification (EM&V) EM&V is performed annually on one or two programs. Selection of the programs to EM&V is prioritized by the dollars spent and savings claimed for the program. The budget for pre and post EM&V is based on the program selected for review and can vary from $20,000 up to $150,000. The budget depends on the extent of field measurement or customer surveys required to fully evaluate the program within the guidelines established by the California Energy Commission. M&V is performed internally or by a third-party contractor on an ongoing basis for all programs. All EM&V reports are posted on the Northern California Power Agency (NCPA) website. http://www.ncpa.com/policy/reports/emv Recommendations resulting from EM&V and M&V reports are used by Roseville Electric in the design and/or redesign of energy efficiency programs.

Recently completed EM&V include: • HVAC Right Size (2013) • Small Commercial and Multi Family Rapid Audit and Install (2014) • Residential HVAC, Pool Pump, Whole House Fan and Sunscreen (2016)
Sources of Energy Savings Roseville Electric relies on the savings in the E3 model provided by the TRM. If not available, the measure is entered to the E3 model as a custom measure. When a custom program is entered to the E3 model, the source of energy savings comes from a white paper, prior EM&V or a manual watt to watt calculation using customer provided hours and baselines. Roseville Electric relies on customer hours for some industries if they are more accurate in actual application than the hours in the TRM.
• LED Lighting: Roseville Electric relies on TRM LED lighting measures when available in the E3 model; otherwise Roseville Electric relies on industry specs for watts and replacement data (incandescent or cfl) and calculates savings using the TRM hours of operation and replacement of incandescent lighting as the baseline. Roseville Electric assumes baseline of incandescent as few residential or commercial customers adopted CFL technology.
• New Home Development Agreements: Roseville Electric is involved in all specific plan
negotiations with new home builders in Roseville and is able to enforce the requirement that all new home builders install HVAC systems with higher SEER and EER ratings than required by Title 24.
• New Home Construction Rebate Program: Roseville Electric influences the construction of
new homes in Roseville by providing rebates to participating builders for energy efficiency and solar. The energy efficiency savings are calculated using the Title 24 reports submitted for each participating village and rebated for energy efficiency by the percentage exceeding state housing standards.
Complimentary Programs
• Renewable Energy Programs: Roseville Electric rebated $837,289 on residential and commercial solar systems in FY 2016 adding 673 new systems. As of December 31, 2016, Roseville Electric had 3,083 installed solar systems at 11.3 MW.
• Multi Family Audit and Direct Install: Roseville Electric spent $102,422 to assist multi-
family residents in Roseville through a contractor energy audit program. The contractor performed an in - home energy audit providing the resident with prescriptive instructions to conserve energy.
• Low-Income Programs: Roseville Electric offers several rate assistance programs for
qualified low income residential customers. Roseville Electric spent $271,798 providing

rate assistance to approximately 1,500 customers in FY 15-16. Roseville Electric is reaching out to customers who may qualify for the rate assistance program through advertisements on local bus routes, retailers in areas where low income residents may reside and through online ads accessible by smart phone apps.
• EZ Energy Low Income Home Audit and Install Program: This program successfully reached
145 low income single family residences. Weatherization measures installed in qualifying homes include attic insulation and HVAC tune ups.
• Scholarships are provided through the Utility Exploration Center (UEC) for Title 1 schools
to offset the costs for field trips to the UEC.
• Research, Development and Demonstration: Roseville Electric participated in four RD&D programs in FY 15 including:
o City of Roseville Utility Exploration Center: a 4000 sq. ft. facility with the mission
to educate ratepayers and school children about water and energy conservation and a sustainable lifestyle. In support of this mission, Roseville Electric contributes to the development and maintenance of exhibits through annual contributions to the center. In FY 16, the Utility Exploration Center hosted 34,098 visitors including 7,301 students. In FY 16, Roseville Electric contributed $276,673 for exhibits and school programs and $1,200 for scholarships for students.
o APPA DEED: DEED is dedicated to increasing energy efficiency, reducing costs,
investigating new technologies and improving utility operations and services. Roseville Electric contributed $2,503 to the DEED program in FY 16.
o California Lighting and Technology Center (CLTC): The CLTC is a collaborative
effort between the California Energy Commission, the U.S. Department of Energy and the National Electrical Manufacturers Association to advance energy efficient lighting and day lighting technologies. The goals of the CLTC are accomplished through partnership with utilities, lighting manufacturers, end users, builders, designers, researchers and government agencies. It was established in 2003 at the University of California, Davis. In FY 16, Roseville Electric contributed $10,000 to the lighting center for ongoing R&D.
o Electric Vehicles: Roseville Electric continues to research and support the expansion
of electric vehicle charging stations in Roseville. In FY 16, we spent $4,032 to provide electricity for three public charging stations. The three charging stations are strategically located in the downtown parking center near the Vernon Street outdoor event plaza and in the Roseville Galleria, a regional shopping center in close proximity to highways 65 & 80.

Roseville Energy Efficiency Program Results, FY 2015-16
Roseville
CategoryUnits
Installed
Gross Coincident
Peak Savings (kW)
Gross Annual Energy Savings
(kWh)
Gross Lifecycle Energy Savings
(kWh)
Net Coincident Peak Savings
(kW)
Net Annual Energy Savings
(kWh)
Net Lifecycle Energy Savings
(kWh)
Net Lifecycle GHG
Reductions (Tons)
Utility Incentives Cost
($)
Utility Mktg, EM&V, and
Admin Cost ($)
Total Utility Cost ($)
Utility ($/kWh)
Res Clothes WashersRes Cooling 1,441 2,017 462,048 5,079,955 2,000 420,491 4,471,407 $525,857 $122,081 $647,938 $0.17Res DishwashersRes ElectronicsRes HeatingRes Lighting 1 2,400 1,299,658 12,996,580 2,400 1,299,658 12,996,580 $185,271 $207,961 $393,232 $0.04Res Pool Pump 274 106 468,814 2,170,155 73 323,482 1,497,407 $54,800 $23,960 $78,760 $0.06Res Refrigeration 247 31 152,002 755,347 31 152,002 755,347 $12,350 $17,898 $30,248 $0.04Res Shell 14,398 14 686,794 13,608,844 9 548,208 10,878,816 $188,637 $177,884 $366,521 $0.05Res Water HeatingRes Comprehensive 1 219 286,485 2,864,850 219 286,485 2,864,850 $48,534 $48,534 $0.02Res Behavior 1 2,964,332 2,964,332 2,964,332 2,964,332 $102,914 $102,914 $0.04Non-Res Cooking 5 9 42,134 471,290 9 42,134 471,290 $11,200 $2,084 $13,284 $0.03Non-Res Cooling 926 81 261,102 3,219,970 81 261,102 3,219,970 $544,078 $16,547 $560,624 $0.21Non-Res HeatingNon-Res Lighting 1,566 597 9,849,214 98,530,888 597 9,849,214 98,530,888 $1,325,305 $447,816 $1,773,121 $0.02Non-Res MotorsNon-Res PumpsNon-Res Refrigeration 9 12 51,995 541,660 12 51,995 541,660 $11,278 $2,307 $13,585 $0.03Non-Res ShellNon-Res Process 5 68 910,677 9,106,770 68 910,677 9,106,770 $42,170 $39,234 $81,404 $0.01Non-Res ComprehensiveNon-Res BehaviorOther
18,874 5,554 17,435,256 152,310,641 5,499 17,109,780 148,299,316 $2,900,946 $1,209,220 $4,110,166 $0.03
T&DCodes and Standards
Total 18,874 5,554 17,435,256 152,310,641 5,499 17,109,780 148,299,316 $2,900,946 $1,209,220 $4,110,166
TRC Test 1.50 PAC Test 1.63 Excluding T&D
Resource Savings Summary Cost Summary

SACRAMENTO MUNICIPAL UTILITY DISTRICT (SMUD) SMUD at a Glance
• Year established: 1946 • Climate Zone: 12 • Total Customers (year-end): 617,307 • Percent of retail sales by customer class – 46% residential, 54%
commercial/industrial/other • SMUD spent $32.0 million for residential and commercial energy-efficiency programs,
compared to a budget of $34.2 million.1 All expenditures are public-goods funded. SMUD Overview SMUD is planning program changes to respond to the following industry trends and changing customer expectations:
• Dozens of new companies now provide products and value-services that involve devices networked through the utility meter, WiFi, or cellular bands.
• LEDs: Prices are declining rapidly due to a combination of increased economies of scale, manufacturing technology improvements, and competition.
• The goals and expectations surrounding SB350 are due toward the end of 2017, which could cause significant changes in budget and goals for energy efficiency.
• The Comprehensive Energy Efficiency Program for Existing Buildings authorized by AB 758 will ultimately generate new utility data reporting requirements, additional building assessment and rating tools and requirements, an increased emphasis on efficiency code compliance during retrofits, focus on building industry training programs, and potential requirements for utilities to finance building upgrades.
• Residential rates will begin to mimic commercial rates at SMUD, with a movement toward TOU rates. This will place a greater focus on measures that impact peak demand and load management strategies.
• Commercial customers’ interest in Zero Net Energy (ZNE) solutions is growing. • More and more customers prefer to access information and communicate via mobile
devices. • Consumers are becoming increasingly interconnected, fundamentally shifting channels of
social interaction. • Customers want clear and simple choices
Major Program Changes The overall budget, energy and peak savings achieved in 2016 were relatively unchanged from 2015. But the following program changes were made to facilitate customer demand and prepare for the future:
1 Includes market research, planning, M&V, and emerging technologies R&D.

• The Retail Lighting program delivered less savings as the movement continued toward an LED only program and the eventual sunset of the program. The program went from a product mix of 60% LEDs and 40% CFLs in 2015 to a product mix of 90% LEDs and 10% CFLs in 2016. The program was able to accomplish this by lowering the incentives to both CFLs and LEDs.
• In conjunction with further improvements to Energy Tools using an OPower platform, SMUD added Business Energy Reports to the existing, 50,000 customer, Home Electricity Reports.
• In collaboration with the EPA, SMUD continued to support and offer the Retail Product Platform (RPP) program, which incentivizes retailers to stock up, and make available greater Energy Star Products. For the 2016 program, new national retailers were added, and new products like heat pump dryers, and sound bars were included. Through the 4 participating retailers, over 7400 products were incentivized.
• The Home Performance Program more than doubled over the past year as the local contractors embraced the program and for several contractors it became the marquee component of their product offerings. While this program took several years to reach maturity, continued to growth is expected for this program.
• SMUD awarded a new three-year contract to Ecology Action to run the Complete Energy Solution program. This program is designed to provide comprehensive energy efficiency solutions to the smaller and mid-size commercial customers. In the latest version of the contract, the vendor has been asked to reach deep into the energy efficiency potential of these traditionally underserved customers. Ecology Action voluntarily set aside a portion of the program to focus on non-profit organizations.
Program Highlight While the Retail Lighting program reduced in size by about 5%, the program continued to make tremendous strides in transferring into an LED only based program. Based upon the reduction of cost and the increased availability of LEDs, this program has become an LED only program for 2017. LED light bulbs are a much better customer experience than CFLs. Customers can expect a higher quality light source with better startup characteristics and better overall controllability. Based upon the continued reduction in LED light bulb prices, the LED light bulb has become viable for nearly every light bulb in the typical house. Program Descriptions SMUD has been continuously operating energy-conservation, load management, and energy-efficiency programs since 1976. Over that 40 year time period, SMUD’s customers have saved over 2 TWh of first year energy savings. In 2007, the SMUD Board of Directors approved a significant expansion in annual savings goals for its energy-efficiency resources, from approximately 0.6% of annual sales to an annual average of approximately 1.5% over the following decade. These goals have now been extended through 2023. The expanded goals were part of the Board’s vision to “empower our customers with solutions and options that increase energy efficiency, protect the environment,

reduce global warming, and lower the cost to serve our region.” SMUD is continually redesigning its energy-efficiency portfolio to expand existing programs, plan and implement new programs, and develop and implement a broader marketing and engagement plan that will meet these expanded goals and the Board’s vision. For 2016, SMUD spent $32.0 million for residential and commercial energy-efficiency programs, compared to a budget of $34.2 million.2 All expenditures are public-goods funded. These programs delivered 35.9 megawatts (MW) of peak-load reduction and 169.2 million kilowatt-hours (GWh) of annual energy savings, compared to annual goals of 28.5 MW and 158.0 GWh. These goals do not match the reported saving on the attached spreadsheets due to variations between net to gross accounting. For 2017, residential and commercial energy-efficiency programs, SMUD has budgeted $28.1 million in PG funds.3 These programs are projected to deliver 39.3 MW of peak-load reduction and 158.5 GWh of annual energy savings. These goals do not match the reported saving on the attached spreadsheets due to variations between net to gross accounting. Commercial/Industrial Retrofit Programs Expenditures for commercial/industrial energy efficiency retrofit programs for existing buildings and facilities were $13.0 million, with delivery of 10.1 MW of peak-load reduction and 74.5 GWh in annual energy savings.
• Customized Energy Efficiency Incentives: Promotes the installation of energy-efficient equipment, controls, and processes at commercial and industrial customer facilities. Provides incentives to contractors and/or customers to promote the installation of energy efficient lighting, HVAC, motors, and refrigeration equipment and controls. The program also provides incentives for retro-commissioning, process improvements, and data center storage projects that result in energy savings.
• Express Energy Solutions: Provides prescriptive incentives to participating qualified contractors for high-efficiency equipment across a variety of end-uses: lighting, HVAC, refrigeration, and food-service equipment. Incentives are targeted to the contractor/supplier in an effort to stimulate the market for energy-efficient equipment and services, and are designed to cover a significant portion of the incremental cost of the equipment.
• Complete Energy Solutions: Third party administrator performs comprehensive energy audits of small and medium-sized businesses. Customer receives a customized report detailing recommended energy improvements, estimated savings, estimated cost and payback. Third party administrator then assist customer in hiring a contractor to complete the project.
• Savings by Design: Provides incentives to builders and their design teams to design new commercial and industrial buildings 10-30 percent more energy efficient than required by
2 Includes market research, planning, M&V, and emerging technologies R&D. 3 Includes market research, planning, M&V, and emerging technologies R&D.

Title 24 (or typical new construction in the case of Title 24-exempt buildings and processes).
• Prop 39 Schools Program: SMUD has taken the position of a trusted advisor with regard to the Prop 39 funding that has been made available to schools for retrofit projects. Instead of a traditional rebate program, SMUD has provided consultant services to help facilitate the local school districts’ access to the Prop 39 funds. Since we still have aided with projects and the schools are using Prop 39 funding, we have included our costs in our reporting, but we have not added the schools cost for the projects as participant costs.
Residential Programs Expenditures for residential energy-efficiency programs for existing homes were $15.3 million and achieved 19.9 MW of peak-load reduction and 73.5 GWh in annual energy savings.
• Shade Trees: Provides free shade trees to SMUD customers. Implemented through the community-based non-profit Sacramento Tree Foundation (STF). STF foresters review tree selection and site locations with customers, who plant the trees.
• Equipment Efficiency: Provides rebates and/or SMUD financing for qualifying (Energy Star, Consortium for Energy Efficiency, and/or other high-efficiency) efficiency improvements to homes’ building shells and equipment. Improvements include central air conditioners and heat pumps, windows, heat pump water heaters, and cool roofs.
• Home Performance Program: Participating contractors use building-science principles and diagnostic equipment to evaluate the current performance of the whole house, and then recommend comprehensive improvements that will yield an optimal combination of savings and comfort for homeowners. Once the homeowner selects the improvements that fit their needs and budget, participating contractors will do the work to Building Performance Institute standards.
• Plug Load Program: Provides rebates for qualifying (Energy Star or Consortium for Energy Efficiency-listed) appliances: clothes washers, dishwashers, refrigerators, and room air-conditioners. Also included in this program are Refrigerator/Freezer Recycling, Pool Pumps and the Retail Partnership Program. Refrigerator/Freezer Recycling provides rebates for the free pick-up and environmental recycling of old refrigerators and freezers. Pool Pump rebates are available to customers and contractor for installing high-efficiency variable-speed pool pumps. The pool pump program also focuses on educating the pool-contractor community on practices for retrofit and new-pool installations that maximize pumping efficiency and minimize energy use and peak demand. The Retail Partnership Program is an upstream program that works with big box retailers to pay retailer incentives for all the energy efficiency items they sell in their stores.
• Retail Lighting: Promotes energy efficient residential lighting products by providing incentives for manufacturers and their retail partners to sell Energy Star lighting at a discount. Implemented through agreements with manufacturers and retailers that involve cost buy-downs, marketing, and/or advertising. SMUD has been steadily increasing the percentage of LED bulbs rebated through this program.

• Multi-Family Retrofit Program: The Multifamily (MF) Retrofit Program contains two distinct options for MF property owners: (1) Home Performance Program for Multifamily (HPP-MF) Rebates, which provide comprehensive retrofit of existing MF buildings (such as at least two changes to an existing building’s envelope, electric water-heating system, space-conditioning system, or lighting system); and (2) Prescriptive MF Rebates, which is offered to MF property owners who are not willing or able to invest in major comprehensive energy efficiency improvements. This program will be on hiatus for 2017.
Information/Education Programs Expenditures for information and Education programs were $1.0M in 2016 with 5.8 MW of peak-load reduction and 21.2 GWh in annual energy savings.
• Home and Business Electricity Reports: A scientifically designed program to measure the impact of sending electricity-usage reports to residential and commercial customers. The reports compare the customer’s monthly usage to that of the previous year and to about 100 neighbors in similar-size homes with the same heat energy source. The reports are customized to each house or business and provide energy tips to assist the customer in making behavior changes that reduce their energy use.
• Residential Advisory Service: Provides on-site energy audits of homes, on-line energy audits, and telephone assistance for customers, with recommendations to reduce their homes’ energy use (and bills). Recommendations include practices and home-improvement projects that will increase the energy efficiency of their dwellings.
Demand-Reduction Programs • Residential Air Conditioner Load Management Program: In the past, customers volunteered
to allow SMUD to install a radio-controlled cycling device on their central air conditioners, and to send a radio signal that switches or cycles off their air conditioners during an electric-system emergency. In the late 1990’s the program was transitioned over into maintenance mode with installation being stopped and then in 2010 the program was shut down and all service and maintenance related work was discontinued. In an Emergency Situation the Power System Operators do have the ability to activate the entire ACLM cycling program within a 3 minute time span.
• Residential PowerStat Program: PowerStat is a “customer choice” model for residential customers giving them more options to manage their energy costs as well as providing comfort and convenience. The PowerStat pilots included a variety of customer tests with varying degrees of incentives and temperature setbacks, with different limitations on event overrides. These pilots were shut down in 2016.
• Power Direct (Automated Demand Response Program): Enhances facilities’ energy performance by seamlessly integrating automated response capabilities into energy management, lighting and HVAC systems. Automatically reduces electricity consumption on Conservation Days in times of high demand.

EM&V SMUD has established a framework to develop yearly measurement and verification (M&V) action plans. SMUD is planning M&V activities for all of its major programs, scheduled at fixed intervals (2-4 years apart), with the intention of evaluating all programs on a continued cyclical basis through 2020. For methodological approaches needed to perform specific types of evaluations, SMUD will be guided by the CPUC’s “California Evaluation Framework” (June 2004) and “California Energy Efficiency Evaluation Protocols” (April 2006). SMUD is planning to allocate approximately one percent of its total energy-efficiency budget towards impact- and persistence-focused M&V studies. These studies will be conducted primarily through the use of third-party contractors, with management and oversight by SMUD’s Business Planning Department. SMUD completed the following M&V activities in 2016:
• Savings by Design • Pool Spa and Pump
In 2017, M&V will be conducted for the following: Sources of Energy Savings In order to determine energy savings, programs may rely on several sources: the Database for Energy Efficient Resources (DEER), TRM, Energy Modeling Software, or specific studies conducted by utilities or recognized working groups. The goal is to use the most current studies/workpapers which best represent CZ12 and SMUD customers. Complimentary Programs
• Smart Homes- New construction program that integrates energy efficiency, demand response and other technologies in an aligned vision. The program is designed to complement SMUD’s other portfolio programs (EE, DR, EV, etc.) to support SMUD’s future load requirements. The resulting home design from those builders that participate will be an innovative use of energy-efficient design technologies, integrated built-in DR capabilities, automated peak shifting strategies, and other “smart” connected options desired by homeowners.
• Renewable Energy Programs: Incentives for net-energy-metered PV; a feed-in tariff for mid-scale systems (currently closed); voluntary green pricing programs including SolarShares, which supports expansion of distributed PV; commercial and residential REC purchase programs; and a community solar program aimed at enhancing K-12 curricula on renewable energy.
• Low-Income Programs: SMUD provides a low-income rate subsidy, a medical assistance rate subsidy, and no-cost weatherization services to our low-income customers. Pilot programs are currently in-place to try other energy efficiency options to assist our low-income customers.
• Research, Development, and Demonstration: SMUD has a centralized research and development program that conducts public good research across the electricity enterprises
from the supply side to demand side. With an annual budget of approximately $10.8 million, research is conducted in eight research areas which include renewable energy, electric transportation, climate change, distributed generation, energy efficiency, demand response, storage and smart grid. These programs seek to track emerging technologies, demonstrate promising technologies and prepare SMUD and SMUD customers for adoption of these emerging technologies.
• Codes & Standards: SMUD continues to assist with the development and implementation of codes and standards (e.g. T24, T20, etc.). SMUD participates in several working groups, drives code compliance through programs, assists with workforce training, conducts research, and develops data management systems to improve tracking and reporting. SMUD is planning to claim the energy savings associated with the Codes and Standards work starting in 2017. SMUD claims the Codes and Standards cycles in which we have previously participated. Electric Vehicles: In 2016 SMUD’s Drive Electric program promoted adoption of plug-in electric vehicles through special PEV rate offerings, participation in educational events, educational offerings through our website SMUD.org/PEV, and collaboration with local auto dealers and the local EV advocacy group Sac EV. SMUD’s coordination of a large scale Ride-N-Drive event at the Sacramento International Auto Show resulted in test drives of plug-in electric vehicles and was one highlight of our PEV education efforts.
• Energy Storage: SMUD conducted field studies to examine grid-scale storage applications, risks and benefits. Additionally, residential applications for storage combined with renewable generation and dynamic pricing were also tested in a midtown Sacramento new construction development.

Sacramento Energy Efficiency Program Results, CY 2016
Sacramento
CategoryUnits
Installed
Gross Coincident
Peak Savings (kW)
Gross Annual Energy Savings
(kWh)
Gross Lifecycle Energy Savings
(kWh)
Net Coincident Peak Savings
(kW)
Net Annual Energy Savings
(kWh)
Net Lifecycle Energy Savings
(kWh)
Net Lifecycle GHG
Reductions (Tons)
Utility Incentives Cost
($)
Utility Mktg, EM&V, and
Admin Cost ($)
Total Utility Cost ($)
Utility ($/kWh)
Res Clothes Washers 3,030 141 408,899 6,133,485 141 327,119 4,906,788 2,010 $42,630 $79,788 $122,418 $0.02Res Cooling 15,405 2,640 3,229,310 57,279,000 2,640 2,583,448 40,095,300 16,421 $1,382,835 $395,876 $1,778,711 $0.04Res DishwashersRes Electronics 944 68 198,240 1,982,400 68 158,592 1,585,920 650 $20,688 $38,682 $59,370 $0.04Res HeatingRes Lighting 1,682,060 5,270 66,712,500 553,713,750 5,270 53,370,000 442,971,000 145,133 $4,938,000 $332,904 $5,270,904 $0.01Res Pool Pump 1,525 52 2,609,275 39,139,125 52 2,087,420 31,311,300 12,823 $272,031 $207,142 $479,173 $0.02Res Refrigeration 5,662 456 5,017,779 24,587,117 456 4,014,223 19,669,694 8,056 $523,131 $276,108 $799,239 $0.04Res Shell 160,647 167 178,397 3,567,940 167 142,718 2,854,352 1,169 $203,746 $59,390 $263,136 $0.09Res Water Heating 118 485 518,022 10,360,440 485 414,418 8,288,352 3,394 $126,500 $66,833 $193,333 $0.02Res Comprehensive 3,063 11,430 15,580,000 128,304,000 11,430 12,464,000 102,643,200 67,377 $2,961,802 $142,046 $3,103,848 $0.02Res Behavior 50,000 5,020 13,550,000 40,650,000 5,020 10,840,000 32,520,000 $451,281 $451,281Non-Res CookingNon-Res Cooling 25 708 9,116,641 136,749,615 708 7,293,313 109,399,692 44,804 $429,393 $211,927 $641,320 $0.01Non-Res HeatingNon-Res Lighting 1,215 6,116 37,738,722 150,954,888 6,116 30,190,978 120,763,910 49,458 $3,178,856 $340,625 $3,519,481 $0.03Non-Res MotorsNon-Res Pumps 2 16 219,176 16 175,341 1,753,408 $36,984 $18,320 $55,304 $0.03Non-Res Refrigeration 57 753 5,001,789 50,017,890 753 4,001,431 40,014,312 16,388 $453,114 $238,472 $691,586 $0.02Non-Res ShellNon-Res Process 18 163 2,198,549 21,985,490 163 1,758,839 17,588,392 7,203 $189,399 $35,834 $225,233 $0.01Non-Res Comprehensive 47 2,394 20,255,106 178,244,933 2,394 20,255,106 178,244,933 72,999 $14,569,168 $263,402 $14,832,570 $0.08Non-Res BehaviorOther 63,675,008
1,923,818 35,879 182,532,405 1,403,670,073 35,879 150,076,945 1,154,610,553 447,886 $29,328,277 $3,158,630 $32,486,907 $0.03
T&DCodes and Standards
Total 1,923,818 35,879 182,532,405 1,403,670,073 35,879 150,076,945 1,154,610,553 447,886 $29,328,277 $3,158,630 $32,486,907
TRC Test 0.82 PAC Test 2.65 Excluding T&D
Resource Savings Summary Cost Summary

SAN FRANCISCO PUBLIC UTILITIES COMMISSION San Francisco Public Utilities Commission At a Glance
• Providing electricity to customers since 1925. • Located in Climate Zone 3. • Serving approximately 2,400 retail customer connections . • Customer classes: Approximately 40% of retail electricity is supplied to San Francisco
municipal customers in the “General Fund” rate class, consisting primarily of nonresidential buildings, process loads, and streetlights. The remaining retail electricity is supplied to customers in the “Enterprise” rate class, which are primarily municipal nonresidential buildings, tenants on municipal property, multi-tenant residential buildings, and process loads.1
• FY 2015-16 total electricity sales to retail customers: 968,000 megawatt-hours (MWh); peak demand: 147 megawatts (MW); load growth is negligible.
• In FY 2015-16, the Power Enterprise appropriated $1,000,000 for energy efficiency projects other than streetlights. Actual spending of utility revenues (reporting all project costs in the year of completion) totaled $1.3 million. Other public purpose programs include municipal renewable energy projects and the GoSolarSF solar incentive program.
San Francisco Public Utilities Commission Overview Power Enterprise manages a portfolio of electric generation, which includes the SFPUC’s Hetch Hetchy Water and Power system, which generates an average of 1.6 million MWh of clean hydroelectric power each year, 23 municipal solar photovoltaic installations (8.1 MW), and 2 biogas cogeneration facilities (3.1 MW). Power Enterprise has made a commitment to energy efficiency as its highest priority resource. Historically, Power Enterprise’s energy efficiency programs mainly have targeted its municipal customers, and most of its programs have been provided at no charge to these civic agencies. Today, fee-for-service programs represent a growing portion of energy efficiency offerings. Power Enterprise is also developing new programs for its growing residential and commercial customer sectors. Major Program Changes This year’s energy savings are primarily derived from completion of a number of comprehensive HVAC retrofits of older municipal buildings located downtown, which also resulted in substantial natural gas savings. Additionally, Power Enterprise continued to implement commissioning and design review projects to achieve electricity and natural gas savings at various sites. Finally, Power Enterprise continues to achieve significant savings through LED streetlight retrofits, which are expected to significantly increase in scale, starting in the next fiscal year.
1 A small portion of sales are made to non-municipal residential and commercial customers located in redevelopment projects at Treasure/Yerba Buena Islands and Hunters Point that are served off of Power Enterprise operated distribution systems.

Program Highlight Energy efficiency has been an essential component of Power Enterprise’s resource portfolio for more than a decade. In the current reporting period, FY 2015-16, completed energy efficiency projects are estimated to save 1,100 MWh (net savings) of electricity per year, at a utility cost of $1.3 million. Program level highlights for FY 2015-16 include:
• Direct-install style retrofits provided most of the electricity savings reported for this fiscal year, including HVAC upgrades at major parking garages and major Real Estate Division buildings.
• Power Enterprise provided ongoing design review for new construction and commissioning for the renovation currently being completed at San Francisco International Airport.
• 718 streetlights were replaced with LED technology. Power Enterprise plans to eventually convert 18,000 streetlights to LED.
• Power Enterprise’s annual report benchmarking the energy performance of San Francisco’s municipal buildings includes 465 buildings representing almost 49 million square feet of building area.
Program Descriptions Power Enterprise’s energy efficiency programs are generally tailored to the particular customer’s circumstances because most customers are large and have varied property characteristics. They include:
• Direct-Install Program: This program provides complete retrofit services to targeted municipal customers, usually at no cost to the customer. The program focuses on City agencies that are funded primarily through local tax receipts, fees, and federal/state-funded programs. These customers are considered hard-to-reach (due to limited access to capital and engineering, as well as insufficient price signals).
• Civic Center Sustainability District: Through a partnership with the Clinton Global Initiative, this program demonstrates green, renewable and energy efficient technologies as a national model for sustainability in historic districts. For energy efficiency projects, the program provides free energy audits, design, construction management, construction services, and full funding to buildings in the City’s historic district.
• LED Street Light Conversion Project: The capital-funded program aims to convert about 18,000 high pressure sodium street lights to LED lights. The program will reduce energy use and maintenance costs, and improve pedestrian and vehicular safety. The project scope includes the installation of networked wireless controls, which will further reduce energy consumption via fixture dimming. The project launched in FY15-16. This year, 718 streetlight fixtures were replaced with LEDs, with a projected annual electricity savings of 293,000 kWh.

• Green Commissioning and Design Review Program: Power Enterprise provides commissioning and related green building design review services on a fee-for-service basis for municipal new construction and major renovations. For existing buildings, the program offers retro-commissioning services.
• Energy Benchmarking Program: San Francisco requires owners of non-residential buildings over 10,000 square feet to annually benchmark and disclose the energy performance of their buildings. In FY 15-16, Power Enterprise released its fourth annual report benchmarking the energy performance of San Francisco’s municipal buildings, including 465 buildings representing nearly 49 million square feet of building area.
EM&V Historically, the majority of energy efficiency retrofit projects funded by Power Enterprise have included an individual M&V study following the International Performance Measurement and Verification Protocol (IPMVP). These projects have included an M&V plan with a sampling plan, a logging plan, an approach to data recovery and analysis, and a written report. Sources of Energy Savings Power Enterprise’s mostly-direct-install energy efficiency portfolio allows it to report energy savings based on site-specific engineering studies with detailed ex ante savings estimates. These studies base savings on on-site collected data for hours of operation, nameplate data for replaced equipment, and detailed site-specific costs. Complimentary Programs Power Enterprise offers several related programs, among them:
• Renewable Energy Programs: o Municipal Renewable Program: Under this program, Power Enterprise directly
installs, maintains and operates solar PV systems on municipal buildings throughout the City and County of San Francisco; and
o GoSolarSF: The program provides incentive payments to San Francisco residents and businesses installing rooftop solar projects. The program includes a component for low income residents, which complements a statewide program administered by Grid Alternatives, a nonprofit organization.


San Francisco Energy Efficiency Program Results, FY 2015-16
San Francisco PUC
CategoryUnits
Installed
Gross Coincident
Peak Savings (kW)
Gross Annual Energy Savings
(kWh)
Gross Lifecycle Energy Savings
(kWh)
Net Coincident Peak Savings
(kW)
Net Annual Energy Savings
(kWh)
Net Lifecycle Energy Savings
(kWh)
Net Lifecycle GHG
Reductions (Tons)
Utility Incentives Cost
($)
Utility Mktg, EM&V, and
Admin Cost ($)
Total Utility Cost ($)
Utility ($/kWh)
Res Clothes WashersRes CoolingRes DishwashersRes ElectronicsRes HeatingRes LightingRes Pool PumpRes RefrigerationRes ShellRes Water HeatingRes ComprehensiveRes BehaviorNon-Res CookingNon-Res Cooling 3 58 44,688 670,320 58 44,688 670,320 411 $45,000 $115,296 $160,296 $0.35Non-Res Heating 1 2 22,100 331,500 2 22,100 331,500 184 $183,864 $22,982 $206,846 $0.90Non-Res Lighting 718 292,736 4,391,039 292,736 4,391,039 2,268 $641,600 $641,600 $0.21Non-Res Motors 1 11 587,175 8,807,625 11 587,175 8,807,625 4,684 $224,091 $28,010 $252,100 $0.04Non-Res PumpsNon-Res RefrigerationNon-Res ShellNon-Res ProcessNon-Res Comprehensive 2 120 153,000 3,060,000 76 97,002 1,940,040 1,080 $24,028 $24,028 $0.02Non-Res BehaviorOther
725 190 1,099,699 17,260,484 146 1,043,701 16,140,524 8,627 $1,094,555 $190,315 $1,284,870 $0.12
T&DCodes and Standards
Total 725 190 1,099,699 17,260,484 146 1,043,701 16,140,524 8,627 $1,094,555 $190,315 $1,284,870
TRC Test 0.99 PAC Test 1.82 Excluding T&D
Resource Savings Summary Cost Summary

CITY OF SHASTA LAKE City of Shasta Lake At a Glance
• Climate Zone 11 • Number of retail customer connections: 4,542 • FY15-16 total retail sales revenue by customer class (35% residential, 10% commercial,
and 55% industrial) • FY15-16 total budget for Public Benefit Programs: $359,461 • FY15-16 total amount actually expended for energy efficiency programs: $107,025
City of Shasta Lake Overview The CSL feels a significant responsibility to its community to invest their Public Benefits funds in such a way as to impact both energy and financial savings for their customers, and a positive economic impact in CSL as well. CSL offers a comprehensive menu of rebates to all of our customers. However, because of the economic downturn that has affected the City for several years, the number of customers taking advantage of the rebate offers have been relatively low. Program Highlight The Commercial Lighting Program delivered 65% of the total kWh savings in FY16. While CSL accomplished 21% of the target kWh savings for FY16, 110% of the total annual goal since FY11 have been realized. History has demonstrated that direct install programs are beneficial and customers will take advantage of free give-a-ways. Program Descriptions CSL manages a comprehensive energy efficiency incentive program for residential and commercial customers focusing on energy efficiency and peak load reduction. For residential customers, rebates are offered for the installation of various energy efficiency measures, such as lighting, HVAC, appliances, and weatherization. For commercial customers, rebates are available for upgraded lighting, HVAC, appliances, refrigeration equipment, electronics, and in cases where an analysis is performed rebates can be offered for additional equipment that reduces energy use and/or demand. On-site energy audits are provided by CSL energy specialists. Energy efficiency measures are recommended and additional visits are completed upon request.
• Residential Lighting Program [Res Lighting]: CSL offers rebates to homeowners who install ENERGY STAR® qualified LED lamps/bulbs, ceiling fans and LED holiday lights.
• Residential HVAC Program [Res Cooling]: CSL offers rebates to homeowners who install high performance heat pumps, central air-conditioners, room air-conditioners, whole house fans, or evaporative coolers that exceed current state requirements. CSL also offers a rebate for duct sealing when not required by code.
• Residential Equipment Program [Res Clothes Washers; Res Dishwashers; Res Pool Pump; Res Refrigeration]: CSL offers rebates to homeowners who purchase new ENERGY STAR
qualified products, including clothes washers, room air conditioners, dishwashers, pool pumps, and refrigerators.

• Residential Weatherization Program [Res Shell]: CSL offers rebates to homeowners who invest in weatherizing their homes, including attic and wall insulation, window treatments/replacement, air/duct sealing and radiant barriers.
• Residential Water Heater Rebate Program [Res Water Heating]: CSL offers rebates to homeowners who purchase a new, energy efficient electric water heater.
• Commercial Lighting Program [Non-Res Lighting]: CSL offers rebates to business owners who invest in the installation of energy efficiency lighting upgrades. There is a prevalence of inefficient lighting throughout the city and most high bay lighting uses high intensity discharge fixtures instead of more efficiency fluorescent or LED fixtures.
• Commercial Custom Program [Non-Res Comprehensive]: CSL offers rebates to business owners based on site-specific consumption. Rebates are tailored to the individual business owner’s needs based on the audit and the potential energy savings associated with the customer project.
EM&V EM&V report link http://www.cityofshastalake.org/DocumentView.aspx?DID=148 “ERS assessed CSL’s WEPT program and estimated its potential energy savings as 22,826 kWh. CSL’s regulatory compliance report for FY2015 was reviewed and verified as accurately representing the energy savings performance of the energy efficiency programs.” Sources of Energy Savings The 2016 TRM was the source for most of the claimed savings. The Commercial Lighting Program relies on custom savings calculations. Complimentary Programs
• Low-Income Programs: Lifeline monthly rate discount program and one time bill assistance known as SHARE
• Renewable Energy Programs: Focus on customized solar projects that benefit the City • Research, Development, and Demonstration: Focuses on LED lighting in various
applications, community solar charging station(s), and latest HVAC applications in City owned facilities
• Electric Vehicles: Support of local business in conversion of combustion engine vehicles to electric vehicles. Currently participating in a regional transportation study to electrify buses.
• Energy Storage: CSL is participating in the NCPA/SCPPA joint contract with DNV GL to provide an updated evaluation of solar and energy storage technologies.

Shasta Lake Energy Efficiency Program Results, FY 2015-16
Shasta Lake
CategoryUnits
Installed
Gross Coincident
Peak Savings (kW)
Gross Annual Energy Savings
(kWh)
Gross Lifecycle Energy Savings
(kWh)
Net Coincident Peak Savings
(kW)
Net Annual Energy Savings
(kWh)
Net Lifecycle Energy Savings
(kWh)
Net Lifecycle GHG
Reductions (Tons)
Utility Incentives Cost
($)
Utility Mktg, EM&V, and
Admin Cost ($)
Total Utility Cost ($)
Utility ($/kWh)
Res Clothes Washers 5 1,220 13,420 378 4,160 2 $500 $788 $1,288 $0.41Res Cooling 34 1 3,731 55,719 1 2,985 44,575 27 $9,222 $5,997 $15,219 $0.49Res Dishwashers 13 754 7,540 452 4,524 2 $750 $860 $1,610 $0.46Res ElectronicsRes HeatingRes Lighting 106 3,211 48,165 1,734 26,009 13 $864 $8,449 $9,313 $0.52Res Pool Pump 8 5,392 53,920 3,235 32,352 16 $3,200 $6,151 $9,351 $0.37Res Refrigeration 19 2,464 34,503 1,725 24,152 13 $1,900 $6,079 $7,979 $0.47Res Shell 13,566 19 20,126 382,332 9 9,174 177,832 100 $16,741 $12,743 $29,485 $0.26Res Water Heating 3 1 1,588 15,879 1,204 12,043 6 $340 $810 $1,150 $0.12Res ComprehensiveRes BehaviorNon-Res CookingNon-Res Cooling 4 1,010 15,150 859 12,878 8 $1,717 $481 $2,198 $0.25Non-Res HeatingNon-Res Lighting 1 5 51,141 613,693 4 40,913 490,954 272 $18,901 $10,532 $29,433 $0.08Non-Res MotorsNon-Res PumpsNon-Res RefrigerationNon-Res ShellNon-Res ProcessNon-Res ComprehensiveNon-Res BehaviorOther
13,758 26 90,638 1,240,321 14 62,660 829,479 461 $54,135 $52,890 $107,025 $0.18
T&DCodes and Standards
Total 13,758 26 90,638 1,240,321 14 62,660 829,479 461 $54,135 $52,890 $107,025
TRC Test 0.71 PAC Test 0.93 Excluding T&D
Resource Savings Summary Cost Summary

SILICON VALLEY POWER
Silicon Valley Power at a Glance • Climate Zone 4 • 53,235 retail customers; 85% are residential; 14% are commercial & industrial; 1% are
municipal • Retail Sales Breakdown: 7.2% residential, 2.9% commercial, 89.4% industrial, 0.6%
municipal (Note that commercial and industrial customers are categorized by their rate code, and not type of business performed at the location.)
• The amount budgeted for energy efficiency programs in FY 15-16 was $6,665.846. • The total amount actually expended was $3,989,874. All funding for energy efficiency
programs comes from the Public Benefits Charge on customers’ utility bills. Unexpended energy efficiency dollars are typically rolled over into the following fiscal year’s energy efficiency programs. However, at the end of Fiscal Year 2015-2016, SVP had built up a larger than usual reserve, so SVP will be reallocating a portion of the unexpended commercial energy efficiency program funds from previous years to fund the FY 2016-2017 PV rebates that were being funded through other utility budgets. This was also done in FY 2013-2014 and FY 2014-2015 with unexpended energy efficiency funds for FY 2012-2013 and FY 2013-2014.
• 73.1% system load factor • Load growth projected at 2.63% for Fiscal Year 2016-2017
Silicon Valley Power Overview Businesses in Santa Clara survived the economic downturn relatively well, and we continued to see load growth during the recession and beyond due to the load that new data centers have been bringing online the last several years. However, even today, most companies are still working with leaner staff and tighter budgets than they did previously, so we are seeing fewer energy efficiency projects due to lack of time and funding. This trend remains in effect, even as the economy has continued to improve. For this reason, we have seen fewer large energy efficiency projects undertaken, but we are beginning to see longer term planning for projects, which are anticipated to be complete in future fiscal years. Silicon Valley Power is unique in its mix of customers. While 85% of the customers are residential, nearly 93% of the utility retail sales are to commercial and industrial customers. Approximately 50% of our electric load is attributable to our largest “Key” Customers. Over 39% comes from data centers. Historically, it is those customers, including the large data centers, who implement a few large projects each year that make up the majority of our energy savings for the year. In Fiscal Year 2015-2016, we saw few of these projects, which is partly due to lack of staff and budget, and partly due to the fact that these customers have been aggressively implementing energy efficiency measures for more than a decade and the opportunities for improvements are fewer and have long payback periods. Some of the energy efficiency measures that are still being implemented include IT improvements, for which SVP does not have an incentive program.

Therefore, while these savings are being achieved in our community, like the energy savings from codes and standards, they are not accounted for in this report. Major Program Changes For FY 2015/2016, Silicon Valley Power added or modified the following programs:
• Residential LED Lighting Rebate – SVP eliminated the mail in rebate and implemented an upstream instant rebate in local stores in conjunction with other Northern California Power Agency (NCPA) member utilities. SVP’s target for the bulbs included in the program were specialty bulbs and those at least 1,000 lumens since there are still few LED options on the market over 1,000 lumens and in certain specialty categories. Incentivizing these bulbs is designed to encourage manufacturers to make more of these bulbs, which have a higher cost due to the additional diodes. This is in line with the Consortium for Energy Efficiency (CEE) recommendations for utility programs across the country.
• Residential Refrigerator Recycling Program: Previously, the incentive was $35 for recycling an old, working refrigerator or freezer. This incentive was increased to $50 to encourage customers to recycle their old refrigerators and freezers through our environmentally responsible recycling provider.
• Residential Pool Pump Rebate: This program provides a $100 rebate to residential customers installing a new variable speed pool pump with a qualifying controller.
• Commercial New Construction Rebate: This program was redesigned and simplified to align with the prescriptive approach to compliance with California’s building energy efficiency code, Title 24. Customers still need to exceed Title 24 by 10% for the measure being incentivized, but rebates are paid at mounts in line with our other prescriptive rebates for retrofit projects. Required paperwork in order to receive the rebate was simplified for customers.
• Enhanced Ventilation Controls Rebate: This program provides an incentive of $160 per ton for adding enhanced ventilation controls to HVAC rooftop packaged units 15 tons or smaller.
• Food Service Equipment Rebate: SVP added two new energy efficiency measures to the program. The CoolerMiser is an occupancy control for reach in coolers with glass doors and was previously the focus of a third party direct install program. As that program ended on June 30, 2015, SVP added a rebate of $100 per unit to the rebate program. SVP also added an incentive of $350 per controlled horsepower for demand controlled kitchen ventilation.
For FY 2015/2016, Silicon Valley Power ended the following programs:
• LEED Rebate: This rebate provided reimbursement to businesses for the cost of registering their LEED building project with the U.S. Green Building Council. Upon completion, if customers met the requirements to obtain LEED certification and achieved the energy requirements, SVP paid a rebate based on the square footage of the facility and the level of certification achieved. SVP ended this program, as there was very little customer

demand for the program of the past several years and no energy savings can be claimed through the program, so it does not contribute to the program goals.
• PC Power Management Rebate: This program provided an incentive for installing qualifying PC Power Management software that demonstrates an annual energy savings of at least 125 kWh. This software is now standard with most new computer purchases and free versions are available for older models. In addition, with “technology refresh” policies averaging between 2-4 years for replacement, the incentive is no longer necessary so the program ended.
• Advanced Lighting Rebate Program: The program provided a $0.20/kWh rebate for advanced lighting controls projects that have such capabilities as real time monitoring and control via remote access and automatic dimming based on occupancy and/or daylighting control strategies, and where the system reduces lighting energy consumption by at least 50%. With the latest version of California Title 24 energy efficiency standard, most of the attributes of an advanced lighting control system are now mandated by code. Therefore, SVP ended this program and rolled lighting controls that achieve savings beyond code into our standard Commercial Lighting Rebate Program.
• Residential Refrigerator Rebates: Previously, SVP provided a rebate on the purchase of a new ENERGY STAR-qualified refrigerator if the old refrigerator was recycled through our program. Due to the increased efficiency of older refrigerators over the past 15 years and very little difference in energy consumption between ENERGY STAR-qualified and non-qualified refrigerators, very little energy savings can be achieved through this incentive program, so it was ended. Funds were redirected to a higher incentive for recycling old appliances, especially secondary appliances that are often the oldest and most unused refrigerators.
• Residential Refrigerator Recycling Program – This program ended when the program implementer, JACO Environmental, went out of business. An RFP was issued for a new program implementer, but no proposals were received so the program ended.
• Low Income Direct Install Program – This program had a first year budget of $200,000 for a direct install program that includes an energy audit, behavior education, and energy efficiency measures at no cost to qualifying customers and is targeted to those customers who average over 800 kWh/month and are on the FRAP program. Funds were not exhausted in the first year, so the program was renewed for a second year. Participation remained low, so the program was ended at the end of the contract term.
Program Highlight In this program year, the customized incentive programs, which includes the Customer Directed Rebate and the Data Center Program, had the largest impact toward our energy efficiency goals. The Customer Directed Rebate program is designed specifically to assist customers with energy efficiency projects that do not fit into our standardized programs. In both the Customer Directed Rebate and the Data Center Program, technical assistance is provided to help customers find customized solutions for their unique situations, and measurement and verification plans are developed and implemented in order to validate the energy savings. These programs require

significant “hands on” approach from SVP, but often result in significant energy savings. This year, a total of 22 custom projects falling under these two programs were implemented for a combined total of 15,284,965 gross kWh in energy savings. Program Descriptions
Res Lighting • Midstream LED Light Bulb Rebates: SVP offers an instant rebate per Energy Star LED bulb
1,000 lumens or greater. • HOA LED Light Bulb Rebates: SVP offers a rebate up to $10 per bulb on qualifying
Energy Star LED light bulbs installed in common areas of Homeowner’s Associations (HOA). Res Pool Pump • Pool Pump Rebate: SVP offers a $100 rebate for the installation of a qualifying variable
speed pool pump and controller. Res Refrigeration • Refrigerator Recycling: Rebate for recycling old refrigerators. (ended mid-program year) Res Cooling • Energy Star Ceiling Fan Rebates: Provides a rebate of $35 per fan (up to three fans per
residence) for the installation of Energy Star ceiling fans.
Res Water Heating • Electric Heat Pump Water Heater: Provides a rebate of up to $1,000 for replacing an
existing electric water heater with an Energy Star Heat Pump Water Heater. Non-Res Lighting • Commercial Lighting Rebates: This program provides rebates for energy efficient lighting
upgrades. Non-Res Cooling • Commercial HVAC Rebate program: This program provides a rebate on the purchase and
installation of new, more efficient air conditioners, HVAC systems, or heat pumps. • Controls Rebate Program: This is a performance-based incentive for controls systems
under a pilot rebate program. The incentive requires demonstrated energy savings over a 5 year period and will make payments annually upon submission of a verification report.
• VFD Rebate: This program provides a rebate on qualifying variable frequency motor drives.
• Enhanced Ventilation Controls Rebate: This program provides an incentive of $160 per ton for adding enhanced ventilation controls to HVAC rooftop packaged units 15 tons or smaller.
Non-Res Cooking & Non Res Refrigeration • Food Service Equipment Rebate: This program provides a rebate for the purchase of
qualifying energy-efficient commercial food service equipment. It includes a variety of equipment, including both cooking and refrigeration equipment.
Non-Res Process • Data Center Efficiency Program*: The program is targeted to data centers with IT server
loads greater than 350 kW or IT cooling loads greater than 100 tons. This program provides unique opportunities for energy-efficiency projects that may not otherwise fit into our standard rebate and customer assistance offerings.
• Uninterruptible Power Supply (UPS) Rebate: This program provides a rebate to customers who install Energy Star UPS equipment to protect enterprise servers, networking equipment, and large storage arrays.
• Plug Load Sensor Rebate: This program provides a rebate for smart power strips used in commercial facilities to reduce energy consumption from office equipment. *Data center projects under these programs may include cooling measures, among others. However, since this is the essential cooling of servers and not for comfort of people, we consider these to be process loads.
Non-Res Comprehensive • New Construction Rebate: This program provides an incentive to customers who exceed
Title 24 by at least 10% on non-residential new construction projects.
Other programs that fall into multiple categories, depending on the energy efficiency measures implemented:
• Public Facilities' Energy Efficiency Program: SVP provides technical assistance and financial incentives for the expansion, remodel, and new construction of City of Santa Clara buildings. Included in this program are higher levels of rebates for qualifying equipment, energy management assistance, and a small budget for retro commissioning.
• City Facilities Energy Efficiency Loan Program: This program provides loans for approved energy efficiency measures implemented at City of Santa Clara facilities. Loans are paid back via the utility bill through the reduction in energy consumption.
• Customer Directed Rebate: This program provides a rebate for energy efficiency projects that do not qualify for our other rebate program offerings, but have demonstrable energy savings.
Other programs educational in nature that do not fall into a category for energy savings:
• Business Audits: Free energy efficiency audits to business customers. • Residential In-Home Energy Audits and Education: Through this technical support program
SVP staff provides on-site audit analysis, energy efficiency recommendations and distributes energy saving items ("lime lite" night lights, outlet gaskets and switch plate thermometers). The Solar Explorer and the SVP information booth participate in major

city events, providing education on energy efficiency and solar electric generation systems.
EM&V Silicon Valley Power’s EM&V plan and reports for the past seven years can be found at http://www.ncpa.com/policy/reports/emv/. For FY 2015-2016 programs, SVP has opted to have its data center efficiency program evaluated by The Cadmus Group. This program was evaluated several years ago and significant changes were made to the program design. Our goal is to determine how well these changes have addressed the issues raised in the original evaluation of the data center efficiency program and further refine the program, if necessary. The report is anticipated to be ready by mid-March 2016 and will be posted with the previous reports on the NCPA website. The EM&V budget averages $75,000 per year, but actual spending varies, depending on the EM&V needs for the year. Sources of Energy Savings Silicon Valley Power uses the POU Technical Reference Manual (TRM) for its energy savings. This can be found at http://cmua.org/energy-efficiency-technical-reference-manual. The lighting calculator used for our commercial lighting rebates can also be found here. The exception to using the TRM is for custom projects, typically funded under our Customer Directed Rebate program, where no deemed values or savings calculators exist in the TRM. For those projects, the customer must submit an M&V plan to be approved by Silicon Valley Power, which may include the use of industry-accepted models or actual pre- and post-measurement data. Complimentary Programs
• Low-Income Programs: Our low income programs include a Rate Assistance Program, where qualified low-income customers receive a 25% discount on their electric bill (low-income program), as well as a Low Income Direct Install Program, which is described in the energy efficiency programs section of this report.
• Renewable Energy Programs:
o Santa Clara Green Power Program: Residents can purchase 100% renewable energy through this voluntary program. The cost for residents and small businesses is a penny and a half per kWh. Larger companies who do not wish to purchase 100% renewable energy may purchase in 1,000 kWh blocks. Block pricing can vary depending on the location of the resources (CA vs. Western U.S), the size of the purchase, and the duration of the purchase commitment.
o Residential Solar Photovoltaic Rebate: Provides significant financial incentive to
residential customers for installation of solar systems. Customers receiving the rebate are required to also complete an energy audit, as is the case with the statewide California Solar Initiative. The rebate started at $4.50 per watt and under a declining scale similar to the California Solar Initiative program, and is currently at $1.25 per watt, up to a maximum system size of 10 kW.

o Business Solar Photovoltaic Rebate: Provides financial incentives for the installation of solar systems at business sites. Rebate structure is designed to decline over time as more PV is installed in SVP’s service territory, similar to the California Solar Initiative program. Businesses can receive rebates up to a total of $300,000 per customer for systems up to 500 kW. While the rebates started at $3.00 per output watt, current rebate level have declined at the time of this report to $0.65 per watt. Businesses installing systems between 500kW and 1 MW are eligible for a Performance Based Incentive. These incentives started at $0.40 per kWh and are currently at a rebate level of $0.09 per kWh at the time of this report. SVP will stop accepting applications for systems over 50kW after December 31, 2016, but customers have up to one year from the date of application to install a system and performance incentives are paid over five years. Businesses are required to complete an energy audit in order to receive a rebate, as is the case with the statewide California Solar Initiative.
o Neighborhood Solar Program: SVP customers have the option to pay into a special
fund to support the installation of solar electric systems at non-profit community buildings. To date, installations have included PV systems at Haman Elementary School, Valley Village Retirement Community, Bill Wilson Center, Hope Services, St. Justin’s Parish, Our Lady of Peace Church, and the Muslim Community Association (MCA).
• Research, Development, and Demonstration:
o Emerging Technologies Grant: This program encourages businesses to demonstrate new products and product applications not yet commercially viable in today’s marketplace, install energy efficient technologies not generally known or widely accepted, yet show potential for successful market growth, successfully apply energy efficiency solutions in new ways, or introduce energy efficiency into industries or businesses that are resistant to adopting new technologies or practices.
o APPA DEED Program: Silicon Valley Power is a paying member of the American
Public Power Association (APPA) Demonstration of Energy and Efficient Design (DEED) and currently occupies a seat on the DEED Board. This program funds grants, internships and student scholarships to further R&D in the electric utility industry and support innovative applications of energy efficient or renewable technologies. Most recently, in Fiscal Year 2014-2015, SVP applied for and was awarded a DEED grant for a “Field demonstration and performance validation of a CO2 heat pump water heater/space heat combination system” in conjunction with Pacific Northwest National Laboratory. The remainder of the study is funded through Public Benefits Funds under the R&D budget. The study will began in the Fall of 2015 and be complete by May 2017. Silicon Valley Power was also recently awarded two additional grants, both of which have matching funds

coming from the Public Benefits Program. The first is for “Calibrated Modeling of Energy Savings of New High-Efficient Residential Window Covering”. This project will build on the work that the Pacific Northwest National Labs did with Bonneville Power Administration to validate the energy savings of new high-efficient residential window coverings and model the energy savings for the various climate zones so that these results may be considered in energy efficiency program planning across the country. The second project is focused on “Energy Efficient Air Management in Small Data Centers through the Use of Liquid Cooling in Servers”. This project is being conducted in conjunction with University of Washington, which will be modeling, designing and demonstrating a novel cooling solution for data centers. The project’s goal is to implement and prove the enabling of components for the liquid cooling of high heat density Central Processing Units (CPUs) and Graphics Processing Units (GPUs) that will meet the server industry’s requirements for RAS (Reliability, Availability, and Serviceability), cost, and size. Both of these projects are currently in the contract phase.
o California Lighting Technology Center (CLTC): Silicon Valley Power provides
financial support to the CLTC to further research and testing of emerging technologies in the area of lighting.
o Super-Efficient Dryer Initiative (SEDI): Silicon Valley Power provides financial
support to SEDI to further research and testing of emerging technologies in clothes dryers, such as the Energy Star Emerging Technology Award-winning Clothes Dryers, which came on the market within the last three years, and the Heat Pump Clothes Dryer, which became commercially available in the United States in 2015, and holds significant promise for energy savings.
• Electric Vehicles: Silicon Valley Power and the City of Santa Clara have invested in
Electric Vehicle charging stations for public and employee use at multiple City facilities. This includes the following:
Location Level 2 EV Chargers
Level 3 DC Fast Chargers
Central Park Library 1 1 Santa Clara Convention Center 5 1
Tasman Garage (across from Levi's Stadium)
48 1
City Hall 7 0 The purchase or lease of electric vehicles is currently under consideration by our Electric Vehicle Task Force.

• Energy Storage: State Law (Assembly Bill 2514) requires publicly owned utilities to evaluate the use of energy storage as an element of power supply plans by adopting an Energy Storage Procurement Plan. Prior to the City of Santa Clara’s adoption of its plan on August 19, 2014, Silicon Valley Power (SVP), the City of Santa Clara’s electric utility, reviewed various technologies and their relative cost effectiveness in the current marketplace. This review found that storage technologies were not cost effective in 2014 with the exception of large pumped hydro storage, which is very sensitive to particular geographic locations. To satisfy SVP’s obligations under state law, the City Council approved energy storage procurement targets in August 2014. Since that time, SVP staff has continued to meet with vendors and review the cost-effectiveness of energy storage technologies in Santa Clara. Staff put forward an internal strategy regarding demonstration and implementation plan. This implementation plan includes a three pronged effort to study and demonstrate energy storage in a variety of situations in the utility system. On December 20, 2016, Silicon Valley Power submitted an update to the California Energy Commission on its efforts to review and potentially adopt energy storage technologies in its territory. This update provides information on activities by SVP since the 2014 Energy Storage Procurement Plan was adopted and informationally provided to the CEC.

Silicon Valley Power Energy Efficiency Program Results
Silicon Valley
CategoryUnits
Installed
Gross Coincident
Peak Savings (kW)
Gross Annual Energy Savings
(kWh)
Gross Lifecycle Energy Savings
(kWh)
Net Coincident Peak Savings
(kW)
Net Annual Energy Savings
(kWh)
Net Lifecycle Energy Savings
(kWh)
Net Lifecycle GHG
Reductions (Tons)
Utility Incentives Cost
($)
Utility Mktg, EM&V, and
Admin Cost ($)
Total Utility Cost ($)
Utility ($/kWh)
Res Clothes Washers 20 7,680 77,936 5,915 59,498 30 $2,000 $17,881 $19,881 $0.43Res Cooling 1 56 560 56 560 $295 $994 $1,289 $2.98Res DishwashersRes ElectronicsRes HeatingRes Lighting 72 1,884 21,904 1,327 13,555 7 $837 $6,330 $7,167 $0.72Res Pool Pump 6 4,044 40,440 2,426 24,264 12 $600 $6,511 $7,111 $0.38Res Refrigeration 287 34 171,898 876,434 24 120,329 613,504 333 $14,185 $207,737 $221,922 $0.42Res Shell 10 1 1,510 15,100 423 4,228 2 $350 $2,978 $3,328 $1.02Res Water Heating 1 1,504 15,040 902 9,024 5 $899 $2,824 $3,723 $0.53Res ComprehensiveRes BehaviorNon-Res CookingNon-Res Cooling 38 75 5,418,516 81,277,740 63 4,605,739 69,086,079 38,443 $593,750 $155,430 $749,180 $0.02Non-Res HeatingNon-Res Lighting 9,771 195 1,654,640 21,168,620 168 1,415,106 18,105,928 10,034 $372,496 $90,872 $463,368 $0.04Non-Res Motors 3 332 2,315,379 34,730,685 282 1,968,072 29,521,082 15,699 $254,692 $134,001 $388,693 $0.02Non-Res PumpsNon-Res RefrigerationNon-Res Shell 1 46 828 46 828 $100 $759 $859 $1.60Non-Res Process 34 25 5,048,726 52,014,520 21 4,291,417 44,212,342 23,512 $490,670 $207,068 $697,738 $0.02Non-Res Comprehensive 11 709 7,322,887 109,843,305 6,224,454 93,366,809 51,954 $401,006 $1,024,608 $1,425,614 $0.02Non-Res BehaviorOther
10,255 1,371 21,948,770 300,083,112 560 18,636,212 255,017,701 140,032 $2,131,880 $1,857,994 $3,989,874 $0.02
T&DCodes and Standards
Total 10,255 1,371 21,948,770 300,083,112 560 18,636,212 255,017,701 140,032 $2,131,880 $1,857,994 $3,989,874
TRC Test 1.07 PAC Test 6.86 Excluding T&D
Resource Savings Summary Cost Summary

TRINITY PUBLIC UTILITY DISTRICT
Trinity Overview • Created in 1982 as a result of the Trinity River Division Act of 1955, in which Congress
provided mitigation for the economic devastation to the local economy resulting from the Act.
• The Congressional mitigation provides the Trinity River Public Utility District (TPUD) enough low cost and clean hydroelectric power to meet its entire load for the next several decades, but forbids the TPUD from selling any of the energy it does not need to meet load.
• Serves small economically depressed area in northern California consisting of approximately 7,500 meters in mountainous terrain covering an area the size of Delaware.
• TPUD is comprised of nine small substations serving 560 miles of distribution line. • TPUD has a peak coincident demand of approximately 25 megawatts, which may occur in
winter or summer. • More than 60 percent of TPUD’s load is residential and only two customers have a peak
demand of more than 150 kilowatts.
Program Descriptions • Weatherization Program: Provides incentives for installation of cost-effective
weatherization measures including insulation and energy efficient windows in electrically heated homes for all new buildings and major remodels, about 30 per year.
• High Efficiency Heat Pump Rebate Program: Provides incentives to replace wood stoves,
propane furnaces/heaters, and kerosene heating systems with high efficiency electric heat pumps (TPUD’s service territory has no natural gas availability).
• High Efficiency Electric Water Heater Rebate Program: Provides incentives to replace
propane water heaters with high efficiency electric water heaters.

Trinity Energy Efficiency Program Results, FY 2015-16
Trinity PUD
CategoryUnits
Installed
Gross Coincident
Peak Savings (kW)
Gross Annual Energy Savings
(kWh)
Gross Lifecycle Energy Savings
(kWh)
Net Coincident Peak Savings
(kW)
Net Annual Energy Savings
(kWh)
Net Lifecycle Energy Savings
(kWh)
Net Lifecycle GHG
Reductions (Tons)
Utility Incentives Cost
($)
Utility Mktg, EM&V, and
Admin Cost ($)
Total Utility Cost ($)
Utility ($/kWh)
Res Clothes WashersRes CoolingRes DishwashersRes ElectronicsRes HeatingRes LightingRes Pool PumpRes RefrigerationRes ShellRes Water Heating 87 1 56,607 566,070 33,964 339,642 182 $59,400 $5,740 $65,140 $0.25Res ComprehensiveRes BehaviorNon-Res CookingNon-Res CoolingNon-Res HeatingNon-Res LightingNon-Res MotorsNon-Res PumpsNon-Res RefrigerationNon-Res ShellNon-Res ProcessNon-Res ComprehensiveNon-Res BehaviorOther
87 1 56,607 566,070 33,964 339,642 182 $59,400 $5,740 $65,140 $0.25
T&DCodes and Standards
Total 87 1 56,607 566,070 33,964 339,642 182 $59,400 $5,740 $65,140
TRC Test 0.45 PAC Test 0.52 Excluding T&D
Resource Savings Summary Cost Summary

TRUCKEE DONNER PUBLIC UTILITY DISTRICT (TDPUD) Truckee Donner Public Utility District (TDPUD) At a Glance
• Climate Zone: 16 (winter, weekend, and holiday peaking electric utility) • Number of retail customer connections: 13,679 (89% residential) • CY16 total retail sales by customer class (i.e.; residential, commercial, industrial):
$23,015,204 with $12,636,812 residential and $10,378,392 commercial • CY16 total budget for energy efficiency programs (including EM&V, admin/overhead,
incentives): $848,831 • CY16 total amount actually expended for energy efficiency programs: $709,833 (note:
rises to $779,517 when counting expenditures on Electric Vehicle (EV) programs). Truckee Donner Public Utility District (TDPUD) Overview TDPUD serves electricity and water to the greater Truckee area comprised of approximately 44 square miles in eastern Nevada County and approximately 1.5 square miles in adjacent Placer County. TDPUD is governed by a locally elected Board of Directors consisting of 5 members with staggered 4-year terms and operates on a calendar year budget. TDPUD is a transmission-dependent utility within NV Energy’s control area and secures electric resources primarily through the Utah Associated Municipal Power System (UAMPS). TDPUD has been successful in the past in transitioning to renewable energy sources, keeping rates stable, and investing in accessible, cost-effective, energy efficiency programs. In 2016, TDPUD continued to invest in public benefit and electric vehicle programs spending over 4.2% of retail sales including 3.1% of retail sales spent directly on energy efficiency programs. TDPUD’s energy efficiency results included a first year E3 ‘Gross’ energy savings of 1.0% of retail sales, first year E3 ‘Net’ energy savings of 0.7% of retail sales, and TRC of 1.96. TDPUD continues to deliver significant, cost-effective results aided by a customer base that embraces energy efficiency and conservation along with innovative program designs. However, a large portion of current savings come from residential lighting (CFL’s and LED’s) and other lighting programs. Maintaining these saving levels, on paper, is becoming increasingly difficult due, in part, to saturation but mostly due to the dramatic reductions in gross savings due to the miss-application of codes & standards and ‘baseline savings’ to actual energy efficiency retrofits. This is particularly true with screw-in residential lighting (EPA standards) and small business/commercial lighting retrofits (EPA standards & Title 24). TDPUD treats energy efficiency as an electric resource (‘first loading order’) and is therefore motivated by actual savings. However, the E3 model does not consider actual savings and the E3 ‘Gross’ savings are based on codes & standard baselines (not what was actually replaced). Thus, the savings and associated cost-effectiveness from E3 understate the true value of the energy efficiency resource.

Major Program Changes • This is the second year that the EISA (Federal) lighting standards were applied as a
baseline to screw in bulb measures and TDPUD continues to see a dramatic change in associated Residential programs (~37% of our portfolio based on annual kWh savings).
• The E3 ‘Gross’ and ‘Net’ energy efficiency results that the TDPUD is able to claim in this report are diverging further and further away from the actual results. While our performance remains relatively strong, it is getting harder to justify the very high levels of spending based on cost-effective results. Furthermore, the costs and complexity of Title 24 are a major burden for small business/commercial lighting projects which constitutes the vast majority of TDPUD’s commercial customer base. This is causing our customers to either forgo projects, spread them out over multiple years to avoid the Title 24 thresholds, or do the project without pulling permits (and utility incentives).
• TDPUD’s energy efficiency results in the past had a strong commercial lighting component but the savings that we are able to claim continues to drop. The fact is that we still have a significant amount of older lighting technology in our community (T12’s, incandescent, etc.) which could be targeted for cost-effective retrofits but the inability to claim the full, actual savings makes these projects appear to not be cost-effective.
• TDPUD continues to invest in Staff and tools to make the delivery and tracking of our energy efficiency programs easy for the customer and more efficient for the utility. This includes a cloud-based program management tool with on-line rebate applications, improved website, and social media.
• TDPUD continues to invest in our most successful programs and to seek out new, cost-effective program opportunities. TDPUD is seeing strong demand for our point-of-sale LED program, residential LED lighting rebate, refrigerator recycle rebate, appliance rebates which offers increasing incentives for CEE Tiers 2 & 3, and Residential Energy Surveys. Customers have embraced LED lighting technology as shown by a continued increase in LED rebates and a decreased interest CFL’s.
• The funding for the energy efficiency programs increased slightly and spending remains very robust (3.1% of retails sales directly on energy efficiency programs). TDPUD did, in part due to diminishing returns in energy efficiency, move $69,684 into Plug-In Electric Vehicle (PEV) charging stations. The main expenditure was for a grant application to the CEC for DC Fast Charging on the I-80 corridor. Unfortunately, after significant effort and expense to submit the grant to the CEC, the CEC decided to give 100% of the grant funds to private charging networks and failed to give any funds to public-owned electric utilities in the last two grant cycles.
Program Highlight
• TDPUD’s energy efficiency results included a first year E3 ‘Gross’ energy savings of 1.0% of retail sales, first year E3 ‘Net’ energy savings of 0.7% of retail sales, and TRC of 1.96. As stated above, we believe these figures overstate the true cost of the energy efficiency resource. The portfolio performance is solid and overall costs remain at or below TDPUD’s cost to purchase and deliver power.

• TDPUD’s Residential Energy Survey’s remain a very popular program with customers. The ‘visual survey’ comes complete with over 20 free energy and water saving measures – including two free A19 LED bulbs - that are delivered at the end of the survey for free. This program allows customers to implement the ‘low hanging fruit’ immediately and the educational component empowers customers to pursue more complicated energy efficiency opportunities.
• Residential lighting remains a critical program area (TDPUD is 89% residential with a large number of vacation homes). TDPUD continues to effectively deliver residential lighting through our Residential Energy Survey’s, low-income program, at numerous events throughout the community, and at our office. The vast majority of light bulbs delivered to our customers is done face-to-face and the customers must ask for the light bulbs. As stated previously, customers have embraced LED lighting and favor it over the CFL technology.
• TDPUD’s LED Holiday Light Exchange remains very popular with ~3% of our customers visiting the conservation department in less than 1-month. Not only is the program cost-effective and very well received by our customers, but TDPUD takes the face-to-face opportunity to educate customers about other programs and to distribute free residential lighting.
Program Descriptions
• Residential Green Partner Lighting Program (Res Lighting): Encourages customers to replace incandescent and halogen light bulbs with energy efficient lighting by distributing, mostly in person and for free, 7-types of Compact Fluorescents (CFL’s) to customers who visit the TDPUD Conservation Department or at a local event. CFL give-a-ways include a 12-pack of 60-watt equivalent spiral CFLs and up to 12 mix-n-match specialty CFLs.
• Residential Lighting Rebate (Res Lighting): Encourages customers to replace incandescent and halogen light bulbs with energy efficient lighting by providing incentives for Compact Fluorescent ($2 per CFL) and Light Emitting Diode ($5 per LED Energy Star, $2 per LED non-Energy Star) screw-in or plug in lamps.
• Residential Energy Survey – RES (Res Lighting): Provides free residential energy surveys and free energy and water-saving measures including the installation of up to 24 energy efficient bulbs, and 2 low-flow shower heads at the time of survey. Customers are also informed about TDPUD conservation programs that they may benefit from and provided with associated literature.
• Residential Appliance Rebate (Appliance): Provides increasing incentives to customers to purchase more energy efficient appliances (clothes washers, dishwashers, and refrigerators) as identified by Energy Star and the Consortium for Energy Efficiency (CEE). Rebates range from $75 to $125.
• Refrigerator Recycle (Res Refrigeration): Promotes the recycling of older, working refrigerators and freezers by providing customers with free pick-up and a $30 rebate.
• LED Holiday Light Exchange (Res Lighting): Exchanges old incandescent holiday light strands with new, efficient Light Emitting Diode (LED) holiday strands for free. This one-for-

one exchange (up to 66 feet of light strands) starts on the Wednesday before Thanksgiving and runs while supplies last.
• Energy Saving Program – ESP, Income-Qualified (Res Lighting): Provides a one-time bill credit and a free residential energy survey to income qualified customers. Customers are qualified by an intermediary agency and are eligible for a one-time credit equal to their highest energy charge in the past 12-months (not to exceed $200) upon completion of the required Residential Energy Survey (RES).
• Watt Meter Loan (Not evaluated): Provides a free loan of a watt meter to help customers answer the question ‘How much energy does that 110 VAC device use?’. Includes information about plug-loads and how to manage their energy use.
• Residential Building Efficiency Rebates (Res Shell): Provides an incentive of up to $75 each for building envelope and/or duct air leakage tests and up to $250 (50% of project cost) each for building envelope or duct leakage mitigation.
• Thermally Efficient Windows Rebate (Res Shell): Provides an incentive of $5 per square foot of window to replace qualifying single-pane windows. Primary heating source must be a permanent electric space heating system.
• Water-Efficient Toilet Rebate (Non-Res Process): Encourages customers to replace high-water use toilets with low water use toilets (1.28 and 1.6 GPF) by providing increasing incentives for more efficient toilets. Rebates range from $25 to $100.
• Water-Efficient Toilet Exchange (Non-Res Process): Encourages customers to replace high-water use toilets with low 1.28 GPF water use toilets by offering a free toilet exchange or the option to apply a credit towards the purchase of any toilet carried by the exchange vendor that meets the program rules. Toilet exchange is conducted during regular business hours at a local toilet vendor.
• Customer Leak Repair Rebate (Non-Res Process): Provides a $100 incentive to help customers locate and repair a water leak on their property. Requires the use of a licensed contractor for the repairs.
• HE Clothes Washer Water Rebate (Non-Res Process): Provides a $50 incentive to customers who purchase a qualifying high water efficiency clothes washer. This is in addition to any applicable energy rebate.
• Residential Green Partners Water Program (Non-Res Process): Distributes, in person and for free, a variety of water saving measures to customers. Give-a-ways range from low-flow shower heads to sink aerators to hose spray nozzles.
• Patricia S. Sutton Conservation Garden (Not Evaluated): Promotes water-efficient landscaping by demonstrating, at the TDPUD’s headquarters, native and drought tolerant plants, hardscaping/mulching techniques, and efficient irrigation. Plant lists, design, and materials used in the project are all available via a web-based resource at www.tdpud.org.
• Conservation Garden Party and Water-Wise Gardening Lecture Series (Not Evaluated): Encourages water-efficient gardening via lectures, access to local resources, and demonstrations.

• Neighborhood Resource Mobilization (Res Lighting): Delivers, through collaboration between a dozen local agencies, conservation programs directly to customers in a neighborhood block-party format.
• School Conservation Education (Res Lighting): Promotes energy and water conservation through an innovative series of programs designed to both educate students and deliver, for free, energy and water savings measures. 2016 handouts included a free LED A19 bulb for every elementary and middle school student in TDPUD’s service territory.
• Business Green Partners Lighting Program (Non-Res Lighting): Provides energy efficient screw-in compact fluorescent (CFL) and light emitting diode (LED) bulbs, free of charge, to replace existing incandescent and halogen bulbs. TDPUD conservation specialist visits business to evaluate lighting needs and provide solutions.
• Commercial Lighting Rebate (Non-Res Lighting): Provides incentives to commercial customers for replacing inefficient lighting equipment with high efficiency lighting. Customers may receive a rebate equal to 1/3 of project cost (up to $10,000) for replacing old linear fluorescent fixtures with reduced wattage T8 fluorescent or LED fixtures. Other lighting retrofits may qualify for a rebate equivalent to projected first year energy saving.
• Commercial Refrigeration (Non-Res Refrigeration): Provides energy-efficient refrigeration controls, motors, case lighting, and infiltration barriers. Customers receive a comprehensive refrigeration energy audit and proposal for energy efficient refrigeration measures from TDPUD’s installation contractor. Once the proposal is accepted the measures are installed at no charge.
• Commercial Custom Rebate (Non-Res Process): Provides incentives to commercial electric customers for replacing inefficient plant equipment with high efficiency equipment. Customers may receive a rebate equal to the projected first year energy savings.
• Green Building (Not Evaluated): Promotes green building standards and techniques through collaboration with and support of local agencies and non-profits.
• Business Green Partners Water Program (Not Evaluated): Distributes to business and commercial customers free water saving measures including pre-rinse spray valves, faucet aerators and shower heads. Custom water-saving projects are evaluated for cost-effectiveness, peak reduction, and opportunities to demonstrate new technologies.
EM&V TDPUD operates on a calendar-year for financials and we strive to deliver our completed E3 model and EM&V reports by the March 15th deadline for this report. This is a very short time-frame (2 ½ months) but the alternative of presenting EM&V results more than a year after program completion would not allow for timely feedback and program improvements. It should be noted that, given this timeframe, TDPUD does occasionally make minor adjustments to the E3 model presented in this report and the final results in the EM&V report. TDPUD has been conducting EM&V on an annual basis since 2008 and plans to continue to do so. The budget for EM&V is ~$30,000 per year which is ~4% of program spending. TDPUD’s EM&V reports can be found at http://www.tdpud.org/departments/conservation/em-v-and-reporting.

Sources of Energy Savings TDPUD used a variety of sources for energy savings estimates including, but not limited to, California Municipal Utilities Association TRM, Pennsylvania TRM, Regional Technical Forum UES, DEER, and utility work papers. TDPUD EM&V reports can be found at (http://www.tdpud.org/departments/conservation/em-v-and-reporting). Complimentary Programs
• Low-Income Programs: The TDPUD’s income-qualified program, Energy Saving Program (ESP), was also described in the Program Descriptions as the participation requires that customers also implement energy efficiency measures. ESP provides a one-time bill credit and a free residential energy survey to income qualified customers. Customers are qualified by an intermediary agency and are eligible for a one-time credit equal to their highest energy charge in the past 12-months (not to exceed $200) upon completion of the required Residential Energy Survey (RES). TDPUD’s income-qualified program achieves a solid return on investment for both the customer and utility.
• Renewable Energy Programs: TDPUD has a successfully fully subscribed our SB1 Solar Rebate program for our customers. TDPUD also achieved an estimated 50% Renewable Portfolio Standard (RPS) in 2016 using the methodology defined by the California Energy Commission. This number would be higher if we considered carbon-free resources. TDPUD has been able to transition our energy resource portfolio from primarily fossil fuel based in 2008 to a diversified mix that includes wind, solar, landfill gas, and small hydro while maintaining stable and competitive rates.
• Research, Development, and Demonstration: It is not practical for a small utility like TDPUD to run direct RD&D programs. However, through the Northern California Power Agency, TDPUD does participate in the American Public Power Associations DEED R&D program, the FLEX lab project and TDPUD Staff does investigate new energy and water conservation products and programs. TDPUD is also exploring public access charging stations for plug-in electric vehicles and is testing an all-electric Toyota Rav4 in our fleet.
• Electric Vehicles: TDPUD installed two Plug-In Electric Vehicle (PEV) public access charging stations locations in 2015. Each location is monetized and has two, Level 2 PEV charging stations and are open to the public. One location is in the Truckee Train Depot in historic downtown Truckee and the other is located in the Pioneer Commerce Center. TDPUD has partnered with the Tahoe Regional Planning Agency (TRPA) on a Truckee-Tahoe PEV Readiness Plan and TRPA received a $200,000 grant from the California Energy Commission (CEC). TDPUD expended significant resources submitting a grant application to the new CEC GFO-15-603 “DC Fast Chargers for California’s Interregional Corridors”. Unfortunately, despite having a grant application that did meet the CEC’s requirements, the CEC did not fund TDPUD and – for the second grant cycle in a row – gave 100% of the awards to private charging networks.
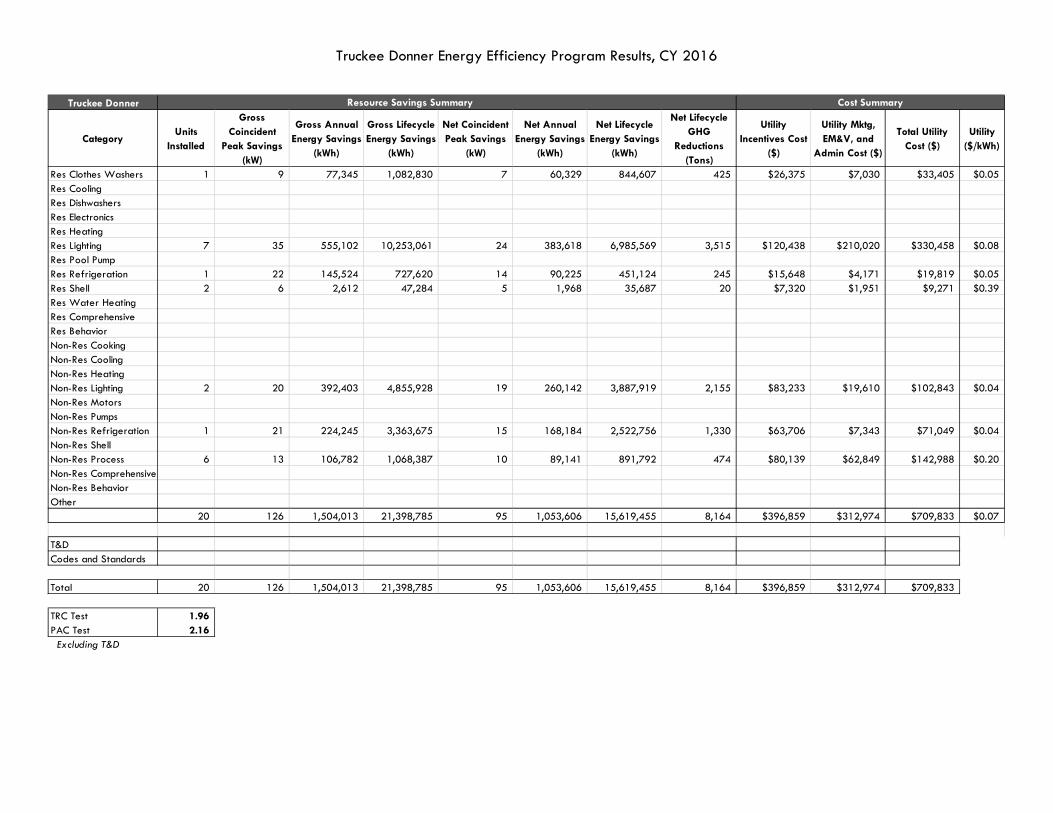
Truckee Donner Energy Efficiency Program Results, CY 2016
Truckee Donner
CategoryUnits
Installed
Gross Coincident
Peak Savings (kW)
Gross Annual Energy Savings
(kWh)
Gross Lifecycle Energy Savings
(kWh)
Net Coincident Peak Savings
(kW)
Net Annual Energy Savings
(kWh)
Net Lifecycle Energy Savings
(kWh)
Net Lifecycle GHG
Reductions (Tons)
Utility Incentives Cost
($)
Utility Mktg, EM&V, and
Admin Cost ($)
Total Utility Cost ($)
Utility ($/kWh)
Res Clothes Washers 1 9 77,345 1,082,830 7 60,329 844,607 425 $26,375 $7,030 $33,405 $0.05Res CoolingRes DishwashersRes ElectronicsRes HeatingRes Lighting 7 35 555,102 10,253,061 24 383,618 6,985,569 3,515 $120,438 $210,020 $330,458 $0.08Res Pool PumpRes Refrigeration 1 22 145,524 727,620 14 90,225 451,124 245 $15,648 $4,171 $19,819 $0.05Res Shell 2 6 2,612 47,284 5 1,968 35,687 20 $7,320 $1,951 $9,271 $0.39Res Water HeatingRes ComprehensiveRes BehaviorNon-Res CookingNon-Res CoolingNon-Res HeatingNon-Res Lighting 2 20 392,403 4,855,928 19 260,142 3,887,919 2,155 $83,233 $19,610 $102,843 $0.04Non-Res MotorsNon-Res PumpsNon-Res Refrigeration 1 21 224,245 3,363,675 15 168,184 2,522,756 1,330 $63,706 $7,343 $71,049 $0.04Non-Res ShellNon-Res Process 6 13 106,782 1,068,387 10 89,141 891,792 474 $80,139 $62,849 $142,988 $0.20Non-Res ComprehensiveNon-Res BehaviorOther
20 126 1,504,013 21,398,785 95 1,053,606 15,619,455 8,164 $396,859 $312,974 $709,833 $0.07
T&DCodes and Standards
Total 20 126 1,504,013 21,398,785 95 1,053,606 15,619,455 8,164 $396,859 $312,974 $709,833
TRC Test 1.96 PAC Test 2.16 Excluding T&D
Resource Savings Summary Cost Summary
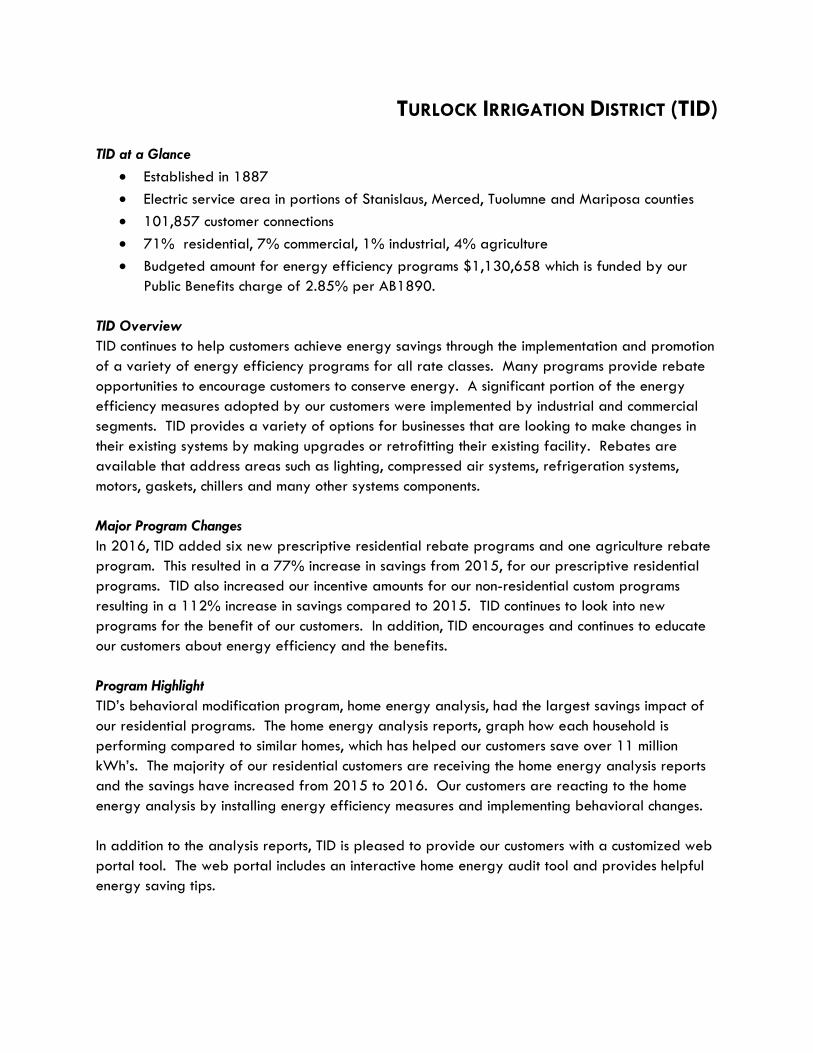
TURLOCK IRRIGATION DISTRICT (TID) TID at a Glance
• Established in 1887 • Electric service area in portions of Stanislaus, Merced, Tuolumne and Mariposa counties • 101,857 customer connections • 71% residential, 7% commercial, 1% industrial, 4% agriculture • Budgeted amount for energy efficiency programs $1,130,658 which is funded by our
Public Benefits charge of 2.85% per AB1890.
TID Overview TID continues to help customers achieve energy savings through the implementation and promotion of a variety of energy efficiency programs for all rate classes. Many programs provide rebate opportunities to encourage customers to conserve energy. A significant portion of the energy efficiency measures adopted by our customers were implemented by industrial and commercial segments. TID provides a variety of options for businesses that are looking to make changes in their existing systems by making upgrades or retrofitting their existing facility. Rebates are available that address areas such as lighting, compressed air systems, refrigeration systems, motors, gaskets, chillers and many other systems components. Major Program Changes In 2016, TID added six new prescriptive residential rebate programs and one agriculture rebate program. This resulted in a 77% increase in savings from 2015, for our prescriptive residential programs. TID also increased our incentive amounts for our non-residential custom programs resulting in a 112% increase in savings compared to 2015. TID continues to look into new programs for the benefit of our customers. In addition, TID encourages and continues to educate our customers about energy efficiency and the benefits. Program Highlight TID’s behavioral modification program, home energy analysis, had the largest savings impact of our residential programs. The home energy analysis reports, graph how each household is performing compared to similar homes, which has helped our customers save over 11 million kWh’s. The majority of our residential customers are receiving the home energy analysis reports and the savings have increased from 2015 to 2016. Our customers are reacting to the home energy analysis by installing energy efficiency measures and implementing behavioral changes. In addition to the analysis reports, TID is pleased to provide our customers with a customized web portal tool. The web portal includes an interactive home energy audit tool and provides helpful energy saving tips.

Commercial, Industrial and Agricultural Customer Programs
• Meter Manager: TID offers an on-line energy management tool for business customers so they can monitor their energy usage and utilize that information to more efficiently manage their energy consumption simply by logging into a secure web site.
• Energy Audits: TID offers free on-site energy audits to commercial, industrial and agricultural customers who have concerns, questions or an interest in implementing measures to manage their energy usage and reduce consumption.
• Commercial, Industrial, Agricultural Energy Efficiency Rebates: TID offers rebates along with comprehensive technical support for all commercial, industrial and agricultural customers to promote the purchase and installation of commercial equipment and systems that support and enhance load reduction.
• Commercial Rebate Programs: TID offers customers rebates for purchasing and installing: o Commercial Motors o Commercial Refrigeration o Network PC Management Software o Commercial Lighting o Advance Power Strip o Residential New Construction o Agricultural Irrigation Pump *
Residential Customer Programs
• Home energy analysis: TID supplies our residential customers, a home energy analysis (HEA) report each month. The HEA provides the customer with information regarding their monthly usage compared to similar homes in our community or compared to their prior year(s) usage. In addition, a web portal gives our customers access to customize their home energy use, using the energy audit tool, and access to helpful energy saving tips.
• Residential Energy Audits: TID provides free in-home energy audits to customers who would like to learn how to reduce their energy use.
• Residential Rebate Programs: TID offers customers rebates for purchasing and installing: o Energy Star Refrigerator o Energy Star Room AC o Energy Star Clothes Washer o Whole House Fan o Shade Screens o Radiant Barrier o Solar Attic Fan o Energy Star Pool Pump* o Energy Star Ductless Mini Split Air Conditioner* o Central Air Conditioner* o High Efficiency Central Air Conditioner* o Central Heat Pump*

o LED* * Programs added in January 2016 • Shade Tree Rebate: TID provides rebates for up to 3 trees per year that are planted to
provide shade. • New Construction Rebate: TID offers a rebate to home builders for exceeding Title 24
energy standards. EM&V TID is currently working on our 2014, 2015 & 2016 EM&V. TID has partnered with Modesto Irrigation District and Merced Irrigation District to have one report generated for our combined utilities. Since TID, MID and MeID have similar projects and similar customers a combined report provides economies of scale for each utility. Our 2013 EM&V is available at: http://www.ncpa.com/wp-content/uploads/2015/09/Merced-Modesto-Turlock-EMV-2015-Final.pdf Sources of Energy Savings TID has primarily used the Technical Reference Manual to determine our savings. The majority of our commercial and industrial savings are driven by lighting projects. TID calculates the savings for each project, since our lighting rebate is paid by first year kWh savings. TID calculates the cost effectiveness using levelized utility cost for each program and as an overall portfolio. In 2016, our portfolio utility cost was $.02/kWh. Complimentary Programs
• Assistance Program: o TID CARES Program: An energy assistance program for qualified customers to receive
a discount on their monthly energy bills. The CARES program reduces the monthly customer charge of $17 to $6, a savings $11, and provides a 15% discount on the first 800 kWh energy charges.
o Medical Rate Assistance: The District provides a 50% discount on the first 500-kWh energy charges for customers who use additional energy due to life-support equipment or a medical condition.
o Weatherization: TID has contracted with organizations within our community to provide weatherization services for families who meet the income qualification guidelines. The program enables families to reduce their energy bills by making their homes more energy efficient.
o Window Replacement: TID has a program to provide replacement of inefficient windows for families who meet the income qualification guidelines. The program allows customers to purchase windows for a discounted amount and install on their own. Assistance is available for those are unable to install.

• Renewable Energy: o Tuolumne Wind Project: TID purchased a 136.6 megawatt wind facility in 2008 o Solar: TID offered solar rebates for residential customers that are interested. o Solar: In 2009, TID installed a 70.7 kW array of photovoltaic panels atop the
newly renovated parking structure. o Small Hydroelectric: TID was the first in California to construct small-scale
hydroelectric power plants using its own canal system and those of neighboring irrigation districts that were not in the retail electric business. Combined the eight plants constructed, beginning in the mid 1970’s provide a total of 20 megawatts of electric power. TID also owns and operates a 5 megawatt hydroelectric power plant at La Grange Dam on the Tuolumne River.
o Geothermal: In 1984, TID acquired an interest in a geothermal power plant in the Geysers Steam Field located in California’s Lake County. The project has a capacity of generating 6.8 megawatts.
o In November of 2015, TID executed a 20 year Purchase Power Agreement for the full output of a 54 MW solar facility. The facility is currently under construction, and is expected to start generating mid-2017.

Turlock Energy Efficiency Program Results, CY 2016
Turlock ID
CategoryUnits
Installed
Gross Coincident
Peak Savings (kW)
Gross Annual Energy Savings
(kWh)
Gross Lifecycle Energy Savings
(kWh)
Net Coincident Peak Savings
(kW)
Net Annual Energy Savings
(kWh)
Net Lifecycle Energy Savings
(kWh)
Net Lifecycle GHG
Reductions (Tons)
Utility Incentives Cost
($)
Utility Mktg, EM&V, and
Admin Cost ($)
Total Utility Cost ($)
Utility ($/kWh)
Res Clothes Washers 290 39,730 437,030 12,316 135,479 68 $10,150 $275 $10,425 $0.10Res Cooling 14,183 43 89,528 1,581,524 29 53,879 966,049 595 $142,908 $4,828 $147,736 $0.24Res DishwashersRes ElectronicsRes Heating 59 4 8,015 120,218 3 6,412 96,174 59 $6,300 $515 $6,815 $0.10Res Lighting 1,398 55,573 688,695 30,070 372,808 188 $10,228 $747 $10,976 $0.04Res Pool Pump 85 3 57,290 572,900 2 34,374 343,740 173 $17,000 $700 $17,700 $0.07Res Refrigeration 250 2 45,376 529,928 1 31,763 370,950 201 $15,689 $998 $16,687 $0.06Res ShellRes Water HeatingRes Comprehensive 66,308 6,907,804 6,917,296 6,907,329 6,914,923 3,902 $181,335 $22,379 $203,713 $0.03Res BehaviorNon-Res CookingNon-Res Cooling 1 260,151 3,902,265 208,121 3,121,812 1,898 $20,812 $15,645 $36,457 $0.02Non-Res HeatingNon-Res Lighting 120 5,609,923 83,978,409 5,586,014 83,619,777 46,341 $663,119 $247,597 $910,716 $0.02Non-Res MotorsNon-Res PumpsNon-Res Refrigeration 2 44,665 425,843 39,782 401,430 212 $2,550 $1,032 $3,582 $0.01Non-Res ShellNon-Res Process 3 354,004 3,751,051 338,801 3,599,014 1,914 $28,320 $9,248 $37,568 $0.01Non-Res Comprehensive 2 131,487 657,436 105,190 525,949 293 $10,519 $1,629 $12,148 $0.03Non-Res BehaviorOther
82,701 51 13,603,546 103,562,594 35 13,354,051 100,468,104 55,843 $1,108,931 $305,591 $1,414,522 $0.02
T&DCodes and Standards
Total 82,701 51 13,603,546 103,562,594 35 13,354,051 100,468,104 55,843 $1,108,931 $305,591 $1,414,522
TRC Test 2.38 PAC Test 8.41 Excluding T&D
Resource Savings Summary Cost Summary

CITY OF UKIAH City of Ukiah At a Glance
• Climate Zone: 2 • Number of retail customer connections: 7,788 • FY15-16 total retail sales by customer class (residential 5,008,108 kWh,
commercial/industrial 9,097,021 kWh) • FY15-16 total budget for energy efficiency programs (including EM&V, admin/overhead,
incentives): $110,000 • FY15-16 total amount actually expended for energy efficiency programs: $92,901
City of Ukiah Overview The City of Ukiah (the City) remains committed to helping their customers manage energy use through energy education and a comprehensive menu of energy efficiency incentives. The City‘s customer base has not typically responded well to a “standard” energy efficiency incentive program. The main reason for this is many customers do not have the discretionary income to fund energy efficiency projects. The City works to overcome this barrier by offering generous incentives to customers to persuade them to participate. However, even with generous incentives, participation in the commercial lighting program was still down in FY2016. Residential and commercial customers enthusiastically participate when the cost of their energy efficiency projects are covered in full by the City’s incentive programs. The City includes seasonal energy saving tips with their customer’s energy bills in order to increase awareness and promote energy education. Major Program Changes For several years, the City’s energy efficiency programs had been operating with a balance forward on a year to year basis. In FY16, that was not the case. In FY16, the balance being carried forward in the PB funds had been expended. Moving forward, rebate amounts and rebate caps were also restructured in attempt to make available funding stretch to serve more customers and more projects. The result is that customer co-pay requirements increased which reduced participation in Ukiah’s EE programs. In FY16, EE programs acquired 112,854 kWhs, or 25% the adopted 448,000kWh energy efficiency goals. Since FY11, the City has acquired 145% of the adopted energy efficiency targets. Program Highlight The Commercial Lighting Program delivered the greatest percentage of savings in FY16, accounting for 86% of the total savings. The City has worked diligently over the years to build a network of lighting contractors and strived to keep them engaged in the program. Program Descriptions The City manages a comprehensive energy efficiency incentive program for residential and commercial customers focusing on energy efficiency and peak load reduction. For residential customers, rebates are offered for the installation of various energy efficiency measures, such as

lighting, HVAC, appliances, and weatherization. For commercial customers, rebates are available for upgraded lighting, HVAC, appliances, refrigeration equipment, electronics, and in cases where an analysis is performed rebates can be offered for additional equipment that reduces energy use and/or demand. On-site energy audits are provided by the City energy specialists. Energy efficiency measures are recommended and additional visits are completed upon request.
• Residential Lighting [Res Lighting]: The City offers rebates to homeowners who install ENERGY STAR® qualified LED lamps/bulbs, ceiling fans and LED holiday lights.
• Residential HVAC [Res Cooling]: The City offers rebates to homeowners who install high performance heat pumps and air-conditioners, or evaporative coolers that exceed current state requirements. The City also offers a rebate for duct sealing when not required by code.
• Residential Equipment [Res Clothes Washers; Res Dishwashers; Res Pool Pump; Res Refrigeration; Res Electronics]: The City offers rebates to homeowners who purchase new ENERGY STAR qualified products, including clothes washers, dishwashers, pool pumps, refrigerators and advanced power strips. Rebates are also available for refrigerator and freezer recycling.
• Residential Weatherization [Res Shell]: The City offers rebates to homeowners who invest in weatherizing their homes, including attic and wall insulation, window treatments/replacement, solar attic fans, and air sealing.
• Residential Water Heater Rebate [Res Water Heating]: The City offers rebates to homeowners who purchase a new, energy efficient electric water heater.
• Commercial Lighting [Non-Res Lighting]: The City offers rebates to business owners who invest in the installation of energy efficiency lighting upgrades. There is a prevalence of inefficient lighting throughout the city instead of more efficiency fluorescent or LED fixtures.
• Commercial Custom [Non-Res Comprehensive]: The City offers rebates to business owners based on site-specific consumption. Rebates are tailored to the individual business owner’s needs based on the audit and the potential energy savings associated with the customer project.
EM&V The City has budgeted $5,000 in FY2017 for evaluation of our programs. The City is currently exploring the opportunity of partnering with a group of other NCPA utilities on this EM&V effort to gain economies of scale. Sources of Energy Savings For FY16, the City has relied heavily on the savings listed in the Technical Resource Manual. The Commercial Lighting and Commercial Custom programs use custom savings calculations. Complimentary Programs
• Low-Income Programs: The City offers a low-income bill assistance program to eligible customers

• Renewable Energy Programs: The City currently offers a Solar Photovoltaic rebate program as described in SB1 legislation. The City is evaluating what, if any solar PV programs will be offered after the SB1 legislation expired on December 31, 2016.
• Electric Vehicles: In addition to the 8 Tesla Fast Charging stations, the Electric Utility is planning placement of Level II chargers at strategic locations throughout the City.
• Energy Storage: The City is participating in the NCPA/SCPPA joint contract with DNV GL to provide an updated evaluation of energy storage technologies and their cost effectiveness to the electric consumer.

Ukiah Energy Efficiency Program Results, FY 2015-16
Ukiah
CategoryUnits
Installed
Gross Coincident
Peak Savings (kW)
Gross Annual Energy Savings
(kWh)
Gross Lifecycle Energy Savings
(kWh)
Net Coincident Peak Savings
(kW)
Net Annual Energy Savings
(kWh)
Net Lifecycle Energy Savings
(kWh)
Net Lifecycle GHG
Reductions (Tons)
Utility Incentives Cost
($)
Utility Mktg, EM&V, and
Admin Cost ($)
Total Utility Cost ($)
Utility ($/kWh)
Res Clothes Washers 5 1,420 15,620 440 4,842 2 $500 $1,042 $1,542 $0.42Res Cooling 9,612 3 6,790 122,192 2 5,432 97,753 59 $11,158 $9,292 $20,450 $0.32Res Dishwashers 7 406 4,060 244 2,436 1 $350 $526 $876 $0.47Res ElectronicsRes HeatingRes Lighting 166 3,393 50,895 1,832 27,483 14 $837 $5,135 $5,972 $0.31Res Pool PumpRes Refrigeration 15 1 5,917 35,828 1 4,142 25,079 14 $1,450 $7,363 $8,813 $0.43Res Shell 14,711 8,164 163,008 2,286 45,642 26 $11,681 $2,373 $14,054 $0.49Res Water Heating 1 165 1,650 99 990 1 $100 $223 $323 $0.42Res ComprehensiveRes BehaviorNon-Res CookingNon-Res Cooling 16 1 1,331 19,967 1 1,131 16,972 10 $1,175 $417 $1,591 $0.14Non-Res HeatingNon-Res Lighting 1 29 121,560 1,458,723 23 97,248 1,166,978 647 $24,069 $15,211 $39,280 $0.05Non-Res MotorsNon-Res PumpsNon-Res RefrigerationNon-Res ShellNon-Res ProcessNon-Res ComprehensiveNon-Res BehaviorOther
24,534 34 149,146 1,871,942 27 112,854 1,388,176 774 $51,319 $41,582 $92,901 $0.09
T&DCodes and Standards
Total 24,534 34 149,146 1,871,942 27 112,854 1,388,176 774 $51,319 $41,582 $92,901
TRC Test 1.26 PAC Test 1.83 Excluding T&D
Resource Savings Summary Cost Summary
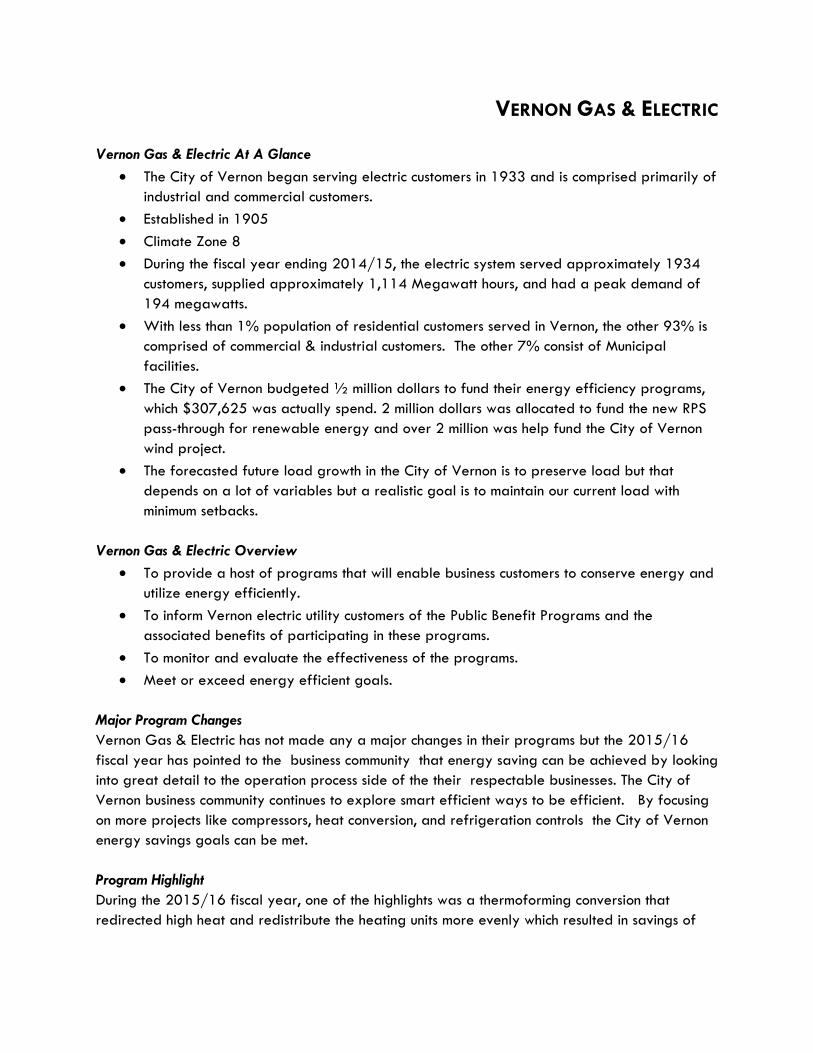
VERNON GAS & ELECTRIC Vernon Gas & Electric At A Glance
• The City of Vernon began serving electric customers in 1933 and is comprised primarily of industrial and commercial customers.
• Established in 1905 • Climate Zone 8 • During the fiscal year ending 2014/15, the electric system served approximately 1934
customers, supplied approximately 1,114 Megawatt hours, and had a peak demand of 194 megawatts.
• With less than 1% population of residential customers served in Vernon, the other 93% is comprised of commercial & industrial customers. The other 7% consist of Municipal facilities.
• The City of Vernon budgeted ½ million dollars to fund their energy efficiency programs, which $307,625 was actually spend. 2 million dollars was allocated to fund the new RPS pass-through for renewable energy and over 2 million was help fund the City of Vernon wind project.
• The forecasted future load growth in the City of Vernon is to preserve load but that depends on a lot of variables but a realistic goal is to maintain our current load with minimum setbacks.
Vernon Gas & Electric Overview
• To provide a host of programs that will enable business customers to conserve energy and utilize energy efficiently.
• To inform Vernon electric utility customers of the Public Benefit Programs and the associated benefits of participating in these programs.
• To monitor and evaluate the effectiveness of the programs. • Meet or exceed energy efficient goals.
Major Program Changes Vernon Gas & Electric has not made any a major changes in their programs but the 2015/16 fiscal year has pointed to the business community that energy saving can be achieved by looking into great detail to the operation process side of the their respectable businesses. The City of Vernon business community continues to explore smart efficient ways to be efficient. By focusing on more projects like compressors, heat conversion, and refrigeration controls the City of Vernon energy savings goals can be met. Program Highlight During the 2015/16 fiscal year, one of the highlights was a thermoforming conversion that redirected high heat and redistribute the heating units more evenly which resulted in savings of

298,203 KWh and 136 KW. But more importantly, the customer was able be more efficient and increase productivity. For a small business to accomplish this feat meant volumes. . Program Descriptions
• Customer Incentive Program: Fund the exploration and implementation of energy efficient technologies and equipment, such as lighting technologies, variable speed drives, air compressors, motors, refrigeration, and air conditioning. Provide cash incentives to businesses that install energy efficient technologies.
• Customer-Directed Program: Fund customized projects demonstrating energy and cost savings and/or commercial market potential in the area of energy efficiency. Customers must fund at least 25 percent of total project cost. Projects are only eligible if they do not qualify for any of the other programs.
• Energy Education & Demonstration Workshops: Provide customers with an array of information resources to encourage energy efficiency measures through energy efficiency workshops and other forms of customer outreach.
• Energy Audit Program: Provide on-site audits for commercial/industrial businesses. A comprehensive audit includes an analysis of energy usage and costs, identification of energy conservation measures, and recommended actions.
• Time of Use Rate Programs: All customers loads exceeding 100 kilowatts demand are eligible to receive time-of-use rate; enabling them to reduce their energy cost through time management of their energy usage.
EM&V The City of Vernon continues to have numerous projects this past fiscal year which require an in depth analysis of the energy, measurement & verification of their projects to prove the validity of the energy savings. Since we have the distinctiveness of being a small commercial/industrial city, we can provide smart and efficient reports to our customers proving their worth. Sources of Energy Savings VG & E uses internal staff to confirm Post data, in conjunction using third-party & EM & V reports for verifications related to energy savings. Complimentary Programs
• Renewable Energy Programs: Ongoing program o City of Vernon Renewable Portfolio Standard (RPS) Pass-Through
Procurement of renewable energy is one of the programs eligible for funding from public benefits charges. On June 19, 2012 City Council approved resolution No., 2012-97 authorizing the allocation of $2 million per year of the funds derived from the public benefits charge to offset the renewable power cost pass-through to customers.

The ‘Renewable Portfolio Standard (RPS) Pass-Through’ is a tariff mechanism designed to recover the cost of complying with California environmental laws governing the use of renewable energy supplies by power generating facilities statewide. It consists of two costs components: incremental renewable power cost and net greenhouse gas cost. The incremental renewable power cost reflects the cost of renewable energy and fuels reduced by the cost of conventional power in the base rates and credits for AB 1890 funds authorized to offset the cost of pass-through to customers.
• Research, Development, and Demonstration: The City of Vernon Tehachapi wind energy on-going project located in Kern County, California is moving forward but the City is still collecting data, reviewing/addressing environmental issues, and discussing permitting with federal and local agencies. This particular project is a huge undertaking in scope which requires the City’s due diligences to make this venture successful. This project is continuing which requires a lot patience’s for this size of project.
• Solar Incentive Program
VG&E just completed a 476 KW AC system that went on-line and is planning on three more solar systems in 2017.
• Vernon Demand Reduction Program
Interruptible service provides: Can reduce 12.65 MW within 30 minutes in case of emergencies.
Reliable Power In April of 2016, Vernon Gas & Electric was awarded the prestigious Diamond Level designation of Reliable Public Power Provider (RP3) from the American Public Power Association (APPA). VG&E earned this accolade by providing exceptionally reliable and safe electric service. The department compiled a 1400 page submission that was scrutinized by industry experts. The RP3 distinction recognizes public power utilities that demonstrate proficiency in four key disciplines: reliability, safety, workforce development, and system improvement. VG&E is one of just 8 utilities among over 2,000 public power utilities in the U.S. achieving Diamond level recognition for this 3 year period. Vernon Gas & Electric ranks in the top 10% for electric system reliability in the US according to a nation-wide benchmarking study that utility participates in annually. VG&E serves essential and dependable gas, electric and fiber resources to the City’s business community at very competitive rates in comparison to neighboring utility providers. The City owned and operated utility systems has a well established, strong, history of reliability, capable of efficiently and serving the needs of the City’s unique business community.

Integrated Resource Plan VG&E utilizes an Integrated Resource Plan (IRP) to identify, evaluate and procure its power supply needs. The goal of the IRP is to provide a long term strategy to meet the Vernon’s future electric needs. As such, the plan designates the amount, timing, and type of resources that achieve this goal in accordance with applicable the standards, while reducing greenhouse gas emission standards. These challenges must be met while safeguarding energy costs affordable to retail customers. The plan provides information associated with resource acquisitions to meet the future electricity demand of the customer base, including capacity and energy supply resources, renewable energy and demand side management. In this context, VG&E’s power system and compliance with regulatory and legislative mandates:
• Provides reliable and affordable energy to ratepayers; • Maintains compliance with all laws and regulations governing VG&E and pertinent
business activities; • Continues to pursue and implement energy efficiency and demand side management
programs that are cost effective and achieve demand reduction. • Reduces greenhouse gas emissions to fully comply with California law as enacted by
Senate Bill 350, “the Clean Energy and Pollution Reduction Act of 2015” (SB 350), which mandates Greenhouse Gas (GHG) emissions reduction in California of 40 percent from 1990 by 2030;
• Increase the amount of qualifying renewable energy resources in its power supply portfolio to 50% of total energy by 2030.
VG&E has acquired multi-year contracts for solar and landfill gas power generation to satisfy the RPS requirement as required by the State of California and Senate Bill X1 2. With the addition of these resources, the proportion of the overall portfolio supplied by bundled renewable energy will enable the City to attain an RPS of 33% by 2020, as required by Senate Bill x1 2. VG&E will continue to procure additional resource to meet Vernon’s long-term goal of reaching an RPS of 50% by 2030 as required by Senate Bill 350.
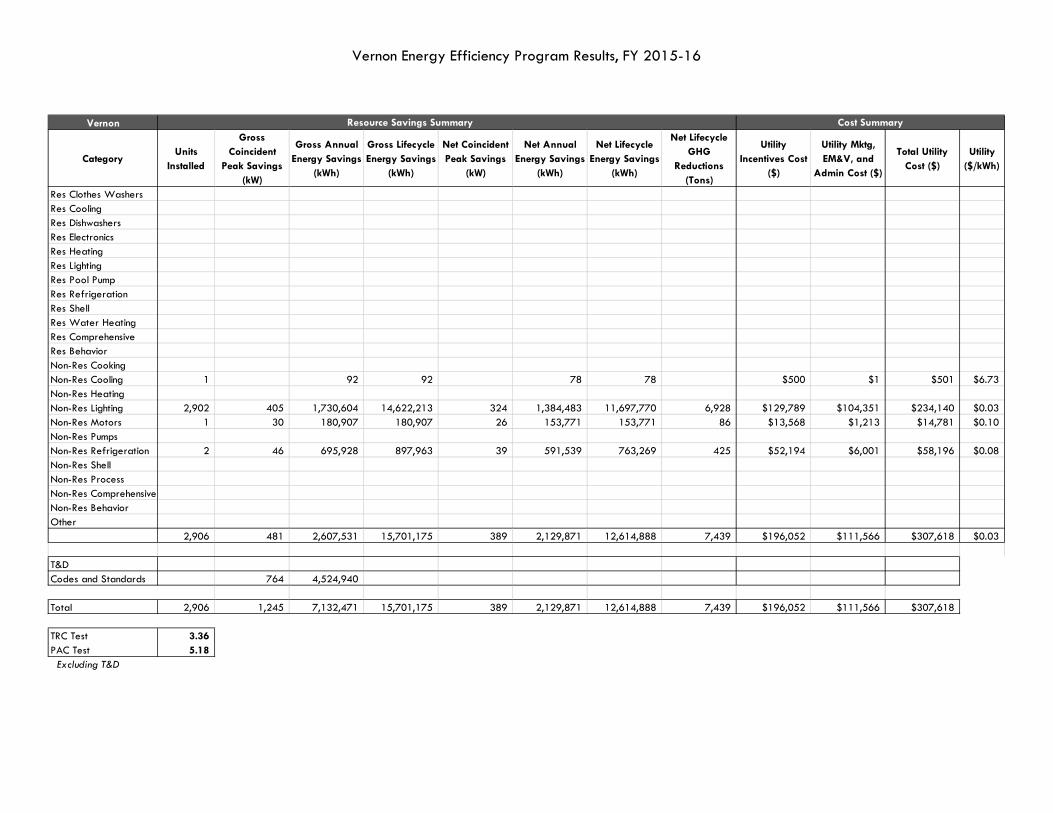
Vernon Energy Efficiency Program Results, FY 2015-16
Vernon
CategoryUnits
Installed
Gross Coincident
Peak Savings (kW)
Gross Annual Energy Savings
(kWh)
Gross Lifecycle Energy Savings
(kWh)
Net Coincident Peak Savings
(kW)
Net Annual Energy Savings
(kWh)
Net Lifecycle Energy Savings
(kWh)
Net Lifecycle GHG
Reductions (Tons)
Utility Incentives Cost
($)
Utility Mktg, EM&V, and
Admin Cost ($)
Total Utility Cost ($)
Utility ($/kWh)
Res Clothes WashersRes CoolingRes DishwashersRes ElectronicsRes HeatingRes LightingRes Pool PumpRes RefrigerationRes ShellRes Water HeatingRes ComprehensiveRes BehaviorNon-Res CookingNon-Res Cooling 1 92 92 78 78 $500 $1 $501 $6.73Non-Res HeatingNon-Res Lighting 2,902 405 1,730,604 14,622,213 324 1,384,483 11,697,770 6,928 $129,789 $104,351 $234,140 $0.03Non-Res Motors 1 30 180,907 180,907 26 153,771 153,771 86 $13,568 $1,213 $14,781 $0.10Non-Res PumpsNon-Res Refrigeration 2 46 695,928 897,963 39 591,539 763,269 425 $52,194 $6,001 $58,196 $0.08Non-Res ShellNon-Res ProcessNon-Res ComprehensiveNon-Res BehaviorOther
2,906 481 2,607,531 15,701,175 389 2,129,871 12,614,888 7,439 $196,052 $111,566 $307,618 $0.03
T&DCodes and Standards 764 4,524,940
Total 2,906 1,245 7,132,471 15,701,175 389 2,129,871 12,614,888 7,439 $196,052 $111,566 $307,618
TRC Test 3.36 PAC Test 5.18 Excluding T&D
Resource Savings Summary Cost Summary
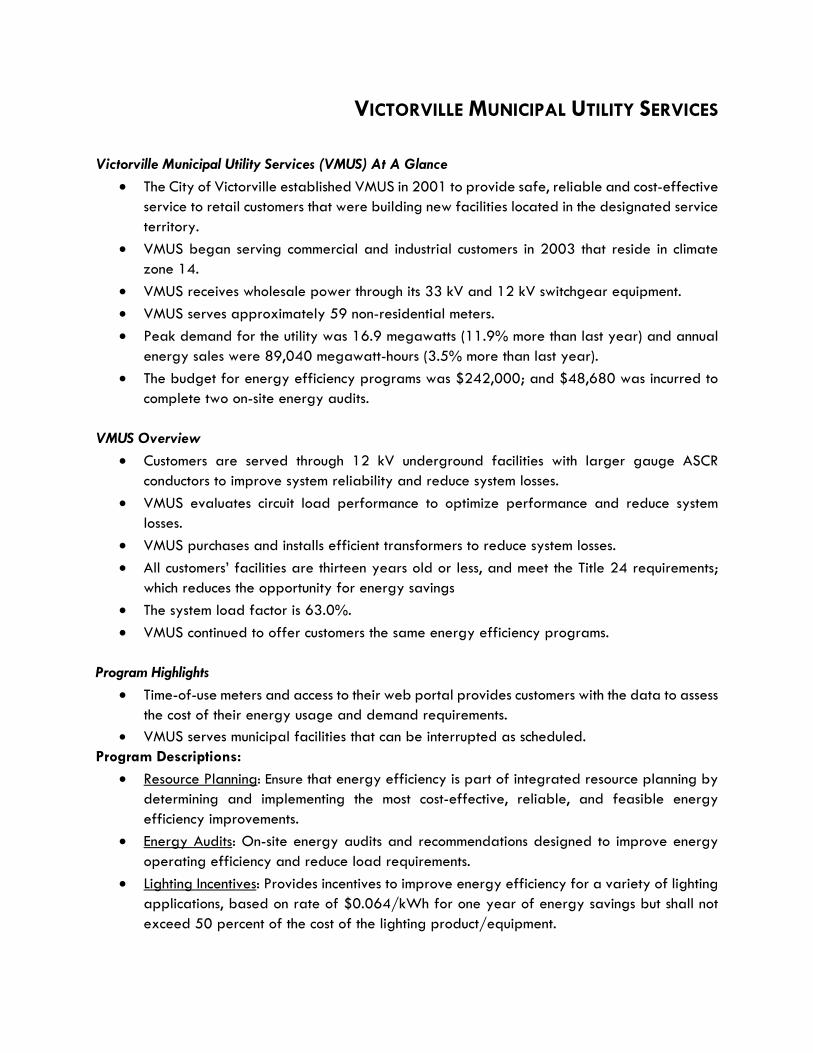
VICTORVILLE MUNICIPAL UTILITY SERVICES
Victorville Municipal Utility Services (VMUS) At A Glance • The City of Victorville established VMUS in 2001 to provide safe, reliable and cost-effective
service to retail customers that were building new facilities located in the designated service territory.
• VMUS began serving commercial and industrial customers in 2003 that reside in climate zone 14.
• VMUS receives wholesale power through its 33 kV and 12 kV switchgear equipment. • VMUS serves approximately 59 non-residential meters. • Peak demand for the utility was 16.9 megawatts (11.9% more than last year) and annual
energy sales were 89,040 megawatt-hours (3.5% more than last year). • The budget for energy efficiency programs was $242,000; and $48,680 was incurred to
complete two on-site energy audits. VMUS Overview
• Customers are served through 12 kV underground facilities with larger gauge ASCR conductors to improve system reliability and reduce system losses.
• VMUS evaluates circuit load performance to optimize performance and reduce system losses.
• VMUS purchases and installs efficient transformers to reduce system losses. • All customers’ facilities are thirteen years old or less, and meet the Title 24 requirements;
which reduces the opportunity for energy savings • The system load factor is 63.0%. • VMUS continued to offer customers the same energy efficiency programs.
Program Highlights
• Time-of-use meters and access to their web portal provides customers with the data to assess the cost of their energy usage and demand requirements.
• VMUS serves municipal facilities that can be interrupted as scheduled. Program Descriptions:
• Resource Planning: Ensure that energy efficiency is part of integrated resource planning by determining and implementing the most cost-effective, reliable, and feasible energy efficiency improvements.
• Energy Audits: On-site energy audits and recommendations designed to improve energy operating efficiency and reduce load requirements.
• Lighting Incentives: Provides incentives to improve energy efficiency for a variety of lighting applications, based on rate of $0.064/kWh for one year of energy savings but shall not exceed 50 percent of the cost of the lighting product/equipment.

• Construction Incentives: Reimbursement for the cost of equipment in construction projects that exceed state-mandated codes, federal-mandated codes, industry-accepted performance standards, or other baseline energy performance standards by more than 10 percent. The program payment is based on 25 percent of the cost difference between standard and upgraded equipment and/or materials, or $50,000, whichever is less.
• Energy Demand Reduction: Payment for the installation of energy efficient equipment/technology that permanently reduces peak demand and exceeds state-mandated codes, federal-mandated codes, industry-accepted performance standards or other baseline energy performance standards, based on rate of $100/kW for each on-peak kW that has been reduced, but shall not exceed 50 percent of the associated equipment/technology.
• Custom Energy Efficiency Incentives: Offers financial incentives for cost-effective energy-savings opportunities, not served by existing offerings, (including HVAC, motors, pumps, refrigeration, process and other) that reduces annual energy usage by at least 20 percent, based on rate of $0.064/kWh or $0.525/therm for one year of energy savings, but shall not exceed 50 percent of the cost of associated equipment/materials.
• Utility-Side Projects/Activities: Direct funding for projects/activities on the utility-side of the meter that promote a benefit customers in terms of improved safety, system integrity, energy efficiency, conservation, or research and development.
Evaluation, Measurement and Verification
• Measure and evaluate the impact of energy efficiency programs. • The budget for energy efficiency and solar rebate programs was $242,000; and $48,680
was incurred for the period July 1, 2015 – June 30, 2016. Two on-site energy audits were completed and no energy efficiency incentive payments were disbursed.
Sources of Energy Savings VMUS relies upon the TRM for energy savings estimates. Complimentary Programs
• Renewable Energy Programs (Photovoltaic Incentive Program): Provides financial incentives not to exceed 50% of the total installed cost of a new solar energy system of $2.80 per watt or reimburse customers $0.10 per kWh over the next sixty (60) months for electricity produced by the installed solar energy system.
• Energy Storage: VMUS’ energy storage goal is to procure cost-effective energy storage applications equal to one percent (1%) of its peak load during calendar year 2020, with installations occurring no later than the end of calendar years 2021. No specific cost-effective energy storage application has been identified to date.

Energy Efficiency in California’s Public Power Sector: 11th Edition — 2017
APPENDIX B
Pursuant to Section 9505(b) of the Public Utilities Code, every four years, each POU is required to identify all potentially achievable cost-effective electricity efficiency savings and to establish annual targets for energy efficiency savings and demand reduction for the next 10-year period. Figure B-1 displays the annual targets by year. For 2018-2027, the sum of the 10-year annual energy efficiency targets for all of public power is 1.18% of forecasted retail sales. Figure B-1. 2018-2027 Energy Efficiency Targets for All POUS, (% of forecasted retail sales)
Figures B-2 and B-3 compare the 2018-2027 targets (2017 targets) and the 2014-2023 targets 2013 and 2017 targets. The 2017 targets are higher overall compared to the 2013 targets, both in terms of energy savings, 7,995 MWh vs. 7,402 MWh, and average percent of retail sales, 1.18% vs 1.08%. Figure B-2. Comparison of 2018-2023 Annual Targets (MWh), 2013 vs. 2017
1.32% 1.33%1.27%
1.20% 1.19% 1.17% 1.14% 1.12%1.08%
1.03%
2018 2019 2020 2021 2022 2023 2024 2025 2026 2027
915,847 897,694857,831
634,555563,217
522,986
855,381 866,409 834,198 795,284 801,525 794,530
2018 2019 2020 2021 2022 2023
2013 Targets 2017 Targets

Figure B-3. Comparison of 2018-2023 Annual Targets by POU, 2013 vs. 2017
Energy Efficiency in California’s Public Power Sector: 11th Edition — 2017
2018 2019 2020 2021 2022 2023 10-Year Total 10-Year
Avg. % of Sales
2018 2019 2020 2021 2022 2023 10-Year Total10-Year
Avg. % of Sales
Alameda 1,061 1,081 1,108 1,196 1,346 1,617 12,068 0.32% 1,459 1,614 832 823 818 858 9,537 0.28%Anaheim 24,585 24,842 25,254 25,480 25,567 25,204 249,353 1.01% 28,033 28,183 26,841 26,228 25,856 24,981 249,086 1.00%
Azusa 2,342 2,438 2,411 2,567 2,386 2,316 24,756 0.95% 2,656 2,666 2,666 2,677 2,687 2,697 26,906 1.01%Banning 573 621 715 730 802 852 6,434 0.35% 328 367 399 445 490 502 4,316 0.30%
Biggs 47 49 51 52 52 51 464 0.27% 7 7 7 8 8 8 78 0.05%Burbank 10,852 11,677 12,111 13,037 12,977 12,829 116,574 0.89% 10,874 11,207 11,385 12,052 12,818 13,072 124,554 1.03%
Colton 1,911 2,137 2,435 2,610 3,804 3,712 22,221 0.64% 4,252 4,137 4,163 4,108 4,201 4,121 38,281 1.03%Corona 325 359 374 361 374 385 3,467 0.43% 209 236 255 269 285 296 2,803 0.35%
Glendale 11,486 11,371 12,120 12,830 13,214 13,548 120,780 1.07% 14,801 14,723 14,634 14,160 13,998 13,528 130,474 1.16%Gridley 170 170 170 170 170 170 1,700 0.51% 106 106 106 106 106 106 1,060 0.29%
Healdsburg 348 382 429 441 598 535 3,888 0.44% 490 486 469 466 438 393 3,984 0.52%Imperial 16,014 17,001 18,073 19,091 19,419 19,240 170,551 0.49% 33,475 33,760 33,952 32,232 30,894 28,668 294,836 0.79%LADWP 541,000 520,000 471,000 240,000 161,000 118,000 3,596,000 1.37% 499,377 504,128 460,618 410,067 407,695 401,709 4,323,888 1.50%Lassen 305 313 338 333 347 364 3,073 0.21% 296 314 265 283 300 311 3,014 0.22%
Lodi 3,359 3,543 3,617 3,737 4,311 5,081 35,934 0.79% 1,227 1,313 1,399 1,496 1,575 1,604 14,965 0.34%Lompoc 195 212 232 246 258 268 2,197 0.16% 213 236 249 266 282 300 2,829 0.20%Merced 1,140 1,040 1,099 1,148 1,386 1,274 12,725 0.27% 1,258 1,346 1,452 1,551 1,597 1,586 14,512 0.30%
Modesto 18,254 18,974 19,233 19,162 18,770 17,862 182,491 0.67% 9,144 10,060 11,062 12,052 12,879 13,385 121,028 0.43%Moreno Valley 251 272 284 303 304 309 2,831 0.17% 1,734 1,748 1,752 1,630 1,427 1,227 13,372 0.65%
Needles 139 159 177 195 215 229 1,511 0.18% 19 20 22 25 27 29 216 0.04%Palo Alto 6,248 6,260 6,809 6,846 7,412 7,452 65,855 0.63% 7,280 7,284 7,760 7,757 8,253 8,146 82,049 0.85%
Pasadena 12,750 12,750 12,750 12,750 12,750 12,750 127,500 1.00% 13,500 13,500 13,500 13,500 13,500 13,500 135,000 1.25%Pittsburg Power 128 124 122 120 125 122 1,260 0.65% 244 247 251 255 258 262 2,605 1.00%Plumas-Sierra 133 128 178 150 233 198 1,564 0.10% 122 122 122 122 122 122 1,220 0.08%
Port of Oakland 103 106 108 111 108 105 1,034 0.15% 196 196 196 196 196 196 1,960 0.33%Rancho Cucamonga 550 598 600 656 634 711 5,618 0.51% 288 293 313 347 388 411 3,634 0.46%
Redding 3,207 3,384 3,581 3,857 4,207 4,349 35,630 0.44% 3,890 4,031 4,238 4,433 4,228 4,052 40,022 0.53%Riverside 19,317 20,287 23,368 24,469 25,889 25,865 215,317 1.00% 22,990 23,010 23,070 23,110 23,250 23,320 232,728 1.00%Roseville 7,499 7,790 7,260 7,697 8,094 8,479 78,344 0.64% 8,413 8,549 8,995 9,578 10,063 10,000 89,302 0.76%
Sacramento 182,000 184,000 186,000 187,000 189,000 191,000 1,824,000 1.52% 149,626 154,902 164,286 175,198 183,687 187,401 1,669,015 1.40%San Francisco 4,857 2,970 2,536 2,806 2,806 2,806 37,201 0.35% 2,736 2,853 2,764 2,657 2,596 2,524 25,352 0.24%Shasta Lake 261 243 256 269 361 368 3,049 0.16% 487 519 550 579 600 635 5,639 0.30%
Silicon Valley 22,407 21,274 20,961 20,174 18,923 18,282 216,411 0.66% 12,851 13,032 14,015 14,928 15,129 14,565 132,163 0.42%Trinity 118 143 161 180 203 219 1,403 0.14% 7 6 6 6 6 6 61 0.01%
Truckee Donner 1,080 1,134 1,103 1,121 1,198 1,204 12,838 0.79% 730 639 654 672 689 693 6,820 0.45%Turlock 13,674 12,666 13,698 15,601 16,159 17,372 134,049 0.61% 16,394 14,939 15,001 14,938 14,172 13,698 134,809 0.60%
Ukiah 364 404 395 391 414 423 4,167 0.32% 250 250 250 250 250 250 2,500 0.22%Vernon 6,592 6,561 6,454 6,377 7,060 7,065 66,430 0.51% 5,268 5,218 5,523 5,618 5,544 5,145 48,457 0.40%
Victorville 202 231 260 291 341 370 2,239 0.31% 149 163 178 196 212 223 2,012 0.22%
PUBLIC POWER 915,847 897,694 857,831 634,555 563,217 522,986 7,402,928 1.08% 855,381 866,409 834,198 795,284 801,525 794,530 7,995,086 1.18%
2014-2023 Energy Efficiency Targets (MWh) 2018-2027 Energy Efficiency Targets MWh
Utility

Figure B-4. 2018-2027 Annual Energy Efficiency Targets (MWh), by Utility
Energy Efficiency in California’s Public Power Sector: 11th Edition — 2017
UtilityNet or Gross?
Include C&S?
2018 2019 2020 2021 2022 2023 2024 2025 2026 2027 10-Year TotalAvg. % of
Sales
Alameda Net No 1,459 1,614 832 823 818 858 818 818 756 740 9,537 0.28%Anaheim Gross No 28,033 28,183 26,841 26,228 25,856 24,981 23,846 22,952 21,795 20,371 249,086 1.00%
Azusa Net Yes 2,656 2,666 2,666 2,677 2,687 2,697 2,707 2,717 2,717 2,717 26,906 1.01%Banning Net No 328 367 399 445 490 502 492 463 428 404 4,316 0.30%
Biggs Net No 7 7 7 8 8 8 8 8 8 8 78 0.05%Burbank Gross No 10,874 11,207 11,385 12,052 12,818 13,072 13,516 13,668 13,251 12,711 124,554 1.03%
Colton Net Yes 4,252 4,137 4,163 4,108 4,201 4,121 3,852 3,462 3,133 2,852 38,281 1.03%Corona Net No 209 236 255 269 285 296 309 316 316 311 2,803 0.35%
Glendale Net Yes 14,801 14,723 14,634 14,160 13,998 13,528 12,447 11,534 10,682 9,966 130,474 1.16%Gridley Net No 106 106 106 106 106 106 106 106 106 106 1,060 0.29%
Healdsburg Net No 490 486 469 466 438 393 358 331 296 257 3,984 0.52%Imperial Net Yes 33,475 33,760 33,952 32,232 30,894 28,668 27,685 26,708 25,027 22,435 294,836 0.79%LADWP Gross Yes 499,377 504,128 460,618 410,067 407,695 401,709 403,761 413,682 417,318 405,533 4,323,888 1.50%Lassen Net No 296 314 265 283 300 311 310 314 313 308 3,014 0.22%
Lodi Net No 1,227 1,313 1,399 1,496 1,575 1,604 1,612 1,618 1,587 1,534 14,965 0.34%Lompoc Gross No 213 236 249 266 282 300 313 324 326 320 2,829 0.20%Merced Net No 1,258 1,346 1,452 1,551 1,597 1,586 1,525 1,455 1,392 1,350 14,512 0.30%
Modesto Net No 9,144 10,060 11,062 12,052 12,879 13,385 13,700 13,714 13,149 11,883 121,028 0.43%Moreno Valley Net Yes 1,734 1,748 1,752 1,630 1,427 1,227 1,106 1,007 909 833 13,372 0.65%
Needles Net No 19 20 22 25 27 29 27 21 15 10 216 0.04%Palo Alto Net No 7,280 7,284 7,760 7,757 8,253 8,146 8,631 8,647 9,139 9,152 82,049 0.85%
Pasadena Gross Yes 13,500 13,500 13,500 13,500 13,500 13,500 13,500 13,500 13,500 13,500 135,000 1.25%Pittsburg Gross No 244 247 251 255 258 262 265 269 273 281 2,605 1.00%
Plumas-Sierra Net No 122 122 122 122 122 122 122 122 122 122 1,220 0.08%Port of Oakland Net No 196 196 196 196 196 196 196 196 196 196 1,960 0.33%
Rancho Cucamonga Net No 288 293 313 347 388 411 416 409 393 375 3,634 0.46%Redding Gross No 3,890 4,031 4,238 4,433 4,228 4,052 4,057 3,967 3,840 3,285 40,022 0.53%
Riverside Gross No 22,990 23,010 23,070 23,110 23,250 23,320 23,370 23,450 23,470 23,688 232,728 1.00%Roseville Gross No 8,413 8,549 8,995 9,578 10,063 10,000 9,275 8,556 7,977 7,895 89,302 0.76%
Sacramento Gross Yes 149,626 154,902 164,286 175,198 183,687 187,401 181,428 168,982 157,634 145,870 1,669,015 1.40%San Francisco PUC Net No 2,736 2,853 2,764 2,657 2,596 2,524 2,435 2,324 2,255 2,209 25,352 0.24%
Shasta Lake Net No 487 519 550 579 600 635 635 601 551 482 5,639 0.30%Santa Clara Net No 12,851 13,032 14,015 14,928 15,129 14,565 13,333 12,192 11,528 10,590 132,163 0.42%
Trinity Net No 7 6 6 6 6 6 6 6 6 6 61 0.01%Truckee Donner Gross No 730 639 654 672 689 693 693 686 685 679 6,820 0.45%
Turlock* Net Yes 16,394 14,939 15,001 14,938 14,172 13,698 12,530 11,638 11,023 10,476 134,809 0.60%Ukiah Net No 250 250 250 250 250 250 250 250 250 250 2,500 0.22%
Vernon Net Yes 5,268 5,218 5,523 5,618 5,544 5,145 4,536 4,147 3,900 3,557 48,457 0.40%Victorville Net No 149 163 178 196 212 223 228 228 223 214 2,012 0.22%
*Turlock targets are for CY 2017-2026 855,381 866,409 834,198 795,284 801,525 794,530 784,406 775,389 760,489 727,476 7,995,086 1.18%

ALAMEDA MUNICIPAL POWER Alameda Municipal Power 10-Year Energy Efficiency (EE) Potential Studies – At a Glance
• 2018-2027 Average Annual Target: 0.28% of forecasted retail sales. • The annual targets are reported as NET savings. • Energy savings from future updates to Title 24 Building Energy Efficiency Standards are NOT
included in the annual targets • The baseline for measures is EXISTING CONDITIONS for non-residential projects that require
pre-install and post-install inspections and CODE for residential measures. Navigant used their Electric Resource Assessment Model (ELRAM) to estimate achievable energy and demand savings over a 10-year forecast period. The modeling team forecasted these savings using two modeling steps:
1. Base Case Run. This modeling run includes no changes or adjustments to Alameda’s current portfolio of energy efficiency programs.
2. Final Run. Alameda’s Final Run included the following adjustments to their Base Case Run:
• Expanded measure list. Navigant modeled a number of measures to provide a picture of potential savings should Alameda decide to expand their current programs. After review, Alameda expanded the reach of the Energy Plus non-residential program.
Figure 1. Net Incremental Market Potential by Sector (MWh) and Percent of Sales – FINAL RUN
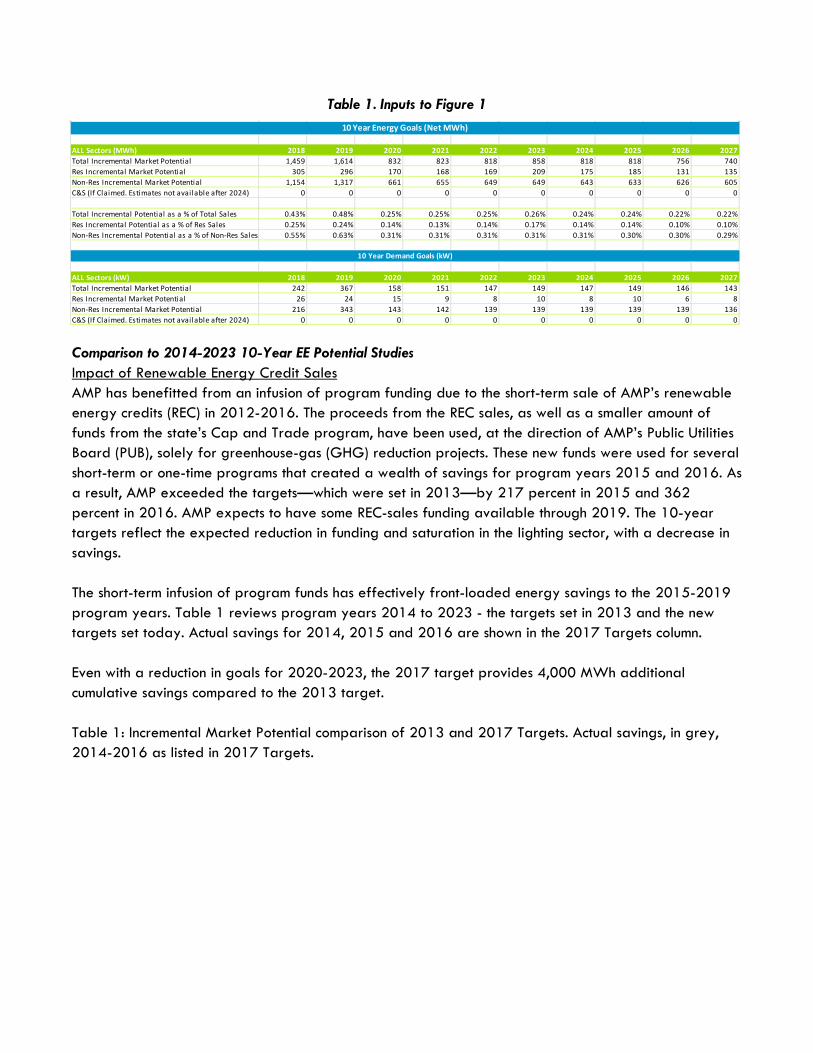
Table 1. Inputs to Figure 1
Comparison to 2014-2023 10-Year EE Potential Studies Impact of Renewable Energy Credit Sales AMP has benefitted from an infusion of program funding due to the short-term sale of AMP’s renewable energy credits (REC) in 2012-2016. The proceeds from the REC sales, as well as a smaller amount of funds from the state’s Cap and Trade program, have been used, at the direction of AMP’s Public Utilities Board (PUB), solely for greenhouse-gas (GHG) reduction projects. These new funds were used for several short-term or one-time programs that created a wealth of savings for program years 2015 and 2016. As a result, AMP exceeded the targets—which were set in 2013—by 217 percent in 2015 and 362 percent in 2016. AMP expects to have some REC-sales funding available through 2019. The 10-year targets reflect the expected reduction in funding and saturation in the lighting sector, with a decrease in savings. The short-term infusion of program funds has effectively front-loaded energy savings to the 2015-2019 program years. Table 1 reviews program years 2014 to 2023 - the targets set in 2013 and the new targets set today. Actual savings for 2014, 2015 and 2016 are shown in the 2017 Targets column. Even with a reduction in goals for 2020-2023, the 2017 target provides 4,000 MWh additional cumulative savings compared to the 2013 target. Table 1: Incremental Market Potential comparison of 2013 and 2017 Targets. Actual savings, in grey, 2014-2016 as listed in 2017 Targets.
ALL Sectors (MWh) 2018 2019 2020 2021 2022 2023 2024 2025 2026 2027Total Incremental Market Potential 1,459 1,614 832 823 818 858 818 818 756 740Res Incremental Market Potential 305 296 170 168 169 209 175 185 131 135Non-Res Incremental Market Potential 1,154 1,317 661 655 649 649 643 633 626 605C&S (If Claimed. Estimates not available after 2024) 0 0 0 0 0 0 0 0 0 0
Total Incremental Potential as a % of Total Sales 0.43% 0.48% 0.25% 0.25% 0.25% 0.26% 0.24% 0.24% 0.22% 0.22%Res Incremental Potential as a % of Res Sales 0.25% 0.24% 0.14% 0.13% 0.14% 0.17% 0.14% 0.14% 0.10% 0.10%Non-Res Incremental Potential as a % of Non-Res Sales 0.55% 0.63% 0.31% 0.31% 0.31% 0.31% 0.31% 0.30% 0.30% 0.29%
ALL Sectors (kW) 2018 2019 2020 2021 2022 2023 2024 2025 2026 2027Total Incremental Market Potential 242 367 158 151 147 149 147 149 146 143Res Incremental Market Potential 26 24 15 9 8 10 8 10 6 8Non-Res Incremental Market Potential 216 343 143 142 139 139 139 139 139 136C&S (If Claimed. Estimates not available after 2024) 0 0 0 0 0 0 0 0 0 0
10 Year Energy Goals (Net MWh)
10 Year Demand Goals (kW)

Residential Sector AMP’s average residential customers have reduced their energy use by 3 percent per year since 2012, and we expect this trend to continue. Alameda has a very mild climate and few homes have air conditioning. While appliance standards (Title 20) and building codes (Title 24) have certainly contributed to a more energy-efficient home in Alameda, AMP’s residential programs have also helped. For example, proceeds from the REC sales were used to send two LED light bulbs to every residential customer in 2015. This program contributed to 2015 savings that exceeded the target, but it also meant that two sockets per home would be unavailable for future programs. Fortunately, the savings from LEDs persist for 15 years. New savings opportunities, however, are becoming more limited. The classic Energy Star refrigerator recycling program has historically comprised 80 percent of AMP’s residential savings (excluding Opower’s behavior change program and the LED promotion). The 2016 Technical Resource Manual (TRM) halves the claimed energy savings from refrigerator recycling as of January 2017. This reduction will, understandably, lower AMP’s residential expected savings and future-looking targets. AMP will continue to offer our award-winning online rebate program for refrigerators, freezers, LED bulbs, LED fixtures, LED decorative string lights, washing machines for all-electric homes, electric dryers, and electric heat pump water heaters. The residential neighbor comparison and behavior-change program, “My Energy,” run by Opower, was a major source of annual savings. The program, which was funded by AMP’s participation in the state’s Cap and Trade program, was in effect from October 2012 through 2016. In 2016, My Energy had the highest net annual energy savings of AMP’s entire energy-efficiency portfolio. The program’s Total
Year2013
Targets2017
Targets2014 1,154 9412015 1,100 2,3912016 1,158 4,1972017 1,247 2,2062018 1,061 1,4592019 1,081 1,6142020 1,108 8322021 1,196 8232022 1,346 8182023 1,617 858
TOTAL 12,068 16,139
Incremental Market Potential, MWh
Resource Cost (TRC) was among the lowest in AMP’s offerings at 0.7, and savings only persist for one year. Despite the annual savings, the program was very expensive and only benefited the half of the residents that received the five-times-a-year paper report. The program concluded in December 2016. Non-Residential Sector Since 2015, Alameda’s non-residential customers have benefitted from direct-install energy-efficiency programs. The goal of the direct-install programs is to reduce customer barriers such as knowledge of technologies, funding for staff to manage projects, fair pricing and protection from unscrupulous contractors, quality equipment/installations and first costs. These programs are funded through REC sales. AMP’s REC-funded “Commercial Lighting Program” was available from October 2014 through December 2015. More than 70 percent of the program participants were small businesses who had never before participated in a program. Over 90 percent of the installed measures were LEDs. Based on the success of that program, AMP started the “Energy Plus Program” to include all non-residential customers and refrigeration measures. This program was launched in January 2016 and will conclude in December 2017, with expected energy savings of over 3,000 MWh. The majority—over 60 percent—of streetlights were converted to LEDs in program year 2016. Conclusions The targets after 2019 are low both due to of the unavailability of REC funds and because we expect to be close to market saturation in some sectors and end uses, notably residential lighting and non-residential exterior lighting. The impact of codes and standards such as Titles 20 and 24, and California policies such as AB 758 and SB 350 are unknown. The 2017 targets are based on current cost-effective energy-efficiency measures. When this target exercise is repeated in 202, future targets may be revised higher or lower depending on the political climate; associated national, state, and local policies; and pending litigation regarding Proposition 26. At a local level, it is unclear how AMP’s new solar rate, the Energy Renewable Generation (ERG) plan, will impact customer demand for solar installs compared to Net Energy Metering (NEM). ERG is seen by the solar industry as less lucrative than NEM. Residential and commercial customers alike may opt to reduce their use (bills) via energy efficiency rather than solar – or they will just install increasingly larger photovoltaic systems and completely ignore efficiency opportunities. AMP’s energy-efficiency portfolio is heavily reliant on lighting measures. When an LED-retrofit fixture with wireless sensors is widely feasible and a cost-effective retrofit for existing fluorescent tubular fixtures, the targets will change considerably. Current iterations of the LED technology, particularly those compliant with Title 24 sensor requirements, have a long payback period and are not appropriate for all applications. When a solution is available on the market with a payback of less than three years, AMP expects to see an increase in market potential savings. On the residential side, AMP will be watching for fuel-switching opportunities, potentially associated with SB 350. Residential potential today does not include HVAC since there is no air conditioning load. If residents are encouraged to complete building

envelope upgrades and consider moving to a heat pump, Alameda as a whole would see a reduction in total energy consumption, and the associated GHG.

ANAHEIM PUBLIC UTILITIES Anaheim Public Utilities 10-Year EE Potential Studies – At a Glance
• 2018-2027 Annual Targets are as follows: The average over the 10-year period is 1.00% of forecasted retail sales.
TARGETS w/C&S
2018 2019 2020 2021 2022 2023 2024 2025 2026 2027 Avg. 10 yr.
kWh 1.15% 1.15% 1.09% 1.06% 1.04% 1.00% 0.95% 0.91% 0.86% 0.80% 1.00%
kW 1.11% 1.12% 1.13% 1.15% 1.19% 1.14% 1.15% 1.13% 1.09% 1.04% 1.13%
• The annual targets are reported as GROSS savings, with the exception that Codes & Standards
reported are NET values. • Energy savings from future updates to Title 24 Building Energy Efficiency Standards are NOT
included in the annual targets since the final Energy Standards in Title 24, Part 6, that apply to newly constructed buildings and additions, or alterations to existing buildings was effective January 1, 2017 but wasn’t published for review until January 19, 2017.
• The baseline for measures is EXISTING CONDITIONS, except for select measures. Comparison to 2014-2023 10-Year EE Potential Studies Goal results for 2014-2023
Goal results for 2018-2027
0.99% 1.00%0.98%
1.04%
0.99% 1.00%1.02% 1.02% 1.03%
1.01%
0.94%0.96%0.98%1.00%1.02%1.04%1.06%
2014 2015 2016 2017 2018 2019 2020 2021 2022 2023
EE Goal % of Sales 2014-2023
1.15% 1.15% 1.09% 1.06% 1.04% 1.00% 0.95% 0.91% 0.86%0.80%
0.00%
0.50%
1.00%
1.50%
2018 2019 2020 2021 2022 2023 2024 2025 2026 2027
EE Goal % of Sales 2018-2027

Anaheim 10-Year Cumulative EE Potential and SB-350 2018-2027 Cumulative Annual Targets are as follows:
ALL Sectors (Cumulative MWh) 2018 2019 2020 2021 2022 2023 2024 2025 2026 2027Total Cumulative Market Potential 28,098 54,010 78,619 102,567 126,204 149,021 169,780 189,696 208,332 225,464Res Cumulative Market Potential 4,040 8,216 11,122 14,148 17,179 20,248 22,298 24,560 26,662 28,660Non-Res Cumulative Market Potential 14,717 27,587 40,945 54,815 69,068 83,322 96,996 110,034 122,337 133,592C&S (If Claimed. Estimates not available after 2024) 9,342 18,207 26,552 33,604 39,957 45,451 50,486 55,102 59,333 63,212
Total Cumulative Potential as a % of Total Sales 1.15% 2.20% 3.19% 4.15% 5.08% 5.97% 6.76% 7.52% 8.22% 8.85%Res Cumulative Potential as a % of Res Sales 0.64% 1.30% 1.76% 2.22% 2.69% 3.15% 3.46% 3.79% 4.09% 4.38%Non-Res Cumulative Potential as a % of Non-Res Sale 0.80% 1.50% 2.22% 2.95% 3.71% 4.45% 5.15% 5.82% 6.44% 7.00%
ALL Sectors (Cumulative kW) 2018 2019 2020 2021 2022 2023 2024 2025 2026 2027Total Cumulative Market Potential 6,303 10,213 14,149 18,531 23,342 27,974 32,589 37,245 41,774 46,115Res Cumulative Market Potential 741 1,515 2,207 2,922 3,647 4,375 4,957 5,555 6,144 6,727Non-Res Cumulative Market Potential 3,067 6,287 9,776 13,628 17,829 21,854 25,988 30,140 34,170 38,011C&S (If Claimed. Estimates not available after 2024) 2,494 2,411 2,166 1,980 1,866 1,744 1,644 1,549 1,460 1,376Total Incremental Potential as a % of Demand 1.12% 1.81% 2.50% 3.27% 4.12% 4.93% 5.74% 6.55% 7.34% 8.10%
Anaheim Ten Year Cumulative Goals - Gross (2018 - 2027)
10 Year Energy Goals (Cumulative Gross MWh)
10 Year Demand Goals (Cumulative kW)
0.00%
1.00%
2.00%
3.00%
4.00%
5.00%
6.00%
7.00%
8.00%
9.00%
10.00%
0
50,000
100,000
150,000
200,000
250,000
2018 2019 2020 2021 2022 2023 2024 2025 2026 2027
% o
f Ann
ual G
Wh
Sale
s
MW
h
Cumulative Market Potential by SectorAll Sectors Energy Potential (MWh) and % of Sales
Res Cumulative Market Potential Non-Res Cumulative Market Potential
C&S (If Claimed. Estimates not available after 2024) Total Cumulative Potential as a % of Total Sales

AZUSA LIGHT & WATER Azusa Light & Water 10-Year EE Potential Studies – At a Glance
• The ELRAM indicates market potential of 0.93% annually; however, the 2018-2027 Average Annual Target is 1.01% of forecasted retail sales.
• The annual targets are reported as NET savings • Energy savings from future updates to Title 24 Building Energy Efficiency Standards ARE included
in the annual targets. • The baseline for measures is EXISITING CONDITIONS, except for select measures.
Navigant used their Electric Resource Assessment Model (ELRAM) to estimate achievable energy and demand savings over a 10-year forecast period. The modeling team forecasted these savings using two modeling steps:
1. Base Case Run. This modeling run includes no changes or adjustments to Azusa’s current portfolio of energy efficiency programs.
2. Final Run. Azusa chose to call their Base Case Run as Final and made no adjustments to modeling scenarios.
Comparison to 2014-2023 10-Year EE Potential Studies Based on the results of the current EE Potential Study, the annual target is being raised from the previous 0.89% to 1.01%. Existing programs are on track to provide the projected energy savings for the current 2018-2027 10-Year cycle. Azusa Light & Water will continue to explore and modify EE programs to continue to provide cost effective programs while adding, deleting and modify the programs as necessary.

CITY OF BANNING City of Banning 10-Year EE Potential Studies – At a Glance
• 2018-2027 Average Annual Target: 0.3% of forecasted retail sales. • The annual targets are reported as NET savings. • Energy savings from future updates to Title 24 Building Energy Efficiency Standards are NOT
included in the annual targets. • A mix of existing condition and code baselines for modeled measures, as well as a “dual
baseline” function that can use the existing condition for a portion of the remaining useful life, and the code baseline for the remaining useful life.
Navigant used their Electric Resource Assessment Model (ELRAM) to estimate achievable energy and demand savings over a 10-year forecast period. The modeling team forecasted these savings using two modeling steps:
1. Base Case Run. This modeling run includes no changes or adjustments to Banning’s current portfolio of energy efficiency programs.
2. Final Run. Banning’s Final Run included the following adjustments to their Base Case Run:
• Expanded measure list. Navigant modeled a number of measures—not currently offered in Banning’s portfolio—to provide a picture of potential savings should Banning decide to expand their current programs. Banning chose to include only a sub-set of this expanded measure list, detailed in the Output Viewer. The team used various sources and studies throughout California and the nation to inform this expanded measure list.
• Not claiming Codes and Standards savings. Banning will not be claiming savings from codes and standards for this study.
Figure 1. Net Incremental Market Potential by Sector (MWh) and Percent of Sales – FINAL RUN

Table 1. Inputs to Figure 1
Comparison to 2014-2023 10-Year EE Potential Studies The years 2018-2023 overlap between the two 10-year study periods. Banning’s current goals are about 85% of the goals established in the prior study even though it added new measures to its portfolio.
ALL Sectors (MWh) 2018 2019 2020 2021 2022 2023 2024 2025 2026 2027Total Incremental Market Potential 328 367 399 445 490 502 492 463 428 404Res Incremental Market Potential 163 179 183 196 213 228 239 247 253 259Non-Res Incremental Market Potential 165 188 216 249 277 274 252 216 175 144C&S (If Claimed. Estimates not available after 2024) 0 0 0 0 0 0 0 0 0 0
Total Incremental Potential as a % of Total Sales 0.23% 0.26% 0.28% 0.31% 0.34% 0.34% 0.33% 0.31% 0.29% 0.26%Res Incremental Potential as a % of Res Sales 0.24% 0.27% 0.27% 0.29% 0.31% 0.33% 0.35% 0.36% 0.36% 0.37%Non-Res Incremental Potential as a % of Non-Res Sales 0.21% 0.24% 0.28% 0.32% 0.35% 0.34% 0.31% 0.26% 0.21% 0.17%
ALL Sectors (kW) 2018 2019 2020 2021 2022 2023 2024 2025 2026 2027Total Incremental Market Potential 84 92 100 110 122 126 123 115 108 106Res Incremental Market Potential 55 58 60 64 69 74 77 79 81 82Non-Res Incremental Market Potential 29 34 40 47 53 52 46 36 28 24C&S (If Claimed. Estimates not available after 2024) 0 0 0 0 0 0 0 0 0 0
10 Year Energy Goals (Net MWh)
10 Year Demand Goals (kW)

CITY OF BIGGS City of Biggs 10-Year EE Potential Studies – At a Glance
• 2018-2027 Average Annual Target: 0.05% of forecasted retail sales. • The annual targets are reported as NET savings. • Energy savings from future updates to Title 24 Building Energy Efficiency Standards are NOT
included in the annual targets. • The baseline for measures is CODE, except for select measures.
Navigant used their Electric Resource Assessment Model (ELRAM) to estimate achievable energy and demand savings over a 10-year forecast period. The modeling team forecasted these savings using two modeling steps:
1. Base Case Run. This modeling run includes no changes or adjustments to Biggs’s current portfolio of energy efficiency programs.
2. Final Run. Biggs chose to call their Base Case Run as Final and made no adjustments to modeling scenarios.
Figure 1. Net Incremental Market Potential by Sector (MWh) and Percent of Sales – FINAL RUN

Table 1. Inputs to Figure 1
Comparison to 2014-2023 10-Year EE Potential Studies The years 2018-2023 overlap between the two 10-year study periods. Biggs’s current 10-year goals are about 17% of the goals established in the prior study. There are primary reason for the lower goals is Biggs is a very small utility and since the 2012 study, the load forecast has dropped nearly 20%, reflecting the difficult economic conditions in Biggs.
ALL Sectors (MWh) 2018 2019 2020 2021 2022 2023 2024 2025 2026 2027Total Incremental Market Potential 7 7 7 8 8 8 8 8 8 8Res Incremental Market Potential 0 0 0 0 0 0 0 0 0 0Non-Res Incremental Market Potential 6 7 7 7 8 8 8 8 8 8C&S (If Claimed. Estimates not available after 2024) 0 0 0 0 0 0 0 0 0 0
Total Incremental Potential as a % of Total Sales 0.05% 0.05% 0.05% 0.05% 0.05% 0.06% 0.06% 0.06% 0.06% 0.06%Res Incremental Potential as a % of Res Sales 0.01% 0.01% 0.01% 0.01% 0.01% 0.01% 0.01% 0.01% 0.01% 0.01%Non-Res Incremental Potential as a % of Non-Res Sales 0.07% 0.07% 0.07% 0.07% 0.08% 0.08% 0.08% 0.08% 0.08% 0.08%
ALL Sectors (kW) 2018 2019 2020 2021 2022 2023 2024 2025 2026 2027Total Incremental Market Potential 1 1 1 1 1 1 1 1 1 1Res Incremental Market Potential 0 0 0 0 0 0 0 0 1 1Non-Res Incremental Market Potential 1 1 1 1 1 1 1 1 1 1C&S (If Claimed. Estimates not available after 2024) 0 0 0 0 0 0 0 0 0 0
10 Year Energy Goals (Net MWh)
10 Year Demand Goals (kW)

BURBANK WATER & POWER Burbank Water & Power 10-Year EE Potential Studies – At a Glance
• 2018-2027 Average Annual Target: 1.03% of forecasted retail sales. • The annual targets are reported as GROSS savings. • Energy savings from future updates to Title 24 Building Energy Efficiency Standards are NOT
included in the annual targets. • The baseline for measures is a mix of EXISTING CONDITIONS and CODE.
Navigant used their Electric Resource Assessment Model (ELRAM) to estimate achievable energy and demand savings over a 10 year forecast period. The modeling team forecasted these savings using two modeling steps:
1. Base Case Run. This modeling run includes no changes or adjustments to Burbank’s current portfolio of energy efficiency programs.
2. Final Run. Burbank chose to call their Base Case Run as Final and made no adjustments to modeling scenarios, except to claim gross, rather than net savings.
Figure 1. Gross Incremental Market Potential by Sector (MWh) and Percent of Sales – FINAL RUN
Table 1. Inputs to Figure 1
ALL Sectors (MWh) 2018 2019 2020 2021 2022 2023 2024 2025 2026 2027Total Incremental Market Potential 10,874 11,207 11,385 12,052 12,818 13,072 13,516 13,668 13,251 12,711Res Incremental Market Potential 4,021 4,194 4,017 4,176 4,338 4,479 4,492 4,551 4,541 4,523Non-Res Incremental Market Potential 6,853 7,013 7,368 7,876 8,481 8,593 9,023 9,117 8,710 8,188C&S (If Claimed) 0 0 0 0 0 0 0 0 0 0
Total Incremental Potential as a % of Total Sales 0.94% 0.96% 0.96% 1.01% 1.06% 1.07% 1.10% 1.10% 1.06% 0.99%Res Incremental Potential as a % of Res Sales 1.41% 1.46% 1.38% 1.42% 1.46% 1.49% 1.48% 1.49% 1.47% 1.45%Non-Res Incremental Potential as a % of Non-Res Sales 0.77% 0.78% 0.81% 0.86% 0.91% 0.92% 0.95% 0.95% 0.90% 0.84%
ALL Sectors (kW) 2018 2019 2020 2021 2022 2023 2024 2025 2026 2027Total Incremental Market Potential 4,150 4,331 4,504 4,716 4,944 4,739 4,951 5,063 5,028 4,895Res Incremental Market Potential 1,107 1,175 1,222 1,300 1,380 1,452 1,506 1,547 1,569 1,546Non-Res Incremental Market Potential 3,043 3,155 3,282 3,416 3,564 3,286 3,445 3,516 3,459 3,349C&S (If Claimed) 0 0 0 0 0 0 0 0 0 0
10 Year Demand Goals (kW)

Comparison to 2014-2023 10-Year EE Potential Studies The years 2018-2023 overlap between the two 10-year study periods. Burbank’s current 10-year goals are about 114% of the goals established in the prior study. The average savings goal between the 2012 and 2016 study are very similar. However, the forecast of sales in 2016 is about 10% lower than the forecast of sales in 2012. Additionally, Burbank is claiming gross savings targets in 2016 while they claimed net in 2012.

CITY OF COLTON City of Colton 10-Year EE Potential Studies – At a Glance
• 2018-2027 Average Annual Target: 1.03% of forecasted retail sales. • The annual targets are reported as NET savings. • Only codes and standards (C&S) that are currently in place today, and not future C&S such as
updates to Title 24, ARE included in the annual targets. • The baseline for measures is a mix of existing condition and code baselines for modeled
measures, as well as a “dual baseline” function that can use the existing condition for a portion of the remaining useful life, and the code baseline for the remaining useful life.
Navigant used their Electric Resource Assessment Model (ELRAM) to estimate achievable energy and demand savings over a 10-year forecast period. The modeling team forecasted these savings using two modeling steps:
1. Base Case Run. This modeling run includes no changes or adjustments to Colton’s current portfolio of energy efficiency programs.
2. Final Run. Colton’s Final Run included the following adjustments to their Base Case Run:
• Expanded measure list. Navigant modeled a number of measures—not currently offered in Colton’s portfolio—to provide a picture of potential savings should Colton decide to expand their current programs. The modeling team used various sources and studies throughout California and the nation to inform this expanded measure list.
• Increased promotional costs by 50%.
Figure 1. Net Incremental Market Potential by Sector (MWh) and Percent of Sales – FINAL RUN

Table 1. Inputs to Figure 1
Comparison to 2014-2023 10-Year EE Potential Studies For years 2018-2023, Colton’s current 10-year goals are about 177% of the goals established in the prior study. There are several reasons for these higher goals:
• Claiming savings from Codes & Standards • Adding new residential, commercial and industrial sector measures to their programs • Increasing administrative/promotional activities by 50% beginning in 2016
ALL Sectors (MWh) 2018 2019 2020 2021 2022 2023 2024 2025 2026 2027Total Incremental Market Potential 4,252 4,137 4,163 4,108 4,201 4,121 3,852 3,462 3,133 2,852Res Incremental Market Potential 149 166 153 170 194 225 264 291 293 292Non-Res Incremental Market Potential 2,457 2,429 2,541 2,617 2,734 2,710 2,481 2,138 1,877 1,661C&S (If Claimed. Estimates not available after 2024) 1,646 1,542 1,469 1,322 1,272 1,186 1,106 1,032 964 899
Total Incremental Potential as a % of Total Sales 1.16% 1.13% 1.13% 1.11% 1.13% 1.11% 1.03% 0.93% 0.84% 0.76%Res Incremental Potential as a % of Res Sales 1.07% 1.19% 1.10% 1.21% 1.38% 1.60% 1.87% 2.06% 2.07% 2.07%Non-Res Incremental Potential as a % of Non-Res Sales 0.69% 0.69% 0.71% 0.73% 0.76% 0.75% 0.69% 0.59% 0.52% 0.46%
ALL Sectors (kW) 2018 2019 2020 2021 2022 2023 2024 2025 2026 2027Total Incremental Market Potential 1,013 1,007 1,010 1,012 1,028 973 944 904 870 835Res Incremental Market Potential 28 30 30 33 37 41 46 51 53 54Non-Res Incremental Market Potential 597 612 643 666 686 639 621 591 568 545C&S (If Claimed. Estimates not available after 2024) 388 365 336 313 305 293 277 262 249 235
10 Year Energy Goals (Net MWh)
10 Year Demand Goals (kW)

CORONA DEPARTMENT OF WATER AND POWER (DWP) Corona Department of Water and Power (DWP) 10-Year EE Potential Studies – At a Glance
• 2018-2027 Average Annual Target: 0.35% of forecasted retail sales. • The annual targets are reported as NET savings. • Energy savings from future updates to Title 24 Building Energy Efficiency Standards are NOT
included in the annual targets. • The baseline for measures is EXISITING CONDITIONS, except for select measures.
Navigant used their Electric Resource Assessment Model (ELRAM) to estimate achievable energy and demand savings over a 10-year forecast period. The modeling team forecasted these savings using two modeling steps:
1. Base Case Run. This modeling run includes no changes or adjustments to Corona’s current portfolio of energy efficiency programs.
2. Final Run. Corona’s Final Run included the following adjustments to their Base Case Run:
• Inclusion of new residential and commercial measures beyond the currently rebated energy efficiency portfolio offerings
Figure 1. Net Incremental Market Potential by Sector (MWh) and Percent of Sales – FINAL RUN

Table 1. Inputs to Figure 1
Comparison to 2014-2023 10-Year EE Potential Studies For years 2018-2023, the current annual energy targets are about 80% of the targets established in the prior study.
ALL Sectors (MWh) 2018 2019 2020 2021 2022 2023 2024 2025 2026 2027Total Incremental Market Potential 209 236 255 269 285 296 309 316 316 311Res Incremental Market Potential 20 20 18 17 17 16 16 16 16 16Non-Res Incremental Market Potential 189 216 237 252 268 280 293 300 300 294C&S (If Claimed. Estimates not available after 2024) 0 0 0 0 0 0 0 0 0 0
Total Incremental Potential as a % of Total Sales 0.27% 0.30% 0.32% 0.34% 0.36% 0.37% 0.39% 0.39% 0.39% 0.39%Res Incremental Potential as a % of Res Sales 0.34% 0.36% 0.32% 0.30% 0.29% 0.28% 0.28% 0.28% 0.28% 0.28%Non-Res Incremental Potential as a % of Non-Res Sales 0.26% 0.29% 0.32% 0.34% 0.36% 0.38% 0.39% 0.40% 0.40% 0.40%
ALL Sectors (kW) 2018 2019 2020 2021 2022 2023 2024 2025 2026 2027Total Incremental Market Potential 44 49 52 55 59 63 67 70 71 70Res Incremental Market Potential 3 3 3 3 3 4 4 4 4 5Non-Res Incremental Market Potential 41 46 49 52 56 59 63 66 66 65C&S (If Claimed. Estimates not available after 2024) 0 0 0 0 0 0 0 0 0 0
10 Year Energy Goals (Net MWh)
10 Year Demand Goals (kW)
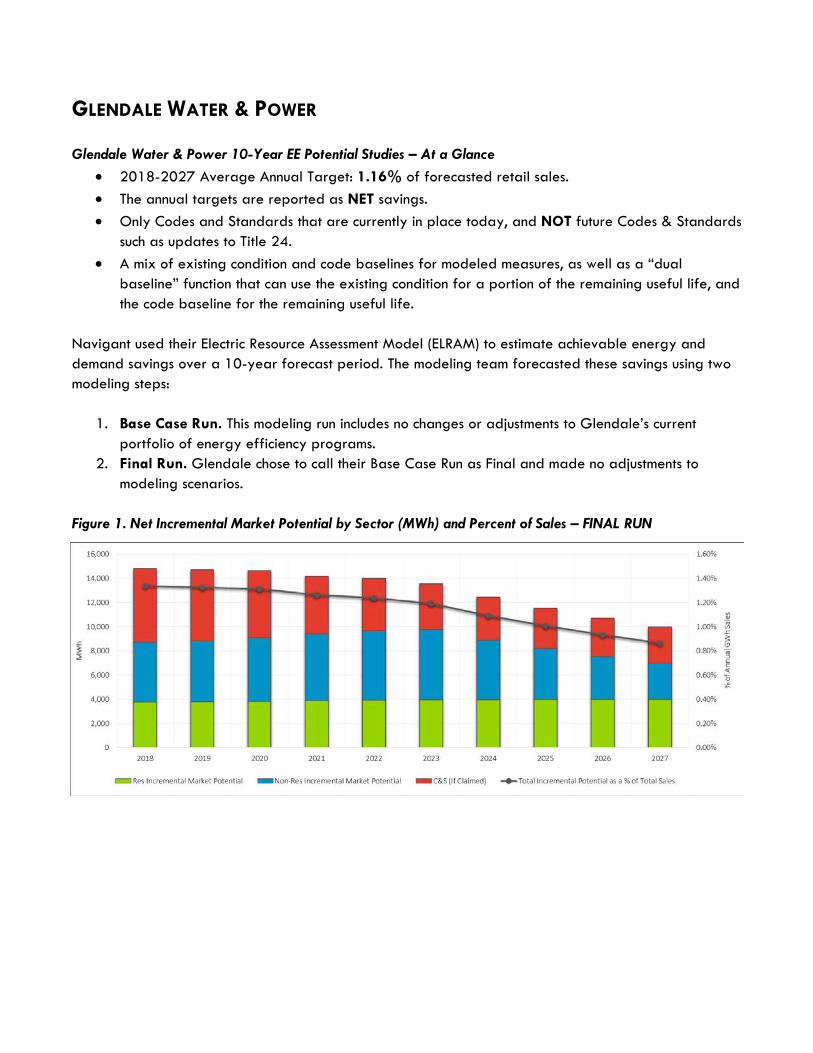
GLENDALE WATER & POWER Glendale Water & Power 10-Year EE Potential Studies – At a Glance
• 2018-2027 Average Annual Target: 1.16% of forecasted retail sales. • The annual targets are reported as NET savings. • Only Codes and Standards that are currently in place today, and NOT future Codes & Standards
such as updates to Title 24. • A mix of existing condition and code baselines for modeled measures, as well as a “dual
baseline” function that can use the existing condition for a portion of the remaining useful life, and the code baseline for the remaining useful life.
Navigant used their Electric Resource Assessment Model (ELRAM) to estimate achievable energy and demand savings over a 10-year forecast period. The modeling team forecasted these savings using two modeling steps:
1. Base Case Run. This modeling run includes no changes or adjustments to Glendale’s current portfolio of energy efficiency programs.
2. Final Run. Glendale chose to call their Base Case Run as Final and made no adjustments to modeling scenarios.
Figure 1. Net Incremental Market Potential by Sector (MWh) and Percent of Sales – FINAL RUN
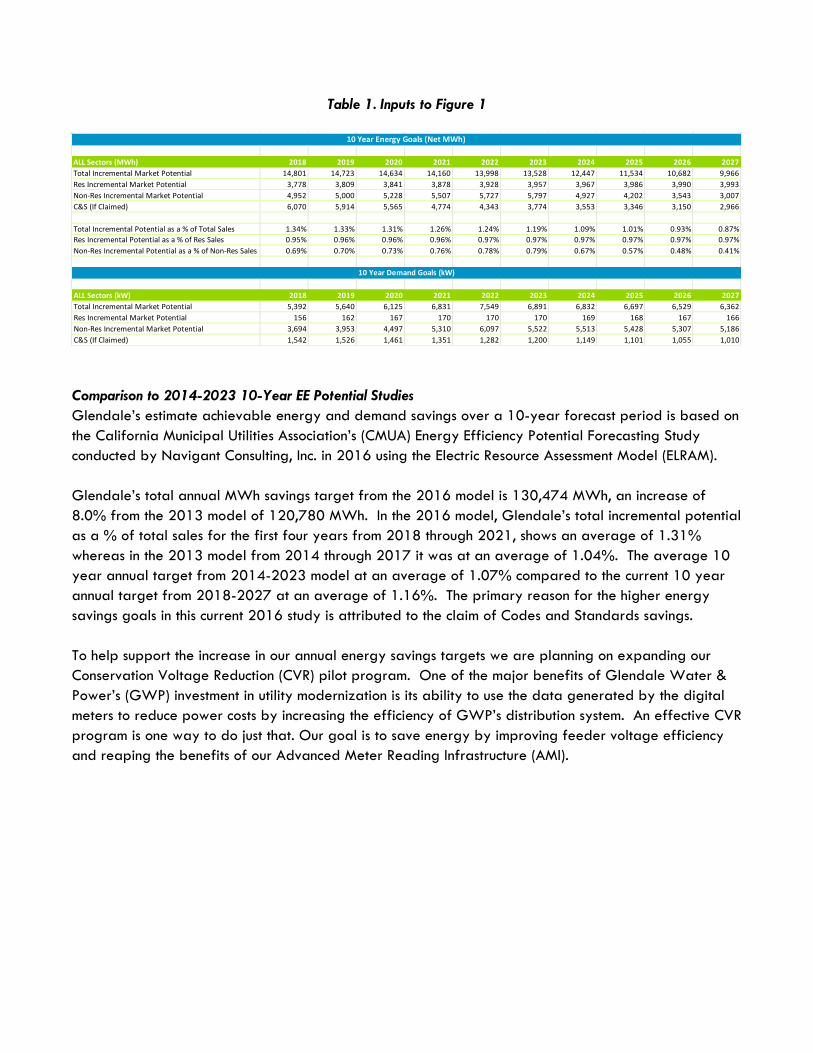
Table 1. Inputs to Figure 1
Comparison to 2014-2023 10-Year EE Potential Studies Glendale’s estimate achievable energy and demand savings over a 10-year forecast period is based on the California Municipal Utilities Association’s (CMUA) Energy Efficiency Potential Forecasting Study conducted by Navigant Consulting, Inc. in 2016 using the Electric Resource Assessment Model (ELRAM). Glendale’s total annual MWh savings target from the 2016 model is 130,474 MWh, an increase of 8.0% from the 2013 model of 120,780 MWh. In the 2016 model, Glendale’s total incremental potential as a % of total sales for the first four years from 2018 through 2021, shows an average of 1.31% whereas in the 2013 model from 2014 through 2017 it was at an average of 1.04%. The average 10 year annual target from 2014-2023 model at an average of 1.07% compared to the current 10 year annual target from 2018-2027 at an average of 1.16%. The primary reason for the higher energy savings goals in this current 2016 study is attributed to the claim of Codes and Standards savings. To help support the increase in our annual energy savings targets we are planning on expanding our Conservation Voltage Reduction (CVR) pilot program. One of the major benefits of Glendale Water & Power’s (GWP) investment in utility modernization is its ability to use the data generated by the digital meters to reduce power costs by increasing the efficiency of GWP’s distribution system. An effective CVR program is one way to do just that. Our goal is to save energy by improving feeder voltage efficiency and reaping the benefits of our Advanced Meter Reading Infrastructure (AMI).
ALL Sectors (MWh) 2018 2019 2020 2021 2022 2023 2024 2025 2026 2027Total Incremental Market Potential 14,801 14,723 14,634 14,160 13,998 13,528 12,447 11,534 10,682 9,966Res Incremental Market Potential 3,778 3,809 3,841 3,878 3,928 3,957 3,967 3,986 3,990 3,993Non-Res Incremental Market Potential 4,952 5,000 5,228 5,507 5,727 5,797 4,927 4,202 3,543 3,007C&S (If Claimed) 6,070 5,914 5,565 4,774 4,343 3,774 3,553 3,346 3,150 2,966
Total Incremental Potential as a % of Total Sales 1.34% 1.33% 1.31% 1.26% 1.24% 1.19% 1.09% 1.01% 0.93% 0.87%Res Incremental Potential as a % of Res Sales 0.95% 0.96% 0.96% 0.96% 0.97% 0.97% 0.97% 0.97% 0.97% 0.97%Non-Res Incremental Potential as a % of Non-Res Sales 0.69% 0.70% 0.73% 0.76% 0.78% 0.79% 0.67% 0.57% 0.48% 0.41%
ALL Sectors (kW) 2018 2019 2020 2021 2022 2023 2024 2025 2026 2027Total Incremental Market Potential 5,392 5,640 6,125 6,831 7,549 6,891 6,832 6,697 6,529 6,362Res Incremental Market Potential 156 162 167 170 170 170 169 168 167 166Non-Res Incremental Market Potential 3,694 3,953 4,497 5,310 6,097 5,522 5,513 5,428 5,307 5,186C&S (If Claimed) 1,542 1,526 1,461 1,351 1,282 1,200 1,149 1,101 1,055 1,010
10 Year Energy Goals (Net MWh)
10 Year Demand Goals (kW)
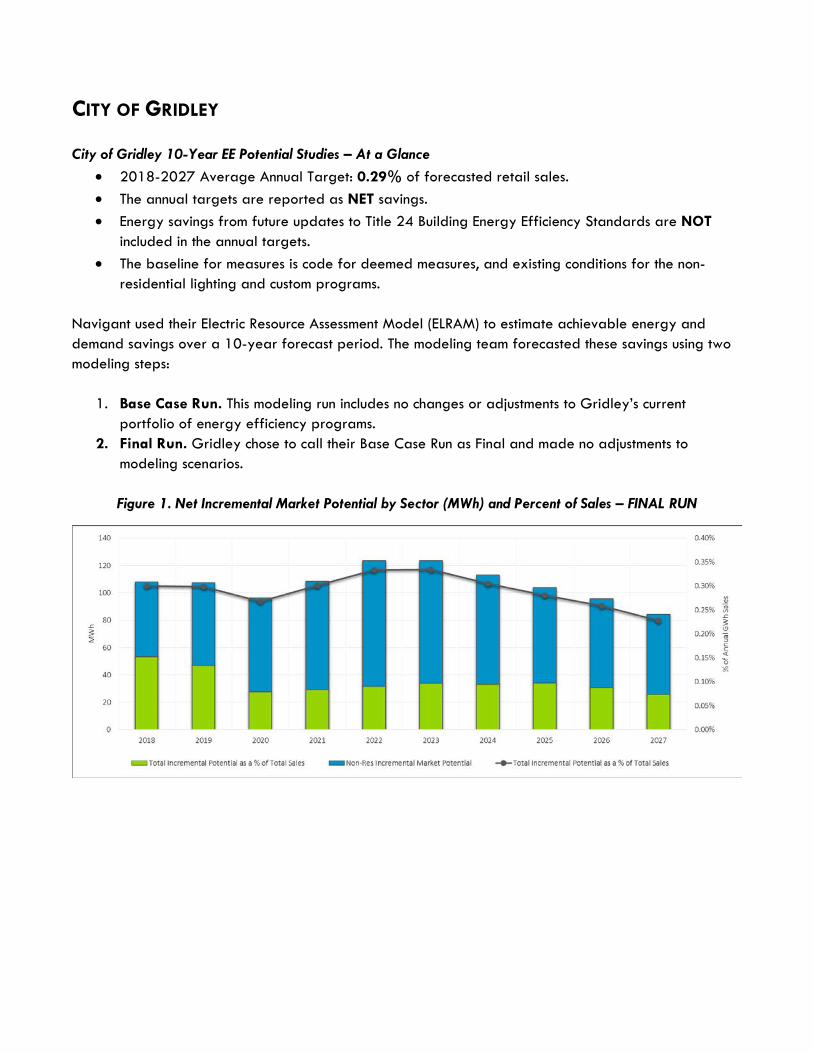
CITY OF GRIDLEY City of Gridley 10-Year EE Potential Studies – At a Glance
• 2018-2027 Average Annual Target: 0.29% of forecasted retail sales. • The annual targets are reported as NET savings. • Energy savings from future updates to Title 24 Building Energy Efficiency Standards are NOT
included in the annual targets. • The baseline for measures is code for deemed measures, and existing conditions for the non-
residential lighting and custom programs. Navigant used their Electric Resource Assessment Model (ELRAM) to estimate achievable energy and demand savings over a 10-year forecast period. The modeling team forecasted these savings using two modeling steps:
1. Base Case Run. This modeling run includes no changes or adjustments to Gridley’s current portfolio of energy efficiency programs.
2. Final Run. Gridley chose to call their Base Case Run as Final and made no adjustments to modeling scenarios.
Figure 1. Net Incremental Market Potential by Sector (MWh) and Percent of Sales – FINAL RUN

Table 1. Inputs to Figure 1
Comparison to 2014-2023 10-Year EE Potential Studies Gridley Municipal Utility (GMU) relied on the ELRAM model to determine the EE potential in the upcoming ten-year period. The current ELRAM model reflected a 38% reduction in potential for 2018-2023. GMU feels a significant responsibility to its community to invest their Public Benefits funds in such a way as to impact both energy savings and financial savings/positive economics in Gridley. GMU offers a comprehensive menu of rebates to all of our customers. GMU’s customer demographic has historically resulted in lower customer participation in programs that require capital investment by the customer.
ALL Sectors (MWh) 2018 2019 2020 2021 2022 2023 2024 2025 2026 2027Total Incremental Market Potential 108 107 96 108 124 124 113 104 96 84Res Incremental Market Potential 53 47 28 29 32 34 33 34 30 26Non-Res Incremental Market Potential 55 61 69 79 92 90 80 70 65 59C&S (If Claimed. Estimates not available after 2024) 0 0 0 0 0 0 0 0 0 0
Total Incremental Potential as a % of Total Sales 0.30% 0.30% 0.27% 0.30% 0.33% 0.33% 0.31% 0.28% 0.26% 0.23%Res Incremental Potential as a % of Res Sales 0.34% 0.30% 0.18% 0.19% 0.20% 0.21% 0.21% 0.21% 0.19% 0.16%Non-Res Incremental Potential as a % of Non-Res Sales 0.27% 0.30% 0.33% 0.37% 0.44% 0.43% 0.38% 0.33% 0.31% 0.28%
ALL Sectors (kW) 2018 2019 2020 2021 2022 2023 2024 2025 2026 2027Total Incremental Market Potential 25 26 27 30 33 32 31 29 28 27Res Incremental Market Potential 11 10 9 10 10 11 11 11 11 10Non-Res Incremental Market Potential 14 16 18 20 23 22 20 18 17 17C&S (If Claimed. Estimates not available after 2024) 0 0 0 0 0 0 0 0 0 0
10 Year Energy Goals (Net MWh)
10 Year Demand Goals (kW)

HEALDSBURG ELECTRIC DEPARTMENT Healdsburg Electric Department 10-Year EE Potential Studies – At a Glance
• 2018-2027 Average Annual Target: 0.52% of forecasted retail sales. • The annual targets are reported as NET savings. • Energy savings from future updates to Title 24 Building Energy Efficiency Standards are NOT
included in the annual targets. • The baseline for measures is existing conditions, except for select measures.
Navigant used their Electric Resource Assessment Model (ELRAM) to estimate achievable energy and demand savings over a 10-year forecast period. The modeling team forecasted these savings using two modeling steps:
1. Base Case Run. This modeling run includes no changes or adjustments to Healdsburg’s current portfolio of energy efficiency programs.
2. Final Run. Healdsburg’s Final Run included the following adjustments to their Base Case Run:
• Utilized a 3-year average calibration target. The three-year average of the years 2013 through 2015 is 32% higher than the 2015 program achievements.
• Expanded measure list. Navigant modeled a number of measures—not currently offered in Healdsburg’s portfolio—to provide a picture of potential savings should Healdsburg decide to expand their current programs. Healdsburg added several residential and commercial measures.
• Increased promotional costs by 50%. • Increased incentive by 50%.
Figure 1. Net Incremental Market Potential by Sector (MWh) and Percent of Sales – FINAL RUN
Table 1. Inputs to Figure 1
ALL Sectors (MWh) 2018 2019 2020 2021 2022 2023 2024 2025 2026 2027Total Incremental Market Potential 490 486 469 466 438 393 358 331 296 257Res Incremental Market Potential 39 48 40 45 51 57 62 64 63 59Non-Res Incremental Market Potential 451 438 429 421 387 336 296 268 233 198C&S (If Claimed. Estimates not available after 2024) 0 0 0 0 0 0 0 0 0 0
Total Incremental Potential as a % of Total Sales 0.65% 0.65% 0.62% 0.61% 0.57% 0.51% 0.46% 0.42% 0.38% 0.33%Res Incremental Potential as a % of Res Sales 0.08% 0.10% 0.08% 0.10% 0.11% 0.12% 0.13% 0.13% 0.13% 0.12%Non-Res Incremental Potential as a % of Non-Res Sales 1.54% 1.47% 1.44% 1.39% 1.28% 1.10% 0.97% 0.88% 0.76% 0.65%
ALL Sectors (kW) 2018 2019 2020 2021 2022 2023 2024 2025 2026 2027Total Incremental Market Potential 98 103 102 101 94 85 79 67 52 38Res Incremental Market Potential 9 12 13 16 20 25 30 26 19 10Non-Res Incremental Market Potential 89 91 89 84 74 60 49 41 34 28C&S (If Claimed. Estimates not available after 2024) 0 0 0 0 0 0 0 0 0 0
10 Year Energy Goals (Net MWh)
10 Year Demand Goals (kW)

Comparison to 2014-2023 10-Year EE Potential Studies The City of Healdsburg did not see significant changes from the annual targets adopted in 2013 for 2018-2023 in the energy efficiency potential studies. There continues to be opportunity for energy efficiency savings in residential, commercial, and industrial sectors in the near term. Looking toward the end of the 10-year window, if program offerings remain the same, savings will dwindle. It will be important to focus on adjusting, revitalizing, and adding new programs as current programs reach saturation. While more than 80% of the City’s electric customers are residential, 66% of retail sales are commercial and industrial customers. This means that, while residential programs, education and outreach will remain a large part of the City’s energy efficiency catalogue, the biggest opportunity for savings will continue to come from commercial and industrial projects. The City is, and will continue to be, focused on growing program offerings to these customer segments that include assistance identifying and completing energy efficiency improvements.

IMPERIAL IRRIGATION DISTRICT Imperial Irrigation District 10-Year EE Potential Studies – At a Glance
• 2018-2027 Average Annual Target: .79% of forecasted retail sales. • The annual targets are reported as NET savings. • Only Codes and Standards that are currently in place today, and NOT future Codes & Standards
such as updates to Title 24. • A mix of existing condition and code baselines for modeled measures, as well as a “dual
baseline” function that can use the existing condition for a portion of the remaining useful life, and the code baseline for the remaining useful life.
Navigant used their Electric Resource Assessment Model (ELRAM) to estimate achievable energy and demand savings over a 10 year forecast period. The modeling team forecasted these savings using two modeling steps:
1. Base Case Run. This modeling run includes no changes or adjustments to IID’s current portfolio of energy efficiency programs.
2. Final Run. IID chose to call their Base Case Run as Final and made no adjustments to modeling scenarios.
10-Year Energy Saving Targets*

Table 1. Inputs to Figure 1
*As of the date this report was submitted, the targets were pending IID board approval. Comparison to 2014-2023 10-Year EE Potential Studies For years 2018-2023, IID’s current 10-year goals are about 160% of the goals established in the prior study. The primary reasons for this shift is IID now claims savings from codes and standards.
ALL Sectors (MWh) 2018 2019 2020 2021 2022 2023 2024 2025 2026 2027Total Incremental Market Potential 33,475 33,760 33,952 32,232 30,894 28,668 27,685 26,708 25,027 22,435Res Incremental Market Potential 8,174 7,999 8,493 8,910 9,013 8,923 8,646 8,312 7,818 6,766Non-Res Incremental Market Potential 7,500 8,076 8,716 9,141 9,212 8,994 8,786 8,618 7,885 6,777C&S (If Claimed. Estimates not available after 2024) 17,801 17,685 16,743 14,181 12,669 10,751 10,252 9,777 9,324 8,892
Total Incremental Potential as a % of Total Sales 0.95% 0.95% 0.94% 0.88% 0.82% 0.75% 0.71% 0.68% 0.63% 0.55%Res Incremental Potential as a % of Res Sales 0.52% 0.50% 0.52% 0.54% 0.53% 0.52% 0.50% 0.47% 0.43% 0.37%Non-Res Incremental Potential as a % of Non-Res Sales 0.38% 0.40% 0.43% 0.44% 0.44% 0.42% 0.40% 0.39% 0.35% 0.30%
ALL Sectors (kW) 2018 2019 2020 2021 2022 2023 2024 2025 2026 2027Total Incremental Market Potential 15,878 15,778 16,105 16,242 16,422 15,033 15,063 15,040 14,856 14,471Res Incremental Market Potential 3,550 3,086 3,290 3,477 3,537 3,515 3,357 3,151 3,006 2,788Non-Res Incremental Market Potential 7,630 7,941 8,202 8,479 8,823 7,704 7,999 8,286 8,347 8,278C&S (If Claimed. Estimates not available after 2024) 4,698 4,751 4,612 4,286 4,062 3,814 3,707 3,603 3,503 3,405
10 Year Energy Goals (Net MWh)
10 Year Demand Goals (kW)

LOS ANGELES DEPARTMENT OF WATER AND POWER (DWP) Los Angeles Department of Water and Power (DWP) 10-Year EE Potential Studies – At a Glance
• A FY17-18 through FY26-27 average annual target of 1.50% of forecasted retail sales. • Gross savings targets of 15% between FY17-18 through FY 26-27. • LADWP claims gross C&S savings. • A/C Optimization Program added in FY20-21. • Efficient Product Marketplace Program added in FY20-21. • Commercial Direct Install Program added in FY20-21. • Added additional measures to existing programs starting FY20-21. • Residential Behavioral Programs expanded in FY20-21. • Commercial and Industrial Behavioral Programs added in FY20-21. • Incentives increased by 1.5 starting in FY20-21. • The C&S claim is expressed as GROSS savings • All measures are using existing condition baselines when savings are available in that format,
staying consistent with how LADWP programs are administered. Any potential double counting of C&S savings have been taken into consideration and removed from the C&S potentials.
Summary of Potential Navigant used their Electric Resource Assessment Model (ELRAM) to estimate achievable energy and demand savings over a 10-year forecast period. The modeling team forecasted these savings using two modeling steps:
1. Base Case Run. This modeling run includes no changes or adjustments to LADWP’s current portfolio of energy efficiency programs.
2. Final Run. This modeling run uses LADWP’s chosen adjustments—if any—to various features within the model to illustrate increased energy savings goals. This run may be the same as the Base Case Run if the utility chose not to make adjustments to current portfolio offerings
LADWP’s Final Run included the following adjustments to their Base Case Run:
• LADWP, from a recent, different potential study, had in place program goals through FY19-20. These goals were maintained.
• A/C Optimization Program added in FY20-21 • Efficient Product Marketplace Program added in FY20-21 • Commercial Direct Install Program added in FY20-21 • Added additional measures to existing programs starting FY20-21 • Residential Behavioral Programs expanded in FY20-21 • Commercial and Industrial Behavioral Programs added in FY20-21 • Incentives increased by 1.5 starting in FY20-21
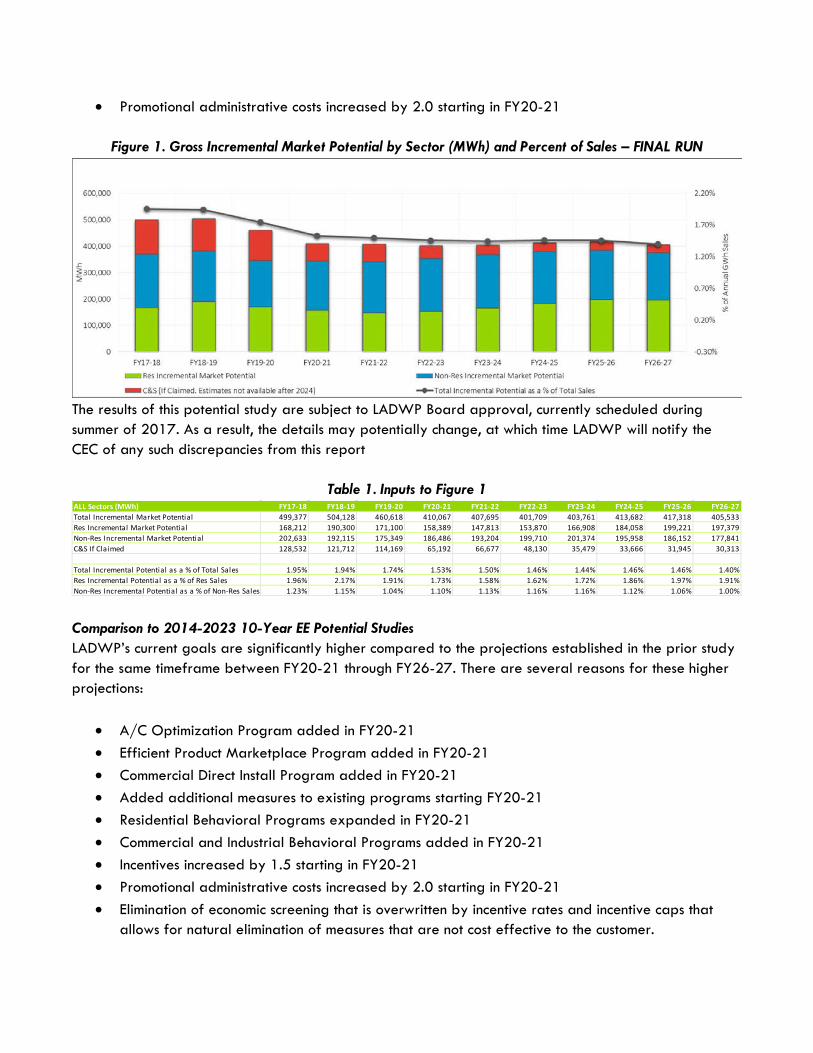
• Promotional administrative costs increased by 2.0 starting in FY20-21
Figure 1. Gross Incremental Market Potential by Sector (MWh) and Percent of Sales – FINAL RUN
The results of this potential study are subject to LADWP Board approval, currently scheduled during summer of 2017. As a result, the details may potentially change, at which time LADWP will notify the CEC of any such discrepancies from this report
Table 1. Inputs to Figure 1
Comparison to 2014-2023 10-Year EE Potential Studies LADWP’s current goals are significantly higher compared to the projections established in the prior study for the same timeframe between FY20-21 through FY26-27. There are several reasons for these higher projections:
• A/C Optimization Program added in FY20-21 • Efficient Product Marketplace Program added in FY20-21 • Commercial Direct Install Program added in FY20-21 • Added additional measures to existing programs starting FY20-21 • Residential Behavioral Programs expanded in FY20-21 • Commercial and Industrial Behavioral Programs added in FY20-21 • Incentives increased by 1.5 starting in FY20-21 • Promotional administrative costs increased by 2.0 starting in FY20-21 • Elimination of economic screening that is overwritten by incentive rates and incentive caps that
allows for natural elimination of measures that are not cost effective to the customer.
ALL Sectors (MWh) FY17-18 FY18-19 FY19-20 FY20-21 FY21-22 FY22-23 FY23-24 FY24-25 FY25-26 FY26-27Total Incremental Market Potential 499,377 504,128 460,618 410,067 407,695 401,709 403,761 413,682 417,318 405,533Res Incremental Market Potential 168,212 190,300 171,100 158,389 147,813 153,870 166,908 184,058 199,221 197,379Non-Res Incremental Market Potential 202,633 192,115 175,349 186,486 193,204 199,710 201,374 195,958 186,152 177,841C&S If Claimed 128,532 121,712 114,169 65,192 66,677 48,130 35,479 33,666 31,945 30,313
Total Incremental Potential as a % of Total Sales 1.95% 1.94% 1.74% 1.53% 1.50% 1.46% 1.44% 1.46% 1.46% 1.40%Res Incremental Potential as a % of Res Sales 1.96% 2.17% 1.91% 1.73% 1.58% 1.62% 1.72% 1.86% 1.97% 1.91%Non-Res Incremental Potential as a % of Non-Res Sales 1.23% 1.15% 1.04% 1.10% 1.13% 1.16% 1.16% 1.12% 1.06% 1.00%

LASSEN MUNICIPAL UTILITY DISTRICT Lassen MUD 10-Year EE Potential Studies – At a Glance
• 2018-2027 Average Annual Target: 0.22% of forecasted retail sales. • The annual targets are reported as NET savings. • Energy savings from future updates to Title 24 Building Energy Efficiency Standards are NOT
included in the annual targets. • The baseline for measures is code for deemed measures, except for non-residential lighting and
custom projects which use existing conditions. Navigant used their Electric Resource Assessment Model (ELRAM) to estimate achievable energy and demand savings over a 10-year forecast period. The modeling team forecasted these savings using two modeling steps:
1. Base Case Run. This modeling run includes no changes or adjustments to Lassen’s current portfolio of energy efficiency programs.
2. Final Run. Lassen modified program design to include early retirement starting in 2018.
Figure 1. Net Incremental Market Potential by Sector (MWh) and Percent of Sales – FINAL RUN

Table 1. Inputs to Figure 1
Comparison to 2014-2023 10-Year EE Potential Studies In the past few years Lassen has experienced very small to nearly flat load growth in all customer sectors. This has a negative effect on potential energy efficiency opportunities. Within the next few years we anticipate the lighting market will be saturated with LEDs which have historically made up a large percentage of our savings. We plan on exploring new technologies as they come into the market place to augment our existing programs in order to achieve our EE goals. For years 2018-2023, our 2018-2027 goals are 2% higher than the prior study, which is in line with our anticipated load growth in the same time period. Based on the ELRAM model, we believe our EE goals are reasonable and achievable.
ALL Sectors (MWh) 2018 2019 2020 2021 2022 2023 2024 2025 2026 2027Total Incremental Market Potential 353 371 318 339 356 359 352 350 332 320Res Incremental Market Potential 256 267 205 214 221 228 222 221 206 201Non-Res Incremental Market Potential 97 104 114 125 134 131 130 129 126 120C&S (If Claimed) 0 0 0 0 0 0 0 0 0 0
Total Incremental Potential as a % of Total Sales 0.27% 0.28% 0.24% 0.25% 0.26% 0.26% 0.26% 0.25% 0.24% 0.23%Res Incremental Potential as a % of Res Sales 1.84% 1.92% 1.46% 1.51% 1.55% 1.59% 1.55% 1.53% 1.43% 1.39%Non-Res Incremental Potential as a % of Non-Res Sales 0.08% 0.09% 0.10% 0.10% 0.11% 0.11% 0.11% 0.11% 0.10% 0.10%
ALL Sectors (kW) 2018 2019 2020 2021 2022 2023 2024 2025 2026 2027Total Incremental Market Potential 79 86 87 96 104 104 103 102 98 92Res Incremental Market Potential 35 39 35 39 41 44 44 44 42 41Non-Res Incremental Market Potential 44 47 52 58 63 60 59 58 56 51C&S (If Claimed) 0 0 0 0 0 0 0 0 0 0
10 Year Demand Goals (kW)

CITY OF LODI City of Lodi 10-Year EE Potential Studies – At a Glance
• 2018-2027 Average Annual Target: 0.34% of forecasted retail sales. • The annual targets are reported as NET savings. • Energy savings from future updates to Title 24 Building Energy Efficiency Standards are NOT
included in the annual targets. • The baseline for measures is EXISITING CONDITIONS, except for select measures.
Navigant used their Electric Resource Assessment Model (ELRAM) to estimate achievable energy and demand savings over a 10-year forecast period. The modeling team forecasted these savings using two modeling steps:
1. Base Case Run. This modeling run includes no changes or adjustments to Lodi’s current portfolio of energy efficiency programs.
2. Final Run. Lodi chose to call their Base Case Run as Final and made no adjustments to modeling scenarios.
Figure 1. Gross Incremental Market Potential by Sector (MWh) and Percent of Sales – FINAL RUN
Table 1. Inputs to Figure 1
ALL Sectors (MWh) 2018 2019 2020 2021 2022 2023 2024 2025 2026 2027Total Incremental Market Potential 1,227 1,313 1,399 1,496 1,575 1,604 1,612 1,618 1,587 1,534Res Incremental Market Potential 361 380 387 408 427 443 453 458 458 454Non-Res Incremental Market Potential 866 933 1,011 1,089 1,147 1,161 1,160 1,160 1,130 1,079C&S (If Claimed. Estimates not available after 2024) 0 0 0 0 0 0 0 0 0 0
Total Incremental Potential as a % of Total Sales 0.28% 0.30% 0.32% 0.34% 0.36% 0.36% 0.36% 0.36% 0.35% 0.34%Res Incremental Potential as a % of Res Sales 0.24% 0.25% 0.26% 0.27% 0.28% 0.29% 0.29% 0.30% 0.29% 0.29%Non-Res Incremental Potential as a % of Non-Res Sales 0.31% 0.33% 0.35% 0.38% 0.40% 0.40% 0.40% 0.40% 0.38% 0.36%
ALL Sectors (kW) 2018 2019 2020 2021 2022 2023 2024 2025 2026 2027Total Incremental Market Potential 372 394 418 440 457 465 472 480 470 452Res Incremental Market Potential 171 183 194 205 213 218 221 220 218 214Non-Res Incremental Market Potential 201 212 224 235 244 246 252 259 252 238C&S (If Claimed. Estimates not available after 2024) 0 0 0 0 0 0 0 0 0 0
10 Year Demand Goals (kW)

Comparison to 2014-2023 10-Year EE Potential Studies For years 2018-2023, Lodi’s current 10-year goals are about 46% of the goals established in the prior study.

CITY OF LOMPOC City of Lompoc 10-Year EE Potential Studies – At a Glance
• 2018-2027 Average Annual Target: .20% of forecasted retail sales. • The annual targets are reported as GROSS savings. • Energy savings from future updates to Title 24 Building Energy Efficiency Standards are NOT
included in the annual targets. • The baseline for measures is existing conditions, except for select measures.
The climate and customer mix of Lompoc limit opportunities for energy savings potential. Due to the mild climate year round, air conditioning is not typically installed in residential buildings and is limited in commercial buildings. Heating is done primarily with gas. The average residential electric consumption per month is 325 kWh. The peak demand for electricity is in the winter in the early evening. Since there is little need for air conditioning in our coastal climate and heating is primarily done with gas, the majority of rebate programs are focused on lighting and refrigeration retrofits. Commercial customers make up 11% of the customer mix. Municipal use makes up 1%. Of the 88% of residential customers, 56% live in rental housing and 21% of these are at or below the poverty level (taken from 2011-2015 American Community Survey). Lompoc is considered a disadvantaged community and a very small portion of residential customers have the expendable money to upgrade to more energy efficient equipment unless Lompoc heavily subsidies the purchase of the equipment. Hence, Lompoc has created programs that offer a higher rebate and pays for the initial purchase of a product with the customer paying back a portion over a one year period. The majority of Lompoc’s commercial customers are small business owners who rent on a short term lease, have relatively low electric bills and are often unwilling to perform retrofits to the building. Lompoc has no industrial customers and limited demand customers. Since there is little need for air conditioning in our coastal climate, most of our rebate programs are focused on lighting retrofits. Many customers have already retrofitted T-12 lighting to T-8 and hesitate or are unable to expend available monies on greater energy efficiency savings with LED lighting. The increased building code requirements and Title 24 Standards have also discouraged customers from upgrading due to the increased costs. Most of the larger commercial customers or demand customers who have long term leases or own their building have taken advantage of lighting retrofits and efficiency programs in the past. We have little manufacturing facilities in the City and the few we have are small and do not have the potential for upgraded equipment. Therefore, it is becoming more and more difficult to offer energy efficient incentives and achieve and meet goals but staff will continue to look at potential programs that will be attractive to our customers while striving to meet our energy efficiency goals. To encourage more participation in programs, Lompoc will consider providing more direct install programs to make it easier for customers. In the commercial sector, the restaurant market has potential for energy savings through appliance and refrigeration cooler retrofit programs. Small convenience and

grocery stores may see additional savings through refrigeration case lighting, equipment and gasket rebate programs. The City will evaluate the addition of commercial direct install incentive programs for lighting and refrigeration to encourage tenants to make retrofits with less out of pocket costs. In the residential market, an upstream LED light bulb program will be considered to make it easier for customers to purchase LED lighting without having to exchange bulbs as required by the current program. Many customers took advantage of previous CFL rebate programs and are unwilling to invest in new LED lighting. To help the few customers with all electric homes, rebates will be provided to customers retrofitting old appliances heated by electricity to more efficient electric or gas appliances. Staff will also consider creating new direct install programs for interior and exterior lighting, refrigeration and electric water heating to encourage owners of multi-family buildings to invest in energy efficiency.
Figure 1. Gross Incremental Market Potential by Sector (MWh) and Percent of Sales – FINAL RUN
Table 1. Inputs to Figure 1
Comparison to 2014-2023 10-Year EE Potential Study For years 2018-2023, Lompoc’s current 10-year goals are higher than the goals established in the prior study. The primary reasons for the higher savings include adding residential and commercial sector
ALL Sectors (MWh) 2018 2019 2020 2021 2022 2023 2024 2025 2026 2027Total Incremental Market Potential 213 236 249 266 282 300 313 324 326 320Res Incremental Market Potential 109 115 114 118 122 125 128 131 133 129Non-Res Incremental Market Potential 104 120 134 148 160 175 185 193 193 191C&S (If Claimed) 0 0 0 0 0 0 0 0 0 0
Total Incremental Potential as a % of Total Sales 0.16% 0.17% 0.18% 0.19% 0.20% 0.21% 0.22% 0.23% 0.23% 0.22%Res Incremental Potential as a % of Res Sales 0.20% 0.21% 0.21% 0.21% 0.22% 0.22% 0.23% 0.23% 0.23% 0.23%Non-Res Incremental Potential as a % of Non-Res Sales 0.13% 0.14% 0.16% 0.17% 0.19% 0.21% 0.22% 0.22% 0.22% 0.22%
ALL Sectors (kW) 2018 2019 2020 2021 2022 2023 2024 2025 2026 2027Total Incremental Market Potential 34 37 39 42 45 48 50 53 53 52Res Incremental Market Potential 11 12 12 13 13 14 14 14 14 14Non-Res Incremental Market Potential 23 24 26 29 31 34 36 38 38 38C&S (If Claimed) 0 0 0 0 0 0 0 0 0 0
10 Year Demand Goals (kW)

measures to the portfolio, starting in 2018 and claiming gross savings targets while net savings targets were claimed in the prior study. The climate and customer mix of Lompoc limit opportunities for energy savings. Commercial and municipal customers make up only 12% of the customer base while 88% of the customer base is residential. Due to the mild climate year round, air conditioning is not typically installed in residential buildings and is limited in commercial buildings. Since there is little need for air conditioning and heating is primarily done with gas, the majority of rebate programs are focused on lighting and refrigeration retrofits. Saturation of these markets will be seen in the next few years. To increase savings potential, several measures will be added to the portfolio, mostly in the commercial sector. To encourage more participation, Lompoc will evaluate adding new direct install programs in both the commercial and residential sectors to make it easier for customers to invest in energy efficiency upgrades.

MERCED IRRIGATION DISTRICT Utility Name 10-Year EE Potential Studies – At a Glance
• 2018-2027 Average Annual Target: 0.30% of forecasted retail sales. • The annual targets are reported as NET savings • Energy savings from future updates to Title 24 Building Energy Efficiency Standards are NOT
included in the annual targets. • The baseline for measures is EXISITING CONDITIONS except for select measures.
Navigant used their Electric Resource Assessment Model (ELRAM) to estimate achievable energy and demand savings over a 10-year forecast period. The modeling team forecasted these savings using two modeling steps:
1. Base Case Run. This modeling run includes no changes or adjustments to Merced’s current portfolio of energy efficiency programs.
2. Final Run. Merced chose to call their Base Case Run as Final and made no adjustments to modeling scenarios.
Figure 1. Net Incremental Market Potential by Sector (MWh) and Percent of Sales – FINAL RUN

Table 1. Inputs to Figure 1
Comparison to 2014-2023 10-Year EE Potential Studies For years 2018-2023, Merced’s current 10-year goals are about 79% of the goals established in the prior study. The Merced Irrigation District (MID) provides retail electric service to over 9,000 customers, approximately 7,500 residential customers and 1,500 commercial/industrial customer in Eastern Merced County. The District has been providing retail electric service since 1996. Our residential rate base is primarily made up of new construction. While we offer customers rebates for appliances, air conditioning, and lighting, we have very little claimed energy savings from our residential customers. A majority of MID’s energy efficiency savings result from projects from our larger industrial customers. These customers implement larger energy efficiency projects. Our future goals include a complete overhaul of our current rebate programs. We will be updating our current rebates to be more in line with current industry applications. In addition to revising the current types of measures, we will also evaluate increasing incentive amounts. Another possibility is to add behavioral programs. Additional marketing and promotion for new programs will also be needed. New programs will produce the need for customer education and allow for additional marketing efforts.
ALL Sectors (MWh) 2018 2019 2020 2021 2022 2023 2024 2025 2026 2027Total Incremental Market Potential 1,258 1,346 1,452 1,551 1,597 1,586 1,525 1,455 1,392 1,350Res Incremental Market Potential 14 15 16 19 23 24 25 26 26 26Non-Res Incremental Market Potential 1,244 1,330 1,436 1,532 1,574 1,562 1,500 1,429 1,366 1,324C&S (If Claimed. Estimates not available after 2024) 0 0 0 0 0 0 0 0 0 0
Total Incremental Potential as a % of Total Sales 0.27% 0.28% 0.30% 0.32% 0.33% 0.32% 0.31% 0.29% 0.28% 0.27%Res Incremental Potential as a % of Res Sales 0.02% 0.03% 0.03% 0.03% 0.04% 0.04% 0.04% 0.04% 0.04% 0.04%Non-Res Incremental Potential as a % of Non-Res Sales 0.30% 0.32% 0.34% 0.36% 0.37% 0.36% 0.34% 0.32% 0.31% 0.29%
ALL Sectors (kW) 2018 2019 2020 2021 2022 2023 2024 2025 2026 2027Total Incremental Market Potential 219 236 255 273 281 279 265 248 234 229Res Incremental Market Potential 1 1 1 1 1 1 1 1 1 1Non-Res Incremental Market Potential 219 235 254 272 281 278 264 248 233 228C&S (If Claimed. Estimates not available after 2024) 0 0 0 0 0 0 0 0 0 0
10 Year Energy Goals (Net MWh)
10 Year Demand Goals (kW)

MODESTO IRRIGATION DISTRICT (MID) MID 10-Year EE Potential Study – At a Glance
• 2018-2027 Average Annual Target: 0.43 % of forecasted retail sales. • The annual targets are reported as NET savings • Energy savings from future updates to Title 24 Building Energy Efficiency Standards are
NOT included in the annual targets. • The baseline for measures is CODE, except for select measures
Navigant used their Electric Resource Assessment Model (ELRAM) to estimate achievable energy and demand savings over a 10-year forecast period. The modeling team forecasted these savings using two modeling steps:
1. Base Case Run. This modeling run includes no changes or adjustments to Modesto’s current portfolio of energy efficiency programs.
2. Final Run. Modesto chose to call their Base Case Run as Final and made no adjustments to modeling scenarios.
Figure 1. Net Incremental Market Potential by Sector (MWh) and Percent of Sales – FINAL RUN

Table 1. Inputs to Figure 1
Comparison to 2014-2023 10-Year EE Potential Study The current EE potential study is based on an enhanced version of the modeling tool used for the previous EE potential study. The enhancements made to the modeling tool since the prior EE potential study are described in detail elsewhere in this 2017 POU status report. However, one key factor - model calibration - resulted in a significant change (downward adjustment) to MID’s targets for the current study relative to the previous study. Over the past decade, MID’s annual EE program results have fluctuated greatly from year to year, ranging from a low of 5.6 GWH to a high of 16.8 GWH (0.22% of actual sales to 0.69% of actual sales). For the 2014-2023 study, model calibration was set at 1% of forecasted sales, which was significantly higher than MID had ever achieved. For the 2018-2027 study, model calibration was set at the average of the prior three years of program achievement, which included two moderate years and one higher year. As such, model calibration for the current study is not unduly influenced by an outlier or arbitrary value as model calibration for the previous study may have been. The revised model calibration methodology reflects continuation of MID’s current program offerings and results in targets that better align with actuals. MID regards the model output to be representative of the incremental market potential for its anticipated EE programs. MID has not yet formally adopted EE targets for the 2018-2027 forecast period, so this data is provided as preliminary and subject to possible revision.
ALL Sectors (MWh) 2018 2019 2020 2021 2022 2023 2024 2025 2026 2027Total Incremental Market Potential 9,144 10,060 11,062 12,052 12,879 13,385 13,700 13,714 13,149 11,883Res Incremental Market Potential 464 489 495 526 559 585 603 615 622 624Non-Res Incremental Market Potential 8,680 9,570 10,567 11,526 12,320 12,800 13,096 13,098 12,527 11,259C&S (If Claimed. Estimates not available after 2024) 0 0 0 0 0 0 0 0 0 0
Total Incremental Potential as a % of Total Sales 0.34% 0.37% 0.41% 0.44% 0.46% 0.47% 0.48% 0.48% 0.45% 0.41%Res Incremental Potential as a % of Res Sales 0.05% 0.05% 0.05% 0.05% 0.06% 0.06% 0.06% 0.06% 0.06% 0.06%Non-Res Incremental Potential as a % of Non-Res Sales 0.49% 0.54% 0.59% 0.63% 0.67% 0.69% 0.70% 0.69% 0.65% 0.58%
ALL Sectors (kW) 2018 2019 2020 2021 2022 2023 2024 2025 2026 2027Total Incremental Market Potential 2,181 2,374 2,640 2,972 3,287 3,242 3,344 3,371 3,313 3,155Res Incremental Market Potential 173 176 176 179 182 184 186 188 190 192Non-Res Incremental Market Potential 2,008 2,197 2,464 2,793 3,105 3,058 3,158 3,182 3,122 2,963C&S (If Claimed. Estimates not available after 2024) 0 0 0 0 0 0 0 0 0 0
10 Year Energy Goals (Net MWh)
10 Year Demand Goals (kW)

MORENO VALLEY UTILITY Moreno Valley Utility 10-Year EE Potential Studies – At a Glance
• 2018-2027 Average Annual Target: 0.65% of forecasted retail sales. • The annual targets are reported as NET savings. • Energy savings from codes and standards (C&S) that are currently in place today ARE included,
but not future C&S such as updates to Title 24. • The baseline for measures is a mix of existing condition and code baselines.
Navigant used their Electric Resource Assessment Model (ELRAM) to estimate achievable energy and demand savings over a 10-year forecast period. The modeling team forecasted these savings using two modeling steps:
1. Base Case Run. This modeling run includes no changes or adjustments to Moreno Valley’s current portfolio of energy efficiency programs.
2. Final Run. Moreno Valley’s Final Run included the following adjustments to their Base Case Run:
• A 50% reduction to baseline densities to account for the relatively newer age of homes and buildings in their service territory
• A 50% reduction to the impacts of the behavioral program • Increased administrative costs by 1.5 • Adjustments to the photovoltaic (PV) forecasts based on actual Moreno Valley data • Inclusion of a revised sales forecast
Figure 1. Net Incremental Market Potential by Sector (MWh) and Percent of Sales – FINAL RUN

Table 1. Inputs to Figure 1
Comparison to 2014-2023 10-Year EE Potential Studies The years 2018-2023 overlap between the two 10-year study periods. Moreno Valley’s current 10-year goals are nearly 5-times greater than the goals established in the prior study. The primary reasons are model calibration and increased promotional activities.
ALL Sectors (MWh) 2018 2019 2020 2021 2022 2023 2024 2025 2026 2027Total Incremental Market Potential 1,734 1,748 1,752 1,630 1,427 1,227 1,106 1,007 909 833Res Incremental Market Potential 0 0 0 0 0 0 0 0 0 0Non-Res Incremental Market Potential 752 753 761 761 617 501 417 354 290 245C&S (If Claimed. Estimates not available after 2024) 982 994 991 869 809 726 689 653 620 588
Total Incremental Potential as a % of Total Sales 0.87% 0.87% 0.86% 0.79% 0.69% 0.59% 0.52% 0.47% 0.42% 0.38%Res Incremental Potential as a % of Res Sales 0.00% 0.00% 0.00% 0.00% 0.00% 0.00% 0.00% 0.00% 0.00% 0.00%Non-Res Incremental Potential as a % of Non-Res Sales 0.46% 0.46% 0.46% 0.45% 0.36% 0.29% 0.24% 0.20% 0.16% 0.14%
ALL Sectors (kW) 2018 2019 2020 2021 2022 2023 2024 2025 2026 2027Total Incremental Market Potential 413 419 416 400 359 321 296 275 255 239Res Incremental Market Potential 0 0 0 0 0 0 0 0 0 0Non-Res Incremental Market Potential 164 163 164 164 132 104 85 72 58 48C&S (If Claimed. Estimates not available after 2024) 249 256 252 236 228 218 210 204 197 191
10 Year Energy Goals (Net MWh)
10 Year Demand Goals (kW)

CITY OF NEEDLES City of Needles 10-Year EE Potential Studies – At a Glance
• 2018-2027 Average Annual Target: 0.04% of forecasted retail sales. • The annual targets are reported as NET savings. • Energy savings from future updates to Title 24 Building Energy Efficiency Standards are NOT
included in the annual targets. • A mix of existing condition and code baselines for modeled measures, as well as a “dual
baseline” function that can use the existing condition for a portion of the remaining useful life, and the code baseline for the remaining useful life.
Navigant used their Electric Resource Assessment Model (ELRAM) to estimate achievable energy and demand savings over a 10-year forecast period. The modeling team forecasted these savings using two modeling steps:
1. Base Case Run. This modeling run includes no changes or adjustments to Needles’s current portfolio of energy efficiency programs.
2. Final Run. Needles chose to expand the list of measures modeled in ELRAM to include a number of ENERGY STAR® Appliances as they look to add these technologies to their program offerings.
Figure 1. Net Incremental Market Potential by Sector (MWh) and Percent of Sales – FINAL RUN
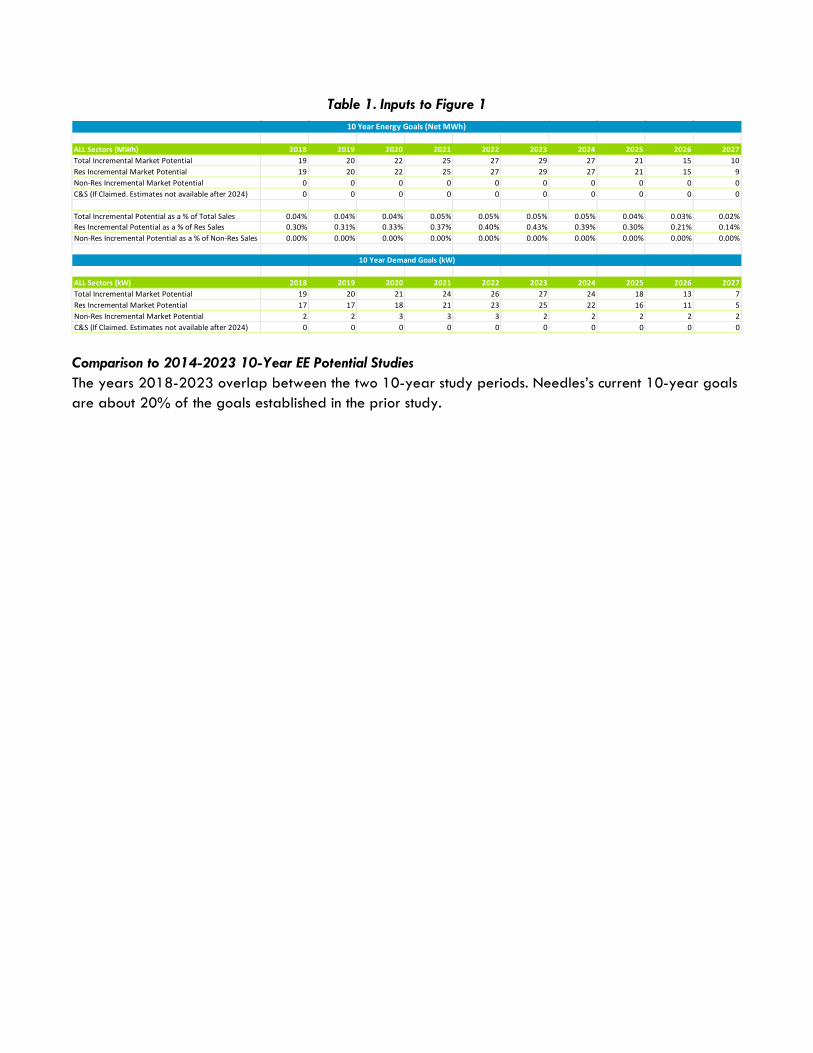
Table 1. Inputs to Figure 1
Comparison to 2014-2023 10-Year EE Potential Studies The years 2018-2023 overlap between the two 10-year study periods. Needles’s current 10-year goals are about 20% of the goals established in the prior study.
ALL Sectors (MWh) 2018 2019 2020 2021 2022 2023 2024 2025 2026 2027Total Incremental Market Potential 19 20 22 25 27 29 27 21 15 10Res Incremental Market Potential 19 20 22 25 27 29 27 21 15 9Non-Res Incremental Market Potential 0 0 0 0 0 0 0 0 0 0C&S (If Claimed. Estimates not available after 2024) 0 0 0 0 0 0 0 0 0 0
Total Incremental Potential as a % of Total Sales 0.04% 0.04% 0.04% 0.05% 0.05% 0.05% 0.05% 0.04% 0.03% 0.02%Res Incremental Potential as a % of Res Sales 0.30% 0.31% 0.33% 0.37% 0.40% 0.43% 0.39% 0.30% 0.21% 0.14%Non-Res Incremental Potential as a % of Non-Res Sales 0.00% 0.00% 0.00% 0.00% 0.00% 0.00% 0.00% 0.00% 0.00% 0.00%
ALL Sectors (kW) 2018 2019 2020 2021 2022 2023 2024 2025 2026 2027Total Incremental Market Potential 19 20 21 24 26 27 24 18 13 7Res Incremental Market Potential 17 17 18 21 23 25 22 16 11 5Non-Res Incremental Market Potential 2 2 3 3 3 2 2 2 2 2C&S (If Claimed. Estimates not available after 2024) 0 0 0 0 0 0 0 0 0 0
10 Year Energy Goals (Net MWh)
10 Year Demand Goals (kW)

CITY OF PALO ALTO UTILITIES City of Palo Alto Utilities 10-Year EE Potential Studies – At a Glance
• 2018-2027 Average Annual Target: 0.57% of forecasted retail sales • The annual targets are reported as NET savings • Energy savings from future updates to Title 24 Building Energy Efficiency Standards are not
included in the annual targets • The baseline for measures is code, except for select measures
Table 1. CPAU 2018-2027 annual electric EE goals, as a both a percentage of total retail sales and in energy units.
Electric (%)
Electric MWh
2018 0.75% 7,300 2019 0.75% 7,300 2020 0.80% 7,800 2021 0.80% 7,800 2022 0.85% 8,300 2023 0.85% 8,300 2024 0.90% 8,600 2025 0.90% 8,600 2026 0.95% 9,100 2027 0.95% 9,200
Sum of 10-year EE Goal 8.5% 82,300
Comparison to 2014-2023 10-Year EE Potential Studies The City of Palo Alto Utilities (CPAU) has long recognized cost-effective energy efficiency (EE) as the highest priority energy resource, given that EE typically displaces relatively expensive electricity generation, lowers energy bills for customers, and contributes to economic development. Relative to the 2014-2023 annual savings goals these new annual savings goals for 2018 to 2027 are 35% higher as shown in Figure 1. On a cumulative basis, the 2018-2027 cumulative electric EE goal of 5.7% is 19% greater than the cumulative goal of 4.8% from 2014 to 2023 as shown in Figure 3. These goals are especially ambitious given 1) savings from lighting are expected to decline, due to our high penetration of LED lighting, and 2) that CPAU does not claim savings from increasingly stringent statewide building codes and appliance standards. CPAU is proposing to test and evaluate a number of new programs to reach these ambitious goals. As the increase in annual savings targets is larger than the increase in cumulative savings, this also represents a general shift in the portfolio towards relatively shorter-lived savings such as behavioral savings and retrocommissioning (RCx) measures.

Figure 1. Comparison of 2018-2027 electric EE goals to 2014-2023 electric EE goals.
Figure 2 shows the reported EE savings as well as the 2018-2027 annual electric EE goals expressed in MWh. The big jump in 2012’s reported savings was due to the completion of a significant EE project at a large commercial site, which is unlikely to be replicable. Figure 2. Historic electric EE savings and 2018-2027 annual electric EE goals on an energy basis.
The projected cumulative savings from these goals is shown in Figure 3. The cumulative savings from 2018 to 2027 attributable to utility programs, without counting statewide building codes and appliance standards, is projected to be 5.7%. The cumulative savings from 2018 to 2027, including both utility programs and statewide building codes and appliance standards, is projected to be 8.5%.

Figure 3. Projected cumulative electric EE savings from 2018-2027, not including cumulative savings prior to 2018.
New programs and programs changes modeled using Navigant ELRAM model CPAU used the Navigant ELRAM model to explore new programs that would significantly increase our EE market potential beyond our existing EE portfolio. Under a Business-As-Usual scenario with no new programs, the ELRAM model estimates a market potential with average annual savings of 0.65% and cumulative savings of 4.9% from 2018 to 2027. Under an aggressive EE scenario which includes several new programs, the ELRAM model shows a CPAU market potential with average annual savings of 0.85% and cumulative savings of 5.7% from 2018 to 2027. CPAU adopted the 2018-2027 goals shown here based on this aggressive EE scenario. The following three new programs are primarily responsible for the increased market potential of EE savings, as they are projected to provide substantial new streams of highly cost-effective savings.
1. Requiring retrocommissioning (RCx) activities to follow the 2016 Statewide Retrocommissioning Policy & Procedures Manual regarding procedures to ensure longer persistence of RCx savings.1
Currently CPAU assumes that RCx savings have a one-year persistence; in other words, RCx projects do not result in EE savings after one year. The statewide manual for the investor-owned utilities recommends greater persistence of RCx savings, but specifies policies to ensure this persistence. CPAU will be implementing these procedures outlined in the manual in order to ensure persistence of RCx savings.
2. Building Operator Certification (BOC) program savings based on the 2014 study2 funded by the California Public Utilities Commission (CPUC)
1This manual governs the RCx procedures for investor-owned utilities. The protocols CPAU will be implementing are shown in the project persistence section 1.7 of the 2016 Statewide Retrocommissioning Policy & Procedures Manual found here: https://www.pge.com/pge_global/common/pdfs/save-energy-money/facility-improvements/retrocommissioning/2016-Statewide-RCx-Policy-Procedures-Manual.pdf

In 2014 a study funded by the CPUC found net savings of 32.02 MWh, 0.0045 MW, and 0.525 kTherm per participant from the BOC program in California. These savings are calculated using a net to gross ratio of 0.69. This same study suggests that persistence of the BOC program savings can be conservatively estimated at three to four years. CPAU is evaluating the appropriate accounting for the BOC training as well as the appropriate persistence of energy savings.
3. Accounting for the Palo Alto Energy Reach Code savings from the Green Building Ordinance.
To date, the Palo Alto local energy reach code savings have not been claimed despite modeling that suggests substantial savings. CPAU will be developing a process to capture the energy savings attributable to the local Green Building Ordinance. Modeled end-use savings will then be associated with the appropriate persistence as well as the appropriate compliance factors. Preliminary analysis suggests large potential savings from the current energy reach code, and future code cycles may capture more cost-effective savings from existing buildings.
The three programs detailed above are the highest priority new programs, with other programs focusing on early retirement protocols for select measures. CPAU will also be evaluating new programs in residential behavioral savings, financing, and emerging EE technologies. CPAU will be continuously monitoring the cost-effectiveness of programs as CPAU incentives are substantial and CPAU marketing efforts are already extensive. Projected Demand Savings Based on the aggressive EE scenario the ELRAM model projects the electric EE demand savings shown below in Table 2 for CPAU. Table 2. Projected electric demand savings from the CPAU 2018-2027 electric EE goals.
All Sectors (kW) 2018 2019 2020 2021 2022 2023 2024 2025 2026 2027 Total Incremental Market Potential 1,796 1,915 2,010 2,103 2,128 1,970 1,808 1,611 1,405 1,327
2 The evaluation study for the BOC training program funded by the CPUC and Itron can be found at http://www.theboc.info/pdf/Eval_Impact_California_BOC_Program_Feb_2014.pdf

PASADENA WATER AND POWER Utility Name 10-Year EE Potential Studies – At a Glance
• 2018-2027 Average Annual Target: 1.25% of forecasted retail sales. • The annual targets are reported as GROSS savings. • Energy savings from future updates to Title 24 Building Energy Efficiency Standards ARE included
in the annual targets. • The baseline for measures is a mix of existing condition and code baselines for modeled
measures, as well as a “dual baseline” function. Navigant used their Electric Resource Assessment Model (ELRAM) to estimate achievable energy and demand savings over a 10-year forecast period. The modeling team forecasted these savings using two modeling steps:
1. Base Case Run. This modeling run includes no changes or adjustments to Pasadena’s current portfolio of energy efficiency programs.
2. Final Run. Pasadena chose to call their Base Case Run as Final and made no adjustments to modeling scenarios.
Comparison to 2014-2023 10-Year EE Potential Studies Compared to Pasadena Potential Study results for 2014-2023, the updated potential model shows more savings opportunities available, primarily due to the inclusion of Code and Standards as well as a result of new emerging technologies. The model also demonstrated a significant decline in potential beginning around 2022 due to a forecast of there being fewer savings opportunities remaining within the commercial building stock and diminishing savings from adopted Codes and Standards. Staff developed the proposed ten-year energy efficiency and demand reduction goals based on the model results, but also with consideration for simplicity of the goals, the City’s environmental objectives, historical goals and achievements, and what may be practically achievable based on past experience. PWP is planning to adopt a goal of 13,500 MWh per year over the 2018 – 2017 or 1.25% of forecast retail sales. PWP is proposing to continue maintain the demand reduction goal of 2.3 MW established in 2013, based on historical program achievements over the last five years.

PITTSBURG POWER COMPANY Utility Name 10-Year EE Potential Studies – At a Glance
• The ELRAM indicates market potential of 0.31% annually; however the 2018-2027 Average Annual Target is 1.00% of forecasted retail sales.
• The annual targets are reported as GROSS savings • Energy savings from future updates to Title 24 Building Energy Efficiency Standards are NOT
included in the annual targets. • The baseline for measures is EXISTING CONDITIONS, except for select measures.
Navigant used their Electric Resource Assessment Model (ELRAM) to estimate achievable energy and demand savings over a 10-year forecast period. The modeling team forecasted these savings using two modeling steps:
1. Base Case Run. This modeling run includes no changes or adjustments to Pittsburg’s current portfolio of energy efficiency programs.
2. Final Run. Pittsburg’s Final Run included the following adjustments to their Base Case Run:
• Expanded measure list. Navigant modeled a number of measures—not currently offered in Pittsburg’s portfolio—to provide a picture of potential savings should Pittsburg decide to expand their current programs. Pittsburg added some residential and non-residential measures to their programs.
Comparison to 2014-2023 10-Year EE Potential Studies With high penetration of residential roof-top solar (10% of total residential load) and potential solar installation of a few big commercial electric users on Mare Island, it has become more challenging to adopt new energy efficiency programs with satisfactory results. The Commercial Lighting Program has been the most in-demand energy efficiency programs on Mare Island. The program has been implemented for 7 years and many large commercial customers and government agencies have benefited from the program. With LED lights becoming more affordable, we anticipate that the program will remain popular in the next few years.

PLUMAS-SIERRA RURAL ELECTRIC COOPERATIVE Plumas-Sierra Rural Electric Cooperative 10-Year EE Potential Studies – At a Glance
• 2018-2027 Average Annual Target: 0.08% of forecasted retail sales. • The annual targets are reported as GROSS savings. • Energy savings from future updates to Title 24 Building Energy Efficiency Standards are NOT
included in the annual targets. • The baseline for measures is mix of existing condition and code baselines.

PORT OF OAKLAND Port of Oakland 10-Year EE Potential Studies – At a Glance
• 2018-2027 Average Annual Target: 0.33% of forecasted retail sales • The annual targets are reported as NET savings. • Energy savings from future updates to Title 24 Building Energy Efficiency Standards are NOT
included in the annual targets • The baseline for measures is EXISTING CONDITIONS, except for deemed measures which are
CODE. Navigant used their Electric Resource Assessment Model (ELRAM) to estimate achievable energy and demand savings over a 10-year forecast period. The modeling team forecasted these savings using two modeling steps:
1. Base Case Run. The Base Case modeling run includes no changes or adjustments to Port of Oakland’s current portfolio of energy efficiency programs.
2. Final Run. Port of Oakland’s Final Run included the following additions:
• Added measures. The Port staff reviewed the list of available measures within the measure database and selected a set of commercial and industrial sector measures.
• Where appropriate, the added measures were modeled as early retirement. Comparison to 2014-2023 10-Year EE Potential Studies The total KWH savings for the overlapping period 2018-2023 increased by 84% from the targets adopted in 2013. New program processes have made participation easier for customers. The Port is exploring opportunities for expanded measure offerings and programs in order to achieve the increased savings goals. The Port has had a limited number of customers taking advantage of the Port’s EE program for a variety of factors:
• Port Electric Customers are also Port tenants. - The Port has approximately 135 electric customers. The Port’s customer profile is 100% Commercial/Industrial. Of these 135 customers, only a small percentage of customers have energy savings potential. For example, a large majority of customers at the Airport rent hangar space to store planes.
• Reluctance to upgrade due to limited duration of lease - Tenants are hesitant to invest in EE upgrades due to the length of their remaining lease. The Port’s tenants typically implement EE measures when they renew their lease and improve their building and/or space assignments.
• Port’s tenants sublease space to their customers including passing utility cost. In the case where a Port tenant subleases space to a third-party and the third party is responsible for utilities, the Port tenant is reluctant to invest in EE measures as they do not receive the benefits of those investments.

RANCHO CUCAMONGA MUNICIPAL UTILITY Rancho Cucamonga Municipal Utility 10-Year EE Potential Studies – At a Glance
• 2018-2027 Average Annual Target: 0.46% of forecasted retail sales. • The annual targets are reported as NET savings. • Energy savings from future updates to Title 24 Building Energy Efficiency Standards are NOT
included in the annual targets. • The baseline for measures is a mix of existing condition and code baseline.
Navigant used their Electric Resource Assessment Model (ELRAM) to estimate achievable energy and demand savings over a 10-year forecast period. The modeling team forecasted these savings using two modeling steps:
1. Base Case Run. This modeling run includes no changes or adjustments to Rancho Cucamonga’s current portfolio of energy efficiency programs.
2. Final Run. Rancho Cucamonga’s Final Run included the following adjustments to their Base Case Run:
• Expanded measure list. Navigant modeled a number of measures—not currently offered in
Rancho Cucamonga’s portfolio—to provide a picture of potential savings should Rancho decide to expand their current programs. The team used various sources and studies throughout California and the nation to inform this expanded measure list.
• Not claiming Codes and Standards savings. Rancho Cucamonga will not be claiming savings from codes and standards for this study.
Figure 1. Gross Incremental Market Potential by Sector (MWh) and Percent of Sales – FINAL RUN

Table 1. Inputs to Figure 1
Comparison to 2014-2023 10-Year EE Potential Studies The model used to create the current 10 year EE goals is similar to the one previously used in 2013 but with a few key differences. One of the most significant changes to the model is the improved calibration. The model now incorporates historical program savings using actual savings as identified in E3. With the prior model calibration, targets were set above actual historic achievement leaving a large percentage of previously established goals not met. This new calibration has made the current 10-year EE goals more accurate and attainable. Other programs and measures were evaluated but many are still not applicable for the current customer base. Customer participation in existing programs has continued to be a challenge since the majority of the commercial businesses were new developments that met or exceeded Title 24 standards and are now just hitting their 10 year mark. As energy efficiency measures and technology continues to advance, there will be more opportunities to explore new programs and continue to increase energy savings.
ALL Sectors (MWh) 2018 2019 2020 2021 2022 2023 2024 2025 2026 2027Total Incremental Market Potential 288 293 313 347 388 411 416 409 393 375Res Incremental Market Potential 2 3 5 7 10 13 15 17 19 19Non-Res Incremental Market Potential 286 290 309 340 378 398 401 392 374 356C&S (If Claimed. Estimates not available after 2024) 0 0 0 0 0 0 0 0 0 0
Total Incremental Potential as a % of Total Sales 0.37% 0.38% 0.40% 0.45% 0.49% 0.52% 0.53% 0.51% 0.49% 0.47%Res Incremental Potential as a % of Res Sales 1.10% 2.00% 2.90% 4.27% 6.00% 7.77% 9.03% 9.95% 10.77% 11.26%Non-Res Incremental Potential as a % of Non-Res Sales 0.37% 0.37% 0.40% 0.43% 0.48% 0.50% 0.50% 0.49% 0.47% 0.44%
ALL Sectors (kW) 2018 2019 2020 2021 2022 2023 2024 2025 2026 2027Total Incremental Market Potential 53 53 55 60 66 71 74 76 76 75Res Incremental Market Potential 1 2 2 3 4 6 7 8 8 9Non-Res Incremental Market Potential 52 51 53 57 62 66 68 68 68 66C&S (If Claimed. Estimates not available after 2024) 0 0 0 0 0 0 0 0 0 0
10 Year Energy Goals (Net MWh)
10 Year Demand Goals (kW)

REDDING ELECTRIC UTILITY Redding 10-Year EE Potential Studies – At a Glance
• 2018-2027 Average Annual Target: 0.53% of forecasted retail sales. • The annual targets are reported as GROSS savings. • Energy savings from future updates to Title 24 Building Energy Efficiency Standards are NOT
included in the annual targets • The baseline for measures is a mixture of code and existing conditions.
Navigant used their Electric Resource Assessment Model (ELRAM) to estimate achievable energy and demand savings over a 10-year forecast period. The modeling team forecasted these savings using two modeling steps:
1. Base Case Run. This modeling run includes no changes or adjustments to Redding’s current portfolio of energy efficiency programs.
2. Final Run. Redding added streetlights to its program offerings starting in 2016 for the Final Run.
Figure 1. Gross Incremental Market Potential by Sector (MWh) and Percent of Sales – FINAL RUN
Table 1. Inputs to Figure 1

Comparison to 2014-2023 10-Year EE Potential Studies The years 2018-2023 overlap between the two 10-year study periods. Redding’s current 10-year goals are about 110% of the goals established in the prior study. There are two reasons for these higher goals:
• Redding added LED street lighting upgrades to their programs. • The forecast of retail sales in 2017 is approximately 10% lower than the retail sales forecast in 2012.

RIVERSIDE PUBLIC UTILITIES Riverside Public Utilities (RPU) 10-Year EE Potential Studies – At a Glance
• The Navigant 10-Year EE Potential Study resulted in an average annual target of 0.76% of forecasted retail sales. RPU intends to adopt a 10-year (2018-2027) Average Annual Target of 1.0% of forecasted retail sales subject to final approval by the governing body expected in April or May, 2017.
• The annual targets are reported as GROSS savings. • Riverside Public Utilities EE Potential Study does NOT include savings from future updates to Title
24 Building Energy Efficiency Standards in establishing the annual targets • The baseline for Energy Efficiency measures is EXISTING CONDITIONS.
Navigant used their Electric Resource Assessment Model (ELRAM) to estimate achievable energy and demand savings over a 10-year forecast period. The modeling team forecasted these savings using two modeling steps:
1. Base Case Run. This modeling run includes no changes or adjustments to Riverside’s current portfolio of energy efficiency programs.
2. Final Run. Riverside’s Final Run included the following adjustments to their Base Case Run:
• Expanded measure list. Included streetlighting phase in starting in 2018. • Utilized a three-year average calibration target rather than 2015 alone.
Comparison to 2014-2023 10-Year EE Potential Studies The 2018-2017, 10-year EE potential study performed by Navigant resulted in an almost identical target when compared to the 2014-2023. Market potential was only 0.02% higher when the study was performed during the last cycle versus the current potential study cycle. Current market conditions throughout RPU’s service territory are very similar to the last cycle with the majority of the potential within the commercial customer segments. This is also where RPU intends to focus most of its program resources. Additional efforts are planned to target, hotels/motels and grocery store commercial customers. On the residential side there is potential in the behavioral program category. RPU will be launching a pilot customer engagement/behavioral residential program in FY 2017/18. If the program is well received by customers it may be expanded in future years.

ROSEVILLE ELECTRIC UTILITY Roseville Electric Utility (RE) 10-Year EE Potential Studies – At a Glance
• 2018-2027 Average Annual Target: 0.76% of forecasted retail sales. • The annual targets are reported as GROSS savings. • Energy savings from future updates to Title 24 Building Energy Efficiency Standards are NOT
considered and applied in the target setting process. • The baseline for measures is assumed to be incandescent lighting for LED retrofit lighting projects
and existing baselines for all other custom projects. When available Roseville will use the measures listed in the TRM.
Navigant used their Electric Resource Assessment Model (ELRAM) to estimate achievable energy and demand savings over a 10-year forecast period. The modeling team forecasted these savings using two modeling steps:
1. Base Case Run. This modeling run includes no changes or adjustments to Roseville’s current portfolio of energy efficiency programs.
2. Final Run. Roseville’s Final Run included the following adjustments to their Base Case Run:
• Added Streetlighting Program. • Added Commercial Sector Behavioral Program. • Increased promotional costs by 10%. • Increased incentives by 10%. • Claim gross rather than net savings
Figure 1. Gross Incremental Market Potential by Sector (MWh) and Percent of Sales – FINAL RUN

Table 1. Inputs to Figure 1
Comparison to 2014-2023 10-Year EE Potential Studies Roseville Electric Utility’s program performance against the targets for the prior three fiscal years average .86% of energy sales; however, when averaged over ten years, the results are .68%. These results are primarily due to the rapid adoption of interior and exterior LED technology and the implementation of the Home Energy Reports residential behavior program in recent years. Roseville is forecasting the market will be saturated with LED in 2018. California Title 24 building codes influence what energy efficiency retrofit savings are eligible to apply towards AB2021 targets. Title 24 set the direction to achieve net zero energy in new homes after 2020. At this time it is unclear how Title 24 will be revised to achieve the net zero home or what impact this will have on reportable energy efficiency savings for retrofit residential home programs. Recognizing the uncertainty with legislation and building codes, Roseville Electric Utility is proposing an average target for energy reduction of .76% over 10 years. These targets are realistic, achievable, cost effective and reliable as required by AB 2021 and can be funded with the 2.85% public benefits charge directed by AB 1890.
ALL Sectors (MWh) 2018 2019 2020 2021 2022 2023 2024 2025 2026 2027Total Incremental Market Potential 8,413 8,549 8,995 9,578 10,063 10,000 9,275 8,556 7,977 7,895Res Incremental Market Potential 6,338 6,448 6,560 6,661 6,760 6,847 6,873 6,880 6,871 6,838Non-Res Incremental Market Potential 2,074 2,101 2,435 2,917 3,303 3,152 2,402 1,677 1,106 1,058C&S (If Claimed) 0 0 0 0 0 0 0 0 0 0
Total Incremental Potential as a % of Total Sales 0.71% 0.72% 0.76% 0.81% 0.85% 0.85% 0.80% 0.74% 0.70% 0.70%Res Incremental Potential as a % of Res Sales 1.47% 1.50% 1.53% 1.56% 1.58% 1.61% 1.63% 1.65% 1.67% 1.68%Non-Res Incremental Potential as a % of Non-Res Sales 0.27% 0.28% 0.32% 0.38% 0.44% 0.42% 0.32% 0.23% 0.15% 0.15%
ALL Sectors (kW) 2018 2019 2020 2021 2022 2023 2024 2025 2026 2027Total Incremental Market Potential 965 1,132 1,426 1,681 1,786 1,565 1,458 1,350 1,260 1,239Res Incremental Market Potential 187 212 247 286 322 346 361 367 369 367Non-Res Incremental Market Potential 777 920 1,179 1,395 1,464 1,219 1,097 983 891 871C&S (If Claimed) 0 0 0 0 0 0 0 0 0 0
10 Year Demand Goals (kW)

SACRAMENTO MUNICIPAL UTILITY DISTRICT SMUD 10-Year EE Potential Studies – At a Glance
• 2018-2027 Average Annual Target: 1.4% of forecasted retail sales • The annual targets are reported as GROSS savings • Energy savings from future updates to Title 24 Building Energy Efficiency Standards ARE included
in the annual targets, using only the portion of utility-attributable statewide savings coming from standards cycles to which SMUD has directly contributed resources
• The baseline for measures is CODE for most measures, and EXISTING CONDITIONS for early retirement measures.
Navigant used their Electric Resource Assessment Model (ELRAM) to estimate achievable energy and demand savings over a 10-year forecast period. The modeling team forecasted these savings using two modeling steps:
1. Base Case Run. This modeling run includes no changes or adjustments to SMUD’s current portfolio of energy efficiency programs.
2. Final Run. SMUD’s Final Run included the following adjustments to their Base Case Run:
• The expansion of behavioral programs beyond the residential sector to the commercial and industrial sector
• Claiming gross rather than net savings
Figure 1. Gross Incremental Market Potential by Sector (MWh) and Percent of Sales – FINAL RUN
Table 1. Inputs to Figure 1
ALL Sectors (MWh) 2018 2019 2020 2021 2022 2023 2024 2025 2026 2027Total Incremental Market Potential 149,626 154,902 164,286 175,198 183,687 187,401 181,428 168,982 157,634 145,870Res Incremental Market Potential 65,706 65,164 63,158 71,826 82,175 86,050 82,037 70,380 59,946 50,519Non-Res Incremental Market Potential 46,921 47,739 48,128 48,373 48,512 47,351 47,391 47,602 47,688 46,351C&S (If Claimed. Estimates not available after 2024) 37,000 42,000 53,000 55,000 53,000 54,000 52,000 51,000 50,000 49,000
Total Incremental Potential as a % of Total Sales 1.34% 1.37% 1.43% 1.51% 1.55% 1.56% 1.48% 1.36% 1.25% 1.14%Res Incremental Potential as a % of Res Sales 1.33% 1.30% 1.24% 1.38% 1.55% 1.58% 1.48% 1.24% 1.04% 0.86%Non-Res Incremental Potential as a % of Non-Res Sales 0.75% 0.75% 0.75% 0.74% 0.74% 0.71% 0.70% 0.70% 0.69% 0.66%
ALL Sectors (kW) 2018 2019 2020 2021 2022 2023 2024 2025 2026 2027Total Incremental Market Potential 131,543 135,519 140,972 145,982 149,594 131,393 132,947 133,068 134,734 136,139Res Incremental Market Potential 10,445 10,691 10,843 11,713 12,746 12,893 12,880 11,019 10,723 10,276Non-Res Incremental Market Potential 111,488 113,726 116,011 118,340 120,699 100,538 102,370 104,291 106,199 108,004C&S (If Claimed. Estimates not available after 2024) 9,610 11,102 14,118 15,929 16,149 17,963 17,697 17,758 17,812 17,859
10 Year Demand Goals (kW)

Comparison to 2014-2023 10-Year EE Potential Studies Several traditional sources for energy efficiency potential are waning due to an increasingly efficient baseline from high measure saturation and more stringent energy efficiency codes and standards. Measures categories with reduced savings compared to the 2013 study include residential cooling and shell, electronics, and non-residential refrigeration, resulting in reduced annual incremental market potential compared to the 2013 study of 74 GWh (-149%) for 2018 and 77 GWh (-52%) for 2023. Furthermore, SMUD’s residential new construction program is no longer considered an energy efficiency program due to poor cost-effectiveness resulting from reduced savings from an improved Title 24 baseline, eliminating 13 GWh (-9%) of incremental market potential for 2023. Sources of increased market potential include residential lighting, pool pumps and refrigerators, home performance retrofits, and non-residential process measures, contributing an additional 34 GWh in 2018 (+22%) growing to 53 GWh in 2023 (+36%). Comprehensive non-residential measures will add another 20 GWh in 2023 (+13%). Codes and standards savings were not included in SMUD’s 10-year goals resulting from the 2013 potential study, and will now add 37 GWh (+24%) to 2018 incremental market potential and 54 GWh (+36%) in 2023. The net impact of the above changes on annual incremental market potential is neutral for 2018 and a 26% increase for 2023.

SAN FRANCISCO PUBLIC UTILITIES COMMISSION San Francisco Public Utilities Commission 10-Year EE Potential Studies – At a Glance
• 2018-2027 Average Annual Target: 0.24% of forecasted retail sales. • The annual targets are reported as NET savings. • Energy savings from future updates to Title 24 Building Energy Efficiency Standards are NOT
included in the annual targets • The baseline for measures is a mix of existing condition and code baselines for modeled
measures, as well as a “dual baseline” function. Navigant used their Electric Resource Assessment Model (ELRAM) to estimate achievable energy and demand savings over a 10-year forecast period. The modeling team forecasted these savings using two modeling steps:
1. Base Case Run. This modeling run includes no changes or adjustments to San Francisco’s current portfolio of energy efficiency programs.
2. Final Run. San Francisco’s Final Run included the following adjustments to their Base Case Run:
• Expanded measure list. Navigant modeled a number of measures—not currently offered in San Francisco’s portfolio—to provide a picture of potential savings should San Francisco decide to expand their current programs. The modeling team used various sources and studies throughout California and the nation to inform this expanded measure list.
• For appropriate measures, early retirement modeling assumptions made.
Figure 1. Net Incremental Market Potential by Sector (MWh) and Percent of Sales – FINAL RUN

Table 1. Inputs to Figure 1
Comparison to 2014-2023 10-Year EE Potential Studies The years 2018-2023 overlap between the two 10-year study periods. San Francisco’s current 10-year goals are about 87% of the goals established in the prior study even though it did add new measures to its portfolio.
ALL Sectors (MWh) 2018 2019 2020 2021 2022 2023 2024 2025 2026 2027Total Incremental Market Potential 2,736 2,853 2,764 2,657 2,596 2,524 2,435 2,324 2,255 2,209Res Incremental Market Potential 1 2 2 3 3 4 4 5 5 5Non-Res Incremental Market Potential 2,735 2,851 2,762 2,654 2,593 2,520 2,431 2,320 2,250 2,204C&S (If Claimed. Estimates not available after 2024) 0 0 0 0 0 0 0 0 0 0
Total Incremental Potential as a % of Total Sales 0.27% 0.28% 0.27% 0.25% 0.25% 0.24% 0.23% 0.22% 0.21% 0.20%Res Incremental Potential as a % of Res Sales 0.01% 0.01% 0.01% 0.02% 0.02% 0.02% 0.03% 0.03% 0.03% 0.03%Non-Res Incremental Potential as a % of Non-Res Sales 0.26% 0.27% 0.26% 0.25% 0.24% 0.23% 0.22% 0.21% 0.21% 0.20%
ALL Sectors (kW) 2018 2019 2020 2021 2022 2023 2024 2025 2026 2027Total Incremental Market Potential 335 371 377 373 383 399 402 400 402 409Res Incremental Market Potential 0 0 1 1 1 1 1 1 1 1Non-Res Incremental Market Potential 335 371 377 372 382 398 401 398 401 407C&S (If Claimed. Estimates not available after 2024) 0 0 0 0 0 0 0 0 0 0
10 Year Energy Goals (Net MWh)
10 Year Demand Goals (kW)

CITY OF SHASTA LAKE City of Shasta Lake 10-Year EE Potential Studies – At a Glance
• 2018-2027 Average Annual Target: 0.30% of forecasted retail sales. • The annual targets are reported as NET savings. • Energy savings from future updates to Title 24 Building Energy Efficiency Standards are NOT
included in the annual targets. • The baseline for measures is a mix of existing condition and code baselines for modeled
measures, as well as a “dual baseline” function. Navigant used their Electric Resource Assessment Model (ELRAM) to estimate achievable energy and demand savings over a 10-year forecast period. The modeling team forecasted these savings using two modeling steps:
1. Base Case Run. This modeling run includes no changes or adjustments to Shasta Lake’s current portfolio of energy efficiency programs.
2. Final Run. Shasta Lake’s Final Run included the following adjustments to their Base Case Run:
• Expanded measure list. Navigant modeled a number of measures—not currently offered in Shasta Lake’s portfolio—to provide a picture of potential savings should Shasta Lake decide to expand their current programs. The modeling team used various sources and studies throughout California and the nation to inform this expanded measure list.
• For appropriate measures, early retirement modeling assumptions made.
Figure 1. Net Incremental Market Potential by Sector (MWh) and Percent of Sales – FINAL RUN

Table 1. Inputs to Figure 1
Comparison to 2014-2023 10-Year EE Potential Studies The years 2018-2023 overlap between the two 10-year study periods. Shasta Lake’s current 10-year goals are about 250% of the goals established in the prior study. There are several reasons for these higher goals:
• Shasta Lake has been achieving program savings above the 2012 targets, which increased the calibration targets for 2016
• Additional new measures in all sectors • For appropriate measures, early retirement modeling assumptions made
ALL Sectors (MWh) 2018 2019 2020 2021 2022 2023 2024 2025 2026 2027Total Incremental Market Potential 487 519 550 579 600 635 635 601 551 482Res Incremental Market Potential 74 90 107 128 154 185 186 156 125 100Non-Res Incremental Market Potential 413 428 443 451 447 450 449 445 425 382C&S (If Claimed. Estimates not available after 2024) 0 0 0 0 0 0 0 0 0 0
Total Incremental Potential as a % of Total Sales 0.27% 0.27% 0.29% 0.30% 0.33% 0.33% 0.33% 0.32% 0.31% 0.28%Res Incremental Potential as a % of Res Sales 0.20% 0.23% 0.27% 0.32% 0.41% 0.47% 0.47% 0.39% 0.33% 0.28%Non-Res Incremental Potential as a % of Non-Res Sales 0.27% 0.28% 0.29% 0.32% 0.30% 0.30% 0.30% 0.31% 0.31% 0.30%
ALL Sectors (kW) 2018 2019 2020 2021 2022 2023 2024 2025 2026 2027Total Incremental Market Potential 74 76 78 79 79 79 80 81 82 81Res Incremental Market Potential 24 26 26 28 29 30 31 33 35 39Non-Res Incremental Market Potential 50 51 52 52 50 49 48 48 46 42C&S (If Claimed. Estimates not available after 2024) 0 0 0 0 0 0 0 0 0 0
10 Year Energy Goals (Net MWh)
10 Year Demand Goals (kW)

SILICON VALLEY POWER Silicon Valley Power 10-Year EE Potential Studies – At a Glance
• 2018-2027 Average Annual Target: 0.42% of forecasted retail sales. • The annual targets are reported as NET savings. • Energy savings from future updates to Title 24 Building Energy Efficiency Standards are NOT
included in the annual targets • The baseline for measures is CODE, except for select measures.
Navigant used their Electric Resource Assessment Model (ELRAM) to estimate achievable energy and demand savings over a 10-year forecast period. The modeling team forecasted these savings using two modeling steps:
1. Base Case Run. This modeling run includes no changes or adjustments to Silicon Valley Power’s current portfolio of energy efficiency programs.
2. Final Run. Silicon Valley Power’s Final Run included the following adjustments to their Base Case Run:
• Expanded measure list. Navigant modeled a number of measures—not currently offered in
Silicon Valley Power’s portfolio—to provide a picture of potential savings should Silicon Valley Power decide to expand their current programs. After review, Silicon Valley Power added the following commercial sector measures to their program portfolio: - Retro-commissioning - Pump and Fan Variable Frequency Drive Controls - Whole Building Retrofit - Comprehensive Rooftop Unit Quality Maintenance (AC Tune-up)
• Increased incentives by 10%.
Figure 1. Net Incremental Market Potential by Sector (MWh) and Percent of Sales – FINAL RUN

Table 1. Inputs to Figure 1
Comparison to 2014-2023 10-Year EE Potential Studies The years 2018-2023 overlap between the two 10-year study periods. Silicon Valley Power’s current 10-year goals are about 87% of the goals established in the prior study even though it did add new measures to its portfolio.
ALL Sectors (MWh) 2018 2019 2020 2021 2022 2023 2024 2025 2026 2027Total Incremental Market Potential 12,851 13,032 14,015 14,928 15,129 14,565 13,333 12,192 11,528 10,590Res Incremental Market Potential 205 238 277 328 371 383 388 392 395 397Non-Res Incremental Market Potential 12,646 12,794 13,738 14,600 14,758 14,182 12,945 11,800 11,132 10,193C&S (If Claimed) 0 0 0 0 0 0 0 0 0 0
Total Incremental Potential as a % of Total Sales 0.42% 0.43% 0.46% 0.48% 0.48% 0.46% 0.42% 0.38% 0.36% 0.33%Res Incremental Potential as a % of Res Sales 0.09% 0.10% 0.12% 0.14% 0.15% 0.16% 0.16% 0.16% 0.16% 0.16%Non-Res Incremental Potential as a % of Non-Res Sales 0.45% 0.45% 0.48% 0.51% 0.51% 0.49% 0.44% 0.40% 0.38% 0.34%
ALL Sectors (kW) 2018 2019 2020 2021 2022 2023 2024 2025 2026 2027Total Incremental Market Potential 2,747 2,760 2,909 3,062 3,091 2,904 2,560 2,130 1,989 1,815Res Incremental Market Potential 25 29 32 34 35 36 37 38 38 38Non-Res Incremental Market Potential 2,722 2,731 2,877 3,028 3,056 2,867 2,523 2,093 1,951 1,777C&S (If Claimed) 0 0 0 0 0 0 0 0 0 0
10 Year Energy Goals (Net MWh)
10 Year Demand Goals (kW)

TRINITY PUBLIC UTILITY DISTRICT Trinity Public Utility District 10-Year EE Potential Studies – At a Glance
• 2018-2027 Average Annual Target: 0.01% of forecasted retail sales • The annual targets are reported as NET savings. • Energy savings from future updates to Title 24 Building Energy Efficiency Standards are NOT
included in the annual targets. • The baseline for measures is a mix of existing condition and code baselines for modeled
measures, as well as a “dual baseline” function. Navigant used their Electric Resource Assessment Model (ELRAM) to estimate achievable energy and demand savings over a 10-year forecast period. The modeling team forecasted these savings using two modeling steps:
1. Base Case Run. This modeling run includes no changes or adjustments to Trinity’s current portfolio of energy efficiency programs.
2. Final Run. Trinity chose to call their Base Case Run as Final and made no adjustments to modeling scenarios.
Figure 1. Net Incremental Market Potential by Sector (MWh) and Percent of Sales – FINAL RUN

Table 1. Inputs to Figure 1
Comparison to 2014-2023 10-Year EE Potential Studies The years 2018-2023 overlap between the two 10-year study periods. Trinity’s current 10-year goals are about 7% of the goals established in the prior study.
ALL Sectors (MWh) 2018 2019 2020 2021 2022 2023 2024 2025 2026 2027Total Incremental Market Potential 7 6 6 6 6 6 6 6 6 6Res Incremental Market Potential 7 6 6 6 6 6 6 6 6 6Non-Res Incremental Market Potential 0 0 0 0 0 0 0 0 0 0C&S (If Claimed. Estimates not available after 2024) 0 0 0 0 0 0 0 0 0 0
Total Incremental Potential as a % of Total Sales 0.01% 0.01% 0.01% 0.01% 0.01% 0.01% 0.01% 0.01% 0.01% 0.01%Res Incremental Potential as a % of Res Sales 0.01% 0.01% 0.01% 0.01% 0.01% 0.01% 0.01% 0.01% 0.01% 0.01%Non-Res Incremental Potential as a % of Non-Res Sales 0.00% 0.00% 0.00% 0.00% 0.00% 0.00% 0.00% 0.00% 0.00% 0.00%
ALL Sectors (kW) 2018 2019 2020 2021 2022 2023 2024 2025 2026 2027Total Incremental Market Potential 1 1 1 1 1 1 1 1 1 1Res Incremental Market Potential 1 1 1 1 1 1 1 1 1 1Non-Res Incremental Market Potential 0 0 0 0 0 0 0 0 0 0C&S (If Claimed. Estimates not available after 2024) 0 0 0 0 0 0 0 0 0 0
10 Year Energy Goals (Net MWh)
10 Year Demand Goals (kW)

TRUCKEE DONNER PUBLIC UTILITY DISTRICT (TDPUD) Truckee Donner Public Utility District 10-Year EE Potential Studies – At a Glance
• 2018-2027 Average Annual Target: 0.45% of forecasted retail sales. • The annual targets are reported as GROSS savings . • Energy savings from future updates to Title 24 Building Energy Efficiency Standards are NOT
included in the annual targets. • The baseline for measures is CODE, except for select measures.
Navigant used their Electric Resource Assessment Model (ELRAM) to estimate achievable energy and demand savings over a 10-year forecast period. The modeling team forecasted these savings using two modeling steps:
1. Base Case Run. This modeling run includes no changes or adjustments to Truckee Donner’s current portfolio of energy efficiency programs.
2. Final Run. Truckee Donner’s Final Run included the following adjustments to their Base Case Run:
• Expanded measure list. Navigant modeled a number of measures—not currently offered in Truckee Donner’s portfolio—to provide a picture of potential savings should Truckee Donner decide to expand their current programs. The modeling team used various sources and studies throughout California and the nation to inform this expanded measure list.
• Increased promotional costs by 50%. • Claim gross rather than net savings.
Figure 1. Gross Incremental Market Potential by Sector (MWh) and Percent of Sales – FINAL RUN

Table 1. Inputs to Figure 1
Comparison to 2014-2023 10-Year EE Potential Studies These targets are based on the TDPUD’s solid documented energy saving results for the past but also acknowledges that, over a 10-year period, maintaining the District's energy savings AND cost-effectiveness will become increasingly difficult as the District moves past the 'low hanging fruit' and we start to saturate some programs. This trend of declining energy savings and increasing program costs over times has been well documented in California's electric utilities. The District has a unique load-profile (weekend, holiday, and winter peaking), customer base (predominately residential with the remainder being small business/commercial), and large number of 2nd homes and transient population. Changes in the regulatory environment, primarily the application of new Codes and Standards (C&S) to retrofits, will diminish the significant impacts of the TDPUD’s residential CFL & LED programs. The model currently used to develop the 10-year EE potential goals is similar to the one used to develop the 2014-2023 potential goals, with the following key differences:
• Updated Measure Impact/Cost Information – the modeling team has significantly improved the measure level inputs using the Technical Reference Manual (TRM) recently developed by the POUs, as well as the most recent CPUC database of available measures with impacts and costs at the climate zone level.
• Measure Impacts Include C&S Effects – the new ELRAM includes the most recent (C&S) impacts to measure savings, but does not include future or planned C&S impacts not currently adopted. This is a key factor in the decrease of the TDPUD’s overall EE potential.
The years 2018-2023 overlap between the two 10-year study periods. Truckee Donner’s current 10-year goals are about 71% of the goals established in the prior study. For the current 10-year goals, Truckee Donner claims gross rather than the net savings targets claimed in 2012. There are several reasons for these lower goals:
• The forecast of sales in 2016 is about 10% lower than the forecast of sales in 2012. • The 2016 calibration target is about one-third the amount of the 2012 calibration target. The
current calibration reflects the average savings of 2013, 2014, and 2015. • The application of C&S to residential lighting retrofits has greatly understated the actual EE
Savings and makes Residential Lighting Programs, on paper, not cost effective. This is a larger portion of TDPUD’s past savings, including 37% of savings in 2016.
ALL Sectors (MWh) 2018 2019 2020 2021 2022 2023 2024 2025 2026 2027Total Incremental Market Potential 730 639 654 672 689 693 693 686 685 679Res Incremental Market Potential 585 496 511 537 567 578 583 580 579 576Non-Res Incremental Market Potential 144 143 143 135 123 115 110 107 106 102C&S (If Claimed. Estimates not available after 2024) 0 0 0 0 0 0 0 0 0 0
Total Incremental Potential as a % of Total Sales 0.50% 0.43% 0.44% 0.45% 0.46% 0.46% 0.45% 0.45% 0.44% 0.43%Res Incremental Potential as a % of Res Sales 0.76% 0.64% 0.66% 0.68% 0.72% 0.73% 0.73% 0.72% 0.71% 0.70%Non-Res Incremental Potential as a % of Non-Res Sales 0.21% 0.20% 0.20% 0.19% 0.17% 0.16% 0.15% 0.14% 0.14% 0.14%
ALL Sectors (kW) 2018 2019 2020 2021 2022 2023 2024 2025 2026 2027Total Incremental Market Potential 236 237 248 233 247 238 245 235 236 225Res Incremental Market Potential 207 209 220 208 226 218 225 215 215 204Non-Res Incremental Market Potential 29 28 27 25 21 20 20 20 21 21C&S (If Claimed. Estimates not available after 2024) 0 0 0 0 0 0 0 0 0 0
10 Year Demand Goals (kW)

• TDPUD has achieved significant EE savings over the last 10 years and are seeing saturation in some previously cost-effective programs.
TDPUD’s targets are reasonable and reflect our best forecast, however in some cases there are EE model limitations that do not accurately model TDPUD’s unique load profile and customer base. For example, the 4th highest potential EE savings program for 2027 on this model are shade trees for TDPUD’s cool, forested environment and non-air conditioned customer base.

TURLOCK IRRIGATION DISTRICT Turlock Irrigation District 10-Year EE Potential Studies – At a Glance
• Calendar Year 2017-2026 Average Annual Target: 0.60% of forecasted retail sales • The annual targets are reported as NET savings. • Energy savings from future updates to Title 24 Building Energy Efficiency Standards ARE included
in the annual targets. • The baseline for measures is the applicable CODE.
Navigant used their Electric Resource Assessment Model (ELRAM) to estimate achievable energy and demand savings over a 10-year forecast period. The modeling team forecasted these savings using two modeling steps:
1. Base Case Run. This modeling run includes no changes or adjustments to Turlock’s current portfolio of energy efficiency programs.
2. Final Run. This modeling run uses Turlock’s chosen adjustments (listed below) to various features within the model to increase energy savings goals:
• Calibration factor changed from 100% to 150%, increasing forecasted achievable
savings. • Included estimates of savings from new programs that are currently not in our portfolio of
programs.
Figure 1. Net Incremental Market Potential by Sector (MWh) and Percent of Sales – FINAL RUN

Table 1. Inputs to Figure 1
Comparison to 2013-2022 10-Year EE Potential Studies The 2017-2026 Targets (2017 Targets) are equal to 2013-2022 Targets (2013 Targets) on a % of forecasted retail load basis (i.e. they are both about 0.6% of forecasted retail sales). However, they differ on a year-by-year comparison. The 2017 Targets include savings from codes and standards that were not included in the 2013 Targets. Hence, the 2017 Targets show more achievable savings in the early years. In addition to supporting studies to develop future codes and standards, we have several planned activities to achieve more energy efficiency savings. For example, this year TID began working with local school districts to assist with Prop 39 projects and provide rebates for energy efficiency projects.
ALL Sectors (MWh) 2017 2018 2019 2020 2021 2022 2023 2024 2025 2026Total Incremental Market Potential 16,394 14,939 15,001 14,938 14,172 13,698 12,530 11,638 11,023 10,476Res Incremental Market Potential 3,430 3,606 3,709 3,775 3,848 3,920 3,986 4,047 4,102 4,148Non-Res Incremental Market Potential 5,632 5,695 5,848 6,078 6,297 6,423 5,950 5,272 4,791 4,341C&S (If Claimed) 7,331 5,637 5,445 5,085 4,026 3,355 2,595 2,319 2,130 1,987
Total Incremental Potential as a % of Total Sales 0.75% 0.67% 0.67% 0.66% 0.62% 0.59% 0.53% 0.49% 0.46% 0.43%Res Incremental Potential as a % of Res Sales 0.47% 0.48% 0.49% 0.50% 0.50% 0.50% 0.51% 0.51% 0.51% 0.51%Non-Res Incremental Potential as a % of Non-Res Sales 0.38% 0.38% 0.39% 0.40% 0.41% 0.41% 0.38% 0.33% 0.30% 0.26%
10 Year Energy Goals (Net MWh)

CITY OF UKIAH City of Ukiah 10-Year EE Potential Studies – At a Glance
• 2018-2027 Average Annual Target: 0.22% of forecasted retail sales. • The annual targets are reported as NET savings. • Energy savings from future updates to Title 24 Building Energy Efficiency Standards are NOT
included in the annual targets. • The baseline for measures is CODE for deemed measures, except for the non-residential lighting
and custom programs, which use EXISTING CONDITIONS as the baseline. Navigant used their Electric Resource Assessment Model (ELRAM) to estimate achievable energy and demand savings over a 10-year forecast period. The modeling team forecasted these savings using two modeling steps:
1. Base Case Run. This modeling run includes no changes or adjustments to Ukiah’s current portfolio of energy efficiency programs.
2. Final Run. Ukiah chose to call their Base Case Run as Final and made no adjustments to modeling scenarios.
Comparison to 2014-2023 10-Year EE Potential Studies For several years, the City’s energy efficiency programs had been operating with a balance forward on a year to year basis. In FY16, that was not the case. In FY16, the balance being carried forward in the PB funds had been expended. Moving forward, rebate amounts and rebate caps were also restructured in attempt to make available funding stretch to serve more customers and more projects. The result is that customer co-pay requirements increased which reduced participation in Ukiah’s EE programs.

VERNON GAS & ELECTRIC Vernon Gas & Electric 10-Year EE Potential Studies – At a Glance
• 2018-2027 Average Annual Target: 0.40% of forecasted retail sales • The annual targets are reported as NET savings. • Only codes and standards (C&S) that are currently in place today, and not future C&S such as
updates to title 24. • A mix of existing condition and codes baselines for modeled measures, as well as a “dual
baseline’’ function that can use the existing condition for a portion of the remaining useful life, and the code baseline for the remaining useful life.
Navigant used their Electric Resource Assessment Model (ELRAM) to estimate achievable energy and demand savings over a 10-year forecast period. The modeling team forecasted these savings using two modeling steps:
1. Base Case Run. This modeling run includes no changes or adjustments to Vernon’s current portfolio of energy efficiency programs.
2. Final Run. Vernon chose to call their Base Case Run as Final and made no adjustments to modeling scenarios.
Figure 1. Net Incremental Market Potential by Sector (MWh) and Percent of Sales – FINAL RUN

Table 1. Inputs to Figure 1
Comparison to 2014-2023 10-Year EE Potential Studies The years 2018 – 2023 overlap between the two 10-year study periods. Vernon’s current 10-year goals are about 88% of the goals established in the prior study.
ALL Sectors (MWh) 2018 2019 2020 2021 2022 2023 2024 2025 2026 2027Total Incremental Market Potential 5,268 5,218 5,523 5,618 5,544 5,145 4,536 4,147 3,900 3,557Res Incremental Market Potential 0 0 0 0 0 0 0 0 0 0Non-Res Incremental Market Potential 2,652 2,990 3,396 3,758 3,741 3,442 3,072 2,888 2,817 2,626C&S (If Claimed. Estimates not available after 2024) 2,616 2,227 2,127 1,860 1,803 1,702 1,464 1,259 1,083 931
Total Incremental Potential as a % of Total Sales 0.44% 0.44% 0.46% 0.47% 0.46% 0.43% 0.37% 0.34% 0.32% 0.29%Res Incremental Potential as a % of Res Sales 0.00% 0.00% 0.00% 0.00% 0.00% 0.00% 0.00% 0.00% 0.00% 0.00%Non-Res Incremental Potential as a % of Non-Res Sales 0.22% 0.25% 0.28% 0.31% 0.31% 0.28% 0.25% 0.24% 0.23% 0.22%
ALL Sectors (kW) 2018 2019 2020 2021 2022 2023 2024 2025 2026 2027Total Incremental Market Potential 1,961 3,200 3,556 3,767 4,295 4,355 4,341 4,288 4,234 4,148Res Incremental Market Potential 0 0 0 0 0 0 0 0 0 0Non-Res Incremental Market Potential 1,258 2,589 3,115 3,372 3,907 3,981 4,014 4,001 3,983 3,928C&S (If Claimed. Estimates not available after 2024) 704 611 441 395 388 375 328 287 251 220
10 Year Energy Goals (Net MWh)
10 Year Demand Goals (kW)

VICTORVILLE MUNICIPAL UTILITY SERVICES Victorville Municipal Utility Services 10-Year EE Potential Studies – At a Glance
• The 2018-2027 Average Annual Target is 0.22% of forecasted retail sales. • The annual targets are reported as NET savings. • Energy savings from future updates to Title 24 Building Energy Efficiency Standards are NOT
included in the annual targets. • The baseline for measures is existing conditions, except for select measures. • VMUS only provides electric service to non-residential customers. • All customers’ facilities are thirteen years old or less, and meet the Title 24 requirements; which
reduces the opportunity for energy savings. • Seventy-four percent of the retail sales are to three customers. Energy efficiency expenditures
are administered at their out-of-state corporate offices and implemented at plant locations across-the-country.
Navigant used their Electric Resource Assessment Model (ELRAM) to estimate achievable energy and demand savings over a 10 year forecast period. The modeling team forecasted these savings using two modeling steps:
1. Base Case Run. This modeling run includes no changes or adjustments to Victorville’s current portfolio of energy efficiency programs.
2. Final Run. Victorville chose to call their Base Case Run as Final and made no adjustments to modeling scenarios.
Comparison to 2014-2023 10-Year EE Potential Studies The lower 2018-2027 annual energy targets are 61% of the targets established in the prior study and reflect: reporting the net rather than the gross savings; incorporating program accomplishments to date; and lower calibration targets for potential program accomplishments.

Energy and Demand Savings Targets (2018-2027)

© 2017 Navigant Consulting, Inc.
Energy Efficiency Potential Forecasting for California’s Publicly Owned Utilities
Prepared for:
California Municipal Utilities Association
Prepared by: Assisted by: Navigant Consulting, Inc. Tierra Resource Consultants, LLC 1001 Officers Row 1501 North Broadway, Suite 300 Vancouver, WA 98661 Walnut Creek, CA 94596 360-828-4001 408-209-3296 February 22, 2017

Energy Efficiency Potential Forecasting for California’s Publicly Owned Utilities
Page i
Table of Contents
1. Introduction ............................................................................................................... 1
2. Key Issues and Updates Since the 2012 Potential Study ...................................... 3
2.1 Relationship of ELRAM to the Current CPUC Model 3 2.2 Ability to Claim Codes and Standards (C&S) Savings 5 2.3 Emerging Technologies 6 2.4 Electric Vehicles (EV) and Solar Photovoltaic (PV) 7
3. Modeling Methodology ........................................................................................... 11
3.1 Key Design Elements 11 3.2 Potential Estimates 11 3.3 Approach to Estimating DSM Potential 13 3.4 Model Structure and Flow 13 3.5 Calculating Energy Efficiency Potential 15 3.6 Creating Scenarios Based on Modifying the Incentive Level 25
4. Summary of Results ...................................................... Error! Bookmark not defined. 4.1 2018 Through 2027 Targets Error! Bookmark not defined. 4.2 Comparison of the Current Targets with the 2012 Targets and Identifying Utilities that
Claim Net or Gross Saving Targets and C&S Claims Error! Bookmark not defined.
Utility ELRAM Results ................................. Error! Bookmark not defined. Utility Summary Memorandums ................. Error! Bookmark not defined.
Energy Efficiency Potential Forecasting for California’s Publicly Owned Utilities
Page 1
1. Introduction
The Navigant Consulting, Inc. team (the Navigant team) developed this study to provide 10-year Demand Side Management (DSM) Potential target goals for 39 California Municipal Utility Association (CMUA) utilities. These utilities include:
• Alameda Municipal Power
• Anaheim, City of
• Azusa, City of
• Banning, City of
• Biggs, City of
• Burbank Water and Power
• Colton Public Utilities
• Corona, City of
• Glendale Water and Power
• Gridley Electric Utility
• Healdsburg, City of
• Imperial Irrigation District
• Lassen Municipal Utility District
• Lodi Electric Utility
• Lompoc, City of
• Los Angeles Department of Water & Power
• Merced Irrigation District
• Modesto Irrigation District
• Moreno Valley Electric Utility
• Needles, City of
• Palo Alto, City of
• Pasadena Water and Power
• Pittsburg, City of
• Plumas-Sierra Rural Electric Cooperative
• Port of Oakland

Energy Efficiency Potential Forecasting for California’s Publicly Owned Utilities
Page 2
• Rancho Cucamonga Municipal Utility
• Redding Electric Utility
• Riverside, City of
• Roseville Electric
• Sacramento Municipal Utility District
• San Francisco Public Utilities Commission
• Shasta Lake, City of
• Silicon Valley Power
• Trinity Public Utilities District
• Truckee Donner Public Utilities District
• Turlock Irrigation District
• Ukiah, City of
• Vernon, City of
• Victorville, City of Target goals were developed for the years 2018 through 2027. The model used to develop these goals is an updated version of the one utilized by the Navigant team in 2012 for CMUA and is similar in design, utilizing much of the same measure data information, as the California Public Utilities Commission’s (CPUC) Potential Goals (PG) Model used for California’s Investor Owned Utilities (IOUs). Assembly Bill 2021 directed the California Energy Commission (CEC) to identify all potentially achievable cost-effective electricity and natural gas efficiency savings and establish 10-year statewide energy efficiency savings targets. Originally intended to occur every three years, Assembly Bill 2227 changed the frequency of the energy efficiency 10-year target setting requirements to once every four years. CMUA engaged the Navigant team to assist the 38 CMUA members meet the CEC requirement to receive from CMUA members their 10 year DSM program targets.

Energy Efficiency Potential Forecasting for California’s Publicly Owned Utilities
Page 3
2. Key Issues and Updates Since the 2012 Potential Study
This study provides an update to the 2012 Potential Study. The 2012 Potential Study developed estimates of technical, economic, and market potential for participating CMUA members. For both the current and 2012 Potential Study, Navigant utilized its Electricality Resource Assessment Model (ELRAM) as well as the related Natural Gas Resource Assessment Model (NGRAM) for the City of Palo Alto. The 2012 model was the basis for the current CPUC Potential Goals (PG) model with both ELRAM and the CPUC PG models evolving over the years since 2012. The new ELRAM is more powerful in its computational capabilities and agile in its scenario development capabilities. It also now includes a robust and easy to use output viewer, which allows the client to view potential savings estimates in a variety of ways without loading the entire ELRAM. Other improvements include:
• Improved savings target calibration – the model calibrates using actual savings per end-use category by program as identified in the SB 1037 reports.
• The capability to adjust potential either to meet specific budget limitations or to meet specific target goals by program.
• Increased decision type flexibility and existing baseline capabilities – the model structure now allows for dual baseline measures and “to code” measures that exist from an existing baseline of a measure rather than a code baseline.
• Expanded building types – ELRAM provides model results at the building type level for both the residential and commercial segments. The 2012 model only provided a rolled up commercial result.
• Expanded industrial and agricultural assessments - ELRAM provides model results for up to 15 industrial and 9 agricultural NAICS categories. The 2012 model only provided a roll up industrial results and no agricultural measures.
• Improved documentation – ELRAM is extensively documented in a Word document and within the model. Each sheet of the model contains a concise explanation of each formula and the purpose of each sheet.
2.1 Relationship of ELRAM to the Current CPUC Model
Since 2011, Navigant has been conducting the CPUC’s PG study; Navigant is currently on contract to continue supporting the study through 2018. The CPUC model creates forecasts of the technical, economic, and market potential across four utilities, 16 climate zones, and six sectors. The study is publically vetted through a stakeholder process and is used by the CPUC to set Investor Owned Utilities (IOU) goals, used by the CEC to inform Integrated Energy Policy Report (IEPR) demand forecast, and relied upon by the California Independent System Operator Corporation (CAISO) for planning purposes

Energy Efficiency Potential Forecasting for California’s Publicly Owned Utilities
Page 4
The PG Model currently used by the CPUC to establish potential goals for the California IOUs is similar to the CMUA ELRAM. The PG model primarily differs in two ways:
• The PG model platform is Analytica and ELRAM is Excel
• The PG model market adoption algorithm is similar to the ELRAM approach in that they both use payback based Bass diffusion curves. However, the PG curves are based on lifecycle full equipment costs and paybacks while ELRAM is based on first cost measure payback. Results are similar but with ELRAM more responsive to changes in incentive levels when performing scenarios based on adjusting incentive levels.
Analytica was chosen as the platform for the PG model because it can handle larger datasets within one model run (it runs all the IOUs at one time). Navigant has found that client preference to platform varies and therefore provides both an Analytica and Excel Potentials Model. For CMUA, Excel is considered the better platform as each model application (the 38 POUs) will each require unique adjustments and considerations. Excel is more amenable to making multiple modifications quickly. The basis for the change in the adoption algorithm between ELRAM and the PG model was the decision to include a financing option within the PG model. Simple payback doesn’t work well with financing. Table 2-1 provides a comparison of model attributes between ELRAM and the PG model.
Table 2-1. Comparison between ELRAM and the 2015 CPUC Model
Model Attribute 2015 CPUC Model Proposed CMUA Model
Sectors Included Residential, Commercial,
Industrial, Agriculture, Mining, Street lighting
Same (as applicable)
Technologies Included +170 current and emerging
energy efficiency technologies,
Same (as applicable) and expanded to include some measures from the POU
Technical Reference Manual (TRM)
Sources of Energy Efficiency Included
IOU rebate programs, codes and standards, behavior programs, impacts of EE
financing
POU rebate programs, codes and standards, behavior programs, impacts of EE
financing
Model Platform Analytica Excel

Energy Efficiency Potential Forecasting for California’s Publicly Owned Utilities
Page 5
Model Attribute 2015 CPUC Model Proposed CMUA Model
Forecasting Approach
Forecast using a bass diffusion model calibrated to
historic program activity. Adoption forecast is based on
economic attractiveness of EE measures; considers the
entire cost of owning and operating baseline equipment
vs. EE equipment in the consumer decision algorithm
Similar with the primary difference being that the Bass diffusion curves are
based on first cost measure payback
Key Data Sources
CPUC EM&V studies, Database for Energy Efficiency Resources (DEER), CEC IEPR,
California Saturation Studies (CLASS, CSS), and CPUC
Incremental Cost Study
Same as well as each utility utility’s SB 1037 data and
selected data from the POU TRM
Energy Prices Used
Low/Mid/High energy prices from the CEC IEPR forecast by sector. No consideration
of tiered rates.
Start with this same data source. Can be modified after
discussions with utility representatives
Address SB 370 Goals Scenario Modifications
Same and additionally, ELRAM has capability to
adjust program budgets by year to meet certain targets
Scenarios Capabilities
Model runs one scenario at a time. Multiple scenarios are possible based on the user’s
inputs.
same
Source: Navigant
2.2 Ability to Claim Codes and Standards (C&S) Savings
Codes and standards affect energy efficiency programs in two different ways. Codes and standards increase overall energy savings because they require customers to install high-efficiency measures in lieu of baseline equipment. The mandates can cause markets (a) to achieve higher levels of adoption and (b) to achieve those levels faster than possible in the absence of the legal mandate.

Energy Efficiency Potential Forecasting for California’s Publicly Owned Utilities
Page 6
However, codes and standards also reduce the savings potential from traditional utility programs. C&S updates increase the baseline efficiency of utility program measures, thus reducing the savings that POUs can claim as a result of the program. The effects of state and federal standards on voluntary programs are quantified by the percentage impact to unit energy savings of affected voluntary program measures. The energy savings impact is quantified as the ratio of the measure unit energy savings (UES) under the new standard to the measure UES using the baseline efficiency, as shown in the following equation:
𝐼𝐼𝐼𝐼𝐼𝐼𝐼𝐼𝐼𝐼𝐼𝐼 𝑃𝑃𝑃𝑃𝑃𝑃𝐼𝐼𝑃𝑃𝑛𝑛𝐼𝐼𝐼𝐼𝑛𝑛𝑃𝑃𝑌𝑌𝑌𝑌𝑌𝑌𝑟𝑟 =𝑈𝑈𝑈𝑈𝑈𝑈 𝑢𝑢𝑛𝑛𝑢𝑢𝑃𝑃𝑃𝑃 𝑛𝑛𝑃𝑃𝑛𝑛 𝑠𝑠𝐼𝐼𝐼𝐼𝑛𝑛𝑢𝑢𝐼𝐼𝑃𝑃𝑢𝑢𝑈𝑈𝑈𝑈𝑈𝑈 𝑢𝑢𝑛𝑛𝑢𝑢𝑃𝑃𝑃𝑃 𝐼𝐼ℎ𝑃𝑃 𝑏𝑏𝐼𝐼𝑠𝑠𝑃𝑃𝑏𝑏𝑏𝑏𝑛𝑛𝑃𝑃
Impact percentages vary by year because standards take effect in different years. Therefore, “vectors” of impact percentages were developed for utility program measure affected by C&S to capture the impact in each future year. For utility program measures not affected by any new C&S, values of the impact percentages are 100%. The energy savings potential of the CPUC PG model C&S advocacy program is determined based on the C&S energy savings defined in the CPUC 2006-2008 C&S program evaluation report1. ELRAM included within its modeling structure the ability of POUs to also claim C&S energy savings if they participate in some way with C&S advocacy. The method involves taking the C&S claims by sector for the closest IOU and pro-rating those savings based on sector sales.
2.3 Emerging Technologies
The Navigant team depended on the analysis of emerging technologies (ETs) as defined in the 2015 CPUC PG modeling effort. ETs are defined as meeting one or more of the following criteria:
• Not commercially available in today’s market but expected to be available in the next 3-5 years
• Commercially available but representing less than 5% of the existing market share • Costs and/or performance are expected to improve in the future
The measures identified as ET in the CPUC PG model and included in ELRAM are:
• Residential, commercial, industrial, and street lighting LEDs • MEF 2.87 Clothes Washers • EF 1.19 Dish Washers • Heat Pump Clothes Dryers
1 Final Evaluation Report, Codes & Standards (C&S) Programs Impact Evaluation, California Investor Owned Utilities’ Codes and Standards Program Evaluation for Program Years 2006-2008. Prepared by KEMA, Inc., The Cadmus Group, Inc., Itron, Inc., and Nexus Market Research, Inc. Utilities’ Codes and Standards Program Evaluation for Program Years 2006-2008. Prepared by KEMA, Inc., The Cadmus Group, Inc., Itron, Inc., and Nexus Market Research, Inc.

Energy Efficiency Potential Forecasting for California’s Publicly Owned Utilities
Page 7
• Refrigerators 35% above code • SEER 22 A/C • SEER 21 HP
2.4 Electric Vehicles (EV) and Solar Photovoltaic (PV)
The Navigant team’s approach to modeling EV/PV adoption rates, and corresponding potential, was established in recognition of the following study considerations:
1.) There does not currently exist a unified and/or approved approach for estimating EV/PV potential across utilities within CMUA.
2.) The subsequent methodology must, to the extent possible, leverage data available to all utilities to facilitate both consistency and transparency in modeled results. Subsequently, individual utilities should have the opportunity to refine the models with utility-specific information and growth projections.
In support of these objectives, the Navigant team leveraged utility-specific information from the California Energy Commission (CEC) Integrated Resource Planning (IRP) process; specifically, we developed regression models to forecast EV/PV adoption rates and potential using data from the 2016 Integrated Energy Policy Report (IEPR).2 Regression modeling is a form of analysis that attempts to quantify the behavior of an uncertain parameter relative to other observable, and potentially influential, variables. The most commonly used approach to capture this relationship is the linear regression3 model. For a set of predictive variables:
],,...,,[ 21 nXXX4
and constants,
],,...,,[ 10 nβββ The linear regression model is expressed by,
nn XXY βββ +++= ...110 In this study, the parameter “Y” represents a modeled adoption rate and/or sector-level consumption target per year by EV/PV, while the predictive variables “Xi” represent the influencing parameters (i.e., years).
2 https://efiling.energy.ca.gov/Lists/DocketLog.aspx?docketnumber=15-IEPR-03 (Mid Demand Case) 3 Nonlinear regression is another form of regression analysis in which the relationship between the dependent and independent variables are characterized by a nonlinear combination of model parameters. However, there is generally no closed-form expression for the best-fitting parameters, as there is in linear regression, and the data are fitted by a heuristic of successive approximations. 4 In this case, the predictive variable would be previous years for which the IEPR forms provided former Electricity Consumption by Sector (GWh), Peak Demand (MW), etc.
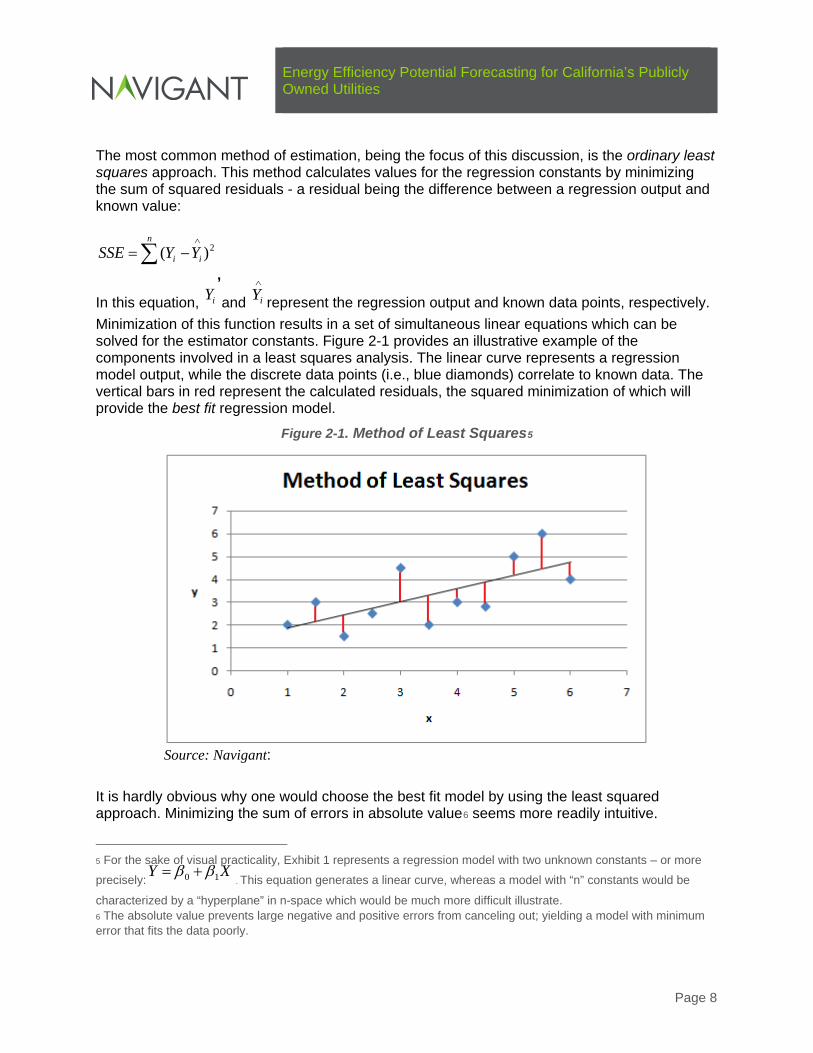
Energy Efficiency Potential Forecasting for California’s Publicly Owned Utilities
Page 8
The most common method of estimation, being the focus of this discussion, is the ordinary least squares approach. This method calculates values for the regression constants by minimizing the sum of squared residuals - a residual being the difference between a regression output and known value:
2)(∧
∑ −= i
n
i YYSSE,
In this equation, iY and ∧
iY represent the regression output and known data points, respectively. Minimization of this function results in a set of simultaneous linear equations which can be solved for the estimator constants. Figure 2-1 provides an illustrative example of the components involved in a least squares analysis. The linear curve represents a regression model output, while the discrete data points (i.e., blue diamonds) correlate to known data. The vertical bars in red represent the calculated residuals, the squared minimization of which will provide the best fit regression model.
Figure 2-1. Method of Least Squares5
Source: Navigant: It is hardly obvious why one would choose the best fit model by using the least squared approach. Minimizing the sum of errors in absolute value6 seems more readily intuitive.
5 For the sake of visual practicality, Exhibit 1 represents a regression model with two unknown constants – or more precisely: XY 10 ββ +=
. This equation generates a linear curve, whereas a model with “n” constants would be
characterized by a “hyperplane” in n-space which would be much more difficult illustrate. 6 The absolute value prevents large negative and positive errors from canceling out; yielding a model with minimum error that fits the data poorly.

Energy Efficiency Potential Forecasting for California’s Publicly Owned Utilities
Page 9
However, there are many qualities that make the least squared approach both computationally and statistically attractive. For one, it is very easy to calculate from a software perspective. Expressing the sum of squared errors mathematically, and employing calculus theory to derive the set of constants to minimize this sum, yields “n” equations and “n” unknowns to solve. The approach also possesses significant statistical properties that may be used to gauge the accuracy of regression findings. The calculation of the R2 value,7 or coefficient of determination, represents the proportion of variability in a data set that is accounted for by a statistical model and is defined to be:
2_
2
2
)(
)(1
∧
∧
∑
∑
−
−−=
i
n
i
n
i
YY
YYR
,
where _Y represents the mean of the observed data. Overall, a larger R2 value indicates a more
accurate regression model. When modeling EV/PV adoption / potential, the Navigant team developed linear, polynomial, exponential, etc. regression models for each utility using data from the 2016 IEPR. To maximize the accuracy of modeled findings, the model with the highest R2 value was used to forecast the first estimate of EV/PV adoption rates and potential for each utility. Figure 2-2 provides an example of the Navigant Team’s modeling output for EV Sales (GWH) within the residential sector. Once the first set of forecasted estimates were provided to each utility, we collaborated with utility representatives to identify whether the source data could be improved through more recent or more utility-specific information. In these cases, the models were updated with improved / more accurate data and a new set of forecasting outputs were provided to each utility. It should be noted that the value of a regression model is directly dependent on the quality of data included. Accordingly, the Navigant team strives for transparency when detailing the sources of information included through each analysis, and to remain cognizant of outliers which may bias results. This transparency also ensures that individual utilities are aware of where updated / utility-specific data would provide the most value to the regression model.
7 Under this definition, R2 assigns a metric to the unexplained variance, as the second term compares the model’s variance with the variance of the observed data. Under this definition, R2 assigns a metric to the unexplained variance, as the second term compares the model’s variance with the variance of the observed data.

Energy Efficiency Potential Forecasting for California’s Publicly Owned Utilities
Page 10
Figure 2-2. Example Regression Modeling Results for EV Sales (GHW)8
Source: Navigant
2.4.1 Photovoltaic System Dampening Effect
A Solar PV dampening methodology is added to the model based on the forecast of PV generation in a POU service territory expressed as a percent of utility sales. The dampening adjustment is applied to the consumer’s willingness to install measures by reducing the willingness as the share of PV generation to utility sales increases. Unfortunately, the Navigant team found no supporting research for calibrating this dampening factor. The dampening effect may in fact be minimal giving that those who install PV are generally more inclined to make their homes energy efficient and thus install a deeper level of efficiency measures. Additionally, the installation of PV may act as a prod to learn more about energy efficiency, therefore potentially increasing installation of energy efficiency measures. Given the lack of evidence one way or another, this dampening effect has been set to 0.0% with no dampening occurring.
8 TN210040_20160127T151013_LADWP_Mid_Demand_Case.xlsx

Energy Efficiency Potential Forecasting for California’s Publicly Owned Utilities
Page 11
3. Modeling Methodology
The Electricity Resource Assessment Model (ELRAM) is an electricity energy efficiency potential model designed to estimate technical, economic, and program (market) energy efficiency potential for a utility’s service area. Developed by Navigant, the model forecasts energy savings and demand reduction potential within the residential, commercial, and industrial sectors over a forecast period of typically 20 years. Since its initial development in 2007, the model has been used by over 50 different electric utilities across the country to identify future energy efficiency potential.
3.1 Key Design Elements ELRAM is a stock/flow Excel spreadsheet model based on the integration of energy efficiency measure impacts and costs, utility customer characteristics, utility load forecasts, and utility avoided costs and rate schedules. ELRAM utilizes Excel as the modeling platform due to the transparency in the DSM potential estimation process, and because of the ubiquitous knowledge of the platform in general. Excel also allows the team to customize ELRAM to accommodate the client’s unique set of input characteristics and utility data. The model utilizes a “bottom-up” approach, beginning with study area building stocks, equipment saturation estimates, forecasts of building stock decay and new construction, energy efficiency technology data, past energy efficiency program accomplishments, and decision maker variables that influence the program scenarios. A key component of ELRAM is the decision maker function used to estimate annual participation in utility programs. ELRAM develops “Measure Payback Response Curves” that are calibrated to historical utility program achievements. These measure level curves are founded on the Bass Diffusion Model developed by Dr. Frank Bass. The Bass Diffusion Model describes the process of the adoption of products as an interaction between users and potential users. The decision maker function estimates a measure by measure elasticity response to first cost measure payback. The elasticity coefficient is calculated for these measures in the base calibration year using measure-level utility program achievements and first cost measure payback. Utilizing this elasticity based decision process allows for easy to create scenario options based on changing the size of measure level incentives. In addition, other input variable flexibilities are included within ELRAM to allow for many different scenario considerations.
3.2 Potential Estimates The model develops estimates of technical, economic, and market potential. Figure 3-1 illustrates these types of energy conservation potential, as defined below: Technical Potential. ELRAM calculates technical potential as the product of a measure savings per unit, the quantity of applicable units in each facility, and the number of facilities in a utility’s
Energy Efficiency Potential Forecasting for California’s Publicly Owned Utilities
Page 12
service area. This potential savings assessment includes measures that may not be cost-effective, and therefore provides an upper bound of efficiency potential regardless of cost or market penetration. All baseline units are considered available regardless of measure life. No net-to-gross adjustments occur with technical potential. Economic Potential. ELRAM estimates economic potential as the amount of technical potential that is cost-effective, as defined in this case by the results of the Total Resource Cost (TRC) test. The TRC test is a cost-benefit analysis of relevant energy efficiency measures, excluding market barriers such as lack of consumer knowledge. Benefits include the avoided costs of generation, transmission and distribution investments, avoided fuel costs, and other benefits that may accrue to participants and/or to the utility. Costs vary by economic test but may include incremental technology cost, incentives, administrative costs, and/or lost revenue. The economic screen is set to 1.0 to determine Economic Potential. There are no net-to-gross adjustments. Maximum Market Potential. ELRAM screens the amount of economic potential that utility programs could capture over the forecast period. The measure level economic screening value for maximum market potential can be set to less than 1.0, but results at the program level have a goal of having an overall economic screen of 1.0 or better. This allows the program to include a mix of measures above and below the 1.0 screening threshold. This adjustment factor can vary by program. In addition to the economic screening value, maximum market potential includes the effects of decision maker awareness of each measure and if aware, their willingness to install the measure. Market Potential. ELRAM uses a fourth step for calculating achievable energy savings at the market level using simple payback elasticity. The achievable market potential uses the remaining maximum market potential at the measure level available each year and applies a decision maker simple payback elasticity coefficient to identify yearly savings available in the marketplace. The model calculates this payback elasticity based on historical program achievements and the identified incentive levels by measure. This step provides realistic forecasts of market potential given incentive and program budget levels, which can change over the forecast period.

Energy Efficiency Potential Forecasting for California’s Publicly Owned Utilities
Page 13
Figure 3-1. Diagram of Types of Energy Efficiency Potential
Source: Navigant 2015
3.3 Approach to Estimating DSM Potential
ELRAM utilizes “Measure Payback Response Curves” to calculate market potential by year. The method for creating these curves comes from the methodology used for the Bass Diffusion Model developed by Dr. Frank Bass. The Bass Diffusion Model describes the process of the adoption of products as an interaction between users and potential users. The decision maker function estimates a measure’s elasticity response to first cost measure payback calculated in the base calibration year. This base year uses measure-level utility program achievements and first cost measure payback. First cost measure payback does not include any savings from extended measure life of changes in maintenance costs. Utilizing this elasticity based decision process allows the model to create scenario options based on changes to measure level incentives. In addition, ELRAM includes other input variable flexibilities to allow for many different scenario considerations including program budget levels and program promotion costs.
3.4 Model Structure and Flow ELRAM includes nearly 40 distinct worksheets including input, calculation, and output pages, as well as a Scenario Dashboard that offers modelers a quick way to interact with the model and produce different scenario runs. The variables available on the dashboard include:
• Economic test screens • Beyond first measure life considerations • Fiscal variables including:
o Incentive level o Administrative costs o Program budget limitations
Technical Potential
Economic Potential
Maximum Market
Market Potential

Energy Efficiency Potential Forecasting for California’s Publicly Owned Utilities
Page 14
There is also an “output viewer” connected to the results of the model which allows the client to view potential savings estimates in a variety of ways. Figure 3-2 provides a general overview of the data flow through the ELRAM model. The model structure can vary from client to client depending on available data and output needs.
Figure 3-2. ELRAM Data Flow Overview
Source: Navigant Successful potential savings forecasts rely on high quality and accurate data inputs into ELRAM. These inputs fall into four categories including:
• Utility Data. Navigant worked closely with the CMUA utilities to gather all utility specific data such as energy (kWh) and demand (kW) forecast estimates, avoided costs, past program savings achievements for use in calibrating ELRAM, customer rate classes, and discount rates. Navigant also relied on the Quarterly Fuels and Energy Reports submitted by the utilities to the California Energy Commission for commercial and industrial sales information by NAICS.
• Customer Data. Navigant relied on the CPUC PG model inputs by climate zone to provide customer characteristic data by measure. The CPUC data relied on statewide Residential and Commercial building saturation surveys.
• Measure Data. Navigant relied on the CPUC PG model dataset of energy efficiency measures as well as the POU Technical Reference Manual (TRM) to characterize the measures included in the study. These characteristics include costs, energy and
Model Outputs • kWh and kW savings forecasts by
potential type, sector, end-use, and other variables
• Scenario development using changes to measure incentives
• Scenario supply curves • Top 50 energy saving technologies
for program design
Technical
Economic
Max Mkt
Market
•Rates• Forecasts•Avoided Costs•DSM Acheivements
Utility Data
•Building Characteristics•Technology Densities•Awareness of Measure•Willingness to Purchase
Customer Data
• Savings Impacts•Measure and Admin Costs•Measure Life• Incentives
Measure Data
•Yearly Building Stock•Delta between Baseline
Measure and Energy Efficient Measure
Measure Availability

Energy Efficiency Potential Forecasting for California’s Publicly Owned Utilities
Page 15
demand use impacts, and measure life for both baseline and energy efficient technologies.
• Measure Availability. ELRAM uses building stock inputs along with the availability of technology density each year to estimate potential energy savings throughout the forecast period. Navigant relied on the CPUC PG model inputs by climate zone for this information.
The outputs from ELRAM accomplish multiple objectives, including:
• Determining the total technical, economic, and market potential of energy savings available over the forecast period, both annually and cumulatively; the model calculates these potential estimates at the sector, building type, program type, and end-use classification levels
• Providing guidance for identifying 10-year energy efficiency program goals at an aggregate level, as well as at the measure category level. ELRAM calibrates calculations to past utility achievement levels to ensure continuity with past utility efforts
• Identifying cost-effectiveness using multiple cost effectiveness tests
• Identifying specific costs and benefits, including administrative, incentive, and technology costs, along with avoided cost and reductions in other resource requirement benefits (such as water use reduction)
3.5 Calculating Energy Efficiency Potential
The results of ELRAM are designed to accomplish multiple objectives, including: • Determining the total cost-effective energy savings available over the forecast period,
both annually and cumulatively. The model provides estimates at the sector, program type, and end-use classification levels.
• Providing guidance for the utility’s energy efficiency goals at an aggregate level and at the measure category level, where appropriate. As discussed, the ELRAM calculations are calibrated to past utility achievement levels to ensure continuity with past program achievements.
The model partitions its assessment of each measure into technical, economic and achievable potential. Each assessment includes building stock estimates, technology densities, and measure impacts, with each using a different algorithm.
3.5.1 Measure Types Addressed
ELRAM recognizes the following measure types:
• Replacement on Burnout (ROB): Implementation of an energy efficient measure after the existing equipment fails.
• Retrofit (RET): Immediate installation of an energy efficient measure that improves the efficiency of an existing technology. The lifetime of the base technology is not a factor as
Energy Efficiency Potential Forecasting for California’s Publicly Owned Utilities
Page 16
retrofit measures generally do not replace existing technologies. The energy impact is therefore only the amount of improvement to the existing technology.
• Dual Baseline (DUB): The dual baseline measure type is an early replacement that replaces an existing technology before the end of useful life. However, savings is calculated using a less efficient “as found condition” baseline for the first part of the remaining useful life (RUL), and a “code condition” for the second portion of the RUL. These results in higher initial energy savings under the first baseline, and lower savings under the second baseline once the measure would have reached the end of its effective useful life (EUL). Measure costs are also adjusted to reflect the change in baselines. 9
• Behavioral Programs (BEH): Programs designed to influence consumer behavior through the provision of training and/or information. As with emerging technologies, achievable potential is calculated using a Bass diffusion model rather than the traditional measure payback.
• Low Income (Low): Measures that are implemented as part of a low-income program. • New Construction (NEW): Installation of a measure or package of measures at the
time of construction. • Demand Response (DR): Strategies specifically designed to reduce peak demand.
There is generally very little energy savings associated with these strategies.
3.5.2 Financial Tests Calculated
ELRAM calculates several financial tests and measurements, including:
• Total Resource Cost (TRC): This test includes all quantifiable costs and benefits of an energy efficiency measure that may accrue to participants or the utility. For example, a measure passing the TRC test is cost effective from this perspective if the sum of its avoided costs and other benefits accruing to participants or the utility are greater than the sum of the measure costs and the utility’s administrative costs.
• Program Administrator Cost Test (PAC): This test measures the costs of an energy efficiency program based on the costs incurred by the utility (including incentive costs) and excluding any net costs incurred by the participant. For example, a measure passing the PAC test is cost effective from this perspective if the sum of the avoided costs (costs avoided by the measure’s energy and demand savings) and other utility benefits are greater than the utility’s costs to promote the measure, including incentives provided to customers.
• Ratepayer Impact Measure Test (RIM): This test measures what happens to a dwelling or business’ electric bills or rates due to changes in utility revenue and operating costs caused by the program. For example, a measure passing the RIM test is cost effective from this perspective if its avoided costs are greater than the sum of the utility’s costs and the “lost revenues” caused by the measure.
• Participant Cost Test (PCT): This test measures the quantifiable benefits and costs to the customer due to participation in the program. For example, a measure passing the PCT test is cost effective from this perspective if the reduced electric costs to the
9 See the Dual Baseline section 3.5.6 for more detail.

Energy Efficiency Potential Forecasting for California’s Publicly Owned Utilities
Page 17
participating customer from the measure exceed the after-incentive cost of the measure to the customer.
• Simple Customer Payback: This measurement calculates the incremental technology cost divided by the incentive and the reduction in the electric bill. If multi-life benefits and costs are considered, it also includes the PV of future technology costs and future incentives and bill reductions.
• Levelized Measure Cost/kWh: This measure multiplies the energy efficiency measure costs by the Capital Recovery Factor, and divides by the first-year kWh savings.
ELRAM calculates measure, program, end-use, building type, and overall portfolio level costs and benefits, and when applicable at both the net and gross levels. Net values take into account free riders by using net-to-gross adjustment values. The costs and benefits calculated include:
• Administrative costs (always gross) • Avoided cost benefits (always net) • Other utility benefits (always net) • Other participant benefits (always net) • Incentive costs (always gross) • Incremental technology costs (gross or net) • Utility bill reductions (gross or net)
Within the “Financial Tests” worksheet, these streams of costs and benefits are converted to a net present value using the discount rate. With this data, four financial tests identified above are calculated.
Total Resource Cost (TRC)10,11,12: The TRC test measures the net resource benefits from the perspective of all ratepayers by combining the net benefits of the program to participants and non-participants. The benefits are meant to be the sum of the avoided costs of the supply-side resources avoided or deferred, and other benefits that accrue to participants or the utility. The TRC costs encompass the cost of the measures/equipment installed, and the costs incurred by the utility. The formulation:
TRC = Benefits / Costs where:
Benefits = net avoided costs + net other utility benefits + net other participant benefits
Costs = gross administrative costs + net incremental technology costs
Program Administrator Cost Test (PAC) : Sometimes referred to as the utility cost test, this test compares the utility's avoided cost benefits with energy efficiency program expenditures (incentives plus administrative costs). The formulation: 10 California Standard Practice Manual: Economic Analysis of Demand-Side Programs and Projects. October 2001. http://www.energy.ca.gov/greenbuilding/documents/background/07-J_CPUC_STANDARD_PRACTICE_MANUAL.PDF 11 CPUC D0606063, Attachment 9. http://www.cpuc.ca.gov/NR/rdonlyres/101F0713-7277-43A8-883D-8EF2712EFA8A/0/NumericalExamplesNTGAdjtoTRCD0709043.pdf 12 CPUC http://docs.cpuc.ca.gov/published/final_decision/73172-10.htm

Energy Efficiency Potential Forecasting for California’s Publicly Owned Utilities
Page 18
PAC = Benefits / Costs where:
Benefits = net avoided costs + net other utility benefits
Costs = gross administrative costs + gross incentives
Ratepayer Impact Test (RIM): 13 This test measures what happens to customer bills or rates due to changes in utility revenue and operating costs caused by the program. The formulation:
RIM = Benefits / Costs where:
Benefits = net avoided costs
Costs = gross administrative costs + gross incentives + net bill reductions
Participant Cost Test (PCT): 14 This test measures the quantifiable benefits and costs to the customer due to participation in the program. The formulation:
PCT = Benefits / Costs where:
Benefits = gross incentives + gross bill reductions
Costs = gross incremental technology costs
Table 3-1 presents the formula for each of the four benefit/cost tests.
Table 3-1. Benefit/Cost Test Formulas
Cost Test Formula
Key of Terms Program
Administrator Cost Test (PAC)
PAC = (A + B) / (D + E) A = PV Avoided Costs (always net)
E = PV Incentive Costs (always gross)
Participant Cost Test (PCT)
PCT = (E + gross G) / gross F
B = PV Other Utility Benefits
(always net)
F = PV Technology Costs (gross or net)
Rate Impact Measure Cost Test
(RIM) RIM = A / (D + E + net G)
C = PV Other Participant Benefits
(always net)
G = PV Bill Reductions (gross or
net) Total Resource Cost Test (TRC)
TRC = (A + B + C) / (D + net F)
D = PV Administrative Costs (always gross) PV = Present Value
13 California Standard Practice Manual: Economic Analysis of Demand-Side Programs and Projects. October 2001. http://www.energy.ca.gov/greenbuilding/documents/background/07-J_CPUC_STANDARD_PRACTICE_MANUAL.PDF 14 Ibid.

Energy Efficiency Potential Forecasting for California’s Publicly Owned Utilities
Page 19
3.5.3 Approach to Multi-Life Benefits
3.5.3.1 Multi-Life Benefits
The ELRAM model has the capability of recognizing that the impacts of DSM measures may extend beyond the initial estimate of measure life. Taking this possibility into account can affect benefit/cost ratios, such as the TRC, PCT, PAC, and RIM, by incorporating future expectations of avoided costs, as well as changes in measure costs and impacts, and cumulative energy and demand impact estimates. The estimation of multi-life benefits and determined by the variable:
• Measure Re-Engagement. This variable estimates the share of measure installations
that continue to provide efficiency benefits at least equal to the initial DSM measure installed. The complimentary share of installations not part of re-engagement is returned to the population totals of available stock for program participation.
There are no new incremental savings accruing from the re-engaging population. However, cumulative savings must be adjusted in two ways. Using as an example a re-engagement rate of 85%, the first adjustment is for the 15% not re-engaging. This 15% goes back to the baseline population and their savings removed from cumulative savings. The second adjustment is for the 85% assumed to be re-engagers. For this group, adjustment to cumulative potential is dependent upon whether the savings are different from what was achieved at the time of the original participation. If unchanged, no changes to cumulative potential. If savings are different, then the cumulative potential is adjusted by this delta difference. At the point in time of re-engagement, factors may exist that affect the estimate of continuing DSM measure saving and costs.
• A code or standard (C&S) may have come into effect since the initial point of participation. The effects of the C&S become an attribution issue. Since C&S are mandatory, savings affected by C&S are attributed to the C&S. The share of savings may be 100% or may be a share lower than 100%. If 100%, then no further savings or costs are attributed to the DSM program measure. If the attribution is less than 100%, then the attribution share still applicable to the utility is accounted.
• A measure’s estimated energy savings may increase or decrease in the future. For example, LED lighting is still improving in efficacy and, as it does, savings per measure increase. In contrast, appliance recycling programs, such as refrigerator recycling, are expected to have lower savings per unit over time as the population of refrigerators becomes a more recent (more efficient) vintage each passing year.
• A measure’s estimated cost may increase or decrease in the future. For example, LEDs and other, newer technologies are expected to decline in cost as these become more popular in the marketplace. The declining cost of CFLs over the past decade is an example of such an effect.
Any changes in energy savings at the point of re-engagement are calculated. These changes in energy savings are applied to the Cumulative Potential and do not affect the Achievable Incremental Potential.
Energy Efficiency Potential Forecasting for California’s Publicly Owned Utilities
Page 20
Avoided cost of energy, capacity, and any externality that is quantified are all calculated per measure unit. The impacts are separated into “first life” avoided costs and “beyond first life” avoided costs. The “first life” values are the present value of avoided costs using measure life, the utility discount rate, and the utility’s avoided cost stream. The “beyond first life” estimate of avoided cost is calculated only for the population of “re-engagers”. For this population, the present value of future avoided costs beyond the first life15 is calculated starting at this future point in time. This calculation uses any revised future estimate of measure impact, along with measure life, the utility discount rate, and the avoided cost stream appropriate for that time frame. In a similar manner, the future cost for incremental technology is calculated.
3.5.3.2 Codes and Standards Modified Baseline Effects on Cumulative Potential
The effects of codes and standards within the ELRAM model are viewed as an attribution issue between what is credited to codes and standards and what is credited to the DSM program. The “Code Based Impact Change” identifies the specific codes and standards expected to affect measure savings over the forecast period. The effects to measure savings are in the form of time vectors where a specific code and standard is associated with the measures it is expected to affect. The measure effect is in the form of a percent change in savings starting at the point when the code and standard goes into force. As an example, if a specific code and standard effectively reduces saving by 50% starting in the year 2015, the DSM program’s first year incremental measure impact would be 100% of the estimated program impact up to the year 2015. Starting in 2015 and thereafter, the utility’s share of the measure savings is reduced by 50%, with the other 50% being attributed to the code and standard.
Treating the savings achieved by the DSM program after a code and standard goes into force is done in two parts. First addressed, at the moment the code and standard going into force, is whether there are any adjustments to the first measure lifetime savings, costs, and benefits. The ELRAM model treats these already exiting program achievements, benefits, and costs as unchanged (maintained) over the remaining first lifetime of the measure.
However, at the time of re-engagement, adjustments do occur. For those measures assumed to re-engage after the first lifetime is complete, the measure impacts, benefits, and costs are calculated based on the code and standard adjusted savings level. It is assumed that attribution of the savings transfers to the code and standard at this point forward. To accommodate this, the Cumulative Potential is adjusted downward to reflect the lowered savings resulting from the impact of the code and standard at the time of re-engagement. Additionally, post first lifetime benefits and costs are calculated to reflect the lower savings.
15 Several lifetimes may be calculated, depending on the measures estimated life and the length of the forecast period.

Energy Efficiency Potential Forecasting for California’s Publicly Owned Utilities
Page 21
3.5.4 Mutually Exclusive Measures
Two or more measures that each can replace the same base technology are considered to be mutually exclusive. Examples of mutually-exclusive measures are LED and CFL lamps of the same efficacy being in competition to replace an incandescent lamp. Mutually-exclusive measures are placed into competition groups with separate competition group identifiers for each group. Within the competition groups, the mutually-exclusive measures share the same base population, but each measure uses its own unique decision-maker adoption rate algorithm to estimate year-by-year achievable potential. The base population is reduced each year by the sum of the mutually-exclusive measures participation.
3.5.5 Interactive Effects
The energy and demand impacts form DSM measures can be affected by other measures or actions taken. ELRAM recognizes two forms of interactive effects. The first are interactive effects among measures within the same fuel type and end use. An example of a set of DSM measures that would be considered having interactive effects would be ceiling insulation, wall insulation, a high efficiency furnace, and energy efficient windows. Alone, each of these measures would have a specific energy savings impact. As a group or part of a group, the individual measures have lower savings. Within ELRAM, a unique interactive effects code is assigned to the set of measures considered to be interactive in this manner. The stand-alone measure impacts are identified as well as the savings if the entire set of interactive measures were implemented. The measure savings used in ELRAM is the pro-rated share of the individual measure savings to the group total. For example, if an interactive measure group included two measures, one with a stand-alone savings of 100 kWh and the other 200 kWh with a group implementation total of 250 kWh, the first measure’s model savings is 100/300*250 or 83.3 kWh and the second measure model savings is 200/300*250 or 166.7 kWh. The second type of interactive effect is among measures from different end-uses that impact the savings of the other. An example would be lighting measures. More efficient lighting produces less waste heat. This results in lower cooling but higher heating loads. The lighting measure energy savings would be increased by how much it reduces electric cooling and increased by how much it increases electric heating. The saturation of electric cooling and heating is taken into account. Effects on other fuels or commodities, such as increased natural gas heating loads or reduced water use, are accounted within the cost effectiveness calculations through increases or decreases in the billing for that fuel or commodity.

Energy Efficiency Potential Forecasting for California’s Publicly Owned Utilities
Page 22
3.5.6 Dual Baseline Measures
Certain DSM measures are candidates for an early replacement program that utilizes a dual baseline. A dual baseline approach calculates energy savings using a more complex method than is used by the majority of North American DSM administrators. Most jurisdictions use the effective useful life (EUL), or assumed average life of the new measure to calculate the annual savings of the new measure. An example is the replacement of an air conditioning system with one that uses energy more efficiently. For the EUL of the new system (for example, 25 years), the difference in energy use between the new system and the replaced one is claimed as the energy savings. A dual baseline approach uses, in addition to EUL, the remaining useful life (RUL) of the replaced equipment, which is the length of time the equipment is expected to remain in operation (the length of time until its EUL is at an end). Using a dual baseline approach in the example of the air conditioning system, the difference in energy use between the replaced and new system is claimed as savings only for the RUL of the replaced system. After the RUL (for example 10 years) of the replaced equipment and until the end of the EUL of the new equipment (15 years, if the new system is assumed to have an EUL of 25 years), the difference in energy use between the new system and the standard of equipment at that time is claimed as energy savings. This method takes into account improvements in technology and the market over time; even without an incentive, energy savings for some equipment will occur when old equipment is replaced, because the standard version of newer equipment uses less energy. In the year an energy-efficient measure is installed, if the replaced measure is still in working order, its RUL must be calculated based on its EUL and the length of time it has been in use prior to replacement. Figure 3-3 illustrates the two-step process.

Energy Efficiency Potential Forecasting for California’s Publicly Owned Utilities
Page 23
Figure 3-3. Two-part Calculation of Energy Savings Using a Dual Baseline Approach
Once calculated, energy savings are affected in the following ways:
• When a measure is replaced and it has a RUL, the full unitary savings value (the replaced measure’s estimated annual kWh usage minus the new measure’s estimated annual kWh usage) is calculated. These savings can be claimed for each year of the RUL of the measure (Figure 3-3, step 1).
• When the RUL of the replaced measure expires in the future, a new baseline for annual kWh savings must be used. This baseline is calculated using the most common energy use values for replacement products: either those legislated through codes and standards or those installed by common practice (Figure 3-3, step 2).
• If the replaced measure has reached the end of its EUL at the time of replacement, then the current code or most commonly used measure is used to calculate the energy savings, rather than the difference between the new measure and the replaced one.
3.5.7 Appliance Recycling
Appliance recycling measures need special treatment because of the unique characteristics of the base population. Unlike other base technologies, the used appliance stock available for recycling is constantly being refreshed with new populations of appliances. Due to past
0
10
20
30
40
50
60
70
80
90
100
Exisisting Equipment Efficient Equipment Standard Equipment Efficient Equipment
Annual Consumption (kWh/yr)
Savings for EUL minus RUL
Savings for RUL
Step 1: Savings calculated for the RUL of a replaced measure
Step 2: Savings calculated for the remaining EUL of
the new measure

Energy Efficiency Potential Forecasting for California’s Publicly Owned Utilities
Page 24
improvements to appliance efficiencies (primarily codes and standards), the constantly refreshing population of available appliances for recycling is more efficient (and thus saves less energy) from year to year. Available populations of appliances for recycling may not change significantly from year to year, but the time vector of savings per unit does decline. The cumulative savings are accounted only within the timeframe of the estimated remaining life of the recycled appliance. The re-engagement calculations do not take place for appliance recycling measures.
3.5.8 Behavior Based Energy Savings Potential
Savings potential from behavior-based initiatives can be included in the ELRAM model by initiative and by building sector. Within ELRAM, behavior-based initiatives are defined as those providing information about energy use and efficiency actions, rather than financial incentives, equipment, or services. These initiatives use a variety of implementation strategies including mass media marketing, community-based social marketing, competitions, training, and feedback.16 Outcomes from behavior-based initiatives that result in energy savings can be broadly characterized as equipment-based and usage-based:
• Equipment-based behavior – Savings from the purchase and installation of higher efficiency equipment, relative to baseline conditions.17 Examples of equipment-based behavior include the replacement of lights with higher efficiency lights, purchasing Energy Star®-qualified appliances, and purchasing premium efficiency motors. In the ELRAM Model, these savings are modeled at the equipment level as contributions to the percentages of the population that are aware of the measure and that are willing to adopt this measure. Equipment-based behavior can be sub-categorized as:
o Non-incented equipment-based behavior – The purchase of higher efficiency equipment for which no incentives are provided.
o Incented equipment-based behavior– The purchase of higher efficiency equipment for which incentives are provided.
• Usage-based behavior – Savings from changes in usage and maintenance of existing equipment. Examples of usage-based behavior include turning off lights, unplugging electronics and chargers, programming thermostats, and improving the efficiency of equipment through modified maintenance practices. In the ELRAM model, these savings are modeled as an equipment-independent module with savings unassociated with equipment improvement.
16 Evaluation of Consumer Behavioral Research, Navigant (Summit Blue Consulting) for the Northwest Energy Efficiency Alliance, April 6, 2010, Page 4. 17 This could be either the early retirement of older equipment or the installation of high-efficiency equipment at the natural time of installation or replacement.

Energy Efficiency Potential Forecasting for California’s Publicly Owned Utilities
Page 25
The behavior measure savings used within ELRAM reflect estimates of usage-based and non-incented based behavior. The incented equipment-based behavior is assumed to be addressed by the utility’s other incentive-based DSM programs. Currently, the measure life is assumed to be one year for the residential sector based on enhanced billing programs, reflecting the need to continually reinforce the behavior program’s message to conserve and use energy efficiently. The commercial and industrial sector programs are assumed to have a measure life of five years based on the extensive training received by building operators. For the commercial sector, the program is based on a Building Operator Certification Program. For the industrial sector, the program is based on a Strategic Energy Management Program.
3.6 Creating Scenarios Based on Modifying the Incentive Level A fundamental element of ELRAM is the decision-maker algorithm. The function of measure calibration is to establish for each measure a baseline “Market Factor”, which is estimated based on first-cost measure payback and the achieved savings in the base year. This value is an elasticity coefficient used in the forecast period to estimate measure adoption. These incentive levels by measure are generally the actual incentives provided by the utility or they default to an input value, such as 50% of incremental cost. Once the baseline Market Factor is established, the incentive during the forecast period can be modified up or down. Changing the incentive changes the first cost measure payback with corresponding changes in measure adoption rates. These changes in adoption rates are established using the baseline Market Factor, which is unchanged, and the modified first cost measure payback. The scenario incentive level is expressed as a multiplier to the base scenario incentive. If the base incentives are expressed solely as a percent of incremental technology cost (such as 50%), then a scenario expressed as 25% would represent incentives being cut in half and 75% would represent incentives increasing 1.5 times. However, if the base incentives include actual incentive levels, then the base case could represent a mix of incentives that are above or below 50% of incremental technology cost. In this situation, the base percentage (such as 50%) would only be applied to measures where either the incentive is unknown or the measure is not yet part of the utility portfolio. For those measures with incentives set at the base case percentage (such as 50%), then a scenario expressed as 25% would represent incentives being cut in half, and 75% would represent incentives increasing 1.5 times. For those measures using actual incentive levels, the scenario expressed as 25% would also represent incentives being cut in half, and 75% would represent incentives increasing 1.5 times. If the current base incentive of 50% represented 25% of incremental cost, the 75% incentive scenario would represent an incentive of 37.5% of incremental cost. Additionally, incentives are capped at 100% of incremental cost. The exception is if the base incentive is already above 100% of incremental cost; in this instance, the incentive does not change.

Energy Efficiency Potential Forecasting for California’s Publicly Owned Utilities
Page 26
The year in which the higher or lower incentive level goes into effect is a variable. For instance, if a utility has a mandated goal to achieve about 1.5% of sales of incremental energy efficiency each year, it may be necessary to increase the incentive in some future year in the forecast when the forecast of market potential begins to fall below the 1.5% of sales goal.
3.6.1 Scenario Adjustments to Consumer Awareness and Willingness The estimates of future decision maker measure awareness and willingness to install the measure are also affected by changes in the incentive and administrative cost levels. Increased incentive and administrative cost levels correspond to increased awareness and willingness, while decreased incentive and administrative cost levels translate to lower awareness and willingness. Changes to administrative cost is used as a proxy to simulate changes in promotional/education efforts. Modifications to these two costs can be considered independently The calculations in ELRAM assume that consumer awareness of energy efficiency measures and willingness to install the measures improves over time as long as an incentive is being offered. If no incentive or only a very small incentive is offered, consumer awareness and willingness grows very slowly and reaches a lower maximum awareness and willingness rate compared to the base case. Conversely, higher incentives generally reflect greater marketing of the utility program, which increases consumer awareness and willingness. As the scenario incentive approaches 100%, both the rate of growth in consumer willingness and awareness grow, as do the maximum awareness and willingness values as compared to the base case.