Wavelet transform based techniques for ultrasonic signal ...

2
Energy Distribution of EEG Signal Components by Wavelet Transform
Ibrahim Omerhodzic1, Samir Avdakovic2, Amir Nuhanovic3, Kemal Dizdarevic1 and Kresimir Rotim4
1Clinical Center University of Sarajevo, Department of Neurosurgery, Sarajevo 2EPC Elektroprivreda of Bosnia and Herzegovina, Sarajevo
3Faculty of Electrical Engineering, University of Tuzla, Tuzla 4University Hospital “Sisters of Charity”, Department of Neurosurgery, Zagreb
1,2,3Bosnia and Herzegovina 4Croatia
1. Introduction
Wavelet theory is a natural extension of the Fourier transformation and its modified Short-Term Fourier transformation (STFT). Over the years, wavelets developed independently in mathematics, quantum physics, electrical engineering, as well as in other areas of science. The result is their significant application in all branches of science. Due to its advantages over other techniques of signal processing, Wavelet Transform (WT) in recent years has attracted considerable attention in signal processing in medicine. The advantage of WT over the Fourier transformation is reflected in the time-frequency analysis (Daubechies, 1992; Mallat, 1998; Mertins, 1999; Vetterli & Kovacevic, 1995; Wang & Xu 2009).
On the other hand, epilepsy is the second most prevalent neurological disorder in humans
after stroke. It is characterized by recurring seizures in which abnormal electrical activity in
the brain causes altered perception or behavior. As one of the world’s most common
neurological diseases, it has affected more than 40 million people worldwide. Epilepsy’s
hallmark symptom, seizure, is manifestations of epilepsy and can have a broad spectrum of
debilitating medical and social consequences (Aylward, 2008; Lefter et al., 2010; McHugh &
Delanty, 2008; Ngugi, 2011; Tong & Thacor, 2009). Although antiepileptic drugs have helped
treat millions of patients, roughly a third of all patients are unresponsive to pharmacological
intervention. An area of great interest is the development of devices that incorporate
algorithms capable of detecting an early onset of seizures or even predicting the hours
before seizures occur. This lead time will allow for new types of interventional treatment.
Intention is, in the near future, that a patient’s seizure may be detected and aborted before
physical manifestations begin (Latka et al., 2005; Saiz Díaz et al., 2007).
Electroencephalogram (EEG) established itself in the past as an important means of identifying and analyzing epileptic seizure activity in humans. It serves as a valuable tool for clinicians and researchers to study the brain activity in a non-invasive manner. Careful analyses of the electroencephalograph (EEG) records can provide valuable insight into and
www.intechopen.com

Wavelet Transforms and Their Recent Applications in Biology and Geoscience 46
improved understanding of the mechanisms causing epileptic disorders. Detection of epileptiform discharges in the EEG is an important component in the diagnosis of epilepsy. In most cases, identification of the epileptic EEG signal is done manually by skilled professionals, who are small in number (Adeli et al., 2003; Patnaik & Manyamb, 2008; Wang & Xu 2009). The diagnosis of an abnormal activity of the brain functionality is a vital issue. The clinical interests (in EEG) are, for example, the sleep pattern analysis, cognitive task registration, seizure and epilepsy detection, and other states of the brain, both normal and pathophysiological (Asaduzzaman et al., 2010; Ernst et al., 2007; Leise & Harrington, 2011; Subasi et al., 2005)
EEG signals involve a great deal of information about the function of the brain. But classification and evaluation of those signals are limited. Since there is no definitive criteria established by experts, visual analysis of EEG signals in time domain may be insufficient. The routine clinical diagnosis needs the analysis of EEG signals. Therefore, some automation and computer techniques are used for this aim. Recent applications of the WT and Neural Network (NN) to engineering-medical problems can be found in several studies that refer primarily to signal processing and classification in different medical areas. Several authors used WT in different ways to analyze EEG signals and combined WT and NN in the process of classification (Adeli et al., 2007; Guo et al., 2010; Leung et al., 2009; Mirowski et al., 2009; Subasi et al., 2005; Zandi et al., 2008).
As EEG signals are non-stationary, the conventional method of frequency analysis is not highly successful in diagnostic classification (Subasi & Erçelebi, 2005). A few papers recently published have reported on the effectiveness of WT applied to the EEG signal for representing various aspects of non-stationary signals such as trends, discontinuities, and repeated patterns where other signal processing approaches fail or are not as effective (Adeli et al., 2003; Asaduzzaman et al., 2010; Guo et al., 2009; Lessa, 2011), but there are still some problems with classical EEG analysis and classification (Arab et al., 2010; Bauer et al., 2008; Oehler et al., 2009). It is important to emphasize the algorithm for classification of EEG signals based on WT and Patterns Recognize Techniques. Discrete Wavelet Transform (DWT) with the Multi-Resolution Analysis (MRA) is applied to decompose EEG signal at the resolution levels of the EEG signal components (├, θ, ┙, ┚ and ┛), and Parseval’s theorem is employed to extract energy distribution percentage features of the EEG signal at different resolution levels. The neural network classifies those extracted features to identify the EEG type according to the energy distribution percentage.
2. Energy distribution of the EEG signal components
Some results of our previous research, shown in this chapter, were published recently (Omerhodzic et al., 2010), and the datasets were originally selected from the Epilepsy Center in Bonn, Germany, collected by Ralph Andrzejak (Andrzejak et al., 2001). The datasets we particularly used and denoted consisting of three groups of EEG signals, were basically extracted from both normal subjects and epileptic patients. The first group was recorded from healthy subject (A set), the second group was recorded prior to a seizure (steady state) from part of the brain of the patient with epilepsy syndrome (C set) and the third group (E set) was recorded from the patient with the epilepsy syndrome during the seizure. Each set contains 100 single channel EEG segments of 23.6-sec duration at a sampling rate of Fs = 173.61 Hz. Set A consisted of segments taken from surface EEG recordings that were
www.intechopen.com

Energy Distribution of EEG Signal Components by Wavelet Transform 47
obtained from five healthy volunteers using a standardized electrode placement. Set E only contained seizure activity.
As is well known, the EEG signal contains a several spectral components. The magnitude of
a human brain surface EEG signal is in the range of 10 to 100 μV. The frequency range of the
EEG has a fuzzy lower and upper limit, but the most important frequencies from the
physiological viewpoint lie in the range of 0.1 to 30 Hz. The standard EEG clinical bands are
the delta (0.1 to 3.5 Hz), theta (4 to 7.5 Hz), alpha (8 to 13 Hz), and beta (14 to 30 Hz) bands.
EEG signals with frequencies greater than 30 Hz are called gamma waves (Schiff et al., 1994;
Tong & Thacor, 2009; Vetterli & Kovacevic, 1995).
Generally, a wavelet is a function 2L R with a zero average
0t dt . (1)
The Continuous Wavelet Transformation (CWT) of a EEG signal x t is defined as:
*1( , )
t bCWT x a b x t dt
aa
(2)
where t is called the ‘mother wavelet’, the asterisk denotes complex conjugate, while a
and b ,a b R are scaling parameters, respectively (He & Starzyk, 2006; Mei et al., 2006;.
Omerhodzic et al., 2010). The scale parameter a determines the oscillatory frequency and
the length of the wavelet, and the translation parameter b determines its shifting position.
In practise, the application of WT in engineering areas usually requires the discrete WT
(DWT). The DWT is defined by using discrete values of the scaling parameter a and the
translation parameter b . Adjustment: 0ma a and 0 0
mb nb a , we obtain the following
2, 0 00
m mm n t a a t nb ,
where ,m n Z , and m is indicating frequency localization and n is indicating time
localization. Generally, we can choose 0 2a and 0 1b . This choice will define a dyadic-
orthonormal WT and provide the basis for multi-resolution analysis (MRA).
In MRA, any EEG signal x t can be completely decomposed in terms of approximations,
provided by scaling functions m t (also called father wavelet) and the details, provided by
the wavelets m t . The scaling function is closely related with the low-pass filters (LPF), and
the wavelet function is closely related with the high-pass filters (HPF). The decomposition of
the signal starts by passing a signal through these filters. The approximations are the low-
frequency components of the time series or signal and the details are the high-frequency
components of the signal. The signal passes through a HPF and a LPF. Then, the outputs from
filters are decimated by 2 to obtain the detail coefficients and the approximation coefficients at
level 1 (A1 and D1). The approximation coefficients are then sent to the second stage to repeat
the procedure. Finally, the signal is decomposed at the expected level (Avdakovic et al., 2009,
2010; Mallat, 1998; He & Starzyk, 2006; Mei et al., 2006).
www.intechopen.com
Wavelet Transforms and Their Recent Applications in Biology and Geoscience 48
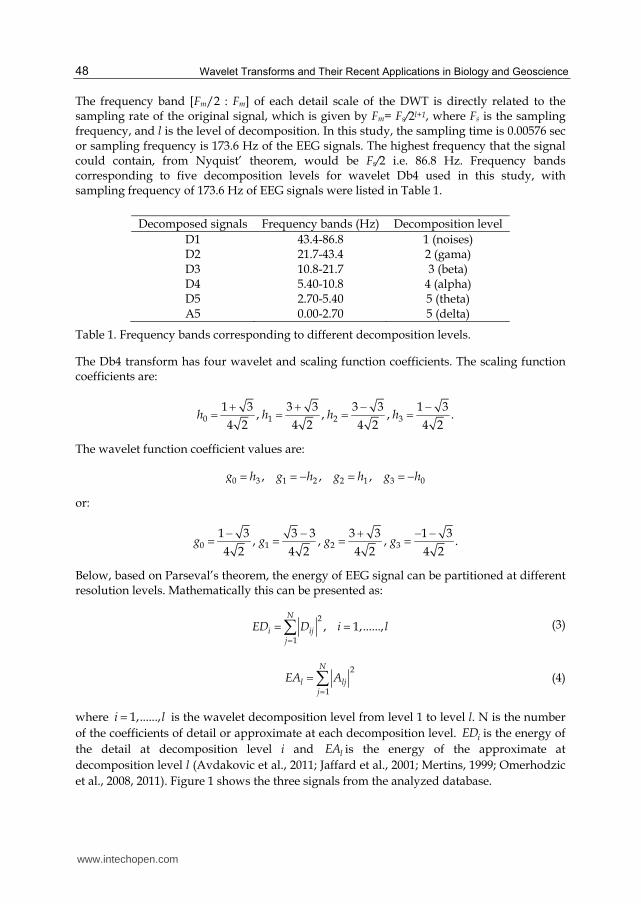
The frequency band [Fm/2 : Fm] of each detail scale of the DWT is directly related to the sampling rate of the original signal, which is given by Fm= Fs/2l+1, where Fs is the sampling frequency, and l is the level of decomposition. In this study, the sampling time is 0.00576 sec or sampling frequency is 173.6 Hz of the EEG signals. The highest frequency that the signal could contain, from Nyquist’ theorem, would be Fs/2 i.e. 86.8 Hz. Frequency bands corresponding to five decomposition levels for wavelet Db4 used in this study, with sampling frequency of 173.6 Hz of EEG signals were listed in Table 1.
Decomposed signals Frequency bands (Hz) Decomposition level
D1 43.4-86.8 1 (noises) D2 21.7-43.4 2 (gama) D3 10.8-21.7 3 (beta) D4 5.40-10.8 4 (alpha) D5 2.70-5.40 5 (theta) A5 0.00-2.70 5 (delta)
Table 1. Frequency bands corresponding to different decomposition levels.
The Db4 transform has four wavelet and scaling function coefficients. The scaling function coefficients are:
0 1 2 3
1 3 3 3 3 3 1 3, , , .
4 2 4 2 4 2 4 2h h h h
The wavelet function coefficient values are:
0 3 1 2 2 1 3 0, , ,g h g h g h g h
or:
0 1 2 3
1 3 3 3 3 3 1 3, , , .
4 2 4 2 4 2 4 2g g g g
Below, based on Parseval’s theorem, the energy of EEG signal can be partitioned at different resolution levels. Mathematically this can be presented as:
2
1
, 1,......,N
i ijj
ED D i l
(3)
2
1
N
l ljj
EA A
(4)
where 1,......,i l is the wavelet decomposition level from level 1 to level l. N is the number
of the coefficients of detail or approximate at each decomposition level. iED is the energy of
the detail at decomposition level i and lEA is the energy of the approximate at
decomposition level l (Avdakovic et al., 2011; Jaffard et al., 2001; Mertins, 1999; Omerhodzic
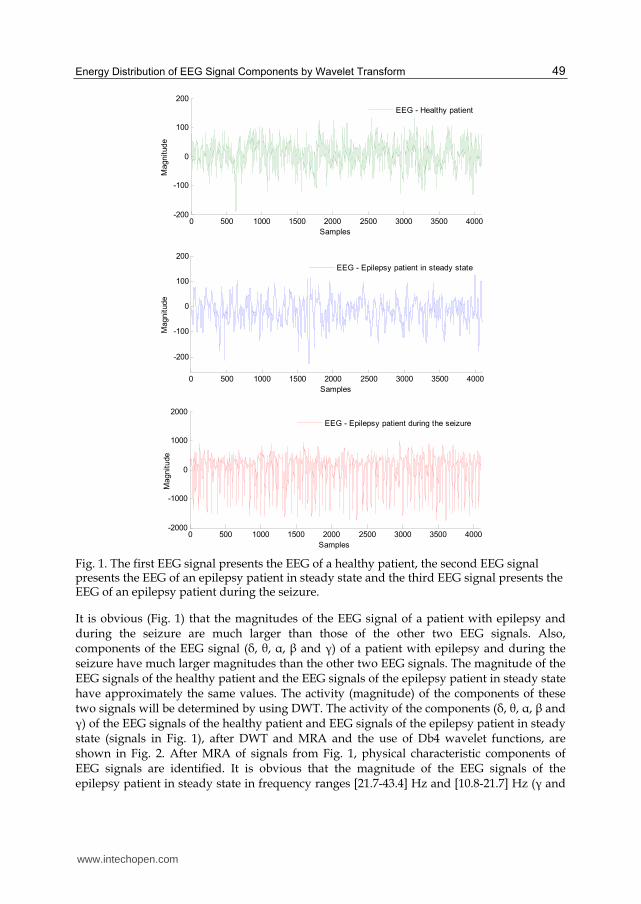
et al., 2008, 2011). Figure 1 shows the three signals from the analyzed database.
www.intechopen.com
Energy Distribution of EEG Signal Components by Wavelet Transform 49
Fig. 1. The first EEG signal presents the EEG of a healthy patient, the second EEG signal presents the EEG of an epilepsy patient in steady state and the third EEG signal presents the EEG of an epilepsy patient during the seizure.
It is obvious (Fig. 1) that the magnitudes of the EEG signal of a patient with epilepsy and during the seizure are much larger than those of the other two EEG signals. Also, components of the EEG signal (├, θ, ┙, ┚ and ┛) of a patient with epilepsy and during the seizure have much larger magnitudes than the other two EEG signals. The magnitude of the EEG signals of the healthy patient and the EEG signals of the epilepsy patient in steady state have approximately the same values. The activity (magnitude) of the components of these two signals will be determined by using DWT. The activity of the components (├, θ, ┙, ┚ and ┛) of the EEG signals of the healthy patient and EEG signals of the epilepsy patient in steady state (signals in Fig. 1), after DWT and MRA and the use of Db4 wavelet functions, are shown in Fig. 2. After MRA of signals from Fig. 1, physical characteristic components of EEG signals are identified. It is obvious that the magnitude of the EEG signals of the epilepsy patient in steady state in frequency ranges [21.7-43.4] Hz and [10.8-21.7] Hz (┛ and
0 500 1000 1500 2000 2500 3000 3500 4000-200
-100
0
100
200
Samples
Magnitude
EEG - Healthy patient
0 500 1000 1500 2000 2500 3000 3500 4000
-200
-100
0
100
200
Samples
Magnitude
EEG - Epilepsy patient in steady state
0 500 1000 1500 2000 2500 3000 3500 4000-2000
-1000
0
1000
2000
Samples
Magnitude
EEG - Epilepsy patient during the seizure
www.intechopen.com

Wavelet Transforms and Their Recent Applications in Biology and Geoscience 50
┚ waves) is much lower than the magnitude of the EEG signals of the healthy patient. The magnitudes of the signals in the frequency range [5.40-10.8] Hz (┙ waves) have roughly the same characteristics, while the magnitude of the EEG signal of the epilepsy patient in steady state in frequency ranges [2.70-5.40] Hz (θ wave) is much higher than the magnitude of the EEG signal of the healthy patient. The magnitude of the EEG signal of the epilepsy patient in steady state in the frequency range and [0.00-2.70] Hz (├ waves) has a higher magnitude than the EEG signal of the healthy patient. Energy distribution diagrams of EEG signals for different analysis cases are shown in Fig. 2.
0 500 1000 1500 2000 2500 3000 3500 4000-10
-5
0
5
10
Samples
Magnitude
D1(noises), EEG signal of the healthy patient
D1(noises), EEG signal of the epilepsy patient in steady state
0 500 1000 1500 2000 2500 3000 3500 4000-40
-20
0
20
40
Samples
Magnitude
D2 (gama), EEG signal of the healthy patient
D2 (gama), EEG signal of the epilepsy patient in steady state
0 500 1000 1500 2000 2500 3000 3500 4000
-50
0
50
100
Samples
Magnitude
D3 (beta), EEG signal of the healthy patient
D3 (beta), EEG signal of the epilepsy patient in steady state
www.intechopen.com

Energy Distribution of EEG Signal Components by Wavelet Transform 51
Fig. 2. Identification of components of EEG signals and their activity.
We could recognize different distribution of energy of the analyzed signals, which was generally quite similar for each group of EEG signals. The results showed that different groups of the analyzed signals (sets A, C and E) are obviously different in energy distribution of signals in the frequency bands of decomposition of EEG signals (Fig. 3).
0 500 1000 1500 2000 2500 3000 3500 4000-100
-50
0
50
100
Samples
Magnitude
D4 (alpha), EEG signal of the healthy patient
D4 (alpha), EEG signal of the epilepsy patient in steady state
0 500 1000 1500 2000 2500 3000 3500 4000-200
-150
-100
-50
0
50
100
150
Samples
Magnitude
D5 (theta), EEG signal of the healthy patient
D5 (theta), EEG signal of the epilepsy patient in steady state
0 500 1000 1500 2000 2500 3000 3500 4000
-100
-50
0
50
100
Samples
Magnitude
A5 (delta), EEG signal of the healthy patient
A5 (delta), EEG signal of the epilepsy patient in steady state
www.intechopen.com

Wavelet Transforms and Their Recent Applications in Biology and Geoscience 52
a)
b)
c)
Fig. 3. Energy distribution diagram (%) of a) A set - 100 EEG signals of a healthy patient, b) C set - 100 EEG signals of an epilepsy patient in steady state and c) E set - 100 EEG signals of an epilepsy patient during a seizure (Omerhodzic et al., 2010)
D1 (noises) D2 (gama) D3 (beta) D4 (alpha) D5 (theta) A5 (delta)0
20
40
60
80
100
Decomposition levels
En
erg
y [
%]
D1 (noises) D2 (gama) D3 (beta) D4 (alpha) D5 (theta) A5 (delta)0
20
40
60
80
100
Decomposition levels
En
erg
y [
%]
D1 (noises) D2 (gama) D3 (beta) D4 (alpha) D5 (theta) A5 (delta)0
10
20
30
40
50
60
70
80
Decomposition levels
Energ
y [
%]
www.intechopen.com

Energy Distribution of EEG Signal Components by Wavelet Transform 53
It was noted in the EEG signal of healthy subjects that energy activity in the frequency
components of D3 and D4 (beta and alpha) waves was quite similar, and percentage of total
energy value of the signal was around 20%. Energy activity in the frequency range D5
component (theta wave) was slightly lower in intensity and percentage of its value in total
energy signal value was around 10%, while value percentage of D2 (gamma wave) was
approximately 5%. Noise was negligibly small (D1) while the value of the frequency
components of A5 was about 45%, although for some samples it had a much higher value.
Unlike the distribution of EEG signals of healthy subjects, energy distribution of the signal
of patients with epilepsy syndrome was obviously different. In comparison with EEG
signals of healthy subjects, D2, D3 and D4 components of EEG signals have a significantly
lower percentage of total energy distribution than D5 and A5 signals. Energy distribution of
EEG signals where epileptic seizure was registered was significantly different from the first
two cases. Energy activity of D3, D4 and D5 components was dominant, while A5
component was somewhat lower.
3. Indicators of epilepsy based on WT
EEG is the recording of electrical activity along the scalp of head, produced by the firing of
neurons within the brain. It refers to the recording of the brain's spontaneous electrical
activity over a short period of time, usually 20–40 minutes, as recorded from multiple
electrodes placed on the scalp (Adeli et al., 2003; Niedermeyer & da Silva, 2004). In
neurology, the main diagnostic application of EEG is in the case of epilepsy, as epileptic
activity can create clear abnormalities on a standard EEG study (Abou-Khalil & Musilus,
2006). Well-known causes of epilepsy may include: genetic disorders, traumatic brain injury,
metabolic disturbances, alcohol or drug abuse, brain tumor, stroke, infection, and cortical
malformations (dysplasia). Therefore, EEG activity always reflects the summation of the
synchronous activity of thousands or millions of neurons that have similar spatial
orientation. Because voltage fields fall off with the square of the distance, activity from deep
sources is more difficult to detect than currents near the skull (Klein & Thorne, 2007). Scalp
EEG activity shows oscillations at a variety of frequencies. Several of those oscillations have
characteristic frequency ranges, spatial distributions, and are associated with the different
states of brain functioning. These oscillations represent synchronized activity over a
network of neurons. Daubechies wavelets are the most popular wavelets representing
foundations of wavelet signal processing, and are used in numerous applications
(Daubechies, 1992). Daubechies 4 (Db4) is selected because its smoothing feature was
suitable for detecting changes of the EEG signals.
In the context of a better understanding of the consequences of epilepsy, but also drawing some conclusions, which may indicate the development of the disease prior to the event, in the form of attack (seizure), a detailed analysis of A and C sets of EEG signals was carried out. Below, in the same way, using MRA and Db4 wavelet function, two sets of EEG signals (A set - 100 EEG signals of the healthy patient and C set - 100 EEG signals of the epilepsy patient in steady state) were partitioned at five resolution levels. Thereafter, the energy values of the components of the EEG signals were determined using Parseval’s theorem (Eq. 3 and Eq. 4). Fig. 4 shows energy values of individual components of EEG signal for set A and set C respectively.
www.intechopen.com

Wavelet Transforms and Their Recent Applications in Biology and Geoscience 54
0 10 20 30 40 50 60 70 80 90 1000
0.5
1
1.5
2
2.5
3x 10
6
Number of EEG signals
Energ
y
Energy - D2, EEG signals of the healthy patient
Energy - D2, EEG signals of the epilepsy patient in steady state
0 10 20 30 40 50 60 70 80 90 1000
1
2
3
4
5
6
7
8
9x 10
6
Number of EEG signals
Energ
y
Energy - D3, EEG signals of the healthy patient
Energy - D3, EEG signals of the epilepsy patient at study state
0 10 20 30 40 50 60 70 80 90 1000
2
4
6
8
10
12x 10
6
Number of EEG signals
Energ
y
Energy - D4, EEG signals of the healthy patient
Energy - D4, EEG signals of the epilepsy patient at study state
www.intechopen.com

Energy Distribution of EEG Signal Components by Wavelet Transform 55
Fig. 4. Energy distribution diagram of EEG signals: comparison of A and C sets (A set - 100 EEG signals of the healthy patient and C set - 100 EEG signals of the epilepsy patient in steady state).
It may be noted that in the patients diagnosed with epilepsy, D2 component activity (┛ waves) is quite low and on average it is by 58.26% lower than the EEG signals of the healthy patient. D3 activity component (┚ waves) was on average lower by 48.22%, while the activity of D4 component (┙ waves) was quite similar to the EEG signals of the healthy patient. The activity of D5 component (θ waves) was about 200% higher than the EEG signals of the healthy patient, and the activity of A5 components (├ waves) was on average higher approximately 77.32%. On average, the analyzed signals, the energy value of set C (epilepsy patients) was 82% higher than in set A (healthy subjects). However, it is possible to observe the different activities of individual components of the EEG signals for healthy and epilepsy patients, which indicates different physical processes. Weakening of or a decrease in magnitudes, over time, of some components of EEG signals (┚ and ┛ waves), or strengthening of or an increase in the magnitude of θ wave over time can be
0 10 20 30 40 50 60 70 80 90 1000
2
4
6
8
10
12x 10
6
Number of EEG signals
Energ
y
Energy - D5, EEG signals of the healthy patient
Energy - D5, EEG signals of the epilepsy patient at study state
0 10 20 30 40 50 60 70 80 90 1000
0.5
1
1.5
2
2.5
3
3.5x 10
7
Number of EEG signals
Energ
y
Energy - A5, EEG signals of the healthy patient
Energy - A5, EEG signals of the epilepsy patient at study state
www.intechopen.com

Wavelet Transforms and Their Recent Applications in Biology and Geoscience 56
reliable indicators of the development of epilepsy. This finding indicates that a timely analysis of energy values of the components of EEG signal, if made in the same patient at regular intervals, could lead to timely detection of the developing of disease before it manifests itself clinically. For a better insight into the results of an analysis of the minimum and maximum values of the components of EEG signals are used to establish thresholds (limits) of energy value where EEG signal is normal. Energy thresholds at different frequency bands (decomposition levels) based on the calculation of energy value of the EEG signals from A set and comparison with the results based on the calculation of energy value of the EEG signals from C set is presented in Table 2. Each of the 100 analyzed EEG signals from C set had ‘punching’ at set thresholds of the decomposition level. Signals marked with N005 and N097 had values outside the limits at each level of decomposition. Ten (10) signals had values beyond the boundaries of just one level of decomposition, while 90 signals had energy values beyond the boundaries at two or more levels of decomposition.
A set C set
Decomposition level Threshold (μV)2 No. of EEG signals
min max < min > max total
D2 [21.7-43.4] Hz 124.524 2.211.951 72 1 73 D3 [10.8-21.7] Hz 406.110 2.871.387 60 3 63 D4 [5.40-10.8] Hz 395.460 2.549.130 13 19 32 D5 [2.70-5.40] Hz 240.620 1.872.889 0 58 58 A5 [0.00-2.70] Hz 846.406 23.970.453 0 6 6
Table 2. Energy thresholds at different frequency bands (decomposition levels) based on the calculation of the energy value of the EEG signals from A set and comparison with results based on the calculation of the energy value of EEG signals from C set.
4. EEG signal classifier based on percentage of energy distribution
The percentage of energy distribution can be used for classification of EEG signals. One of the common tools used for classification are Artificial Neural Networks (ANN). Details on the mathematical background of ANN can be found in many books and papers (Subasi & Erçelebi, 2005; Dreiseitl & Ohno-Machado, 2002; Basheer & Hajmeer, 2000; Chaudhuri & Bhattacharya, 2000). In the classifier based on percentage of energy distribution of EEG signals (Omerhodzic et al., 2010) the Feed-Forward Neural Network (FFNN) is used to classify different EEG signals. FFNN model was provided in Matlab. The algorithm structure is based on two stages: feature extraction stage (FES) and classification stage (CS). The input of CS is a pre-processed signal. In this case, EEG signal in the time domain is transformed into the wavelet domain before applying as input to CS. Based on the feature extraction, 6-dimensional feature sets (D1, D2, D3, D4, D5 and A5) for training and testing data were constructed. The dimensions here describe different features resulting from the WT, that is to say, the total size of training data or testing data set is 6×300. Considering the classification performance of this method, this input vector is applied as the input to the WNN structure. The training parameters and the structure of the WNN used in this study are shown in Table 3.
www.intechopen.com

Energy Distribution of EEG Signal Components by Wavelet Transform 57
Architecture
The Number of Layers 3 The Number of Neuron on the Layers
Input: 6, Hidden: 5, Output: 1
The Initial Weights and Biases Random Activation Functions Tangent Sigmoid
Training Parameters
Learning Rule Levenberg–Marquardt Back-Propagation Mean-Squared Error 1E-01
Table 3. NN Architecture and Training Parameters
They were selected to obtain the best performance, after several different experiments, such as number of hidden layers, size of hidden layers, value of the moment constant and learning rate, and type of activation functions. Data for each experiment were selected randomly. Table 4 presents classification results of WNN algorithm where 250 data sets were used to train the NN model, and 50 data sets were used for the testing process. The system can correctly classify 47 of the 50 different EEG signals in the testing set, as shown in Table 4. The classified accuracy rate of EEG signals of the proposed approach was 94.0%. A hundred percent correct classification rates were obtained for normal EEG signals.
Class Healthy Epilepsy Syndrome Seizure Accuracy
[%]
Healthy 16 0 0 100.0 Epilepsy Syndrome 2 17 0 88.2
Seizure 0 1 14 92.9
Overall Success Rate 94.0
Table 4. EEG classification results of WNN algorithm
This approach presents relativly simple WNN classifier with high accuracy of EEG signal classification and could be compared with findings of other authors (Adeli et al., 2007; Ghosh-Dastidar et al., 2007). The DWT-based method proposed in this chapter was applied to three sets of EEG signals for identification of components of EEG signals and their activity. Frequency band of signal decomposition corresponded to the frequency range of individual components of EEG signal (gamma, beta, alpha, theta and delta). The results showed that different groups of the analyzed signals (sets A, C and E) are obviously different in energy distribution of signals in the frequency bands of decomposition of EEG signals.
5. Conclusion
WT, due to its advantages over the other techniques of analyzing and processing of signals, found its application in medicine. EEG signals provide important information for several types of neurological diseases. The presented methods for the analysis of EEG signal did not give at full capacity the necessary information that would help secure confirmation or exclusion of certain diseases (e.g. epilepsy). We believe that analysis of EEG signals using
www.intechopen.com

Wavelet Transforms and Their Recent Applications in Biology and Geoscience 58
WT can be a suitable method for precise and reliable identification of bioelectric state of the cerebral cortex, both in healthy patients and epilepsy patients in steady state. Finally, it can be quite a reliable indicator of epilepsy. The example of analysis of EEG signals presented here, using the discrete WT, allows identification of components of EEG signals and determines their energy value. Monitoring and analysis of the patient over a longer period of time can give us more information concerning the development of epilepsy. WT in combination with ANN allows implementation of quite a simple classifier based on energy distribution of the EEG signal components. Identification of activities of individual components of EEG signals, as well as the physicality of the processes that occur at the source of these waves, should be subject of the future research.
6. References
Abou-Khalil, B. & Musilus, K.E. (2006). Atlas of EEG and Seizure Semiology. Philadelphia: Butterworth-Heinemann/Elsevier
Adeli, H.; Ghosh-Dastidar, S. & Dadmehr, N. (2007). A wavelet-chaos methodology for analysis of EEGs and EEG subbands to detect seizure and epilepsy. IEEE Trans Biomed Eng, Vol.54, No.2, pp. 205-211
Adeli, H.; Zhou, Z. & Dadmehr, N. (2003). Analysis of EEG records in an epileptic patient using wavelet transform. J Neurosci Methods, Vol.123, pp. 69-87
Andrzejak, R.G.; Lehnertz, K.; Rieke, C.; Mormann, F.; David, P. & Elger, C.E. (2001). Indications of nonlinear deterministic and finite dimensional structures in time series of brain electrical activity: Dependence on recording region and brain state. Phys Rev E, Vol. 64 (6 Pt 1):061907, 10.10.2011, Available from: http://epileptologie-bonn.de/cms/front_content.php?idcat=193&lang=3&changelang=3
Arab, M.R.; Suratgar, A.A. & Ashtiani, A.R. (2010). Electroencephalogram signals processing for topographic brain mapping and epilepsies classification. Comput Biol Med, Vol.40, pp. 733-739
Asaduzzaman, K.; Reaz, M.B.; Mohd-Yasin, F.; Sim, K.S. & Hussain, M.S. (2010). A study on discrete wavelet-based -noise removal from EEG signals. Adv Exp Med Biol, Vol.680, pp. 593-599
Avdakovic, S.; Music, M.; Nuhanovic, A. & Kusljugic, M. (2009). An identification of active power imbalance using wavelet transform, Proceedings of The Ninth IASTED European Conference on Power and Energy Systems, Palma de Mallorca, Spain, September 7-9, paper ID 681-019
Avdakovic, S.; Nuhanovic, A. & Kusljugic, M. (2011). An estimation rate of change of frequency using wavelet transform. International Review of Automatic Control (Theory and Applications), Vol. 4, No. 2, pp. 267-272
Avdakovic, S.; Nuhanovic, A.; Kusljugic, M. & Music, M. (2010). Wavelet transform applications in power system dynamics. Electric Power Systems Research, Elsevier, doi: 10.1016/j.epsr.2010.11.031
Aylward, R.L. (2008). Epilepsy: a review of reports, guidelines, recommendations and models for the provision of care for patients with epilepsy. Clin Med, Vol. 4, pp. 433-438
Basheer, I.A. & Hajmeer A. (2000). Artificial neural networks: fundamentals, computing, design, and application, J Microbiol Methods, Vol. 43, pp. 3-31
www.intechopen.com

Energy Distribution of EEG Signal Components by Wavelet Transform 59
Bauer, G.; Bauer, R.; Dobesberger, J.; Unterberger, I.; Ortler, M.; Ndayisaba, J.P. & Trinka, E. (2008). Broad sharp waves-an underrecognized EEG pattern in patients with epileptic seizures. J Clin Neurophysiol, Vol. 25, pp. 250-254
Chaudhuri, B.B. & Bhattacharya, U. (2000). Efficient training and improved performance of multilayer perceptron in pattern classification, Neurocomputing, Vol. 34, pp. 11-27
Daubechies, I. (1992). Ten Lectures on Wavelets. Philadelphia: Society for Industrial and Applied Mathematics
Dreiseitl, S. & Ohno-Machado, L. (2002). Logistic regression and artificial neural network classification models: a methodology review, J Biomed Inform, Vol. 35, pp. 352-359
Ernst, F.; Schlaefer, A. & Schweikard, A. (2007). Prediction of respiratory motion with wavelet-based multiscale autoregression. Med Image Comput Comput Assist Interv, Vol.10 (Pt 2), pp. 668-675
Ghosh-Dastidar, S; Adeli, H. & Dadmehr, N. (2007). Mixed-Band Wavelet-Chaos-Neural Network Methodology for Epilepsy and Epileptic Seizure Detection. IEEE Trans Biomed Eng, Vol. 54, No. 9, pp. 1545-1551
Guo, L.; Rivero, D.; Dorado, J.; Rabuñal, J.R. & Pazos, A. (2010). Automatic epileptic seizure detection in EEGs based on line length feature and artificial neural networks. J Neurosci Methods, Vol.191, pp. 101-109
Guo, L.; Rivero, D.; Seoane, J.A. & Pazos A. (2009). Classification of EEG signals using relative wavelet energy and artificial neural networks. GEC’09, Shanghai, China
He, H. & Starzyk, J.A. (2006). A self-organizing learning array system for power quality classification based on wavelet transform. IEEE Transaction On Power Delivery, Vol. 21, No. 1, pp. 286-295, ISSN 0885-8977
Jaffard S., Meyer Y. & Ryan R.D. (2001). Wavelets - Tools for Science and Technology, Philadeplhia: SIAM
Klein, S. & Thorne, B.M. (2007). Biological psychology, New York: Worth Latka, M.; Kozik, A.; Jernajczyk, J.; West, B.J. & Jernajczyk, W. (2005). Wavelet mapping of
sleep spindles in young patients with epilepsy. J Physiol Pharmacol, Vol. 56 (Suppl 4), pp. 15-20
Lefter, S.; O'Toole, O. & Sweeney B. (2010). Epilepsy and driving: new European Union guidelines. Ir Med J, Vol. 103, No. 3, pp. 86-88
Leise, T.L. & Harrington, M.E. (2011). Wavelet-based time series analysis of circadian rhythms. J Biol Rhythms, Vol.26 No.5, pp. 454-463
Lessa, P.S.; Sato, J.R.; Cardoso, E.F.; Neto, C.G.; Valadares, A.P. & Amaro, E. Jr. (2011). Wavelet correlation between subjects: a time-scale data driven analysis for brain mapping using fMRI. J Neurosci Methods, Vol. 194, No. 2, pp. 350-357
Leung, H.; Schindler, K.; Chan, A.Y.; Lau A.Y.; Leung, K.L.; Ng, N.G. & Wong, V.S. (2009). Wavelet-denoising of electroencephalogram and the absolute slope method: a new tool to improve electroencephalographic localization and lateralization. Clin Neurophysiol, Vol.120, No.7, pp. 1273-1281
Mallat, S. (1998). A Wavelet Tour of Signal Processing, San Diego: Academic Press, Inc., ISBN 0-12-466606-X
McHugh, J.C. & Delanty, N. (2008). Epidemiology and classification of epilepsy: gender comparisons. Int Rev Neurobiol, Vol. 83, pp. 11-26
www.intechopen.com

Wavelet Transforms and Their Recent Applications in Biology and Geoscience 60
Mei, K.; Rovnyak, S. M. & Ong, C-M. (2006). Dynamic Event Detection Using Wavelet Analysis, Proceedings of IEEE PES General Meeting, pp. 1-7, ISBN 1-4244-0493-2, Montreal, Canada, June 18-22, 2006
Mertins, A. (1999). Signal analysis: Wavelets, Filter Banks, Time-Frequency, Transforms and Applications, New York: John Wiley&Sons Ltd, ISBN 0471986267
Mirowski, P.; Madhavan, D.; Lecun, Y. & Kuzniecky R. (2009). Classification of patterns of EEG synchronization for seizure prediction. Clin Neurophysiol, Vol. 120, No. 11, pp. 1927-1940
Ngugi, A.K.; Kariuki, S.M.; Bottomley, C.; Kleinschmidt, I.; Sander, J.W. & Newton, C.R. (2011). Incidence of epilepsy: A systematic review and meta-analysis. Neurology, Vol. 77, No. 10, pp. 1005-1012
Niedermeyer, E. & da Silva, F.L. (2004). Electroencephalography: Basic Principles, Clinical Applications, and Related Fields. New York: Lippincot Williams & Wilkins
Oehler, M.; Schilling, M. & Esperer, H.D. (2009). Capacitive ECG system with direct access to standard leads and body surface potential mapping. Biomed Tech, Vol.54, pp. 329-335
Omerhodzic I.; Avdakovic, S.; Dizdarevic, K. & Nuhanovic, A. (2011). Wavelet transform based analysis of EEG signals and indicators of epilepsy. Acta Clin Croat, Vol. 50 (Suppl 1), p. 42
Omerhodzic, I.; Avdakovic, S.; Nuhanovic, A. & Dizdarevic K. (2010). Energy distribution of EEG signals: EEG signal Wavelet-Neural Network classifier. World Academy of Science, Engineering and Technology. Vol.61, pp.1190-1195
Omerhodzic, I.; Causevic, E.; Dizdarevic, K.; Avdakovic, S.; Music, M.; Kusljugic, M.; Hajdarpasic, E. & Kadic, N. (2008). First neurosurgical expirience with the wavelet based EEG in diagnostic of concussion. Abstarct book, p. 118, 11th Congress of Neurosurgeons of Serbia with International participation. Nais, Serbia, Oct. 2008
Patnaik, L.M. & Manyamb, O.K. (2008). Epileptic EEG detection using neural networks and post-classification" Comput Methods Programs Biomed, Vol. 91, pp. 100-109
Saiz Díaz, R.A.; Martínez Bermejo, A. & Gómez Alonso J. (2007). Diagnosis of epilepsy over the course of the disease. Neurologist, Vol. 13, No. 6 (Suppl 1), pp. S11-19
Schiff, S.J.; Aldroubi, A.; Unser, M. & Sato, S. (1994). Fast wavelet transformation of EEG. Electroencephalogr Clin Neurophysiol, Vol. 91, No 6, pp. 442-455
Subasi, A. & Erçelebi, E. (2005). Classification of EEG signals using neural network and logistic regression. Comput Methods Programs Biomed, Vol.78, pp. 87-99
Subasi, A.; Alkan, A.; Koklukaya, E. & Kiymik, M.K. (2005). Wavelet neural network classification of EEG signals by using AR model with MLE preprocessing. Neural Netw, Vol.18, No.7, pp. 985-997
Tong, S. & Thacor, N.V. (2009). Engineering in Medicine & Biology- Quantitative EEG Analysis Methods and Clinical Applications, Boston/London: Artech House
Vetterli, M. & Kovacevic, J. (1995). Wavelets and subband coding, New York: Prentice-Hall, Inc., ISBN 0-13-097080-8
Wang, J. & Xu G. (2009). Some Highlights on Epileptic EEG Processing. Recent Pat Biomed Eng, Vol. 2, pp. 48-57
Zandi A.S.; Dumont G.A.; Javidan M.A; Tafreshi, R.; MacLeod, B.A.; Ries, C.R. & Puil, E.A. (2008). A novel wavelet-based index to detect epileptic seizures using scalp EEG signals. Conf Proc IEEE Eng Med Biol Soc, Vol. 2008, pp. 919-922
www.intechopen.com

Wavelet Transforms and Their Recent Applications in Biology andGeoscienceEdited by Dr. Dumitru Baleanu
ISBN 978-953-51-0212-0Hard cover, 298 pagesPublisher InTechPublished online 02, March, 2012Published in print edition March, 2012
InTech EuropeUniversity Campus STeP Ri Slavka Krautzeka 83/A 51000 Rijeka, Croatia Phone: +385 (51) 770 447 Fax: +385 (51) 686 166www.intechopen.com
InTech ChinaUnit 405, Office Block, Hotel Equatorial Shanghai No.65, Yan An Road (West), Shanghai, 200040, China
Phone: +86-21-62489820 Fax: +86-21-62489821
This book reports on recent applications in biology and geoscience. Among them we mention the application ofwavelet transforms in the treatment of EEG signals, the dimensionality reduction of the gait recognitionframework, the biometric identification and verification. The book also contains applications of the wavelettransforms in the analysis of data collected from sport and breast cancer. The denoting procedure is analyzedwithin wavelet transform and applied on data coming from real world applications. The book ends with twoimportant applications of the wavelet transforms in geoscience.
How to referenceIn order to correctly reference this scholarly work, feel free to copy and paste the following:
Ibrahim Omerhodzic, Samir Avdakovic, Amir Nuhanovic, Kemal Dizdarevic and Kresimir Rotim (2012). EnergyDistribution of EEG Signal Components by Wavelet Transform, Wavelet Transforms and Their RecentApplications in Biology and Geoscience, Dr. Dumitru Baleanu (Ed.), ISBN: 978-953-51-0212-0, InTech,Available from: http://www.intechopen.com/books/wavelet-transforms-and-their-recent-applications-in-biology-and-geoscience/energy-distribution-of-eeg-signal-components-by-wavelet-transform

© 2012 The Author(s). Licensee IntechOpen. This is an open access articledistributed under the terms of the Creative Commons Attribution 3.0License, which permits unrestricted use, distribution, and reproduction inany medium, provided the original work is properly cited.