ENERGY CONSERVATION & DEMAND MANAGEMENT PLAN
26
ENERGY CONSERVATION & DEMAND MANAGEMENT PLAN 2019
Transcript of ENERGY CONSERVATION & DEMAND MANAGEMENT PLAN

ENERGY CONSERVATION &
DEMAND MANAGEMENT PLAN
2019

Energy Conservation & Demand Management Plan 2019
Page 1 of 26
Executive Summary The purpose of this Energy Conservation and Demand Management (ECDM) Plan from Durham College
(“DC”) is to outline specific actions and measures that will promote good stewardship of our environment
and community resources in the years to come.
This ECDM outlines how the college will reduce overall energy consumption, operating costs and
greenhouse gas emissions. This ECDM Plan is written in accordance with sections 4, 5, and 6 of the recently
amended Electricity Act, 1998, O. Reg. 507/18.
Today, utility and energy related costs are a significant part of overall operating costs. In 2018:
• Energy Use Index (EUI) was 47 ekWh/sq.ft
• Energy-related emissions equaled 4,015 tCO2e
To obtain full value from energy management activities, DC will take a strategic approach to fully integrate energy management into its business decision-making, policies and operating procedures. This active management of energy-related costs and risks will provide a significant economic return and will support other key organizational objectives.
With this prominent focus on energy management, DC can expect to achieve the following targets by
2024:
• 11 % reduction in electricity consumption
• 28 % reduction in natural gas consumption
• 947 tCO2e reduction of carbon equivalent emissions

Energy Conservation & Demand Management Plan 2019
Page 2 of 26
Contents Executive Summary ....................................................................................................................................... 1
1. Introduction .......................................................................................................................................... 3
2. Regulatory Update ................................................................................................................................ 5
3. About Durham College .......................................................................................................................... 6
Campus-Wide Historical Energy Intensity ..................................................................................... 6
Campus-Wide Historical GHG Emissions ...................................................................................... 7
Sustainability at Durham College .................................................................................................. 9
4. Site Analysis ........................................................................................................................................ 10
Oshawa Campus .......................................................................................................................... 10
4.1.1. Utility Consumption Analysis .............................................................................................. 11
4.1.2. GHG Emissions Analysis ...................................................................................................... 11
4.1.3. Proposed Conservation Measures ...................................................................................... 12
4.1.4. Geothermal Case Study ....................................................................................................... 13
4.1.5. Utility Consumption Forecast ............................................................................................. 14
4.1.6. GHG Emissions Forecast ...................................................................................................... 15
Whitby Campus ........................................................................................................................... 16
4.2.1. Utility Consumption Analysis .............................................................................................. 17
4.2.2. GHG Emissions Analysis ...................................................................................................... 17
4.2.3. Proposed Conservation Measures ...................................................................................... 18
4.2.4. Utility Consumption Forecast ............................................................................................. 19
4.2.5. GHG Emissions Forecast ...................................................................................................... 20
5. College Outlook ................................................................................................................................... 21
Campus-Wide Utility Consumption ............................................................................................ 21
Campus-Wide GHG Emissions ..................................................................................................... 22
6. Closing Comments .............................................................................................................................. 23
7. Appendix ............................................................................................................................................. 24
Glossary of Terms ........................................................................................................................ 24
List of Pictures, Tables and Figures ............................................................................................. 25
Energy Conservation & Demand Management Plan 2019
Page 3 of 26
1. Introduction
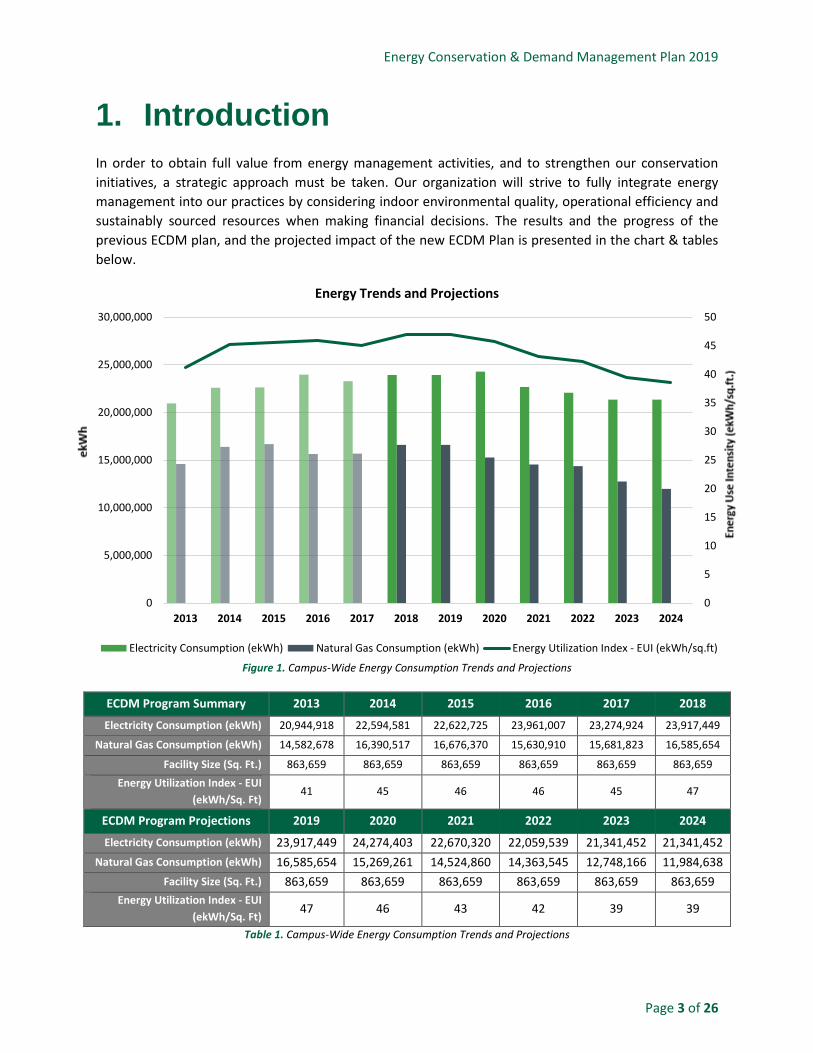
In order to obtain full value from energy management activities, and to strengthen our conservation
initiatives, a strategic approach must be taken. Our organization will strive to fully integrate energy
management into our practices by considering indoor environmental quality, operational efficiency and
sustainably sourced resources when making financial decisions. The results and the progress of the
previous ECDM plan, and the projected impact of the new ECDM Plan is presented in the chart & tables
below.
Figure 1. Campus-Wide Energy Consumption Trends and Projections
ECDM Program Summary 2013 2014 2015 2016 2017 2018
Electricity Consumption (ekWh) 20,944,918 22,594,581 22,622,725 23,961,007 23,274,924 23,917,449
Natural Gas Consumption (ekWh) 14,582,678 16,390,517 16,676,370 15,630,910 15,681,823 16,585,654
Facility Size (Sq. Ft.) 863,659 863,659 863,659 863,659 863,659 863,659
Energy Utilization Index - EUI
(ekWh/Sq. Ft) 41 45 46 46 45 47
ECDM Program Projections 2019 2020 2021 2022 2023 2024
Electricity Consumption (ekWh) 23,917,449 24,274,403 22,670,320 22,059,539 21,341,452 21,341,452
Natural Gas Consumption (ekWh) 16,585,654 15,269,261 14,524,860 14,363,545 12,748,166 11,984,638
Facility Size (Sq. Ft.) 863,659 863,659 863,659 863,659 863,659 863,659
Energy Utilization Index - EUI
(ekWh/Sq. Ft) 47 46 43 42 39 39
Table 1. Campus-Wide Energy Consumption Trends and Projections
0
5
10
15
20
25
30
35
40
45
50
0
5,000,000
10,000,000
15,000,000
20,000,000
25,000,000
30,000,000
2013 2014 2015 2016 2017 2018 2019 2020 2021 2022 2023 2024
Energy Trends and Projections
Electricity Consumption (ekWh) Natural Gas Consumption (ekWh) Energy Utilization Index - EUI (ekWh/sq.ft)

Energy Conservation & Demand Management Plan 2019
Page 4 of 26
An unwavering commitment to student success, high-quality programs led by exceptional professors with
real-world experience, graduates who’ve gone on to outstanding career success and a treasured
relationship with the community – Durham College (DC) has been guided by these ideals since 1967.
Our Mission
The student experience comes first at Durham College.
Our Vision
Durham College is the premier post-secondary destination for students who succeed in a dynamic and supportive learning environment. Our graduates develop the professional and personal skills required to realize meaningful careers and make a difference in the world.
Our Values
Our values drive our organizational culture and behaviour in delivering our vision and mission. We value:
• Integrity and transparency – We behave and communicate sincerely and honestly.
• Respect – We treat everyone with dignity deliver superior service and offer a safe environment.
• Equal access and diversity – We embrace diversity, ensure accessibility and champion all learners.
• Personal and team accountability – We do what we say we will do and are creative and innovative in how we conduct our business
• Collaboration – We create opportunities to work together to foster learning and achieve success
Our Goals
• Our students – To provide students with the best possible learning experience. • Our people – To optimize the experience and expertise of our people and help them make the
best possible contribution toward the student experience. • Our business – To manage resources responsibly and ensure that we are financially and
environmentally sustainable, demonstrate good governance, and are leaders in the support of outstanding teaching and learning.
• Our community – To contribute and respond to the economy, social and environmental well-being of our community.

Energy Conservation & Demand Management Plan 2019
Page 5 of 26
2. Regulatory Update
O. Reg. 397/11: Conservation and Demand Management Plans was introduced in 2013. Under this
regulation, public agencies were required to report on energy consumption and greenhouse gas (GHG)
emissions and develop Conservation and Demand Management (CDM) plans the following year.
Until recently, O. Reg. 397/11 was housed under the Green Energy Act, 2009 (GEA). On December 7, 2018,
the Ontario government passed Bill 34, Green Energy Repeal Act, 2018. The Bill repealed the GEA and all
its underlying Regulations, including O. Reg. 397/11. However, it re-enacted various provisions of the GEA
under the Electricity Act, 1998.
As a result, the conservation and energy efficiency initiatives, namely CDM plans and broader public sector
energy reporting, were re-introduced as amendments to the Electricity Act. The new regulation is now
called O. Reg. 507/18: Broader Public Sector: Energy Conservation and Demand Management Plans
(ECDM).
As of January 1, 2019, O. Reg. 397/11 was replaced by O. Reg. 507/18, and BPS reporting and ECDM plans
are under the Electricity Act, 1998 rather than the Green Energy Act, 2009.

Energy Conservation & Demand Management Plan 2019
Page 6 of 26
3. About Durham College DC’s Oshawa and Whitby campuses are located in safe and secure settings that offer the best of country
and city living. DC’s nine academic schools offer market-driven programs, led by industry experts, across
a wide range of disciplines from Business, IT and Management to Media, Art and Design. Thanks to our
expert faculty with extensive industry experience and leading educational resources, our alumni go on to
successful careers in their chosen field.
Campus-Wide Historical Energy Intensity Energy Utilization Index is a measure of how much energy a facility uses per square foot. By breaking
down a facility’s energy consumption on a per-square-foot-basis, we can compare facilities of different
sizes with ease. In this case, we are comparing our facility to the industry average for Ontario Colleges
(derived from Natural Resources Canada’s Commercial and Institutional Consumption of Energy Survey),
which was found to be 27.63/sq. ft.
Figure 2. Historic Annual Energy Intensity for All DC Sites
Annual Consumption (EUI)
Campus 2013 2014 2015 2016 2017 2018
Oshawa Campus 45 49 47 52 51 51
Whitby Campus 31 37 42 32 31 36
Table 2. Historic Energy Utilization Indices for All DC Sites
0
5
10
15
20
25
30
35
40
45
50
55
2013 2014 2015 2016 2017 2018
EUI (
ekW
h/s
q.f
t.)
Annual Consumption (EUI)
Oshawa Campus Whitby Campus

Energy Conservation & Demand Management Plan 2019
Page 7 of 26
Campus-Wide Historical GHG Emissions Greenhouse gas (GHG) emissions are expressed in terms of equivalent tonnes of Carbon Dioxide (tCO2e).
The GHG emissions associated with a facility are dependent on the fuel source — for example,
hydroelectricity produces fewer greenhouse gases than coal-fired plants, and light fuel oil produces fewer
GHGs than heavy oil.
Electricity from the grid in Ontario is relatively “clean”, as the majority is derived from low-GHG
hydroelectricity, and coal-fired plants have been phased out. Scope 1 (natural gas) and Scope 2 (electricity)
consumptions have been converted to their equivalent tonnes of greenhouse gas emissions in the table
below. Scope 1 represents the direct emissions from sources owned or controlled by the institution, and
Scope 2 consists of indirect emissions from the consumption of purchased energy generated upstream
from the institution.
Figure 3. Examples of Scope 1 and 2
Energy Conservation & Demand Management Plan 2019
Page 8 of 26
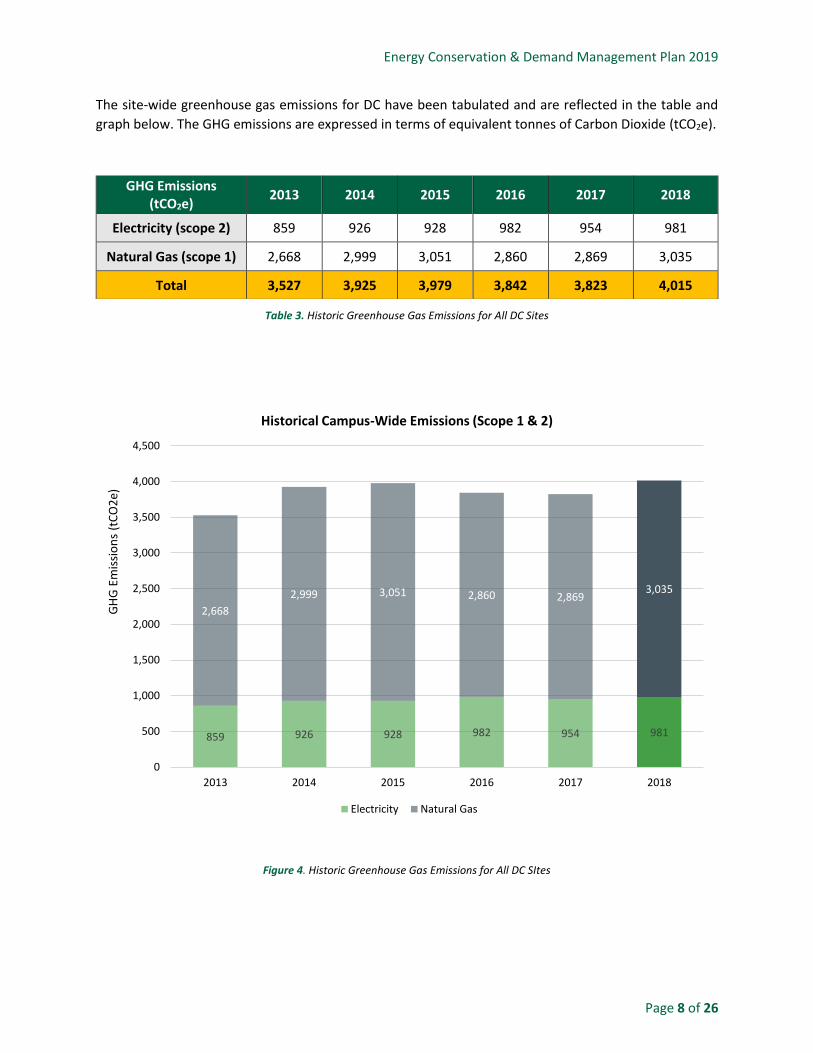
The site-wide greenhouse gas emissions for DC have been tabulated and are reflected in the table and
graph below. The GHG emissions are expressed in terms of equivalent tonnes of Carbon Dioxide (tCO2e).
GHG Emissions (tCO2e)
2013 2014 2015 2016 2017 2018
Electricity (scope 2) 859 926 928 982 954 981
Natural Gas (scope 1) 2,668 2,999 3,051 2,860 2,869 3,035
Total 3,527 3,925 3,979 3,842 3,823 4,015
Figure 4. Historic Greenhouse Gas Emissions for All DC SItes
Table 3. Historic Greenhouse Gas Emissions for All DC Sites
859 926 928 982 954 981
2,668
2,999 3,051 2,860 2,8693,035
0
500
1,000
1,500
2,000
2,500
3,000
3,500
4,000
4,500
2013 2014 2015 2016 2017 2018
GH
G E
mis
sio
ns
(tC
O2
e)
Historical Campus-Wide Emissions (Scope 1 & 2)
Electricity Natural Gas

Energy Conservation & Demand Management Plan 2019
Page 9 of 26
Sustainability at Durham College At DC, sustainability guides our decisions and practices in fostering the continued success and well-being of our students, people and planet. Aligned with the United Nations Sustainable Development Goals (SDGs), our Living Green initiative serves to inspire and equip the campus with appropriate resources to identify and implement new programs and activities designed to reduce campus energy, water, and paper consumption, maximize waste diversion, reduce greenhouse gas emissions and inspire a sustainable mindset. DC has chosen to focus on several key SDGs to guide our sustainability programs over the next few years:
• Quality Education • Clean Water and Sanitation • Affordable and Clean Energy • Decent Work and Economic Growth • Sustainable Cities and Communities • Responsible Consumption and Production • Climate Action
Action on these SDGs is supported by DC programs such as Green Office Certification, Solid Waste Management policy including waste reduction and responsible diversion, energy efficiency and renewable energy, Green Restaurant Certification, green events, and mobilization of action on campus through the Green Impact Team, to name a few. Durham College has also partnered with key local environmental organizations such as Smart Commute Durham, General Motors Company of Canada, and the Ontario Sustainable Energy Association. DC employees are also active on various regional committees such as the Durham Environmental Advisory Committee. As an institution committed to reducing our environmental footprint, we recognize that there is still work to be done, but it is also important to celebrate achievements and use them to fuel further action, such as:
• the W. Galen Weston Centre for Food (CFF) achieved the rating of 3 Star Certified Green Restaurant® from the Green Restaurant Association in 2016;
• in 2017, DC received a Silver rating from STARS (Sustainability Tracking, Assessment & Ratings System) for on-campus sustainability initiatives;
• DC earned a Gold-level Smart Commute Workplace designation in 2018; • in 2019, DC was named one of Canada’s Greenest Employers for the third year in a row.
As we work toward our goals, we will continue to use the 17 SDGs to guide us in planning and implementing future sustainability initiatives.

Energy Conservation & Demand Management Plan 2019
Page 10 of 26
4. Site Analysis The following section will introduce each of our sites and provide a brief description about the building
and its operations, energy & greenhouse gas (GHG) emissions trends, and specific conservation measures.
Oshawa Campus
Facility Information
Facility Name Durham College Oshawa Campus
Type of Facility Post-Secondary Education Institution
Address 2000 Simcoe Street N., Oshawa, ON
Gross Area (Sq. Ft) 623,040
Average Operational Hours Per Week 168
Picture 1. Oshawa Campus
Table 4. Oshawa Campus Facility Information
Energy Conservation & Demand Management Plan 2019
Page 11 of 26
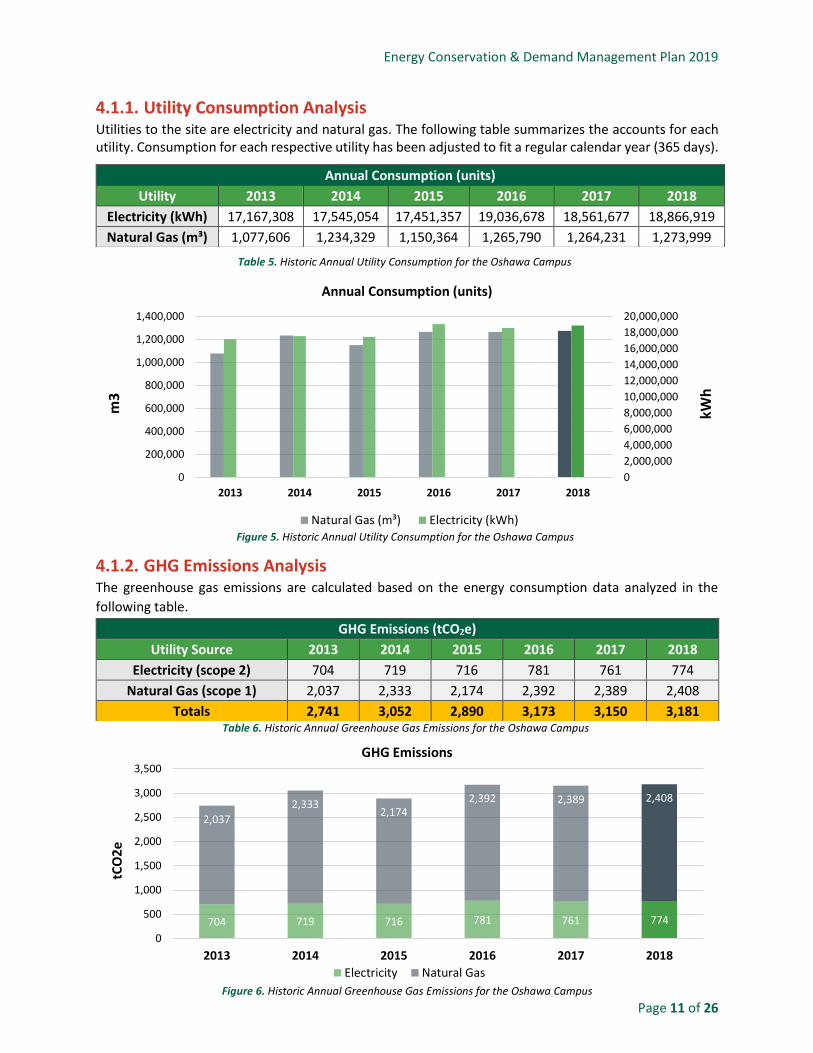
4.1.1. Utility Consumption Analysis Utilities to the site are electricity and natural gas. The following table summarizes the accounts for each utility. Consumption for each respective utility has been adjusted to fit a regular calendar year (365 days).
4.1.2. GHG Emissions Analysis The greenhouse gas emissions are calculated based on the energy consumption data analyzed in the
following table.
Annual Consumption (units)
Utility 2013 2014 2015 2016 2017 2018
Electricity (kWh) 17,167,308 17,545,054 17,451,357 19,036,678 18,561,677 18,866,919
Natural Gas (m³) 1,077,606 1,234,329 1,150,364 1,265,790 1,264,231 1,273,999
Table 5. Historic Annual Utility Consumption for the Oshawa Campus
GHG Emissions (tCO2e)
Utility Source 2013 2014 2015 2016 2017 2018
Electricity (scope 2) 704 719 716 781 761 774
Natural Gas (scope 1) 2,037 2,333 2,174 2,392 2,389 2,408
Totals 2,741 3,052 2,890 3,173 3,150 3,181 Table 6. Historic Annual Greenhouse Gas Emissions for the Oshawa Campus
0
2,000,000
4,000,000
6,000,000
8,000,000
10,000,000
12,000,000
14,000,000
16,000,000
18,000,000
20,000,000
0
200,000
400,000
600,000
800,000
1,000,000
1,200,000
1,400,000
2013 2014 2015 2016 2017 2018
kWh
m3
Annual Consumption (units)
Natural Gas (m³) Electricity (kWh)
704 719 716 781 761 774
2,037
2,3332,174
2,392 2,389 2,408
0
500
1,000
1,500
2,000
2,500
3,000
3,500
2013 2014 2015 2016 2017 2018
tCO
2e
GHG Emissions
Electricity Natural Gas
Figure 5. Historic Annual Utility Consumption for the Oshawa Campus
Figure 6. Historic Annual Greenhouse Gas Emissions for the Oshawa Campus

Energy Conservation & Demand Management Plan 2019
Page 12 of 26
4.1.3. Proposed Conservation Measures Our energy analysis has revealed several conservation strategies for the facility. Oshawa Campus’ proposed energy saving initiatives are
summarized in the table below outlining the targeted utilities. These measures will remain in place until a more efficient and cost-effective
technology is found.
Measure Impacted Utility Estimated Annual Savings Simple
Payback (years)
Expected Year of
Implementation Electricity
(kWh) $
Natural Gas (m3)
$
Lighting Upgrade to LED Fixtures Electricity & Natural
Gas 551,949 $76,614 -9,174 -$2,004 6.03 2020
Building Automation Recommissioning/Adjust Schedule
Electricity & Natural Gas
503,879 $69,942 46,471 $10,150 2.81 2020
Upgrade Selected Air Handling Units (AHU) (AHU-A1, AHU-B1, AHU-H1 &
AHU-H2)
Electricity & Natural Gas
92,236 $12,982 11,187 $2,458 45.34 2021
Convert Constant Air Volume Air Handling Units to Variable Air
Volume
Electricity & Natural Gas
482,503 $68,863 46,136 $10,193 6.01 2022
Lighting Control Based on Classroom Occupancy
Electricity 321,970 $45,317 0 $0 8.28 2021
Weather Stripping and Caulking Natural Gas 0 $0 57,335 $12,742 7.46 2023
Piping Insulation Natural Gas 0 $0 74,535 $16,468 9.41 2022
Install Submetering System (kWh, NG, BTU Meters)
N/A 0 $0 0 $0 0.00 2020
Ground Loop Heat Pump (In process of Implementation)
Electricity & Natural Gas
-356,955 -$48,864 127,434 $27,679 -436.49 2019
2.13 megawatt (MW) Rooftop Solar Electricity 128,950 $18,404 0 $0 13.58 2022
Totals 1,724,532 $243,258 353,924 $77,686
Table 7. Proposed Conservation Measures for the Oshawa Campus

Energy Conservation & Demand Management Plan 2019
Page 13 of 26
Fast Facts:
• BTES is comprised of 150 boreholes
• Each borehole is 180 meters in depth
• Average temperature year-round at 2 meters below surface: 10.5 degrees Celsius
• Total length of piping for closed loop through BTES: Approximately 55 km (the distance from Oshawa to the CN Tower)
• Anticipated Greenhouse Gas emissions reduction: 64% for heating and cooling needs of Willey Building estimated at 894.42 tonnes CO2 annually
• Durham College’s Whitby campus has a 32-borehole Geothermal GSHP system
4.1.4. Geothermal Case Study The Simcoe Geothermal Field and Energy Innovation Centre (EIC) project is part of the ongoing transformation of Durham College’s (DC) energy infrastructure to support and implement sustainably focused initiatives on campus. Completed over a 12-month construction period, the new geothermal Ground Source Heat Pump (GSHP) system is designed to provide the majority of the heating and cooling requirements of the Gordon Willey building. The Energy Innovation Centre houses the geothermal field manifold and pumping equipment for the closed loop of water and glycol. This new building with its viewing gallery, digital displays and interactive components acts as a living lab and provides new learning opportunities for students.
Tapping Into The Earth’s Resources Geothermal energy is thermal energy generated and stored in the Earth. This energy, combined with heat exchange systems, can be used as an alternative to traditional oil- gas- or coal-fired heating, ventilation and air conditioning (HVAC) systems. Other industry terms for these systems are: geoexchange or earth energy systems. Borehole thermal energy storage (BTES) describes thermal energy storage underground through a series of boreholes and associated closed-loop of piping that carries a thermal conducting fluid, typically a mixture of water and glycol.
Greenhouse Gas Campus Retrofits Program In 2018, the Ontario government announced a new funding program for Ontario post-secondary educational institutions to achieve greenhouse gas emissions relating to campus operations. Durham College received funding from this program to support a $9.1 M implementation of a new geothermal Ground Source Heat Pump system for its campus in North Oshawa, which was completed in 2019.
Picture 2. Geothermal System Construction

Energy Conservation & Demand Management Plan 2019
Page 14 of 26
4.1.5. Utility Consumption Forecast By implementing the energy conservation measures stated in the previous section, the forecasted electricity and natural gas use could be
forecasted based on the utility savings generated from individual measures. The forecasted utility consumption is tabulated below. The percentage
of change is based off the data from the baseline year of 2018.
Annual Consumption
2019 2020 2021 2022 2023 2024
Units %
Change Units
% Change
Units %
Change Units
% Change
Units %
Change Units
% Change
Electricity (kWh)
18,866,919 0% 19,223,873 -2% 18,168,045 4% 17,753,839 6% 17,142,386 9% 17,142,386 9%
Natural Gas (m³)
1,273,999 0% 1,146,565 10% 1,109,268 13% 1,098,081 14% 977,410 23% 920,076 28%
Table 8. Forecast of Annual Utility Consumption for the Oshawa Campus
Figure 7. Forecast of Annual Utility Consumption for the Oshawa Campus
0
5,000,000
10,000,000
15,000,000
20,000,000
25,000,000
0
200,000
400,000
600,000
800,000
1,000,000
1,200,000
1,400,000
2019 2020 2021 2022 2023 2024
kWhm
3
Annual Consumption Forecast
Natural Gas (m³) Electricity (kWh)

Energy Conservation & Demand Management Plan 2019
Page 15 of 26
4.1.6. GHG Emissions Forecast The forecasted greenhouse gas emissions are calculated based on the forecasted energy consumption data analyzed in the previous section and
are tabulated in the following table. The percentage of reduction is based off the data from the baseline year of 2018.
Table 9. Forecast of Annual Greenhouse Gas Emissions for the Oshawa Campus
GHG Emissions (tCO2e)
Utility Source 2019 2020 2021 2022 2023 2024
Electricity (scope 2) 774 788 745 728 703 703
Natural Gas (scope 1) 2,408 2,167 2,097 2,075 1,847 1,739
Totals 3,181 2,955 2,841 2,803 2,550 2,442
Reduction from Baseline Year (2018) 0% 7% 11% 12% 20% 23%
Figure 8. Forecast of Annual Greenhouse Gas Emissions for the Oshawa Campus
774 788 745 728 703 703
2,4082,167 2,097 2,075
1,847 1,739
0
500
1,000
1,500
2,000
2,500
3,000
3,500
2019 2020 2021 2022 2023 2024
tCO
2e
GHG Emissions
Electricity Natural Gas

Energy Conservation & Demand Management Plan 2019
Page 16 of 26
Whitby Campus
Facility Information
Facility Name Durham College Whitby Campus
Type of Facility Post-Secondary Education Institution
Address 1610 Champlain Avenue, Whitby, ON
Gross Area (Sq. Ft) 240,619
Average Operational Hours Per Week 168
Picture 3. Whitby Campus
Table 10. Whitby Campus Facility Information

Energy Conservation & Demand Management Plan 2019
Page 17 of 26
4.2.1. Utility Consumption Analysis Utilities to the site are electricity and natural gas. The following table summarizes the accounts for each utility. Consumption for each respective utility has been adjusted to fit a regular calendar year (365 days).
4.2.2. GHG Emissions Analysis The greenhouse gas emissions are calculated based on the energy consumption data analyzed in the
following table.
Annual Consumption (units)
Utility 2013 2014 2015 2016 2017 2018
Electricity (kWh) 3,777,610 5,049,527 5,171,368 4,924,329 4,713,247 5,050,530
Natural Gas (m³) 334,076 352,362 463,999 247,367 253,854 331,582
Table 11. Historic Annual Utility Consumption for the Whitby Campus
GHG Emissions (tCO2e)
Utility Source 2013 2014 2015 2016 2017 2018
Electricity (scope 2) 155 207 212 202 193 207
Natural Gas (scope 1) 631 666 877 468 480 627
Totals 786 873 1,089 669 673 834 Table 12. Historic Annual Greenhouse Gas Emissions for the Whitby Campus
0
1,000,000
2,000,000
3,000,000
4,000,000
5,000,000
6,000,000
0
100,000
200,000
300,000
400,000
500,000
2013 2014 2015 2016 2017 2018
kWh
m3
Annual Consumption (units)
Natural Gas (m³) Electricity (kWh)
Figure 9. Historic Annual Utility Consumption for the Whitby Campus
155207 212 202 193 207
631666
877
468 480
627
0
200
400
600
800
1,000
1,200
2013 2014 2015 2016 2017 2018
tCO
2e
GHG Emissions
Electricity Natural Gas
Figure 10. Historic Annual Utility Consumption for the Whitby Campus

Energy Conservation & Demand Management Plan 2019
Page 18 of 26
4.2.3. Proposed Conservation Measures Our energy analysis has revealed several conservation strategies for the facility. Whitby Campus’ proposed energy saving initiatives are
summarized in the table below outlining the targeted utilities. These measures will remain in place until a more efficient and cost-effective
technology is found.
Measure Impacted Utility Estimated Annual Savings Simple
Payback (years)
Expected Year of
Implementation Electricity
(kWh) $
Natural Gas (m3)
$
Lighting Upgrade Electricity & Natural
Gas 206,250 $28,629 -4,897 -$1,070 8.55 2020
Building Automation Recommissioning/Adjust Schedule
Electricity & Natural Gas
342,005 $47,473 39,662 $8,663 1.87 2020
Upgrade Selected AHUs (AHU-03 & AHU-07)
Electricity & Natural Gas
42,416 $5,970 4,429 $973 44.65 2021
Convert CAV AHUs to VAV Electricity & Natural
Gas 106,634 $15,219 10,838 $2,395 6.53 2022
Lighting & Ventilation Control Based on Classroom Occupancy (SW Bldg)
Electricity 154,159 $21,698 0 $0 6.68 2021
Weather Stripping and Caulking Natural Gas 0 $0 16,579 $3,685 8.14 2023
Piping Insulation Natural Gas 0 $0 24,869 $5,495 9.10 2022
Totals 851,464 $118,989 91,480 $20,141
Table 13. Proposed Conservation Measures for the Whitby Campus
Energy Conservation & Demand Management Plan 2019
Page 19 of 26
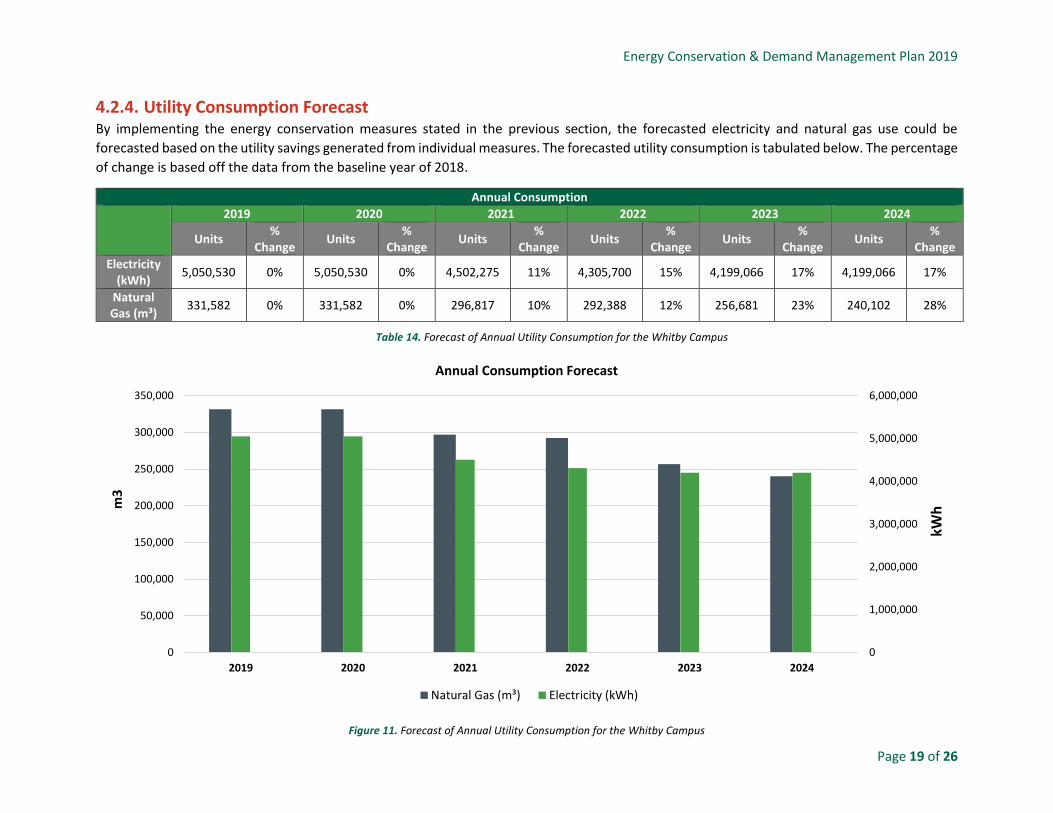
4.2.4. Utility Consumption Forecast By implementing the energy conservation measures stated in the previous section, the forecasted electricity and natural gas use could be
forecasted based on the utility savings generated from individual measures. The forecasted utility consumption is tabulated below. The percentage
of change is based off the data from the baseline year of 2018.
Annual Consumption
2019 2020 2021 2022 2023 2024
Units %
Change Units
% Change
Units %
Change Units
% Change
Units %
Change Units
% Change
Electricity (kWh)
5,050,530 0% 5,050,530 0% 4,502,275 11% 4,305,700 15% 4,199,066 17% 4,199,066 17%
Natural Gas (m³)
331,582 0% 331,582 0% 296,817 10% 292,388 12% 256,681 23% 240,102 28%
Table 14. Forecast of Annual Utility Consumption for the Whitby Campus
Figure 11. Forecast of Annual Utility Consumption for the Whitby Campus
0
1,000,000
2,000,000
3,000,000
4,000,000
5,000,000
6,000,000
0
50,000
100,000
150,000
200,000
250,000
300,000
350,000
2019 2020 2021 2022 2023 2024
kWhm
3
Annual Consumption Forecast
Natural Gas (m³) Electricity (kWh)

Energy Conservation & Demand Management Plan 2019
Page 20 of 26
4.2.5. GHG Emissions Forecast The forecasted greenhouse gas emissions are calculated based on the forecasted energy consumption data analyzed in the previous section and
are tabulated in the following table. The percentage of reduction is based off the data from the baseline year of 2018.
GHG Emissions (tCO2e)
Utility Source 2019 2020 2021 2022 2023 2024
Electricity (scope 2) 207 207 185 177 172 172
Natural Gas (scope 1) 627 627 561 553 485 454
Totals 834 834 746 729 657 626
Reduction from Baseline Year (2018) 0% 0% 11% 13% 21% 25%
Table 15. Forecast of Annual Greenhouse Gas Emissions for the Whitby Campus
Figure 12. Forecast of Annual Greenhouse Gas Emissions for the Whitby Campus
207 207 185 177 172 172
627 627
561 553485 454
0
100
200
300
400
500
600
700
800
900
2019 2020 2021 2022 2023 2024
tCO
2e
GHG Emissions
Electricity Natural Gas

Energy Conservation & Demand Management Plan 2019
Page 21 of 26
5. College Outlook
Campus-Wide Utility Consumption By implementing the energy conservation measures stated in the previous sections, in each respective campus, the campus-wide projected
electricity and natural gas use could be forecasted based on the utility savings generated from individual measures. The campus-wide forecasted
utility consumption is tabulated below. The percentage of change is based off the data from the baseline year of 2018.
Annual Consumption
2019 2020 2021 2022 2023 2024
Units %
Change Units
% Change
Units %
Change Units
% Change
Units %
Change Units
% Change
Electricity (kWh)
23,917,449 0% 24,274,403 -1% 22,670,320 5% 22,059,539 8% 21,341,452 11% 21,341,452 11%
Natural Gas (m³)
1,605,581 0% 1,478,147 8% 1,406,085 12% 1,390,469 13% 1,234,092 23% 1,160,178 28%
Table 16. Forecast of Annual Utility Consumption for All DC Sites
Figure 13. Forecast of Annual Utility Consumption for All DC SItes
0
200,000
400,000
600,000
800,000
1,000,000
1,200,000
1,400,000
1,600,000
1,800,000
0
5,000,000
10,000,000
15,000,000
20,000,000
25,000,000
30,000,000
2019 2020 2021 2022 2023 2024
m3
kWh
Campus-wide Utility Consumption Forecast
Electricity Natural Gas

Energy Conservation & Demand Management Plan 2019
Page 22 of 26
Figure 14. Forecast of Annual Greenhouse Gas Emissions for All DC Sites
Campus-Wide GHG Emissions The organizational greenhouse gas emissions are calculated based on the forecasted campus-wide energy consumption data analyzed in the
previous section and are tabulated in the following table. The percentage of reduction is based off the data from the baseline year of 2018.
GHG Emissions (tCO23)
Utility Source 2019 2020 2021 2022 2023 2024
Electricity (scope 2) 981 995 929 904 875 875
Natural Gas (scope 1) 3,035 2,898 2,869 2,573 2,193 2,193
Totals 4,015 3,789 3,587 3,532 3,207 3,068
Reduction from Baseline Year (2018) 0% 6% 11% 12% 20% 24%
Table 17. Forecast of Annual Greenhouse Gas Emissions for All DC Sites
981 995 929 904 875 875
3,0352,794
2,658 2,6282,332 2,193
0
500
1,000
1,500
2,000
2,500
3,000
3,500
4,000
4,500
2019 2020 2021 2022 2023 2024
GH
G E
mis
sio
ns
(tC
O2
e)
Campus-Wide Emissions Forecast (Scope 1 & 2)
Electricity Natural Gas

Energy Conservation & Demand Management Plan 2019
Page 23 of 26
6. Closing Comments
Thank you to all who contributed to Durham College’s Energy Conservation & Demand Management Plan.
We consider our facility a primary source of education, and an integral part of the local community. The
key to this relationship is being able to use our facilities efficiently and effectively to maximize our ability
to provide the highest quality of educational services while integrating environmental stewardship into
all aspects of facility operations.
On behalf of the Senior Management Team here at Durham College, we approve this Energy Conservation
& Demand Management Plan.
This ECDM plan was created through a collaborative effort between Durham College and Blackstone
Energy Services.

Energy Conservation & Demand Management Plan 2019
Page 24 of 26
7. Appendix
Glossary of Terms
Word Abbreviation Meaning
Baseline Year A baseline is a benchmark that is used as a foundation
for measuring or comparing current and past values.
Building Automation System BAS
Building automation is the automatic
centralized control of a building's heating, ventilation
and air conditioning, lighting and
other systems through a building management
system or building automation system (BAS)
Carbon Dioxide CO2
Carbon dioxide is a commonly referred to greenhouse
gas that results, in part, from the combustion of fossil
fuels.
Energy Usage Intensity EUI
Energy usage intensity means the amount of energy
relative to a buildings physical size typically measured
in square feet.
Equivalent Carbon Dioxide CO2e CO2e provides a common means of measurement
when comparing different greenhouse gases.
Greenhouse Gas GHG
Greenhouse gas means a gas that contributes to the
greenhouse effect by absorbing infrared radiation,
e.g., carbon dioxide and chlorofluorocarbons.
Metric Tonnes t Metric tonnes are a unit of measurement. 1 metric
tonne = 1000 kilograms
Net Zero
A net-zero energy building, is a building with zero
net energy consumption, meaning the total amount of
energy used by the building on an annual basis is
roughly equal to the amount of renewable energy
created on the site,
Variable Frequency Drive VFD
A variable frequency drive is a device that allows for
the modulation of an electrical or mechanical piece of
equipment.
Energy Conservation & Demand Management Plan 2019
Page 25 of 26
List of Pictures, Tables and Figures Pictures Picture 1. Oshawa Campus ......................................................................................................................... 10
Picture 2. Geothermal System Construction .............................................................................................. 13
Picture 3. Whitby Campus .......................................................................................................................... 16
Figures Figure 1. Campus-Wide Energy Consumption Trends and Projections ........................................................ 3
Figure 2. Historic Annual Energy Intensity for All DC Sites ........................................................................... 6
Figure 3. Examples of Scope 1 and 2 ............................................................................................................ 7
Figure 4. Historic Greenhouse Gas Emissions for All DC SItes ...................................................................... 8
Figure 5. Historic Annual Utility Consumption for the Oshawa Campus .................................................... 11
Figure 6. Historic Annual Greenhouse Gas Emissions for the Oshawa Campus ......................................... 11
Figure 7. Forecast of Annual Utility Consumption for the Oshawa Campus .............................................. 14
Figure 8. Forecast of Annual Greenhouse Gas Emissions for the Oshawa Campus ................................... 15
Figure 9. Historic Annual Utility Consumption for the Whitby Campus ..................................................... 17
Figure 10. Historic Annual Utility Consumption for the Whitby Campus ................................................... 17
Figure 11. Forecast of Annual Utility Consumption for the Whitby Campus ............................................. 19
Figure 12. Forecast of Annual Greenhouse Gas Emissions for the Whitby Campus .................................. 20
Figure 13. Forecast of Annual Utility Consumption for All DC SItes ........................................................... 21
Figure 14. Forecast of Annual Greenhouse Gas Emissions for All DC Sites ................................................ 22
Tables Table 1. Campus-Wide Energy Consumption Trends and Projections ......................................................... 3
Table 2. Historic Energy Utilization Indices for All DC Sites .......................................................................... 6
Table 3. Historic Greenhouse Gas Emissions for All DC Sites ....................................................................... 8
Table 4. Oshawa Campus Facility Information ........................................................................................... 10
Table 5. Historic Annual Utility Consumption for the Oshawa Campus ..................................................... 11
Table 6. Historic Annual Greenhouse Gas Emissions for the Oshawa Campus .......................................... 11
Table 7. Proposed Conservation Measures for the Oshawa Campus ........................................................ 12
Table 8. Forecast of Annual Utility Consumption for the Oshawa Campus ............................................... 14
Table 9. Forecast of Annual Greenhouse Gas Emissions for the Oshawa Campus .................................... 15
Table 10. Whitby Campus Facility Information .......................................................................................... 16
Table 11. Historic Annual Utility Consumption for the Whitby Campus .................................................... 17
Table 12. Historic Annual Greenhouse Gas Emissions for the Whitby Campus ......................................... 17
Table 13. Proposed Conservation Measures for the Whitby Campus ....................................................... 18
Table 14. Forecast of Annual Utility Consumption for the Whitby Campus .............................................. 19
Table 15. Forecast of Annual Greenhouse Gas Emissions for the Whitby Campus ................................... 20
Table 16. Forecast of Annual Utility Consumption for All DC Sites ............................................................ 21
Table 17. Forecast of Annual Greenhouse Gas Emissions for All DC Sites ................................................. 22