
Energy company in a competitive energy market€¦ · Energy company in a competitive energy market...
14
POLITYKA ENERGETYCZNA – ENERGY POLICY JOURNAL 2018 Volume 21 Issue 2 35–48 DOI: 10.24425/122768 35 1 The Silesian University of Technology, The Faculty of Organization and Management, Gliwice, Poland; e-mail: [email protected] Krzysztof ZAMASZ 1 Energy company in a competitive energy market ABSTRACT: Until the early 1990s, the domestic power industry was a natural monopoly. This was cau- sed by the specificity of the operation of the electricity transmission and distribution sub sectors, technical challenges of coordinating the operation of generating units and transmission networks, requirements regarding long-term forecasting of the industry development, and returns to scale. In view of the above, the objective of the presented paper is to assess the economic situation of energy companies operating in a competitive electricity market. The article analyses the main areas of activity of the energy companies, i.e.: the areas of production, transmission, distribution, and sa- les. In addition, the market shares of the various energy companies, in terms of generating capacity and the amount of the energy produced, were analyzed. Furthermore, the technical and economic situation of enterprises operating in the power sector was also subjected to analysis. The mentioned analysis has revealed that the profit received from the main activity of the enterprises (i.e. the sale of electricity) has decreased in recent years. What is more, the energy sector must adapt to legal and regulatory changes related to the intensification of the decarbonization policy pursued by the European Commission. Therefore, national energy should focus on developing skills in the areas of innovation, such as: electro mobility, energy storage, energy management, etc. KEYWORDS: energy company, energy sector, electricity generation sector
Transcript of Energy company in a competitive energy market€¦ · Energy company in a competitive energy market...

POLITYKA ENERGETYCZNA – ENERGY POLICY JOURNAL
2018 Volume 21 Issue 2 35–48
DOI: 10.24425/122768
35
1 The Silesian University of Technology, The Faculty of Organization and Management, Gliwice, Poland; e-mail: [email protected]
Krzysztof ZamasZ1
Energy company in a competitive energy market
abstract: Until the early 1990s, the domestic power industry was a natural monopoly. This was cau-sed by the specificity of the operation of the electricity transmission and distribution sub sectors, technical challenges of coordinating the operation of generating units and transmission networks, requirements regarding long-term forecasting of the industry development, and returns to scale. In view of the above, the objective of the presented paper is to assess the economic situation of energy companies operating in a competitive electricity market. The article analyses the main areas of activity of the energy companies, i.e.: the areas of production, transmission, distribution, and sa-les. In addition, the market shares of the various energy companies, in terms of generating capacity and the amount of the energy produced, were analyzed. Furthermore, the technical and economic situation of enterprises operating in the power sector was also subjected to analysis. The mentioned analysis has revealed that the profit received from the main activity of the enterprises (i.e. the sale of electricity) has decreased in recent years. What is more, the energy sector must adapt to legal and regulatory changes related to the intensification of the decarbonization policy pursued by the European Commission. Therefore, national energy should focus on developing skills in the areas of innovation, such as: electro mobility, energy storage, energy management, etc.
Keywords: energy company, energy sector, electricity generation sector

Introduction
Due to the steadily growing importance of electricity for the economic development in the world, the power industry was developing, practically up to the early 1990s, as a natural mono- poly (Kirschen and Strbac 2004). The energy sector was considered as one of several typical infrastructural monopolies, such as: telecommunications, heating, water supply or sewage sys-tems, while its development was considered as an essential factor of economic growth. The activities related to the production, transmission, and sale of electricity were considered as fully integrated elements. The main reasons that historically shaped power systems as vertically inte-grated state monopolies (Hunt 2002; Belyaev 2011) are:
1. The specificity of the operation of the electricity transmission and distribution sub sectors as a natural monopoly, which is the result of the economic inefficiency of multiplying transmission and distribution networks in the same area. As a result, the competition of transmission and distribution companies in a given region is not economically justified.
2. Technical challenges related to the coordination of the operation of generating units and the grid; as a result, for many years they were considered as inseparable. Power plants, combined heat and power plants, and grids were not managed individually.
3. Requirements for long-term forecasting of the industry development; the monopolist has the opportunity to build and develop a coordinated investment program that incorporates the main elements of the energy sector.
4. Economies of scale, according to which the increased output leads to lower unit costs of electricity generation and transmission.
In view of the above, the objective of the presented paper is to assess the economic situation of energy companies operating in a competitive electricity market. Determining the market share of individual companies is the starting point for a consistent analysis. Then, the analysis of the economic and financial situation of companies operating in the power generation industry will be carried out; the obtained results will be interpreted.
1. The main activities of energy companies
The main consequence of the implementation of market principles in the energy sector, espe-cially in the context of the production, is the increased risk of investment decisions. While in the case of a power industry operating as a regulated natural monopoly the costs of implementing inefficient projects are practically always borne directly by the consumers, then in the case of the competitive market all financial and economic consequences of incorrect investment decisions are borne by energy companies. The key risk components, to which companies operating in
36

37
the electricity generation sector are exposed, include, among others (Hunt 2002; Kuziak 2011; Zamasz 2015a):)) The strategic risk, which affects the competitive position of the company in the long term;)) The market risk, including, among others, the demand and price volatility (hourly, daily,
weekly, monthly, or yearly) – it is difficult to identify markets for other consumer or invest-ment goods with such high price volatility – even in very short periods;
)) Operational (organizational and technical) risks, including those related to the: renovation, personnel, organizational, and quality policies, or technical changes (making profitable en-terprises to become economically inefficient) etc.;
)) Credit risk;)) Investment risk.
Companies operating in the electricity market, or segments of the vertically integrated enter-prise, operate in one of four areas:)) Production,)) Transmission,)) Distribution,)) Sale of electricity.
In each of these areas, industrial activities in Poland are conducted by economically inde-pendent entities or capital groups, including: )) Polska Grupa Energetyczna PGE SA (The PGE Capital Group),)) TAURON Polska Energia SA,)) ENEA SA, )) ENERGA SA.
1.1. The area of production
Many energy companies operate in the sub-sector of electricity generation and their number is still growing. This is a result of low barriers to entry to the sector. In the past, large generating units were exclusively built by energy groups. Currently, with the development of distributed energy, renewable sources, and the growing interest in projects implemented in the area of in-dustrial energy, new producers are increasingly entering the market. In 2016, the President of the Energy Regulatory Office granted 159 concessions for electricity generation. As a result, the number of concessions valid at the end of this year was 1275 (ERO 2017).
Despite the constantly growing number of companies operating in the production sector, the majority of electricity in Poland is still produced by economic entities operating within larger structures of domestic or European capital groups. The largest generation companies (including those operating in energy groups) include: )) PGE Górnictwo i Energetyka Konwencjonalna SA,)) TAURON Wytwarzanie SA and TAURON Ciepło Sp. z o.o.,

38
)) ENEA Wytwarzanie Sp. z o.o. and ENEA Elektrownia Połaniec SA,)) ENERGA Wytwarzanie SA,)) EdF Polska SA,)) Zespół Elektrowni Pątnów–Adamów–Konin SA,)) PGNiG TERMIKA SA,)) CEZ Chorzów SA and CEZ Skawina SA.
Fig. 1 presents the share of individual companies in the installed capacity, which is a reflec-tion of their manufacturing capacities. The presented structure – formed as a result of the consol-idation of the energy sector, which took place back in 2007–2008, has not changed significantly in recent years (Zamasz 2015b). The PGE Group has largest share (35.3%) in the domestic production capacity (as of the end of 2016). The next places are taken by the following groups: ENEA (16.3%), TAURON (15.2%), EdF (10.2%), and ZE PAK (8.2%). It is worth mention-ing that as a result of the acquisition of the Połaniec power station, the generating capacity of ENEA SA has increased significantly. In addition, a significant change took place in 2017 as a result of the acquisition of the EDF Group assets by the PGE Group. After the merger, the PGE Group is the undisputed leader in terms of the available capacity – 45.5%.
Despite the fact that in terms of the energy produced the ranking of the largest energy com-panies is generally similar to the ranking of the installed capacity, some differences can be ob-served. The share of the largest energy producer (The PGE Group) is up to 40.5%; when taking the importance of the acquired power plants and combined heat and power plants into account, this share will increase to 50.2%. This is, among other things, the result of increasing the load of
Fig. 1. The share of national energy companies in the available capacity of the commercial power industry in 2016 Source: own work based on Energy Market Agency 2017
Rys. 1. Udział krajowych przedsiębiorstw energetycznych mocy osiągalnej energetyki zawodowej w 2016 r.

39
the installed capacity in the case of companies using lignite. As a result, the share of other units, using mainly hard coal, is accordingly lower (Fig. 2).
1.2. The energy transmission area
The PSE SA (Polskie Sieci Elektroenergetyczne SA) is the only electricity transmission sys-tem operator in Poland. This entity carries out the tasks of the electricity transmission system operator based on a high voltage power grid. The objective of PSE SA’s activity is to provide the services of electricity transmission in compliance with the required criteria of the securi-ty of the Polish Power System operation. The main objectives of PSE SA include (PSE SA, www.pse.pl):
1. Ensuring the secure operation of the Polish Power System whilst meeting the conditions of synchronous operation and asynchronous connections with other European systems.
2. Ensuring the necessary development of the domestic transmission grid and cross-border interconnections.
3. Making the transmission capacity available on market based methods for cross-border exchange purposes.
4. Creating the technical infrastructure for the efficient and economic operation of the do-mestic wholesale electricity market.
Fig. 2. The share of domestic energy companies in the electricity generation for the commercial power industry in 2016
Source: own work based on Energy Market Agency 2017
Rys. 2. Udział krajowych przedsiębiorstw energetycznych w produkcji energii elektrycznej energetyki zawodowej w 2016 r.

40
1.3. The distribution
Several large companies, the so-called distribution network operators (DNOs), carry out dis-tribution activities. Each of these companies is a regional monopolist. Among them, the largest (with more than 100 000 customers) include (Fig. 3):)) PGE Dystrybucja SA,)) TAURON Dystrybucja SA,)) ENERGA-Operator SA,)) ENEA Operator Sp. z o.o.,)) Innogy Stoen Operator Sp. z o.o.
The first four companies operate within larger structures of the previously mentioned capital groups.
In 2016, the President of the Energy Regulatory Office granted three transmission and dis-tribution concessions. As a consequence, the number of valid concessions at the end of this year increased to 186 (ERO 2017).
Fig. 3. The geographical area of activity of the distribution companies Source: Energy Market Information Centre (www.cire.pl)
Rys. 3. Obszar geograficzny działalności spółek dystrybucyjnych

41
1.4. The sales area
The number of companies engaged in the sale of electricity is systematically growing; this is a result of the implementation of regulations liberalizing the European electricity market. In contrast to the production process, there is no need to invest significant resources in sales, while barriers to entry into this sector are reduced on a regular basis.
In 2016, the President of the Energy Regulatory Office granted 60 concessions for electricity sales. Consequently, at the end of 2016 the number of valid concessions increased to 460; 29 of them were granted to foreign entities (ERO 2017).
2. The economic and financial situation of companies operating in the power sector
The companies operating in the power sector face a number of challenges resulting from the current socio-economic situation and the changing formal and legal conditions. In this context, it is important to pay attention to the behavior of key economic factors determining the functioning of these companies – including, in particular: revenues, costs, and profits gen-erated. Due to the specificity of the industry, changes to specific measures, taking into account the fuel used, are analyzed individually for both power plants and combined heat and power plants.
Analyzing the aggregated data for all professional thermal power plants operating in Poland, a practically unchanged surplus of sales revenues over the total costs of electricity production (at the level of approximately PLN 2.5–3.0 billion per year) until 2008 can be observed. Between 2009–2011, this margin increased to about PLN 6–7 billion, just to be reduced, as a result of the increasing competition and the changing regulatory and market environment, to a level of PLN 2.8 billion in 2013 and PLN 1.4 billion in 2014, respectively. In 2015, there was a sig-nificant increase in costs as a result of write-downs of fixed assets made by the majority of the energy groups in Poland; this resulted in a surplus of costs over benefits of approximately PLN 5.0 million. In the next year (2016), the situation returned to normal (Fig. 4).
The analysis of revenues and costs in relation to homogeneous generation sources enables a more detailed look at the financial results of energy companies. In the case of lignite-fired thermal power plants, the relative stability of total costs (at a level of about PLN 8 billion) can be observed practically throughout the analyzed period. Until 2008, the surplus of revenues over costs amounted to PLN 480–970 million, while in the years 2009–2012 it rapidly increased to a level of about PLN 3.5 billion in 2012. In the period 2013–2014, a decline to a level of about PLN 1.3 billion was observed; this trend reversed in 2015 due to the write-downs described ear-lier. In 2016, the reported results were similar to those from 2014 (Fig. 5).

42
Fig. 4. The comparison of total costs against the revenues of industrial thermal power stations, fixed prices – base year: 2016
Source: own work based on Energy Market Agency 2006–2016
Rys. 4. Porównanie kosztów całkowitych na tle przychodów ze sprzedaży w elektrowniach cieplnych zawodowych, ceny stałe – rok bazowy: 2016
Fig. 5. The comparison of total costs against the revenues of industrial lignite-fired thermal power stations, fixed prices – base year: 2016
Source: own work based on Energy Market Agency 2006–2016
Rys. 5. Porównanie kosztów całkowitych na tle przychodów ze sprzedaży w elektrowniach cieplnych zawodowych na węglu brunatnym, ceny stałe – rok bazowy: 2016
43
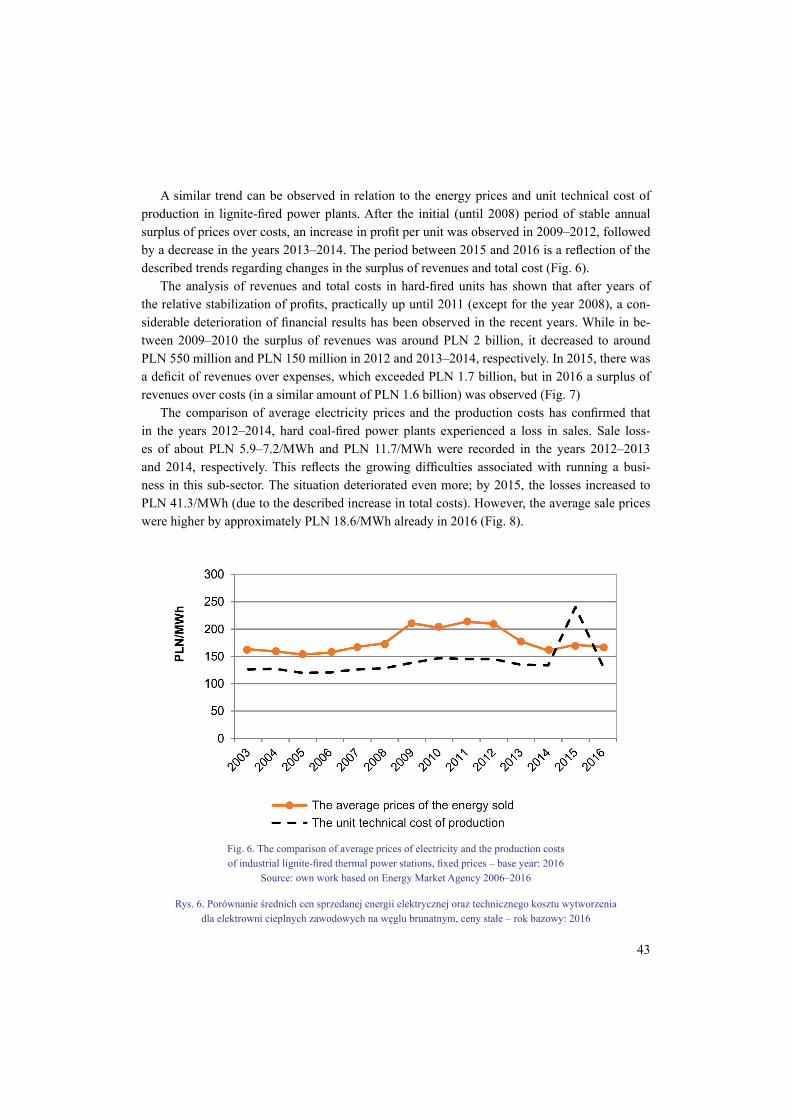
A similar trend can be observed in relation to the energy prices and unit technical cost of production in lignite-fired power plants. After the initial (until 2008) period of stable annual surplus of prices over costs, an increase in profit per unit was observed in 2009–2012, followed by a decrease in the years 2013–2014. The period between 2015 and 2016 is a reflection of the described trends regarding changes in the surplus of revenues and total cost (Fig. 6).
The analysis of revenues and total costs in hard-fired units has shown that after years of the relative stabilization of profits, practically up until 2011 (except for the year 2008), a con-siderable deterioration of financial results has been observed in the recent years. While in be-tween 2009–2010 the surplus of revenues was around PLN 2 billion, it decreased to around PLN 550 million and PLN 150 million in 2012 and 2013–2014, respectively. In 2015, there was a deficit of revenues over expenses, which exceeded PLN 1.7 billion, but in 2016 a surplus of revenues over costs (in a similar amount of PLN 1.6 billion) was observed (Fig. 7)
The comparison of average electricity prices and the production costs has confirmed that in the years 2012–2014, hard coal-fired power plants experienced a loss in sales. Sale loss-es of about PLN 5.9–7.2/MWh and PLN 11.7/MWh were recorded in the years 2012–2013 and 2014, respectively. This reflects the growing difficulties associated with running a busi-ness in this sub-sector. The situation deteriorated even more; by 2015, the losses increased to PLN 41.3/MWh (due to the described increase in total costs). However, the average sale prices were higher by approximately PLN 18.6/MWh already in 2016 (Fig. 8).
Fig. 6. The comparison of average prices of electricity and the production costs of industrial lignite-fired thermal power stations, fixed prices – base year: 2016
Source: own work based on Energy Market Agency 2006–2016
Rys. 6. Porównanie średnich cen sprzedanej energii elektrycznej oraz technicznego kosztu wytworzenia dla elektrowni cieplnych zawodowych na węglu brunatnym, ceny stałe – rok bazowy: 2016

44
Fig. 8. The comparison of average prices of electricity and the production costs of industrial coal-fired thermal power stations, fixed prices – base year: 2016
Source: own work based on Energy Market Agency 2006–2016
Rys. 8. Porównanie średnich cen sprzedanej energii elektrycznej oraz technicznego kosztu wytworzenia dla elektrowni cieplnych zawodowych na węglu kamiennym, ceny stałe – rok bazowy: 2016
Fig. 7. The comparison of total costs against the revenues of industrial hard coal-fired thermal power stations, fixed prices – base year: 2016
Source: own work based on Energy Market Agency 2006–2016
Rys. 7. Porównanie kosztów całkowitych na tle przychodów ze sprzedaży w elektrowniach cieplnych zawodowych na węglu kamiennym, ceny stałe – rok bazowy: 2016

45
As in the case of lignite-fired industrial power plants, the profits of cogeneration plants, after the stable period of 2003–2008 with annual surpluses of revenues over total costs, were signifi-cantly increased in the years 2009–2012. While lignite-fired power plants were characterized by fixed costs, a rapid increase in total costs (which were stable up to the year 2010), from a level of approximately PLN 3 billion to PLN 4.4 billion in 2014 and PLN 4.8 million in 2015, was observed in the case of combined heat and power plants. Due to a significant reduction in sales revenues (from PLN 5.2 billion PLN in 2012 to PLN 4.5 billion in 2013 and PLN 4.3 billion in 2014, the profit margin decreased accordingly. In 2014 and 2015, the level of total costs was higher than revenues from sales for the first time. The difference was about PLN 115–122 mil-lion (Fig. 9).
Similar trends were observed when analyzing the prices of electricity sold and the unit tech-nical cost of production. Even in 2012, the prices exceeded the above mentioned cost by approx-imately PLN 8/MWh. In 2013, the unit cost was higher than the average selling price by ap-proximately PLN 0.8/MWh; in 2014 it was higher by PLN 34.5/MWh, while in 2015 by almost PLN 42.0/MWh (Fig. 10). This is also confirmed by the declining energy sales in the industrial heat and power plant sector. It should be noted, however, that the year 2016 was more successful for the energy sector – the difference between the unit technical cost of production and the aver-age selling prices decreased to about PLN 7.1/MWh.
Fig. 9. The comparison of total costs against the revenues of CHP plants, fixed prices – base year: 2016 Source: own work based on Energy Market Agency 2006–2016
Rys. 9. Porównanie kosztów całkowitych na tle przychodów ze sprzedaży w elektrociepłowniach, ceny stałe – rok bazowy: 2016

46
Conclusions
The analysis of the economic and financial condition of companies operating in the electricity generation and heat production sectors indicates a reduction of profits generated from the basic (i.e. from the sale of electricity) activities of these entities. The situation is further complicated by the fact that the expected legal and regulatory changes, including the intensification of the energy and climate policy, will tighten the conditions for the functioning of the manufacturing sector. Therefore, the national energy sector should focus on developing skills in the areas of innovation, such as: electro mobility, energy storage, energy management, etc. Negligence in the specified areas may lead to an increase in electricity prices and, consequently, to a slowdown in the economic development of the country.
For this reason, the domestic energy companies need to modernize their business models, that is move towards the diversification of production sources and make production more flex-ible as a result of the implemented innovations. For this purpose, the energy companies should
Fig. 10. The comparison of average prices of electricity and the technical cost of production for CHP plants, fixed prices – base year: 2016
Source: own work based on Energy Market Agency 2006–2016
Rys. 10. Porównanie średnich cen sprzedanej energii elektrycznej oraz technicznego kosztu wytworzenia dla elektrociepłowni, ceny stałe – rok bazowy: 2016

47
make use of the new opportunities emerging with the currently implemented power market in Poland, the potential revenues from which will provide individual entities with an impulse for investments. The proper use of the impulse by the industry enabling the future functioning of competitive, efficient, and modern enterprises in the domestic and European energy market, is of great importance.
References
ARE 2006–2016. Technical and economic situation of the power sector (quarterlies for the years 2006– –2016) (Sytuacja techniczno-ekonomiczna sektora elektroenergetycznego (kwartalniki za okres 2006––2016)). Warsaw: Energy Market Agency (in Polish).
ARE 2017. The statistics of the power sector, 2016 (Statystyka elektroenergetyki polskiej 2016). Warsaw: Energy Market Agency (in Polish).
Belyaev, L.S. 2011. Electricity Market Reform: Economics and Policy Challenges. Springer, New York.Cire.pl [Online] www.cire.pl [Accessed: 2018-04-05].Hunt, S. 2002. Making Competition Work in Electricity. New York: John Wiley & Sons.KirscHen, D. and strbac, G. 2004. Fundamentals of Power System Economics. Chichester: John Wiley
& Sons.KuZiaK, K. 2011. Measurement of the enterprise risk – measurement models and their risk (Pomiar ryzyka
przedsiębiorstwa – modele pomiaru i ich ryzyko). Wrocław: Wyd. Uniwersytetu Ekonomicznego we Wrocławiu (in Polish).
PSE SA. [Online] www.pse.pl [Accessed: 2018-04-05] (in Polish).URE 2017. Report on the Activity of the President of Energy Regulatory Office in 2016 (Sprawozdanie
z działalności prezesa URE w 2016 roku). Energy Regulatory Office, Warsaw (in Polish).ZamasZ, K. 2015a. Economic efficiency of an electricity undertaking in the context of capacity market
introduction (Efektywność ekonomiczna przedsiębiorstwa energetycznego w warunkach wprowadzenia rynku mocy). Warsaw: PWN (in Polish).
ZamasZ, K. 2015b. Economic and regulatory conditions of the domestic power sector consolidation (Warunki ekonomiczne i regulacyjne konsolidacji krajowego sektora energetycznego). Polityka Ener-getyczna – Energy Policy Journal Vol. 18, Iss. 2, pp. 19–28 (in Polish).

Krzysztof ZamasZ
Przedsiębiorstwo energetyczne na konkurencyjnym rynku energii
Streszczenie
Krajowy przemysł elektroenergetyczny rozwijał się do wczesnych lat dziewięćdziesiątych XX wie-ku w strukturze państwowego monopolu naturalnego. Spowodowane to było specyfiką funkcjonowania podsektorów przesyłu i dystrybucji energii elektrycznej, wyzwaniami technicznymi koordynacji pracy jednostek wytwórczych i sieci przesyłowych, wymogami w zakresie długoterminowego prognozowania rozwoju branży oraz efektami skali. W związku z powyższym celem niniejszego artykułu jest przepro-wadzenie oceny sytuacji ekonomicznej przedsiębiorstw energetycznych funkcjonujących na konkurencyj-nym rynku energii elektrycznej. W artykule przeanalizowano główne obszary działalności przedsiębiorstw energetycznych, tj. obszar wytwarzania, obszar przesyłu, obszar dystrybucji oraz obszar sprzedaży/obrotu. Zbadano także udziały rynkowe poszczególnych spółek energetycznych, pod względem posiadanych mocy wytwórczych oraz wielkości produkowanej energii elektrycznej. Ponadto przeprowadzono analizę sytuacji techniczno-ekonomicznej przedsiębiorstw funkcjonujących w sektorze wytwarzania energii elektrycznej. Analiza ta wskazała, że w ostatnich latach zmalały zyski generowane z podstawowej działalności przedsię-biorstw (tj. ze sprzedaży energii elektrycznej). Dodatkowo sektor energetyczny musi się dostosowywać do zmian otoczenia prawno-regulacyjnego, związanego z intensyfikacją prowadzonej przez Komisję Europej-ską polityki dekarbonizacyjnej. Dlatego też krajowa energetyka powinna ukierunkować swe działania na budowę kompetencji w innowacyjnych obszarach, takich jak elektromobilność, magazynowanie energii, zarządzanie energią itp.
Słowa kluczowe: przedsiębiorstwo energetyczne, rynek energii, sektor wytwarzana energii elektrycznej


![[Economics] Perfectly Competitive Market](https://static.fdocuments.net/doc/165x107/55847362d8b42a6b4d8b4d5a/economics-perfectly-competitive-market.jpg)