Energy Choices for Minneapolis
36
Photo credit: John Farrell Minneapolis Energy Options
-
Upload
john-farrell -
Category
Documents
-
view
6.731 -
download
3
Transcript of Energy Choices for Minneapolis

Photo credit: John Farrell
Minneapolis Energy Options

Energy can make us feel powerless

Energy can make us feel powerless

Others are in control

$0
$0.03
$0.06
$0.08
$0.11
2000 2002 2004 2006 2008 2010
Residential revenue per kWh (Xcel 10-K)
Rising Rates
We face rising costs
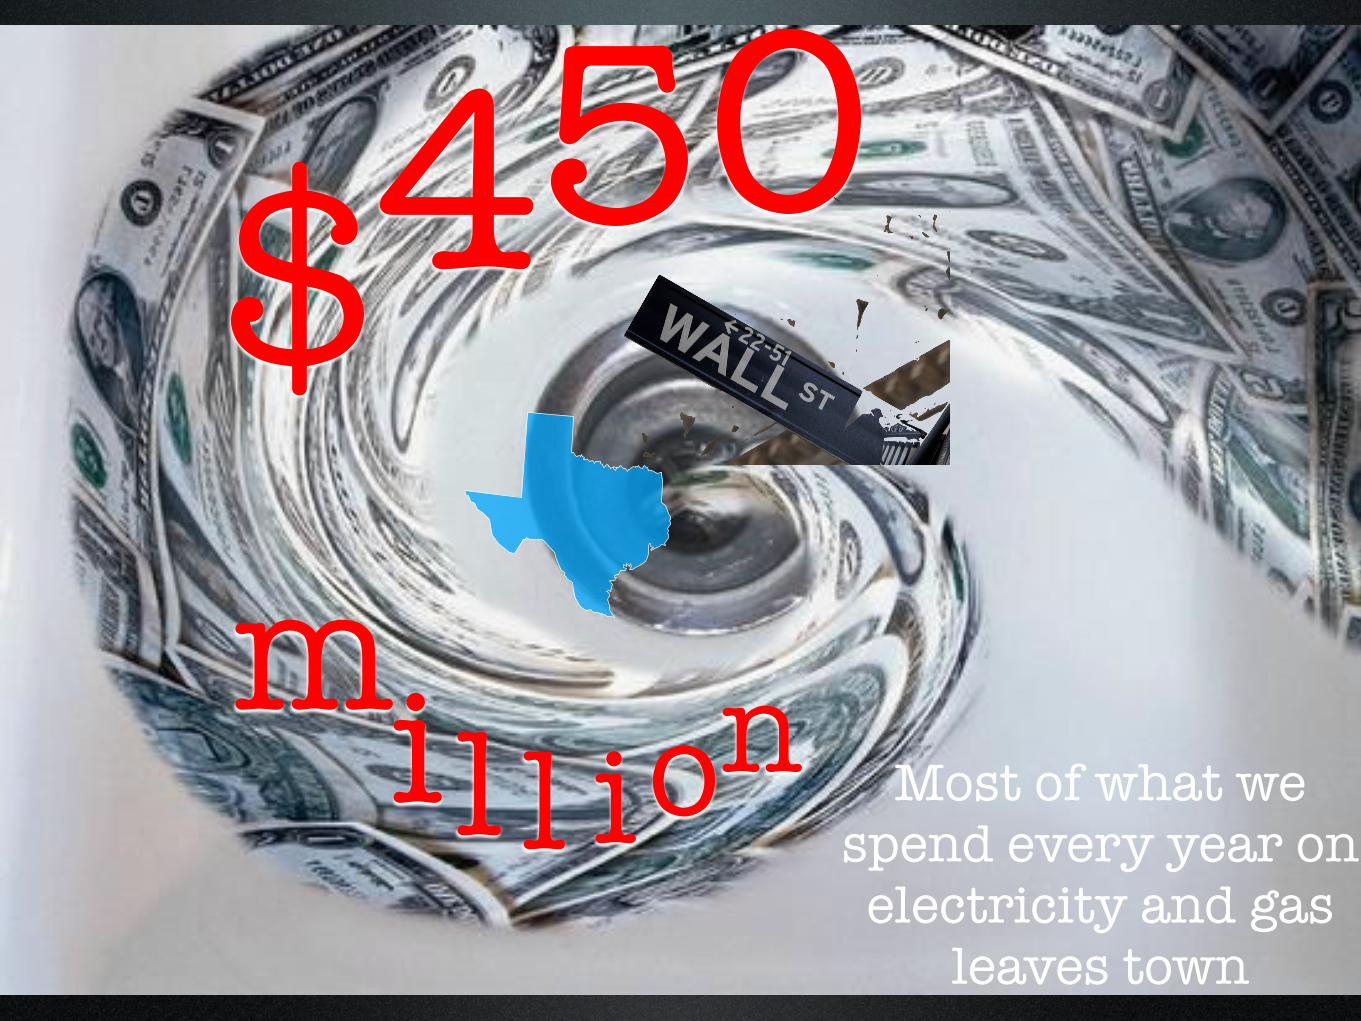
m
$il l ion
450
Most of what we spend every year on electricity and gas
leaves town

4.2 billion kilowatt-hours
0%
<1%And little of our
clean energy comes from local sources

But we’re at a crossroads

The city’s contract with
our energy companies is
up for renewal
“Franchise” provides $23 million to general fund out of $450 million per year in energy sales

20years
For the first time in

Other communities have chosen a cleaner future

$0
$0.25
$0.50
$0.75
$1.00
1992 1994 1996 1998 2000 2002 2004 2006 2008 2010
High Stakes
Cost per kilowatt-hour (kWh)
Fa ling Pri es
l
c
A lot changes in 20 years
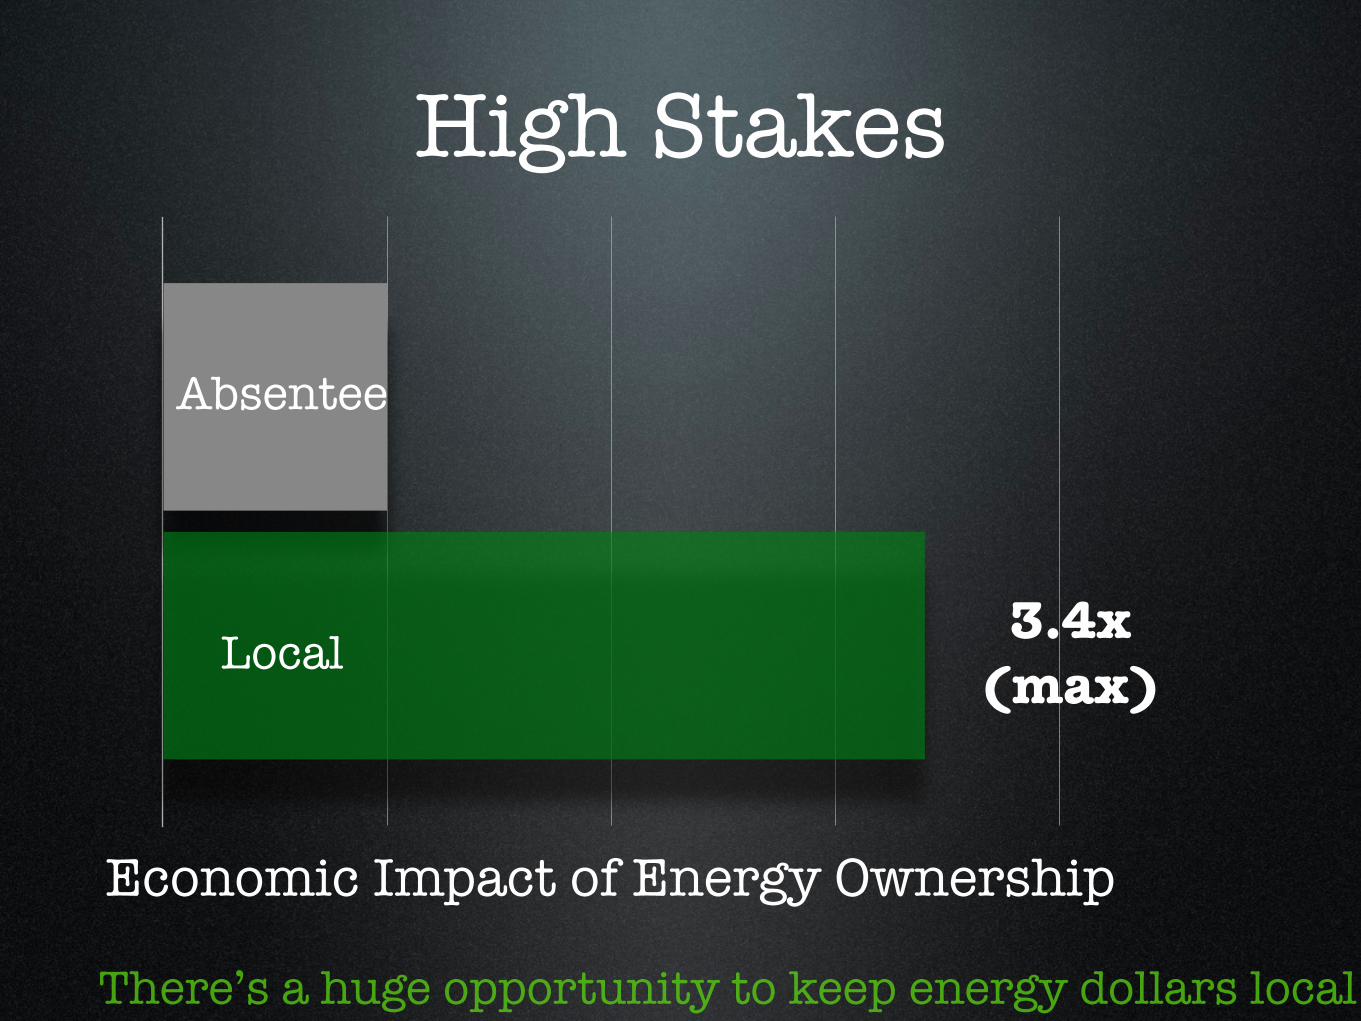
Economic Impact of Energy Ownership
Absentee
Local 3.4x (max)
High Stakes
There’s a huge opportunity to keep energy dollars local
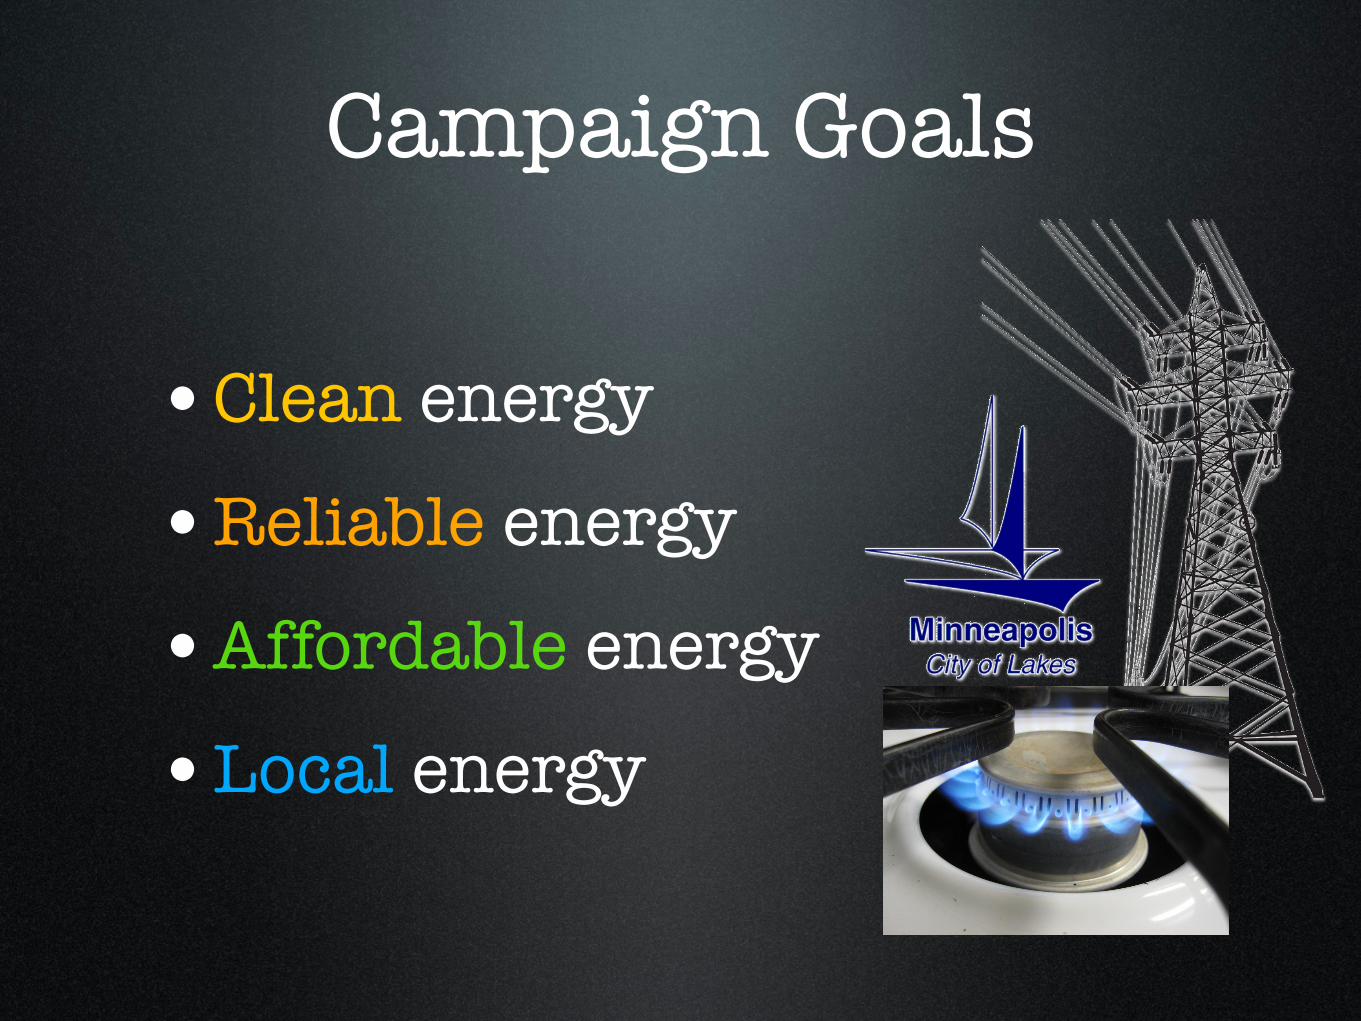
•Clean energy
•Reliable energy
•Affordable energy
•Local energy
Campaign Goals

Coalition
Prospect Park

What are the options?
Renew (status quo)
Negotiate
Do it ourselves
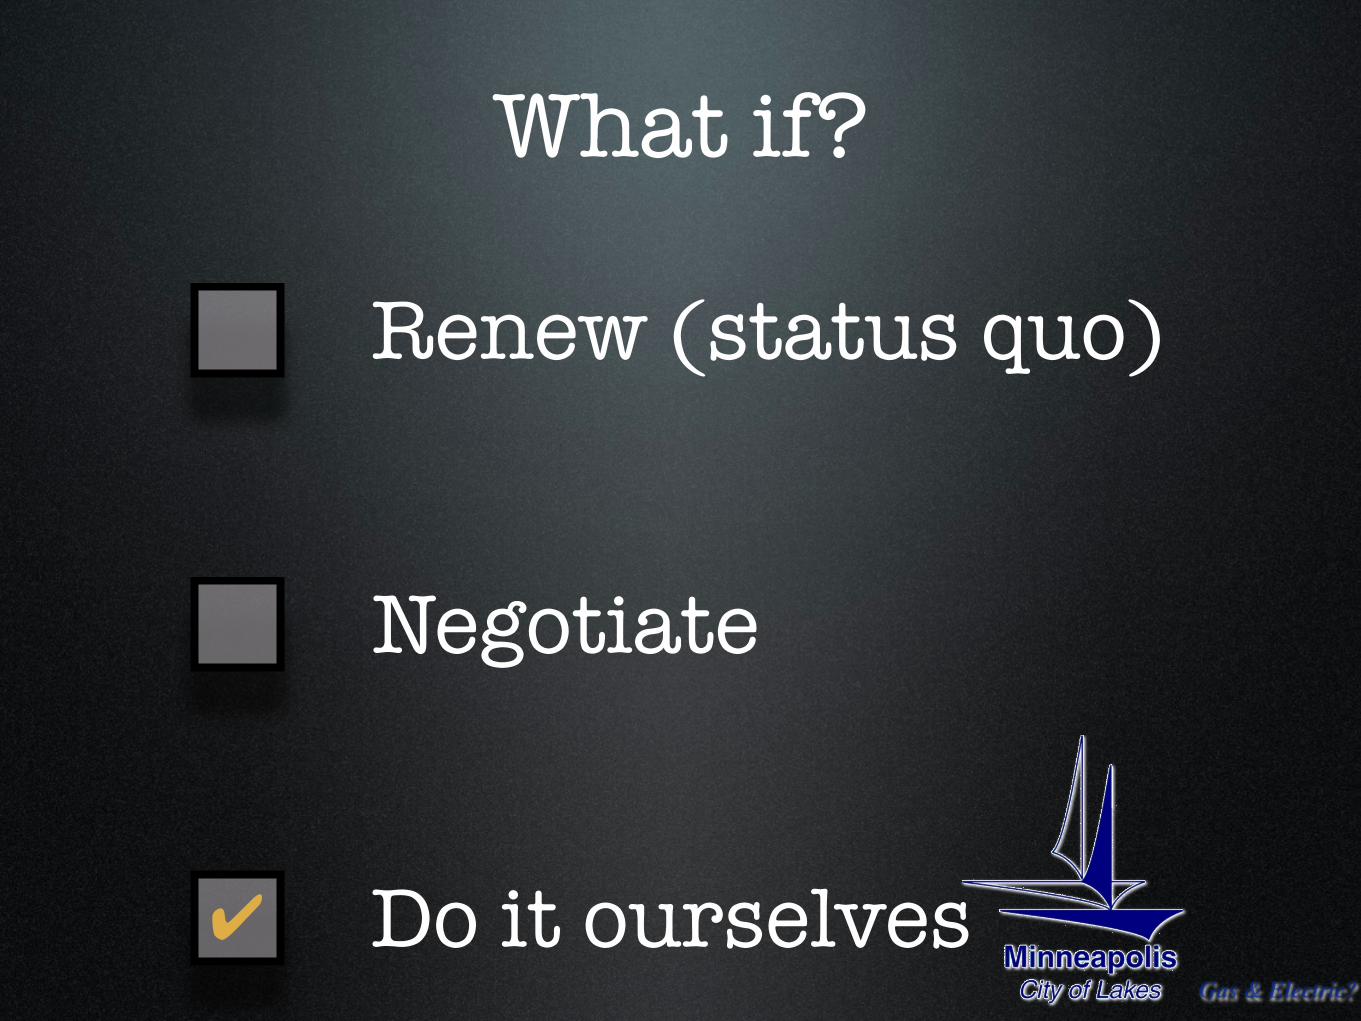
What if?
Renew (status quo)
Negotiate
✔Gas & Electric?
Do it ourselves

2005 2020 2035 2050
http://www.flickr.com/photos/albaum/2570901839/sizes/l/in/photostream/
-90%
Municipal utilitySacramento, CA
greenhouse gas emissions
SMUD serves 2x more customers than Minneapolis

http://www.flickr.com/photos/albaum/2570901839/sizes/l/in/photostream/
100 MW of solar
Municipal utilitySacramento, CA
Minneapolis has 1 MW
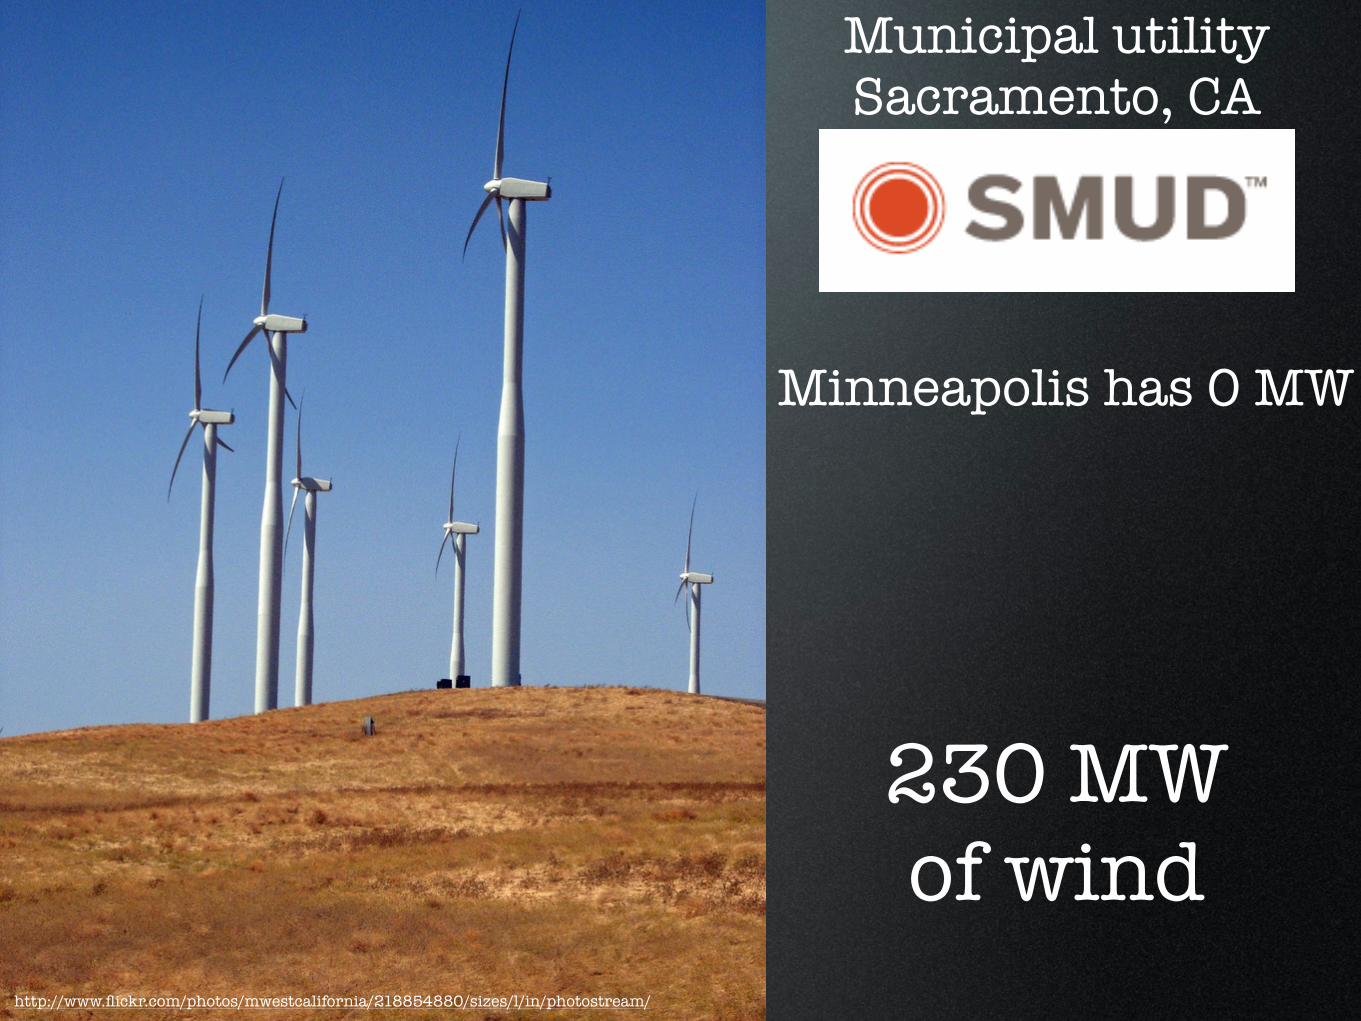
230 MWof wind
http://www.flickr.com/photos/mwestcalifornia/218854880/sizes/l/in/photostream/
Municipal utilitySacramento, CA
Minneapolis has 0 MW
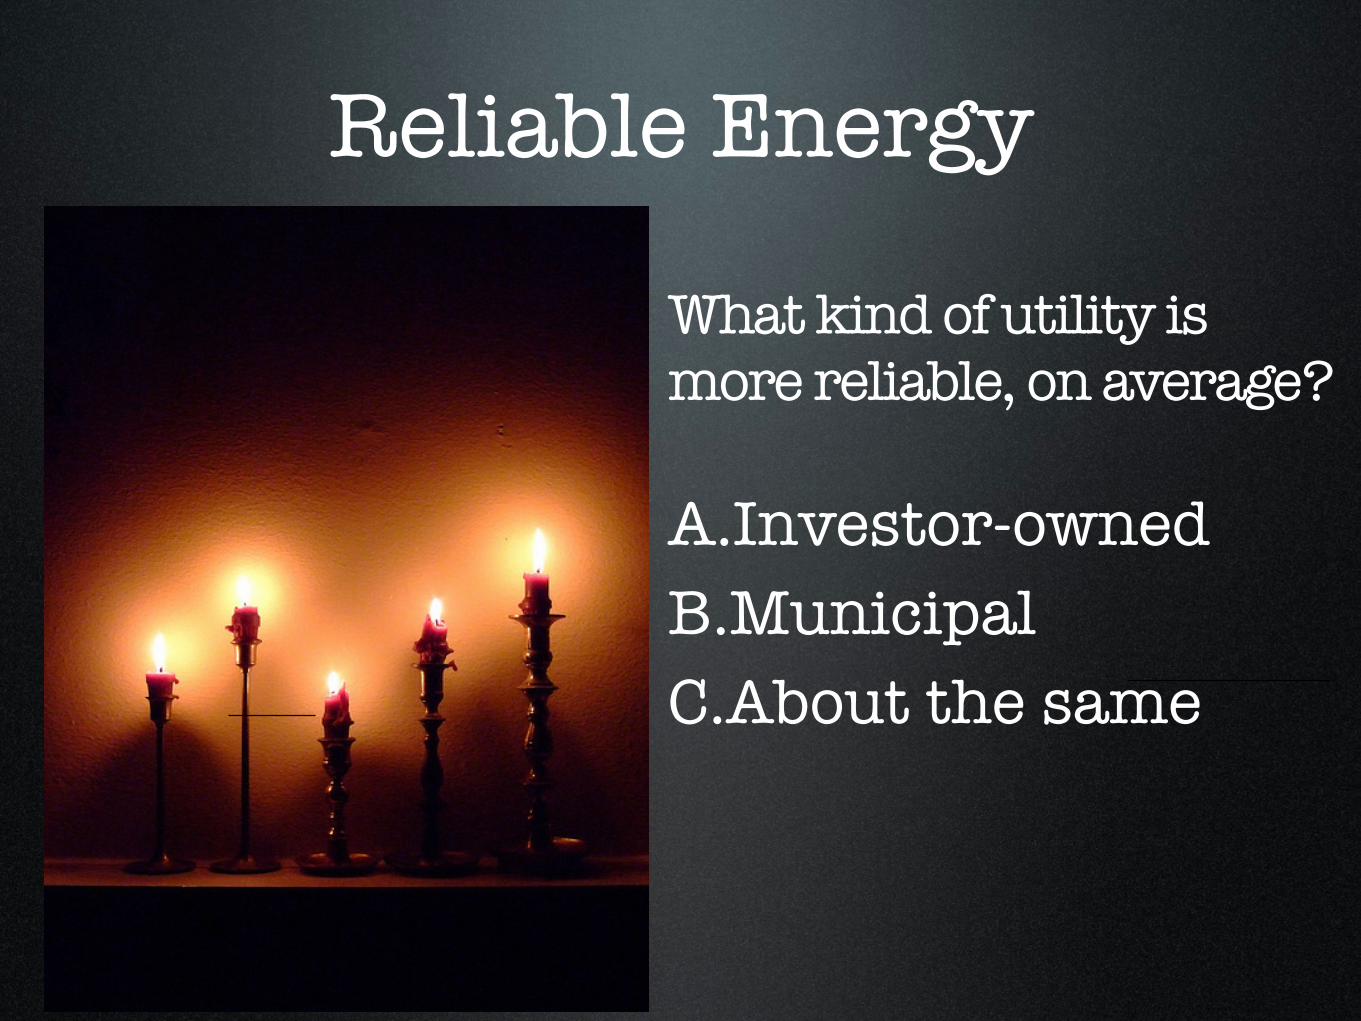
Reliable Energy
What kind of utility is more reliable, on average?
A.Investor-ownedB.MunicipalC.About the same

Reliable EnergyYear IOU Public
Power
1997 132 65
1999 191 65
2000 125 43
average outage minutes, lower is better
What kind of utility is more reliable, on average?
A.Investor-ownedB.MunicipalC.About the same

Reliable Energy
1 in 7Americans
Los Angeles
San Antonio
Austin
Rochester, MN
Moorhead, MN
get electricity from a municipal utility

Affordable Energy
AAA
BBB+
Bond rating
This means the city borrows money for less interest
v.

Affordable Energy
•No taxes
•No shareholders
•Low overhead
•Common interest
Municipal utilities have:
0
25
50
75
100
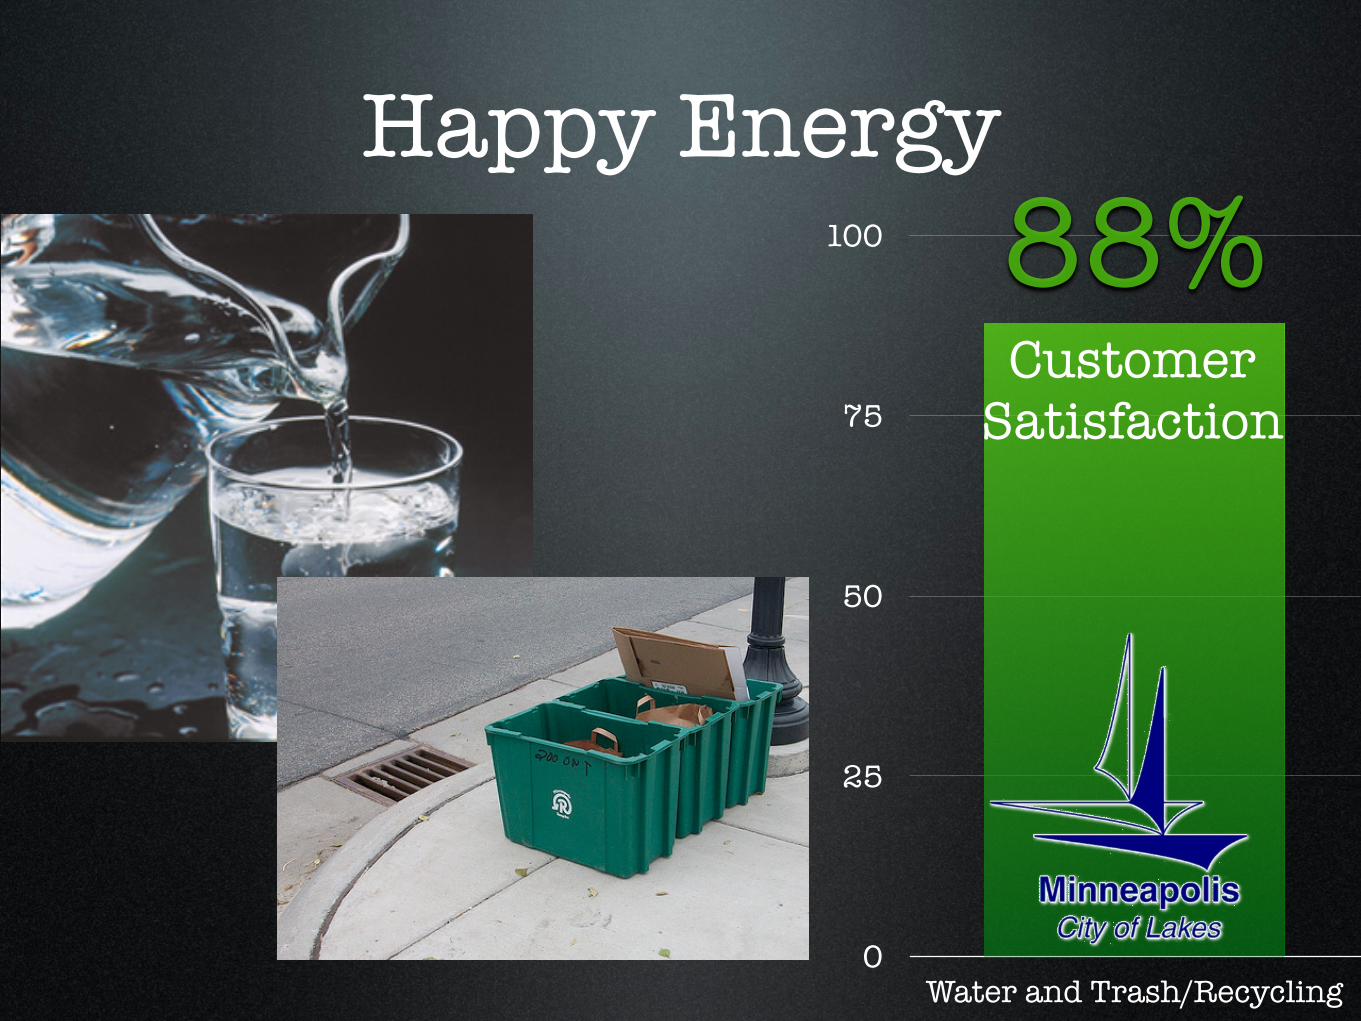
Water and Trash/Recycling
88%Happy Energy
CustomerSatisfaction

Gas & Electric?

Gas & Electric?
Maybe not.
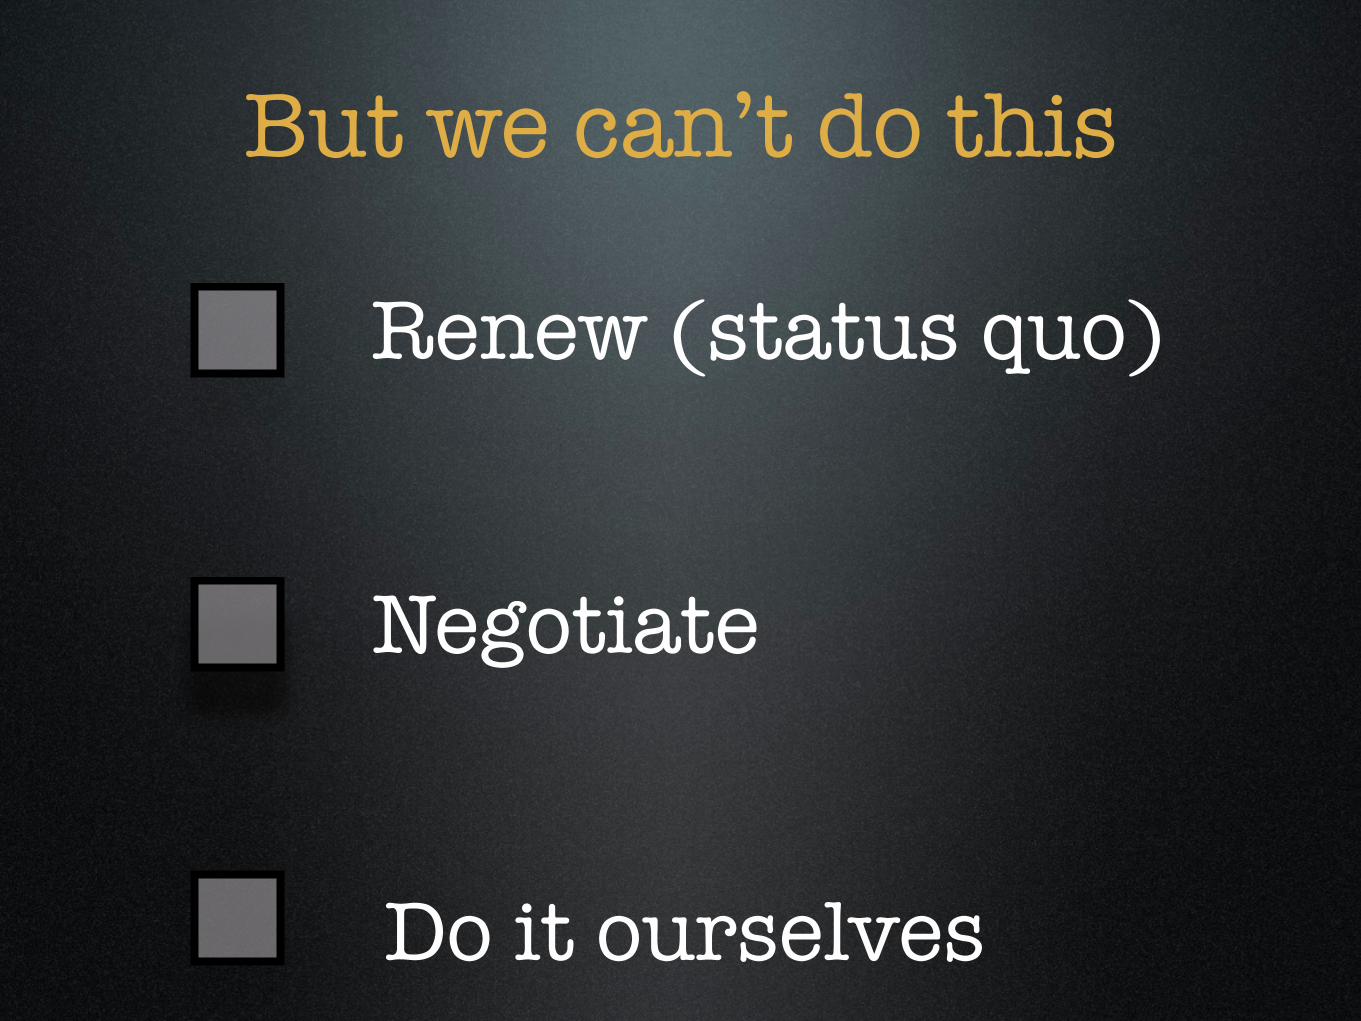
But we can’t do this
Renew (status quo)
Negotiate
Do it ourselves

Without an option for this
Renew (status quo)
Negotiate
Do it ourselvesGas & Electric?

We need
•Clean energy
•Reliable energy
•Affordable energy
•Local energy
A ballot measure authorizing a
municipal utilityWith strong
requirements for:

LEVERAGE
Because that gives the city

It Gives Us a Chance For
• Simple, on-bill financing for energy
• Intensive neighborhood efficiency retrofits
• More local clean energy production
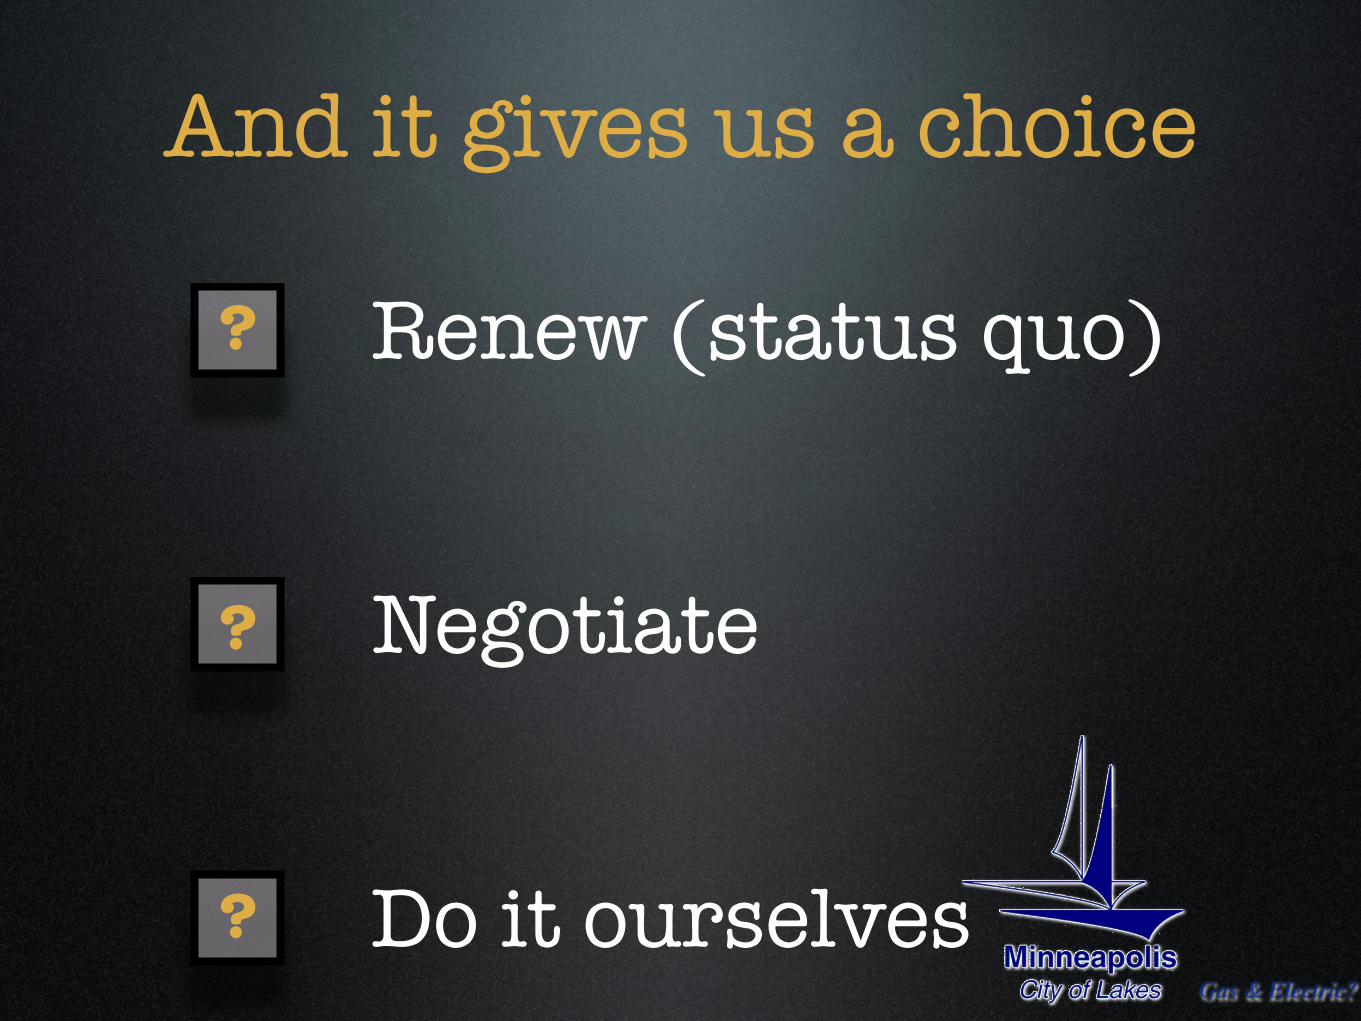
And it gives us a choice
Renew (status quo)
Negotiate
?
?
? Do it ourselvesGas & Electric?

Choose Now
Renew (status quo)
Negotiate
Municipalize
Sign up here: http://minneapolisenergyoptions.org/join-us/

MinneapolisEnergyOptions.org