Energy Can Democracy Survive ?. Temperature & CO 2 over 450,000 years.
66
Energy Can Democracy Survive ?
-
Upload
beryl-chase -
Category
Documents
-
view
223 -
download
4
Transcript of Energy Can Democracy Survive ?. Temperature & CO 2 over 450,000 years.

Energy
Can Democracy
Survive ?

Temperature & CO2 over 450,000 years

Contributions of greenhouse gases to Global Warming Worldwide.
• Carbon Dioxide CO2 66%
• Methane CH4 18%
• Chlorfluocarbons CFCs11%
• NOx & others 5%
source IPPC

Characteristics of Kyoto Greenhouse Gases (Stern Report III)
Non-CO2 Kyoto gases make up around one quarter of total emissions in terms of their long term warming potential in 2000 (Table 3.1). However, they account for around 30% of the total warming effect (the radiative forcing) of non-CO2 gases in the atmosphere today.
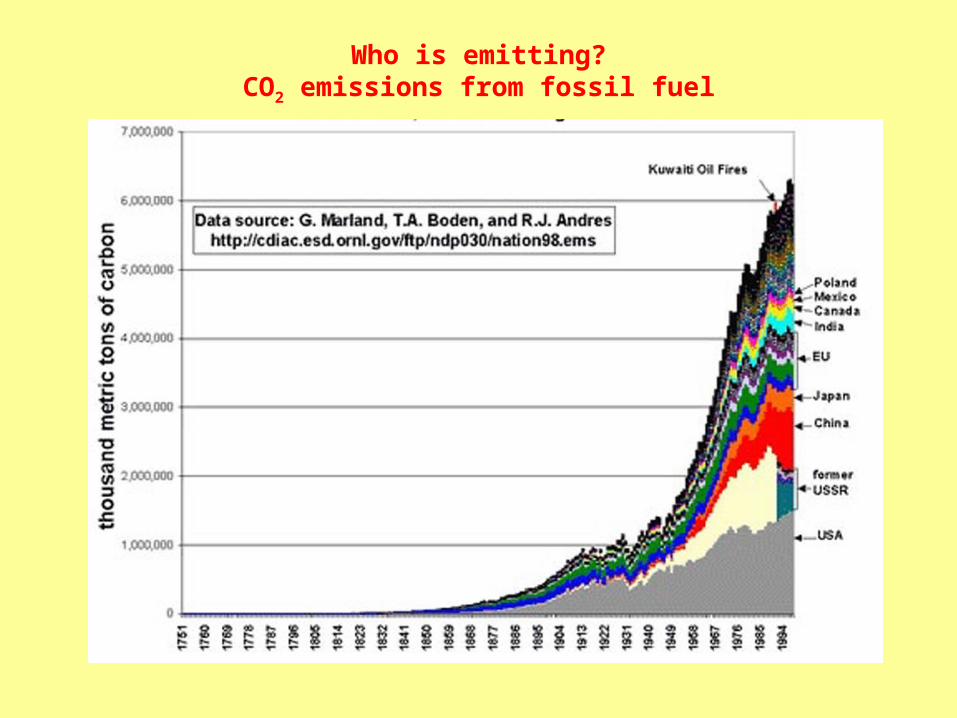
Who is emitting?CO2 emissions from fossil fuel

Growth in CO2 Emissions (Stern Report III)

CO2 Emissions Country or Region (Stern Report III)

The Challenge 60% reduction of World 1990 emissions of CO2 by 2050
"Annex I Countries" are those that have taken on emission reduction or limitation targets under the Kyoto Protocol
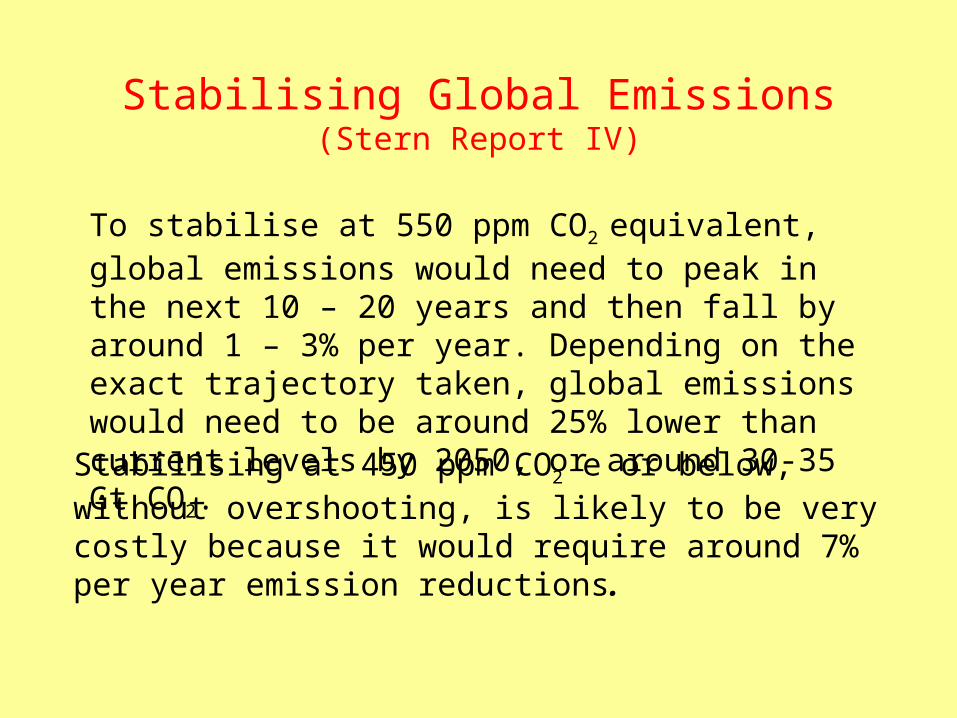
Stabilising Global Emissions (Stern Report IV)
To stabilise at 550 ppm CO2 equivalent, global emissions
would need to peak in the next 10 – 20 years and then fall by around 1 – 3% per year. Depending on the exact trajectory taken, global emissions would need to be around 25% lower than current levels by 2050, or around 30-35 Gt CO2.
Stabilising at 450 ppm CO2 e or below, without overshooting, is likely to be very costly because it would require around 7% per year emission reductions.

Oil Prices and Resources (Stern Report III)
There appears to be no good reason, then, to expect large increases in real fossil-fuel prices to be necessary to bring forth supply. Yet big increases in price would be required to hold energy demand and emissions growth in check if no other method were also available. Stern Report

Where do they come from? 65% of UK CO2 emissions are energy derived
(Stern Report part III)

UK Emissions of GHGs 1990-2005
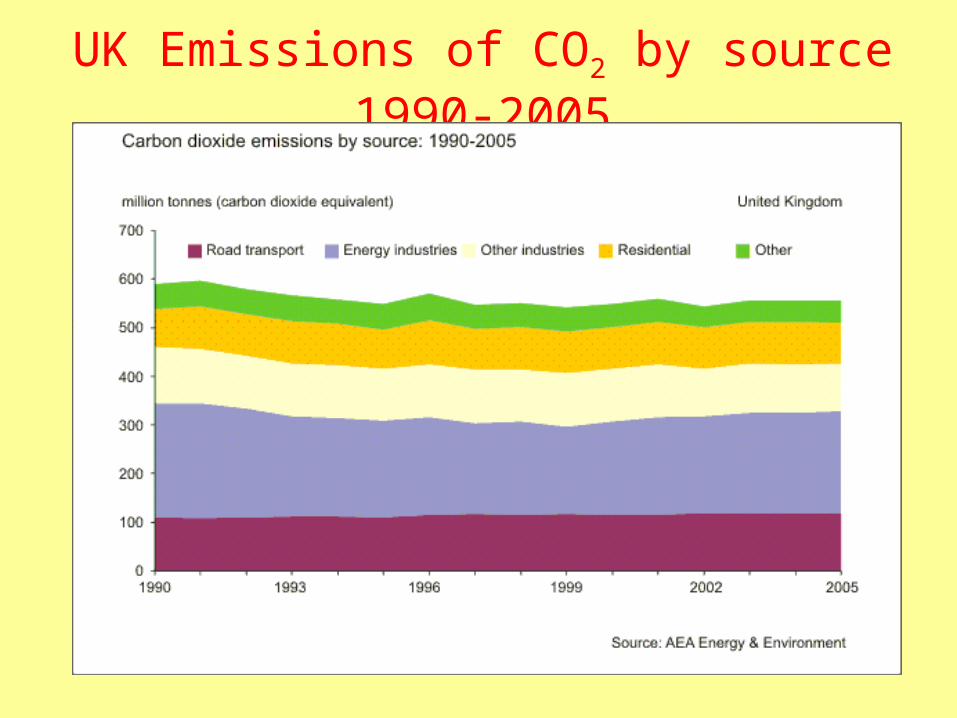
UK Emissions of CO2 by source 1990-2005
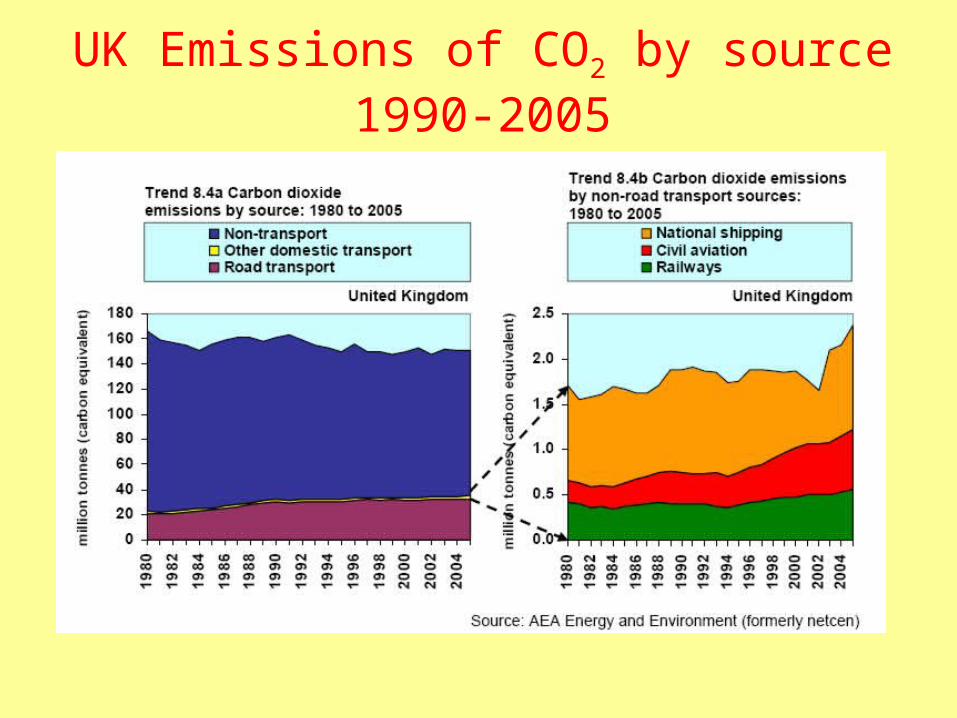
UK Emissions of CO2 by source 1990-2005

UK Emissions of CH4 by source 1990-2005
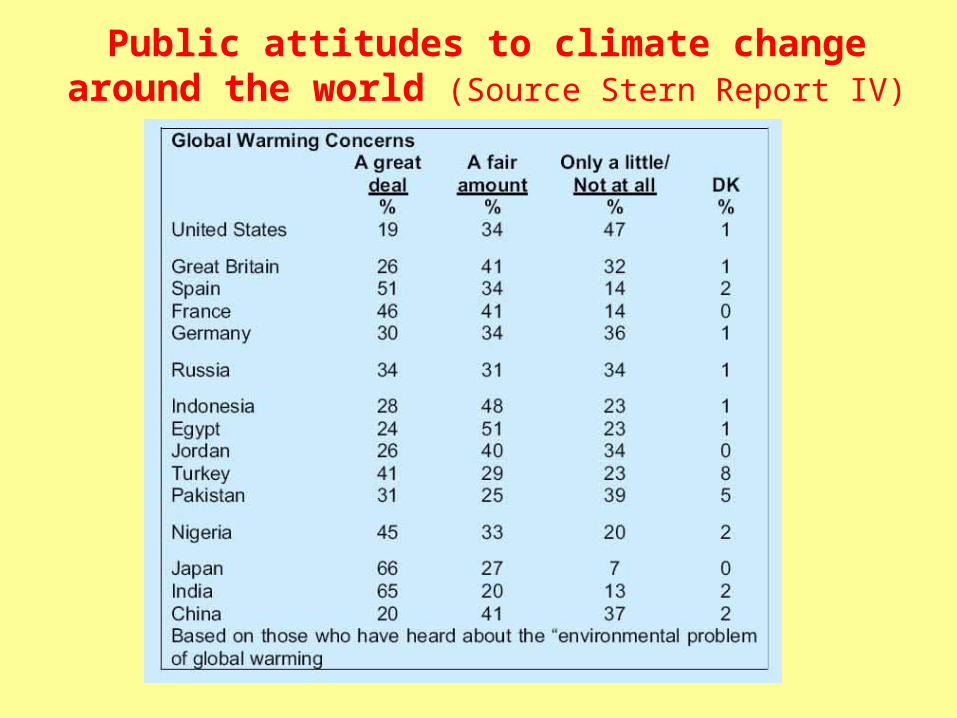
Public attitudes to climate change around the world (Source Stern Report IV)
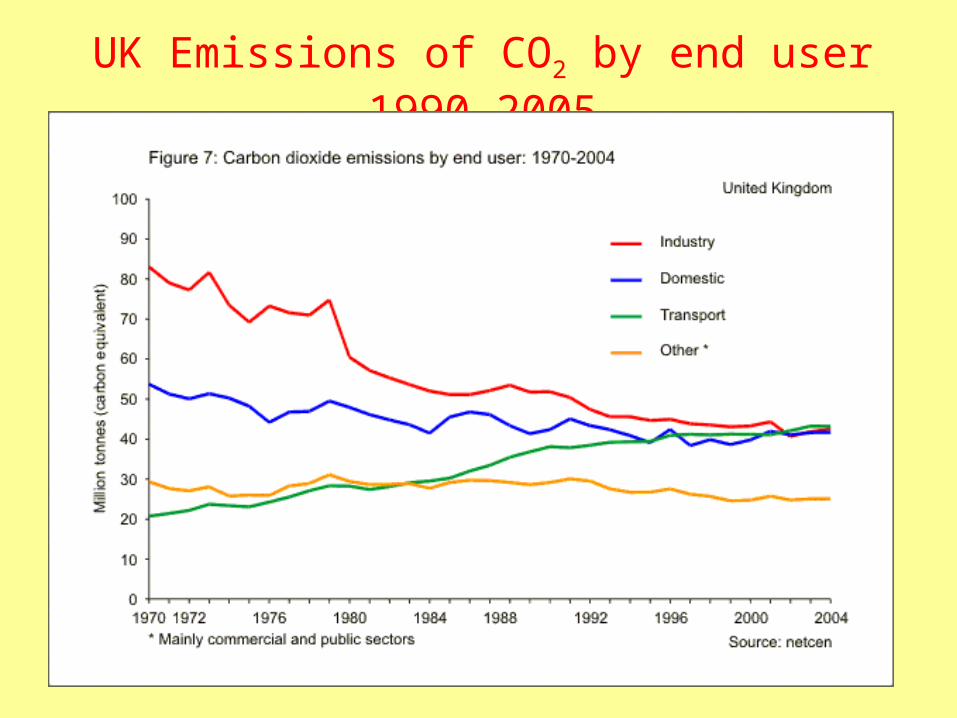
UK Emissions of CO2 by end user 1990-2005
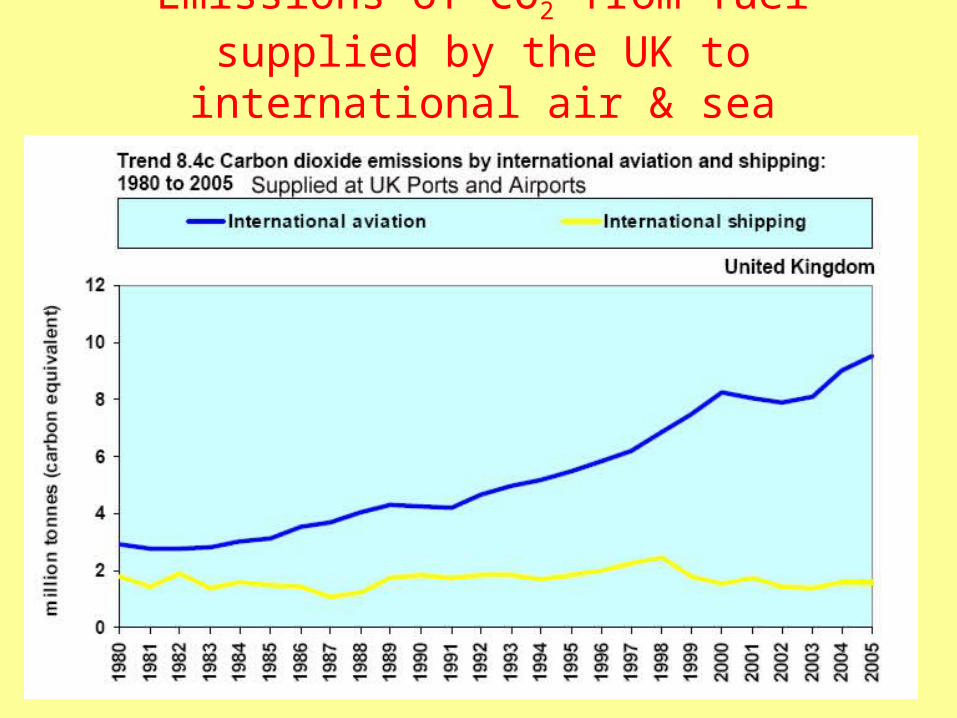
Emissions of CO2 from fuel supplied by the UK to international air & sea transport1990-2005
Reducing Emissions
What can we do ?

What are the solutions?
• Above all save energy
• Nuclear – Fission reactors are already demonstrated as viable and safe but deep concerns over the potential proliferation of nucflear arms
• Biofuels – the old solution – they will never do more than scratch the surface and plant resources will mostly be needed for food.
• Hydrogen – where does it come from. If from nuclear or fossil fuel the problem is just being displaced with alower overall efficiency.
• Geothermal – technology is here but needs rapid expansion
• Wind – technology is here is expanding but is opportunist
• Photovoltaic - technology is under rapid development and is expanding from a small base

Reducing Emissions
What can we do ?
Save Energy

How to save energy?Two examples
Housing
• Insulation and more efficient heating of property
• Turn down the thermosat A reduction of 1°C makes a 10% saving in fuel. We now heat to 20°C but 16.5% C was the design T in 1960’s.
• Replace all electrical bulbs with energy saving bulbs.
Transport
• Use public transport
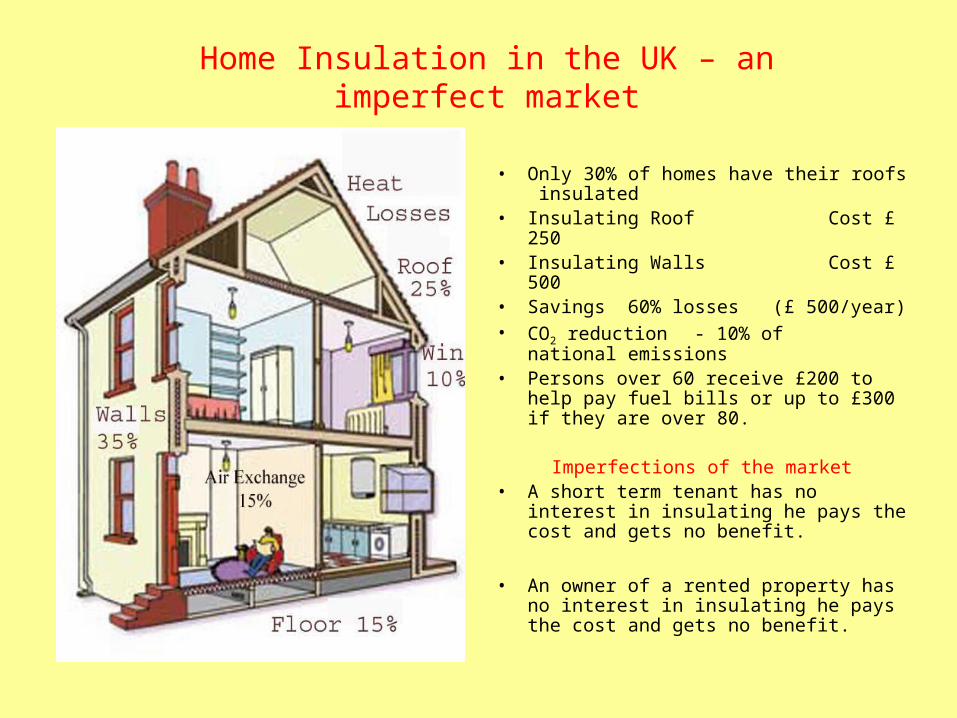
Home Insulation in the UK – an imperfect market
• Only 30% of homes have their roofs insulated
• Insulating Roof Cost £ 250• Insulating Walls Cost £ 500• Savings 60% losses (£ 500/year)• CO2 reduction - 10% of national
emissions • Persons over 60 receive £200 to help pay
fuel bills or up to £300 if they are over 80.
Imperfections of the market• A short term tenant has no interest in
insulating he pays the cost and gets no benefit.
• An owner of a rented property has no interest in insulating he pays the cost and gets no benefit.
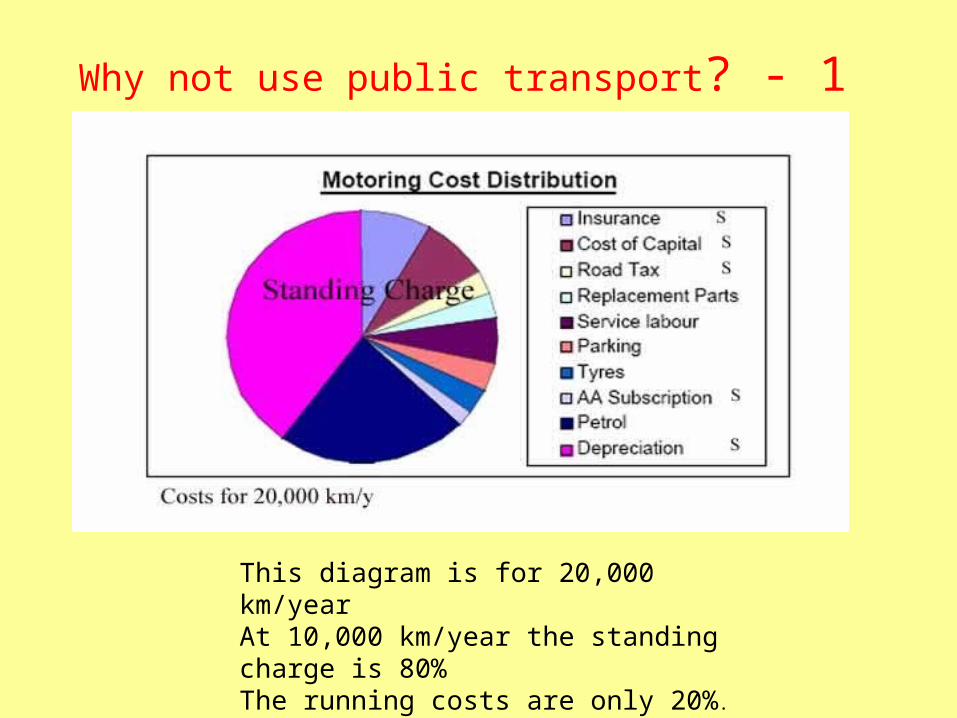
Why not use public transport? - 1
This diagram is for 20,000 km/year At 10,000 km/year the standing charge is 80%The running costs are only 20%.

Why not use public transport? – 2
The less you use your car the more it costs/kmFreedom - it is convenient and flexiblePersonal safety – protection from mugging, theft & assaultsWith larger numbers in the car the costs per person plummet
Prestige, a car is seen as a trophy of success in life

Electricity demand – The Consumer is king - 1
The highest demand ever recorded on the National Grid system was 54.430 GW in the half hour ending 17:30hrs on 10th December 2002.

Electricity demand – The Consumer is king - 2
At the half-time interval in the Englang Germany football match demand rose by 1,200 Mw in less than 5 minutes due to people making hot drinks. This would require several large power stations to go from half to full power.

Impact of the EU refrigerator energy label - sales of refrigerators in the EU by energy label class, 1992-2003 (Stern IV)
Reducing Emissions
What can we do ?
Alternative Fuels

Environmentally-compatible primary bioenergy potential in the EU (source EEA)
The agricultural potential comprises dedicated bioenergy crops plus cuttings from grassland and was calculated for EU-25 without Cyprus, Luxembourg and Malta The forestry potential consists of residues from fellings and complementary fellings.
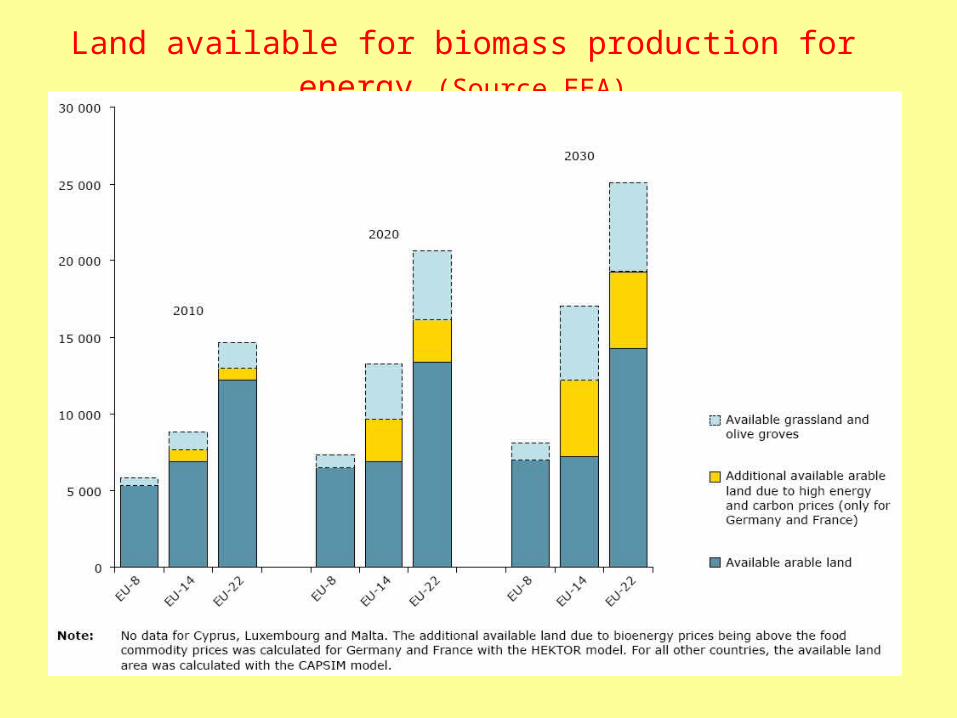
Land available for biomass production for energy (Source EEA)
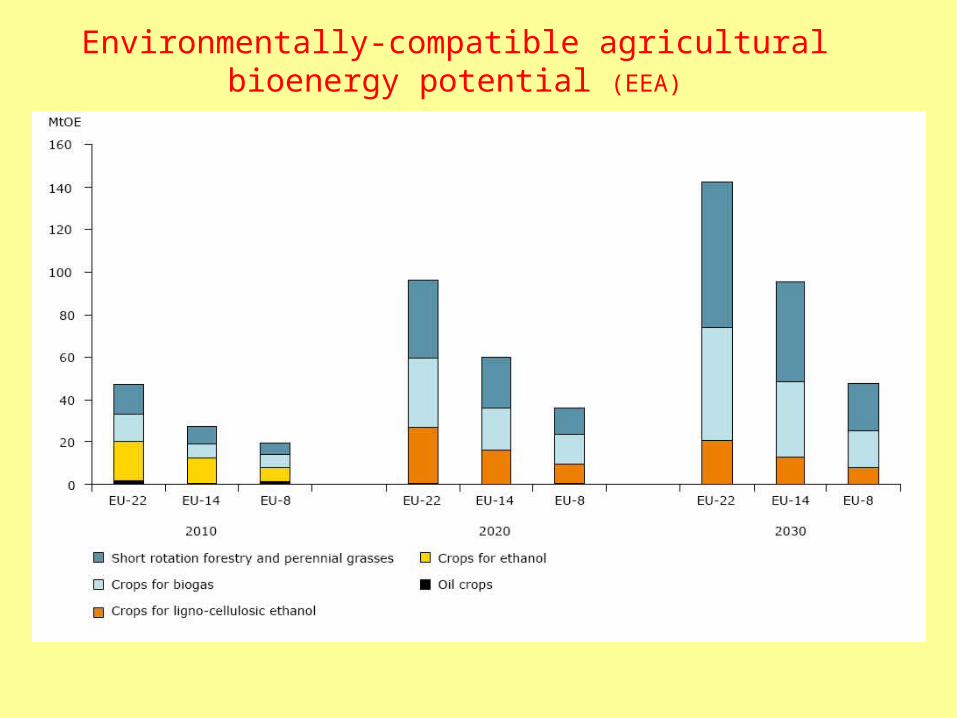
Environmentally-compatible agricultural bioenergy potential (EEA)

Biofuel from grain hikes Grain Prices Nov 07 - Feb 08

Environmentally-compatible primary bioenergy
potential in the EU (Source EEA)
• Biofuels made from sugar and vegetable oils will not substantially reduce our dependance on oil
• Production of conventional transport fuels uses only the starch or oil parts of limited number of crops and operates on reduced efficiency compared to whole-plant uses.
• The use of grain for biofuel is already increasing food prices. The extent to which a substitution of food production is desirable needs to be discussed within society.
• To meet the EU target of 5.75% of transport fuel by 2010 by biofuels from domestic production would imply the use of between 4 and 13% of Europe’s agricultural area.

Anaerobic Digesters (Source Stern Report)
• Anaerobic digesters store manure and allow it to decay in the absence of oxygen, producing biogas (a mixture of methane and CO2) which can be captured and combusted as an alternative to fossil fuels.
• In the US, the AgSTAR programme encouraged the adoption of this technology
• In the last two years, the number of digesters in the US has more than doubled, reducing emissions by 0.6 MtCO2e annually and generating 120 million kWh of energy

The Hydrogen Myth - 1Hydrogen does not exist naturally- where does it come from?
• 1 Electrolysis of water.
• Electricity has to be produced from either
• 1a Atomic energy - 30% efficiency
• 1b Photovoltaic – 8% efficiency
• 2 Decomposition of a fossil fuel - hydrogen content
Methane 25%
• Oil 12.5%
• Coal <5%
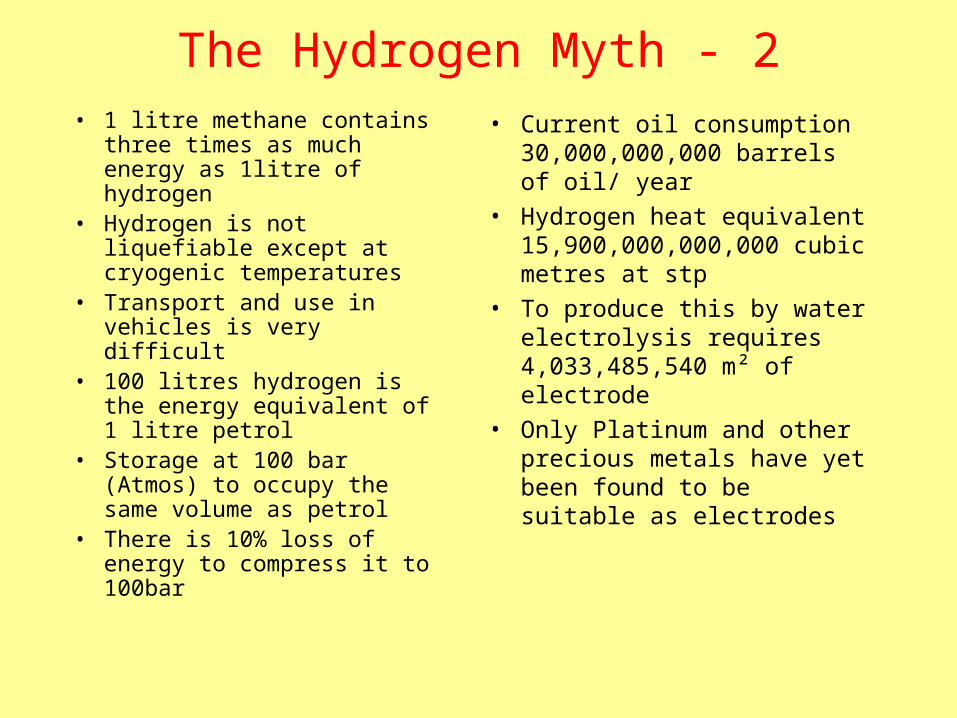
The Hydrogen Myth - 2• 1 litre methane contains three
times as much energy as 1litre of hydrogen
• Hydrogen is not liquefiable except at cryogenic temperatures
• Transport and use in vehicles is very difficult
• 100 litres hydrogen is the energy equivalent of 1 litre petrol
• Storage at 100 bar (Atmos) to occupy the same volume as petrol
• There is 10% loss of energy to compress it to 100bar
• Current oil consumption 30,000,000,000 barrels of oil/ year
• Hydrogen heat equivalent 15,900,000,000,000 cubic metres at stp
• To produce this by water electrolysis requires 4,033,485,540 m² of electrode
• Only Platinum and other precious metals have yet been found to be suitable as electrodes
Reducing Emissions
What can we do ?
Non Fuel Energy Sources
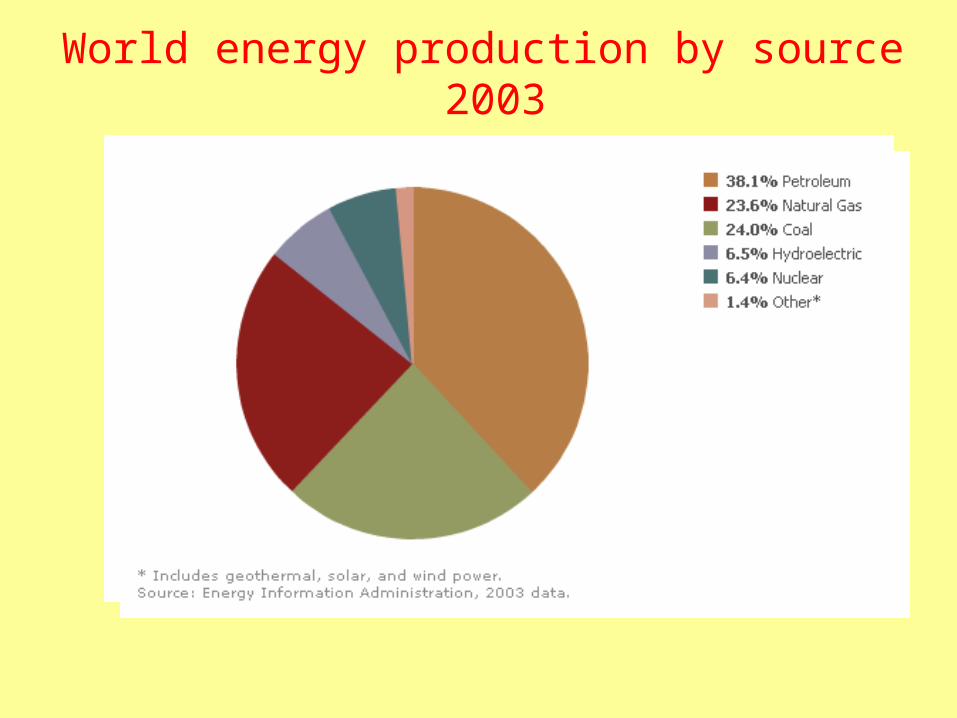
World energy production by source 2003

World electrical energy - Sources
In electricity generation, renewables are the third most important source of energy after coal and gas, providing 18% of total electricity in 2003.

Evolution of World electricity generation by fuel 1971-2001
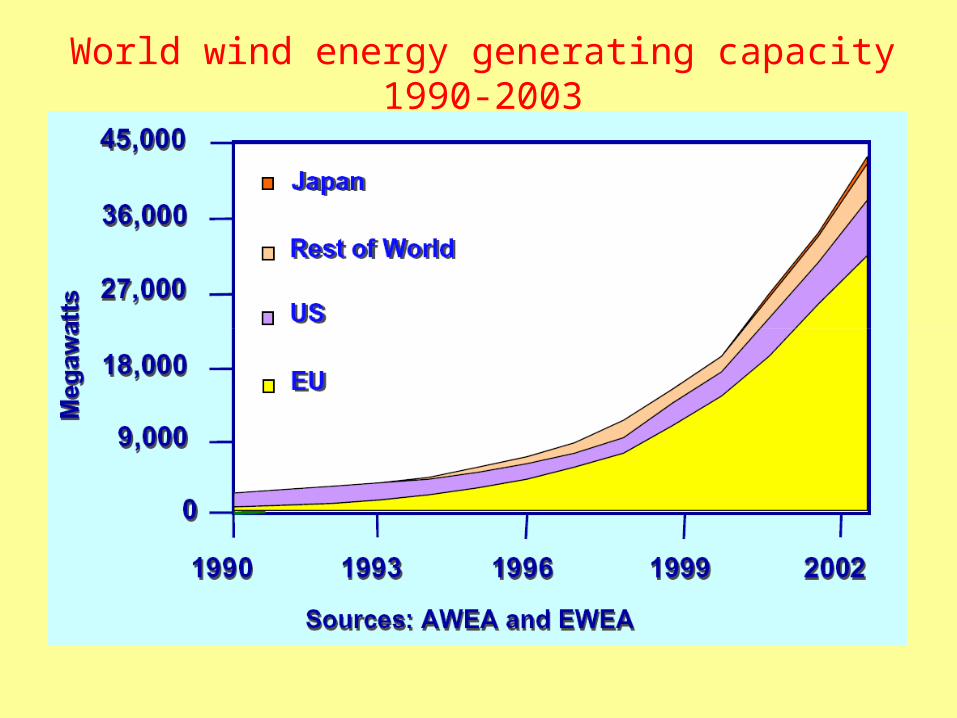
World wind energy generating capacity 1990-2003

World wind energy generating capacity 1997-2010

World photovoltaic shipments 1990-2003

World Geothermal Power 1950-1998

Reducing Emissions
What is the target?

60% reduction of World 1990 emissions of CO2 by 2050
"Annex I Countries" are those that have taken on emission reduction or limitation targets under the Kyoto Protocol
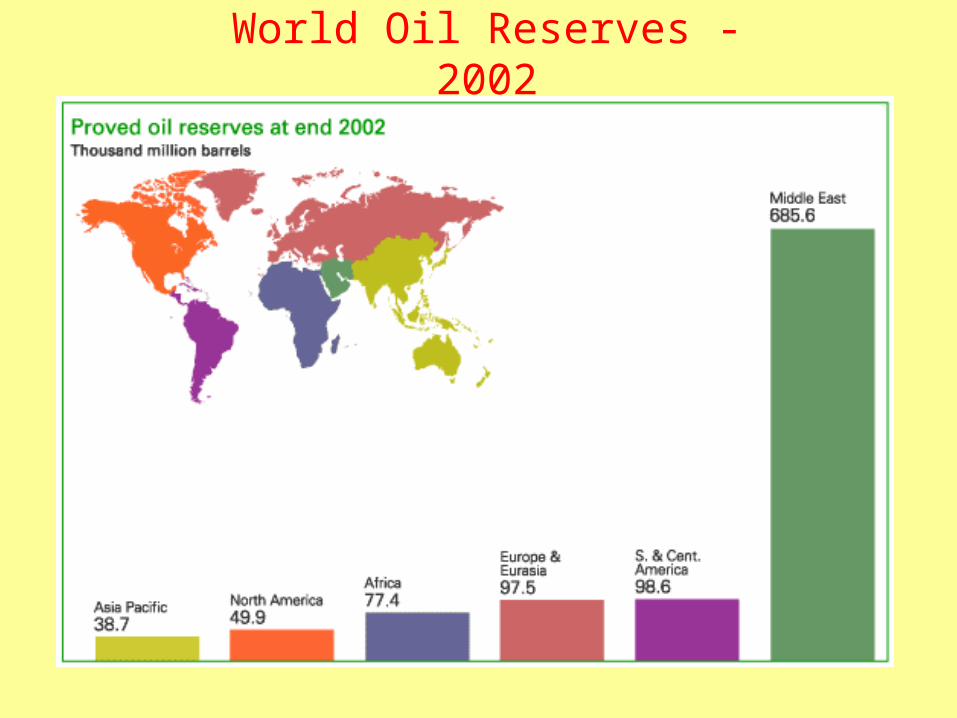
World Oil Reserves - 2002

Historical and forecast EU oil production
Source - Center for Energy and Environmental Policy
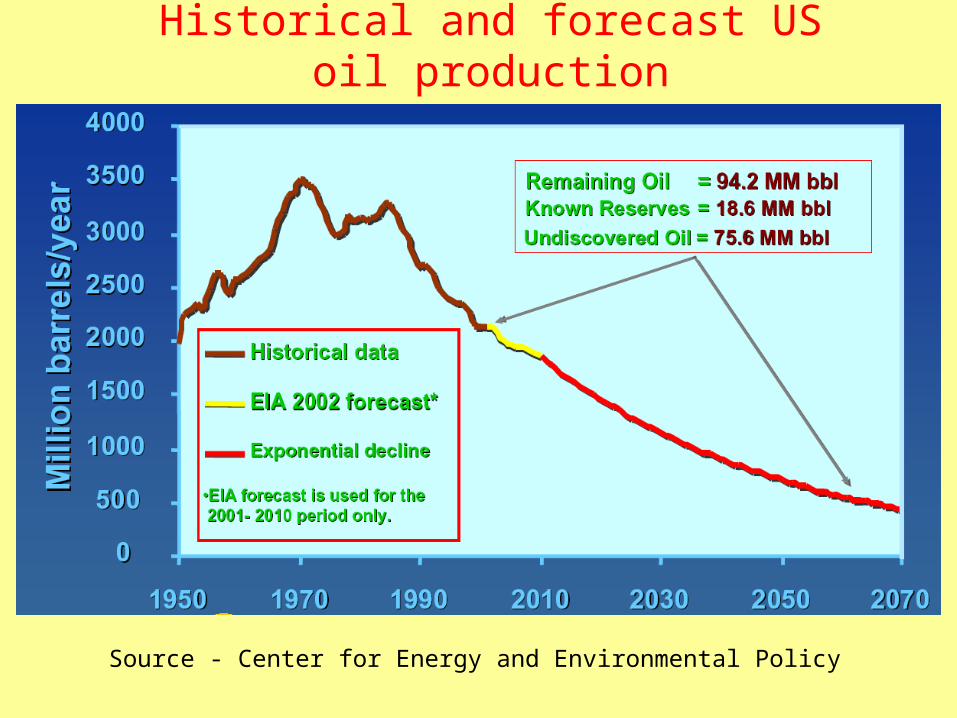
Historical and forecast US oil production
Source - Center for Energy and Environmental Policy

Reducing Emissions
Political Will
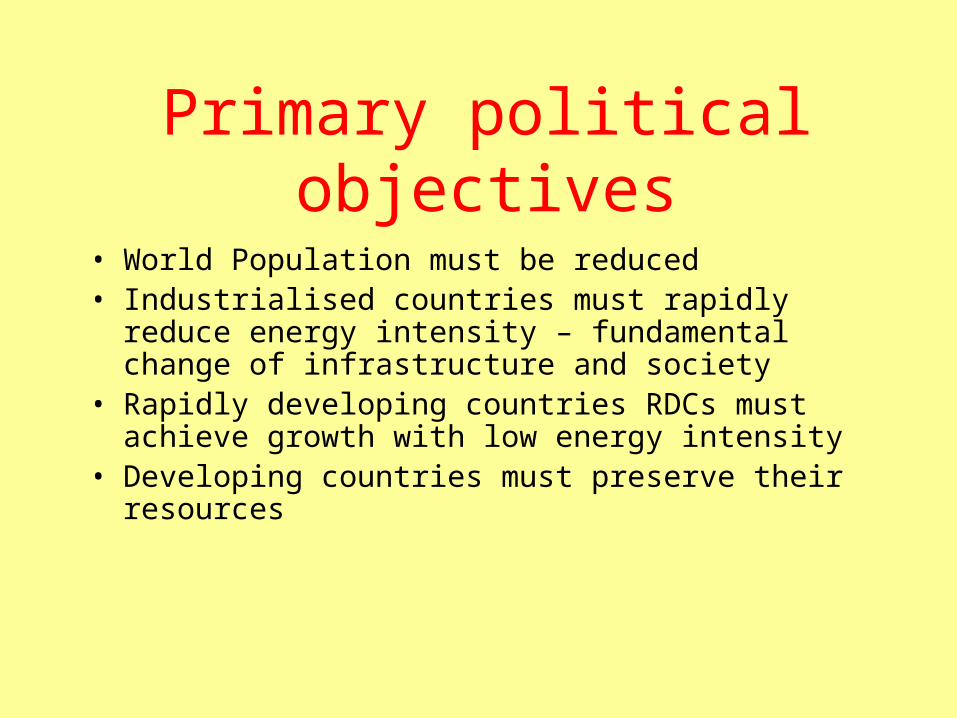
Primary political objectives
• World Population must be reduced • Industrialised countries must rapidly reduce
energy intensity – fundamental change of infrastructure and society
• Rapidly developing countries RDCs must achieve growth with low energy intensity
• Developing countries must preserve their resources

Global Energy Poverty

Public energy R&D investments as a share of GDP (Stern Report IV)

Illustrative marginal abatement option cost curve (Stern Report III)

Ways of including road transport in an emissions trading scheme (Source Stern Report IV)
• Motorists. Individual motorists would have to surrender permits whenever they purchased fuel. Quantity instruments might be better than prices at encouraging motorists to reduce their consumption of fuel. However, there would probably be high transaction costs associated with this approach
• Refineries located in the region of the scheme, would have to buy permits to cover the emissions generated when the fuel that they produce is used in vehicles.
• Vehicle manufacturers would be faced with a target for fuel efficiency of the average vehicle sold and, to the extent that they exceeded this target, they would have to buy permits to cover the excess expected lifetime carbon emissions from fuel inefficient vehicles.

Oily Politics A letter to President George W Bush before the Johannesburg Summit in 2002 from political
groups and individuals asked him not to participate. Signatories included:-
• Fred L Smith and Myron Ebell of the Competitive Enterprise Institute
• Craig Rucker from the Committee for a Constructive Tomorrow (CFACT)
• Steven Hayward from the American Enterprise Institute
• Terrence Scanlon from the Capital Research Center
• Joseph L Bast of the Heartland Institute
• Deroy Murdock of the Atlas Economic Research Foundation (AERF)
• H Stirling Burnett of the National Center for Policy Analysis
• all funding details from an official Exxon document
• funding from Exxon $280,000 in 2001
• funding from Exxon $35,000 in 2001
• funding from Exxon $25,000 in 2001
• funding from Exxon $25,000 in 2001
• funding from Exxon $90,000 in 2001
• funding from Exxon $150,000 in 2001
• funding from Exxon $20,000 in 2001
Reducing Emissions
If we do not succeed
Fuel for Thought• The total output of the Sun for one second would
provide the EU with enough energy, for the next 20,000,000 years.
• All fossil fuels: coal, oil and natural gas, were produced over 74 million years by photosynthesis from sunlight in the Carboniferous Era about 360 to 286 million years ago and are now being burnt in a few hundred years.
• The fixing of carbon in fossil fuels from Carbon Dioxide in the atmosphere produced fundamental changes in the Earth's climate and its re-introduction as Carbon Dioxide at 370,000 times the rate of its removal will cause dramatic changes in the Earth's climate.
• It would require abot 150,000 km2 of solar cells to supply the Earth’s energy
it
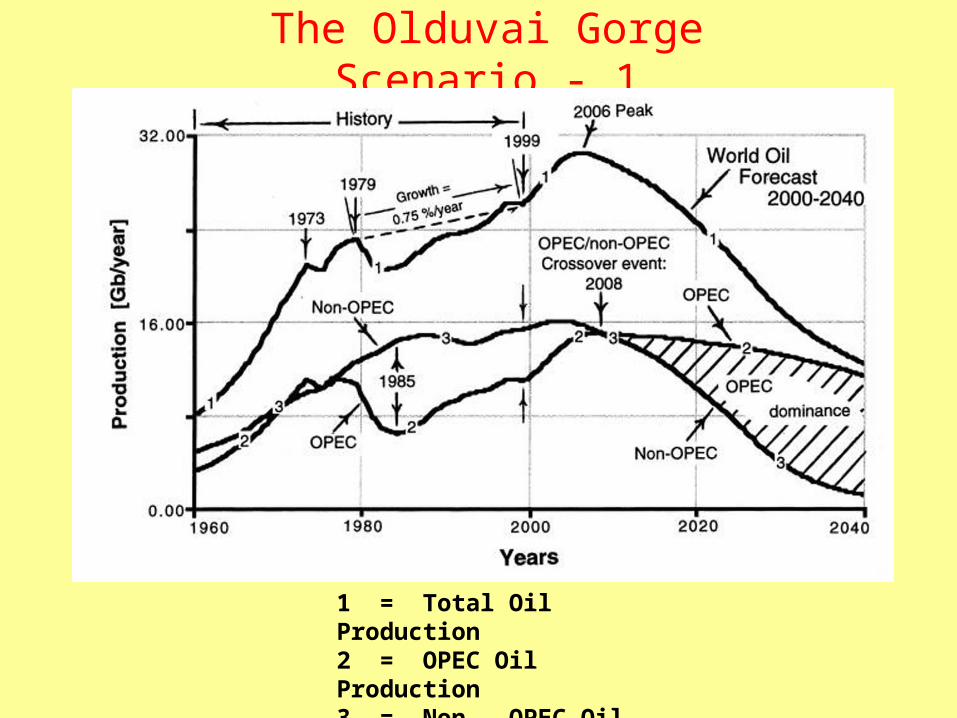
The Olduvai Gorge Scenario - 1
1 = Total Oil Production2 = OPEC Oil Production3 = Non - OPEC Oil Production

The Olduvai Gorge Scenario -2
Electricity is the essential end-use energy for Industrial Civilization Industrial Civilization ends when energy head of population falls to its 1930 value.

Five ways to save the worldHubris and delusion
• Global sunshade – either dust from the moon or glass spheroids.
• Fire hundreds of rockets loaded with tons of sulphur into the stratosphere creating a vast, but very thin sunscreen of sulphur around the earth.
• A fleet of remote-controlled yachts that will pump fine particles of sea water into the clouds, increasing the thickness of the clouds and reflecting the suns rays.
• Feed plankton with gallons of fertiliser. • Carbon dioxide adsorbing artificial trees

What an expert thinks
Source: EIA, International Energy Outlook 1997
1970 1975 1980 1985 1990 1995 2000 2005 2010 20150
2,000
4,000
6,000
8,000
10,000
12,000
14,000
16,000 High Economic Growth Case
Low Economic Growth Case

What an Expert thinksThree Key Points
• The prospect for energy demand growth is substantial and will be based on fossil fuels
• Growth will be centered in developing countries, particularly Asia, where living standards are rising
• Thanks to technological know-how, resource availability will not constrain energy supply development

Renewable Energy House

European Policy Centre WORKING PAPER No.29
5-03-2008
Gain without pain: towards
a more rational use of energy
http:/www.epc.eu