Energy and Water Savings in Multifamily Retrofits · Energy and Water Savings in Multifamily...
66
Energy and Water Savings in Multifamily Retrofits Results from the U.S. Department of Housing and Urban Development’s Green Retrofit Program and the Energy Savers Program in Illinois Prepared by: Jon Braman, Steven Kolberg, and Jeff Perlman Bright Power, Inc. Edited by: Stewards of Affordable Housing for the Future (SAHF)
Transcript of Energy and Water Savings in Multifamily Retrofits · Energy and Water Savings in Multifamily...

Energy and Water Savings in Multifamily Retrofits
Results from the U.S. Department of Housing and Urban Development’s Green Retrofit Program and the Energy Savers Program in Illinois
Prepared by:Jon Braman, Steven Kolberg, and Jeff Perlman Bright Power, Inc.
Edited by:Stewards of Affordable Housing for the Future (SAHF)

SAHF and Bright Power gratefully acknowledge the generous support of the John D. and Catherine T. MacArthur Foundation.
The following individuals provided valuable contributions:
HUD Office of Affordable Housing PreservationJerry Anderson, Mara Blitzer, Sula Miller, Trisha Miller, Amit Sarin, Ted Toon, Genevieve Tucker
Elevate Energy (formerly CNT Energy)Anne Evens, Cecilia Gamba, Jason Ransby-Sporn, Rachel Scheu
SAHFJeanne Engel, Kenley Farmer, Toby Halliday, Bill Kelly, Rick Samson, Rebecca Schaaf
Federal Practice GroupLiane Houseknecht, Robert Robinson
Bright PowerEric Ast, Hannah Chao, Sola Cho, Wesley Cronk, Josh Haggarty, Conor Laver, Megan Loeb, Caleb Smeeth
ABOUT SAHF
Stewards of Affordable Housing for the Future (SAHF) consists of eleven high capacity mission-driven nonprofit members who acquire, preserve, and are committed to long-term, sustainable ownership and continued affordability of multifamily rental properties for low-income families, seniors, and disabled individuals. Since 2003, SAHF has promoted its members’ shared notion that stable, affordable rental homes are critically important in people’s lives. Together SAHF members provide homes to more than 100,000 low-income households across the country.
ABOUT BRIGHT POWER
Bright Power is a leading energy management partner for portfolios of multifamily buildings, providing practical solutions for controlling energy costs, improving efficiency, and deploying solar energy solutions. The company’s proprietary software, EnergyScoreCards, provides meaningful measurement and analysis of energy and water usage across entire portfolios of buildings. Bright Power, founded in 2004, helps clients to improve building operations to save energy and water, reduce maintenance costs and improve occupant comfort. Bright Power is well-versed in government incentives, rebates, grants, and other financing options to make clients’ projects possible.
Acknowledgements

LIST OF FIGURES AND TABLES . . . . . . . . . . . . . . . . . . . . . . . . . . iii–iv
Executive Summary . . . . . . . . . . . . . . . . . . . . . . . . . . . . . . . . . . . . . 1
Background . . . . . . . . . . . . . . . . . . . . . . . . . . . . . . . . . . . . . . . . . . . . . . 2Approach. . . . . . . . . . . . . . . . . . . . . . . . . . . . . . . . . . . . . . . . . . . . . . . . 2
Key Terms . . . . . . . . . . . . . . . . . . . . . . . . . . . . . . . . . . . . . . . . . . . . . . 4Key Findings . . . . . . . . . . . . . . . . . . . . . . . . . . . . . . . . . . . . . . . . . . . . . . 6
HUD Green Retrofit Program (GRP) . . . . . . . . . . . . . . . . . . . . . . . . . 8Program Background. . . . . . . . . . . . . . . . . . . . . . . . . . . . . . . . . . . . . . . . . . 8
Process . . . . . . . . . . . . . . . . . . . . . . . . . . . . . . . . . . . . . . . . . . . . . . . 8
GRP Data Set . . . . . . . . . . . . . . . . . . . . . . . . . . . . . . . . . . . . . . . . . . . . . . 9GRP Key Findings . . . . . . . . . . . . . . . . . . . . . . . . . . . . . . . . . . . . . . . . . . . 9How much energy and water was saved? . . . . . . . . . . . . . . . . . . . . . . . . . . . . . . 10How did energy and water use intensity change? . . . . . . . . . . . . . . . . . . . . . . . . . . 12What types of retrofit projects saved energy?. . . . . . . . . . . . . . . . . . . . . . . . . . . . 13How did the level of savings vary between properties? . . . . . . . . . . . . . . . . . . . . . . . 14Did retrofit projects perform as expected? . . . . . . . . . . . . . . . . . . . . . . . . . . . . . 20Were the retrofits cost-effective? . . . . . . . . . . . . . . . . . . . . . . . . . . . . . . . . . . 22
Discussion of cost-effectiveness and marginal vs. total cost . . . . . . . . . . . . . . . . . . . 23
Energy Savers. . . . . . . . . . . . . . . . . . . . . . . . . . . . . . . . . . . . . . . . . 25Program Background. . . . . . . . . . . . . . . . . . . . . . . . . . . . . . . . . . . . . . . . . 25
Process . . . . . . . . . . . . . . . . . . . . . . . . . . . . . . . . . . . . . . . . . . . . . . 25
Energy Savers Data Set . . . . . . . . . . . . . . . . . . . . . . . . . . . . . . . . . . . . . . . 26Energy Savers Key Findings . . . . . . . . . . . . . . . . . . . . . . . . . . . . . . . . . . . . . 26How much gas was saved? . . . . . . . . . . . . . . . . . . . . . . . . . . . . . . . . . . . . . . 26How did gas use intensity change? . . . . . . . . . . . . . . . . . . . . . . . . . . . . . . . . . 27What types of projects saved energy? . . . . . . . . . . . . . . . . . . . . . . . . . . . . . . . . 27How did the level of savings vary between properties? . . . . . . . . . . . . . . . . . . . . . . . 28Were the retrofits cost-effective? . . . . . . . . . . . . . . . . . . . . . . . . . . . . . . . . . . 30
Conclusions . . . . . . . . . . . . . . . . . . . . . . . . . . . . . . . . . . . . . . . . . . 31Lessons for Sucessful Retrofits. . . . . . . . . . . . . . . . . . . . . . . . . . . . . . . . . . . . 31Areas for Further Research. . . . . . . . . . . . . . . . . . . . . . . . . . . . . . . . . . . . . . 34
Contents
JUNE 2014
PAGE i

Appendix A: Additional GRP Program Data . . . . . . . . . . . . . . . . . . 37
GRP Building Characteristics. . . . . . . . . . . . . . . . . . . . . . . . . . . . . . . . . . . . . 37Location . . . . . . . . . . . . . . . . . . . . . . . . . . . . . . . . . . . . . . . . . . . . . . 37Metering. . . . . . . . . . . . . . . . . . . . . . . . . . . . . . . . . . . . . . . . . . . . . . 37Property Size . . . . . . . . . . . . . . . . . . . . . . . . . . . . . . . . . . . . . . . . . . . 38Age . . . . . . . . . . . . . . . . . . . . . . . . . . . . . . . . . . . . . . . . . . . . . . . . 38Utilities Used on Site . . . . . . . . . . . . . . . . . . . . . . . . . . . . . . . . . . . . . . . 39
GRP-installed Measures . . . . . . . . . . . . . . . . . . . . . . . . . . . . . . . . . . . . . . . 39GRP Marginal Cost of Installed Measures . . . . . . . . . . . . . . . . . . . . . . . . . . . . . 42
GRP Savings Results . . . . . . . . . . . . . . . . . . . . . . . . . . . . . . . . . . . . . . . . . 43
GRP Additional Tests . . . . . . . . . . . . . . . . . . . . . . . . . . . . . . . . . . . . . . . . . 45
Appendix B: Additional Energy Savers Data . . . . . . . . . . . . . . . . . 46Age . . . . . . . . . . . . . . . . . . . . . . . . . . . . . . . . . . . . . . . . . . . . . . . . 46Initial Energy Efficiency. . . . . . . . . . . . . . . . . . . . . . . . . . . . . . . . . . . . . . 46
Energy Savers Installed Improvements . . . . . . . . . . . . . . . . . . . . . . . . . . . . . . . 47
Appendix C: Other Multifamily Energy Program Data Sets . . . . . . 48
Appendix D: Methodology Details . . . . . . . . . . . . . . . . . . . . . . . . 50
Available Data . . . . . . . . . . . . . . . . . . . . . . . . . . . . . . . . . . . . . . . . . . . . 50Data Quality. . . . . . . . . . . . . . . . . . . . . . . . . . . . . . . . . . . . . . . . . . . . 51
Quantifying Energy and Water Savings . . . . . . . . . . . . . . . . . . . . . . . . . . . . . . . 52Whole Building Utility Bill Analysis . . . . . . . . . . . . . . . . . . . . . . . . . . . . . . . . 52Normalization . . . . . . . . . . . . . . . . . . . . . . . . . . . . . . . . . . . . . . . . . . . 52
Cost-effectiveness Approach . . . . . . . . . . . . . . . . . . . . . . . . . . . . . . . . . . . . 54
Statistical Tests. . . . . . . . . . . . . . . . . . . . . . . . . . . . . . . . . . . . . . . . . . . . 56
EnergyScoreCards Samples . . . . . . . . . . . . . . . . . . . . . . . . . . . . . . . . . . . . . 56Energy Events . . . . . . . . . . . . . . . . . . . . . . . . . . . . . . . . . . . . . . . . . . . 56The EnergyScoreCards Database . . . . . . . . . . . . . . . . . . . . . . . . . . . . . . . . . 57Weather-normalization in EnergyScoreCards . . . . . . . . . . . . . . . . . . . . . . . . . . 58
Energy and Water Savings in Multifamily Retrofits
PAGE ii CONTENTS

LIST OF FIGURES AND TABLES
Figure 1: Retrofit Project Life-Cycle . . . . . . . . . . . . . . . . . . . . . . . . . . . . . . . . . . 3Figure 2: GRP Pre- vs. Post-Retrofit EnergyScoreCards Grade Shift (n=179) . . . . . . . . . . . 12Figure 3: Water Efficiency Grade Shift (GRP) . . . . . . . . . . . . . . . . . . . . . . . . . . . 13Figure 4: GRP Whole Building Site Energy Savings Distribution (n=179) . . . . . . . . . . . . 15Figure 5: GRP Whole Building Water Savings Distribution (n=162) . . . . . . . . . . . . . . . . 17Figure 6: Pre-Retrofit Energy Use Intensity and Change in Energy Usage (GRP) . . . . . . . . . 17Figure 7: Pre-Retrofit Water Use Intensity and Change in Water Usage (GRP) . . . . . . . . . . 18Figure 8: Investment in Energy Measures vs. Energy Cost Savings (GRP) . . . . . . . . . . . . . 19Figure 9: Investment in Water Measures vs. Change in Water Cost Savings (GRP) . . . . . . . . 19Figure 10: Projected Savings and Achieved Savings (GRP) . . . . . . . . . . . . . . . . . . . . . 21Figure 11: Gas Usage Intensity (GUI) Shift Pre- vs. Post-Retrofit (Energy Savers) . . . . . . . . . 27Figure 12: Energy Savers Gas Savings (%) Distribution . . . . . . . . . . . . . . . . . . . . . . . 29Figure 13: Pre-Retrofit Gas Use Intensity and Gas Savings (Energy Savers) . . . . . . . . . . . . 29Figure 14: Gas Efficiency Investment and Achieved Gas Savings (Energy Savers) . . . . . . . . . 30 Figure 15: Property Size Distribution (GRP) . . . . . . . . . . . . . . . . . . . . . . . . . . . . 38Figure 16: GRP Year Built Distribution (n=160). . . . . . . . . . . . . . . . . . . . . . . . . . . 38Figure 17: Fuel Type Distribution (GRP) . . . . . . . . . . . . . . . . . . . . . . . . . . . . . . 39Figure 18: Energy and Water Upgrade Spending Distribution–Marginal Cost (GRP) . . . . . . . 42Figure 19: Full Cost Compared to Marginal Cost by Improvement Type . . . . . . . . . . . . . . 43Figure 20: Energy Use Intensity Shift (GRP) . . . . . . . . . . . . . . . . . . . . . . . . . . . . 43Figure 21: GRP Water Use Intensity Shift Pre vs. Post Retrofit (n=162) . . . . . . . . . . . . . . 44Figure 22: Total Energy Simple Payback Period (years) (n=172) . . . . . . . . . . . . . . . . . . 44Figure 23: Total Water Simple Payback Period (years) (n=121) . . . . . . . . . . . . . . . . . . . 45Figure 24: Energy Savers Year Built Distribution (n=53) . . . . . . . . . . . . . . . . . . . . . . 46Figure 25: Pre-Rehab Site Gas Use Intensity Distribution (Energy Savers) . . . . . . . . . . . . . 46Figure 26: Data Availability and Gaps . . . . . . . . . . . . . . . . . . . . . . . . . . . . . . . . 50Figure 27: Sample “Energy Event” Package for a GRP Property . . . . . . . . . . . . . . . . . . 57Figure 28: Weather-based Regression and Energy End Use Separation (EnergyScoreCards, sample electric account) . . . . . . . . . . . . . . . . . . . . . . . . . . . 59
JUNE 2014
PAGE iii

Table 1: Whole Building Site Energy Savings and Cost savings by Fuel (GRP) . . . . . . . . . . . 11Table 2: Electricity Savings Breakdown, Owner and Tenant (GRP) . . . . . . . . . . . . . . . . . 11Table 3: Natural Gas Savings Breakdown, Owner and Tenant (GRP) . . . . . . . . . . . . . . . 11Table 4: Implemented Improvement Category (GRP). . . . . . . . . . . . . . . . . . . . . . . . 13Table 5: Energy Savings by Metering Type (GRP) . . . . . . . . . . . . . . . . . . . . . . . . . 16Table 6: Realization Rates for Owner-paid and Tenant-paid Energy Accounts (GRP) . . . . . . . 20Table 7: Realization Rates by Metering Configuration (GRP). . . . . . . . . . . . . . . . . . . . 21Table 8: Cost-effectiveness Metrics (GRP) . . . . . . . . . . . . . . . . . . . . . . . . . . . . . 23Table 9: Cost of Saved Energy and Water vs. Energy and Water Prices (GRP) . . . . . . . . . . . 23Table 10: Full Cost vs. Marginal Cost Simple Payback Period: Energy and Water Measures Combined . . . . . . . . . . . . . . . . . . . . . . . . . . . . . . . . . . . 24Table 11: Implementation of Heating Measures (Energy Savers). . . . . . . . . . . . . . . . . . . 28Table 12: Energy Savers Cost-effectiveness Metrics . . . . . . . . . . . . . . . . . . . . . . . . . 30Table 13: Cost of Saved Gas vs. Gas Prices (Energy Savers) . . . . . . . . . . . . . . . . . . . . . 30Table 14: Regional Distribution of GRP Properties . . . . . . . . . . . . . . . . . . . . . . . . . 37Table 15: GRP Properties by Metering Configuration . . . . . . . . . . . . . . . . . . . . . . . . 37Table 16: Improvement Types (GRP) . . . . . . . . . . . . . . . . . . . . . . . . . . . . . . 40–41Table 17: Improvements Types (Energy Savers) . . . . . . . . . . . . . . . . . . . . . . . . . . . 47Table 18: Comparison to Other Multifamily Retrofit Data Sets . . . . . . . . . . . . . . . . . . . 49
Energy and Water Savings in Multifamily Retrofits
PAGE iv CONTENTS
Executive Summary
JUNE 2014
PAGE 1
Energy and water consumption represent some of the largest operating costs in multifamily properties, estimated at $22 billion per year in the U.S.1 The total expenditures for both energy and water utilities for public and assisted housing in 2011 were estimated to be $7.1 billion, with the U.S. Department of Housing and Urban Development’s (HUD) share estimated to be $6.4 billion or nearly 13% of HUD’s total budget.2 A growing body of research shows that 25% or more of this energy and water is wasted through inefficiencies that could be corrected by the expansion of efficiency upgrade programs for multifamily housing.3 In studies that compare the cost of strategies to reduce greenhouse gas emissions, efficiency gains in buildings are considered to have a negative cost, because energy and water savings alone tend to more than offset the cost of upgrades.4 By improving energy and water efficiency, multifamily homes would not only use fewer resources, but would cost less to operate, improving affordability for residents and reducing operating costs for HUD and for private owners.
Despite this potential for savings, efficiency retrofits are less common in multifamily housing than in single-family housing.5 One barrier to increased activity in this sector is the limited quantity and reliability of data relating to multifamily retrofits and their potential impact on energy consumption and utility costs.6 This report will add to the available knowledge base by providing a detailed analysis of 236 multifamily properties that underwent energy and water retrofit projects from 2009 to 2012. This is the first study to examine a large and diverse national data set containing pre- and post-retrofit utility data for both owner- and tenant-paid energy and water accounts.7 In addition to the findings themselves, the challenges faced in performing this research provide useful insights for others seeking to understand and execute energy and water retro-fits in multifamily properties.
1 “IntroducingUtilitiestotheNeedsofMultifamilyBuildingsandTheirOwners,”AmericanCouncilforanEnergyEfficientEconomy,http://aceee.org/files/pdf/fact-sheet/partners-utilities-fs.pdf
2 U.S.DepartmentofHousingandUrbanDevelopment,ProgressReportandEnergyActionPlan,ReporttoCongress,Section154EnergyPolicyActof2005,December2012,pp.iand2.
3 SeeAnneMcKibbin,etal.,“EngagingasPartnersinEnergyEfficiency:MultifamilyHousingandUtilities,”ElevateEnergyandtheAmericanCouncilforanEnergyEfficientEconomy,January2012,http://www.elevateenergy.org/wp-content/uploads/2014/01/Engaging_as_Partners_in_Energy_Efficiency_Multifamily_Housing_and_Utilities.pdfwhichconcludedthattheexpansionofefficiencyupgradeprogramscouldtranslateintoannualutilitybillsavingsofalmost$3.4billion(in2010energyprices)forthemultifamilysector;BenningfieldGroup,Inc.,“U.S.MultifamilyEnergyEfficiencyPotentialby2020,”preparedfortheEnergyFoundation,October29,2009,whichfoundthatthemultifamilyhousingstockcouldbecome28.6%moreenergyefficientby2020;EnergyProgramsConsortiumMatthewBrownandMarkWolfe,2007;“EnergyEfficiencyinMultifamilyHousing:AProfileandAnalysis,”3,iv.,whichfoundthat85percentofmultifamilyunitswerebuiltbefore1990,leavingroomforsubstantialsavings(from30to75%)fromenergyefficiencyimprovements.
4 McKinseyandCompany,“ImpactoftheFinancialCrisisonCarbonEconomics:Version2.1oftheGlobalGreenhouseGasAbatementCostCurve”(2010),http://www.mckinsey.com/client_service/sustainability/latest_thinking/greenhouse_gas_abatement_cost_curves
5 U.S.DepartmentofHousingandUrbanDevelopmentOfficeofPolicyDevelopmentandResearch,“QuantifyingEnergyEfficiencyinMultifamilyRentalHousing”Evidence Matters(Summer2011).
6 Ibid.
7 Othersimilarstudiesofpre-andpost-retrofitutilityconsumptioninmultifamilyretrofitsinclude: •DeutscheBankandLivingCities,“RecognizingtheBenefitsofEnergyEfficiencyinMultifamilyUnderwriting”(2011),https://www.db.com/usa/img/DBLC_
Recognizing_the_Benefits_of_Energy_Efficiency_01_12.pdf.TheDeutscheBank/LivingCitiesstudyanalyzedpre-andpost-retrofitconsumptiondataat104properties,allinNewYorkCity.
•LindsayRobbinsandBetsyParrington,“RealizingMeasurableSavingsinMultifamilyBuildings:ResultsfromNYSERDA’sMultifamilyPerformanceProgram”(Forthcoming2014).ThisNYSERRDAstudywillincludeanalysisof219properties,allinNewYorkState.
•LocalInitiativesSupportCorporation,“GreenRetrofitInitiativeSummaryEvaluationReport”(August2013).TheGreenRetrofitInitiativeevaluationincludedanalysisof148buildings,allinMassachusetts.Thenumberofpropertieswasnotreported.

Energy and Water Savings in Multifamily Retrofits
PAGE 2 EXECUTIVE SUMMARY
BACKGROUNDHistorically, multifamily efficiency programs have not required tracking of energy and water utility data to measure achieved savings. To the extent that these programs had explicit energy or water saving goals, they were often satisfied on the basis of models or projections. One of the reasons for this lack of data is that collecting and analyzing energy and water utility bills for multifamily buildings can be quite cumbersome. Utility provid-ers have differing and often extensive requirements for allowing access to utility bills, which are the best source of consumption information. As a result, while thousands of multifamily prop-erties have undergone energy and water retrofits, actual data on pre- and post-retrofit energy and water consumption are not widely available, especially on a national scale and including unit-level consumption.
There is growing recognition that measuring achieved energy and water retrofit savings is critical to improving and expand-ing energy and water saving efforts. Better data can provide investors and owners with the confidence to make large-scale investments, assure program managers that programs are working as intended, and allow engineers, consultants, archi-tects, and equipment manufacturers to evaluate real-world feedback on the results of their efforts. Several current trends may make this type of information more widely available in the future, including new municipal energy disclosure require-ments in several U.S. cities, the growing adoption of smart meters by utilities, an interest in mining “big-data” sources, and new programs, similar to those in this report, that require energy data reporting as a condition of participation.8
In this context, the John D. and Catherine T MacArthur Foundation provided a grant to Stewards of Affordable Housing for the Future (SAHF) to work with Bright Power to analyze data from multifamily retrofits performed under
two programs: HUD’s Green Retrofit Program (GRP) and the Energy Savers program offered by Elevate Energy and the Community Investment Corporation (CIC) in Illinois. 9 Participation in the GRP and in the Energy Savers program required the submission of utility data for the twelve-month pre-retrofit period as well as the twelve-month post-retrofit period. Program staff provided anonymized property characteristics, utility-consumption data, and details on the scopes of work implemented at each property to Bright Power for analysis in this report. This compilation of data presents a rare opportunity to provide the industry with an analysis and comparison of actual pre- and post-retrofit energy and water consumption data on a national scale.10
Although the two data sets became available at roughly the same point in time and each provides pre- and post-retrofit data, the differences in participating properties and program design (which determined the energy conservation measures to be undertaken in each program) are significant. The 227 GRP projects were diverse in terms of location, building type, and the range of upgrades pursued, and included energy and water improvements related to both tenant- and owner-paid utilities. The 57 Energy Savers projects were more homogeneous as all were located in the Chicago area and focused primarily on reducing gas use in central heat and domestic hot-water systems.11 The two data sets were analyzed separately. Overarching key findings are drawn from both programs where appropriate.
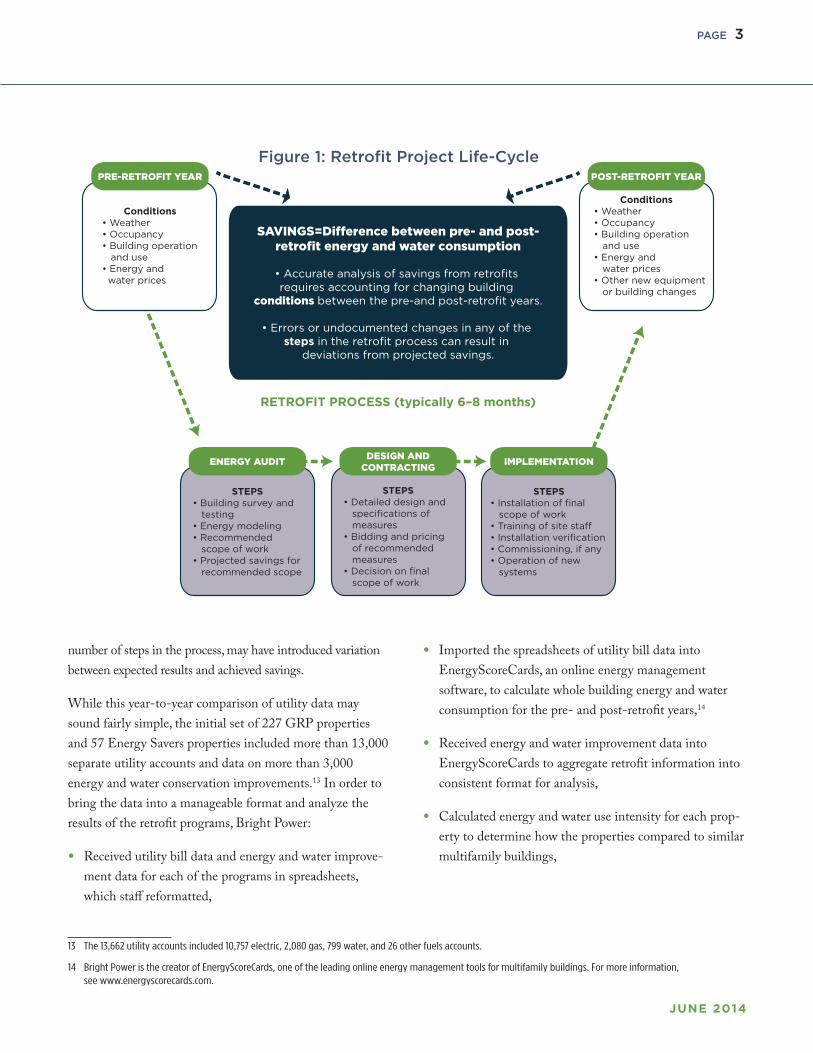
APPROACHThis report used pre- and post-retrofit utility bill data to calcu-late the savings generated by a retrofit.12 As shown in Figure 1, the process of implementing a retrofit has many stages. Changes in pre- and post-retrofit conditions, or changes in any
8 Seehttp://www.buildingrating.org/content/us-policy-briefsforasummaryofbenchmarkingpoliciesinU.S.cities.
9 ElevateEnergyisanaffiliateoftheCenterforNeighborhoodTechnologyandwasformerlyknownasCNTEnergy.
10 Pre-andpost-retrofitdatawasnormalizedforweatherandcontrolledforutilitypricechanges.Formoreonthesemethods,seeAppendixD:MethodologyDetails.
11 Theinitialdatasetincluded227GRPpropertiesand57ElevateEnergyproperties.SomepropertieswereremovedduetoinsufficientormismatcheddatathatbroughtthefinalsetofGRPpropertiesdownto179properties.
12 SeeAppendixD:MethodologyDetailsforamoredetaileddescriptionofthisprocess.
JUNE 2014
PAGE 3
number of steps in the process, may have introduced variation between expected results and achieved savings.
While this year-to-year comparison of utility data may sound fairly simple, the initial set of 227 GRP properties and 57 Energy Savers properties included more than 13,000 separate utility accounts and data on more than 3,000 energy and water conservation improvements.13 In order to bring the data into a manageable format and analyze the results of the retrofit programs, Bright Power:
• Received utility bill data and energy and water improve-ment data for each of the programs in spreadsheets, which staff reformatted,
• Imported the spreadsheets of utility bill data into EnergyScoreCards, an online energy management software, to calculate whole building energy and water consumption for the pre- and post-retrofit years,14
• Received energy and water improvement data into EnergyScoreCards to aggregate retrofit information into consistent format for analysis,
• Calculated energy and water use intensity for each prop-erty to determine how the properties compared to similar multifamily buildings,
Figure 1: Retrofit Project Life-Cycle
13 The13,662utilityaccountsincluded10,757electric,2,080gas,799water,and26otherfuelsaccounts.
14 BrightPoweristhecreatorofEnergyScoreCards,oneoftheleadingonlineenergymanagementtoolsformultifamilybuildings.Formoreinformation,seewww.energyscorecards.com.
PRE-RETROFIT YEAR
Conditions• Weather• Occupancy• Building operation and use• Energy and water prices
ENERGY AUDIT
STEPS• Building survey and testing• Energy modeling• Recommended scope of work• Projected savings for recommended scope
IMPLEMENTATION
STEPS• Installation of final scope of work• Training of site staff• Installation verification• Commissioning, if any• Operation of new systems
DESIGN AND CONTRACTING
STEPS• Detailed design and specifications of measures• Bidding and pricing of recommended measures• Decision on final scope of work
POST-RETROFIT YEAR
Conditions• Weather• Occupancy• Building operation and use• Energy and water prices• Other new equipment or building changes
SAVINGS=Difference between pre- and post-retrofit energy and water consumption
• Accurate analysis of savings from retrofits requires accounting for changing building
conditions between the pre-and post-retrofit years.
• Errors or undocumented changes in any of the steps in the retrofit process can result in
deviations from projected savings.
RETROFIT PROCESS (typically 6–8 months)

Energy and Water Savings in Multifamily Retrofits
PAGE 4 EXECUTIVE SUMMARY
• Compared pre- and post-retrofit energy and water con-sumption and spending for each property and across the portfolio to calculate energy and water savings, normaliz-ing for weather and energy and water prices,
• Compared actual savings to saving projections where possible, and
• Analyzed the cost-effectiveness of retrofits based on three metrics: simple payback period, savings-to-investment ratio, and cost of saved energy and water.15
The initial GRP data set provided by HUD included 227 properties. Forty-eight GRP properties were excluded from the final data set due to insufficient data, a mismatch in the number of utility accounts between pre- and post-retrofit years, or unre-alistically high or low energy or water consumption before or after the retrofits, bringing the final number of GRP properties included in the analysis down to 179. 16 Data were provided on 57 Energy Savers properties and all are included in the analysis. See Appendix D: Methodology Details for additional discus-sion of data quality checks.
Information was made anonymous before it was provided by HUD and Elevate Energy for this analysis because owners and residents had only authorized the programs, not Bright Power, to view their utility data. The use of anonymous data, however, created significant limitations on the analysis. Bright Power didn’t have access to complete and detailed information on building locations, configurations, or pre- existing conditions, and could not contact properties, utilities, consultants, or contractors involved in the projects to verify any of the data received.
Key TermsThis section describes the types of analyses performed in the body of the report and introduces terms used in the “Key Findings” section below.
Energy and Water Use Intensity
Energy use intensity (often referred to as EUI) is calculated by dividing the annual energy use at a property by the total square footage of the property. This calculation provides an easy way to compare the energy use at similar types of buildings. In general, a low EUI signifies a more efficient building. All energy savings and EUI figures in this report represent site energy rather than source energy (i.e., the energy consumed at the property without accounting for losses in power generation or transmission). The energy and water use intensity figures used in this report include:
• Site Energy Use Intensity (EUI) is used to mea-sure energy efficiency in the GRP portfolio. EUI reflects the building’s square footage divided by the annual elec-tricity, gas, oil, or propane used at the site, including both owner and tenant utility bills (converted to thousand British Thermal Units, or kBTUs).17
• Gas Use Intensity (GUI) is used to measure energy efficiency in the Energy Savers portfolio because only owner-paid gas consumption data were provided. GUI is calculated according to the same methodology as EUI, except only owner-paid natural gas energy bills are used. All buildings in the Energy Savers data set have central, gas fired heating and domestic hot-water systems.18
15 Seedefinitionsofcost-effectivenessmetricsonthefollowingpage.
16 EnergyandwaterconsumptionwasjudgedasunrealisticbasedonacomparisontobenchmarksfromtheEnergyScoreCardsdatabaseofmorethan5,000multifamilyproperties.SeeAppendixD:MethodologyDetailsforadditionaldiscussionondataqualityconsiderations.
17 UnitsarekBTU/sqft/year.
18 UnitsarekBTU/sqft/year.

JUNE 2014
PAGE 5
• Water Use Intensity (WUI) is used to measure water efficiency in the GRP portfolio. WUI reflects the daily water use at each property divided by the number of bedrooms at the property. Water use is closely related to the number of residents, and because occupancy data was not provided (and is often hard to accurately collect), the number of bedrooms serves as a proxy for the number of people occupying the building.19
Cost-effectiveness
Three cost-effectiveness metrics were considered to understand the retrofits from a financial perspective. It is important to keep in mind that the retrofit decisions under these two programs were not made solely on the basis of cost savings. For example, in many cases the GRP required that high-efficiency options be recommended regardless of cost-effectiveness. The GRP and Energy Savers programs pursued a broad range of goals including the preservation of affordable housing, improving housing quality and resident health, economic stimulus, and environmental conservation goals. While methods exist for quantifying the monetary value of non-utility-based benefits to assess overall social impact, such analyses were beyond the scope of this report.
The three cost-effectiveness metrics used in this report are:
• Simple Payback Period (SPP) is calculated by dividing the cost of the improvements by the annual energy savings. This calculation is often used to make quick decisions on efficiency improvements but does not take into account the expected lifetime of the measures or the time-value of money.
• Savings-to-Investment Ratio (SIR) calculated by dividing the total discounted life-cycle savings of a mea-sure by the initial cost of the measure.20 SIR is used to answer the question of whether an investment will make money over its lifetime. The threshold for indicating whether or not an investment is economically attractive is “1”. An SIR greater than 1 indicates that savings out-weigh costs over the expected useful life of the invest-ment (e.g., an SIR of 1.5 means that the lifetime savings exceed the retrofit investment by 50%).
• Cost of saved energy and water is determined by dividing amount spent by the unit of energy or water saved.21 The cost of saved energy and water determines the total price of efficiency and can be compared to the price of buying energy and water. This metric is used by some utilities to decide between investing in efficiency or in developing new energy supplies, and by regulators to evaluate energy efficiency programs or projects.22 For an individual owner, this metric helps to compare the cost of doing nothing (and continuing to purchase energy from the utility company) versus saving energy through efficiency investments.
In addition, the GRP used the marginal cost of the mea-sure in its cost-effectiveness calculations (i.e. the difference between an efficient and conventional upgrade), while Energy Savers used the full cost of the measures in its calcu-lations. A full discussion of marginal versus full costs can be found in Appendix D: Methodology Details.
19 Unitsaregal/bedroom/day.
20 DiscountRate=3%ExpectedUsefulLifeinyears(EUL)=20yearsAssumedannualenergyandwaterpriceescalation=2%
21 CostofSavedEnergy($/mmBTU)=(C)x(CapitalRecoveryFactor)/D)CapitalRecoveryFactor=[A*(1+A)^(B)]/[(1+A)^(B)-1]A=DiscountRate(3%)B=ExpectedUsefulLifeinyears(EUL,20years)C=TotalCostofECMMeasures($)D=Totalenergy(mmBTU)savedperyear
22 See,forinstance,“SavingEnergyCost-Effectively”bytheAmericanCouncilforanEnergyEfficientEconomy,whichlooksatthecost-effectivenessofutilityprograms:http://www.aceee.org/research-report/u092

Energy and Water Savings in Multifamily Retrofits
PAGE 6 EXECUTIVE SUMMARY
Realization Rates
Realization rates are calculated by dividing the post-retro-fit measured savings by the pre-retrofit projected savings. A 100% realization rate means that the retrofit achieved exactly the same savings as the projected savings, whereas a lower percentage indicates that the savings fell short of the projection and a higher percentage indicates that the actual savings exceeded the projection.
For the GRP properties, HUD provided energy savings projections for a large majority of properties; however, the projections were based upon the recommended scope of work, which may have varied from the improvements that were actually implemented.23 Due to this variance between the recommended scope of work and those retrofits that were implemented, the realization rates in this report should not be relied upon to assess the quality of energy savings pro-jections. Aside from this basic issue (actual improvements varying from what was used to calculate projected savings), there are several other reasons why realization rates could vary, as summarized in Figure 1 above. Despite this caveat, realization rates are a significant metric for both property owners and lenders. Property owners want to have a clear understanding of what they can expect from their retrofits. Lenders want to develop appropriate methods for under-writing energy savings. Relatively little empirical data on realization rates for energy efficiency is available for the multifamily sector at this time; therefore, this analysis is included in the report despite the underlying uncertainties.
This report does not provide realization rates for the Energy Savers portfolio because the sample of properties for which Bright Power received projected savings was too small.
KEY FINDINGS
1. Retrofits produced significant energy and water savings in both portfolios.The GRP properties reduced whole building energy consumption by 18%, achieving estimated savings of $213/unit/year24 or $3.1 million dollars per year across the portfolio (including both electricity and gas), and reduced water consumption by 26%, or $95/unit/year equating to a total savings of approximately $1.2 million per year across the portfolio.25
Energy Savers properties reduced gas consumption by 26% with a total estimated savings of $195/unit/year or $381,000 per year across the portfolio.26
2. Less efficient properties achieved higher post-retrofit savings.Properties with higher pre-retrofit energy use intensity achieved higher post-retrofit savings in both the GRP and Energy Savers data sets. Similarly, higher pre-retrofit water use intensity showed a positive correlation with post-retrofit water savings.
3. Both energy and water retrofits were cost-effective.27
The energy savings measures in the GRP resulted in an estimated simple payback period (SPP) of 15 years and a savings-to-investment (SIR) ratio of 1.2 using the mar-ginal cost of measures.28 Water saving measures in the GRP suggest a simple payback period of 1 year and an SIR of 9 using the marginal cost of measures.29 The gas saving
23 WatersavingsprojectionswerenotprovidedfortheGRPportfolio.
24 Costsavingsarereportedusingpre-retrofitprices.
25 TheanalyzedGRPportfolioforenergyincluded179properties.TheanalyzedGRPportfolioforwaterincluded162properties,assomepropertiesdidnotprovidewaterdata.
26 TheanalyzedEnergySaversportfolioincluded57properties.
27 Lifecyclecost-effectivenesscalculationsassumptions:DiscountRate=3%,ExpectedUsefulLifeinyears(EUL)=20years,Annualenergyandwaterpriceescalation=2%.SeeAppendixD:MethodologyDetailsforadditionaldiscussionofassumptions.
28 ThelifecyclecostofsavedelectricityintheGRPportfolio($0.13/kWhsaved)islessthancontinuingtopurchaseit($0.14/kWh),whichisaportfolio-averagepriceoverthenext20years,assuminga2%annualpriceescalation.Thelifecyclecostofsavedgas($1.00/thermsaved)islessthancontinuingtopurchaseit($1.37/therm),whichisaportfolio-averagepriceoverthenext20years,assuminga2%annualpriceescalation.

JUNE 2014
PAGE 7
measures in the Energy Savers group showed a SPP of 7.3 years and an SIR of 2.8 based on the full cost of measures.30 For all three sets of measures, the lifecycle cost of saved energy or water was less than the projected cost of buying energy or water.
4. Both energy and water savings vary widely at the individual property level. Those properties falling within the 25th to 75th percentile (when ranked according to energy or water savings, respec-tively), showed 2% to 24% energy savings and 4% to 38% water savings at the GRP properties, and 14% to 32% gas savings at Energy Savers properties. While across the port-folio significant savings were achieved, 9% (17 out of 179) of the GRP properties showed energy usage increases (i.e. negative savings) in the first year post-retrofit.
5. First year energy savings of GRP projects fell short of audit projections, but further study would be needed to identify the causes of this variation.On average, 64% of projected energy savings were realized in the first year after the retrofits at GRP properties. This is comparable to the realization rate found in three other recent studies of retrofit programs.31
Part of the gap between projected and actual savings is likely due to changes in the retrofit scopes of work that occurred after the savings projections were calculated.
In general, factors contributing to the variation between savings projections and actual measured savings include changes in scopes of work not accounted for in projections, errors in engineering assumptions and calculations on the savings to be achieved from various energy efficiency measures, the interaction among new components (such as new boilers, new thermostats, and new building insulation), changes in the number and energy use profiles of occupants, other changes in equipment used (such as new exterior lighting or new air conditioners), and how equipment is installed, operated, and maintained.
29 Thelifecyclecostofsavedwaterintheprogram($1.32perthousandgallonssaved)issignificantlylessthanthecostofcontinuingtopurchaseit($10perthousandgallons).
30 Theavoidedcostofgassaved(atcurrentpricesof$0.90/therm)greatlyexceededthecostofinstallingthenewheatingsystems(atanaverageof$0.39/thermsaved).
31 DeutscheBankandLivingCities,“RecognizingtheBenefitsofEnergyEfficiencyinMultifamilyUnderwriting”(2011),https://www.db.com/usa/img/DBLC_Recognizing_the_Benefits_of_Energy_Efficiency_01_12.pdf;LindsayRobbinsandBetsyParrington,“ProgramResultsToDate—DeepDive,”NewYorkStateEnergyResearchandDevelopmentAuthority(NYSERDA)MultifamilyPerformanceProgram,PresentedatPartnerSummit(2013);L.BerryandM.Gettings,“RealizationRatesoftheNationalEnergyAudit.”InProceedings of Thermal Performance of the Exterior Envelopes of Buildings VII (Clearwater,Florida:AmericanSocietyofHeating,RefrigeratingandAir-ConditioningEngineers,1998).
This section presents an analysis of 179 properties in the Green Retrofit Program, beginning with background on the program, a description of the building stock and retrofit types, and a sum-mary of key findings. Results are presented as answers to a series of questions:
• How much energy and water was saved?
• How did energy and water use intensity change?
• What types of retrofit projects saved energy?
• How did the level of savings vary between projects?
• Did retrofit projects perform as expected?
• Were the retrofits cost-effective?
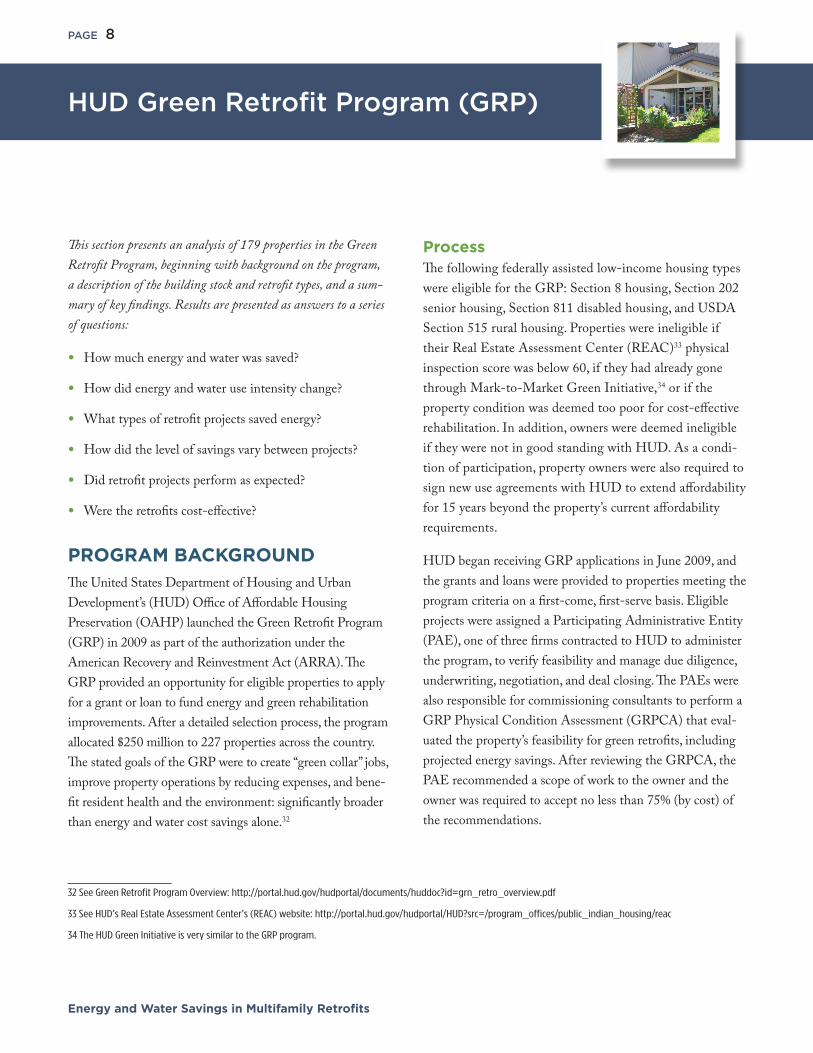
PROGRAM BACKGROUND The United States Department of Housing and Urban Development’s (HUD) Office of Affordable Housing Preservation (OAHP) launched the Green Retrofit Program (GRP) in 2009 as part of the authorization under the American Recovery and Reinvestment Act (ARRA). The GRP provided an opportunity for eligible properties to apply for a grant or loan to fund energy and green rehabilitation improvements. After a detailed selection process, the program allocated $250 million to 227 properties across the country. The stated goals of the GRP were to create “green collar” jobs, improve property operations by reducing expenses, and bene-fit resident health and the environment: significantly broader than energy and water cost savings alone.32
ProcessThe following federally assisted low-income housing types were eligible for the GRP: Section 8 housing, Section 202 senior housing, Section 811 disabled housing, and USDA Section 515 rural housing. Properties were ineligible if their Real Estate Assessment Center (REAC)33 physical inspection score was below 60, if they had already gone through Mark-to-Market Green Initiative,34 or if the property condition was deemed too poor for cost-effective rehabilitation. In addition, owners were deemed ineligible if they were not in good standing with HUD. As a condi-tion of participation, property owners were also required to sign new use agreements with HUD to extend affordability for 15 years beyond the property’s current affordability requirements.
HUD began receiving GRP applications in June 2009, and the grants and loans were provided to properties meeting the program criteria on a first-come, first-serve basis. Eligible projects were assigned a Participating Administrative Entity (PAE), one of three firms contracted to HUD to administer the program, to verify feasibility and manage due diligence, underwriting, negotiation, and deal closing. The PAEs were also responsible for commissioning consultants to perform a GRP Physical Condition Assessment (GRPCA) that eval-uated the property’s feasibility for green retrofits, including projected energy savings. After reviewing the GRPCA, the PAE recommended a scope of work to the owner and the owner was required to accept no less than 75% (by cost) of the recommendations.
HUD Green Retrofit Program (GRP)
Energy and Water Savings in Multifamily Retrofits
PAGE 8
32SeeGreenRetrofitProgramOverview:http://portal.hud.gov/hudportal/documents/huddoc?id=grn_retro_overview.pdf
33SeeHUD’sRealEstateAssessmentCenter’s(REAC)website:http://portal.hud.gov/hudportal/HUD?src=/program_offices/public_indian_housing/reac
34TheHUDGreenInitiativeisverysimilartotheGRPprogram.

JUNE 2014
PAGE 9
GRP DATA SETThe GRP data set included 227 properties spread across 33 states that were diverse in terms of location, age, size, building type, and the type of improvements undertaken.35 The median property size was 65 units, with the middle half (25th to 75th percentile) of properties ranging from 40 to 100 units. Most properties were built after 1970, with a median year of construction of 1983, and the middle half (25th to 75th percentile) of properties built between 1979 and 1995.
Less than a third of the properties (63 out of 227) were master-metered properties (i.e., the owner pays for all of the energy and water consumed at the property). At the remainder of the properties, tenants paid for some portion of energy use for one or more utilities (e.g., in-unit electric-ity, heating, cooling, and/or or domestic hot water). Both owner and tenant utility data were gathered by the GRP and analyzed in EnergyScoreCards for this study.
Average GRP pre-retrofit energy use intensity (kBTU/sqft/year) was similar to the average for all properties in the EnergyScoreCards database.36 That is, the building popula-tion started out at roughly average energy efficiency com-pared to a large national multifamily database.
Scopes of work included improvements to or replacements of heating, cooling, lighting, domestic hot water (DHW) systems, appliances, building envelope, and onsite genera-tion, as well as non-energy green improvements. Most prop-erties implemented a large number of measures affecting
multiple systems. Improvements were intended to reduce the overall energy consumption at each property, including tenant utility portion of consumption. Improvement scopes concentrated primarily on equipment replacement (e.g. new boilers, new windows, new refrigerators) rather than tuning up, repairing, or retrofitting existing equipment.
The median cost of energy and water improvements was approximately $2,300/unit, with a cost of $1,600/unit at the 25th percentile and $3,500/unit at the 75th percentile. This represents the marginal cost difference, or “green premium,” between green and conventional improvements imple-mented in the sites. Additional information on the types of energy and water improvements implemented can be found in Appendix A: Additional GRP Program Data.
GRP KEY FINDINGSGRP projects achieved significant energy and water savings in the first year after the retrofits:
• GRP properties achieved a total energy savings of 18% with a range of 6% to 24% for the 25th to 75th percen-tile of properties. The median site energy use intensity improved from roughly the national average (58 kBTU/sq ft/year) before the retrofits to better than the national average (49 kBTU/sq ft/year) after the retrofits. The total site-energy savings of 18% ($3.1M/year) were achieved across 179 properties.37
• GRP properties achieved a total water savings of 26%, with a range of 4% to 38% from the 25th to 75th
35 Outof227properties,48wereremovedfromtheoriginalGRPdatasetbecauseofdataqualityissuesasdescribedinAppendixD:MethodologyDetails,leaving179propertiesintheGRP-savingsanalysis.
36 EnergyScoreCardsusesanationaldatabaseofover5,000multifamilyproperties(morethan15,000buildings)toassignpeer-basedenergyandwaterefficiencygrades.SeeAppendixDforadditionalinformation.
37 NationalsiteenergyuseintensitybenchmarksaretakenfromtheEnergyScoreCardsdatabase.

Energy and Water Savings in Multifamily Retrofits
PAGE 10 HUD GREEN RETROFIT PROGRAM (GRP)
percentile. Median water use intensity improved from slightly worse than the national average (83 gallons/bed-room/day) to slightly better than the national average (60 gallons/bedroom/day) after the retrofits. Total water savings of 26% ($1.2M/year) were achieved across 157 properties.38
• GRP water saving measures were extremely cost-effective, showing a SPP of 1 year and a savings-to-investment ratio (SIR) of 9. The lifecycle cost of saved water in the program ($1.32/kGal saved) is significantly less than the projected average cost of water in the portfolio ($10/kGal).39
• GRP energy saving measures are cost-effective over their lifetime, showing a SPP of 15 years and a SIR of 1.2 based on first-year savings (including both electricity and gas savings). The lifecycle cost of saved electricity ($0.13/kWh saved) is less than the projected average portfolio cost of electricity ($0.14/kWh). The lifecycle cost of saved gas ($1.00/therm saved) is less than the projected average portfolio cost of gas ($1.37/therm).
• Of the projected savings, 64% was realized in the first year after the retrofits, which is comparable to the realization rates found in three other recent studies.40 However, GRP savings projections were based upon original scopes of work that may have changed during the retrofit process.
• Properties in the GRP portfolio that started with higher energy or water use intensity tended to achieve greater savings in the post-retrofit period.
• GRP properties where owners pay a larger portion of the energy usage tended to perform closer to projections. Savings on owner-paid bills realized 70% of the projec-tions, while savings on tenant-paid bills realized only 37% of the projections.
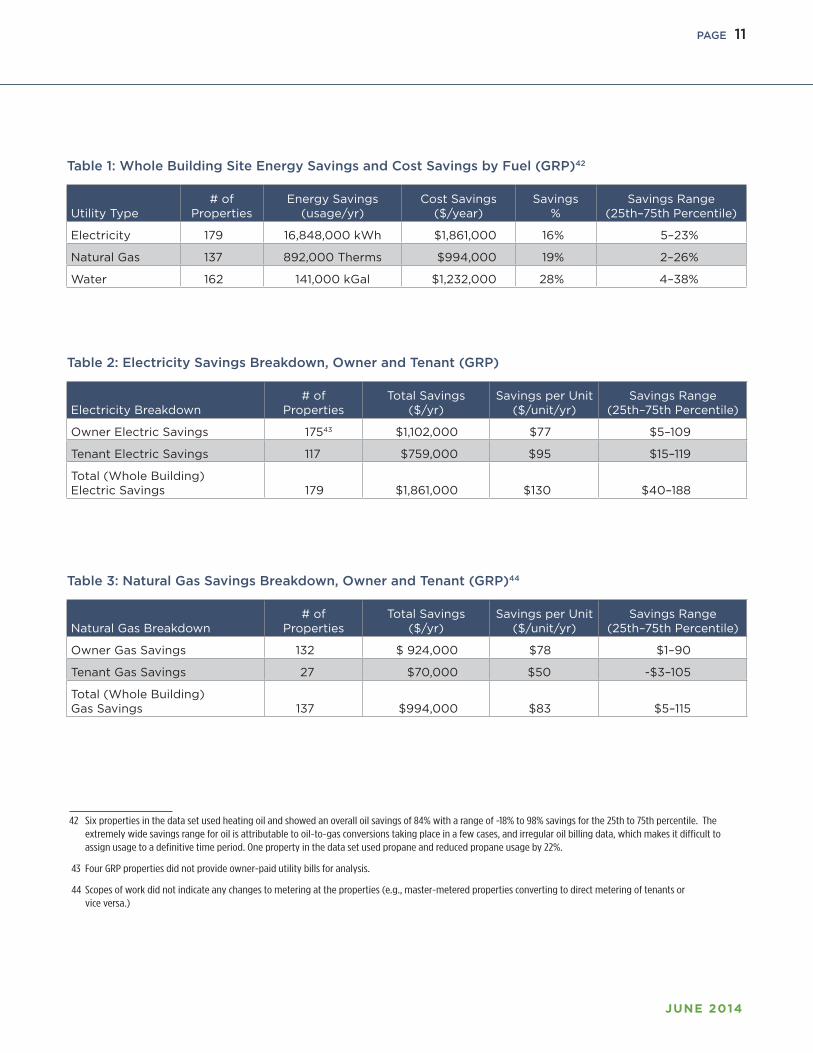
HOW MUCH ENERGY AND WATER WAS SAVED? Whole building energy and water savings for the GRP projects are shown according to fuel-type in Table 1. Electricity savings (16%, $130/unit/year) made up the largest portion of the total savings in terms of avoided cost. Natural gas savings, while only present at some properties, were deeper in terms of consumption (19%) but smaller in terms of cost savings ($83/unit). Electricity is a significant operating expense at all sites, and is more expensive than gas per-unit of energy, so a relatively small percentage reduction can represent a larger absolute cost savings.
Table 2 and Table 3 show a breakdown of owner and tenant savings for electricity and gas.41 Given that more than a third of the properties are master-metered or have central heat and hot-water systems, the relatively high portion of savings achieved on owner bills (particularly for gas) is not surprising. On a per-unit basis, however, tenant savings are significant and represent an average savings of $95/unit/year for electricity and $50/unit/year for gas across the portfolio.
38 NationalwateruseintensitybenchmarksaretakenfromtheEnergyScoreCardsdatabase.
39 SIRandcostofsavedenergycomparisonsusedthefollowingassumptions:DiscountRate=3%,ExpectedUsefulLifeinyears(EUL)=20years,Annualenergyandwaterpriceescalation=2%.SeeAppendixD:MethodologyDetailsforadditionaldiscussionofassumptions.
40 DeutscheBankandLivingCities,“RecognizingtheBenefitsofEnergyEfficiencyinMultifamilyUnderwriting”(2011),https://www.db.com/usa/img/DBLC_Recognizing_the_Benefits_of_Energy_Efficiency_01_12.pdf;LindsayRobbinsandBetsyParrington,“ProgramResultsToDate—DeepDive,”NewYorkStateEnergyResearchandDevelopmentAuthority(NYSERDA)MultifamilyPerformanceProgram,PresentedatPartnerSummit(2013);L.BerryandM.Gettings,“RealizationRatesoftheNationalEnergyAudit.”InProceedings of Thermal Performance of the Exterior Envelopes of Buildings VII(Clearwater,Florida:AmericanSocietyofHeating,RefrigeratingandAir-ConditioningEngineers,1998).
41 Asmallnumberofpropertiesconvertedfromelectricitytogas,orfromoiltogas,astheprimaryheatingfuel,resultinginverylargeshiftsinfuelusage(>90%),butmorereasonableoverallenergyusageshifts.Theseprojectsfallwelloutsideofthe25thto75thpercentileforelectricityandgas,butwithinitforoil,giventhatonlysixpropertiesusedoil.
JUNE 2014
PAGE 11
42 Sixpropertiesinthedatasetusedheatingoilandshowedanoveralloilsavingsof84%witharangeof-18%to98%savingsforthe25thto75thpercentile.Theextremelywidesavingsrangeforoilisattributabletooil-to-gasconversionstakingplaceinafewcases,andirregularoilbillingdata,whichmakesitdifficulttoassignusagetoadefinitivetimeperiod.Onepropertyinthedatasetusedpropaneandreducedpropaneusageby22%.
43 FourGRPpropertiesdidnotprovideowner-paidutilitybillsforanalysis.
44 Scopesofworkdidnotindicateanychangestometeringattheproperties(e.g.,master-meteredpropertiesconvertingtodirectmeteringoftenantsorviceversa.)
Table 1: Whole Building Site Energy Savings and Cost Savings by Fuel (GRP)42
Utility Type
# of Properties
Energy Savings (usage/yr)
Cost Savings($/year)
Savings %
Savings Range (25th–75th Percentile)
Electricity 179 16,848,000 kWh $1,861,000 16% 5–23%
Natural Gas 137 892,000 Therms $994,000 19% 2–26%
Water 162 141,000 kGal $1,232,000 28% 4–38%
Table 2: Electricity Savings Breakdown, Owner and Tenant (GRP)
Electricity Breakdown
# of Properties
Total Savings ($/yr)
Savings per Unit ($/unit/yr)
Savings Range (25th–75th Percentile)
Owner Electric Savings 17543 $1,102,000 $77 $5–109
Tenant Electric Savings 117 $759,000 $95 $15–119
Total (Whole Building) Electric Savings 179 $1,861,000 $130 $40–188
Table 3: Natural Gas Savings Breakdown, Owner and Tenant (GRP)44
Natural Gas Breakdown
# of Properties
Total Savings ($/yr)
Savings per Unit ($/unit/yr)
Savings Range (25th–75th Percentile)
Owner Gas Savings 132 $ 924,000 $78 $1–90
Tenant Gas Savings 27 $70,000 $50 -$3–105
Total (Whole Building) Gas Savings 137 $994,000 $83 $5–115

Energy and Water Savings in Multifamily Retrofits
PAGE 12 HUD GREEN RETROFIT PROGRAM (GRP)
HOW DID ENERGY AND WATER USE INTENSITY CHANGE?
Building energy and water efficiency in the GRP portfolio improved significantly in the first year after the retrofits. A comparison to the EnergyScoreCards database shows a shift from roughly average efficiency pre-retrofit to slightly better than average efficiency (more efficient) post-retrofit com-pared to the national multifamily housing stock:
• Median site EUI improved from 58 kBTU/sq ft/year pre-retrofit to 49 kBTU/sq ft/yr post-retrofit. The median post-retrofit energy intensity is better than the average in the EnergyScoreCards national database.
• Water use intensity improved even more significantly, from 83 gallons/bedroom/day pre-retrofit to 60 gallons/bedroom/day post-retrofit. This represents a shift in water
efficiency in the portfolio from slightly worse than average pre-retrofit, to better than average post-retrofit.
Figure 2 shows the change in EnergyScoreCards grades for the GRP properties. The grades indicate how a property’s EUI compares to other similar properties in the EnergyScoreCards database (A=in the most efficient quartile, D=in the least efficient quartile). The number of properties in the worst quartile for energy efficiency (D grades) decreased by almost half in the first post-retrofit year. Figure 3 shows the shift in water efficiency grades in the GRP data set. The number of properties in the best quartile for water efficiency (A grades) doubled post-retrofit and the number in the worst quartile (D grades) decreased by half.
See Appendix A: Additional GRP Program Data for additional figures showing the shift in energy use intensity before and after the retrofits.
Figure 2: GRP Pre- vs. Post-Retrofit EnergyScoreCards Grade Shift (n=179)
Pre-retrofit
Post-retrofit
16%
32%
0%
5%
10%
15%
20%
25%
30%
35%
40%
AB CD
Pe
rce
nt
of
Sam
ple
Energy Efficiency Grade
37%
18%
13%
35%
27%
22%
A B C D

JUNE 2014
PAGE 13
WHAT TYPES OF RETROFIT PROJECTS SAVED ENERGY?
A closer look at the data reveals a striking diversity in the types of GRP projects that saved energy. GRP participants implemented comprehensive scopes of work that affected many different building systems, including heating, cooling, DHW, lighting, building envelope, appliances, ventila-tion, and on-site generation (see Table 4). Most properties implemented at least eight different categories of improvements. Within each measure category, a number of different specific retrofits were implemented.
GRP scopes of work tended to include upgrading equip-ment with high-efficiency alternatives, including water fixtures, lighting, boilers, air-conditioners, DHW heaters, appliances, and windows. These upgrades often produced energy and water savings, but were also driven by the program’s broad goals of rehabilitating affordable housing and creating economic stimulus. For example, the majority of properties that implemented heating measures replaced
Figure 3: Water Efficiency Grade Shift (GRP)
A
Pe
rce
nt
of
Sam
ple
B C D
Pre-retrofit
Post-retrofit
18%
41%
27%
22%
18%
28%
15%
33%
45%
40%
35%
30%
25%
20%
15%
10%
5%
0
Table 4: Implemented Improvement Category (GRP)
Improvement Category
# Properties Implementing
% Properties Implementing
Water 157 88%
Lighting 149 83%
Building Enclosure 145 81%
Cooling 130 73%
Appliances 126 70%
Ventilation 123 69%
Heating 112 63%
Window Replacement 108 60%
Domestic Hot Water 107 60%
Onsite Generation 22 12%
Pumps/Motors 14 8%
Water Efficiency Grade

Energy and Water Savings in Multifamily Retrofits
PAGE 14 HUD GREEN RETROFIT PROGRAM (GRP)
major heating equipment (boilers, furnaces, etc.) or installed new thermostats, whereas very few addressed radiators or focused on tuning or calibrating existing equipment. Of the properties addressing heating measures, 45% addressed upgrades to thermostats or other controls, 37% installed new heating equipment, and 4% made other heating improve-ments. Fewer than 2% of the properties included radiator replacements, radiator valves, or the installation or calibra-tion of heating system controls other than thermostats. A similar focus on equipment replacement, rather than tune-ups or repairs, is evident in the scopes of work for cooling, domestic hot water and building enclosure measures. See Appendix A: Additional GRP Program Data for details on the improvements made within each category in the GRP portfolio.
No clear differences were discovered in the level of sav-ings achieved for different types of improvement packages, although drawing lines between package types was difficult given the large number of improvements undertaken at each site.45 It’s possible that differences in effectiveness of differ-ent improvement types or packages would be visible with more targeted monitoring to isolate the impacts of specific measures, or with a larger data set.
HOW DID THE LEVEL OF SAVINGS VARY BETWEEN PROPERTIES?Individual GRP properties achieved a wide range of energy savings (Figure 4) and water savings (Figure 5). The middle half (25th to 75th percentile) achieved energy savings in a range of 6% to 24% and water savings in a range of 4% to 38%, but a wide variation exists. Nine percent of the properties reported “negative savings,” or energy and water usage increases.
Data issues—such as mistakes in the source data provided, improperly assigned utility accounts or utility billing errors—could explain some of the very large changes observed, but the use of anonymous data precluded Bright Power from contacting properties or utilities to confirm the information received. Because large changes in energy and water consumption may, in fact, have occurred, surprising but plausible outliers have not been excluded from this analysis.46
Several possible explanations for energy or water use increases were suggested in conversation with program administrators and based on Bright Power’s knowledge with GRP projects outside of the data received for this study. For example, energy use might increase as a result of various factors such as:
• Air conditioners were installed at some properties where they had not existed prior to the retrofits.
• At some properties under-lit areas were brought up to comfortable lighting levels, resulting in increased elec-tricity consumption even with the use of more efficient fixtures.
• Broken or undersized ventilation fans were fixed or replaced at some properties, increasing energy usage. At other properties mechanical ventilation was added to kitchens and bathrooms to improve occupant health and safety where it had not previously existed.
• Residents that previously had broken heating or cooling systems might consume more energy after the retrofit.
45 Utilitybillanalysisdoesnotallowforthecalculationofsavingsfromspecificimprovementswhenmultiplechangesaremadeatthesametimethataffectthesameenergyusesourceatthesamemeter.Giventhelargeassortmentofimprovementscomparedtothenumberofpropertiesevaluated,BrightPowerwasunabletostatisticallyteaseouttheimpactofspecificimprovements.
46 Propertieswereremovedfromtheanalysiswherethedatasuggestedmissingutilityaccounts,orwherepre-orpost-retrofitenergyusagefelloutsideofthenormalrangeformultifamilyproperties.SeeAppendixD:MethodologyDetailsforfurtherdescription.

JUNE 2014
PAGE 15
• Changes in facility use. For example, the owner of one Ohio property shared that new tenant service activities in common areas resulted in net electricity increases at a specific property even as lighting and other measures produced savings.47
• Changes in occupancy.
• Improperly installed or configured equipment and/or control systems.
• Operational issues, such as new or inexperienced mainte-nance staff, gradual failure of older equipment, or lack of preventive maintenance.
On the other hand, some properties experienced energy or water savings of over 50%, unusually high for efficiency improvements. Properties with very large changes were not removed from the analysis if pre- and post-retrofit con-sumption levels were plausible. Some of these very large decreases were the result of large onsite generation systems (e.g. solar PV), while others may have resulted from correct-ing large leaks or equipment issues that existed before the retrofits.
47 Whileownerswerenotsurveyedaspartofthisstudy,BrightPowerhadpre-existingrelationshipswithownersofseveralGRPpropertieswhosharedanecdotesonretrofitprojects.
Figure 4: GRP Whole Building Site Energy Savings Distribution (n=179)
+$$"+"+!%,"
Percent Site Energy Saved
60
50
40
30
20
10
0
0 - +10
%
11 - 2
0%
21 -
30%
31 -
40%
41 - 5
0%
> 50%
Pro
pe
rty
Co
un
t
2 2 3
10
22
52
4949
35
< - 30
%
-21 -
30%
-11 -
20%
-10 -
0%
0% change

Energy and Water Savings in Multifamily Retrofits
PAGE 16 HUD GREEN RETROFIT PROGRAM (GRP)
Master-metered properties saved energy slightly
more than other metering configurations.
Master-metered properties—those properties where the owner pays for all of the energy and water used at the property—experienced slightly higher median savings lev-els than properties in which tenants paid for some portion of the building’s energy (Table 5), though the range of savings achieved across metering types did not show a clear relationship to metering.
Less efficient properties achieved higher
post-retrofit energy savings.
A property’s initial efficiency is represented by its pre- retrofit EUI, or energy usage per square foot (kBTU/sqft/year). In the GRP data set, for every 10 KBTU/sqft/year in pre-retrofit EUI, the property achieved an additional 2 kBTU/sqft/year increase in energy savings in the first post-retrofit year.48
Figure 6 shows a correlation between pre-retrofit energy use intensity and higher realized post-retrofit energy savings. Figure 7 shows a similar relationship for water, although the correlation is quite weak.
This result supports similar conclusions drawn in at least two other recent studies50 and general industry understanding that inefficient buildings have a greater potential for savings. However, many questions remain. Further research in this area might seek to understand differences between buildings with high initial energy use that achieved deep savings, and those that did not show substantial change. The strength of the relationship, or how closely savings potential is associ-ated with initial EUI, should be studied for different build-ing types and with larger data sets. See Areas for Further Research on page 34.
48 TheX-interceptofthetrend-line(13kBTU/sqft/year)showninFigure10mightsuggesttheminimumvaluetowhichenergyusecouldbereducedthroughsimilarret-rofits.Thatis,abuildingwithanEUIof13kBTU/sqft/yearwouldn’tbeexpectedtofindanyadditionalsavingsfromthetypesofimprovementsundertaken.However,thelowR2value(0.25)suggestscautionindrawingthisconclusionfromthisdataset.LargerormorehomogeneousdatasetsmighthelpidentifythetheoreticalminimumEUIachievableforaparticularsetofbuildingsandretrofittypes.
49 Fivepropertieswithunusualmeteringconfigurationsareexcludedfromthistable:onepropertywheretheowneronlypaysforcentralheatandthecommonareas,andfourpropertieswheretheownerpaysforcentralcooling,centralheat,andcentralDHWandcommonareas,buttenantspaytheirownin-unitelectricity.
50 DeutscheBankandLivingCities,“RecognizingtheBenefitsofEnergyEfficiencyinMultifamilyUnderwriting”(2011),https://www.db.com/usa/img/DBLC_Recognizing_the_Benefits_of_Energy_Efficiency_01_12.pdf;LocalInitiativesSupportCorporation,“GreenRetrofitInitiativeSummaryEvaluationReport”(August2013).
Table 5: Energy Savings by Metering Type (GRP)
Metering Configuration49
# of Properties
Median Savings for the Whole Property (%)
Savings Range (25th–75th Percentile)
Master-metered 62 17% 6–26%
Owner only pays for central heat, hot water and common areas 42 15% 9–26%
Owner only pays for hot water 23 14% 8–16%
Owner only pays for common areas (typically garden style) 47 13% 5–25%

Figure 5: GRP Whole Building Water Savings Distribution (n=162)
.&&".".%(,"
< '-70
%
32
1 13
78
7
18
30
2223
21
7
45
35
30
25
20
15
10
5
0
Pro
pe
rty C
ou
nt
0% change
-61 -
70%
-51 -
60%
-41 -
50%
-31 -
40%
-21 -
30%
-11 -
20%
-10 -
0%
+31 -
40%
+41 - 5
0%
+51 -
60%
+61 -
70%
>+70%
Percent Water Saved
0 - +0%
+11 - +
20%
+21 -
+30%
JUNE 2014
PAGE 17
Figure 6: Pre-Retrofit Energy Use Intensity and Change in Energy Usage (GRP)
En
erg
y S
av
ing
s (k
BT
U/s
qft
/yr)
80
60
40
20
0
-20
-40
0 50 100 150 200
More Efficient Baseline EUI (kBTU/sqft/yr) Less Efficient
y=0.20x - 2.59R2 = 0.25

Energy and Water Savings in Multifamily Retrofits
PAGE 18 HUD GREEN RETROFIT PROGRAM (GRP)
Higher levels of spending on retrofits do not
appear to correlate with higher levels of savings.
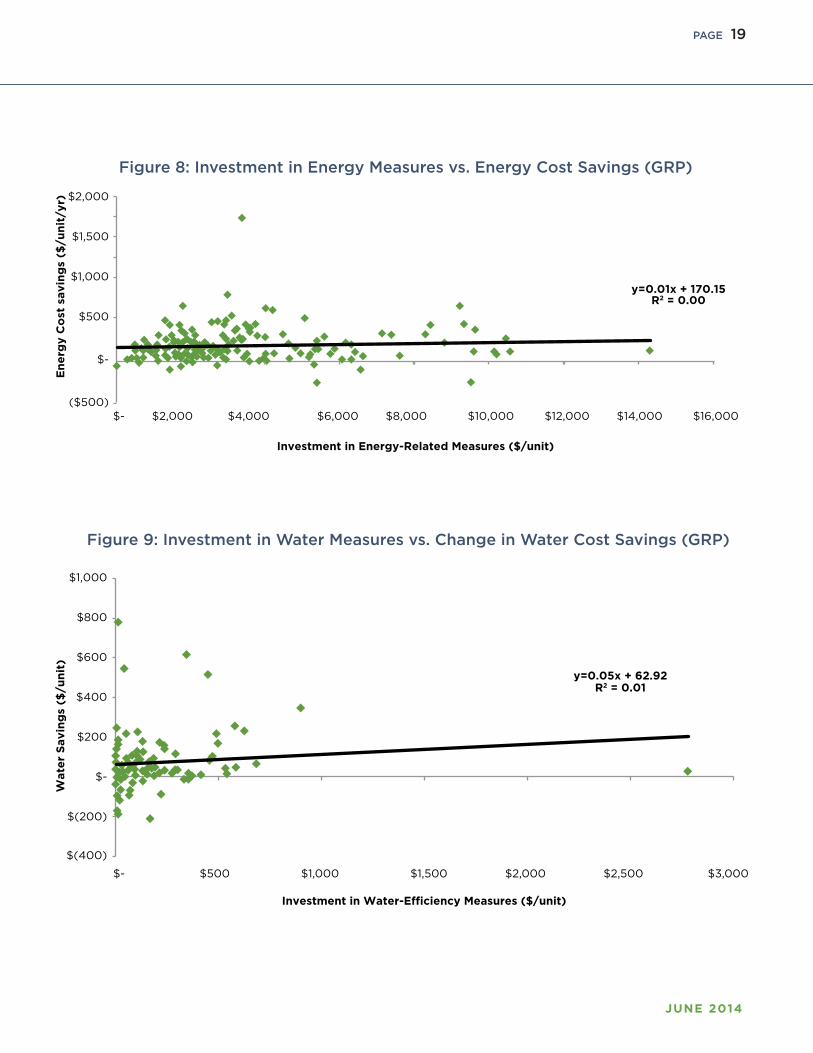
The level of investment in energy (Figure 8) and water (Figure 9) improvements did not show a significant cor-relation to the level of savings achieved. Some expensive retrofits produced low levels of savings, while others realized a high level of savings from inexpensive improvements.
This conclusion points to several factors at work in deter-mining scopes of work and ultimate savings, including:
• Unrelated changes in building occupancy or use may have masked savings from energy and water upgrades and are unrelated to the level of retrofit spending.
• Some projects failed to realize potential savings due to implementation or operations issues.
• Some improvements—even to energy and water related systems—were chosen for other reasons besides energy and water savings (e.g., improving resident comfort, green goals, general upgrade of older systems, or upgrading a system when substantial incentive money was available to offset costs). This is known to have taken place in the GRP and may have resulted in a looser relationship between property spending and savings achieved.
• Some projects may have realized large savings at a low cost by correcting operational inefficiencies.
Figure 7: Pre-Retrofit Water Use Intensity and Change in Water Usage (GRP)
Wate
r S
av
ing
s (g
al/
bd
rm/d
ay)
150
100
50
0
-50
-100
0 50 100 150 200 250
Less Efficient Baseline Water Efficiency (gal/bdrm/day) More Efficient
y=0.34x - 12.05R2 = 0.16
JUNE 2014
PAGE 19
Figure 8: Investment in Energy Measures vs. Energy Cost Savings (GRP)
Figure 9: Investment in Water Measures vs. Change in Water Cost Savings (GRP)
En
erg
y C
ost
savin
gs
($/u
nit
/yr) $2,000
$1,500
$1,000
$500
$-
($500)$- $2,000 $4,000 $6,000 $8,000 $10,000 $12,000 $14,000 $16,000
Investment in Energy-Related Measures ($/unit)
y=0.01x + 170.15R2 = 0.00
Wate
r S
av
ing
s ($
/un
it)
$1,000
$800
$600
$400
$200
$-
$(200)
$(400)
$- $500 $1,000 $1,500 $2,000 $2,500 $3,000
Investment in Water-Efficiency Measures ($/unit)
y=0.05x + 62.92R2 = 0.01

Energy and Water Savings in Multifamily Retrofits
PAGE 20 HUD GREEN RETROFIT PROGRAM (GRP)
Additional analyses were performed to investigate savings trends in the GRP data set related to property size, age, location, and the types of improvements undertaken that did not reveal other significant relationships in this data set. These tests are further described in Appendix A: Additional GRP Program Data.
DID RETROFIT PROJECTS PERFORM AS EXPECTED?Realization rates were calculated for each property in order to evaluate how achieved energy savings related to the energy savings projections. The realization rate is the ratio of achieved savings to projected savings. The realization rates in this report should not be used to evaluate the accuracy of energy savings projections because scopes of work may have changed between the projections and implementation. As shown in Figure 1 (see Approach section, page 2), there are many steps in the retrofit process and initial energy savings projections are sometimes made infeasible by later changes
in the scope of work that reduce the scale or eliminate some of the measures that are installed. Conversations with GRP program staff confirmed that scopes of work often changed, and projections were not updated based on the final imple-mented scope.
Ignoring these changes in the scopes of work for the properties, the GRP projects achieved a realization rate of 64% on energy measures in the first year of operation.51 This realization rate is similar to what three other studies have reported.52 In addition, 64% reflects only the first-year realization rate, and the achievement of energy savings often changes over time based on how systems are used and maintained. (See additional discussion of realization rates in Appendix D: Methodology Details.)
Figure 10 shows the variation in realization rates by plot-ting projected savings against achieved savings for each of the GRP buildings (each dot represents a single building). Buildings falling above the green 100%-realization-rate
51 Onepropertywasexcludedfromrealizationrateanalysisbecausebecauseithadaprojectedsavingsrateofzero.
52 DeutscheBankandLivingCities,“RecognizingtheBenefitsofEnergyEfficiencyinMultifamilyUnderwriting”(2011),https://www.db.com/usa/img/DBLC_Recognizing_the_Benefits_of_Energy_Efficiency_01_12.pdf;LindsayRobbinsandBetsyParrington,“ProgramResultsToDate—DeepDive,”NewYorkStateEnergyResearchandDevelopmentAuthority(NYSERDA)MultifamilyPerformanceProgram,PresentedatPartnerSummit(2013);L.BerryandM.Gettings,“RealizationRatesoftheNationalEnergyAudit.”InProceedingsofThermalPerformanceoftheExteriorEnvelopesofBuildingsVII(Clearwater,Florida:AmericanSocietyofHeating,RefrigeratingandAir-ConditioningEngineers,1998)lB.Polly,N.Kruis,andD.R.Roberts,Assessing and Improving the Accuracy of Energy Analysis for Residential Buildings.U.S.DepartmentofEnergy,EnergyEfficiencyandRenewableEnergy,BuildingTechnologiesProgram,NationalRenewableEnergyLaboratory(2011).
53 TheGRPrealizationraterepresentstheratiooftotalmeasuredsavingstototalprojectedsavingsacrossowneraccountsatallproperties,oracrosstenantaccountsatallproperties.
Table 6: Realization Rates for Owner-paid and Tenant-paid Energy Accounts (GRP)
GRP realization rate53
Median property realization rate
Range (25th–75th Percentile)
Owner-paid accounts 65% 70% 25–126%
Tenant-paid accounts 55% 37% 11–76%

JUNE 2014
PAGE 21
Figure 10: Projected Savings and Achieved Savings (GRP)
Ach
iev
ed
En
erg
y S
av
ing
s ($
/un
it/y
ear)
$- $200 $400 $600 $800 $1,000 $1,200 $1,400 $1,600 $1,800
Projected Energy Savings ($/unit/year)
100% Realization Rate Line
$1,800
$1,600
$1,400
$1,200
$1,000
$800
$600
$400
$200
$-
Table 7: Realization Rates by Metering Configuration (GRP)
Metering Configuration
# of Properties
Median Realization Rate (%)
Range (25th–75th Percentile)
Master-metered 62 65% 18–96%
Owner pays for central heat, hot water and common areas only 42 74% 28–112%
Owner pays for hot water and common areas only 23 49% 10–77%
Owner pays for common areas only (typically garden style) 47 40% 18–77%
Energy and Water Savings in Multifamily Retrofits
PAGE 22 HUD GREEN RETROFIT PROGRAM (GRP)
line exceeded projected savings, and buildings falling below the green line fell short of the projected savings. Interestingly, realization rates are significantly higher for the measures that reduce the owners’ energy bills than for the measures that reduce the tenants’ energy bills (Table 6).
Similarly, master-metered properties and properties with central heat and hot-water systems saw higher whole- building realization rates than properties where tenants paid a larger portion of utilities (see Table 7). The higher realization rates on owner-paid utilities and at properties where owners pay a larger portion of utilities appear to be related, and could be due to several factors, including more substantial changes in scopes of work on tenant units between projections and implementation, over-projection of savings from improvements affecting tenant bills, changes in resident behavior, or differences between the tenant units sampled before and after the retrofit.
Properties that use gas had higher realization rates (62% median realization rate, 129 properties) than all-electric properties (38% realization rate, 42 properties).
These findings, however, do not suggest that tenant or electric savings are not worth pursuing. A large number of projects realized significant tenant savings. Furthermore, electricity is used at all properties, and typically costs several times more than gas-per-unit of energy, so a smaller savings percentage can still be a significant dollar savings. In fact, electricity improvements delivered two-thirds of the energy cost savings across the GRP properties.
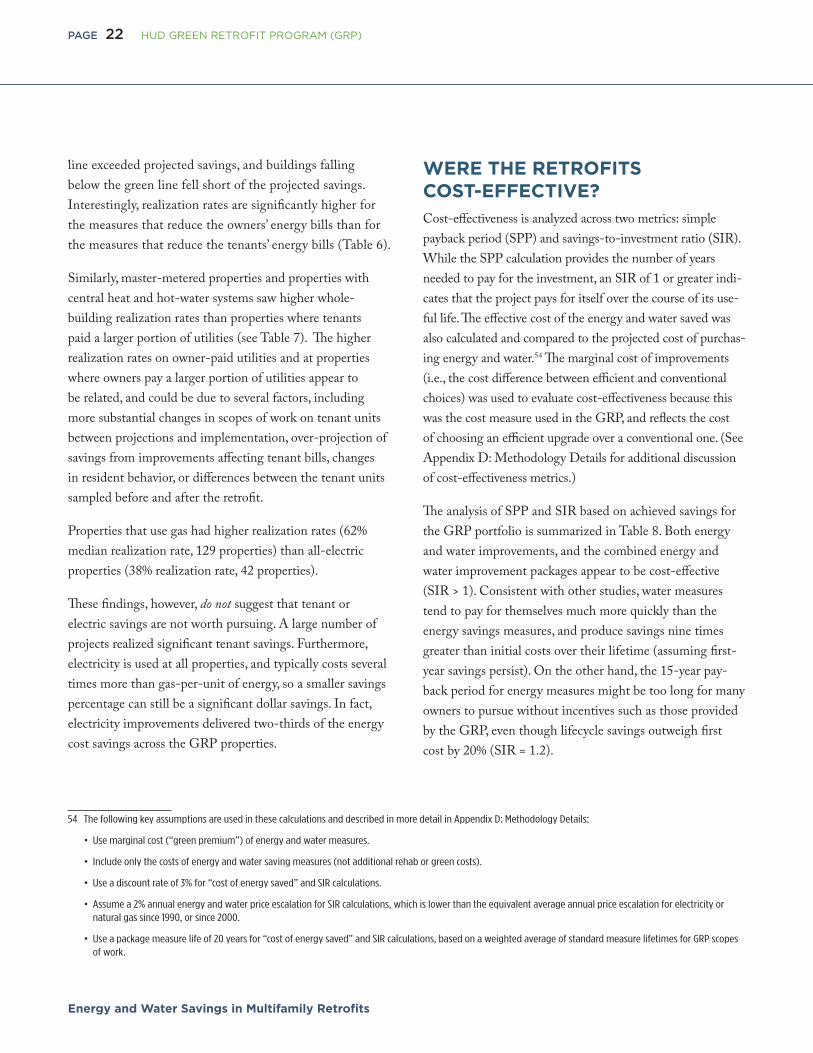
WERE THE RETROFITS COST-EFFECTIVE?Cost-effectiveness is analyzed across two metrics: simple payback period (SPP) and savings-to-investment ratio (SIR). While the SPP calculation provides the number of years needed to pay for the investment, an SIR of 1 or greater indi-cates that the project pays for itself over the course of its use-ful life. The effective cost of the energy and water saved was also calculated and compared to the projected cost of purchas-ing energy and water.54 The marginal cost of improvements (i.e., the cost difference between efficient and conventional choices) was used to evaluate cost-effectiveness because this was the cost measure used in the GRP, and reflects the cost of choosing an efficient upgrade over a conventional one. (See Appendix D: Methodology Details for additional discussion of cost-effectiveness metrics.)
The analysis of SPP and SIR based on achieved savings for the GRP portfolio is summarized in Table 8. Both energy and water improvements, and the combined energy and water improvement packages appear to be cost-effective (SIR > 1). Consistent with other studies, water measures tend to pay for themselves much more quickly than the energy savings measures, and produce savings nine times greater than initial costs over their lifetime (assuming first-year savings persist). On the other hand, the 15-year pay-back period for energy measures might be too long for many owners to pursue without incentives such as those provided by the GRP, even though lifecycle savings outweigh first cost by 20% (SIR = 1.2).
54 ThefollowingkeyassumptionsareusedinthesecalculationsanddescribedinmoredetailinAppendixD:MethodologyDetails:
•Usemarginalcost(“greenpremium”)ofenergyandwatermeasures.
•Includeonlythecostsofenergyandwatersavingmeasures(notadditionalrehaborgreencosts).
•Useadiscountrateof3%for“costofenergysaved”andSIRcalculations.
•Assumea2%annualenergyandwaterpriceescalationforSIRcalculations,whichislowerthantheequivalentaverageannualpriceescalationforelectricityornaturalgassince1990,orsince2000.
•Useapackagemeasurelifeof20yearsfor“costofenergysaved”andSIRcalculations,basedonaweightedaverageofstandardmeasurelifetimesforGRPscopesofwork.

JUNE 2014
PAGE 23
Table 9 shows the effective cost of the saved electricity, gas, and water calculated by dividing the cost of the retrofit by the energy and water saved across the entire lifetime of the improvements, and including a “capital recovery factor” to account for other forgone opportunities based on the cost of retrofits.55 The capital recovery factor is calculated using a standard formula that incorporates the lifetime of measures and a discount rate (see Appendix D: Methodology Details for further description). For electricity, gas, and water, the cost of efficiency gains is less than the cost of continuing to purchase the commodity. In effect, this means that a building choosing to forgo GRP improvements would pay 8% more for electricity, 37% more for gas, and 900% more (e.g. ten times as much) for water over the next 20 years, even includ-ing the cost of upgrades. Furthermore, the “cost of saved energy and water” is fixed (assuming the retrofits continue to perform as they did in the first year) whereas actual energy and water prices are subject to market volatility. Thus, the ret-rofit projects can also be valued as a hedge against utility costs.
DISCUSSION OF COST-EFFECTIVENESS AND MARGINAL VS. TOTAL COST
Marginal cost is the additional cost to implement a more efficient option over a conventional option, and is typically used to evaluate efficiency upgrades undertaken at the time of replacement, or for substantial rehabs or new construction. As shown in Table 10, the simple payback based on the full cost of measures is significantly longer than that based upon the marginal cost. Outside of the context of an incentive program like the GRP, this simply means that investing in high- efficiency systems is more cost-effective if it is already time to replace the system. Most owners who do not have strong incentives like those in the GRP will choose to wait to replace functioning equipment unless significant savings, compared to full replacement costs, are anticipated.
55 Forthisanalysis,thecostofcooling,heatingandDHWimprovementswassplitbetweenelectricityandgasforeachpropertybasedonwhetherelectricityorgaswasusedastheprimaryfuelforcooling,heatingorDHW.Thisisasimplifiedassumption,becauseinmanycasesbothelectricityandgassavingsmayresultfromthesameimprovement.Thecostofbuildingenvelopeimprovements(e.g.windows,insulation)whichcansaveonbothheatingandcooling,wasdividedbetweenheat-ingandcoolingbasedontheratioofannualheatingorcoolingconsumptiontothetotalspaceconditioning(i.e.heating+cooling)consumptionforeachpropertyseeninpre-retrofitutilitybillanalysis.
Table 8: Cost-Effectiveness Metrics (GRP)
Metric
Energy
Water
Energy + Water (all measures)
Simple Payback Period (SPP) 15 years 1 year 11 years
Savings-to-Investment Ratio (SIR) 1.2 9 1.6
Table 9: Cost of Saved Energy and Water vs. Energy and Water Prices (GRP)
Metric
Electricity ($/kWh)
Gas ($1/therm)
Water ($1.32/kGal)
Cost of Saved Energy and Water $0.13 1 year 11 years
Average Energy Prices over next 20 Years, Assuming 2% Annual Escalation $0.14
$1.37
$10

Energy and Water Savings in Multifamily Retrofits
PAGE 24 HUD GREEN RETROFIT PROGRAM (GRP)
Because the GRP was created by legislation passed by Congress in 2009 with the intent of creating economic stimulus during a deep recession, it provided for extensive efficiency upgrades to existing systems, in some cases even when systems were not at the end of their useful life. In doing so, the GRP captured an opportunity for cost-effective upgrades that would not appear again for 10 to 20 years after a conventional replacement (the lifetime of most equipment).
Table 10: Full Cost vs. Marginal Cost Simple Payback Period: Energy and Water Measures Combined
Program SPP
Range (25th–75th percentile)
Marginal cost calculations
11 years
4–21 years
Full cost calculations
29 years
15–56 years

JUNE 2014
PAGE 25
This section presents an analysis of 57 properties in the Energy Savers program, beginning with background on the program, a description of the building stock and retrofit types, and a summary of key findings. Results are presented as answers to a series of questions: 56
• How much energy and water was saved?
• How did energy and water use intensity change?
• What types of retrofit projects saved energy?
• How did the level of savings vary between projects?
• Were the retrofits cost-effective?
PROGRAM BACKGROUND The Energy Savers program is offered in partnership by Elevate Energy and Community Investment Corporation (CIC). Since 2007, Energy Savers has retrofitted more than 18,000 housing units in the Chicago area. The program aims to preserve affordable housing by helping owners of multi-family buildings reduce utility expenses with cost-effective energy and water efficiency measures.57
Elevate Energy designs and implements efficiency programs that lower costs, protect the environment, and ensure the ben-efits of energy efficiency reach those who need them most.
Community Investment Corporation, a not-for-profit mortgage lender, provides financing to buy and rehab mul-tifamily apartment buildings with five units or more in the six-county metropolitan Chicago area. CIC offers Energy Savers Loans at a fixed-rate of 3% with a seven-year term
as a second mortgage to pay for energy efficiency improve-ments recommended by the Elevate Energy and the Energy Savers team.
ProcessEnergy Savers is open to multifamily properties with two or more units located in the greater Chicago area.58 All proper-ties analyzed in this report are centrally heated multifamily rental buildings with more than five units, though the pro-gram also retrofits individually heated properties.
The Energy Savers process begins with a utility-bill analysis and on-site building energy assessment conducted by the Energy Savers team. Participating properties are required to submit 12 months of owner-paid gas and electric bills. The assessment includes an inspection of the building envelope and roof cavity, heating and domestic hot-water equipment, lighting, HVAC systems, and residential apartment units.
The Energy Savers team then delivers a report to the owner with a recommended scope of improvements. This includes energy savings projections and cost-effectiveness calculations using full implementation cost, rather than marginal cost. Properties are not required to complete any of the recom-mended measures. The Energy Savers team works with owners to arrange financing and solicit and evaluate bids from contractors. Roughly a third of the projects covered in this study received Energy Savers Loans, others received utility rebates, or grant awards administered by Elevate Energy. The program also provides construction advice and oversight and inspects all energy efficiency improvements after installation.
56 ThisisthesamesetofquestionsusedfortheGRPdataset,omittingtheanalysisofrealizationratesbecauseprojectedsavingsinformationwasnotavailableforamajorityofEnergySaversProperties.
57 SeeadescriptionofEnergySaversathttp://www.elevateenergy.org/for-building-owners-managers/energy-savers/
58 Participatingcountiesinclude:Cook,DuPage,Kane,Kendall,Lake,McHenry,andWillCountiesortheCityofRockford.
Energy Savers
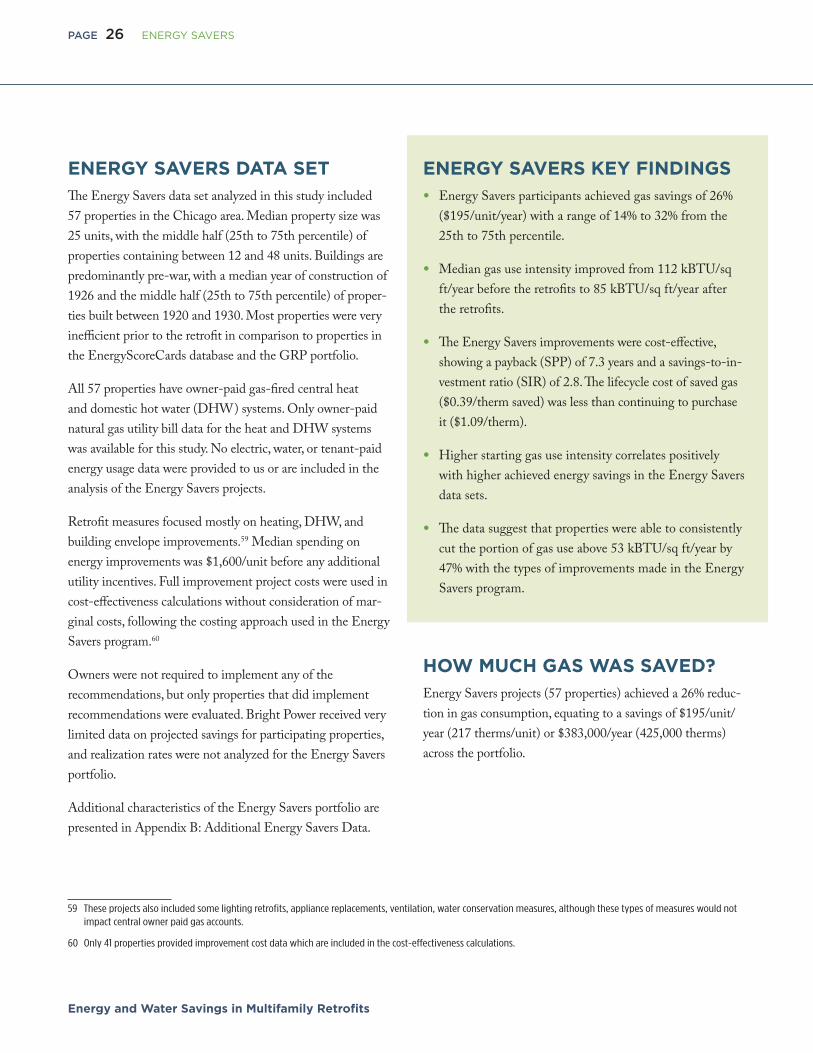
Energy and Water Savings in Multifamily Retrofits
PAGE 26 ENERGY SAVERS
ENERGY SAVERS DATA SETThe Energy Savers data set analyzed in this study included 57 properties in the Chicago area. Median property size was 25 units, with the middle half (25th to 75th percentile) of properties containing between 12 and 48 units. Buildings are predominantly pre-war, with a median year of construction of 1926 and the middle half (25th to 75th percentile) of proper-ties built between 1920 and 1930. Most properties were very inefficient prior to the retrofit in comparison to properties in the EnergyScoreCards database and the GRP portfolio.
All 57 properties have owner-paid gas-fired central heat and domestic hot water (DHW) systems. Only owner-paid natural gas utility bill data for the heat and DHW systems was available for this study. No electric, water, or tenant-paid energy usage data were provided to us or are included in the analysis of the Energy Savers projects.
Retrofit measures focused mostly on heating, DHW, and building envelope improvements.59 Median spending on energy improvements was $1,600/unit before any additional utility incentives. Full improvement project costs were used in cost-effectiveness calculations without consideration of mar-ginal costs, following the costing approach used in the Energy Savers program.60
Owners were not required to implement any of the recommendations, but only properties that did implement recommendations were evaluated. Bright Power received very limited data on projected savings for participating properties, and realization rates were not analyzed for the Energy Savers portfolio.
Additional characteristics of the Energy Savers portfolio are presented in Appendix B: Additional Energy Savers Data.
ENERGY SAVERS KEY FINDINGS• Energy Savers participants achieved gas savings of 26%
($195/unit/year) with a range of 14% to 32% from the 25th to 75th percentile.
• Median gas use intensity improved from 112 kBTU/sq ft/year before the retrofits to 85 kBTU/sq ft/year after the retrofits.
• The Energy Savers improvements were cost-effective, showing a payback (SPP) of 7.3 years and a savings-to-in-vestment ratio (SIR) of 2.8. The lifecycle cost of saved gas ($0.39/therm saved) was less than continuing to purchase it ($1.09/therm).
• Higher starting gas use intensity correlates positively with higher achieved energy savings in the Energy Savers data sets.
• The data suggest that properties were able to consistently cut the portion of gas use above 53 kBTU/sq ft/year by 47% with the types of improvements made in the Energy Savers program.
HOW MUCH GAS WAS SAVED? Energy Savers projects (57 properties) achieved a 26% reduc-tion in gas consumption, equating to a savings of $195/unit/year (217 therms/unit) or $383,000/year (425,000 therms) across the portfolio.
59 Theseprojectsalsoincludedsomelightingretrofits,appliancereplacements,ventilation,waterconservationmeasures,althoughthesetypesofmeasureswouldnotimpactcentralownerpaidgasaccounts.
60 Only41propertiesprovidedimprovementcostdatawhichareincludedinthecost-effectivenesscalculations.

JUNE 2014
PAGE 27
HOW DID GAS USE INTENSITY CHANGE?A comparison between the pre- and post-retrofit owner-paid gas usage shows a significant improvement across the port-folio (Figure 11). Median gas use intensity (GUI) decreased from 112 kBTU/sq ft/year to 85 kBTU/sqft/year.
Even after the retrofit, however, Energy Savers properties are relatively energy intensive compared to the GRP data set. Median Energy Savers post-retrofit gas use alone is 85 kBTU/sq ft/year versus a median of 47 kBTU/sq ft/year whole building post-retrofit energy usage in the GRP. This may be attributable to the fact that Chicago has a colder climate and the participating buildings are older than the average GRP building stock.
WHAT TYPES OF PROJECTS SAVED ENERGY?Most Energy Savers projects included heating (84%), DHW (42%), and building enclosure upgrades (77%) such as insulation and air sealing, and most scopes of work included five or fewer improvements.
Scopes of work included a variety of measures within each category including equipment replacement, controls and distribution system upgrades. For example, Table 11 shows the number of properties implementing different types of heating improvements.
Figure 11: Gas Usage Intensity (GUI) Shift Pre- vs. Post-Retrofit (Energy Savers)
0 - 18
19 -
36
37 - 55
56 - 73
74 - 36
110 -
127
128 -
145
146 -
164
164 -
182
183 -
200
92 - 10
9
Pro
pe
rty C
ou
nt
30
25
20
15
10
5
0
More Efficient GUI (kBTU/sqft/yr) Less Efficient
Pre-retrofit GUI (Baseline) Post-retrofit GUI

Energy and Water Savings in Multifamily Retrofits
PAGE 28 ENERGY SAVERS
HOW DID THE LEVEL OF SAVINGS VARY BETWEEN PROPERTIES?Achieved gas savings varied between Energy Savers proj-ects (Figure 12). The middle half of properties (25th to 75th percentile) achieved savings in the range of 14% to 32%, or $90/unit/year to $349/unit/year. All 57 projects showed gas savings in the first year.
Inefficient Properties Achieved Greater Savings.
Energy Savers properties with higher pre-retrofit GUI achieved larger gas savings. On average, properties achieved a 47% reduction in energy use on all pre-retrofit consump-tion above 53 kBTU/sqft/year. In other words, for properties undergoing retrofits, every 10 KBTU/sqft/year in additional pre-retrofit gas use above 53 kBTU/sqft/yr was associated with 4.7 kBTU/sqft/year in post-retrofit energy savings (see Figure 13).61 This result should be confirmed with a larger sample and is likely specific to this population of buildings.
Higher Retrofit Spending Appears to be
Weakly Correlated with Greater Savings.
Greater investment was weakly correlated with higher energy savings in the Energy Savers data set (R2=0.13; see Figure 14). On average, each $100 per unit spent led to a savings increase of $5 per unit per year. However, a number of properties significantly reduced gas consumption with very small investments. Further research would be needed to determine if these properties had exceptionally cost-effective opportunities or if different measures or implementation approaches led to these low-cost savings.
Additional analyses were performed to investigate savings trends in the Energy Savers data set related to property size, age, location, and the types of improvements undertaken that did not show significant relationships between achieved savings and these variables. These tests are further described in Appendix B: Additional Energy Savers Data.
61 Thetrendlineinterceptsthex-axisat53kBTU/sqft/year,andincreasesataslopeof0.47.
Table 11: Implementation of Heating Measures (Energy Savers)
Heating Improvement Type
# Properties Implementing
% Properties Implementing
Upgrade Boiler Controls 25 44%
Install/Upgrade Boiler/Furnace 23 40%
Insulate Pipes/Ducts 13 23%
Repair/Clean/Tune Boiler/ Furnace 12 21%
Other Heating Improvements 5 9%
Install/Upgrade Thermostat 4 7%
Install/Upgrade Controls 4 7%
Repair/Clean/ Correct Pitch of Radiators 4 7%
Install/Upgrade Burner 3 5%
Install/Upgrade Radiators 2 4%
Tune/Calibrate Controls 1 2%
Adjust Heating System Temperature 1 2%

JUNE 2014
PAGE 29
Figure 12: Energy Savers Gas Savings (%) Distribution
Figure 13: Pre-Retrofit Gas Use Intensity and Gas Savings (Energy Savers)
16
6
16
12
6
1
Pro
pe
rty C
ou
nt
18
16
14
12
10
8
6
4
2
0
0 - 10
%
11 - 2
0%
21 - 3
0%
11 - 2
0%
21 - 3
0%
31 - 4
0%
41 - 5
0%
> 50%
Gas Savings (%)
Gas
Sav
ing
s (k
BT
U/s
qft
/yr)
90
80
70
60
50
40
30
20
10
0
-10
More Efficient Baseline GUI (kBTU/sqft/yr) Less Efficient
25 45 65 85 105 125 145 165 185 205 225
y = 0.47x - 24.50R2 = 0.57

Energy and Water Savings in Multifamily Retrofits
PAGE 30 ENERGY SAVERS
WERE THE RETROFITS COST-EFFECTIVE?Energy Savers projects were cost-effective.62 The cost- effectiveness calculations mirror those in the GRP section of this report and are shown in Table 12.63
Table 13 shows the effective cost of the saved gas in the Energy Savers projects—significantly less than the cost of gas. In effect, this means that a building choosing to forgo Energy Savers improvements would pay 179% more for gas over the next 20 years, even considering the cost of energy upgrades.
62 Forty-oneEnergySaversprojectsprovidedinformationonthecostofinstalledmeasureswhichareincludedinthecost-effectivenessanalysis.
63 ThefollowingassumptionsareusedinthesecalculationsanddescribedinmoredetailinAppendixD:MethodologyDetails.ThesearethesameassumptionsusedinGRPcost-effectivenesscalculationsexcepttheuseoffullcostsofimprovementsforEnergySavers(marginalcostsareusedfortheGRP).
•Usefullcostsofenergyimprovements. •Includeonlythecostsofenergyandwatersavingmeasures(notadditionalrehaborgreencosts). •Useadiscountrateof3%for“costofenergysaved”andSIRcalculations. •Assumea2%annualenergyandwaterpriceescalationforSIRcalculations. •Useapackagemeasurelifeof20yearsfor“costofenergysaved”andSIRcalculations.
Figure 14: Gas Efficiency Investment and Achieved Gas Savings (Energy Savers)
Gas
Savin
gs
($/u
nit
/yr)
$1,000
$900
$800
$700
$600
$500
$400
$300
$200
$100
$-
Investment ($/yr)
$- $2,000 $4,000 $6,000 $8,000 $10,000 $12,000
y = 0.04x + 187.22R2 = 0.17
Table 12: Energy Savers Cost-Effectiveness Metrics
Metric Gas
Simple Payback Period (SPP) 7.3 years
Savings to Investment Ratio (SIR) 2.8 years
Table 13: Cost of Saved Gas vs. Gas Prices (Energy Savers)
Metric Gas ($/therm)
Cost of Saved Gas $0.39
Average Gas Prices over next 20 Years with 2% Annual Escalation $1.09

JUNE 2014
PAGE 31
Two primary conclusions can be drawn as a result of this study: multifamily retrofits produce real and measurable energy and water use reductions, and energy and water retrofits are a good investment based solely on utility cost savings. Energy and water savings were documented across a wide range of building types, locations, and improvement types, and in both owner-paid and tenant-paid utilities. The GRP and Energy Savers programs were effective at cutting costs and reducing environmental impacts from multifamily building operation.
The findings in this study are supported by several smaller regional studies. Appendix C: Comparison to Other Multifamily Program Data Sets includes a discussion of three other recent data sets that similarly demonstrate mea-surable savings in multifamily energy retrofits.
This analysis included a number of retrofit projects that did not perform according to expectation. For example, some properties saw an increase in energy or water use instead of a reduction, some achieved a reduction in usage of resources, but fell short of original savings estimates, and some expensive projects resulted in very little monetary savings. While the available data allowed for a quantification of utility savings, it did not allow for a detailed investigation into the specific causes of variation between projects.
The successes and challenges of the multifamily energy and water retrofits in this study provide valuable lessons for property owners and program managers undertaking retrofits, and suggest several promising areas for further research. These lessons and research topics are described in the following.
LESSONS FOR SUCCESSFUL RETROFITS
1. Make data collection and analysis a standard for all multifamily energy and water retrofitsMultifamily energy and water retrofit programs can become invaluable sources of learning for property owners and for the industry at large, but only if critical data is captured, analyzed and shared. Post-retrofit analysis goals should be identified at the start of a retrofit project or during program design to ensure that data of sufficient quality and detail are available after the project is complete. Generally, critical information to be collected should include:
• A minimum of one year of pre-retrofit and one year of post-retrofit utility data. Data for subsequent post-retrofit years would have significant additional value when it is available.
• Information on building size, occupancy, equipment, and building type.
• Information on the implemented improvements at each property.
• Projected savings for the improvements implemented at each property.
• Other changes (e.g., occupancy, new equipment, changing operations) taking place at the same time as the retrofit, or during the pre- and post-retrofit years.
Conclusions

Energy and Water Savings in Multifamily Retrofits
PAGE 32 CONCLUSIONS
Recommendations for data collection and analysis based on this study are included below.
a) Benchmark energy and water consumption
both before and after retrofits.
While the GRP, Energy Savers and a handful of other programs have started to require the collection of pre- and post-retrofit utility data, this is still the exception rather than the rule.64 As demonstrated here, measuring savings is critical to document results and to pinpoint areas for improvement and further study.
Data collection alone is not sufficient, however, as raw utility bills require analysis to accurately document results. Energy and water benchmarking—the analysis and comparison of consumption between peer buildings or at a single building over time using standardized metrics—should be the stan-dard. Data should be gathered and stored at the utility bill level, including cost, consumption, and date information, with clear distinctions made between owner-paid and tenant-paid accounts. Data stored in other aggregated formats (e.g., annual or monthly totals or fuel totals) may not allow accurate savings analysis, including weather normalization.
While benchmarking inevitably adds some cost to a retrofit project, these costs are typically a very small fraction of the budget spent on new equipment and engineering. The devel-opment of online tools for gathering and analyzing multifam-ily energy data in recent years has also reduced the costs of benchmarking, although barriers to utility data collection, in particular for tenant data, remain.
b) Collect key property and project
characteristics.
Information on building size, age, location, construction type, metering, fuel use, occupancy, building activities, and building systems, as well as on the types of improvements undertaken, costs and projected savings of improvements,
is critical to capturing the full value of data collected from retrofits. Fannie Mae, the Department of Energy, the Environmental Protection Agency, the MacArthur Foundation, and others have supported industry-wide efforts to standardize data on energy and water usage, buildings and retrofits. Creating and then promoting the use of such a standard taxonomy for energy projects and programs would make data collection and analysis less resource-intensive for future research efforts, and give individual owners clear guidance on data collection best practices.
c) Project savings for final scopes of work, not
just for initial recommendations.
Developing savings projections on the improvements that are actually implemented at a building is vital for compar-ing post-retrofit energy performance to expectations. There are many factors that can impact the energy performance of retrofits, including changes to the scope of work, changes in metering configuration, physical additions to the property, and changes to building operation. Without a model that takes these factors into account, it is impossible to know if retrofits are “working” or not. Models of this type have been used to project and verify savings for energy performance contracts under the International Performance Measurement and Verification Protocol Option C.
2. Use post-retrofit tracking to drive deeper savings and improve realization rates. This study found that actual first-year savings results varied significantly between properties, and that some properties saw consumption increases. Buildings are not static, however, and energy and water performance can be improved with ongo-ing feedback. The following two suggested approaches use post-retrofit analysis to intervene and improve savings results over time:
64 Forinstance,theNYSERDAMultifamilyPerformanceProgram,thePennsylvaniaHousingFinanceAgency’sPreservationthroughSmartRehabProgram,theMassachusettsGreenInitiativeandtheCommunityWeatherizationPartnersprograminNewYorkCityallperformedpre-andpost-retrofittracking.

JUNE 2014
PAGE 33
a) Track actual savings (or lack thereof ) in the first year after retrofits, and be ready to make corrections if savings do not meet expectations. Programs or owners of large portfolios should identify projects that are not achieving their projected savings during the first year, and strategically deploy technical assistance to correct any issues or deficiencies. This should increase savings and realization rates over the lifetime of improvements.
b) Create incentives based upon achieving actual savings tar-gets. For example, the NYSERDA Multifamily Performance Program only releases the final portion of incentive funds after one year of utility data shows that the property has met its performance target.65 For an individual owner, finan-cial incentives and/or public recognition for staff involved in projects that demonstrate real savings might produce a similar result.
3. Focus on proper design, installation, and operation of retrofits to improve consistency of retrofit results.While this study did not investigate the causes of project underperformance, one common problem is that new systems are not always designed and installed correctly, or not oper-ated correctly by building staff. Attention to energy and water efficiency goals shouldn’t end with an energy audit, but must carry through the system design, specification, installation, training and oversight of maintenance staff in order to achieve consistent results.
4. Aggressively promote efficiency during rehabs and at equipment replacement. The GRP demonstrated the high value of improving effi-ciency at the time of equipment replacement. Marginal cost—the difference between the cost of a conventional piece of equipment and its energy efficient alternative—is appropriate for evaluating cost-effectiveness of an efficiency
improvement at the time of equipment replacement. More efficiency projects make financial sense when evaluated with respect to marginal cost. Furthermore, installing a con-ventional replacement today makes it unlikely that a more efficient option will be installed for years, or even decades. Owners and lenders should make it a standard practice to upgrade efficiency at the time of equipment replacement. For maximum effectiveness, this may require working directly with equipment distributors and installers since emergency replacements often happen too fast for intervention from energy programs or consultants.
5. Pursue efficient operations and maintenance as a way to save without major capital expense.This study found that some low-cost projects realized larger savings than high-cost projects. One possible explanation is that operational corrections can sometimes save more than equipment replacement. Owners can target low-cost opera-tional tweaks and potentially realize savings very cost-effec-tively. Even if easily correctable inefficiencies are not found, preventative maintenance reduces the risk of utility usage increases by helping to catch problems early.
6. Resident electric savings are harder to achieve: be conservative with projections and innovative with approaches.Baseload electricity consumption is the fastest growing area of residential energy use, due in part to increasing use of home electronics and larger appliances.66 This study found that savings were deeper on gas than electricity, and that tenant electric savings were more variable and less reliable (i.e., had a wider range and lower realization rates) than owner savings.
Given these findings, owners, engineers, and program man-agers should be conservative in projecting resident electricity savings. For projects where achieving resident savings is a high priority, targeted and innovative approaches including
65 Seehttp://www.nyserda.ny.gov/EnergyEfficiency-and-Renewable-Programs/Multifamily-Performance-Program/Multifamily-Performance-Program.aspx
66 See,forinstance,“TwoPerspectivesonHouseholdElectricityUse,”EnergyInformationAdministration(March2013),http://www.eia.gov/todayinenergy/detail.cfm?id=10251

Energy and Water Savings in Multifamily Retrofits
PAGE 34 CONCLUSIONS
real-time monitoring or resident feedback, hands-on tenant engagement, and frequent unit inspections may be beneficial.
7. Aggressively target the most inefficient buildings to achieve the greatest savings.The least efficient buildings have the greatest potential for savings. In addition to the analyses of GRP and Energy Savers in this study, this seemingly common sense finding has also been documented in regional data sets in New York and Massachusetts.67 However, most energy retrofit programs do not use initial energy consumption as a determinant for par-ticipation or projected savings. Based on this finding, owners, investors, or program managers seeking to maximize savings should target the worst performers first. One approach might be to set a minimum starting EUI threshold to help ensure a portfolio of projects would meet savings goals. This does not mean that better-performing buildings can’t be improved, but that identifying and addressing the worst performers should be a high priority.
AREAS FOR FURTHER RESEARCHWhile 236 analyzed projects make this study one of the largest aggregations of multifamily retrofit results to date, the data set is still relatively small compared to the diver-sity of the national multifamily building stock, and the many types of efficiency improvements undertaken in mul-tifamily buildings. Further studies are needed to confirm and refine these findings, and may identify other relation-ships not apparent in this data set. In the coming years, there is an opportunity to greatly expand the knowledge base by using energy and water retrofits as real-world lab-oratories to test new approaches. Specific areas for further research that build on this study are listed below. Along with new studies, there may an opportunity to perform
meta-analyses on the results of the GRP, Energy Savers and several recent multifamily energy programs. Generally, experimental or longitudinal studies with explicit research goals and careful design will accelerate industry learn-ing beyond what can be gleaned from case studies and anecdotes.
1. Study the causes of retrofit underperformance.This study analyzed retrofit results but could not address the underlying causes of retrofit performance in detail, given the use of anonymous data. Studies that utilize more detailed post-retrofit surveys or tracking of projects throughout the full retrofit lifecycle might help uncover the most important causes of retrofit underperformance. Possible causes of underperformance include imprecisions in savings projections, improper equipment installation, or building operational changes.
Additionally, some buildings with high-energy use that appeared to be good retrofit candidates achieved deep savings, and others did not. Are differences in results due to under-lying characteristics of the properties, poorly implemented projects, or missed opportunities?
2. Find the optimal level of technical assistance for successful multifamily retrofits.Anecdotal evidence suggests that better design, installation, and operation of new equipment can improve results. To test this hypothesis, researchers might design an experiment where a large number of projects are divided into groups based on the amount of technical assistance received for energy audits, design, installation oversight, training for building staff, or commissioning. Groups receiving different levels of assistance can then be compared in terms of achieved savings to test whether the additional support improved results.
67 SeeAppendixC:ComparisontoOtherMultifamilyProgramDataSets.

JUNE 2014
PAGE 35
3. Refine the relationship between initial efficiency and potential savings. Future research should study the specifics of the relationship between energy use intensity and potential savings, which may vary by region, building type, or the scope of improve-ments. Ultimately, building owners, programs or lenders could use an equation similar to the regression shown in Figure 10 and Figure 24 to predict potential energy savings using only a building’s energy use intensity. Once confirmed, this would be a powerful tool for enabling large-scale investments in multifamily efficiency.
4. Test new approaches to increase tenant-paid electric savings.Resident energy efficiency appears to be an area with sig-nificant room for improvement both in the depth of savings achieved and consistency of results. Further research could test innovative approaches designed to increase resident energy efficiency, including educational initiatives, feedback mechanisms, messaging, and other efforts to engage the com-munity around energy savings.
Multifamily energy efficiency is a growing priority for owners and managers seeking to control costs and upgrade proper-ties, utilities seeking to meet energy targets, and governments seeking to create jobs, reduce greenhouse gas emissions, and make housing more affordable and resilient. It is the hope of the authors that this study helps readers target investments in multifamily retrofits that increase the level of savings achieved, the predictability of results, and the cost-effective-ness of improvements.

Appendices: Energy and Water Savings in Multifamily Retrofits
Results from the U.S. Department of Housing and Urban Development’s Green Retrofit Program and Energy Savers Program in Illinois

Appendix A: Additional GRP Program Data
JUNE 2014
PAGE 37
GRP BUILDING CHARACTERISTICS
LocationThe GRP properties were located in 33 states. Most regions of the country were well represented, with the exception of the Southwest where there were only eight properties, as shown in Table 14. The majority (52%) of the GRP portfolio was located in seven states: California, New York, Ohio, Michigan, Florida, Illinois, and Wisconsin.
MeteringThe GRP properties included buildings with various energy metering configurations. Owners and tenants paid for different portions of the energy usage at different properties. The owners paid for all water usage.
Table 15 contains a description of each metering configuration and the number of properties with each configuration.
Table 14: Regional Distribution of GRP Properties
Region Number of properties in
data set
States represented
Midwest 52 IL, IN, MI, MN, OH, WI
Northeast 38 CT, DC, DE, MA, ME, NY, PA, RI, VT
Southeast 44 AL, AR, FL, GA KY, LA, MO, NC, SC, TN, VA
Southwest 8 AZ, TX, NM
West 37 CA, CO, NV, OR, WA
Table 15: GRP Properties by Metering Configuration
End-uses paid by owner
Typical property and building system characteristics
Property count
Whole building (master-metered)
Single property with one or more buildings with central heat, DHW, and no tenant electric meters
63
Common area, tenant cooling, heat, and DHW
Central cooling and central heat and DHW systems
4
Common area,tenant heat and DHW
Central heating and DHW systems 42
Common area, tenant heat
Central heating system 1
Common area,tenant DHW
Central DHW system 23
Common area onlyMultiple buildings (garden style) with individual HVAC + DHW units in each tenant unit
46

68 Only160propertiesprovidedtheyearofconstruction.
Energy and Water Savings in Multifamily Retrofits
PAGE 38 APPENDIX A
Property SizeAs shown in Figure 15, the GRP data set included a wide range of building sizes, with the highest concentration of properties between 25 and 100 units.
AgeThe GRP data set includes a wide range of building ages, with most properties built in the 1970s, ’80s and ’90s (Figure 16).
Figure 15: Property Size Distribution (GRP)
+$$"+"+!%,"
Units Per Property
100 -
124
125-
149
150 -
174
175
- 199
200 -
250
> 250
Pro
pe
rty C
ou
nt
37
40
30
54 46
7
1 - 2
4
25 -
49
50 -
74
75 -
99
28
18
0
5
10
15
20
25
30
35
40
45
Figure 16: GRP Year Built Distribution (n=160)68
Decade Built
Pro
pe
rty
Co
un
t
1 2 1 1 4 2 1
6
47
29
59
7
0
10
20
30
40
50
60
70
1901 -
10
1911
- 20
1921 -
30
1931 -
40
1941 -
50
1951 -
60
1961 -
70
1971 -
80
1981 -
90
1991 -
00
2001 -
10

JUNE 2014
PAGE 39
69 The“fuelcode”indicateswhichfuelsareusedforCooling,Heating,andDomesticHotWater,respectively.E=electricity,G=gas,O=fueloil.
Utilities Used on SiteBuildings varied in terms of which fuels were used. The three most common utility fuel types in the GRP data set were:
1) Electric cooling, natural-gas heating, and natural-gas domestic hot water (EGG fuel code).69
2) All-electric properties (EEE fuel code)
3) Electric cooling, electric heating, and natural-gas domestic hot water (EEG).
The distribution of fuel types in the GRP data set is shown in Figure 17 below.
GRP Installed MeasuresTable 16 shows the percentage of GRP properties that implemented each type of improvement. The improvements are categorized and presented in order of the most widely implemented types. By design, the GRP promoted the replacement of energy intensive equipment, with a large percentage of properties replacing heating, cooling, and domestic hot-water equipment, lighting, windows, fans, refrigerators, etc., as shown on the following page.
Figure 17: Fuel Type Distribution (GRP)
Pro
pe
rty C
ou
nt
97
42
33
2 2 1 1 1
0
20
40
60
80
100
120
E-G-G E-E-E E-E-G E-G-E E-O-O E-E-O E-O-G G-G-G
Fuel Code
Cooling - Heating - DHW
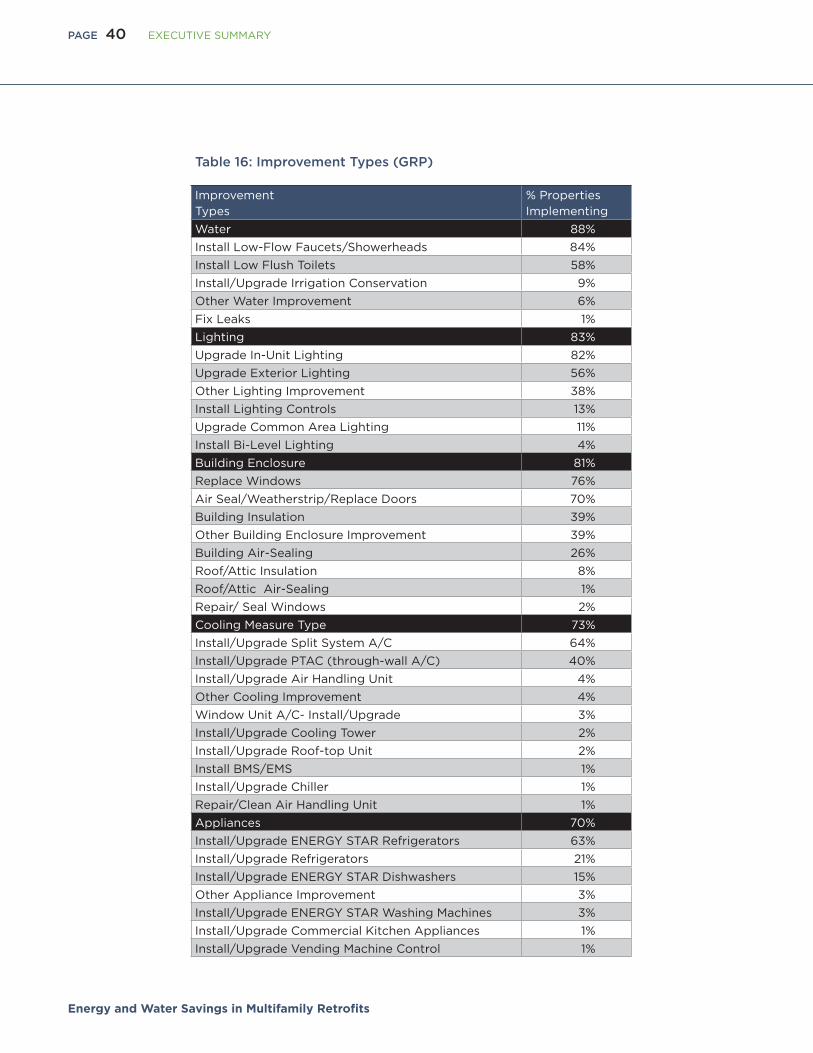
Energy and Water Savings in Multifamily Retrofits
PAGE 40 EXECUTIVE SUMMARY
Table 16: Improvement Types (GRP)
Improvement Types
% Properties Implementing
Water 88%
Install Low-Flow Faucets/Showerheads 84%
Install Low Flush Toilets 58%
Install/Upgrade Irrigation Conservation 9%
Other Water Improvement 6%
Fix Leaks 1%
Lighting 83%
Upgrade In-Unit Lighting 82%
Upgrade Exterior Lighting 56%
Other Lighting Improvement 38%
Install Lighting Controls 13%
Upgrade Common Area Lighting 11%
Install Bi-Level Lighting 4%
Building Enclosure 81%
Replace Windows 76%
Air Seal/Weatherstrip/Replace Doors 70%
Building Insulation 39%
Other Building Enclosure Improvement 39%
Building Air-Sealing 26%
Roof/Attic Insulation 8%
Roof/Attic Air-Sealing 1%
Repair/ Seal Windows 2%
Cooling Measure Type 73%
Install/Upgrade Split System A/C 64%
Install/Upgrade PTAC (through-wall A/C) 40%
Install/Upgrade Air Handling Unit 4%
Other Cooling Improvement 4%
Window Unit A/C- Install/Upgrade 3%
Install/Upgrade Cooling Tower 2%
Install/Upgrade Roof-top Unit 2%
Install BMS/EMS 1%
Install/Upgrade Chiller 1%
Repair/Clean Air Handling Unit 1%
Appliances 70%
Install/Upgrade ENERGY STAR Refrigerators 63%
Install/Upgrade Refrigerators 21%
Install/Upgrade ENERGY STAR Dishwashers 15%
Other Appliance Improvement 3%
Install/Upgrade ENERGY STAR Washing Machines 3%
Install/Upgrade Commercial Kitchen Appliances 1%
Install/Upgrade Vending Machine Control 1%

JUNE 2014
PAGE 41
Table 16: Improvement Types (GRP) Continued
Improvement Types
% Properties Implementing
Ventilation 69%
Install/Upgrade Fans 19%
Install/Upgrade Air-Handling Unit 7%
Other Ventilation Measure 7%
Install/Upgrade Ventilation Register 3%
Clear/Repair/Seal Ducts 1%
Install Heat Recovery Ventilator 1%
Install/Upgrade Ventilation Controls 1%
Heating 63%
Install New Thermostat/Controls 45%
Install New Heating Equipment 37%
Other Heating Improvement 4%
Install/Upgrade Radiators 2%
Install TRVs (Thermostatic Radiator Valves) 1%
Insulate Boiler/Furnace 1%
Tune/Calibrate Controls 1%
Domestic Hot Water 60%
Install/Upgrade Water Heater 50%
Insulate DHW Pipes 11%
Install/Upgrade Mixing Valve 5%
Install/Upgrade Heat Pump Water Heater 4%
Other Domestic Hot Water Improvement 2%
Install/Upgrade DHW Controls 1%
Install Flue Damper 1%
Balance Pipes/Distribution System 1%
Repair/Clean Water Heater 1%
Onsite Generation 12%
Install Solar PV System 11%
Install Cogeneration System 1%
Install Solar Thermal System 1%
Install Fuel Cells 1%
Install Wind Turbine 1%
Pumps/Motors Measure Type 8%
Upgrade/Improve Elevators 3%
Install/Upgrade Pumps/Motors 4%
Install High-Efficiency/VFD Pumps/Motors 1%
Reduce Elevator Operating Hours 1%

Energy and Water Savings in Multifamily Retrofits
PAGE 42 EXECUTIVE SUMMARY
GRP Marginal Cost of Installed MeasuresThe distribution of the GRP’s retrofit costs per unit is shown in Figure 18. The median cost of the installed measures was $2,463/unit with the middle half (25th to 75th percentile) showing a range from $1,606 to $3,842/unit.
Figure 19 compares the marginal cost to the total cost of improvements by category. In most cases, the marginal cost is less than half of the full cost of improvements. The exception is on-site genera-tion (e.g., solar, cogeneration) for which the marginal cost equals the full cost, as the energy savings are generally the only consideration driving the installation of these systems.
Figure 18: Energy and Water Upgrade Spending Distribution— Marginal Cost (GRP)
9
14 14
24 23
17
11 12
4
2
6 7
1
4
0 1
2
0 1
2
8
30
25
20
15
10
5
0
$0 -
500
$500 -
1000
$1000 -
1500
$150
0 - 20
00
$2000- 2
500
$250
0- 3000
$3000- 3
500
$350
0- 4000
$4000- 4
500
$450
0- 5000
$5000 -
5500
$550
0 - 6000
$6000 -
6500
$650
0 - 70
00
$7000 -
7500
$750
0 - 80
00
$8000 -
8500
$850
0 - 9000
$9000 -
9500
$950
0 - 10
,000
> $10
000
Marginal Cost of Upgrades per Units ($/unit)
Pro
pe
rty C
ou
nt

JUNE 2014
PAGE 43
GRP SAVINGS RESULTS
Figure 20 shows the shift in energy use intensity for the GRP data set. The overall post-retrofit efficiency improvement is clearly visible, although a number of properties remain high on the energy intensity scale. A more pronounced improvement in water efficiency is shown in Figure 21, although a small number of very high-water users remain.
Figure 19: Full Cost Compared to Marginal Cost by Improvement Type
$10,000,000
$20,000,000
$30,000,000
$40,000,000
$50,000,000
$60,000,000
$-
Build
ing E
nclo
sure
Cooling
Hea
ting
Dom
estic
Hot W
ater
Ventil
atio
n
Wat
er
Light
ing
ONsite
Gen
erat
ion
Applia
nces
Pumps/
Moto
rs
Measure Category
GR
P Im
pro
vem
ent
Sp
end
ing
($
)
Full Cost ($)
Marginal Cost ($)
Figure 20: Energy Use Intensity Shift (GRP)
0
10
20
30
40
50
60
70
80
0 - 18
19 -
36
37 - 55
56 - 73
74 -
91
92 - 10
9
110 -
127
128 -
145
146 -
164
165 -
182
183 -
200
> 200
Pro
pe
rty
Co
un
t
More Efficient EUI (kBTU/sqft/yr) Less Efficient
Pre Rehab EUI (Baseline) Post Rehab EUI I

Energy and Water Savings in Multifamily Retrofits
PAGE 44 EXECUTIVE SUMMARY
Figure 22 and Figure 23 show the distribution of the simple payback period (SPP) for energy and water measures in the GRP data set based on achieved first-year savings. Eleven properties showed energy use increases and 22 properties showed water use increases, and so will not “pay back” the cost of upgrades unless performance improves over time.
Figure 22: Total Energy Simple Payback Period (SPP) (years) (n=172)
16
38
20
14 16
5 7 7
3 4 2 3
1 3
22
11
0
5
10
15
20
25
30
35
40
0 -5
6 - 10
11 - 1
5
16 -
20
21 -
25
26 -
30
31 -
35
36 -
40
41 - 4
5
46 - 50
51 -
55
56 -
60
61- 6
5
66 - 70
> 75
Energ
y us
e in
crea
se
Pro
pe
rty
Co
un
t
Simple Payback Period (SPP) (years)
Figure 21: GRP Water Use Intensity Shift Pre- vs. Post-Retrofit (n=162)
0 - 18
19 -
36
37 - 55
56 - 73
74 -
91
92 - 10
9
110 -
127
128 -
145
146 -
164
165 -
182
183 -
200
> 200
Pro
pe
rty
Co
un
t
More Efficient EUI (kBTU/sqft/yr) Less Efficient
Pre Rehab EUI (Baseline) Post Rehab EUI I
0 5
10 15
20 25 30 35 40 45
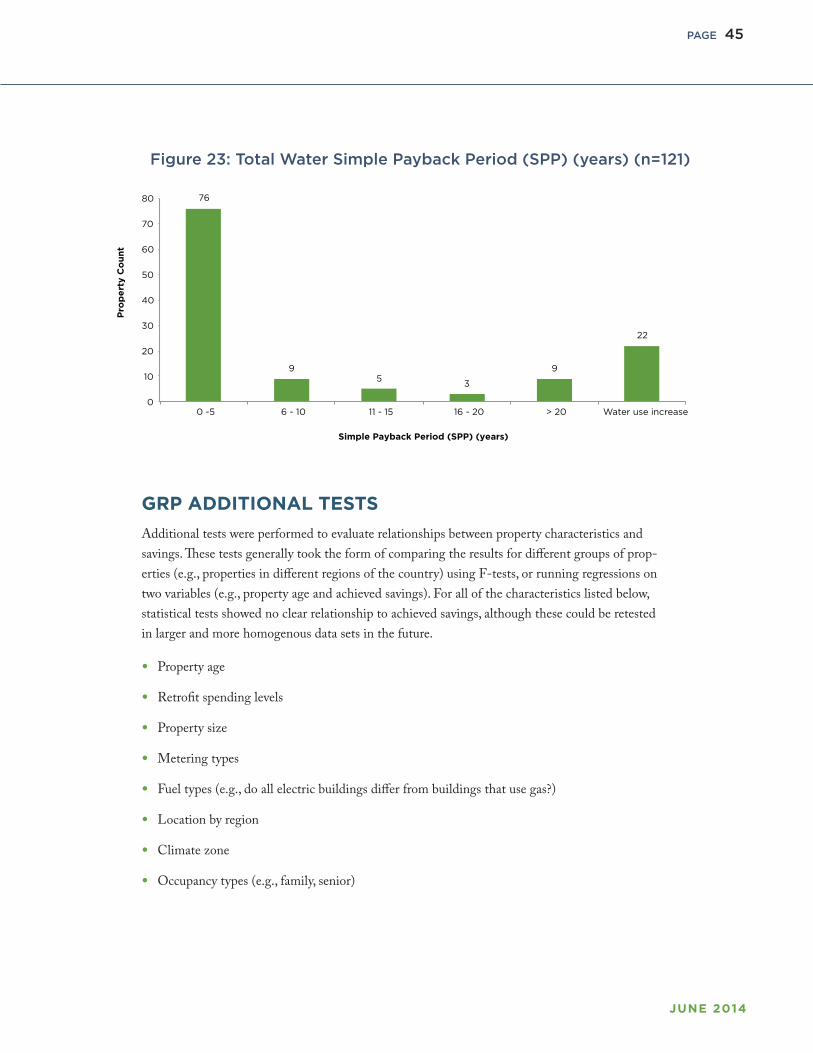
JUNE 2014
PAGE 45
GRP ADDITIONAL TESTS
Additional tests were performed to evaluate relationships between property characteristics and savings. These tests generally took the form of comparing the results for different groups of prop-erties (e.g., properties in different regions of the country) using F-tests, or running regressions on two variables (e.g., property age and achieved savings). For all of the characteristics listed below, statistical tests showed no clear relationship to achieved savings, although these could be retested in larger and more homogenous data sets in the future.
• Property age
• Retrofit spending levels
• Property size
• Metering types
• Fuel types (e.g., do all electric buildings differ from buildings that use gas?)
• Location by region
• Climate zone
• Occupancy types (e.g., family, senior)
Figure 23: Total Water Simple Payback Period (SPP) (years) (n=121)
Pro
pe
rty
Co
un
t
Simple Payback Period (SPP) (years)
76
9 5
3
9
22
0
10
20
30
40
50
60
70
80
0 -5 6 - 10 11 - 15 16 - 20 > 20 Water use increase

70 Only53oftheEnergySaverspropertiesprovidedinformationontheyearofconstruction.
Energy and Water Savings in Multifamily Retrofits
PAGE 46
AgeThe majority of the buildings in the Energy Savers data set (72%) were built before 1940, while others were built after 1980. The distribution of properties in this set by the year they were built is shown in Figure 24 below.
Initial Energy EfficiencyThe pre-retrofit owner-paid gas use intensity (GUI) of the Energy Savers properties ranged from 37 to 200 kBTU/sqft/year. The least energy consuming property used less than one-fifth as much gas as the highest energy consuming property before any retrofits were implemented (Figure 25 below).
Appendix B: Additional Energy Savers Data
Figure 24: Energy Savers Year Built Distribution (n=53)70
Figure 25: Pre-Rehab Site Gas Use Intensity Distribution (Energy Savers)
Pro
pe
rty
Co
un
t
Decade Built
4
0
12
24
2
0 1
0 0 1
3
6
0
5
10
15
20
25
30
1901 -
10
Pre -
1900
1911
- 2
0
1921 -
30
1931 -
40
1941 -
50
1951 -
60
1961 -
70
1971 -
80
1981 -
90
19
91 - 2
000
2001 -
10
1
4
10 10
17
6
4 3
2
0
2
4
6
8
10
12
14
16
18
37 - 55
56 - 73
74 -
91
92 - 10
9
110 -
127
128 -
145
146 -
164
164 -
182
183 -
200
GUI (kBTU/sqft/yr)
Pro
pe
rty
Co
un
t

JUNE 2014
PAGE 47
ENERGY SAVERS INSTALLED IMPROVEMENTS
Table 17 shows the percentage of properties that implemented each type of improvement according to building system category. A mix of equipment replacement, controls replacement, distribution system upgrades, and tune-ups or repairs is seen in all categories.
Table 17: Improvements Types (Energy Savers)
Improvement Types
% Properties Implementing
Heating 84%
Upgrade Boiler Controls 44%
Install/Upgrade Boiler/Furnace 40%
Insulate Pipes/Ducts 23%
Repair/Clean/Tune Boiler/Furnace 21%
Other Heating Improvement 9%
Install/Upgrade Thermostat 7%
Install/Upgrade Controls 7%
Repair/Clean/Correct Pitch of Radiators 7%
Install/Upgrade Burner 5%
Install/Upgrade Radiators 4%
Tune/Calibrate Controls 2%
Adjust Heating System Temperature 2%
Building Enclosure 77%
Insulate Roof/Attic 37%
Replace Windows 26%
Air-Seal Roof/Attic 25%
Insulate Building 12%
Air Seal/Weatherstrip/Replace Door 12%
Other Building Enclosure Improvement 11%
Air-Seal Building 5%
Air-Seal Windows 5%
Repair Windows 2%
Domestic Hot Water 42%
Insulate Pipes/Distribution System 19%
Install/Upgrade Water Heater 19%
Other Domestic Hot Water Improvement 11%
Reduce/Adjust Temperature Setting 5%

71 DeutscheBankandLivingCities.“RecognizingtheBenefitsofEnergyEfficiencyinMultifamilyUnderwriting.”(2011)https://www.db.com/usa/img/DBLC_Recognizing_the_Benefits_of_Energy_Efficiency_01_12.pdf.
TheDB/LCstudyfrom2012analyzedpre-andpost-retrofitdata,aswellasprojectedversusachievedsavings,for104buildingsinNYCthathadundergoneweatherizationorNYSERDA-supportedretrofits.ThebuildingsintheDB/LCstudyaresimilartothebuildingsintheEnergySaversdataset:early20thcenturyconstructionwithcentralheatandhot-watersystems.AllDB/LCbuildingshadcentral,owner-paidheatandhot-watersystemsusinggas,oil,ordistrictsteam,andtenant-paidelectricity.Retrofitsfocusedmainlyonheatandhot-watersystems,withsomecommonarealighting,ventilation,orenvelopeworkaswell.
72 Robbins,Lindsay,andBetsyParrington.“RealizingMeasurableSavingsinMultifamilyBuildings:ResultsfromNYSERDA’sMultifamilyPerformanceProgram.”Forthcoming2014.Atotalof219propertieswereanalyzedthatparticipatedinNYSERDA’sMPP.Propertiesareamixofaffordable(84%)andmarket-rate(16%)housinglocatedinNYC(33%)andupstateNY(67%),withcloseto50%ofunitsinNYC.Theupstateportionofthedatasetincludesamorediversesetofbuildingtypesincludingsomegarden-stylecomplexes.Inordertoreceiveanyincentivestooffsetthecostofupgrades,projectshadtoprojectatleast20%savings,arequire-mentthatmayhaveincreasedthedepthofsavingsintheprogram.Theprogramalsoprovidesafinancialincentivebasedonachievedsavings.
73 LocalInitiativesSupportCorporation,“GreenRetrofitInitiativeSummaryEvaluationReport”,August2013.TheGreenRetrofitInitiativefocusedonretrofitsofMassachusettsbuildingswithcentralheatandhot-watersystems,andincludedupgradestargetinggas,electricandwatersavings.
Energy and Water Savings in Multifamily Retrofits
PAGE 48
While this study is the only known effort to analyze the performance of a nationwide multifamily building retrofit program, there are a growing number of regional programs that have documented pre- and post-retrofit energy analysis data. Primary results from three such data sets are shown in Table 18 alongside the GRP and Energy Savers programs: The Deutsche Bank/Living Cities (DB/LC) study of NYC buildings,71 a forthcoming study from the NY State Energy Research and Development Authority (NYSERDA) on its state-wide Multifamily Performance Program (MPP),72 and a program evaluation on the Massachusetts Green Retrofit Initiative (MGRI) from the Local Initiatives Support Corporation (LISC).73
Not surprisingly, the scopes of work and the methodologies used among various programs varied widely. For example, only the GRP and MPP analyses included tenant-energy consumption and only the GRP and MGRI included water savings. In addition, only the GRP, DB/LC, and MPP studies included the calculation of realization rates. The extent of weather-normalization per-formed also varied significantly between these studies. Notably, the GRP is the only national data set, and the only data set with properties outside of the heating-dominated northern climates.
Despite these differences, some common themes appear across all five data sets, which bear confir-mation through future studies, or more meta-analysis:
• Program-wide savings vary between roughly 10% and 25% across a range of program types, locations, and levels of investment.
• The observed realization rates across the GRP and DB/LC are very close (64% and 61% respec-tively). However, due to potential changes in the scopes of work in the GRP program we are unable to provide a true meta-analysis of realization rates across the programs. The NYSERDA MPP realization rate is higher (87%), which is possibly the result of very tight energy modeling standards and technical oversight, as well as a financial incentive that is awarded on the basis of achieved savings. Further research would be needed to identify the specific factors that impact realization rates.
Appendix C: Other Multifamily Energy Program Data Sets

• Gas savings as a percentage reduction from pre-retrofit levels are greater than electric savings in all programs. Interestingly, this is true both for the studies that considered only owner-paid electricity (DB/LC and MA Green Retrofit), and those that included tenant-paid electricity (GRP and MPP). It is not clear whether this is because electric savings opportunities are more limited, harder to achieve, or are more easily masked by other factors.
JUNE 2014
PAGE 49
74 HUDGRPscopesofworkmayhavechangedafterenergysavingsprojectionsweremade,meaningthatthecalculatedrealizationratecannotbeusedtoassesstheaccuracyofenergysavingsprojections.
75 Thenumberofpropertieswasnotreported.
Table 18: Comparison to Other Multifamily Retrofit Data Sets
Data set# of
Properties LocationUtilities
Analyzed
Measured Energy
ReductionRealization
Rate74
HUD GRP 179 National
Gas, electric,
water: owner
and tenant
19% gas, 16% electric 26% water
64%
Energy Savers
57 Chicago areaGas:
owner only26% gas n/a
Deutsche Bank/Living
Cities104 NYC
Gas, electric:
owner only
19% gas/oil,
7% electric61%
NYSERDA
MPP219 NY state
Gas, electric:
owner and
tenant
28% gas/oil,
17% electric87%
MA Green
Retrofit
Initiative
148
buildings75 MA
Gas, electric:
owner only
22% gas
11% electric
14% water
n/a

Energy and Water Savings in Multifamily Retrofits
PAGE 50
AVAILABLE DATA
Figure 26 depicts the types of information that were available for this study, as well as some key pieces of data that were not made available. This was either because they were not collected and recorded by the programs, or because they would require a time-consuming extraction from pro-gram documents beyond the scope of this effort.
Figure 26: Data Availability and Gaps
Several key pieces of information, shown in the gray boxes above, were unavailable for this analysis, which limited our ability to assess and evaluate program data:
• Without energy and water saving projections based on the energy efficiency measures that were actually installed, we were unable to properly assess the accuracy of energy savings projections. GRP projects were required to pursue only 75% of the recommended measures based on cost and, according to HUD program administrators, often did not pursue all of the recommendations.
Appendix D: Methodology Details
• Without post-retrofit occupancy information, we were unable to normalize for changes in building populations that may have impacted energy and water consumption.
• Without information on other unrelated changes taking place at the property that may have impacted energy and water consumption, we cannot be sure that the changes resulted only from the implemented scopes of work.
Data QualityAfter an initial review, Bright Power corresponded with HUD and Elevate Energy to clarify any missing or suspect information. Once the data was confirmed by HUD or Elevate Energy, we were cautious in eliminating properties from the study, even when the results for certain properties were surprising. Given our use of anonymous data and our inability to directly contact properties to confirm information, we decided to eliminate some properties with complete data from the savings analysis for the following reasons:
• Some properties had an unexplained mismatch in the number of owner-paid utility accounts before and after the retrofit and were removed from the analysis unless the utility account contained less than 3% of the property’s energy consumption. The changing quantities of utility accounts suggest that we could be missing utility information before or after the retrofit, which could have skewed our calculation of savings. Tenant-paid utility accounts also varied, but these were normalized to 100% of units both before and after retrofits to avoid such skewing.
• The energy consumption before or after the retrofit appeared to be unrealistically high or low at some properties, which suggested some type of data quality problem. We used EnergyScore-Cards’ thresholds for flagging unrealistic energy consumption, which are based on data from over 5,000 multifamily properties nationwide.
• For the analysis of realization rates, we removed properties that projected more than 100% savings in energy consumption for tenant or owner energy, unless the scope of work showed an onsite generation installation that could have plausibly made the property a net energy exporter.
• For the GRP cost-effectiveness analysis, we removed properties with implausible marginal cost data, as described in the Cost-effectiveness Approach section (page 54).
After eliminating properties based on the criteria above, the final data set for savings analysis included:
• 179 GRP properties
• 57 Energy Savers properties76
JUNE 2014
PAGE 51
76 NoEnergySaverspropertieswereexcludedfromtheanalysisbasedonthedescribedcriteria.

77 See“InternationalPerformanceMeasurement&VerificationProtocol:ConceptsandOptionsforDeterminingEnergyandWaterSavings.”VolumeI,RevisedMarch2002,pp.27–28;http://www.nrel.gov/docs/fy02osti/31505.pdf
Energy and Water Savings in Multifamily Retrofits
PAGE 52 APPENDIX D
QUANTIFYING ENERGY AND WATER SAVINGS
Whole Building Utility Bill AnalysisThis study uses utility bill information to quantify achieved energy and water savings, i.e., the change from pre- to post-retrofit energy and water consumption. The use of pre- and post-retrofit utility bill data is one of four methods established by the International Performance Measurement and Verification Protocol.77 Utility bill analysis could be performed without visiting properties and made use of a ready source of data available from each program. This approach, however, has inherent limitations:
• Utility bill analysis alone cannot isolate retrofit savings from other changes that may have occurred at the property. To the extent possible, we use normalization to minimize these skew-ing factors as described below.
• Utility bill analysis generally does not allow for a measure-level savings analysis because there are usually many improvements associated with a single utility meter. This report largely pres-ents savings at the property level, but also reports savings separately by fuel (electric, gas) and separately for owner-paid and tenant-paid utility bills.
NormalizationIn order to accurately quantify energy and water savings from retrofits using utility data, it is important to account for outside factors that may affect energy and water consumption.
Weather Normalization
EnergyScoreCards software compares weather-normalized energy consumption between the pre- and post-retrofit years in order to remove the effect of weather changes on savings calcu-lations. Weather-normalized consumption represents the amount of energy the building would have used in a year with typical weather, given building efficiency in the pre- or post-retrofit year. (See page 58 for additional description of weather analysis in EnergyScoreCards.) The process of weather-normalization means that different dates of retrofits between properties do not impact the calculations, since all comparisons are made assuming the same weather in both pre- and post-ret-rofit years.
Occupancy Normalization on Owner Accounts
As noted in Figure 12 (page 29), Bright Power received pre-retrofit occupancy information for the GRP properties, and neither pre- nor post-retrofit occupancy information for the Energy Savers properties. For this reason, owner-paid utility bills (e.g. master-metered buildings, common area
JUNE 2014
PAGE 53
78 Twopropertiesthatreportedlessthan75%occupancyinthepre-retrofityearwereremovedfromtheanalysis.Thislowfigureincreasedthechancesofsignificantlyincreasedoccupancyanddistortedenergyconsumptioninthepost-retrofityear.
79 Forinstance,iftherewereten(10)two-bedroomunitsinaproperty,andwereceiveddataononlysixoutoftenunits,thetotalenergyconsumptionforthosesixunitswasmultipliedby(10/6)toestimatetotaltwo-bedroomenergyconsumptionattheproperty.
80 EIArateswereusedfor41propertiesintotal.
meters, or central systems) could not be adjusted for occupancy.78 Our experience performing occupancy adjustments as a contracted vendor for over 100 GRP and Mark-to-Market Green Initiative projects suggests that, in most cases, changes in occupancy do not significantly change common area and central HVAC energy consumption.
Occupancy Normalization on Tenant Apartment Accounts
The GRP program required the collection of a 50% sample of tenant-paid apartment utility accounts. In most cases, the number and types of specific accounts available before and after the retrofits differed. We used EnergyScoreCards to scale tenant utility consumption from the sample available to 100% occupancy based on the total number of units of each type at the property.79 Thus, changes in the number of apartments with available data before and after the retrofit should not have impacted the savings numbers reported here except to the extent that occupancy changes correlated with behavioral changes (i.e., tenants who moved out were more efficient in their con-sumption behaviors than tenants who moved in). While this may have impacted realization rates at specific properties, it would not be expected to lead to lower than average tenant realization rates across the portfolio, since changing behaviors could swing energy use either up or down.
Energy Price Normalization
To avoid any skewing effect of changing energy prices (and because cost data was not available for all properties) all energy and water savings calculations were performed based on consumption data (e.g., kWh, therms, gallons). In order to quantify the cost savings, pre-retrofit prices were applied to the pre- and post-retrofit consumption. For the GRP data set, the pre-retrofit rates were provided by HUD for most properties, and if property-specific information was missing or unusually low, a typical rate from the Energy Information Administration (EIA) for the region was used instead.80 The rates provided by HUD were specified according to the utility type and payer (e.g., we received a separate rate for the owner-paid electric accounts and tenant-paid electric accounts).
Gas expenditure data was not available for the Energy Savers properties. A rate of $0.90 per therm was used as an approximation of Chicago-area gas prices in the pre-retrofit year in order to estimate the value of gas savings for Energy Savers properties. With declining gas prices in recent years, the value of the energy savings during the post-retrofit year may have actually been slightly less than $0.90/therm. However, using the pre-retrofit rate captures the prices used in determining the scopes of work (see discussion in the following section).

Energy and Water Savings in Multifamily Retrofits
PAGE 54 APPENDIX D
COST-EFFECTIVENESS APPROACH
GRP: Marginal Cost (“Green Premium”) Data
The GRP used the marginal cost of a measure in cost-effectiveness calculations (i.e., the cost difference between a green and conventional upgrade), also referred to as “incremental cost” or “green premium.” This approach is typically used for projects where equipment has reached the end of its useful life and will be replaced regardless of energy or water savings. In these cases, utility savings are only driving the choice of a green or energy efficient product and so must only justify the marginal cost of green upgrades. In situations where the improvement is only undertaken to achieve energy or water savings (e.g., onsite solar PV systems, certain types of controls or insula-tion) the marginal cost equals the full cost.
Marginal-cost information is inherently less precise than full cost information as it represents estimates made by a consultant or contractor comparing prices for one upgrade to a hypothetical alternative that was not pursued. For this analysis we removed properties for which the total marginal cost was negative or more than 100% of the fully-implemented package cost for either energy or water measures, which suggested gross errors in the marginal cost estimates provided. This additional filter reduced the number of properties included in cost-effectiveness analysis from 173 to 172 for energy calculations, and from 157 to 131 for water cost-effectiveness calculations.
Excluding Non-Efficiency Upgrade Costs
Many items in the GRP scopes of work were not energy or water saving measures (e.g., recycled materials, low-VOC paints, etc.). Non-energy and water saving measures and their associated costs were removed from this analysis as the quantification of non-utility benefits were deemed to be outside the scope of this study.
Elevate Energy: Full-Cost Data
The Energy Savers program used the full cost of measures in their cost-effectiveness calculations and only energy efficiency measures were included in the program. Energy Savers used full-cost data because energy savings were the main reason for completing the work even though some equipment had remaining years of useful life. Therefore, our analysis of the Energy Savers prop-erties uses the full cost of measures to assess cost-effectiveness and does not exclude any measures included in the scopes of work.

JUNE 2014
PAGE 55
81 Seeadiscussionofwaterpricesandissuesina2012EPAtechnicalworkshoppresentation:“AReviewofHistoricalWaterPriceTrends,”http://water.epa.gov/action/importanceofwater/upload/19-Maxwell.pdf
82 Thisisa3%nominaldiscountrateasitdoesnotadjustforinflation.
83 See“EnergyPriceIndicesandDiscountFactorsforLife-CycleCostAnalysis–2013,”NaturalInstituteofStandardsandTechnology:http://www1.eere.energy.gov/femp/pdfs/ashb13.pdf
Assumptions for Cost-Effectiveness Calculations
The lifecycle cost-effectiveness metrics used in this report, Savings-to-Investment Ratio (SIR) and Cost of Energy and Water Saved, require several assumptions for calculations. The assumptions used and the basis of these choices are described below:
• Energy and water prices are assumed to escalate at 2% per year. Data from the U.S. Energy Information Administration (EIA) for electricity shows an overall price increase since 1990 equivalent to an annual escalation of approximately 2%, and approximately 3% since 2000. For natural gas, the overall price increase since 1990 is equivalent to an annual escalation of more than 2.5%, and more than 3% since 2000, even with price declines in recent years. Water prices have risen by 5% to 10% annually in recent years, although the variation between different locations is typically more dramatic than energy prices given highly localized water utilities.81 In this context, 2% seems like a reasonable, conservative assumption for future energy and water price escalation, though future prices are unknowable.
• Annual savings persist at first-year levels for the lifetime of the improve-
ments. While energy performance is sure to vary from year-to-year, we have no data to suggest a consistent degradation of energy savings, or conversely, that properties might correct problems and improve performance over time.
• Discount rate = 3%.82 We used the Department of Energy’s discount rate of 3% in all cost- effectiveness calculations.83 While lower than the rate used by private investors, this rate is used in the Federal Energy Management Program and followed by many energy programs around the country. Because of the relationship between discount rate and energy price escalation, our conclu-sions would remain true using a higher energy price escalation and a higher discount rate.
• Estimated Useful Life (EUL) = 20 years. When projecting the life-cycle cost- effectiveness of proposed energy efficiency measures, separate EUL figures are used for each type of improvement. In this report, we estimated lifecycle savings based on actual first-year energy savings for the entire package of improvements at each property. Since each package includes several improvements with different EULs, we calculated a program average EUL for all measures installed across the GRP and Energy Savers portfolios, weighted by the total program-wide expenditures for each improvement type, which came out to 20 years. While this estimated EUL will not apply perfectly to every project (as the scopes of work varied), it seemed a reasonable assumption given available data, and our intent to estimate the cost-effectiveness of improvements across the entire programs, and not just for individual properties. To do this weighting, standard EULs for each improvement type were used that were primarily drawn from the Fannie Mae Physical Needs Assessment EUL table. EULs for some improvement

Energy and Water Savings in Multifamily Retrofits
PAGE 56 APPENDIX D
types not found in the Fannie Mae list were drawn from the New York State Energy Research and Development Authority Multifamily Performance Program EUL Table, values found on the U.S. Department of Energy’s website (energy.gov), and the New York State Energy Efficiency Portfolio Standard.
STATISTICAL TESTS
In order to test the significance of observed patterns in the data, we used regressions and F-tests.
Regressions are a statistical tool used to investigate possible relationships among variables. In this study, linear regressions were used to identify the direction and slope of possible correlations. For example, the variables of building age and achieved savings were plotted and a linear regression applied. This regression showed an increase in savings in older buildings in the Energy Savers data set, but not the GRP data set. The strength of the correlation, indicated by the R2 value, tells us how much of the change is explained by the variable.
F-tests were used to determine if different populations of buildings performed similarly or differ-ently. The F-test analyzes the variance in two sets of data and determines the likelihood of those data sets being drawn from the same population. An F-test value of <0.05 rejects the null hypoth-esis that the two samples are drawn from the same normally distributed population, i.e. an F-test of <0.05 shows that the two samples are distinct. For instance, when F-tests were used to compare savings between properties with different occupancy types, the F-test value was greater than 0.05, and so may not be distinct—even if the averages or median values were slightly different. In this analysis, F-tests were used only as a general indicator, as the populations may not be completely normally distributed. F-tests results are not listed in the report, but we have only highlighted dif-ferences between groups where F-test values were <0.05.
ENERGYSCORECARDS SAMPLES
Energy EventsAll retrofit measures for GRP and Energy Savers projects in this study were entered into EnergyScoreCards as one of 91 pre-defined Energy Events (see sample in Figure 27). Grouping the improvements into common categories allowed for the analysis of measures across the portfolio. Energy Events included dates of installation and the cost of each improvement. The projected savings amount was provided by HUD only at the project level. While projected savings for each measure (in both cost and consumption) can be entered into EnergyScoreCards, they were not available for this analysis.

JUNE 2014
PAGE 57
Figure 27: Sample “Energy Event” Package for a GRP Property
The EnergyScoreCards DatabaseThe EnergyScoreCards database is currently composed of approximately 5,000 properties located in 49 states and the District of Columbia. The EnergyScoreCards database covers approximately 500,000,000 square feet and contains properties with approximately 500,000 residential units. Properties in EnergyScoreCards are benchmarked against a peer group of properties that are also in the EnergyScoreCards database based on geographic location, occupancy type, and physical attributes (such as metering configuration).

Energy and Water Savings in Multifamily Retrofits
PAGE 58 APPENDIX D
Weather Normalization in EnergyScoreCardsEnergyScoreCards provides weather-normalized analysis so that results portray changes in efficiency and not variations in weather. EnergyScoreCards’ approach to weather normalization, described below, conforms with the IPMVP, the American Society of Heating Refrigeration and Air-conditioning Engineers (ASHRAE), the Building Performance Institute (BPI), and industry best practices.
Once utility bill data is loaded into the system, EnergyScoreCards runs a multi-variable regression of each energy account against local weather data for the specific dates included in each utility bill. This analysis was performed separately for the pre-retrofit and post-retrofit years in the GRP and Energy Savers data sets to create two models of energy performance for each energy account.
This model takes the form of an equation:
Energy consumption = A*CDD + B*HDD + C*Days, where:
A = cooling coefficientB = heating coefficientC = baseload (non-seasonal) coefficientCDD = Cooling Degree DaysHDD = Heating Degree DaysDays = # of days in billing period
Figure 28 shows a sample of a weather analysis page in EnergyScoreCards. This display includes a comparison of actual utility bills (black line in top graph) to the model (green line in top-graph), local HDD (red line in middle graph) and CDD (blue line in middle graph), and a graph of the annual disaggregated electric consumption (bottom).
In order to ensure the accurate analysis of pre- and post-retrofit energy consumption at each prop-erty, a visual inspection of the “fit” between the model and actual utility data was performed for large utility accounts. A poor fit on a utility account means that consumption varied in ways that were not related to weather or time and can indicate changes in efficiency, use of the property, or billing errors, which, in some cases, can make accurate savings analysis impossible.

JUNE 2014
PAGE 59
Figure 28: Weather-Based Regression and Energy End Use Separation (EnergyScoreCards, sample electric account)
The models of building performance for the pre- and post-retrofit years were each applied to weather data for a typical meteorological year from the National Oceanographic and Atmospheric Association (NOAA), which is used as a standard for energy savings projections.
This approach is similar to the IPMVP Option C whole building analysis methodology.84 IPMVP Option C applies the pre-retrofit equation to the weather data for the post-retrofit year and compares that to the actual utility bills in the post-retrofit year. This is appropriate for determining the actual savings for a particular property in a particular year. In our case, we used typical weath-er-year data to normalize both pre- and post-retrofit performance. This enabled us to calculate and aggregate savings across a large set of properties with different time periods of utility data, unskewed by weather, and therefore more representative of the anticipated savings over the life-times of the retrofit projects.
84 SeeEfficiencyValuationOrganization:http://www.evo-world.org/index.php?option=com_content&view=article&id=272&Itemid=504&lang=en