Energy And Water Recovery With Transport Membrane ... · Energy and Water Recovery with Transport...
88
Public Interest Energy Research (PIER) Program FINAL PROJECT REPORT ENERGY AND WATER RECOVERY WITH TRANSPORT MEMBRANE CONDENSER JANUARY 2013 CEC ‐ 500 ‐ 2013 ‐ 001 Prepared for: California Energy Commission Prepared by: Gas Technology Institute
-
Upload
nguyentuong -
Category
Documents
-
view
218 -
download
0
Transcript of Energy And Water Recovery With Transport Membrane ... · Energy and Water Recovery with Transport...

Publ ic Interest Energy Research (P IER) Program
FINAL PROJECT REPORT
ENERGY AND WATER RECOVERY WITH TRANSPORT MEMBRANE CONDENSER
JANUARY 2013CEC ‐500 ‐2013 ‐001
Prepared for: California Energy Commission Prepared by: Gas Technology Institute

Prepared by: Primary Author(s): Dexin Wang, PhD Gas Technology Institute 1700 South Mount Prospect Road Des Plaines, IL 60018 Phone: 847-768-0500 www.gastechnology.org Contract Number: 500-08-023 Prepared for: California Energy Commission
Leah Mohney Contract Manager Kiel Pratt Leah Mohney Project Managers Virginia Lew Office Manager Energy Efficiency Research Office Laurie ten Hope Deputy Director Energy Research and Development Division Robert P. Oglesby Executive Director
DISCLAIMER This report was prepared as the result of work sponsored by the California Energy Commission. It does not necessarily represent the views of the Energy Commission, its employees or the State of California. The Energy Commission, the State of California, its employees, contractors and subcontractors make no warrant, express or implied, and assume no legal liability for the information in this report; nor does any party represent that the uses of this information will not infringe upon privately owned rights. This report has not been approved or disapproved by the California Energy Commission nor has the California Energy Commission passed upon the accuracy or adequacy of the information in this report.

i
ACKNOWLEDGEMENTS
This work was jointly supported by U.S. Department of Energy and the Southern California Gas Company.
The project demonstration work is hosted by L & N Costumes and Linen Services.
Major project partners include Heat Transfer Solutions and Magus Consulting (DVBE).

PREFACE
The California Energy Commission Public Interest Energy Research (PIER) Program supports public interest energy research and development that will help improve the quality of life in California by bringing environmentally safe, affordable, and reliable energy services and products to the marketplace.
The PIER Program conducts public interest research, development, and demonstration (RD&D) projects to benefit California.
The PIER Program strives to conduct the most promising public interest energy research by partnering with RD&D entities, including individuals, businesses, utilities, and public or private research institutions.
PIER funding efforts are focused on the following RD&D program areas:
• Buildings End‐Use Energy Efficiency
• Energy Innovations Small Grants
• Energy‐Related Environmental Research
• Energy Systems Integration
• Environmentally Preferred Advanced Generation
• Industrial/Agricultural/Water End‐Use Energy Efficiency
• Renewable Energy Technologies
• Transportation
Energy and Water Recovery with Transport Membrane Condenser is the final report for the Energy and Water Recovery with Transport Membrane Condenser Project (Contract Number 500‐08‐023 conducted by Gas Technology Institute. The information from this project contributes to PIER’s Industrial/Agricultural/Water End‐Use Energy Efficiency Program.
When the source of a table, figure or photo is not otherwise credited, it is the work of the author of the report.
For more information about the PIER Program, please visit the Energy Commission’s website at www.energy.ca.gov/research/ or contact the Energy Commission at 916‐327‐1551.
ii

ABSTRACT
Gas Technology Institute has developed a transport membrane condenser for recovering both energy and water from the low‐grade waste heat streams that are present in many industrial processes. This transport membrane condenser heat and water recovery system has been demonstrated successfully for many industrial boiler applications. In this study, the technology was tested at a commercial laundry drying facility to recover both water and energy. This is the first time that this technology has been applied in a non‐boiler application. Design, fabrication, assembly, and laboratory validation work was accomplished at the Gas Technology Institute. The transport membrane condenser field demonstration system with control and data acquisition was installed and commissioned at L & N Costume and Linen Service in Southern California after laboratory validation was completed. Significant energy and water savings were reported during the long‐term system operation since the new waste heat and water recovery technology was installed in September 2009. About 50 gallons per hour of water and 0.5 million BTUs per hour of heat have been recovered. A commercialization path for this new technology to be used in California and across the United States has been evaluated. This project extended the transport membrane condenser application to broader areas, which will greatly enhance waste heat and water recovery potentials and will save both energy and water, thus benefitting the environment.
Keywords: Waste heat recovery, wastewater recovery, transport membrane condenser, low‐grade waste heat
Please use the following citation for this report:
Wang, Dexin. (Gas Technology Institute). 2013. Energy and Water Recovery with Transport Membrane Condenser. California Energy Commission. Publication Number: CEC‐500‐2013‐001.
iii

TABLE OF CONTENTS
ACKNOWLEDGEMENTS ...................................................................................................................... I
PREFACE ................................................................................................................................................... II
ABSTRACT ............................................................................................................................................. III
TABLE OF CONTENTS ........................................................................................................................ IV
LIST OF FIGURES ................................................................................................................................... V
LIST OF TABLES ................................................................................................................................... VI
EXECUTIVE SUMMARY ........................................................................................................................ 1
CHAPTER 1: INTRODUCTION ........................................................................................................... 1
1.1 BACKGROUND .................................................................................................................................... 1 1.2 TMC CONCEPT AND TECHNOLOGY DEVELOPMENT....................................................................... 2 1.3 TMC SYSTEM FOR BROADER APPLICATIONS ................................................................................... 7
CHAPTER 2: POTENTIAL HOST SITE EVALUATIONS ............................................................. 10
2.1 INTRODUCTION ................................................................................................................................ 10 2. 2 POTENTIAL HOST SITES WITH DETAILED EVALUATION ............................................................... 10
CHAPTER 3: SYSTEM DESIGN, FABRICATION AND INTEGRATION ................................ 15
3.1 CFD SIMULATION FOR TMC DESIGN AND PERFORMANCE ........................................................... 15 3.2 TMC MODULE ASSEMBLY AND PRE‐TEST ..................................................................................... 17 3.3 TMC SYSTEM DESIGN, FABRICATION AND INTEGRATION ............................................................ 18 3.4 TMC SYSTEM PRE‐TEST ................................................................................................................... 24
CHAPTER 4: INSTALLATION AND PARAMETRIC TEST ........................................................ 26
4.1 INSTALLATION AT THE HOST SITE .................................................................................................. 26 4.2 OPERATION AND CONTROL OF THE SYSTEM .................................................................................. 27 4.3 TMC SYSTEM SHAKE DOWN ........................................................................................................... 30 4.4 PARAMETRIC TEST RESULTS ............................................................................................................ 32
CHAPTER 5: LONG‐TERM MONITORING AND TRAINING .................................................. 35
CHAPTER 6: POTENTIAL MARKETS AND COMMERCIALIZATION .................................. 36
6.1 POTENTIAL MARKETS FOR TMC APPLICATIONS ........................................................................... 36 6.2 COMMERCIALIZATION ..................................................................................................................... 39
CHAPTER 7: GLOSSARY ..................................................................................................................... 43
APPENDIX A: WET SCRUBBER AND HIGH MOISTURE EXHAUST GAS MARKET FOR TMC TECHNOLOGY ............................................................................................................................ 44
iv

LIST OF FIGURES
Figure 1: TMC Concept Showing Cross Section of the Nanoporous Ceramic Membrane ............. 3
Figure 2: Photomicrograph of a Porous Ceramic Membrane Tube Cross‐Section .......................... 3
Figure 3: Comparison of Water Transport Rate in Knudsen Diffusion and Capillary Condensation Modes ................................................................................................................................. 4
Figure 4: Boiler Heat Recovery System Incorporating TMC............................................................... 5
Figure 5: Simplified Cross‐Section of TMC Version 1.0, Membrane Bundle, and Installed Field Unit ............................................................................................................................................................... 6
Figure 6: 3D View of TMC Version 2.0 Vessel Design and Prototype Tube Modules ..................... 7
Figure 7: TMC Installation Arrangement Layout for a Slip Stream Demonstration ..................... 11
Figure 8: L. & N. Costume and Linen Service Steam Tunnel ............................................................ 14
Figure 9: TMC Module Assembly Procedure ...................................................................................... 17
Figure 10: An Assembled Single TMC Module ................................................................................... 17
Figure 11: TMC Housing Assembling Drawing .................................................................................. 19
Figure 12: Assembled 9‐Module TMC Unit with Water Reservoir ................................................... 20
Figure 13: Hot Water Storage Tank for Receiving Hot Water from TMC ........................................ 22
Figure 14: TMC System Control Panel .................................................................................................. 23
Figure 15: TMC System P&ID ................................................................................................................ 24
Figure 16: TMC System GTI lab Pretest Setup ..................................................................................... 25
Figure 17: Overall Steam Tunnel with TMC Installed on the Top (Left Side of the Picture) ....... 26
Figure 18: Close‐up View of the TMC Unit Installed on top of Steam Tunnel ID Fan .................. 26
Figure 19: Typical TMC Inlet and Outlet Characteristic Parameters ................................................ 31
Figure 20: L&N Steam Tunnel Stack Gas Before and After TMC Installation ................................ 32
Figure 21: TMC Inlet and Outlet Parameters Distribution for Case 1 .............................................. 33
Figure 22: TMC Inlet and Outlet Parameters Distribution for Case 2 .............................................. 33
v
vi
Figure 23: TMC Inlet and Outlet Parameters Distribution for Case 3 .............................................. 34
Figure 24: Long‐Term TMC Performance ............................................................................................. 35
LIST OF TABLES
Table 1: Examples of Industrial Waste Streams with High Moisture Content…………………… 7
Table 2: Characteristics Dimension for the TMC Unit………………………………………………. 15
Table 3: CFD Results for the TMC System…………………………………………………………… 16
Table 4: Main TMC System Component and Instrument List………………………………………23
Table 5: TMC Parametric Study Results……………………………………………………………… 34
Table 6: Summary of the Water and Heat Recovery by TMC System…………………………….. 35
Table 7: Summary of TMC Potential Applications and Savings………………………...…………. 39
Table 8. Comparison of the Capital Cost and Energy Cost Savings………………………………. 41

EXECUTIVE SUMMARY
Many industries use steam and process heating, which generates low‐grade waste heat, often with high‐moisture content. This low‐grade energy is difficult to recover and reuse for two reasons. First, the relatively low temperature provides an insufficient driving force for the heat transfer with conventional heat exchanging equipment. Second, water vapor condensation at low temperatures can cause equipment corrosion due to carbon dioxide (CO2), sulfur dioxide (SO2), and other acidic gas components. An innovative technology is needed to recover both the heat and moisture cost‐effectively from these low‐grade waste streams.
Gas Technology Institute developed a transport membrane condenser as a waste heat and water recovery system for natural gas‐fired boilers. The transport membrane condenser system is designed to simultaneously recover both water vapor and its latent heat, that is, heat that is released during the transformation of the water to its vapor phase. This is accomplished by condensing water vapor inside the ceramic membrane pore structure, so that the gas side heat transfer resistance is greatly decreased and, therefore, the overall heat transfer coefficient can be significantly increased. In this application, the membrane is fabricated so that only tiny particles less than 100 nanometers in size can pass through its pores. Since this nanoporous membrane material is the sole element in contact with the hot flue gas side, only water vapor condensed inside the membrane pores can pass through. The condensed water vapor is recovered along with its sensible and latent heat, providing a clean water source for additional industrial processes. For natural gas‐fired boiler applications, the transport membrane condenser system can increase the system efficiency by up to 20 percent, depending on the waste stream temperature, moisture content, and available heat dissipating capabilities (heat sink) in the form of a low‐temperature process water stream.
For this project, researchers sought to extend the transport membrane condenser waste heat and water recovery system application areas beyond industrial boilers. A California commercial laundry site that has an exhaust stream appropriate for this application was selected to host this demonstration. The technology was re‐engineered to accommodate the host site waste stream and heat sink conditions. Design, fabrication, assembly, and laboratory validation were accomplished at GTI. After laboratory validation, the field demonstration unit with control panel and data acquisition system was installed and commissioned at L & N Costume and Linen Service in Santa Ana, California (Orange County). The new waste heat and water recovery technology was installed in September 2009. Since then, the host site has reported significant energy and water savings: 50 gallons per hour of water and 0.5 million British thermal units (BTUs) per hour of heat. Long‐term operation of the condenser demonstrates that the overall system can maintain stable performance.
The transport membrane condenser heat and water recovery system has demonstrated that it can provide a new source of clean water for industrial facilities. This will help conserve existing fresh water supplies for public use, reduce fuel use in industrial plants by up to 20 percent, improve productivity to preserve jobs, reduce the price pressure on natural gas, and reduce greenhouse gas and pollutant emissions. Preliminary analysis of the industrial market suggests that if the technology can be successfully applied to the California market, about 4.2 trillion
1

2
BTUs of natural gas per year can be saved. This savings translates to $46 million in annual fuel savings for the users, the reduction of 242,000 tons of CO2 emissions and 180,000 pounds of NOx emissions, and 225 million gallons of clean water reclaimed. These additional benefits could potentially bring the total annual California ratepayers benefit to about $49 million. A commercialization path for this new technology for use in California and across the United States has been evaluated.
CHAPTER 1: Introduction 1.1 Background A large portion of energy used by society comes from hydrocarbon fuel combustion, and one of the major combustion products is water vapor1. In industrial process units such as boilers and furnaces, this water vapor exits with the flue gases. This is also true of exhaust gases from various other industrial processes, like food processing, paper drying, and production of many chemicals2. Usually, the water vapor, along with its substantial latent heat of vaporization, is exhausted into the atmosphere. This limits the thermal efficiency of these processes because conventional heat recovery techniques are ineffective for recovering this exhaust heat.
To increase the thermal efficiency, traditional waste heat recovery devices have been used to cool down the exhaust gas to the condensation temperature (dew point). However, because most of the flue gas has a relatively low temperature and high water vapor content, large heat transfer surfaces and special materials to control corrosion from the acidic condensate are required. Also, the condensate generated in the condensing process must be treated for disposal, and because heat is transferred indirectly, only part of the heat of condensation can be recovered as useful energy. If more of this water vapor and its latent heat could be recovered, additional thermal efficiency could be gained.
In response to this need, Gas Technology Institute (GTI) has developed a new concept to recover water vapor and its latent heat from these processes by using a membrane water vapor separation technique 3 ,4. After investigating various porous and nonporous membranes for their water vapor separation and transport properties, GTI concluded that nanoporous ceramic membranes are capable of achieving the best combination of high water transport flux, high separation ratio, and durability at elevated temperatures when operating in a capillary condensation mode5. Based on this mechanism, the Transport Membrane Condenser (TMC) was developed initially for recovering water vapor along with its latent heat from gas‐fired boiler flue gases, and industrial applications with TMC units have demonstrated significant waste water vapor and heat recovery6 ,7.
1 Boyen, J., Practical Thermal Energy Recovery, John Wiley & Sons, (1980) 2 Bend Research, Research on an Energy‐Efficient Drying Process, DOE Final Report, DOE/ID/12293‐1 (DE 86013369, Feb.25, (1986). 3 Rabovister, I., R. Knight, R. Remick, Method and Apparatus for Selective Removal of a Condensable Component from a Process Stream with Latent Heat Recovery, U.S. Patent No. 6,517, 607 B2, Feb.11, 2003. 4 Bao, A., D. Wang, and C.X. Lin, ʺNanoporous Membrane Tube Condensing Heat Transfer Enhancement Studyʺ, IMECE 2011‐63530, Denver, CO, Nov. 11‐17, 2011 5 Keizer, K., R. Uhlhorn, V. Zaspalis and A. Burggraaf, ʺTransport and Related (Gas and Vapor) Separation in Ceramic Membranesʺ, Key Engineering Materials, v.61&62, p. 143‐154, 1991 6 Knight, R., ʺCompact Package Boiler Combining Ultra‐High‐Efficient and Ultra‐Low Emissions: Development and Demonstrationʺ, Natural Gas Technology Conference II, Buena Vista, FL, 2005
1

The TMC technology was invented by GTI as a component for advanced high‐efficiency boiler technology, and was developed under the Super Boiler project sponsored by DOE and other industrial sponsors starting in 20008 ,9,10.
1.2 TMC Concept and Technology Development Figure 1 shows a representation of the TMC concept. Flue gas flows on one side of a nanoporous ceramic membrane tube, and cold boiler feed water flows counter‐currently on the opposing side. Water vapor from the flue gas is transported through the membrane structure by first condensing inside the inner separation membrane layer (60Å to 85Å pore size), then moving through the intermediate layer (500Å pore size) and the substrate (0.4 μm pore size). Figure 2 shows the photomicrograph of ceramic porous layer coated on the porous membrane tube surface. Other gas components in the flue gas are blocked from passing the membrane by the condensed liquid. The condensed water along with its latent heat finally combines with the cold boiler feed water, helping to raise its temperature prior to entering the boiler feed water tank or deaerator. A partial vacuum is maintained on the water side of the device to prevent backflow of water due to liquid pressure head and also to provide additional driving force for water to pass through the membrane.
7 Wang, D., W. Liss, and A. Bao, "Water Reclamation from High Moisture Content Waste Heat Streams", IMECE 2011-63513, Denver, CO, Nov. 11-17, 2011 8 Knight, K., I. Rabovister, D. Wang, ʺMethod and Apparatus for Enhanced Heat Recovery from Stream Generators and Water Heatersʺ, U.S. Patent No. 7,066.396 B2, Jun.27, 2006 9 Wang, D., R. Knight, D. Chojnacki, P. Molvie, B. Tynkov, and D. Willems, ʺReduce Energy Cost with the Super Boilerʺ, WEEC 2007, Atlanta, GA, August 15‐16, 2007 10 Wang, D., R. Knight, D. Chojnacki, P. Molvie, B. Tynkov, and D. Willems, ʺSaving Energy with the High Efficiency Super Boilerʺ, Journal of Energy Engineering, Vol. 105, No.3, pp.38‐48, 2008.
2

Figure 1: TMC Concept Showing Cross Section of the Nanoporous Ceramic Membrane
Water Vapor Laden Flue Gas Inlet
Water Vapor Depleted Flue Gas Outlet
60 to
80
Å
500Å
~0.4μm
Tube Side TMC Element
Shell Side TMC Element
Cold Water Inlet
Hot Water Outlet
TMC Membrane Cross Sectionw/ Pore Sizes of the Layers
Cap
illar
y C
onde
nsat
ion
of W
ater
O
ccur
s in
the
Surf
ace
Pore
s
Water (and Heat) Flow
Source: Gas Technology Institute
Figure 2: Photomicrograph of a Porous Ceramic Membrane Tube Cross-Section
Source: Gas Technology Institute
Researchers have focused on TMC membrane materials that were insensitive to acid corrosion, including ceramics (chiefly alumina) to avoid corrosion concerns. In the initial research work at GTI, researchers found that a nanoporous ceramic membrane with an 80Å mean pore size, when working in the Knudsen diffusion transport mode, has low water vapor transport flux and inadequate separation characteristics for water vapor. But when the gas stream is adequately cooled by heat transfer to the permeate side and the relative humidity of the flue gas is increased, a capillary condensation transport mode can be produced in the asymmetric
3

nanoporous membrane. Water vapor transport flux then increases by more than five times from the value measured in the Knudsen diffusion mode (Figure 3), and the separation ratio is greatly improved (greater than 100). Consequently, the onset of the membrane capillary condensation is a critical point for porous membrane vapor separation switching from a low transport mode to a high transport mode, and this makes the TMC viable for industrial heat recovery use.
Figure 3: Comparison of Water Transport Rate in Knudsen Diffusion and Capillary Condensation Modes
Source: Gas Technology Institute
An advanced waste heat and water recovery system can be configured by using the TMC as the core component, to achieve the maximum heat and water recovery efficiency. The system can be configured as shown in Figure 4 with the following components as an example for boiler application: 1) a conventional high‐pressure economizer (HPE) that uses water from the deaerator to partially recover sensible heat from the flue gas; 2) a low‐pressure economizer (LPE) to further capture the remaining sensible heat from the flue gas by using lower temperature water coming out of TMC; 3) a TMC to transport and recover mainly the water vapor and its latent heat in the flue gas; and 4) a humidifying air heater (HAH) to recycle cooler water for TMC reuse and at the same time to heat/humidify the combustion air to increase its enthalpy for increased boiler efficiency.
Based on the operating experience and testing data obtained from GTI’s laboratory heat recovery system for a 3‐million‐Btu/h boiler, GTI has developed the industrial‐scale TMC based system for 11‐million‐Btu/h (300 hp) firetube boilers at customer sites. The system is fully automatic to allow unattended operation just like a conventional industrial boiler. Starting in 2006, GTI and Cleaver‐Brooks successfully demonstrated two prototype versions of TMC‐based heat recovery systems in the GTI Super Boiler project. These two boilers‐both 300 hp capacity‐are now in operation for supplying customer steam loads in Alabama and California. The system has been proven at 94 percent average fuel‐to‐steam efficiency, saving about 12 percent fuel and about 20 percent makeup water. The TMC alone contributes over 40 percent of the boiler efficiency increase, and is responsible for all of the water savings.
4

Figure 4: Boiler Heat Recovery System Incorporating TMC
Condensatereturn
Fuel In
Steam Out
Boiler
Deaerator/Make-Up Tank
Ambient air
HAH
Preheated humidified air
LPEHPE
Flue gas out
Makeup water
TMC
Source: Gas Technology Institute
The TMC design used in Alabama and California (Version 1.0) was based on commercially available membrane modules from Media & Process Technology situated between two aluminum tube sheets in a cylindrical vessel. Figure 5 shows a simplified schematic of the arrangement with flue gas flowing downward through the inside of the membrane tubes and boiler makeup water flowing counter‐currently upward in the TMC shell, plus a close‐up of a single membrane bundle and the finished TMC installation at the field site in Alabama. The down‐flow configuration was necessary to attain maximum heat and water removal due to the natural convective upward flow of the water in the TMC shell side.
5

Figure 5: Simplified Cross-Section of TMC Version 1.0, Membrane Bundle, and Installed Field Unit
Warm humid flue
gas in
Warm water out to
deaerator
Cool feed water
in
Cool dry flue
gas out
Warm humid flue
gas in
Warm water out to
deaerator
Cool feed water
in
Cool dry flue
gas out
Source: Gas Technology Institute This basic design has been continuously improved in the field and proven to be reliable, durable, and effective. However, because of the prototype nature of this TMC, its fabrication, installation, and maintenance costs need to be reduced to be a commercially attractive product, particularly for the potentially lucrative retrofit boiler market where a more compact and user‐friendly design is needed. The TMC design revision was based on the following guidelines:
• Stay with a modular design for ease of scaleup. • Adopt a design that allows upflow of exhaust gas (and downflow of water) so TMC can
be situated above the boiler or other waste gas unit for more compact installation and less ductwork.
• Improve the tube bundle design for more effective use of membrane surface so that fewer tubes can be used.
• Re‐size the tube bundles to a size and geometry much larger but still manageable by a single worker (approximately 25 lb.) to reduce the number of modules required.
• Configure the TMC geometry so bundles can be easily removed and replaced without complete disassembly of the TMC vessel.
• Design the membrane tube modules to facilitate high‐volume manufacturability. • Integrate the LPE with the TMC as a single unit. • Investigate alternate membrane tube support materials for higher heat transfer. • Reduce overall equipment cost by approximately 75 percent.
GTI first developed a method to reverse the arrangement of water and exhaust gas so that gas flows upward over the outside of the tubes and water downward on the inside via a serpentine arrangement. A rectangular cross flow tube bundle was designed with tube spacing to maximize gas‐to‐surface contact while minimizing pressure drop. GTI also modeled the concept using Fluent® computational fluid dynamics (CFD). The bundle design was sized for easy handling. The module capacity is targeted to be about 1 million Btu/h in steam boiler
6

applications. The gasket arrangement allowed the bundles to be removed and replaced without disturbing the TMC installation. GTI Staff contracted with a manufacturing consultant to help design a manufacturable membrane module at minimal material and labor cost. This resulted in a design based on injection molded polymeric end pieces with fast‐curing elastomeric potting materials to seal the membrane tubes. The design also includes self‐contained water distribution chambers for each module. Figure 6 shows a drawing of the new TMC Version 2.0 vessel design and two photographs of the Version 2.0 tube bundle design. At the bottom of the TMC vessel is the low‐cost integrated LPE panel.
Figure 6: 3D View of TMC Version 2.0 Vessel Design and Prototype Tube Modules
Source: Gas Technology Institute
1.3 TMC System for Broader Applications With the above heat recovery strategy, the TMC can increase boiler system efficiency by up to 20 percent, depending on the water stream temperature, moisture content, and available heat sink in the form of a low‐temperature process water stream. Further applications of the TMC system will show the following: The TMC will provide a new source of clean water, helping conserve existing fresh water supplies for public use; this approach will reduce fuel use, and reduce price pressure on natural gas; TMC outcomes will improve productivity—and increased efficiency. helping to preserve jobs and reduce price pressures; and TMC will reduce greenhouse gas and pollution emissions through increased efficiency. The next step for the TMC water and heat recovery system application is to expand its use to other industrial low grade waste heat streams beyond the boiler applications.
Through our market evaluation efforts, a variety of processes were identified as having low‐grade heat with relatively high moisture contents (for example, higher than 24 percent water vapor by volume). The higher moisture content is advantageous for the TMC to capture more latent heat and water vapor. Some examples of these streams are given in Table 1. The data show that there are numerous opportunities for energy recovery by extracting water and latent heat from low‐temperature waste streams.
Table 1: Examples of Industrial Waste Streams With High Moisture Content
7

Application Temp (°F) H2O (vol%) O2 (vol%) CO2 (vol%)Calciner Natural gas 356 52.3 2.3 4.4 Fuel oil 342 58.2 0.9 4.8 Lime Kilns Longview – natural gas 35.5 0.8 17.5 Longview – fuel oil 32.0 0.7 21.3 Pine Hill – natural gas 39.3 1.1 14.6 Pine Hill – fuel oil 36.6 1.1 18.0 Espanola - #1 kiln 158 32.5 14.2 Espanola - #2 kiln 153 29.3 16.7 Windsor 153 27.5 16.6 Ashdown - #3 354 30.1 4.7 21.1 Recovery Boilers Espanola – recovery boiler 430 25.0 16.0 Windsor – recovery boiler 360 24.1 5.5 13.5 Ashdown – #2 recovery boiler 392 27.0 3.0 15.6
Source: Gas Technology Institute
Another potential TMC application market is the industrial drying market (primarily chemicals, food processing, paper, textiles, transportation equipment, fabricated metals, furniture, and industrial machinery). Preliminary analysis of the drying market shows that the nationwide annual natural gas usage for this purpose in 1992 was 285 trillion Btu11, or about 3.0 percent of the total natural gas fuel usage by industry (9,540 trillion Btu) in that same year. Natural gas usage has declined by 30 percent since then, so the current projected usage for industrial drying would be about 198 trillion Btu across the U.S. Adjusting 2000 data for California’s natural gas consumption12 to 2007 levels, the State consumption is currently about 494 TBtu, and natural gas usage for industrial drying is about 16.4 TBtu. At current delivered industrial price of abo$11/MMBtu
ut
13, the cost of this natural gas is $180 million.
Drying system data provided by Aeroglide, Hills Pet Nutrition14 and literature sources were used by GTI to develop a model case for pet food drying in a conveyor dryer. An extruder feeds pet food at 20 percent moisture to a two‐stage conveyor dryer where hot air from a gas‐fired oven dries the product to 5 percent to 6 percent moisture. The dryer exhaust then leaves the drying oven at approximately 196°F with a moisture content of 6.2 wt. percent. Depending on the ability of the facility to reclaim hot water (140‐170°F) from the TMC, in this case the recovered water can be used for boiler feed water and/or for heating fish oil and butter oil tanks. Researchers estimated the TMC can remove between 7 percent and 30 percent of the dryer exhaust moisture along with its latent heat while reducing the temperature to 114 to 123°F. This translates to total dryer heat input savings of 14 percent to 25 percent. Extending
11 ʺ1992 Industrial Process Heat Energy Analysisʺ, GRI‐96/0353, EEA, Inc. 1993 12 Kulkarni, P. ʺPublic Interest Energy Research (PIER) Industry/Agriculture/Water (IAW) Programʺ, California Energy Commission, Oct. 26, 2004. 13 http://www.eia.gov/naturalgas/weekly/ 14 U.S. Energy Information Administration, http://www.eia.gov/dnav/ng/ng_cons_sum_dcu_nus_a.htm and http://www.eia.gov/dnav/ng/ng_cons_sum_dcu_SCA_a.htm, 2006.
8

these savings throughout California’s estimated industrial market for drying equipment yields a potential annual California natural gas savings of 4.2 trillion Btu ‐‐ about $45.8 million in annual fuel savings alone.
Other annual benefits include 225 million gallons of clean water recovered, with a value of $362,000; CO2 reduction of 242,000 tons with a projected value of $2.9 million; and approximately 180,000 lb. avoided NOx emissions with a potential value of $360,000. These projected annual dollar savings provide benefits to the ratepayers of about $49.3 million, which is 103 times of the requested PIER funds for this project. In addition, the anticipated reductions in NOx and CO2 will contribute to the goals of AB 32, the California Global Warming Solutions Act of 2006. These benefits will accrue throughout California because of the wide‐ranging distribution of drying operations over industrial, commercial, and agricultural areas.
Overall, the value of the TMC to industrial customers is its ability to recover both energy and water from low‐temperature waste streams with a cost‐effective package. Advantages of the TMC for low‐grade heat recovery are:
• Compact size – because of the intensive heat transfer of the condensing‐transporting concept, the TMC will be smaller than conventional heat exchangers.
• Corrosion resistance – the portions of the TMC exposed to condensate and liquid water are entirely ceramic tubes and polymeric support structures; the TMC enclosure is constructed of stainless steel, and under normal operation there is no condensate on the exhaust side, the usual corrosion concerns for condensing heat exchangers are avoided.
• Modular design – the TMC technology consists of membrane tube modules, or bundles of approximately 1 million Btu/h capacity per module; they are arrayed in a housing which can be scaled up or down according to the customer’s needs. The modular design also facilitates module removal and reinsertion for cleaning or replacement.
• Water recovery – unlike a conventional condensing heat exchanger, the TMC actually recovers clean water for re‐use
• Cost‐effectiveness – the TMC system has already been tested for optimization measures to reduce the cost for boiler application to approximately a two‐year payback (for a 12 million Btu/h boiler). Further cost reduction steps such as lower cost membrane tube substrates and new porous support materials that improve heat transfer have been identified and will be considered for implementation in this project.
9

CHAPTER 2: Potential Host Site Evaluations 2.1 Introduction TMC technology was developed for natural gas boiler flue gas heat and water recovery. This project seeks to expand its use to other industrial low grade waste heat streams. Historically, many of these heat streams have much higher moisture content than the boiler flue gas, and the heat from low grade waste heat streams cannot be recovered economically by any currently available technology. These low grade waste heat streams are more favorable for TMC technology to recover more heat and water. In the process of seeking a potential host site for this project, researchers have found widely available low grade high moisture effluent from industries such as food, chemical, metal, biomass production, and so forth.
To select a suitable industrial host site in California for a field demonstration of the TMC it was necessary for the host site to provide the following: 1) A waste gas source with acceptable stream properties; 2) Access to collect baseline data to compare energy efficiency with and without the TMC system; 3) Access to install, test, and monitor the TMC system; 4) Sufficient seasonal and weekly operating hours to provide enough data to make a realistic assessment of the potential savings; 5) Accessibility to visits by sponsors, potential end users, and potential participants in the manufacturing chain; and 6) Offer of sufficient commitment to the project in the form of cash and/or in‐kind contribution.
Information and performance analysis was collected from potential host sites and three representative examples are listed below.
2. 2 Potential Host Sites With Detailed Evaluation High moisture effluents can be generated from many industrial processes themselves as well as from industrial effluent post cleaning processes. Examples of primary industrial processes that produce high moisture effluent include food processing, laundry, paper and other drying processes; high hydrogen content fuel combustion processes (such as natural gas and hydrogen combustion); water quenching processes in metal making; and the fermentation processes in the biomass industry. In addition, many more high moisture effluents can be generated by the post cleaning processes where industrial facilities use various types of scrubbers for high particulate matter and high acid gas content effluents to meet air quality control criteria. These effluents vary in nature because they involve different industries and different processes. Therefore, it is very difficult to quantify their detailed parameters and quantities. The list of potential TMC customers is huge, and the follow‐up to the current project presents many opportunities for educational, marketing, and sales work to continue the quest for better climate, and reduction of needless fuel usage in California. Below are three example host sites where researchers have collected data and performed potential TMC application analysis.
10

EnerTech Environmental Inc.
EnerTech Environmental, Inc. is located in San Juan Capistrano, CA. On a site visit of the facility, researchers collected all of the detailed operational data for this site. EnerTech Environmental, Inc., is a solid fuel production plant that uses city waste sludge. The effluent from the rotary dryer for the produced solid fuel has high moisture content after various post cleaning processes. Researchers developed a proposal to use the recovered heat to preheat EnerTech’s combustion air to its rotary dryer; which includes a P&ID, an installation layout drawing, and preliminary analysis for the system heat and water recovery performance. Figure 7 shows the layout drawing for a slip stream demonstration system setup.
Figure 7: TMC Installation Arrangement Layout for a Slip Stream Demonstration
Source: Gas Technology Institute
11

Here is what researchers have proposed to the plant based on the analysis and discussion with the plant staff: a 9‐module TMC will be used for the demonstration to treat part of their total flue gas, which is capable of treating approximately 2,500 scfm of effluent, about 1/8 of its total effluent from the SO2 scrubber stack.
The detailed effluent parameters are listed below:
• 17.42 percent H2O in volume • Temperature of 136˚F
Based on the information provided, GTI staff did a preliminary estimation of the TMC system performance:
• Flue gas flowing through the TMC: 2,500 scfm, inlet T=136˚F, dew point 136˚F, outlet T=120˚F, dew point 120˚F.
• Water flowing through the TMC: inlet T=70˚F, flow rate: 14gpm; outlet T=125˚F, flow rate 15gpm.
• Water recovery will be 1gpm, and heat recovery will be: 0.5 million Btu/hr for this demo TMC unit.
BP Carson Refinery
The second potential host site is BP Carson Refinery at Carson, California. Several potential waste heat streams within this plant were discussed, and one was considered to have the most potential for a TMC installation for performance analysis. The detailed effluent parameters are given below:
• Average flue gas volume : approximately 157,000 scfm • Average flue gas moisture (water vapor mass percent): 30 • Average flue gas temperature (after ID Fan): 220˚F • Average O2 concentration: 4.2 percent • Flue Gas NOx concentration: 50 ppm • Flue Gas SO2 concentration: 30 ppm • Average temperature of the RO water: ambient • Pressure of the RO water: 120 psig
Based on the information provided, the TMC performance was analyzed with major parameters as shown below:
• Flue gas flowing through the TMC: 2,500 scfm, inlet T=220˚F, dew point 170˚F (based on 30 percent water vapor content in mass, which is 40.8 percent in volume), outlet T=125˚F, dew point 120˚F.
• Water flowing through the TMC: inlet T=70˚F, flow rate: 30gpm; outlet T=190˚F, flow rate 34gpm.
• Water recovery will be 4gpm, and heat recovery will be: 1.8 million Btu/hr for this demo TMC unit.
12

L. & N. Costume and Linen Service
L. & N. Costume and Linen Service, located in Santa Ana, California, has been laundering and dry cleaning Disneyland Resort’s costumes since 2000. This facility launders thousands of clothing and restaurant supply items daily. There is a steam tunnel in the plant to iron out wrinkles from the garments when they come out of the dryers. There is significant steam lost from its exhaust stack, detailed effluent parameters are given below:
• Average exhaust gas volume : approximately 1,700 scfm • Average exhaust gas moisture (water vapor mass percent): 11.5 • Average exhaust gas dew point: 135˚F • Average exhaust gas temperature (after ID Fan): 180˚F • Average temperature of the feed water: 75˚F • Pressure of the feed water: 120 psig
Based on the information provided, the following estimation was carried out:
• Flue gas flowing through the TMC: 1,700 scfm, inlet T=180˚F, dew point 135˚F, outlet T=112˚F, dew point 112˚F.
• Water flowing through the TMC: inlet T=75˚F, flow rate: 14gpm; outlet T=120˚F, flow rate 15gpm.
• Water recovery will be 1.0 gpm, and heat recovery will be: 0.50 million Btu/hr for this demonstration TMC unit.
After review and analysis, researchers selected the L. & N. Costume and Linen Service as the host site for the TMC water and heat recovery system field demonstration. The engineering design is based on the L. & N. steam tunnel exhaust stream parameters. A picture of the L. & N. Steam Tunnel is as shown in Figure 8.
13

Figure 8: L. & N. Costume and Linen Service Steam Tunnel
Source: Gas Technology Institute
Other potential demonstration sites considered include Hills Pet Nutrition, and Miller Brewing Company in California. Although significant moisture is generated in these industrial processes, (dryers, regenerative thermal oxidizers (RTO), ovens, extruders, and so forth), it is highly diluted afterwards, so the exhaust gas temperature and vapor concentration is reduced. The resulting exhaust gas has low energy and moisture density, which is beyond the economic criteria for using any type of waste heat recovery equipment, including the TMC.
14

CHAPTER 3: System Design, Fabrication, and Integration The TMC water and heat recovery system was designed based on the host site condition, including detailed Piping and Instrumentation Diagram (P&ID), electrical wiring drawings, general arrangement drawings, fabrication drawings, and assembly drawings. After the fabrication, the TMC system was assembled and integrated together with full controls, and pre‐tested at the GTI combustion laboratory.
3.1 CFD Simulation for TMC Design and Performance To meet the water and heat recovery goal for this host site, a computational fluid dynamics (CFD) simulation tool Fluent@ was used to simulate the TMC heat and water recovery performance under the host site conditions. We have simulated various conditions within the host steam tunnel operating range, and an optimized configuration was selected for the design.
Based on the CFD simulation results, researchers designed a 9‐module 3‐pass TMC unit to process the L. & N. steam tunnel exhaust gas. Table 2 lists the characteristic dimensions for this 9‐module TMC unit. The CFD results are shown in Table 3, and all the initial conditions are from the host site exhaust stream measurement, with the TMC cooling water flow rate of 14gpm and cooling water inlet temperature of 75ºF. From Table 3, the TMC system will recover 48.5 percent water vapor from waste stream and recover 480,000 Btus per hour of heat. Table 3 also shows the water and heat transfer rates for each TMC module. The 8.5nm separation membrane layer pore size researchers selected for the TMC membrane tubes is appropriate for this field demonstration application.
Table 2: Characteristics Dimension for the TMC Unit
Total tube for single TMC module 389 Tube Length inch 17Tube outer diameter mm 5.5 Separation membrane pore size nm 8.5 Module cross‐section inch x inch 11.7 x 18.5 Module height inch 9Total module 9Total pass of stream 3
Source: Gas Technology Institute
15

Table 3: CFD Results for the TMC System
Source: Gas Technology Institute
16

3.2 TMC Module Assembly and Pretest Figure 9 shows the details of a single TMC module structure and assembly procedure. The module combines a tube bundle and the water chamber together. So it can be put into the housing like a drawer, easy for assembly and maintenance. The tube sheets and end caps are made of Garolite, because of its high‐heat resistance, dimensional stability, and high flexural strength. The tubes are bonded to the tube sheet with high temperature adhesive, Loctite E‐30CL Hysol Epoxy, to form a leak free module. A stainless steel frame is designed for tube protection and overall strength of the module.
After the construction of the module, typical bubble testing was done to check for any leaks through the sealant, as well as from the end cap seal section. The highest inside tube pressure tested was 10 PSI, and no leaks found in any of the nine modules. More than a thousand vacuum test cycles (8 minutes at 8” Hg of vacuum, 2 minutes at atmosphere pressure condition) were done to check for long term performance. A typical full size module built according to the above method, Figure 10.
Figure 9: TMC Module Assembly Procedure
Source: Gas Technology Institute
Figure 10: An Assembled Single TMC Module
Source: Gas Technology Institute
17

3.3 TMC System Design, Fabrication, and Integration For the L. & N. host site, the TMC system extracts heat from the exhaust gas of its steam tunnel to preheat water for its washing machine use, allowing the facility to use less energy to heat the water. It also recovers water from the exhaust gas, which reduces the amount of make‐up water needed. For this particular host site, the TMC waste heat and water recovery system was configured with four major components—a TMC unit, a water pump, a hot water storage tank, and a control panel. The TMC unit is installed on top of the steam tunnel exhaust duct, the water pump is installed downstream of the TMC unit to extract hot water from it, and the hot water storage tank is located downstream of the water pump to receive the water for next step process use.
TMC Unit
The TMC unit consists of 9 individual TMC modules in a 3 module high by 3 module wide arrangement in a stainless steel housing. Its water reservoir supplies fresh cooling water to the TMC tubes through PVC piping to the TMC module integrated water chambers. Each TMC module has a small port in each end cap so that air in the modules can be vented to the water reservoir during initial fill‐up process and in the operation process. The vent lines are connected to the water reservoir.
The housing that contains the TMC modules has a bracket for attaching the water reservoir. There are removable bezels on one side of the housing to allow replacement of individual modules. The bezels seal the modules in the housing using gaskets on both sides of the modules. Figure 11 shows the TMC housing AutoCAD drawing, and Figure 12 shows the assembled TMC unit for L. & N. Costume and Linen Service.
18

Figure 11: TMC Housing Assembling Drawing
Source: Gas Technology Institute
19

Figure 12: Assembled 9-Module TMC Unit With Water Reservoir
Source: Gas Technology Institute
Water Reservoir
The water reservoir is a small tank attached to the TMC housing on one side above the TMC modules. The reservoir serves three functions. The first function is to provide the TMC modules with a steady supply of water. For this function, the level in the reservoir is controlled to be maintained at a half‐filled condition. The second function is to provide a chamber for collecting the air being vented out from the TMC modules during initial water fill‐up period and in the operation period. The third function is to provide a place for the application of the partial vacuum in the TMC system. The vacuum can only be initiated when the TMC modules are full so that all the membrane pores are sealed, and can only be maintained when there is a consistent air pocket in the top of the water reservoir.
Water Pump
The water pump is installed downstream of the TMC unit to extract water from the TMC modules. It is located on the floor level, well below the TMC unit to establish a high water
20
pressure head at the pump water inlet, for example, to help prime the water pump. During normal operation, its start‐up is delayed until after the TMC unit and the water reservoir are filled with water, and its shutdown is delayed until after the water reservoir and the TMC unit have been emptied of water.
The Water Pump contains an integrated variable frequency drive (VFD) and pressure transmitter. With these components, the speed of the pump is controlled to maintain a set pressure (30 psig) in the discharge line of the pump. The set pressure establishes a steady discharge rate for the water flow from the pump to the hot water storage tank. The actual flow rate is determined by a throttle valve.
Hot Water Storage Tank
The Hot Water Storage Tank (Figure 13) is located downstream of the water pump to receive the water discharged from the TMC for present or later use at the facility. The tank has a 1,600 gallon capacity. A lower float switch was designed and installed in the tank to maintain the level at about 550 gallons for normal operations at the facility‐‐without the TMC system running. The extra capacity is used to collect the preheated water from the TMC system when the facility is using less water from the tank than the TMC system is discharging to the tank. The tank also has an upper float switch designed to stop the TMC system when the tank is nearly full, and an emergency float switch to prevent overflow of the tank.
21

Figure 13: Hot Water Storage Tank for Receiving Hot Water From TMC
Source: Gas Technology Institute
Control Panel
The Control Panel interfaces with the steam tunnelʹs and storage tankʹs controls and regulates the TMC system. The control panel contains a P&ID Loop Controller for maintaining the level in the Water Reservoir and sensing when the level is first filled, too low, or too high. The control panel also contains relays and timers to control the starting and stopping of the Water Pump, Vacuum Generator, Vent Valve, and Water Inlet Valve. Also in the control panel there is a data acquisition system which collects readings from various instruments attached to the TMC system.
22
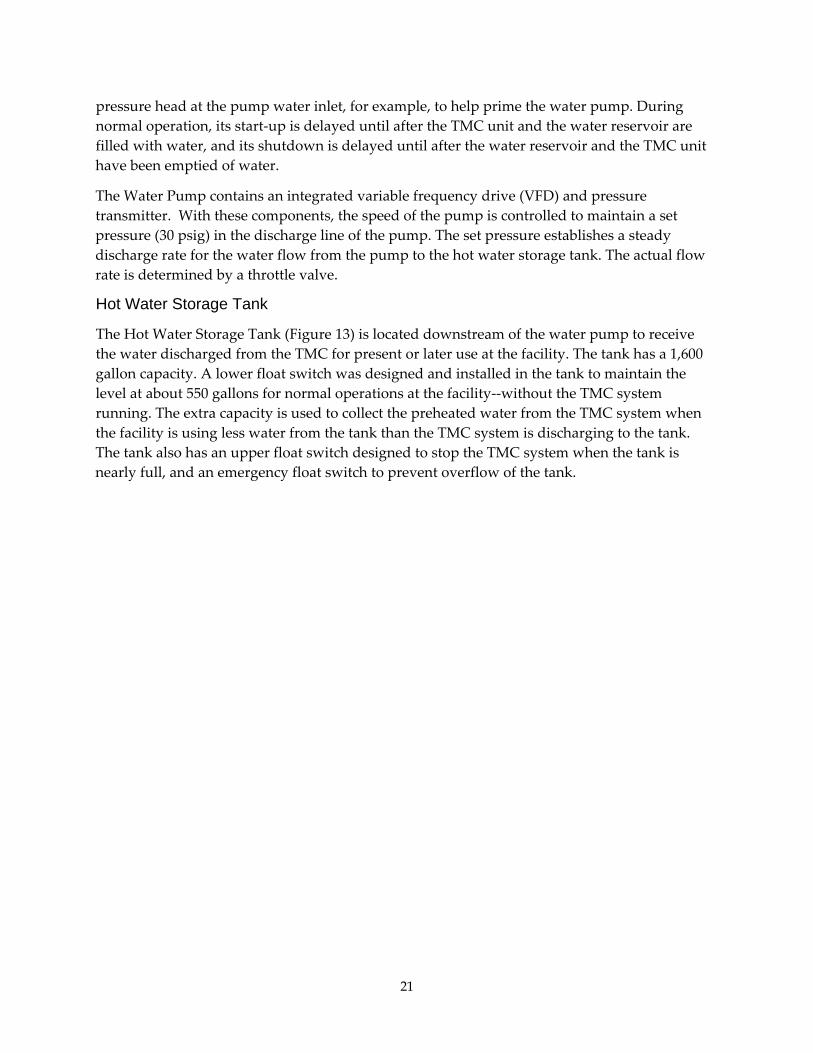
Figure 14: TMC System Control Panel
Source: Gas Technology Institute
Minor components include a vacuum generator and control valves. The vacuum generator maintains a negative pressure in the water reservoir and TMC unit. The control valves maintain the water level in the water reservoir.
Various instrumentations are installed throughout the system to measure the water and gas inlet and outlet conditions, and for evaluating the TMC performance. These include temperature, pressure, humidity, water level, and water flow rate sensors.
Table 4 lists the main TMC system components and instruments with the vendor names. Figure 15 shows TMC system P&ID.
Table 4: Main TMC System Component and Instrument List
Description of Material Vendor Name TMC module part fabrications Lemke machine TMC module membrane tubes Media &Process Tech.
TMC housing, transition Comet, IncControl Panel fabrication Mission Control Control components National instrument
Valves SimensWater Pump Grundfos
Vacuum pump, level gauge, McMastercar Water flow meter ABB
Misc. parts, tubing, piping McMastercar Hygrometers Vaisala
data acquisition system National Instruments Source: Gas Technology Institute
23

Figure 15: TMC System P&ID
Source: Gas Technology Institute
3.4 TMC System Pretest The TMC system was set up in the GTI combustion laboratory to do the pre‐evaluation testing, Figure 16. The pre‐evaluation test proved that all of the functions GTI’s engineers have designed for the system are working properly and that the TMC system is ready to be shipped and installed at the host site for real world operation. Summary of the pre‐test steps includes:
1. Assemble the TMC heat/water recovery system with adequate temporary piping connections to allow it to function, set it up on a temporary stand to simulate the height of real installation which will give the water pump a correct suction side pressure head.
2. Manually control the TMC to change water flow rates, vacuum level and other parameters to check for any leaks, blocked vent ports, inadequate water flow and drainage, as well as other malfunctions.
3. Connect the control components into the system, which includes pump VFD control, flow meters, solenoid valves, and so forth. Complete the wiring from the control box to the system, implement the control software, and check the function of the actuators.
4. Commission the control system to allow full control of the TMC operation, observe if it can accurately respond to the setup control parameters GTI staff wants to achieve. Run the TMC system in full automatic control mode to simulate startup, normal operation,
24
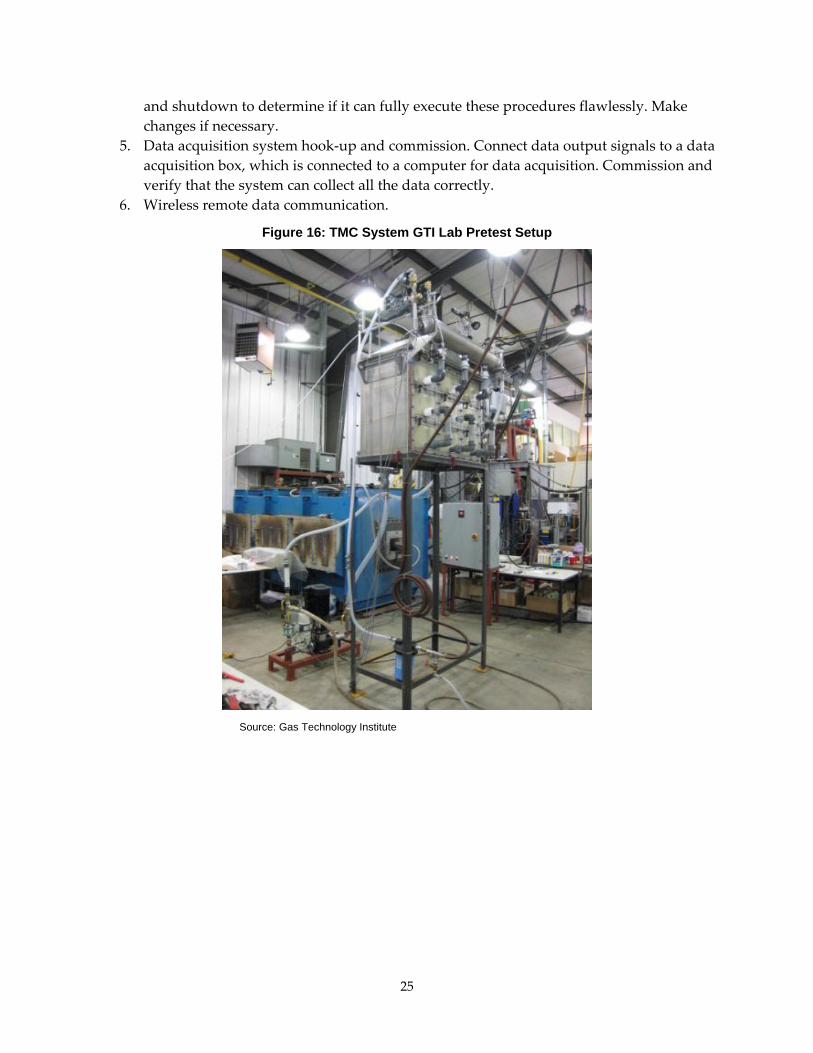
and shutdown to determine if it can fully execute these procedures flawlessly. Make changes if necessary.
5. Data acquisition system hook‐up and commission. Connect data output signals to a data acquisition box, which is connected to a computer for data acquisition. Commission and verify that the system can collect all the data correctly.
6. Wireless remote data communication.
Figure 16: TMC System GTI Lab Pretest Setup
Source: Gas Technology Institute
25

CHAPTER 4: Installation and Parametric Test The TMC waste heat and water recovery system was installed at the L. & N. Costume and Linen Service host site and the whole system has been setup and shakedown tested to make sure the system is working properly. A series of parametric testing was conducted to obtain the TMC performance data and finally optimize the TMC performance for long term operation.
4.1 Installation at the Host Site The TMC unit was installed at the L. & N. Costume and Linen Service host site, (Figure 17 and Figure 18), with the appropriate piping connection.
Figure 17: Overall Steam Tunnel with TMC Installed on the Top (Left Side of the Picture)
Source: Gas Technology Institute
Figure 18: Close-up View of the TMC Unit Installed on Top of Steam Tunnel ID Fan
Source: Gas Technology Institute
26

4.2 Operation and Control of the System A detailed operation and control procedure has been established and documented for the TMC system, which was provided for the host site personnel. The following is a summary.
System Startup
In order for the TMC system to start, the following conditions must be met: • Control Panel has to be on • Storage Tank has to be less than full of water • ID fan on the steam tunnel has to be powered • Compressed air supply must be present.
When powered (disconnect switch in the On position), the control panel powers the drain solenoid (FV130B), which closes, and sends a 120 VAC signal to the upper level float switch (LSH210B) and the emergency float switch (LSHH210C) at the storage tank. These switches are wired in series and pass current through (contacts are closed) if the water level is below these switches. Next, the current signal goes back to the control panel and then out to a relay contact in the steam tunnel control panel. This relay (PY160) passes the current through (contact is closed) if the ID fan is running. The signal comes back to the control panel, goes through the coil of relay CR0, and then goes out to the compressed air pressure switch (PSL190). This switch passes through the current (contact is closed) if the compressed air is above its set point (60 psig). If all four contacts are closed, relay CR0 is energized.
The sole purpose of relay CR0 is to energize relays CR1A and CR1B. Relays CR1A and CR1B are not powered directly to allow external signals of different voltages (such as 240 VAC, 24 VDC), instead of the internal 120 VAC signal. This enables us to start the TMC system by simply changing relay CR0 to one of the appropriate voltage and making the appropriate wiring connections at the terminal blocks.
When relays CR1A and CR1B are energized, the TMC system is started. The CR1A relay energizes relay CR2, which turns itself on. Relay CR2 is turned on so that it stays on during the shutdown sequence (see Shutdown section below) when relay CR0, and relays CR1A and CR1B, are de‐energized.
With the relay CR1A energized, and relay CR6 not yet energized, power is sent to the compressed air valve (FV190), which opens, to the water reservoir vent valve (FV120), which closes, and to relay CR7 (used only for data acquisition). The energized solenoid valve FV190 sends compressed air to the vacuum generator (P120), a Venturi jet pump, which starts to evacuate the air from water reservoir.
With the relay CR1A energized, and relay CR4 not energized, power is sent to the water shut‐off valve (FV140), which opens, while the relay CR1B connects the output of the Piping and Instrumentation Diagram (PID) loop level controller (LIC140) to the actuator (LZ140) of the water flow control valve (LCV140). At startup there is no water in the water reservoir. The reading on the level controller is not zero because there is a residual water column in the tubing between the water reservoir and the level transmitter (LT140). This low reading causes the level
27

controller to command the water flow control valve to be fully open so water can flow into the water reservoir and start filling the TMC modules.
As water starts filling the system, level switch LS130 senses water in the piping leading to the water pump and activates relay CR8, but this circuit is ignored until TMC system shutdown.
After the TMC unit is filled with water, the water reservoir starts filling. When the water reservoir is about one‐quarter full, which corresponds to a reading of 7.0ʺ on the level controller, the level controller activates its second output relay (LALL140), which energizes relay CR5 via off‐delay timer TR3. When energized, relay CR5 signals the water pump (P130) to start. When the pump starts running, its integral VFD energizes an internal status relay (PY130) which causes timer TR2 to start. Timer TR2 would normally delay the start of the vacuum generation until after the pump had been running for a preset time (6 seconds), but that circuitry is 1) bypassed since relay CR6 is not yet energized, and 2) bypassed in this installation so that the pumpʹs status does not affect the operation of the vacuum generation.
When the water reservoir is about one‐half full, which corresponds to a reading of 8.5ʺ on the level controller, the level controller activates its third output relay (LAM140), which energizes relay CR6. This is indicative of normal operation. Relay CR6 stays on for the remainder of the TMC system operation. The activation of relay CR6 switches the mode of operation of the vacuum generation from being forced on at startup to being only on with the water pump running, though the latter has been bypassed in this installation as mentioned above so that the pumpʹs status does not affect the operation of the vacuum generation.
System Normal Operation
During normal operation, the level controller modulates its output signal to the water flow control valve actuator to maintain the 8.5ʺ water level in the water reservoir as displayed on the level controller, which is half full in the water reservoir. The normal fluctuation is about 0.5ʺ. The water pump will discharge about 14 gallons per minute at 30 psig and about 120 °F from the TMC system to the storage tank. The vacuum pressure in the water reservoir will be about 6 in Hg below atmosphere.
All four solenoid valves are powered. The compressed air valve (FV190) and water shut‐off valve (FV140) are open, while the vent valve (FV120) and the drain solenoid valve (FV130B) are closed.
The upper level float switch and the emergency float switch on the storage tank are not activated; the ID fan on the steam tunnel is powered; and the compressed air pressure switch is activated.
The following relays and timers in the control panel are energized during normal operation: CR0, CR1A, CR1B, CR2, CR5, CR6, CR7, CR8, TR2, and TR3. Also energized are the second and third relays (LALL140, and LAM140) in the level controller, and the internal status relay in the water pumpʹs integral VFD. The Power and Pump lights will be illuminated.
28

System Shutdown
When the steam tunnel is shut down, the ID fan on the steam tunnel is shut off, the power to relay CR0 in the control panel is disrupted. Relays CR1A and CR1B are then de‐energized, but relay CR2 stays energized since it was turned on.
The de‐powering of relay CR1A causes the water shut‐off valve (FV140) to close, while the de‐powering of relay CR1B causes the connection between the level controller and the water flow control valve actuator to be disrupted, which closes the water flow control valve. Both valves act to stop water flow into the TMC system.
With relay CR1A de‐energized and CR2 still energized, timer TR1 is started, and with relay CR8 still energized because there is water in the piping to the water pump, relay CR3 is energized. Timer TR1 is energized and immediately de‐powers the compressed air solenoid (FV190), which shuts off the vacuum generation, and de‐powers the vent solenoid (FV120), which allows air into the water reservoir to aid in emptying the TMC system. Relay CR7 is also de‐energized.
The energizing of relay CR3 keeps the water pump operating, even after the level in the water reservoir drops below one‐fourth full. Normally this condition would stop the pump when relay CR5 get de‐energized (see Upsets section).
When the TMC system is drained of water and water is mostly drained from the piping downstream, the level switch LS130 senses the lack of water in the piping going to the water pump and de‐energizes relay CR8. The de‐powering of relay CR8 causes relay CR3 to become de‐energized. The reason there are two relays here is that the level switch LS130 is a low voltage and low current device that can only actuate a small load. The rest of the control logic is 120 VAC, so the low current relay CR8 is used to actuate the coil of the larger relay CR3. The de‐energizing of relay CR3 causes the water pump to stop, and thus timer TR2 to become de‐energized.
Draining water from the TMC system takes about 60 seconds from the time the ID fan is shut off until the time the water pump is shut off. After another 6 seconds (66 seconds total from the energizing of timer TR1), timer TR1 activates and breaks the latch on relay CR2. This causes all other active relays and timers, including timer TR1 to de‐energize. If the draining of water is not completed after 66 seconds, the de‐energizing of timer TR1 will still de‐energize all the active relays and timers, which will shut off the pump.
The drain valve (FV130B) remains powered (closed). The control panel is now in the state it was in before the ID fan was started, ready for the next cycle of the steam tunnel.
System Upsets
• Loss of electrical power – The drain valve (FV130B) opens. If the TMC system were operating at this time, the open drain valve would allow water to empty out of the TMC modules and discharge through the wall to the outside. When power is restored, the TMC system reverts back to the idle state, or to the startup state if the ID fan is running.
29

• Loss of compressed air – The TMC system shuts down as if the ID fan was stopped. This condition is sensed by the compressed air pressure switch (PSL190).
• Too much water in water reservoir – The inlet water valve (FV140) shuts off, the vacuum is stopped by closing the compressed air valve (FV190), and the reservoir is vented by opening the vent valve (FV120). The water pump continues running to drain the excess water from the reservoir. This condition is sensed by the level controller (LIC140) when the level rises above 10.5ʺ.
• Too little water in water reservoir – The water pump is stopped so that more water can build up in the water reservoir. The vacuum stays on via the jumper in the control panel. This condition is sensed by the level controller (LIC140) when the level drops below 7ʺ.
• Loss of fresh water – The level in the water reservoir will no longer be maintained. When the level drops below 7ʺ, the water pump will be shut as described above.
• Too much water in the hot water storage tank – The TMC system shuts down as if the ID fan is stopped. This condition is sensed by the storage tank upper level float switch (LSH210B) and, as a backup, by the storage tank emergency float switch (LSHH210C).
System Emergency Shutdown
The TMC can be shut down in an emergency by turning off the power switch on the control panel. This will open the drain valve (FV130B) which allows the water to empty out of the TMC modules and discharge through the wall to the outside. Alternately, the main disconnect on the control panel can be turned off, but this will shut off the data acquisition system.
Manually shutting off the compressed air supply valve will force the TMC system to go through its normal shutdown sequence, with the water pump discharging the water from the TMC modules and the water reservoir to the storage tank. The vacuum will no longer be generated, so there will be more condensate dripping from the TMC modules into the ID fan housing, which will be subsequently removed by the condensate pump.
4.3 TMC System Shakedown The TMC system was installed with complete control and instrumentation systems. System shakedown was performed, which includes the TMC unit mounted on top of the steam tunnel stack, piping and wiring for water, power and electrical signals, mechanical integrity checking, and control and data acquisition system commissioning.
Shake down testing was performed to verify the TMC performance. Figure 20 shows the typical TMC inlet and outlet characteristic parameter plots for one work day at L. & N. host site, with three steam tunnel operation cycles. The results show that the TMC system cools down the exhaust gas from 190ºF to 110ºF, and gas dew point decreases from 135ºF to 110 ºF, which corresponds with 467,000 BTUs per hour of heat recovery and 50 gallons per hour of water recovery. The water inside the hot water storage tank has been preheated from ambient
30

temperature to about 120 ºF for washing machines use. This proved that a significant amount of energy and water can be recovered from the low‐temperature steam‐laden exhaust gas stream. Figure 21 shows the pictures of the steam tunnel stack gas before and after the TMC installation. Minimum water vapor can be observed from the stack after the TMC in operation, compared with the big plum of vapor totally blocking the background objects before the TMC in operation.
Figure 19: Typical TMC Inlet and Outlet Characteristic Parameters
Source: Gas Technology Institute
31

Figure 20: L&N Steam Tunnel Stack Gas Before and After TMC Installation
Source: Gas Technology Institute
4.4 Parametric Test Results A series of parametric tests were conducted for the TMC system at the host site to improve TMC performance. The TMC vacuum adjustment tests showed that it has minimum effect on the TMC water and heat recovery rates when the water reservoir vacuum is higher than 6” Hg. Another parametric study was performed at the host site on the cooling water flow rates. Three cases were set up with 14gpm for case 1, 16gpm for case 2, and 12gpm for case 3. Figures 22‐24 show the TMC characteristic gas temperatures and dew points, cooling water flow rates and temperatures, and vacuum in a typical steam tunnel operation cycle for different cooling water flow rates. Table 6 summarizes the results with water and heat recovery rates.
The cooling water flow rate parametric study shows that higher flow rates increase both water and heat recovery rates and improve the overall TMC system performance. Researchers selected the cooling water flow rate at 14gpm for long‐term TMC testing based on the host site water supply and the hot water requirement.
The cooling water inlet temperature, exhaust stream inlet temperature and dew point, and exhaust stream flow rate can also affect the TMC system performance, based on other GTI TMC project results. For this practical application, these parameters are determined by the host site conditions.
32
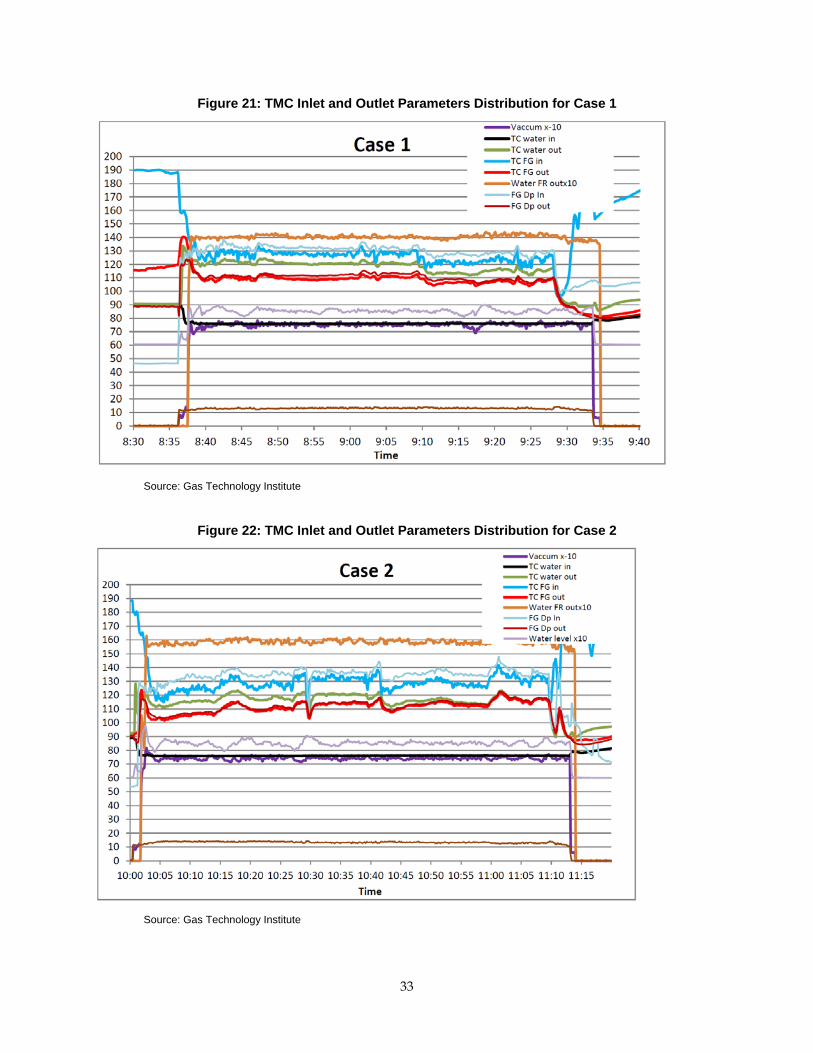
Figure 21: TMC Inlet and Outlet Parameters Distribution for Case 1
Source: Gas Technology Institute
Figure 22: TMC Inlet and Outlet Parameters Distribution for Case 2
Source: Gas Technology Institute
33

Figure 23: TMC Inlet and Outlet Parameters Distribution for Case 3
Source: Gas Technology Institute
Table 5: TMC Parametric Study Results
Case 1 Case 2 Case 3 Total Gas flow rate CFH 100,000 100,000 100,000FG inlet Temp F 190.1 188.7 179.1 FG inlet Dew Point F 132.7 135.4 126.3 FG inlet RH % 25.6 28.2 27.3 FG outlet Temp F 109.4 111.7 105.9 FG outlet Dew Point F 109.4 111.7 105.9 FG outlet RH % 100 100 100 Water flow rate GPM 14.1 15.9 12.3 TMC Vacuum ʺHg ‐7.5 ‐7.4 ‐7.2 Water inlet Temp F 75.9 76.2 74.4 Water outlet Temp F 121.3 117.4 116.5 Water recovery rate GPM 0.82 0.89 0.63 Vapor recovery percentage % 52.0 52.6 47.4 Heat recovery rate Btu/hr 467,600 504,300 364,000
Source: Gas Technology Institute
34

CHAPTER 5: Long-Term Monitoring and Training After the overall heat recovery system shakedown and parameter testing in October, 2010, the system entered into its long term testing period. The plant personnel were trained to take over the system operation and maintenance, and a comprehensive TMC system operation manual has been provided to the host. It includes detailed instructions on system startup, normal operation, normal shutdown, emergency shutdown, maintenance, P&ID and equipment descriptions. The data acquisition system was set up for continuous data logging and sending data back to GTI in a certain period. Therefore, the system’s long term performance can be monitored and analyzed by GTI. Technical support has been provided by GTI for the host site when there were conditions that the host personnel could not handle by themselves. In fact, the plant personnel felt very comfortable with the demonstration system operation just after one to two weeks. Figure 24 shows the water and heat recovery rate, from data between September, 2010 and July, 2011. It shows that the TMC performance was stable, with the water recovery rate at about 0.8gpm and heat recovery rate about 0.5 million‐Btu/hr most of the time. There is a period between January, 2011 and March 2011, both values increased due to the cooling water flow rate increase during that time to accommodate the plant water demand increase.
From the recorded long‐term TMC performance data, the TMC demonstration system water and heat recovery data are summarized in Table 6.
Figure 24: Long-Term TMC Performance
Source: Gas Technology Institute
Table 5: Summary of the Water and Heat Recovery by TMC System
Operation time Water saving Energy saving
Hours/year Gallon Million Btu
900 43,200 420.8
Source: Gas Technology Institute
35

CHAPTER 6: Potential Markets and Commercialization TMC technology was developed for natural gas boiler flue gas heat and water recovery. The present project is expanding its use for other industrial low grade waste heat streams. Many of these industrial low grade waste heat streams have much higher moisture content which would allow TMC to recover greater quantities of heat and water. In the process of expanding TMC applications, researchers found out that low grade high moisture effluent is widely available from industries such as food, chemical, metal, biomass production, and others. For example, to meet the more stringent air quality regulations, most of the effluents from these industrial processes must go through a series of cleanup procedures before being exhausted to the atmosphere. The cleanup equipment is typically a wet (or dry) scrubber, which is responsible for capturing any acid gases and particulate matters. After the scrubber, the effluent is typically in a saturated condition if it is a wet scrubber, or close to saturation if it is a dry scrubber. This is due to the large amounts of water used in these kinds of scrubbers, and the effluent temperature is typically lower than 200˚F. This low temperature high moisture content effluent gas is considered low grade heat, and cannot be recovered by any currently available technologies. The emission of this high moisture effluent also causes environmental problems like large plumes of vapor reducing the visibility of the nearby roads, and causes local high moisture conditions which can cause many problems such as the corrosion of buildings and equipment. This high moisture effluent actually has very high energy content because of the huge latent heat associated with the water vapor. Effectively recovering the water vapor and its tremendous latent heat will not only conserve energy and water, but also avoid environmental problems.
6.1 Potential Markets for TMC Applications High moisture effluents can be generated from many industrial processes, like food, paper and other drying processes, high hydrogen content fuel combustion processes, such as natural gas and hydrogen combustion flue gases, water quenching processes in metal making, and fermentation processes in the biomass industry. Many more high moisture effluents can be generated by the post cleaning processes (different scrubbers are typically used) for many high particulate matter and high acid gas content effluents to meet air quality control criteria. The nature of these effluents involves different industries and different processes, so it is very difficult to quantify their detailed parameters and quantities. For this report researchers focused on high moisture effluents from scrubbers, which included dry and wet scrubbers. The most often used are SO2 scrubbers, also called Flue Gas Desulfurization (FGD) units. Appendix A provides a detailed market evaluation of different kinds of wet scrubbers used in different industries in the US.
According to a March 2009, 13‐page letter from the Austin, TX chapter of the Sierra Club to the US EPA, there are 73 different industrial processes that emit H2S which typically needs wet scrubbers to do the cleanup work.
36

Excluding processes associated with oil and gas exploration and production, processes listed in this letter include:
• Pulp and paper mills • Paper production • Municipal sewage treatment plants • Large confined animal feeding operations • Carbon black manufacturing • Portland cement kilns • Municipal waste landfills • Coke ovens • Coal gasification plants • Tanneries • Slaughterhouses, chicken houses with waste incinerators, and rendering plants • Geothermal power plants (this is a major issue in California, but there aren’t any such
plants in Southern California) • Sulfur products and hydrogen sulfide production plants • Animal fat and oil processing plants • Asphalt storage facilities • Blast furnaces • Breweries and fermentation processes • Fertilizer production • Glue manufacturing • Metal processing (gold ore, lead ore, lead removal, copper ore sulfidizing and
metallurgy) • Barium carbonate and barium salt production • Phosphoric acid production • Fish, sugar beet and sugar cane processing
Miscellaneous processes, including • Carbon disulfide manufacture • Dye manufacturing • Textile printing • Thiophene manufacturing • Sulfur manufacturing • Soap manufacturing • Phosphate purification • Hydrochloric acid purification • Cellophane, rubber, and plastics processing • Silk making • Refrigerant chemicals manufacturing
37

This letter mentions that 16 states (which include major industrial states such as Texas and Ohio) have no regulations on H2S emissions, which complicates the determination of the population of acid gas scrubbers. The letter mentions that the US EPA Regions that cover these 16 states have received thousands of complaints about H2S odors. The letter mentions that there is no accurate national emissions inventory for H2S; the letter cites a US EPA estimate of 110 million pounds annually.
Oil refineries use acid gas scrubbers, estimating this population is speculative at best. Per the 2009 annual survey of refining capacity by Oil & Gas Journal, there are 130 oil refineries in the US (Texas: 23; Louisiana: 18; California: 15; single digit populations for the other 47 states).
Other industries that use acid gas scrubbers include:
• Semiconductor manufacturing • Food processing (kind of broad)(rendering plants) • Asphalt manufacturing • Metal casting (foundries) • Chemical manufacturing, especially the production of styrene • Surface coating operations • Wood products
If even half of these industrial processes use acid gas scrubbers, the number in use could well be in the thousands.
Table 7 below provides a summary of potential TMC applications and savings, with the data sources cited. Also included is a new application for residential furnaces that has just been developed and demonstrated. In this Table, researchers did not include the other acidic gas scrubbers mentioned above, because researchers could not find reliable data sources.
38

Table 6: Summary of TMC Potential Applications and Savings
Energy Saving (Trillion Btu/year)
Avoided CO2 (million tons/year)
Industrial and commercial boilers15 1,207 60.4
Coal fired utility boilers with FGD16 2,535 126.8
Refining industry with wet scrubbers 18.9 0.945
Portland cement industry with wet scrubber 2.6 0.13
Iron and steel industry with wet scrubbers 5.7 0.286
Pulp and paper industry with wet scrubbers 38.5 1.924
Residential home furnaces17 331 16.6
Total 4,139 207.1
Source: Gas Technology Institute
6.2 Commercialization The TMC technology has been licensed to Cannon Boiler Works, Inc. (CBW) for the industrial boiler application, with the trade name Ultramizer. Media & Process Technology Inc. (MPT) has provided the key material—ceramic membrane tubes. CBW has established the capability to assemble the TMC module, fabricate the TMC housing, and configure the control system independently. CBW is a well known, trusted supplier of boiler heat recovery devices including economizers, vent condensers, air coolers, after coolers, and other energy efficiency devices. They also have a non‐exclusive license from GTI to apply to the market sector beyond boiler applications. Below is an economic analysis for applying the TMC to waste heat and water recovery markets.
Because the TMC technology is being marketed as an energy and cost savings tool for the boiler and other industries, commercialization requires an accurate estimate of the capital and
15 “Characterization of the U.S. Industrial/Commercial Boiler Population” by Energy and Environmental Analysis, Inc. to ORNL, May 2005. Energy saving calculations are based on our demonstration experience with industrial boilers. 16 FGD data includes both wet and semi‐dry scrubbers. Energy saving calculations are based on our demonstration experience with industrial boilers. FGD is installed for about 20% of the US coal‐fired utility boiler, flue gases from non‐FGD units are also potential TMC users since many of the coals used are of high moisture content, but they are not counted in this report. 17 Residential Energy Consumption Survey, DOE Energy Information Agency, 2005. Residential home furnace energy saving calculation is based on our two home demonstrations from last year. Carbon saving calculation just bases on the energy savings.
39

operating costs and potential savings. In this section, researchers discuss two specific areas, the system cost projections provided by CBW, and the membrane cost and production economics and supply provided by MPT.
TMC Capital and Operating Costs In recent conversations with CBW, the economics of the TMC technology were revisited based upon the latest data available from MPT for TMC membrane element production, and CBW for module preparation, system construction, and system installation. The basis of the economic analysis presented here is a fully installed TMC unit in operation at the City Brewery in Latrobe, PA as a typical installation. Additional economic data was also compiled by CBW based upon the Rock Island Arsenal installation. For this economic analysis an expected standard commercial unit containing nine 389‐tube (ceramic) TMC modules (18” length, 80Å pore size, 3.1m2 of total surface area) and designed to recover heat and water from the flue gas of a 300 hp boiler burning natural gas. In addition to the TMC subsystem (TMC membranes, tube sheets, module framework, cold water pumping subsystem, vacuum pump, duct fan, and so forth) other major equipment includes the low and high pressure economizers (heat exchangers) and associated pumping and flue ductwork hardware.
Based upon discussions with CBW, the overall installed equipment cost for the system described above is $196,500. Of this total, approximately 32 percent (approximately $62,800) is attributable to the TMC tubes, end caps, tube sheets, housing/frame and labor, the tube cost in this installation is approximately $6,000. The balance of the capital cost includes the low and high pressure economizers and components that are shared by each of these subsystems including costs such as ductwork, pump, plumbing, control, installation and labor. It is difficult to separate the cost of a standalone TMC unit because it is generally not considered without including an integral low pressure economizer at a minimum. However, an estimate of the installed cost of a standalone TMC would be approximately $115,000.
CBW also provided estimates of the cost savings that can be achieved with a TMC unit (including integral low pressure economizer, with and without a high pressure economizer). Assuming 8,400 annual operating hours and natural gas at $8.50/MMBtu, Table 8 provides a comparison of the capital cost and energy cost savings of a typical 300 hp steam boiler operating at a base case of 80 percent efficiency with a standalone high pressure economizer(HPE), and then HPE with TMC and integral low pressure economizer (LPE). The fully integrated TMC with low and high pressure economizers is expected to boost the efficiency of the base case 300 hp boiler from about 80 to 95 percent. The annual fuel savings are estimated to be $141,000 per year yielding a capital payback in less than 18 months.
40

Table 7: Comparison of the Capital Cost and Energy Cost Savings
High Pressure TMC w/integralSystem Description Base Case Economizer Only LPE + HPESystem Efficiency 80% 85% 95%Fuel Savings / Year $0 $53,550 $141,000Equipment Cost $0 $33,000 $196,500Water Savings 0 0 Up to 58 gph
Source: Gas Technology Institute
Membrane Cost and Supply As noted above, the capital cost of the membrane tubes represents about 6 percent of the total cost of the base TMC unit and about 3 percent of the overall unit cost. For a total surface area of about 27m2, the tube cost is approximately $230/m2. At larger production scales, this cost can be reduced by up to 30 percent. However, given that the tubes represent less than 3 percent to 6 percent of the overall system cost, it is unlikely that the economics and commercial potential of the TMC technology in general will be dictated by tube production cost. Instead, membrane supply constraint issues may be a concern at very large scales and are addressed here.
Approximately 3,600 x 18” long tubes (approximately 5,400ft in total length) are required for the standard 300 hp installation. The tubes consist of a bare porous ceramic substrate and two ceramic coatings that yield a final membrane product with a pore sizes in the range of 80Å. The substrate is toll manufactured by Associated Ceramics Inc. (AC) and current production capabilities of AC exceed two million linear feet per month (or the equivalent of approximately 370 x 300 hp TMC units per month). Further, expansion of their production capabilities to over 3.5 million linear feet per month can be achieved with idled equipment. Beyond this scale, capital equipment purchases will be required to expand the facility production capabilities. All of the membrane layer deposition work is conducted by MPT at their facilities in Pittsburgh, including the newer acid resistant membrane developed in part in this project. Current tube layer deposition production capacity is on the order of 4,000 to 6,000 x 18” parts per week or about four 300 hp boiler equivalents per month. However, the limited layer deposition capacity is due to the use of laboratory technicians in part‐time as needed roles. Full scale production on the order of 2 to 3 million feet per month would require only modest layer deposition facility expansion but would necessitate hiring of full time production staff. These expenses will be modest and will ultimately lower the per unit membrane cost. In addition to the layer deposition requirement to meet the commercial scale tube demand, additional production furnaces will be required. Currently, firing capacity is limited to approximately 70,000 x 18” parts per month (equivalent to 20 x 300 hp TMC units). Beyond this in‐house firing capacity, AC can provide an additional 100,000 to 200,000 parts per month of spare furnace capacity. Finally, additional firing capacity can be installed at a relatively modest cost. Overall, membrane production capacity for the TMC application is likely sufficient for the next two to three years of commercialization efforts.
In summary, this field demonstration project has proved the TMC real world performance in a new application area, received acceptance from the industrial customer, and paved the way for
41

our commercial partner to put it into a much larger waste heat and waste water recovery market.
42

CHAPTER 7: Glossary CDF Computational Fluid Dynamics
GTI Gas Technology Institute
HAH Humidifying Air Heater
HPE High Pressure Economizer
LPE Low Pressure Economizer
RTO Regenerative Thermal Oxidizer
TMC Transport Membrane Condenser
VFD Variable Frequency Drive
43

ATTACHMENT U: Wet Scrubber and High-Moisture Exhaust Gas Market for TMC Technology
Wet Scrubber and High Moisture Exhaust Gas Market for Transport Membrane Condenser (TMC) Technology
C-10-008
to:
Gas Technology Institute 1700 S. Mount Prospect Avenue
Des Plaines, IL 60018
Final Report May 27, 2011
44

45
Contents
Sections Page
1. Background 48
2. Objectives 49
3. Program Results 50
Power Generation 50
Refining 55
Portland Cement 591
Iron and Steel 634
Pulp and Paper 70
Other Applications 73
4. Possible Future Work 806

Background
The Gas Technology Institute (GTI) is a not‐for‐profit Research and Development (R&D)
organization. For more than 65 years, GTI (or its predecessors, GRI and IGT) has been the leader
in the development and deployment of technology solutions that contribute to a secure,
abundant, and affordable energy future. As such, researchers provide economic value to the
energy industry and its customers, while supporting government in achieving policy objectives.
To date, GTI programs have resulted in nearly 500 products, 750 licenses, and more than 1,200
associated patents.
GTI has developed the Transport Membrane Condenser (TMC), which can enhance
thermal efficiency of processes that have high moisture waste gas. GTI is interested in better
understanding the market for the TMC technology.
46

Objectives
The objectives of this proposed effort are to:
• Identify high moisture content waste streams where GTI’s patented Transport Membrane Condenser (TMC) can be used to recover heat and water.
o Identify qualified waste heat streams in industries such as food, chemical, metal, forest, paper and biomass. An important area is exhaust from wet and dry scrubbers which typically have a high moisture content and low grade heat. Wet and dry scrubbers can be found in many industrial applications such as lime kilns, plating operations, sludge incinerators, odor control, and so forth.
Deliverables: A comprehensive report on high moisture content waste streams in industry including parameters such as typical exhaust temperature, flow rates and moisture concentrations
47
Program Results
1. Quantify and Characterize the Use of Wet Scrubbers in the Electric Utility Industry.
Power plant scrubbers fall generally into two categories – wet and semi‐dry. The wet
scrubbers are mostly limestone forced oxidation (LSFO) scrubbers. A small number of wet
scrubbers use lime rather than limestone. In either wet scrubber case the inlet and exit gas
conditions are similar with the only major difference being the amount and cost of reagent used
and the amount of water used. Since exit gas is saturated (at dew point), in either case (lime or
limestone wet scrubber) the moisture level is temperature dependent.
Another scrubber type is semi‐dry , and is most often a spray drier absorber (SDA).
These scrubbers use lime reagent. Water is added, but only to a point where the dew point is
approached. A typical approach to saturation temperature is 15‐20°F, or 15‐20°F above the dew
point.
Figure 1 shows a wet scrubber. The most common wet scrubber is a spray tower, where
levels of slurry spray are admitted into an open vessel with the gas flow upward. When the
scrubber uses reagents that are soluble in water (such as caustic) as opposed to slurries (calcium
reagents), the absorber may be partially filled with packing material to improve liquid‐gas
contact. There are other configurations as well. Figures 2a and 2b show absorber vessels.
Because an LSFO system operates at low temperatures it is usually the last pollution
control device before the chimney. As Figure 3 shows, the LSFO absorber is usually located
downstream of the particulate matter (PM) control device (in this case an electrostatic
precipitator) and immediately upstream of the stack. As a result, LSFO scrubber is frequently
used to treat the exhaust gas of multiple devices (typically boilers when used in power plant
applications) with the gases being emitted through a common stack. In fact, depending upon
the fuel type and the absorber design, modern LSFO systems at power plants are capable of
treating up to roughly 1000 MWe (megawatts electric) equivalent of flue gas in a single
absorber. As a result, it is possible for three 300 MWe units to be served by a single LSFO
absorber vessel.
48

49
Figure 1. Wet Scrubbing Process Diagram 18
Figure 4 shows the process diagram
for a Spray Dryer Absorber (SDA). The lime
and water are introduced in the SDA vessel
and the dried product is captured in a
downstream collection device. SDAs are
typically capable of handling up to the
equivalent of about 300 MWe of flue gas. So,
for boilers larger than 300 MWe, multiple
systems are often needed.
Figure 2a. A Wet FGD Absorber Vessel 19 Figure 2b. Photo of a wet FGD Absorber Vessel 20
18 Srivastava, R., “CONTROLLING SO2 EMISSIONS: A REVIEW OF TECHNOLOGIES”, U.S.
Environmental Protection Agency, EPA‐600/R‐00‐093, October 2000
19 Babcock & Wilcox Company, Steam It’s Generation and Use, 40th edition, The Babcock & Wilcox Company, 1992
20 http://www.wapc.com/scrubber.htm

Figure 3. Location of a Wet FGD Absorber 19
Figure 4. A flow diagram for a spray dryer used for air pollution control
21 Scrubbers are typically used on boilers to remove oxides of sulfur, and therefore are
normally on coal‐fired boilers. As of January 1, 2010 there were roughly 315 GW (nearly 1100
21 GEA Niro web site: http://www.niro.com/niro/cmsdoc.nsf/webdoc/ndkk5hveag!OpenDocument&Click=
50

boiler units) of coal‐fired electric generating capacity in the US. Of this, nearly half of this
capacity was scrubbed in some manner with most using wet flue gas desulfurization (FGD) and
a smaller portion using spray drier absorber (SDA) or similar technology. Table 1 shows the
breakdown of capacity, boilers and estimated total scrubber inlet gas flow in acfm as well as
estimated stack exit gas flow in acfm for all large electric utility boilers that report under Title IV
of the 1990 Clean Air Act Amendments (CAAA).22 This includes all large, coal‐fired electric
utility boilers. As shown, 65 percent of coal fired power plant boilers are not scrubbed
although about half of all capacity is scrubbed. This is because scrubbers are typically installed
on the largest boilers since smaller boilers are less economical to scrub. The flowrates shown in
Table 1 are estimated based upon typical flow assumptions and engineering calculations.
Typical scrubber inlet conditions are roughly 300°F and a slight vacuum to atmospheric
pressure. Moisture level at inlet conditions will vary according to fuel characteristics. For the
most common fuel fired in situations where there are wet scrubbers, bituminous coal, scrubber
inlet moisture level is typically around 8 percent by volume. In cases where sub‐bituminous
coals are fired (these would typically be used with semi‐dry systems), inlet moisture level is
around 12 percent by volume.
Typical wet scrubbers (normally installed on bituminous coal fired boilers) exit
conditions are in the range of 125‐130°F and saturated conditions. For semi‐dry scrubbers that
most often fire sub‐bituminous coal (which has a higher moisture content than bituminous
coal)‐, the typical exit temperature is around 145°F and about 15‐20°F above dew point.
Table 1. Coal Fired Power Plant Scrubbers Reporting Under Title IV of the 1990 CAAA.22
Scrubber type Sum of Capacity (MW) # boilers Estim. Total Inlet acfm Estim. Total Exit acfm
FGD (wet) 138,115 296 501,637,381 426,391,774
SDA (semi‐dry) 21,920 90 81,862,714 68,764,680
No scrubber 154,773 710 576,461,511 576,461,511
Grand Total 314,808 1096 1,159,961,606 1,071,617,965
22 This is developed from US EPA Emissions Reporting data as well as engineering calculations for gas flowrate.
51
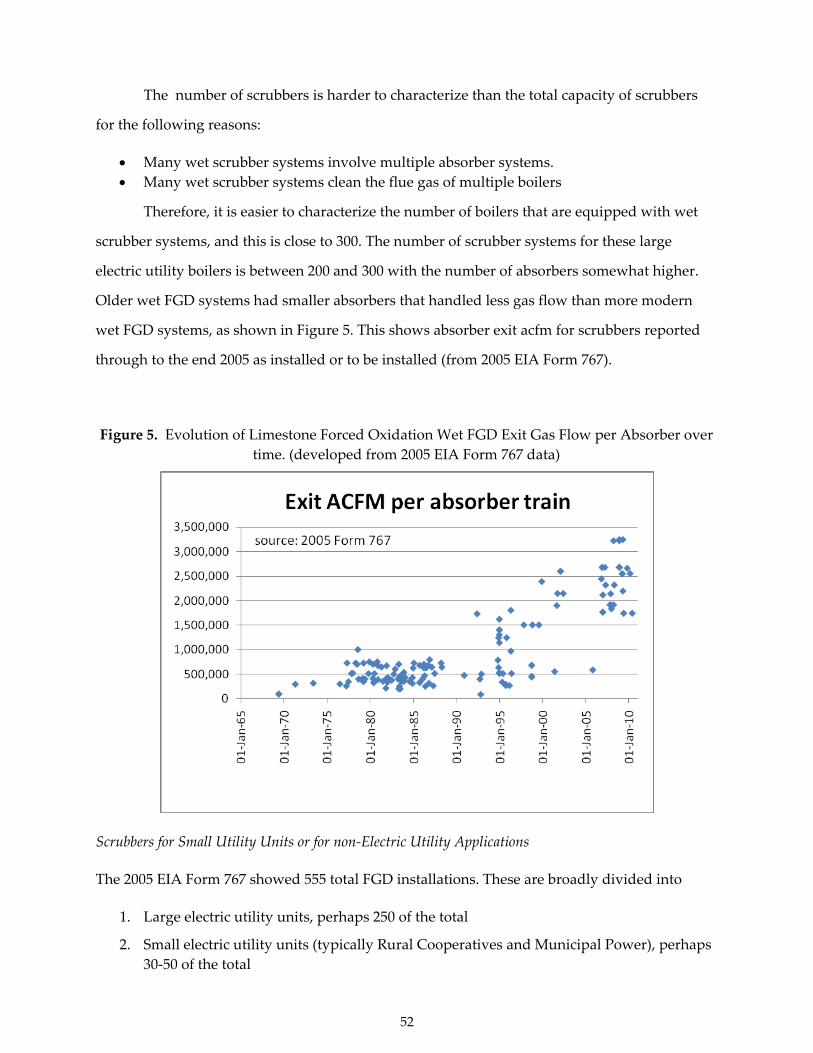
The number of scrubbers is harder to characterize than the total capacity of scrubbers
for the following reasons:
• Many wet scrubber systems involve multiple absorber systems. • Many wet scrubber systems clean the flue gas of multiple boilers
Therefore, it is easier to characterize the number of boilers that are equipped with wet
scrubber systems, and this is close to 300. The number of scrubber systems for these large
electric utility boilers is between 200 and 300 with the number of absorbers somewhat higher.
Older wet FGD systems had smaller absorbers that handled less gas flow than more modern
wet FGD systems, as shown in Figure 5. This shows absorber exit acfm for scrubbers reported
through to the end 2005 as installed or to be installed (from 2005 EIA Form 767).
Figure 5. Evolution of Limestone Forced Oxidation Wet FGD Exit Gas Flow per Absorber over time. (developed from 2005 EIA Form 767 data)
Scrubbers for Small Utility Units or for non‐Electric Utility Applications
The 2005 EIA Form 767 showed 555 total FGD installations. These are broadly divided into
1. Large electric utility units, perhaps 250 of the total
2. Small electric utility units (typically Rural Cooperatives and Municipal Power), perhaps 30‐50 of the total
52

3. municipal waste incinerators – about 135 of the 555
4. industrial boilers, municipal and university heating boilers – the balance – roughly 120‐140 boilers
The first category has been discussed. Small electric utility boilers will be very similar to
coal‐fired industrial boilers, municipal and university heating system boilers. These typically do
not use the spray tower wet scrubbers used by large electric utility boilers. They typically use
spray dryers or Venturi wet scrubbers. Municipal waste incinerators typically use spray dryers
followed by fabric filters, and often have higher exhaust temperatures – closer to 300F.
Industrial boilers, municipal and university heating boilers are the final category, and these
typically use spray dryers with fabric filters (sometimes with an ESP instead of a fabric filter) or
they use Venturi scrubbers.
Trends in the use of wet scrubbers in the Power Industry.
Wet scrubbers have become more widespread in the power industry in recent years as a
result of tightening requirements on SO2 and acid gas emissions. These requirements are
expected to become even stricter with EPA’s newly proposed Transport Rule. Scrubber usage
may increase further to near two thirds of all installed coal power plants. Future scrubbers on
existing power plants will generally be smaller in size than many recently installed scrubbers
because recent scrubbers have been installed on larger plants due to the more favorable
economics. There will also likely be a trend toward semi‐dry scrubbers (similar to SDA) on
smaller facilities because they are simpler and they more economical to install on smaller
facilities.
Internationally, the major growth area for wet scrubbers is Asia, especially China and
India as these countries rapidly industrialize with mostly coal‐fired generation. In Western
Europe scrubbers are fairly widespread on coal and the small number of heavy oil fired boilers.
Eastern Europe may also be a growth area for scrubbers as these countries strive to meet EU
requirements.
2. Quantify and Characterize the Use of Wet Scrubbers in the Refining Industry.
According to the Energy Information Administration (EIA), there are 137 operable
refineries plus 11 idled refineries in the United States with a total refining capacity of over 17
million barrels per day. Fluid Catalytic Cracking Units (FCCUs) are the devices used at
53

refineries to break the crude into lighter, more usable products. The sulfur in the crude
contributes to acid gas emissions from the FCCU. Refineries utilize one of four approaches to
control SO2 emissions from the FCCU.
• Use of naturally low sulfur crude • Pre treatment of crude by catalytic hydrotreating to remove sulfur (used at most US
refineries) • Use of DeSOx catalyst in the FCCU • Use of a wet scrubber.
Worldwide, there are roughly 100 wet scrubbers installed at refinery FCCUs, with about
60 of these in the US. Thus, while most refineries use other methods for controlling sulfur
emissions, scrubbers have a reasonable share. The wet scrubbers used in refineries are very
different than those used in utility applications. This is because a refinery must be able to run
for roughly three years continuously without a maintenance shutdown, which means the
scrubber must have the same ability to run for a long time without a maintenance shutdown.
The scrubbers used at refineries are typically Venturi scrubbers that remove both particle matter
and SO2 using a 100 percent aqueous solution (most often caustic) as reagent rather than the
calcium reagent slurries typical for power plants. A Venturi scrubber (the Belco EDV scrubber)
is shown in Figure 6. The Belco EDV scrubber is the most widely used scrubber for this purpose
(80 of the 100 scrubbers worldwide). Acid gases are removed from the raw exhaust gas in the
absorber. Caustic is typically used as the reagent for capturing acid gases. Particle matter is
removed in the Venturi scrubber as moisture condenses on the particles and they are removed
with water in the Filtering Module. Droplets of moisture are further removed in the Droplet
Separators.
Inlet conditions for an FCCU scrubber are on the order of 550°F and roughly 600 lb. (244
acfm) of flue gas per barrel of crude processed. Exit gas conditions will vary somewhat from
one facility to another, but the following conditions should be regarded as representative for a
relatively small wet scrubbing system on a refinery FCCU exhaust:
1. outlet flue gas is 273,890 lb./hr. (mass) 2. Temperature ‐‐‐‐‐‐‐‐‐‐‐‐‐‐‐‐ 145 oF 3. Humidity ‐‐‐‐‐‐‐‐‐‐‐‐‐‐‐‐‐‐‐‐‐ 19.8 percent ( percent volume wet) 4. Specific Heat Cap. ‐‐‐‐‐‐ 1.56 BTU/lb oF 5. Enthalpy ‐‐‐‐‐‐‐‐‐‐‐‐‐‐‐‐‐‐‐‐‐ 48.3 MMBTU/hr
54

6. Actual gas flow ‐‐‐‐‐‐‐‐‐‐‐‐ 72,128 ACFM 7. Gas Flow ‐‐‐‐‐‐‐‐‐‐‐‐‐‐‐‐‐‐‐ 62,550 SCFM at 68 F 8. Density ‐‐‐‐‐‐‐‐‐‐‐‐‐‐‐‐‐‐‐‐‐‐ 0.063 LB/FT3 9. Mass Water Flow ‐‐‐‐‐‐‐‐ 37,445 LB/HR 10. O2 ‐‐‐‐‐‐‐‐‐‐‐‐‐‐‐‐‐‐‐‐‐‐‐‐‐‐‐‐ 1,796 LB/HR 11. Nitrogen ‐‐‐‐‐‐‐‐‐‐‐‐‐‐‐‐‐‐‐‐ 176,038 LB/HR 12. CO2 ‐‐‐‐‐‐‐‐‐‐‐‐‐‐‐‐‐‐‐‐‐‐‐‐‐ 58,590 LB/HR 13. SO2 ‐‐‐‐‐‐‐‐‐‐‐‐‐‐‐‐‐‐‐‐‐‐‐‐‐‐‐ 7.5 LB/HR 14. SO3 ‐‐‐‐‐‐‐‐‐‐‐‐‐‐‐‐‐‐‐‐‐‐‐‐‐‐‐ 2 LB/HR 15. NO ‐‐‐‐‐‐‐‐‐‐‐‐‐‐‐‐‐‐‐‐‐‐‐‐‐‐‐ 1 LB/HR 16. NO2 ‐‐‐‐‐‐‐‐‐‐‐‐‐‐‐‐‐‐‐‐‐‐‐‐‐ 4 LB/HR 17. Particulate ‐‐‐‐‐‐‐‐‐‐‐‐‐‐‐‐‐‐ 6 LB/HR 18. Flue gas pressure ‐‐‐‐‐‐‐‐ 0 psig 19. Particulate ‐‐‐‐‐‐‐‐‐‐‐‐‐‐‐‐‐‐ 6 LB/HR 20. Flue gas pressure ‐‐‐‐‐‐‐‐ 0 psig
Source: e-mail from N. Confuorto, Belco Technologies, 8/2/2010
Thus, total gas flow being treated with wet scrubbers in this sector is at least 3.73 million
SCFM (60 scrubbers) in the US and at least about 6.25 million SCFM (100 scrubbers) worldwide.
Trends in the use of wet scrubbers in the refining industry.
There is limited opportunity for the installation of new scrubbers in the United States, as
the market is nearly saturated. Only about 4 or 5 new opportunities remain. The opportunities
for new wet scrubbers are mainly in Asia and in the Middle East, as this is where there is the
largest growth in refining capacity.
55

Figure 6. The Belco EDV Scrubber 23
23 Confuorto, N., Weaver, E., “FLUE GAS SCRUBBING OF FCCU REGENERATOR FLUE GAS
PERFORMANCE, RELIABILITY, AND FLEXIBILITY A CASE HISTORY”, Belco Technologies Corporation, EDV 765
56

3. Quantify and Characterize the Use of Wet Scrubbers in the Portland Cement Industry.
The Portland Cement industry is an industry where wet scrubber use is currently fairly limited; only five kilns in the US are scrubbed. Table 2 shows the different kiln types and capacity (in tons per year of clinker – the main ingredient in Portland Cement) in the US.
As shown, wet process and long dry kilns are the oldest technology and they tend to be
the smallest and least efficient kilns. All new kilns are precalciner kilns, as these are the most
efficient kilns available. Of the five kilns that have wet scrubbers, all are on precalciner kilns –
five on new kilns and one on a kiln that was refurbished and converted to modern precalciner
technology.
Table 2. Cement Kilns in the United States (developed from ref. 24)
Number Total Capacity
(tpy) Average kiln capacity (tpy)
Average kiln flowrate, dscfm*
Total kiln flowrate,
million dscfm*
Average year on line
Wet Process 50 16,937,008 338,740 71,609 3.58 1959
Long Dry 49 15,193,152 310,064 65,547 3.21 1958
Preheater 36 19,158,165 532,171 112,500 4.05 1976
Precalciner 47 51,749,092 1,101,045 232,759 10.94 1989
Total 182 103,037,418
* Average kiln flowrate estimated based upon 90% capacity factor and 100,000 dscf/ton clinker
For cement kilns, SO2 emissions are generally not from the combustion of fuel, although
the most widely used fuel is coal. SO2 formed from coal sulfur is generally captured efficiently
within the calcining region of the kiln where there is available free lime to react with the SO2.
The SO2 from a cement kiln is mostly from the sulfur in the raw materials that is released in the
raw mill. Therefore, the SO2 emissions from a cement kiln – absent a scrubber – depend
primarily upon the raw materials as well as the kiln configuration.
Wet scrubbers on cement kilns that are in operation are either of the froth zone (MECS
Dynawave) type or are of the spray tower type (similar to electric utility wet scrubbers). Froth 24 Developed from data from US EPA Information Collection Request for Portland Cement NESHAP http://www.epa.gov/ttn/atw/pcem/pcempg.html
57
zone scrubbers are simpler and less expensive than spray tower technology; but the extensive
experience with spray towers in the utility industry suggests that higher removal efficiencies
are possible and high quality gypsum can be produced. Moreover, spray towers are well suited
for very high volume gas flowrates, which is favorable for large, new precalciner kilns. Figure 7
shows a Dynawave froth zone scrubber.
Gas flowrate from a cement kiln can vary by kiln type and by the equipment that is
installed at the facility; however, as Table 3 shows, a rough estimate of 100,000 dry scf per short
ton of clinker is a reasonable estimate for stack gas flowrate (scrubber inlet flowrate). Scrubber
exit conditions would be similar to those of an electric utility wet scrubber.
58

Figure 7. Dynawave reverse jet scrubber
(MECS web site: http://www.mecsglobal.com/howthe‐dynawave‐wet‐gas‐scrubber‐works.aspx)
59

Table 3. Stack flowrates and temperatures from a select number of kilns (developed from data from US EPA) 24
Gas Flow -dscf/short ton feed
Gas Flow -dscf/short ton clinker
Stack Temp - deg F
number of kilns*
All Kilns Average 62,586 103,266 351
57* Median 59,112 97,534 330
Dry Average 64,074 105,722 379
15* Median 60,171 99,283 375
Preheater Average 62,513 97,669 438
10* Median 49,104 79,119 398
Precalciner Average 61,182 100,951 266
18* Median 56,214 92,752 259
Wet Average 63,249 104,361 363
14* Median 65,457 108,004 347
* This represents the number of kilns where data was available.
Trends in the Portland Cement industry
The Portland Cement industry is faced with the need for improved acid gas (HCl in
particular) controls on existing kilns due to recently proposed rules by US EPA. This will force
at least some Portland Cement kilns to install wet scrubbers or other devices for acid gas
control. Due to the high capital cost of wet scrubbers, it would be far more economical to install
them on large, precalciner kilns rather than other kiln types that are smaller and less efficient.
There has been a general trend in replacing wet kilns with large precalciner kilns. Some of these
wet kilns continued to operate rather than be mothballed during the middle part of this last
decade due to very high demand for Portland Cement; however, the recent downturn in the
economy is forcing many cement manufacturers to mothball their older wet and long dry kilns
that are reaching their end of useful life and in the future they will rely more heavily on their
more modern kilns.
For a new kiln, there are other technologies that might be used in lieu of wet scrubbers
that may be determined to provide adequate SO2 removal in a BACT analysis, but it is unclear if
these will provide adequate removal of HCl and other hazardous air pollutants. As a result,
60

although researchers should expect to see increased use of wet scrubbers on existing and new
precalciner kilns (and on some existing preheater kilns), it is unclear how many precalciner
kilns will actually use wet scrubbers. I would not expect to see wet scrubbers installed on many,
if any, wet process or long dry kilns because these plants are generally less economical to
operate and are likely to be discontinued in favor of more modern kiln systems.
4. Quantify and Characterize the Use of Wet Scrubbers in the Iron and Steel Industry.
Integrated steel mills produce steel from ore, rather than recycled steel as in the case of
mini‐mills. Wet scrubbers are used in a number of applications in integrated steel mills. In an
integrated steel mill the ore is first sintered and then combined with coke in a blast furnace (BF)
where the BF reduces the ore to hot metal (pig iron) with a carbon content in the range of about
4 percent. The hot metal is converted to steel in the basic oxygen process furnace (BOPF)
through oxidation of the carbon to reduce carbon levels to about 1 percent or less.
Sinter Lines
Sinter lines, which prepare sintered
ore for use in the blast furnace, and blast
furnaces themselves also use scrubbers for
PM an SO2 control. Sinter lines use Venturi
scrubbers for air pollution control. There are
4 sinter lines at US integrated mills that use
scrubbers. Data on gas flow and gas
conditions was not available. Gas conditions,
however, are expected to similar to those of
other Venturi scrubbers (about 140‐150°F and saturated air).
# of Blast Furnaces 30
Total Capacity (TPY) 53,100,000
Avg Capacity (TPY) 1,770,000
Avg BFG (lb/hr) 990,000
Avg BFG (scfm) 220,000
Total flow all BFs, scfm
6.6 million
Table 4. Statistics on US Blast Furnaces 7
Blast Furnaces
Blast Furnaces (BFs) use scrubbers to clean the Blast Furnace Gas (BFG) of particle
matter, not for the purpose of air pollution control. For every ton of hot metal produced by the
BF, there are roughly 2.2 tons of BFG, 0.084 tons of moisture, and 0.043 tons of particulate in the
top gas that is vented to the Venturi scrubber. Figure 8 is a process description for a BF with the
61

62
Venturi scrubber highlighted. BFG is a low BTU gas (typically under 100 BTU/scf) produced
from the BF from oxidation of coke that is used as a reducing source in the BF process. BFG is
used as a fuel for the BF as well as in boilers, ovens or furnaces at the mill. Table 4 shows the
number and capacity of BFs in the United States 25 and estimated average BFG flow assuming
2.2 tons BFG per ton of hot metal, a relative density of BFG to air of 1.04 and an annual
utilization factor of 90 percent for the BF. Average BFG flow will be less than peak flow, as a blast
furnace operates as a batch process.
25 Developed from data collected for US EPA’s Information Collection Request for Iron and Steel Foundry NESHAP; http://www.epa.gov/ttn/atw/ifoundry/ifoundrypg.html

Figure 8. Flow diagram depicting the principal units and auxiliaries in a blast furnace plant, and showing the steps in the manufacture of pig iron from receipt of raw materials to disposal of pig iron and slag, as well as the methods for treating and utilizing the furnace gases
63

64
The Making, Shaping, and Treating of Steel 11th Ed, Ironmaking Volume. (1999), David Wakelin, Editor, Association for Iron and Steel Technology,
Warrendale, PA,

From this data there are 30 or more Venturi scrubbers used at BFs for this purpose.
These Venturi scrubbers tend to be very high pressure drop scrubbers, with typically 25 IWC or
more pressure drop.
Steel production – the Basic Oxygen Process
In the Basic Oxygen Process Furnace (BOPF) the carbon in the iron is burned off to
produce steel. This is done by injecting oxygen into the hot metal to reduce the carbon content
from about 4 percent to less than 1 percent. Feed includes mostly hot metal, but also typically
includes some scrap steel. Because the reactions to convert hot metal to steel are exothermic,
fuel requirements are small. Table 5 shows the Inputs and Outputs for every 1000 kg (2200 lb)
of steel.
Table 5. Inputs and Outputs for every 1000 kg (2200 lb) of steel (Fruehan, 1998 p 501)
Inputs Outputs
1931 lb of hot metal
442 lb of scrap
37 lb of ore
125 lb of limestone/dolomite (105 lb of CaO)
166 lb of oxygen
2200 lb of steel
220 lb of slag
61 lb iron fumes
188 lb CO
33 lb CO2
The Making, Shaping, and Treating of Steel 11th Ed, Steelmaking and Refining Volume. (1998), Richard Fruehan, Editor, The AISE Steel Foundation, Pittsburgh, PA Table 6. Estimate of gas flowrate to air
pollution control (APC) equipment for production of 2200 lb of steel in closed‐hood
BOPF.
BOF Outlet
Mol Wt
Venturi scrubbers are the most
commonly used device to capture PM
from the BOPF exhaust and are necessary
for closed‐hood BOPFs. The Venturi
scrubber has traditionally been used in
lieu of electrostatic precipitators and
fabric filters for closed hood BOPFs
because of the combustible nature (high
lb lb mol
CO2 44 33 0.750
CO 28 188 6.714
Total 221 7
scf estimate 2,733
65

CO content) of closed hood BOPF exhaust gases and the need for high reliability with long
times between maintenance shutdowns. For open hood BOPFs, they may have scrubbers or
ESPs since the CO gets burned off to CO2. SO2 emissions are generally not a concern for BOPFs.
There are a total of 46 Basic Oxygen Furnaces (BOPFs) at 18 integrated steel mills in the United
States. Of these 46 BOPFs, 34 have scrubbers. Table 6 shows estimated gas flows exiting a
closed hood BOPF and going into the air pollution controls assuming roughly 366 scf/lb mol of
gas. For a short ton of steel (2000 lb) the flow to the wet scrubber would be roughly 2,460 scf per
ton versus 2,733 scf per metric ton. For open hood BOPFs the gas flowrate would be roughly
five times that of a closed hood BOPF due to the additional air.
Table 7 shows the statistics on US BOPFs including estimated average BOPF exhaust gas
flow. Average flow is less than peak flow, as a BOPF is a batch process. There can be multiple
scrubbers for any given BOPF. This is to provide redundancy as well as due to limitations in
scrubber size. A reasonable estimate is 3 scrubbers per BOPF. With this assumption, there are
roughly 100 scrubbers installed on BOPFs in the United States.
Table 7. US Basic Oxygen Process Furnace Statistics and estimated average BOPF gas flow for scrubbed units (Developed from data collected for US EPA) 26 and Table 6 data
# BOPFs Capacity, tpy Est. avg. gas flow, scfm
Est. total gas flow, scfm
Closed Hood with scrubber 9 10,360,000 6,650 59,850
Open hood with scrubber 25 36,412,000 42,074 1.105 million
Total Scrubbed BOPFs 34 46,772,000
1.165 million
All US (incl. unscrubbed) 46 64,712,000
The conditions at the exit of the wet Venturi scrubber would be roughly 140‐150°F and
saturated humid air; however, it should be kept in mind that for closed hood BOPFs the exhaust
gases are combustible and are normally flared at the stack to eliminate the CO.
26 Developed from data collected for US EPA’s Information Collection Request for Iron and Steel Foundry NESHAP; http://www.epa.gov/ttn/atw/ifoundry/ifoundrypg.html
66

Trends in the use of wet scrubbers in the iron and steel industry.
Integrated steel mills are under pressure, especially in light of the recent economic
downturn. It is likely that the use of wet Venturi scrubbers will continue in the industry;
however, it is not likely that many new steel mills will be built. The majority of steel in the US is
recycled steel from electric arc furnaces at mini‐mills, and this share is growing. One steel mill
to produce steel from taconite ore is planned in Minnesota. Most other new steel mills to
produce steel from ore are overseas. Moreover, new integrated steel mills will use different
technology – most likely some form of direct reduction of iron for iron production (currently
planned for Minnesota Steel) and electric arc furnace for steel production. Venturi scrubbers
will likely be used to some degree at these mills – especially for gas cleaning of ore preparation
equipment, but not to the extent that they are used at in BFs and BOPFs.
67

5. Quantify and Characterize the Use of Wet Scrubbers in the Pulp and Paper Industry.
ATP’s database (based on data collected for US EPA) of Pulp and Paper industry boilers
lists 475 boilers in all, with descriptions of the control equipment, capacity and fuel. Of these
475 boilers, 78 boilers were listed have having wet scrubbers, Venturi scrubbers, alkali
scrubbers or spray towers. The database does not show the scrubber reagent, although, the most
widely used scrubber (typically referred to as a wet scrubber) in this industry is the caustic‐
based Venturi scrubber because of the simplicity, low cost, and the fact that the by product can
be used as make up for the Kraft pulping process. Since every one of the 78 scrubbed boilers is
located at a Kraft process mill, it is reasonable to assume that they are virtually all caustic
reagent scrubbers. Table 9 shows the breakdown of these 78 units by fuel and source type
(boilers, gasifiers, recovery furnaces), heat input capacity, and the average estimated exhaust
gas flowrate assuming 15 percent excess air and 15 percent volume for moisture and F factors
from the NCASI . 27 The boiler that is listed as firing distillate oil, most likely also fires residual
fuel oil and liquid waste.
27 National Council for Air and Stream Improvement, Inc. (NCASI). 2004. Compilation of criteria air
pollutant emissions data for sources at pulp and paper mills including boilers. Technical Bulletin No. 884. Research Triangle Park, N.C
68

Table 9. Scrubbed Pulp and Paper Boiler Summary
(developed from data from US EPA28)
Fuel Source Tot. Heat In, MMBtu/hr
Total Units
Avg. estim.
dscfm Tot. estim.
dscfm
Bituminous/Subbituminous Coal, Wood/Bark Waste Boiler 5,633 11 96,379 1.06 million
Distillate Oil - Grades 1 and 2 Oil Boiler 360 1 63,618 63,618
Liquid Waste, Natural Gas, Residual Oil, Wood/Bark Waste Boiler confidential 1
Residual Oil, Wood/Bark Waste, Waste Oil Boiler 5,650 14 71,314 1.0 million
Wood/Bark, Residual Oil, Process Gas Boiler 28,198 48 106,514 5.11 million
Black Liquor Gasifier 15 1
Black Liquor RF-DCE 930 2 80,213 160,426
Only two spray towers were identified in the database – one on a coal fired boiler and
another on a wood fired boiler. It is reasonable to assume that all of these scrubbers are caustic
reagent scrubbers, and it is reasonable to assume that nearly all are Venturi scrubbers. As a
result, the gas conditions in terms of temperature, pressure and moisture level would be very
similar to what is experienced in other Venturi scrubber applications, such as refinery FCCU.
28 This data was developed from US EPA’s ICI Boiler and Pulp and Paper NESHAP Information
Collection Requests, http://www.epa.gov/ttn/atw/pulp/pulppg.html, and http://www.epa.gov/ttn/atw/boiler/boilerpg.html
69
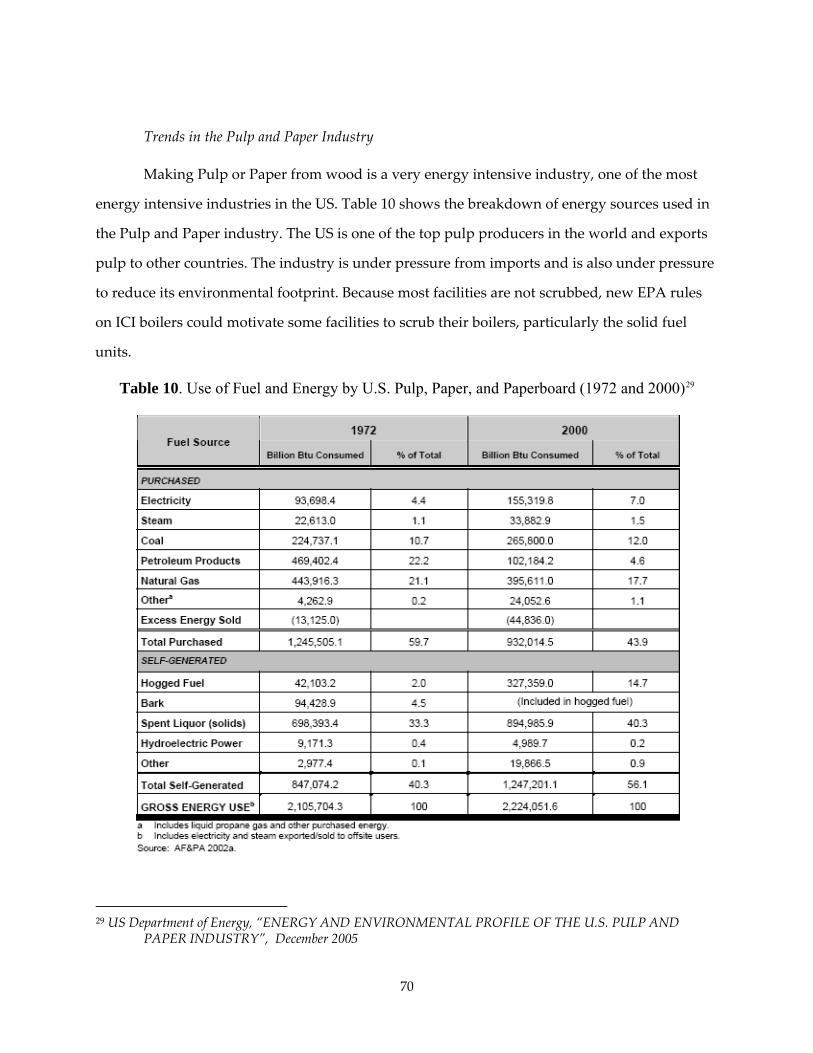
Trends in the Pulp and Paper Industry
Making Pulp or Paper from wood is a very energy intensive industry, one of the most
energy intensive industries in the US. Table 10 shows the breakdown of energy sources used in
the Pulp and Paper industry. The US is one of the top pulp producers in the world and exports
pulp to other countries. The industry is under pressure from imports and is also under pressure
to reduce its environmental footprint. Because most facilities are not scrubbed, new EPA rules
on ICI boilers could motivate some facilities to scrub their boilers, particularly the solid fuel
units.
Table 10. Use of Fuel and Energy by U.S. Pulp, Paper, and Paperboard (1972 and 2000)29
29 US Department of Energy, “ENERGY AND ENVIRONMENTAL PROFILE OF THE U.S. PULP AND
PAPER INDUSTRY”, December 2005
70

It is not likely that researchers will see many new Pulp and Paper mills in the US, but
researchers may see substantial modernization of facilities. An option being considered is
gasification of biomass and/or black liquor to produce syngas that can be fired in a gas turbine
or be used in a biorefinery. Gasification has been studied by DOE and offers some energy and
environmental advantages; however, it is very capital intensive. Because gas cleaning uses other
methods to clean the gas, wet scrubbers are not expected to be used in these applications.
However, because these methods are so capital intensive, it is more likely that Pulp and Paper
mill modernization programs would entail more efficient versions of conventional technology,
such as higher pressure steam systems with modern higher pressure boilers that allow more
electricity to be produced on site from the more efficient steam cycle, as well as conversion of
older direct contact evaporator recovery furnaces with non‐direct contact evaporator recovery
furnaces.
6. Review of other industries (non wet scrubber or wet scrubber) in which the TMC may be applicable to
include: paper drying, powdered foods, sludge incineration.
This section provides a high level review of other applications (including non wet
scrubber) where the TMC may be applicable. This includes paper drying, food drying
(powdered foods) and municipal sludge incineration. This analysis focuses more on industry
trends, industry structure, equipment and energy use and characteristics of gas, where data is
available.
Paper drying
In 2000, 499 paper and/or paperboard mills and 176 pulp mills operated in the United
States, including integrated pulp and paper mills. Integrated mills share common systems for
generating energy and treating wastewater, and eliminate transportation costs for acquiring
pulp, making them overall more energy and resource efficient than nonintegrated mills. Most
paper mills, however, are nonintegrated mills. Nonintegrated mills must obtain pulp from
another source but are typically smaller and can be sited in urban locations. An example of a
non‐integrated mill would be a newsprint recycling plant or a plant that converts purchased
pulp into paper.
71

Figure 10 shows how paper is produced from pulp. There are numerous steps along the
way, but as shown in Table 11, drying is the most energy intensive step in the papermaking
process (making paper from pulp).30 In the drying section, steam heated rollers compress and
dry the sheet through evaporation, which facilitates additional bonding of fibers. Figure 11
shows a Fourdrinier system for producing paper, which is the most common method for paper
production. The figure shows the drying section and a steam heated dryer roller that would be
incorporated into a Fourdrinier system. At the beginning of the Fourdrinier system the pulp
suspension is dispersed uniformly in the head box, dewatered, and pressed to produce wet
paper, the moisture content of which is approximately 20 to 50 percent. The remaining water is
removed by evaporation. This is achieved by passing the sheet through a steam heated roll in a
closed dryer. The water is evaporated by recirculating hot (50 to 120 °C), low‐humidity air
through the dryer. To maintain the specified air humidity (which will be vary by paper type),
humidity meters are installed at several locations in the dryer. The moist air from the dried
paper is collected in a hood and vented.
Figure 10. Making paper from pulp 29
30 Pulp manufacturing is somewhat more energy intensive than papermaking.
72

Table 11. Energy Consumption in Papermaking (Million Btu per Ton of Finished Paper) Process Steam Electricity Fuel TOTAL Paper Refining and Screening 0.84 0.84 Newspaper Forming, Pressing and Finishing 1.44 1.44 Newsprint Drying 4.07 0.10 4.17 Tissue Forming, Pressing, Finishing 1.82 1.82 Tissue Paper Drying 4.0 0.45 3.50 7.95 Uncoated Paper Forming, Pressing, Finishing 1.80 1.80 Uncoated Paper Drying 5.0 0.10 5.10 Coated Paper Forming, Pressing, Finishing 1.80 1.80 Coated Paper Drying 5.2 0.10 5.30 Linerboard Forming, Pressing, Finishing 0.92 0.92 Linerboard Drying 4.0 0.05 4.05 Papermaking Average (6.26x10⁶ Btu/ton) Total Papermaking Energy Use/Yr: 554x1012 Btu (based on annual paper production of 88.4 million tons of paper and paperboard)
US Department of Energy, “ENERGY AND ENVIRONMENTAL PROFILE OF THE U.S. PULP AND PAPER INDUSTRY”, December 2005
73

Figure 11. The Fourdrinier process for making paper, and a dryer drum.
(US DOE 200529 and GL‐V website31)
As Table 11 shows, the drying is, by far, the step that consumes the most energy in
converting pulp to paper– and most of this is steam that is produced from on‐site process steam
boilers. Because the majority of the energy demand from papermaking is in the drying process,
a means for improving the energy efficiency of the process should be very beneficial. For this
reason, if the TMC can significantly reduce energy demand, it should be attractive for paper
producers.
The paper industry is a very cyclical industry that varies with the global economy. The
majority of paper product is paperboard (which is used for making cardboard, boxboard and
corrugated cardboard, and so forth), as shown in Table 12. Some sectors are experiencing
structural changes that are reducing demand, especially demand for newsprint.
31http://www.glv.com/Pulp_Paper/Paper_Technologies/Dryer_System/Steam_Heated_Paper_Dryers/
ProductDescription.aspx
74

Table 12. Production of Paper and Paperboard Products (2003)
Product Million Tons/Year
% of Production
Newsprint 5.7 6% Tissue Paper 7.1 8% Printing/Writing Paper 23.7 26% Packaging/Industrial Papers 3.9 4% Total Paper 40.4 44% Total Paperboard 49.4 56% TOTAL Paper/Paperboard 89.8 100%
US Department of Energy, “ENERGY AND ENVIRONMENTAL PROFILE OF THE U.S. PULP AND PAPER INDUSTRY”, December 2005
As a global industry US paper manufacturers are also challenged by imports. Some
sectors, however, are facing structural changes. In particular, newsprint shipments in the US
have been declining for a number of years. Packaging material shipments – which comprise
over half of all total shipments in tons ‐ tend to vary with the direction of economic growth.
Some specialty paper products have seen growth, but these comprise a smaller portion of total
production capacity in tons per year.
Food and Related Industries.
Powdered food is the most common form of dried food and it is a global industry. Food
drying allows food to be preserved for more time and makes it easier to ship. The most widely
used method for drying food to produce powdered foods is the spray dryer. This technology,
which has wide application from drying foods to cleaning pollution, works by injecting an
atomized liquid or slurry into a dry gas stream where the moisture evaporates leaving a dry
particle. The dried particles are collected in a downstream particle collection device that could
be a cyclone separator, fabric filter, electrostatic precipitator or other collection device. The most
common atomizer is the rotary atomizer because of its ability to produce a relatively consistent
droplet (and thus particle) size. Two fluid atomizers are also frequently used. Spray drying
applications include:
Food: milk powder, coffee, tea, eggs, cereal, spices, flavorings, ... Pharmaceutical: antibiotics, medical ingredients, additives
75

Industrial: paint pigments, ceramic materials, catalyst supports, air pollution control
The advantage of a spray dryer versus other drying methods is that it can produce
powdered product with a well controlled particle size. GEA Niro is probably the world leader
in spray dryer technology for all applications. Their technology is used for air pollution control
(through a license agreement with the Babcock & Wilcox company), but is also used for all of
the other spray dryer applications as well.
Other devices used for food drying are flash dryers, which are used to dry powdered
solids that are already low in moisture, fluidized bed dryers, which can dry agglomerated
particles, and freeze drying, which dries deep‐frozen material.
For purposes of the TMC, applications in food drying where spray dryer technology is
used appears to be the most attractive application for the TMC because it is likely the approach
with the highest humidity. Of course, it is not possible to examine all of these applications;
however, it might be beneficial for GTI to discuss the TMC further with a company like GEA
Niro to see if there are any applications where the TMC would be beneficial.
Sludge Incineration
Sludge incinerators are used to incinerate sewage sludge from municipal water
treatment systems. These incinerators are one of two types – multiple hearth incinerators (MH)
and fluidized bed incinerators (FB). There are roughly 167 multiple hearth MH incinerators and
63 FB incinerators in the US that are incinerating municipal sewage sludge. These incineration
systems utilize wet scrubbers to clean the exhaust gas, as shown in Figure 12.
The wet scrubber is used for control of particulate as well as gaseous pollutant emissions and
are therefore are generally of a Venturi/impingement tray type. Gas flowrate will be higher
from a MH than from a FB because of the higher excess air level and higher fuel requirement.
Although most existing sludge incinerators are MH, the trend in the industry is toward FB.
Several older MH incinerators have been converted to FB and new sludge incinerators are FB.
Table 13 compares the expected fuel and gas flowrates for 2 dry ton per hour MH and FB
incinerators.
76

Combustion of sludge is a growing field, and municipalities see this as a way to dispose
of waste and generate CO2‐neutral energy. Today’s modern facilities incorporate heat recovery
steam generators and steam turbines so that electricity can be exported from the site. For a
municipality, the payback period allowed is far longer than a private company would require,
and I am aware of some facilities justifying the additional cost of heat recovery steam generators
and steam turbines with payback periods on the order of over 10 years.
The exhaust from the wet scrubber at a sludge incinerator would likely be similar to the
temperature of other wet scrubbers – on the order of 125‐145 °F.
Figure 12. Gas flow diagram for a municipal sludge incineration process32
32 NATIONAL MANUAL OF GOOD PRACTICE FOR BIOSOLIDS, National Biosolids Partnership, 2005
77

78
Table 13. Fuel Requirement and Exhaust Gas Rate from Typical Fluid Bed and Multiple
Hearth Refurbished with Afterburner 33
Possible Future Work This study focused on specific industries where wet scrubbers are used and may be possible candidates for application of the TMC. These industries generally comprise very large industrial complexes, such as power plants, refineries, steel mills, cement kilns, and pulp/paper mills. There are other industries and applications that may use wet scrubbers or dry scrubbers (such as spray driers); however, in some of these other industries the applications may be smaller in size and perhaps larger in number than what is addressed in this study. These markets for wet scrubbers have a tendency to be highly fragmented, and the larger suppliers of scrubbers that serve the large industrial markets generally do not serve these markets. As a result, the statistics for such scrubbers will generally be more difficult to assemble. It may be possible to assemble these statistics by contacting a few of the suppliers to these markets. Future efforts may be directed at collecting information on the size of these markets and technical information on the applications.
33 Dangtran, K., Mullen, J., Mayrose, D., “A Comparison of Fluid Bed and Multiple Hearth Biosolids Incineration”, Paper Presented At The 14th Annual Residuals & Sludge Management Conference, February 27- March 1, 2000, Boston, MA