Energy and Energy Cost Savings Analysis of the 2018 IECC ...
57
PNNL-28125 Energy and Energy Cost Savings Analysis of the 2018 IECC for Commercial Buildings December 2018 J Zhang Y Chen Y Xie M Rosenberg R Hart
Transcript of Energy and Energy Cost Savings Analysis of the 2018 IECC ...

PNNL-28125
Energy and Energy Cost Savings Analysis of the 2018 IECC for Commercial Buildings
December 2018
J Zhang Y Chen Y Xie M Rosenberg R Hart


PNNL-28125
Energy and Energy Cost Savings Analysis of the 2018 IECC for Commercial Buildings
J Zhang Y Chen Y Xie M Rosenberg R Hart December 2018 Prepared for the U.S. Department of Energy under Contract DE-AC05-76RL01830 Pacific Northwest National Laboratory Richland, Washington 99352


v
Executive Summary
The U.S. Department of Energy (DOE) Building Energy Codes Program supports the development and implementation of building energy codes and standards, which set minimum requirements for energy-efficient design and construction for new and renovated buildings, and impact energy use and related environmental impacts for the life of buildings. As required by federal statute (42 U.S.C. 6833), DOE recently issued a determination that ANSI/ASHRAE/IES1 Standard 90.1-2016 would achieve greater energy efficiency in buildings compared to the 2013 edition of the standard. In support of DOE’s determination, Pacific Northwest National Laboratory (PNNL) conducted an energy savings analysis for Standard 90.1-2016 (DOE 2017). While Standard 90.1 is the national model energy standard for commercial buildings (42 U.S.C. 6833), many states have historically adopted the International Energy Conservation Code (IECC) for both residential and commercial buildings.
This report provides an assessment as to whether new buildings constructed to the commercial energy efficiency provisions of the 2018 IECC would save energy and energy costs as compared to the 2015 IECC. The Commercial Energy Efficiency chapter in the 2018 IECC allows users to either follow the provisions in the IECC or use Standard 90.1-2016 as an alternative compliance path. PNNL also compared the energy performance of the 2018 IECC with the corresponding Standard 90.1-2016 to help states and local jurisdictions make informed decisions regarding model code adoption.
The analysis builds on previous work done by PNNL that assessed the energy performance of the 2015 IECC compared to the 2012 editions of the IECC (Zhang et al. 2015). For this analysis, PNNL first reviewed all code changes from the 2015 to 2018 IECC and identified those having a quantifiable impact on energy. These changes were then implemented in a suite of 16 prototype building models covering all 16 climate zones in the United States. This results in a total of 512 building models, 256 models each for the 2015 and 2018 editions of the IECC. Prototype models for the 2018 IECC were developed by implementing code changes to the 2015 IECC models. The 16 prototype building models represent more than 80% of the national stock of commercial buildings in the United States.
Whole-building energy simulations were conducted using DOE’s EnergyPlus Version 8.0 (DOE 2015) building simulation software. The resulting energy use from the complete suite of 512 simulation runs was converted to site energy use intensity (EUI, or energy use per unit floor area), and energy cost index (ECI) for each simulation. For each prototype, the resulting EUIs and ECIs in each climate zone were weighted to calculate the aggregate national level EUI and ECI. Weighting factors were developed using commercial construction data and are based on construction floor area of the different building types in each climate zone. Finally, the EUIs were aggregated across building types to the national level using the same weighting data.
Overall, the 2018 edition of the IECC results in site energy savings of 5.1% at the aggregate national level compared to the 2015 IECC edition. Comparatively, on a national weighted average basis, the 2018 IECC is 2.6% less efficient for energy use than Standard 90.1-2016 (see Appendix B in this report for the full comparison of the 2018 IECC and Standard 90.1-2016). Savings from the 2015 to 2018 IECC vary
1 ANSI – American National Standards Institute; ASHRAE – American Society of Heating, Refrigerating, and Air-Conditioning Engineers (until 2012, then just ASHRAE); IES – Illuminating Engineering Society; IESNA – Illuminating Engineering Society of North America (IESNA rather than IES was identified with Standard 90.1 prior to 90.1-2010)

vi
significantly by prototype and climate. This is expected because code requirements are different by building type and by climate.
A few high-impact changes resulting in significant energy savings are listed below:
• Heating, ventilation and air conditioning (HVAC): dual maximum control requirements to multiple-zone variable-air volume (VAV) systems with direct digital control (DDC) (C403.6.1); VAV system ventilation optimization when energy recovery ventilator (ERV) is installed (C403.6.6); and HVAC control for hotel guestroom during unoccupied hours (C403.7.6).
• Lighting: high efficacy lighting in dwelling units (C405.1), and lower interior and exterior lighting power allowance (C405.3.2 and C405.4.2).
Table ES.1 summarizes the analysis results. The 16 building prototypes are listed along with their construction weighting factors. Side-by-side comparisons of the site EUI and ECI for the 2015 and 2018 IECC are shown in the table along with their percentage savings. Positive percentage savings indicate a reduction in energy or energy costs from the 2015 IECC. As depicted in Table ES.1, the analysis shows an estimated site energy savings of 5.1% and energy cost savings of 5.3% on a national aggregated basis.
Table ES.1. Site Energy and Energy Cost Savings between the 2015 and 2018 IECC
Building Activity Building Prototype
Floor Area
Weight (%)
Site EUI (kBtu/ft2-yr)
Site EUI
Savings (%)
ECI ($/ft²-yr) ECI
Savings (%) 2015
IECC 2018 IECC
2015 IECC
2018 IECC
Office Small Office 5.6 29.6 28.6 3.4% $0.89 $0.85 4.5%
Medium Office 6.0 34.2 33 3.5% $0.97 $0.93 4.1% Large Office 3.3 71.1 67.9 4.5% $2.04 $1.98 2.9%
Retail Stand-Alone Retail 15.3 47.1 40.9 13.2% $1.20 $1.04 13.3%
Strip Mall 5.7 55.4 51.5 7.0% $1.46 $1.33 9.6%
Education Primary School 5.0 52.7 48.8 7.4% $1.31 $1.20 8.4%
Secondary School 10.4 43.1 40.2 6.7% $1.11 $1.03 7.2%
Healthcare Outpatient Health Care 4.4 119.7 115.7 3.3% $3.09 $2.97 4.2%
Hospital 3.4 125.6 124.3 1.0% $2.90 $2.88 0.7%
Lodging Small Hotel 1.7 60.3 56.4 6.5% $1.29 $1.17 9.3% Large Hotel 5.0 87.7 85.4 2.6% $1.79 $1.75 1.7%
Warehouse Non-Refrigerated Warehouse 16.7 16.2 14.4 11.1% $0.36 $0.30 16.7%
Food Service
Quick Service Restaurant 0.6 575.5 572.2 0.6% $8.45 $8.35 1.2% Full Service Restaurant 0.7 372 368 1.1% $6.28 $6.14 2.2%
Apartment Mid-Rise Apartment 7.3 43.6 43 1.4% $1.25 $1.23 1.6% High-Rise Apartment 9.0 47.6 46.6 2.1% $1.13 $1.10 2.7%
National Weighted Average 100 54.5 51.7 5.1% $1.31 $1.24 5.3%
Figures ES.1 and ES.2 illustrate the weighted EUI and ECI for each prototype and the national weighted average results for the 2015 and 2018 editions of the IECC, respectively.

vii
Figure ES.1. National Average Energy Use Intensity for all IECC Prototypes
Figure ES. 2. National Average Energy Cost Index for all IECC Prototypes
0 100 200 300 400 500 600
National Weighted Average
High-Rise ApartmentMid-Rise Apartment
Full-Service RestaurantQuick-Service Restaurant
WarehouseLarge HotelSmall Hotel
HospitalOutpatient Healthcare
Secondary SchoolPrimary School
Strip MallStandalone Retail
Large OfficeMedium Office
Small Office
Energy Use Intensity [kBtu/ft2-yr]
2015 IECC 2018 IECC
0 2 4 6 8 10
National Weighted Average
High-Rise ApartmentMid-Rise Apartment
Full-Service RestaurantQuick-Service Restaurant
WarehouseLarge HotelSmall Hotel
HospitalOutpatient Healthcare
Secondary SchoolPrimary School
Strip MallStandalone Retail
Large OfficeMedium Office
Small Office
Energy Cost Index [$/ft2-yr]
2015 IECC 2018 IECC

viii
Acknowledgments
This report was prepared by Pacific Northwest National Laboratory (PNNL) for the U.S. Department of Energy (DOE) Building Energy Codes Program. The authors would like to thank Jeremiah Williams at DOE for providing oversight. The authors would also like to thank contributors to the Commercial Prototype Building Models, who built a technical foundation for this analysis project.
The authors sincerely thank their PNNL colleagues, Mark Halverson, Rosemarie Bartlett, Chitra Nambiar, and Susan Arey, and Bing Liu at Northwest Energy Efficiency Alliance, Eric Lacey at Responsible Energy Codes Alliance, and Michelle Britt at International Code Council who provided insightful review comments on an earlier draft of this report.
Jian Zhang, Ph.D. Pacific Northwest National Laboratory

ix
Acronyms and Abbreviations
AFUE annual fuel utilization efficiency ANSI American National Standards Institute AHU air handling unit ASHRAE American Society of Heating, Refrigerating, and Air-Conditioning Engineers BECP Building Energy Codes Program Btu/h British thermal unit(s) per hour CBECS Commercial Building Energy Consumption Survey CFR Code of Federal Regulations DDC direct digital control DOE U.S. Department of Energy ECI energy cost index ECPA Energy Conservation and Production Act EIA Energy Information Administration EMS energy management system ERV energy recovery ventilator EUI energy use intensity ft2 square feet hp horsepower HVAC heating, ventilation, and air-conditioning ICC International Code Council IECC International Energy Conservation Code IES Illuminating Engineering Society kBtu/ft2-yr thousand British thermal unit(s) per square foot per year kBtu/h thousand British thermal unit(s) per hour kWh kilowatt hour(s) LPD lighting power density PNNL Pacific Northwest National Laboratory SHGC solar heat gain coefficient USC United States Code VAV variable air volume VSD variable speed drive WWR window-to-wall ratio


xi
Contents
Executive Summary ............................................................................................................................ v Acknowledgments ........................................................................................................................... viii Acronyms and Abbreviations ............................................................................................................ ix 1.0 Introduction ............................................................................................................................. 1.1 2.0 Methodology ............................................................................................................................ 2.1
2.1 Building Prototypes ......................................................................................................... 2.1 2.2 Climate Zones ................................................................................................................. 2.1 2.3 Comparison Metrics and Construction Weights ............................................................. 2.3
3.0 2018 IECC Building Prototype Development ......................................................................... 3.5 3.1 Review of Code Changes ................................................................................................ 3.5 3.2 Building Envelope ........................................................................................................... 3.6
3.2.1 U-factor for Garage Door ..................................................................................... 3.6 3.2.2 Vertical Fenestration Solar Heat Gain Coefficient (SHGC) ................................ 3.7
3.3 Building Mechanical Systems ......................................................................................... 3.7 3.3.1 Gas-Fired Boiler Efficiency ................................................................................. 3.7 3.3.2 Controls for Heating and Cooling Systems in Vestibules .................................... 3.8 3.3.3 Modified Threshold for VSD Pumps ................................................................... 3.8 3.3.4 Dual Maximum Control Requirements to Multiple-Zone VAV Systems ............ 3.9 3.3.5 ERV with Ventilation Optimization ................................................................... 3.11 3.3.6 Raises Minimum Energy Recovery Threshold .................................................. 3.11 3.3.7 Hotel Guestroom Controls ................................................................................. 3.12 3.3.8 Reduced Threshold for Fan Speed Control for Heat Rejection Equipment ....... 3.13
3.4 Service Water Heating .................................................................................................. 3.13 3.4.1 Updates Efficiency Requirements for Water Heaters ........................................ 3.13
3.5 Electrical Power and Lighting Systems ......................................................................... 3.13 3.5.1 Dwelling Unit Lighting Efficacy ........................................................................ 3.13 3.5.2 Occupancy Sensor Lighting Control .................................................................. 3.14 3.5.3 Interior Lighting Power ...................................................................................... 3.14 3.5.4 Exterior Lighting Power ..................................................................................... 3.15 3.5.5 Transformer Efficiency ...................................................................................... 3.16
4.0 Site Energy and Energy Cost Savings Results ........................................................................ 4.1 5.0 References ............................................................................................................................... 5.1 Appendix A Code Changes from the 2015 to 2018 IECC Included in Analysis and their Impact on
Building Prototypes ................................................................................................................ A.1 Appendix B Energy and Energy Cost Savings for the 2018 IECC and Corresponding Standard
90.1-2016 ................................................................................................................................ B.1 Appendix C Amendments to the 2018 IECC to Align with Standard 90.1-2016 ........................... C.1

xii
List of Figures
Figure ES.1. National Average Energy Use Intensity for all IECC Prototypes ................................vii Figure ES. 2. National Average Energy Cost Index for all IECC Prototypes ...................................vii Figure 2.1. United States Climate Zone Map (ASHRAE 2013) ...................................................... 2.2 Figure 3.1. Single-maximum Terminal Box Control Sequence ..................................................... 3.10 Figure 4.1. National Average Energy Use Intensity for all IECC Prototypes ................................. 4.2 Figure 4.2. National Average Energy Cost Index for all IECC Prototypes ..................................... 4.3 Figure B.1. National Average Energy Use Intensity for Standard 90.1 and IECC Prototypes ...... B.3 Figure B.2. National Average Energy Cost Index for Standard 90.1 and IECC Prototypes .......... B.3
xiii
List of Tables
Table ES.1. Site Energy and Energy Cost Savings between the 2015 and 2018 IECC ..................... vi Table 2-1. Commercial Prototype Building Models ........................................................................ 2.2 Table 2-2. Relative Construction Volume Weights for 16 Prototype Buildings by Climate Zone
(percent) ................................................................................................................................... 2.4 Table 3-1 Changes Between the 2015 and 2018 IECC with Quantified Energy Impacts................ 3.6 Table 3-2 Number of Opaque Doors in Prototypes ......................................................................... 3.7 Table 3-3 VSD Requirements for Demand-Controlled Chilled Water and Heating Pumps in the
2018 IECC ............................................................................................................................... 3.9 Table 3-4. Guestroom Setpoints and Ventilation Control .............................................................. 3.12 Table 3-5. Exterior Lighting Zones for Prototypes ........................................................................ 3.15 Table 3-6. Exterior Lighting Power in Prototypes for 2015 and 2018 IECC ................................. 3.16 Table 4-1.Site Energy and Energy Cost Savings between the 2015 and 2018 IECC ...................... 4.1 Table 4-2. Site Energy and Energy Cost Savings between the 2015 and 2018 IECC by Climate
Zone ......................................................................................................................................... 4.4 Table A.1. Changes between the 2015 and 2018 IECC with Quantified Energy Impacts and
Impacted Prototypes ............................................................................................................... A.1 Table B.1. Site Energy and Energy Cost Savings between Standard 90.1-2016 and the 2018
IECC ....................................................................................................................................... B.2 Table B.2.Site Energy and Energy Cost Savings between Standard 90.1-2016 and the 2018 IECC by
Climate Zone ........................................................................................................................... B.5 Table C.1. . Site Energy Savings and Energy Cost Savings for the 2018 IECC with Amendments and
Standard 90.1 2016 by Prototype ............................................................................................ C.2
1.1
1.0 Introduction
The U.S. Department of Energy (DOE) Building Energy Codes Program supports the development and implementation of building energy codes and standards, which set minimum requirements for energy-efficient design and construction for new and renovated buildings, and impact energy use and related environmental impacts for the life of buildings.
As required by federal statute (42 U.S.C. 6833), DOE recently issued a determination that ANSI/ASHRAE/IES1 Standard 90.1-2016 would achieve greater energy efficiency in buildings subject to the code compared to the 2013 edition of the standard.2 Pacific Northwest National Laboratory (PNNL) conducted an energy savings analysis for Standard 90.1-2016 in support of the determination (DOE 2017). While Standard 90.1 is the national model energy standard for commercial buildings (42 U.S.C. 6833), many states adopt the full suite of International Codes, and thus adopt the International Energy Conservation Code (IECC), which includes energy conservation requirements for both residential and commercial buildings. Of the 43 states with statewide commercial building energy codes currently, 35 use a version of the IECC (BECP 2018). The Commercial Energy Efficiency chapter in the 2018 IECC (International Code Council, ICC 2018) allows users to either follow the provisions in the IECC or use Standard 90.1-2016 as an alternative compliance path. This report provides an assessment as to whether new buildings constructed to the commercial energy efficiency provisions of the 2018 IECC would save energy and energy costs compared to the 2015 IECC (ICC 2015). Because PNNL used the same methodology for both this 2018 IECC analysis and the previous Standard 90.1-2016 analysis, comparisons between the estimated energy performance of the 2018 IECC and that of its referenced Standard 90.1-2016 are presented in Appendix B of this report. The goal of this analysis is to help states and local jurisdictions make informed decisions regarding model code adoption.
This report documents the approach and results for PNNL’s analysis for energy and energy cost savings of the 2018 IECC for commercial buildings. PNNL first reviewed all code changes from the 2015 to 2018 IECC and identified those having a quantifiable impact. PNNL then compared two suites of building prototypes, each suite complying with one edition of the IECC. Each suite consists of 256 building prototypes; a combination of 16 building prototypes in all 16 U.S. climate zones. The 2015 IECC prototypes were taken from PNNL’s previous analysis of the energy performance of the 2015 IECC compared to its previous edition which was documented in Energy and Energy Cost Savings Analysis of the 2015 IECC for Commercial Buildings (Zhang et al. 2015), referred to here as Analysis of the 2015 IECC.
The remainder of this report is organized as follows: Section 2.0 summarizes the general methodology about the building prototypes, their development, and simulation for their energy use and cost. The same methodology was applied in the previous Analysis of the 2015 IECC and the Standard 90.1-2016 determination (DOE 2017). Section 3.0 describes how PNNL developed the 2018 IECC prototypes using the 2015 IECC prototypes as a basis. Finally, Section 4.0 summarizes the results of the comparison of the two editions of the IECC. Appendix A summarizes the identified code changes between the 2015 and 2018 IECC (with quantified energy impacts) and identifies which building prototypes are impacted by each change. Appendix B provides energy and energy cost comparisons
1 ANSI – American National Standards Institute; ASHRAE – American Society of Heating, Refrigerating, and Air-Conditioning Engineers (until 2012, then just ASHRAE); IES – Illuminating Engineering Society; IESNA – Illuminating Engineering Society of North America (IESNA rather than IES was identified with Standard 90.1 prior to 90.1-2010) 2 For more information on the DOE Determination of energy savings, see http://www.energycodes.gov/development/determinations

1.2
between Standard 90.1-2016 and the 2018 IECC. Appendix C identifies a few amendments to the 2018 IECC that would align the requirements with Standard 90.1-2016 to create equivalency on a nationally aggregated basis.

2.1
2.0 Methodology
To support the development and implementation of building energy codes, PNNL researchers have developed building prototypes that comply with various editions of energy codes including both Standard 90.1 and IECC. These building prototypes represent the majority of new commercial building stock and were developed using DOE’s EnergyPlus Version 8.0 building energy simulation software (DOE 2015). The results allow comparison of the national weighted average savings of one code to its earlier edition and the relative performance differences between the codes. This section summarizes the general methodology used for this 2018 IECC analysis, which is consistent with that used for the Analysis of the 2015 IECC.
2.1 Building Prototypes
For this analysis, PNNL used a suite of building prototypes (DOE and PNNL 2018) representing the first seven principal building activities in the Commercial Buildings Energy Consumption Survey (CBECS; EIA 2003). These seven principal building activities represent 76% of the building energy usage of commercial buildings. In addition, two multifamily prototypes (Mid-Rise and High-Rise Apartments), which are not included in CBECS, were added into the suite of prototypes. These two prototypes were included in the analysis because they are regulated by the commercial provisions of the IECC. Table 2.1 shows the seven principal activities as defined in CBECS and the added apartment activity. These eight building activities were further divided into 16 building prototypes as listed in Table 2.1 along with their floor area, representing 80% of new construction floor area in the United States. Detailed descriptions of these prototypes and enhancements are documented in Thornton et al. (2011) and Goel et al. (2014).
2.2 Climate Zones
The climate zones and moisture regimes in the 2018 IECC include eight zones and three moisture regimes. Each combination of climate zone and moisture regime defines a climate subzone, resulting in 15 climate subzones in the United States, which are the same as those defined in Standard 90.1-2013. Standard 90.1-2016 adopted an updated climate zone map by referencing ASHRAE Standard 169-2013, Climatic Data for Building Design Standards (ASHRAE 2013), which reassigns U.S. counties to climate zones, as shown in Figure 2.1, based on more recently monitored climate data and also added a new, extremely hot climate zone 0. Approximately 300 U. S. counties out of more than 3,000 were reassigned, most to warmer climate zones. A sensitivity analysis using prototype building models (Athalye et al. 2016) showed the energy impact of the county-climate zone reassignment to be very small at a national level, with an increase of 0.18% in the site energy consumption of buildings compared to those with previous county-climate assignments. For DOE’s recent determination of the energy savings of Standard 90.1-2016 compared to Standard 90.1-2013 (DOE 2017), PNNL decided to focus on energy savings due to the changes in design requirements between the standards instead of the climate zone assignments. To maintain consistency with that approach, the new county-climate zone mapping was used for all codes and standards compared in the present analysis. For the same reason, the new set of 16 representative cities used for the 90.1-2016 Determination (DOE 2017) was also used for this analysis.

2.2
Table 2-1. Commercial Prototype Building Models
Building Type Prototype Building Floor Area
(ft2)
Office Small Office 5,502 Medium Office 53,628 Large Office 498,588
Retail Stand-Alone Retail 24,692 Strip Mall 22,500
Education Primary School 73,959 Secondary School 210,887
Healthcare Outpatient Health Care 40,946 Hospital 241,501
Lodging Small Hotel 43,202 Large Hotel 122,120
Warehouse Non-Refrigerated Warehouse 52,045
Food Service Quick Service Restaurant 2,501 Full Service Restaurant 5,502
Apartment Mid-Rise Apartment 33,741 High-Rise Apartment 84,360
Figure 2.1. United States Climate Zone Map (ASHRAE 2013)

2.3
The 16 cities used in the current analysis are:
• 1A: Honolulu, Hawaii (very hot, humid)
• 2A: Tampa, Florida (hot, humid)
• 2B: Tucson, Arizona (hot, dry)
• 3A: Atlanta, Georgia (warm, humid)
• 3B: El Paso, Texas (warm, dry)
• 3C: San Diego, California (warm, marine)
• 4A: New York, New York (mixed, humid)
• 4B: Albuquerque, New Mexico (mixed, dry)
• 4C: Seattle, Washington (mixed, marine)
• 5A: Buffalo, New York (cool, humid)
• 5B: Denver, Colorado (cool, dry)
• 5C: Port Angeles, Washington (cool, marine)
• 6A: Rochester, Minnesota (cold, humid)
• 6B: Great Falls, Montana (cold, dry)
• 7: International Falls, Minnesota (very cold)
• 8: Fairbanks, Alaska (subarctic)
2.3 Comparison Metrics and Construction Weights
Annual electricity and natural gas energy use in each building prototype were simulated across 256 buildings, a combination of 16 prototypes in all 16 U.S. climate zones. This simulated energy use is utility electricity and natural gas delivered and used at the building site. The site energy use was converted to site energy use intensity (site EUI, or energy use per unit floor area).
To calculate the energy cost, PNNL relied on national average commercial building energy prices based on Energy Information Administration (EIA) statistics for 2016 in Table 2, “U.S. Energy Prices,” of the March 2017 Short Term Energy Outlook for commercial sector natural gas and electricity1 of:
• $0.1037/kWh of electricity
• $7.26 per 1000 cubic feet ($0.701/therm) of natural gas
The same set of prices was used for all prototypes and in all climate zones. The annual energy costs for each building were calculated for each fuel type (electricity and natural gas) by using the energy prices for all buildings. These costs were converted to energy cost index (ECI, or energy cost per unit floor area) for each building.
PNNL recognizes that actual energy costs will vary somewhat by building type within a region, and even more across regions. However, the use of national average figures sufficiently illustrates energy cost savings and the effect on energy efficiency in commercial buildings. The same method and the same set of fuel prices were used for the DOE determination for Standard 90.1-2016.
The EUI and ECI results of each building were weighted by construction volume for each building prototype and climate zone to calculate the national weighted average EUI and ECI. Weighting factors developed by building type and climate-related geographic areas in the United States were previously derived from 5 years of recent construction data (Jarnagin and Bandyopadhyay 2010).2 Table 2.2 lists the weighting factors assigned to each prototype in all 16 U.S. climate zones.
1 EIA Short Term Energy Outlook available at http://www.eia.gov/forecasts/steo/report/. 2 The original weighting factors were based on the climate to county mapping in Standard 169-2006. This analysis uses updated mapping from 169-2013 and the construction weights were updated accordingly (DOE 2017).

2.4
Table 2-2. Relative Construction Volume Weights for 16 Prototype Buildings by Climate Zone (percent)
Building Type 1A 2A 2B 3A 3B 3C 4A 4B 4C 5A 5B 5C 6A 6B 7 8 Weights by Bldg Type
Large Office 0.13 0.39 0.06 0.49 0.28 0.12 1.05 0.00 0.15 0.44 0.12 0.00 0.08 0.00 0.01 0.00 3.33
Medium Office 0.21 0.85 0.29 0.83 0.72 0.14 1.16 0.04 0.19 1.00 0.35 0.01 0.21 0.03 0.02 0.01 6.05
Small Office 0.17 1.13 0.29 1.02 0.47 0.08 0.84 0.06 0.12 0.89 0.32 0.01 0.18 0.03 0.02 0.00 5.61
Stand-Alone Retail 0.41 2.33 0.51 2.57 1.25 0.19 2.44 0.13 0.41 3.36 0.79 0.02 0.69 0.08 0.06 0.01 15.25
Strip Mall 0.20 1.08 0.25 1.11 0.63 0.10 0.89 0.02 0.11 0.96 0.20 0.00 0.09 0.01 0.00 0.00 5.67
Primary School 0.16 0.99 0.16 0.96 0.45 0.05 0.87 0.03 0.09 0.82 0.23 0.00 0.12 0.03 0.02 0.00 4.99
Secondary School 0.32 1.59 0.23 1.99 0.82 0.11 1.97 0.06 0.23 2.15 0.45 0.01 0.30 0.08 0.05 0.01 10.36
Hospital 0.06 0.51 0.10 0.49 0.27 0.04 0.66 0.03 0.10 0.80 0.21 0.00 0.12 0.02 0.03 0.00 3.45
Outpatient Health Care 0.08 0.62 0.13 0.63 0.28 0.06 0.81 0.02 0.17 1.06 0.22 0.01 0.23 0.03 0.03 0.00 4.37
Full Service Restaurant 0.02 0.11 0.02 0.12 0.05 0.01 0.12 0.01 0.01 0.13 0.03 0.00 0.02 0.00 0.00 0.00 0.66
Quick Service Restaurant 0.02 0.10 0.02 0.10 0.06 0.01 0.09 0.01 0.01 0.12 0.03 0.00 0.02 0.00 0.00 0.00 0.59
Large Hotel 0.13 0.69 0.12 0.70 0.79 0.11 0.90 0.04 0.12 0.90 0.20 0.00 0.16 0.05 0.03 0.00 4.95
Small Hotel 0.03 0.30 0.03 0.27 0.11 0.02 0.32 0.02 0.04 0.35 0.09 0.00 0.08 0.03 0.02 0.00 1.72
Non-Refrigerated Warehouse 0.51 3.07 0.58 2.70 2.30 0.15 2.84 0.08 0.43 3.01 0.70 0.00 0.29 0.03 0.03 0.00 16.72
High-rise Apartment 1.69 1.48 0.08 0.62 0.74 0.17 2.38 0.00 0.36 1.25 0.12 0.00 0.06 0.02 0.01 0.00 8.97
Mid-rise Apartment 0.34 1.19 0.09 0.82 0.86 0.26 1.58 0.02 0.36 1.15 0.32 0.01 0.23 0.06 0.03 0.00 7.32
Weights by Zone 4.46 16.43 2.98 15.42 10.08 1.61 18.92 0.57 2.92 18.39 4.37 0.07 2.89 0.49 0.37 0.05 100.00

3.5
3.0 2018 IECC Building Prototype Development
The starting point for the 2018 prototypes was the 2015 prototypes that were developed for the Analysis of the 2015 IECC (Zhang et al. 2015). PNNL reviewed all code changes from the 2015 to 2018 IECC. In this section, PNNL compares code changes in commercial energy efficiency provisions between the 2015 and 2018 IECC and documents how they were implemented in the 2018 IECC prototypes and modeled in EnergyPlus.
3.1 Review of Code Changes
Chapter 4 Commercial Energy Efficiency of the IECC provides three alternative paths for a new building to show compliance: (1) the mandatory and prescriptive requirements in the IECC; (2) the mandatory and total building performance requirements in the IECC; or (3) the requirements in the referenced Standard 90.1. This analysis looks only at compliance path (1), comparing the energy performance of the mandatory and prescriptive requirements in the 2015 IECC relative to those in the 2018 IECC, which is consistent with how DOE has traditionally evaluated model code updates when issuing its statutorily-directed Determinations of Energy Savings1.
Of the changes to path (1), PNNL classified them into three categories, including those that 1) provide clarifications, administrative, or updated references to other documents that do not directly impact energy use; 2) result in energy efficiency impacts but are not quantified using the building prototypes; and 3) result in energy efficiency impacts that can be quantified. Only those in the third category were incorporated into the 2018 IECC building prototypes. Changes in the second category were not quantified when they met one of the following criteria:
1. The changes impact features not found in typical building designs. The prototype models include the most common design features found in each building type in the United States. Therefore, there are many less common features that are not represented in the prototypes, such as heated slabs and conditioned (cooled) vestibules. Changes affecting these features of buildings were not captured via the prototypes in order to preserve representation of the typical building stock.
2. The changes adopt standard practice. The systems and their configuration in the prototype models are based on standard practice that has been widely adopted in the United States. When a change is to fix a loophole for an uncommon design practice, the uncommon design is not modeled in the prototypes and thus, has no affect within the analysis.
3. Changes apply only to existing buildings instead of new buildings.
Table 3-1 lists the changes in the third category and Appendix A identifies their location in the IECC and which prototypes are impacted. The following subsections describe these changes in more detail, as well as their modeling strategies in the prototypes.
1https://www.energycodes.gov/development/determinations

3.6
Table 3-1 Changes Between the 2015 and 2018 IECC with Quantified Energy Impacts
Description of Code Changes Establishes a new opaque envelope assembly category, garage door <14% glazing, in Table C402.1.4 for garage doors, which is previously under nonswinging opaque door category in Table C402.1.3 in the 2015 IECC. Prescribes lower SHGC for vertical fenestration in climate zones 4 and 5. Increases gas boiler efficiency. Adds control requirements for heating and cooling systems in vestibules. Reduces the threshold for variable flow pumping requirements for chilled water pumps and adds requirement for heating water pumps. Expands the VSD requirement to heat rejection loops. Adds dual maximum control requirements to multiple-zone VAV systems with direct digital control (DDC). Requires VAV system ventilation optimization even when ERV is installed. Raises minimum threshold for energy recovery. Requires deeper thermostat setback for networked guestrooms or those unoccupied for more than 16 hours/day. Also requires ventilation be turned off when guestrooms are unoccupied. Reduces the threshold for variable flow heat rejection device fans from 7.5 to 5 hp and includes the service factor power in the determination of a 5 hp threshold. Eliminates the exception for climate zones 1 and 2. Updates efficiency requirements for electric water heaters (>12kW) and gas water heaters (<75Kbtu/h) based on the latest federal requirement effective in 2018. Increases efficacy requirements for lighting installed in dwelling units. Adds occupancy sensor requirements for open offices. Changes interior lighting power allowances including display lighting. Reduces exterior lighting power allowances. Updates distribution transformer efficiency requirements.
3.2 Building Envelope
3.2.1 U-factor for Garage Door
Code Change Description. The 2018 IECC establishes a new opaque envelope assembly category, garage door <14% glazing, in Table C402.1.4, which is under the nonswinging opaque door category in Table C402.1.3 in the 2015 IECC. A new footnote i to Table C402.1.3 also clarifies that garage doors should no longer follow the nonswinging door requirements, which is the case in the 2015 IECC.
Modeling Strategy. The number of opaque doors modeled in each prototype is summarized in Table 3-2. Swinging doors were assumed to be 7 ft tall by 3 ft wide, and rollup doors were assumed to be 10 ft tall by 8 ft wide.
For this analysis, the garage doors are modeled using the nonswinging door requirement of the 2015 IECC and the garage door <14% glazing requirement of the 2018 IECC. The energy impacts are captured in Large Hotel, Hospital, Stand-alone Retail, and Non-refrigerated Warehouse prototypes.

3.7
Table 3-2 Number of Opaque Doors in Prototypes
Prototype
Number of Swinging
Doors Modeled
Number of Rollup Doors
Modeled Full Service Restaurant 1 0 Large Hotel 5 1 Hospital 16 1 Large Office 12 0 Medium Office 6 0 Small Hotel 3 0 Outpatient Health Care 17 0 Primary School 25 0 Quick Service Restaurant 1 0 Stand-Alone Retail 8 5 Secondary School 32 0 Small Office 2 0 Strip Mall 0 0 Non-Refrigerated Warehouse 1 12
3.2.2 Vertical Fenestration Solar Heat Gain Coefficient (SHGC)
Code Change Description. The 2018 IECC decreases the maximum SHGC requirement in climate zones 4 and 5 in Table C402.4.
Modeling Strategy. All the prototypes have vertical fenestration; therefore, this code change has energy impacts on all prototypes in these two climate zones. For each prototype building, assumptions were made in previous analyses (Thornton et al. 2011 and Zhang et al. 2015) about the mixed use of vertical fenestration types in each prototype. Weighted U-factor and SHGC were developed using the fenestration type weighting factors (Thornton et al. 2011) and the code requirements in the IECC. The weighting factors remain the same for each prototype between the 2015 and 2018 IECC but different window constructions were selected in EnergyPlus models to reflect the SHGC differences between the two IECC editions.
3.3 Building Mechanical Systems
3.3.1 Gas-Fired Boiler Efficiency
Code Change Description. The IECC contains requirements for specific types of equipment that are regulated by federal efficiency standards for manufacturing and import. Based on the new federal standards, the 2018 IECC updated the annual fuel utilization efficiency (AFUE) requirements for gas- and oil-fired boilers with capacity <300,000 Btu/h in Table C403.3.2(5).
Modeling Strategy. Gas-fired boilers are used in prototypes with hydronic heating systems, including the Large Office, Primary School, Secondary School, Outpatient Health Care, Large Hotel and

3.8
High-Rise Apartment. The capacity of the boilers is automatically sized based on the building load. For each prototype building, a sizing simulation run was performed first and then a script was used to assign the appropriate thermal efficiency input based on the code requirement. The impact of this code change was captured for prototypes with boilers sized less than 300,000 Btu/h.
3.3.2 Controls for Heating and Cooling Systems in Vestibules
Code Change Description. The 2018 IECC establishes a new requirement C403.4.1.4 to limit heating and cooling energy use associated with vestibules. It requires heated and cooled vestibules to have controls to limit the heating setpoint to a maximum of 60°F and the cooling setpoint to a minimum of 85°F. The vestibule heating system is also required to include automatic controls configured to shut off the heating system when the outdoor air temperature is above 45°F. Control of heating or cooling provided by site-recovered energy or transfer air is exempted from meeting these requirements.
Modeling Strategy. The new requirement only impacts the Stand-alone Retail prototype, which has a designated thermal zone serving the purpose of a vestibule, heated using a unit heater and not cooled. The gas unit heater follows the same thermostat setpoint and schedule as the rest of the building in the 2015 IECC model. The 2018 IECC requirement was implemented using a two-step approach: (1) the heating setpoint for the vestibule is limited to a maximum of 60°F, and (2) an energy management system (EMS) routine in EnergyPlus was created to shut off the unit heater and fan when the outdoor air temperature is above 45°F.
3.3.3 Modified Threshold for VSD Pumps
Code Change Description. Section C403.4.4 was modified to improve energy efficiency of hydronic systems. The 2018 IECC reduces the threshold of hydronic heating or cooling output capacity from 500,000 Btu/h to 300,000 Btu/h for part-load control requirements to be triggered. It also reduces the threshold that triggers the requirement for variable flow and variable speed drives (VSD) for pumping systems. The pump threshold is reduced from 10 to 2 hp for continuous operation and time schedule controlled pumps. Pumps that have operation controlled by direct digital control based on zone demand result in a varied threshold based on climate zone. Where formerly only chilled water pumps and those in a heat rejection loop serving water-cooled unitary air conditioners were covered, large heating water pumps are now included.
Modeling Strategy. The output capacity of the chilled water systems in the prototypes is over 500,000 Btu/h, so the C403.4.4 Part-load Controls provision is applicable to all chilled water systems. A few hydronic heating systems in the Outpatient Health Care prototype in warmer climates are between 300,000 Btu/h and 500,000 Btu/h. PNNL identified two reasons that the capacity threshold change does not impact these small heating systems:
1) Section C403.4.1.5 Hot Water Boiler Outdoor Temperature Setback Control (Mandatory) already requires supply-water temperature reset regardless of heating output capacity. Therefore, the change in output capacity threshold for C403.4.4 (1), supply-water temperature reset, does not impact hydronic heating systems.

3.9
2) All hydronic heating systems are assumed to vary flow by “riding the pump curve” as their typical design. The pump size thresholds are more stringent than the heating output thresholds for the applicability of the part-load controls.
The pump threshold change potentially impacts the following prototypes with hydronic heating or cooling systems: Large Hotel, Large Office, Secondary School, Primary School, Outpatient Health Care, and Hospital. In the recent DOE Standard 90.1-2016 Determination analysis, the baseline hydronic systems in all prototypes were modified to include a pump motor sizing factor of 1.25 times the required brake horsepower with varied pump flow.
The 2015 IECC does not require heating pumps to have VSD, so pumps are assumed to vary flow by “riding the pump curve”. In the 2015 IECC prototypes, all chilled water systems have primary-secondary pumping systems and they do not need to have VSD either. For the 2018 IECC, a VSD pump is included when the pump sizes are greater than the values in Table 3-3.
Table 3-3 VSD Requirements for Demand-Controlled Chilled Water and Heating Pumps in the 2018 IECC
Motor Nameplate
Horsepower
Chilled Water Pumps in These Climate Zones
Heating Water Pumps in These Climate
Zones ≥2 hp 0A, 0B, 1A, 1B, 2B NR ≥3 hp 2A, 3B NR ≥5 hp 3A, 3C, 4A, 4B 7, 8 ≥7.5 hp 4C, 5A, 5B, 5C, 6A, 6B 3C, 5A, 5C, 6A, 6B ≥10 hp 4A, 4C, 5B ≥15 hp 7, 8 4B ≥25 hp 2A, 2B, 3A, 3B ≥100 hp 1B ≥200 hp 0A, 0B, 1A NR: not required
3.3.4 Dual Maximum Control Requirements to Multiple-Zone VAV Systems
Code Change Description. Section C403.4.4 in the 2015 IECC limits zone airflow of multiple zone VAV systems to 30% of the maximum supply air during deadband and before reheating can occur. It also allows a higher reheating airflow rate if a reduction in overall annual energy use can be demonstrated by offsetting reheat/recool energy losses through a reduction in outdoor air intake for the system. In the 2018 IECC, this section is renumbered to C404.6.1 and requires systems with DDC to implement a dual maximum control strategy, in which the minimum zone airflow becomes 20% during deadband and is allowed to increase to 50% during reheating to better control the supply air temperature and improve ventilation effectiveness.

3.10
Modeling Strategy. This code change is related to VAV terminal box control and it impacts building prototypes with an air system serving multiple zones: Large Office, Medium Office, Hospital, Outpatient Health Care, Large Hotel, Primary School, and Secondary School. PNNL assumed they all have DDC, which is typical for most multiple-zone VAV systems. For the 2015 IECC prototypes, a simple-maximum control sequence with 30% minimum damper position is used as illustrated in Figure 3.1.
In the 2018 prototypes, the modeled dual-maximum control sequence has one maximum damper position for cooling and one for heating. When the zone is in the deadband mode, the damper stays at the minimum position, which is the higher value of 20% and the minimum position to meet the ventilation requirement. When the zone temperature falls below the heating setpoint and the zone mode changes to the heating mode, the reheating coil valve opens up increasingly while the damper position is still at the minimum position. With increasing heating load, the reheat coil valve can open until the supply air temperature reaches the predefined maximum value. Then, the damper position increases up to the maximum heating airflow setpoint of 50% if more heat is needed for zone heating. Such a control sequence is illustrated in Figure 3.2.
Both the 2015 and 2018 IECC state that a terminal airflow rate higher than 30% (2015 IECC) or 20% (2018 IECC) is allowed if it can be demonstrated to reduce overall system annual energy use by offsetting reheat/recool energy losses through a reduction in outdoor air intake for the system. PNNL has established a modeling strategy to determine the minimum zone supply airflow to meet this requirement. The calculation procedure includes four steps: (1) calculate zone ventilation efficiency; (2) calculate system ventilation efficiency; (3) increase the minimum damper fraction (i.e., ratio of minimum to maximum zone supply airflow) from 30% (2015 IECC) or 20% (2018 IECC) to a new value based on a target value of system ventilation efficiency; and (4) calculate the system design outdoor air intake.
EnergyPlus does not allow dual maximum control (reverse damper control input in the software) for electric reheat VAV terminals, which are in Medium Office and Outpatient Health Care. Therefore, the dual maximum control requirement is not captured in these prototypes.
Figure 3.1. Single-maximum Terminal Box Control Sequence
Reheating mode
Deadband mode
Cooling with more than minimum air flow rate
Con
trol s
igna
l (%
)
0
100
VAV terminal damperReheating coil valve
Cooling setpoint
Heating setpoint
Minimum air flow setpoint (e.g., 30%)

3.11
Figure 3.2. Dual-maximum Terminal Box Control Sequence
3.3.5 ERV with Ventilation Optimization
Code Change Description. The 2015 IECC allows systems with exhaust energy recovery to be exempt from the Multi-zone VAV Ventilation Optimization Control provision per Exception 2 to Section C403.4.4.6. This exception is removed in the 2018 IECC (renumbered to C403.6.6).
Modeling Strategy. Dynamic ventilation optimization or dynamic ventilation reset was simulated using the mechanical controller object in EnergyPlus. This object has an option to turn on the ventilation rate procedure calculations for optimizing system outdoor air flow in multi-zone VAV systems. Previously, dynamic ventilation reset was only turned on when there was no energy recovery ventilator (ERV) in the system. In the 2018 IECC models, the ventilation optimization control was modeled for all multiple-zone VAV systems regardless of the use of an ERV.
3.3.6 Raises Minimum Energy Recovery Threshold
Code Change Description. Section C403.7.4 uses supply fan airflow rate and the ratio of design outdoor airflow rate to fan airflow rate to determine if an ERV is required. The 2018 IECC raises the minimum design outdoor airflow rate threshold in Tables C403.2.7(1) and C403.2.7(2) (renumbered to Tables C403.7.4(1) and C403.7.4(2)) from zero cfm to a reasonable amount based on minimum ERV products available on the market. Overall this will have the impact of reducing the requirement for ERVs in certain climates where small size units are not readily available.
Modeling Strategy. In the Analysis of the 2015 IECC, air handling units in Mid-Rise and High-Rise Apartment in certain climate zones meet the trigger for the ERV requirements in the 2015 IECC but ERV
Reheating mode
Deadband mode
Cooling with more than minimum air flow rate
Cont
rol s
igna
l (%
)
0
100
VAV terminal damperReheating coil valve
Cooling setpoint
Heating setpoint
Minimum air flow setpoint (e.g., 20%)
Maximum heating air flow setpoint (e.g., 50%)

3.12
was not added to these prototypes because products were not available for those small air handing units (AHU).
For this analysis, because the new ERV thresholds in the 2018 IECC are based on the availability of market products, PNNL used the same thresholds for both 2015 (a baseline change) and 2018 IECC to implement the code changes. The inclusion of an ERV in a system in the prototypes depends on the climate zone, system airflow and the design outdoor air fraction. An initial design simulation is performed; and based on the system supply and outdoor air flow rates, a script automatically inserts the ERV into the system where required. The code change impacts systems with small supply and outdoor air flow rates, such as those found in the Mid- and High-rise Apartment prototypes.
3.3.7 Hotel Guestroom Controls
Code Change Description. The 2018 IECC introduces a new set of automatic control requirements for HVAC systems serving guestrooms in large hotels with more than 50 guestrooms. These include:
1) Two levels of thermostat setback for when a room is unrented or rented but not occupied. They require heating and cooling setpoints to be lowered and raised, respectively by 4°F when rented rooms are unoccupied. For unrented unoccupied periods, heating and cooling setpoints are to be lowered to 60°F and raised to 80°F, respectively.
2) Ventilation and exhaust airflow must also be turned off when rooms are unoccupied.
Unrented periods can be determined either by the networked guestroom control system or by a longer unoccupied period up to 16 hours. Key card control systems may be used to indicate occupancy.
Modeling Strategy. This code change only impacts Small and Large Hotel prototypes. The Small Hotel already has separate blocks of vacant guestrooms, while vacancy was managed through an average schedule in the Large Hotel. The baseline of the Large Hotel was modified to have separate blocks of rented and unrented rooms. The Small Hotel has 65% occupancy on average, while the Large Hotel has 58% occupancy. The ventilation for rented rooms is turned off 6 hours per day, and the ventilation for unrented rooms is turned off 23 hours per day, with a 1-hour daily ventilation purge. The baselines had a temperature setback in occupied rooms because this was previously required in the general thermostat requirements. The temperature setpoints and ventilation operation for the various modes are shown in Table 3-4.
Table 3-4. Guestroom Setpoints and Ventilation Control
Guestroom Condition 2015 IECC 2018 IECC Heating Cooling Ventilation Heating Cooling Ventilation
Occupied 70°F 70°F Continuous 70°F 70°F Continuous Rented Unoccupied 66°F 74°F Continuous 66°F 74°F Off 6 hr/day Unrented Unoccupied 66°F 74°F Continuous 60°F 80°F Off 23 hr/day

3.13
3.3.8 Reduced Threshold for Fan Speed Control for Heat Rejection Equipment
Code Change Description. The 2018 IECC has more stringent requirements in C403.9.1 Fan Speed Control for heat rejection equipment than C403.4.3.2 in the 2015 IECC. This code change reduces the threshold where variable speed drives are required for heat rejection fan systems. The fan threshold is reduced from 7.5 to 5 hp. It also eliminates the exception for climate zones 1 and 2 for cooling tower fans. In addition, the new requirement clarifies the maximum motor horsepower based on the service factor that should be used to establish compliance with this requirement.
Modeling Strategy. This code change potentially impacts the following prototypes with water-cooled heat rejection: High-rise Apartment, Large Office, and Hospital. The heat rejection fans serving water-loop heat pumps in High-rise Apartment are close to 5 hp and therefore are impacted by this code change. However, the Hospital and Large Office prototypes have cooling tower fans that are much greater than 7.5 hp; therefore, they are not impacted. These large cooling towers were established as variable speed by standard practice in the baseline prototypes, so there was no change made for removing the exception in climate zones 1 and 2. For High-rise Apartment, the evaporative fluid cooler type in the EnergyPlus model was changed from “SingleSpeed” in the 2015 IECC baseline to “TwoSpeed” for 2018 IECC.
3.4 Service Water Heating
3.4.1 Updates Efficiency Requirements for Water Heaters
Code Change Description. The 2018 IECC includes an updated Table C404.2 Minimum Performance of Water-Heating Equipment based on new federal appliance and equipment standards. The changes impact several water heater categories, such as electric water heaters, gas and oil storage water heaters, and gas and oil instantaneous water heaters.
Modeling Strategy. All water heaters in the prototypes are either electric water heaters or gas storage water heaters by equipment type defined in Table C404.2. The efficiency and tank heat loss for these water heaters in the prototypes are calculated based on their volume and size categories. The electric water heaters (>12kW) and gas water heaters (<75 kBtu/h) in Small Office, Stand-alone Retail, Strip Mall, and Non-refrigerated Warehouse are affected by this code change.
3.5 Electrical Power and Lighting Systems
3.5.1 Dwelling Unit Lighting Efficacy
Code Change Description. The 2018 IECC clarifies that lighting power allowance in dwelling units in multifamily buildings shall comply with R404.1, which was updated to require no less than 90% of permanently installed lighting fixtures to use high-efficacy lamps. The requirement for high-efficacy lamps is 75% in the 2015 IECC.
Modeling Strategy. In the recent DOE Standard 90.1-2016 Determination analysis, a study by Gifford et al. (2012) was used to update the typical lighting usage in the two apartment prototypes. The updated baseline assumption represents typical multifamily homes that are not designed to meet a particular energy code provision.

3.14
PNNL calculated changing an apartment unit from using 75% high-efficacy lamps for the 2015 IECC to 90% for the 2018 IECC would reduce their hard-wired lighting energy usage by about 94 W×hr/day or by 12%. This difference was modeled in the Mid-rise and High-rise Apartments using their lighting power density inputs to the apartment zones.
3.5.2 Occupancy Sensor Lighting Control
Code Change Description. There are several changes to Section C405.2.1 Occupant Sensor Controls: 1) clarifying the space names for consistency without changing the stringency, 2) reducing the occupancy sensor time delay from 30 to 20 minutes, and 3) adding occupancy sensor control to open office areas.
Modeling Strategy. The New Commercial Construction Characteristics database (Richman et al. 2008) is used to determine the fraction of open office space type in the Small, Medium, and Large Offices, Large Hotel, and Hospital prototypes. These spaces do not have occupancy sensor lighting control in the 2015 IECC models and the modeled lighting schedules are based on scheduled controls. To implement the new occupancy sensor control, PNNL applied a 10% reduction to the lighting schedule fractions during the occupied hours.
PNNL reviewed some literature and did not find sufficient data to quantify the energy impacts from reducing occupancy sensor time delay from 30 to 20 minutes. A paper from VonNeida (2000) includes data with time delay of 5, 10, 15, and 20 minutes. It was not clear if extrapolating the data to 30 min is reasonable and the data were not available for all the space types required in the 2018 IECC. Therefore, the impact of reducing time delay was not captured.
3.5.3 Interior Lighting Power
Code Change Description. The lighting power density (LPD) allowances for many building area types and space types in Tables C405.3.2(1) and C405.3.2(2) are modified to reduce energy use of lighting systems from 2015 to 2018 IECC. In addition, the additional interior lighting power allowance for specific lighting functions is reduced in C405.3.2.2.1.
Modeling Strategy. The change affects all prototypes. Each thermal zone in the prototypes is either mapped to a single space-by-space category or is assumed to be a mix of two or more space types. Because the three office prototypes do not have detailed thermal zones, the office building LPD from the whole building area method was used.
Section C406 of the IECC requires buildings to comply with the requirements in one of eight high efficiency package options. In the previously developed 2012 and 2015 IECC prototypes, the reduced lighting power option was selected. To be consistent with the previous IECC prototypes, PNNL selected the same option for the 2018 IECC. Some editorial changes to code language for this option (see C406.3) were made but the requirement remains the same, i.e., 10% reduction to the LPD calculated based on Tables C405.3.2(1) and C405.3.2(2). PNNL used the calculated LPD allowances accounting for C406.3 to develop two sets of lighting power inputs to the prototypes for the 2015 and 2018 IECC.

3.15
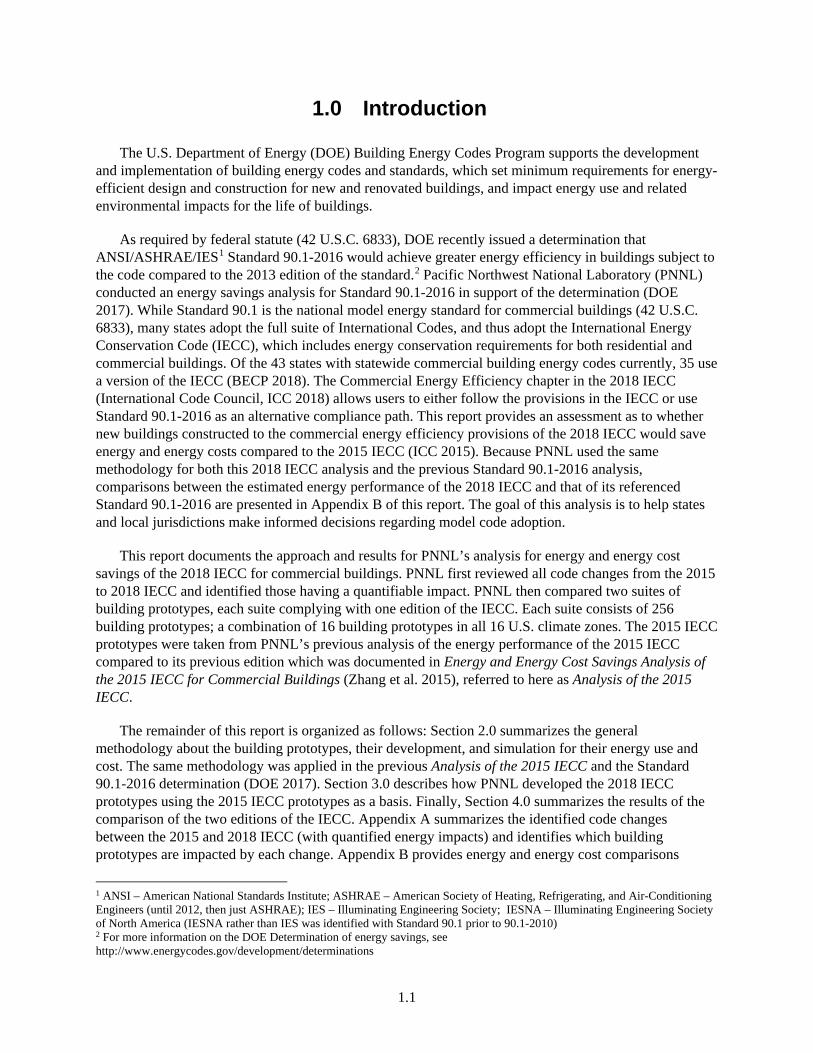
3.5.4 Exterior Lighting Power
Code Change Description. The exterior lighting power allowances for most area types and applications listed in Tables C405.4.2(2) and C405.4.2(3) are reduced in the 2018 IECC compared to the 2015 IECC.
Modeling Strategy. These changes are applicable to all prototypes for only three major exterior lighting applications: uncovered parking areas, building entrances and exits, and building facades. The development of assumptions for exterior lighting in prototypes is described in Thornton et al. (2011). Based on the lighting power allowances in Tables C405.4.2(2) and C405.4.2(3), the total exterior lighting power was calculated for each of the three major applications for all prototypes. During the recent DOE Standard 90.1-2016 Determination Analysis, PNNL updated some baseline assumptions about what exterior lighting zones are applicable to each prototype as shown in Table 3-5. These assumptions allow PNNL to assign the proper power allowance to a prototype based on its exterior lighting zone. Where a prototype is in two or three lighting zones, an average of the lighting power allowances for the multiple zones is used.
Table 3-5. Exterior Lighting Zones for Prototypes
Prototype Exterior Lighting Zone
Quick Service Restaurant 2,3,4 Full Service Restaurant 2,3,4 Strip Mall 2,3 Large Office 4 Outpatient Health Care 2,3 Non-refrigerated Warehouse 2,3 Stand-Alone Retail 2,3 Small Office 2,3 Medium Office 2,3 Primary School 2 Secondary School 2,3 Hospital 3,4 Small Hotel 3 Large Hotel 3,4 Mid-rise Apartment 2,3 High-rise Apartment 3,4
Table 3-6 summarizes the total exterior lighting power for each prototype for the 2015 and 2018 IECC and they are modeled as exterior lighting objects in the prototypes.
3.16
Table 3-6. Exterior Lighting Power in Prototypes for 2015 and 2018 IECC
Prototype Parking Lot Building Entrances Building Façade 2015 IECC (W)
2018 IECC (W)
2015 IECC (W)
2018 IECC (W)
2015 IECC (W)
2018 IECC (W)
Small Office 713 446 148 115 38 38 Medium Office 6947 4342 456 376 390 390 Large Office 42265 26027 1037 968 9734 9734 Stand-Alone Retail 2800 1751 1528 1304 238 238 Strip Mall 3390 2120 3240 2520 315 315 Primary School 881 584 2350 1646 113 113 Secondary School 4745 2974 3807 2995 332 332 Outpatient Health Care 6634 4148 1664 1402 131 131 Hospital 8905 5432 1669 1499 2203 2203 Small Hotel 3368 2022 247 225 432 432 Large Hotel 10182 6192 487 444 3755 3755 Non-refrigerated Warehouse 1604 1005 4594 3955 86 86 Quick Service Restaurant 979 608 55 42 92 92 Full Service Restaurant 2154 1337 143 123 116 116 Mid-rise Apartment 2286 1429 0 0 167 167 High-rise Apartment 8227 5011 0 0 1874 1874
3.5.5 Transformer Efficiency
Code Change Description. Table C405.7 Minimum Nominal Efficiency Levels for 10 CFR 431 Low-Voltage Dry-Type Distribution Transformers is updated with more stringent requirements for three-phase transformers, which reflect the federal energy efficiency standards that went into effect on January 1, 2016.
Modeling Strategy. Prototypes with floor areas greater than 50,000 square feet, i.e., Medium Office, Large Office, Primary School, Secondary School, Hospital, and Large Hotel, are assumed to include transformers as documented in Thornton et al. (2011). PNNL captured efficiency changes using the EnergyPlus transformer object, which takes efficiency input and requires electric end use through the transformer to be specified. All miscellaneous plug loads and incandescent lighting are assumed to be fed through the transformers. Assumptions about the fraction of incandescent lighting to total interior lighting in the prototypes are documented in Thornton et al. (2011).

4.1
4.0 Site Energy and Energy Cost Savings Results
This section summarizes the estimated site energy and energy cost savings for the 2018 IECC compared to the 2015 IECC. The results of the analysis are summarized in Table 4.1. This table groups the building prototypes by their principal activity and shows the construction weighting factors by building prototype. The table provides a side-by-side comparison of the site EUI and ECI for the 2015 and 2018 editions of the IECC. Site energy is utility electricity and natural gas delivered and used at the building site. The EUI and ECI shown in Table 4.1 for each prototype are national weighted averages across climate zones in the United States. The percent savings (reduction) in EUI and ECI are presented as well. A negative percentage would reflect increases in EUI or ECI. The last row of Table 4.1 shows the national weighted average results from all 16 prototypes and 16 climate zones using the construction weighting factors (see Table 2.2 in this report). As shown in Table 4.1, on a weighted national basis, the 2018 IECC results in 5.1% energy savings and 5.3% energy cost savings over the 2015 IECC. These savings include federally mandated efficiency improvements of appliances and equipment that have taken effect since (but independent of) the publication of the 2015 IECC. The savings attributed to federal appliance and equipment standards are included in the results in Table 4.1.
Table 4-1.Site Energy and Energy Cost Savings between the 2015 and 2018 IECC
Building Activity Building Prototype
Floor Area
Weight (%)
Site EUI (kBtu/ft2-yr) Site EUI
Savings (%)
ECI ($/ft²-yr) ECI
Savings (%) 2015
IECC 2018 IECC
2015 IECC
2018 IECC
Office Small Office 5.6 29.6 28.6 3.4% $0.89 $0.85 4.5%
Medium Office 6.0 34.2 33 3.5% $0.97 $0.93 4.1% Large Office 3.3 71.1 67.9 4.5% $2.04 $1.98 2.9%
Retail Stand-Alone Retail 15.3 47.1 40.9 13.2% $1.20 $1.04 13.3%
Strip Mall 5.7 55.4 51.5 7.0% $1.46 $1.33 9.6%
Education Primary School 5.0 52.7 48.8 7.4% $1.31 $1.20 8.4%
Secondary School 10.4 43.1 40.2 6.7% $1.11 $1.03 7.2%
Healthcare Outpatient Health Care 4.4 119.7 115.7 3.3% $3.09 $2.97 4.2%
Hospital 3.4 125.6 124.3 1.0% $2.90 $2.88 0.7%
Lodging Small Hotel 1.7 60.3 56.4 6.5% $1.29 $1.17 9.3% Large Hotel 5.0 87.7 85.4 2.6% $1.79 $1.75 1.7%
Warehouse Non-refrigerated Warehouse
16.7 16.2 14.4 11.1% $0.36 $0.30 16.7%
Food Service
Quick Service Restaurant 0.6 575.5 572.2 0.6% $8.45 $8.35 1.2% Full Service Restaurant 0.7 372 368 1.1% $6.28 $6.14 2.2%
Apartment Mid-Rise Apartment 7.3 43.6 43 1.4% $1.25 $1.23 1.6% High-Rise Apartment 9.0 47.6 46.6 2.1% $1.13 $1.10 2.7%
National Weighted Average 100.0 54.5 51.7 5.1% $1.31 $1.24 5.3%
As can be seen from Table 4.1, the savings vary significantly by prototype. This is expected as code requirements are different by building type and by climate. PNNL did not separately quantify the national impacts of individual code changes. Although this approach does not allow the ranking of all code

4.2
changes based on their energy savings impacts, a few high impact changes resulting in significant energy savings are listed below (categorized by end use):
a. HVAC: dual maximum control requirements to multiple-zone VAV systems with DDC (see Section 3.3.4); VAV system ventilation optimization when ERV is installed (see Section 3.3.5); HVAC control for hotel guestrooms during unoccupied hours (see Section 3.3.7).
b. Lighting: high efficacy lighting in dwelling units (see Section 3.5.1), lower interior and exterior lighting power allowance (see Sections 3.5.3 and 3.5.4), and extended occupancy sensor controls for open office area (see Section 3.5.2).
Figure 4.1 and Figure 4.2 illustrate the weighted EUI and ECI for each prototype and the national weighted EUI and ECI for the 2015 and 2018 editions of the IECC, respectively.
Figure 4.1. National Average Energy Use Intensity for all IECC Prototypes
0 100 200 300 400 500 600
National Weighted Average
High-Rise ApartmentMid-Rise Apartment
Full-Service RestaurantQuick-Service Restaurant
WarehouseLarge HotelSmall Hotel
HospitalOutpatient Healthcare
Secondary SchoolPrimary School
Strip MallStandalone Retail
Large OfficeMedium Office
Small Office
Energy Use Intensity [kBtu/ft2-yr]
2015 IECC 2018 IECC

4.3
Figure 4.2. National Average Energy Cost Index for all IECC Prototypes
Table 4.2 presents the 2018 IECC savings for all prototype buildings aggregated by climate zone. The energy and energy cost savings vary by climate zone. The energy savings in 10 climate zones are greater than 5% and the savings in the remaining six climate zones (i.e., 1A, 3B, 3C, 4B, 4C, and 5B) are between 3.6 and 5%. The energy cost savings in all climate zones are over 5% except for climate zones 1A and 3C. For all climate zones, the percentages of energy cost savings are greater than the energy savings. The savings variance is attributed to the applicability of the code changes to different climate zones and the construction weights of the building types within the climate zones.
0 2 4 6 8 10
National Weighted Average
High-Rise ApartmentMid-Rise Apartment
Full-Service RestaurantQuick-Service Restaurant
WarehouseLarge HotelSmall Hotel
HospitalOutpatient Healthcare
Secondary SchoolPrimary School
Strip MallStandalone Retail
Large OfficeMedium Office
Small Office
Energy Cost Index [$/ft2-yr]
2015 IECC 2018 IECC

4.4
Table 4-2. Site Energy and Energy Cost Savings between the 2015 and 2018 IECC by Climate Zone
Climate Zones
Site EUI Site EUI Savings
(%)
ECI ECI
Savings (%)
(kBtu/ft2-yr) ($/ft²-yr) 2015 IECC
2018 IECC
2015 IECC
2018 IECC
1A 49.4 47.6 3.6% 1.33 1.27 4.5% 2A 51.6 48.9 5.2% 1.36 1.28 5.9% 2B 51.3 48.5 5.5% 1.35 1.27 5.9% 3A 52.1 49.2 5.6% 1.29 1.21 6.2% 3B 48.2 46.1 4.4% 1.22 1.15 5.7% 3C 47.2 45.3 4.0% 1.22 1.16 4.9% 4A 55.4 52.6 5.1% 1.31 1.24 5.3% 4B 56.4 54.2 3.9% 1.33 1.26 5.3% 4C 51.0 48.9 4.1% 1.20 1.14 5.0% 5A 60.4 57.1 5.5% 1.32 1.24 6.1% 5B 57.0 54.8 3.9% 1.32 1.25 5.3% 5C 53.4 50.3 5.8% 1.28 1.20 6.3% 6A 69.8 66.0 5.4% 1.49 1.39 6.7% 6B 65.1 61.8 5.1% 1.43 1.35 5.6% 7 78.0 73.8 5.4% 1.60 1.50 6.3% 8 75.4 69.5 7.8% 1.44 1.31 9.0%
National Weighted Average 54.5 51.7 5.1% 1.31 1.24 5.3%

5.1
5.0 References
42 U.S.C. 6833. Chapter 42, U.S. Code, Section 6833. Available at http://www.gpo.gov/fdsys/pkg/USCODE-2011-title42/pdf/USCODE-2011-title42-chap81-subchapII.pdf. ASHRAE. 2016. ANSI/ASHRAE/IES Standard 90.1-2016. Energy Standard for Buildings Except Low-Rise Residential Buildings. ASHRAE, Atlanta, Georgia.
ASHRAE. 2013. ANSI/ASHRAE Standard 169-2013. Climatic Data for Building Design Standards. ASHRAE, Atlanta, Georgia.
Athalye R. A., Z. Taylor, and B. Liu. 2016. Impact of ASHRAE Standard 169-2013 on Building Energy Codes and Energy Efficiency. Building Performance Modeling Conference 2016. Salt Lake City, UT. Accessed August 29, 2018 at https://ibpsa-usa.org/index.php/ibpusa/article/download/389/375.
BECP – U.S. Department of Energy, Building Energy Codes Program. 2018. Status of State Energy Code Adoption. Accessed August 29, 2018 at http://www.energycodes.gov/adoption/states.
DOE. 2015. EnergyPlus Energy Simulation Software, Version 8.0. U.S. Department of Energy, Washington, D.C. Accessed August 29, 2018 at http://apps1.eere.energy.gov/buildings/EnergyPlus/.
DOE. 2017. Final Energy Savings Analysis ANSI/ASHRAE/IES Standard 90.1-2016. U.S. Department of Energy, Washington, D.C. Accessed August 29, 2018 at https://www.energy.gov/sites/prod/files/2018/02/f49/02142018-standard-90.1-2016-determination.pdf.
DOE and PNNL. 2018. Commercial Prototype Building Models, Richland, WA, Pacific Northwest National Laboratory. Available at https://www.energycodes.gov/development/commercial/prototype_models.
ECPA. Energy Conservation and Production Act of 1976. Public Law 94-385. Accessed April 29, 2015 at http://www.gpo.gov/fdsys/pkg/STATUTE-90/pdf/STATUTE-90-Pg1125.pdf.
EIA. 2003. Commercial Buildings Energy Consumption Survey 2003. Energy Information Administration of U.S. Department of Energy, Washington, D.C. Accessed August 29, 2018 at http://www.eia.doe.gov/emeu/cbecs/contents.html.
Gifford W, ML Goldberg, PM Tanimoto, DR Celnicker, and ME Poplawski. 2012. Residential Lighting End-Use Consumption Study: Estimation Framework and Initial Estimates. Fairfax, VA. Accessed August 29, 2018 at https://www1.eere.energy.gov/buildings/publications/pdfs/ssl/2012_residential-lighting-study.pdf.
Goel S, R. A. Athalye, W. Wang, J. Zhang, M. I. Rosenberg, Y. L. Xie, P. R. Hart, and V. V. Mendon. 2014. Enhancements to ASHRAE Standard 90.1 Prototype Building Models. PNNL-23269, Pacific Northwest National Laboratory, Richland, WA. Accessed April 29, 2015 at http://www.pnnl.gov/main/publications/external/technical_reports/PNNL-23269.pdf.
ICC 2015 – International Code Council. 2015. 2015 International Mechanical Code®. Washington D.C.

5.2
ICC 2018 – International Code Council. 2018. 2018 International Energy Conservation Code®. Washington, D.C.
Jarnagin R. E. and G. K. Bandyopadhyay. 2010. Weighting Factors for the Commercial Prototype Buildings Used in the Development of ANSI/ASHRAE/IENSA Standard 90.1-2010. PNNL-19116, Pacific Northwest National Laboratory, Richland, Washington. Accessed August 29, 2018 at http://www.pnl.gov/main/publications/external/technical_reports/PNNL-19116.pdf.
Richman EE, E Rauch, J Knappek, J Phillips, K Petty, and P Lopez-Rangel. 2008. “National Commercial Construction Characteristics and Compliance with Building Energy Codes: 1999-2007.” 2008 ACEEE Summer Study on Energy Efficiency in Buildings, ACEEE Publications, Washington, D.C.
Thornton, B. A., W. Wang, H. Cho, Y. Xie, V. V. Mendon., E. E. Richman, J. Zhang, R. A. Athalye, M. I. Rosenberg, and B. Liu. 2011. Achieving 30% Goal: Energy and Cost Saving Analysis of ASHRAE/IES Standard 90.1-2010. PNNL-20405. Pacific Northwest National Laboratory, Richland, Washington. Accessed April 29, 2015 at http://www.energycodes.gov/publications/research/documents/codes/PNNL-20405.pdf.
VonNeida, B., D. Maniccia, and T. Allan. 2000. An Analysis of the Energy and Cost Savings Potential of Occupancy Sensors for Commercial Lighting Systems. Illuminating Engineering Society of North America 2000 Annual Conference: Proceedings. IESNA, New York. Accessed August 29, 2018 at http://www.lrc.rpi.edu/resources/pdf/dorene1.pdf.
Zhang J, Y. Xie, R. A. Athalye, J. Zhuge, M. I. Rosenberg, P. R. Hart, and B. Liu. 2015. Energy and Energy Cost Savings Analysis of the 2015 IECC for Commercial Buildings. PNNL-24269 Rev. 1, Pacific Northwest National Laboratory, Richland, WA. Accessed August 29, 2018 at https://www.energycodes.gov/sites/default/files/documents/2015_IECC_Commercial_Analysis.pdf.

Appendix A
Code Changes from the 2015 to 2018 IECC Included in Analysis and their Impact on Building Prototypes
A
.1
Appendix A
Code Changes from the 2015 and 2018 IECC Included in Analysis and their Impact on Building Prototypes
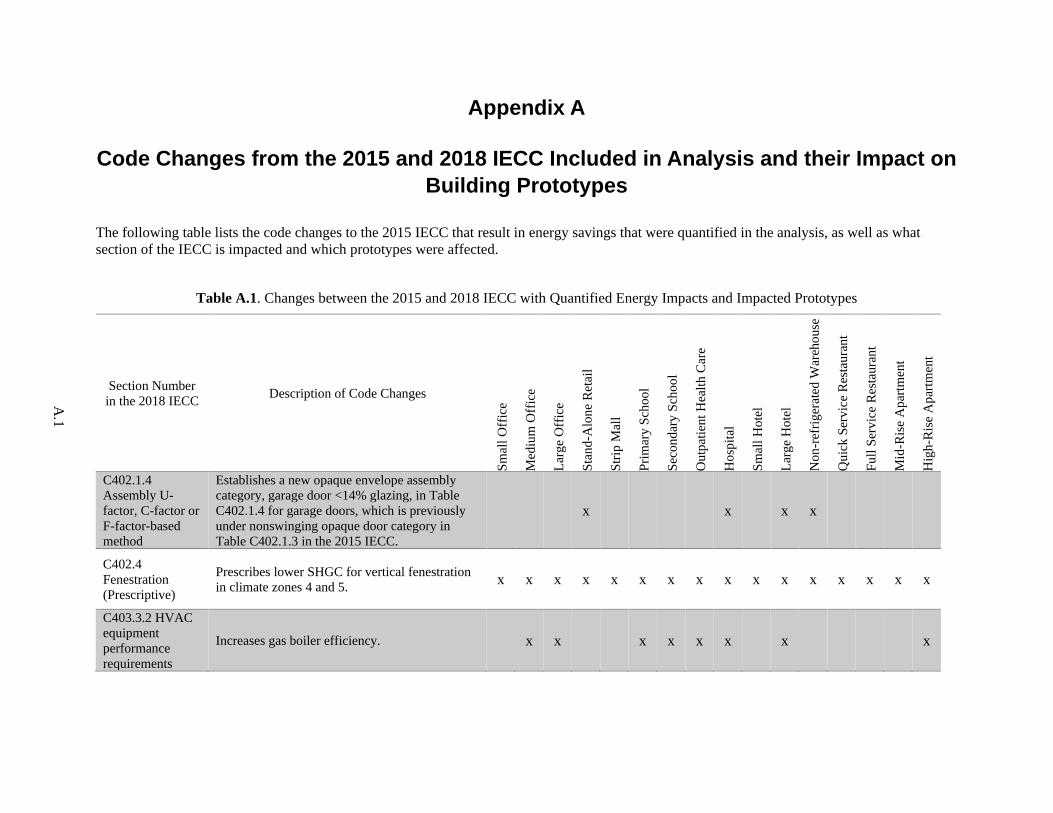
The following table lists the code changes to the 2015 IECC that result in energy savings that were quantified in the analysis, as well as what section of the IECC is impacted and which prototypes were affected.
Table A.1. Changes between the 2015 and 2018 IECC with Quantified Energy Impacts and Impacted Prototypes
Section Number in the 2018 IECC Description of Code Changes
Smal
l Off
ice
Med
ium
Off
ice
Larg
e O
ffic
e
Stan
d-A
lone
Ret
ail
Strip
Mal
l
Prim
ary
Scho
ol
Seco
ndar
y Sc
hool
Out
patie
nt H
ealth
Car
e
Hos
pita
l
Smal
l Hot
el
Larg
e H
otel
Non
-ref
riger
ated
War
ehou
se
Qui
ck S
ervi
ce R
esta
uran
t
Full
Serv
ice
Rest
aura
nt
Mid
-Ris
e A
partm
ent
Hig
h-R
ise
Apa
rtmen
t
C402.1.4 Assembly U-factor, C-factor or F-factor-based method
Establishes a new opaque envelope assembly category, garage door <14% glazing, in Table C402.1.4 for garage doors, which is previously under nonswinging opaque door category in Table C402.1.3 in the 2015 IECC.
x x x x
C402.4 Fenestration (Prescriptive)
Prescribes lower SHGC for vertical fenestration in climate zones 4 and 5. x x x x x x x x x x x x x x x x
C403.3.2 HVAC equipment performance requirements
Increases gas boiler efficiency. x x x x x x x x

A
.2
Section Number in the 2018 IECC Description of Code Changes
Smal
l Off
ice
Med
ium
Off
ice
Larg
e O
ffic
e
Stan
d-A
lone
Ret
ail
Strip
Mal
l
Prim
ary
Scho
ol
Seco
ndar
y Sc
hool
Out
patie
nt H
ealth
Car
e
Hos
pita
l
Smal
l Hot
el
Larg
e H
otel
Non
-ref
riger
ated
War
ehou
se
Qui
ck S
ervi
ce R
esta
uran
t
Full
Serv
ice
Rest
aura
nt
Mid
-Ris
e A
partm
ent
Hig
h-R
ise
Apa
rtmen
t
C403.4.1.4 Heated or cooled vestibules (Mandatory)
Adds control requirements for heating and cooling systems in vestibules.
x
C403.4.4 Part-load controls
Reduces the threshold for variable flow pumping requirements for chilled water pumps and adds requirement for heating water pumps. Expands the VSD requirement to heat rejection loops.
x x x x x x
C403.6.1 Variable air volume and multiple zone systems
Adds dual maximum control requirements to multiple-zone VAV systems with DDC.
x x x x x x
C403.6.6 Multiple-zone VAV system ventilation optimization control
Requires VAV system ventilation optimization even when ERV is installed.
x x x x x x x
C403.7.4 Energy recovery ventilation systems (Mandatory)
Raises minimum threshold for energy recovery. x x
C403.7.6 Automatic control of HVAC systems serving guestrooms (Mandatory)
Requires deeper thermostat setback for networked guestrooms or those unoccupied for more than 16 hours/day. Also requires ventilation be turned off when guestrooms are unoccupied.
x x

A
.3
Section Number in the 2018 IECC Description of Code Changes
Smal
l Off
ice
Med
ium
Off
ice
Larg
e O
ffic
e
Stan
d-A
lone
Ret
ail
Strip
Mal
l
Prim
ary
Scho
ol
Seco
ndar
y Sc
hool
Out
patie
nt H
ealth
Car
e
Hos
pita
l
Smal
l Hot
el
Larg
e H
otel
Non
-ref
riger
ated
War
ehou
se
Qui
ck S
ervi
ce R
esta
uran
t
Full
Serv
ice
Rest
aura
nt
Mid
-Ris
e A
partm
ent
Hig
h-R
ise
Apa
rtmen
t
C403.9.1 Fan speed control
Reduces the threshold for variable flow heat rejection device fans from 7.5 to 5 hp and includes the service factor power in the determination of a 5 hp threshold. Eliminates the exception for climate zones 1 and 2.
x
C404.2 Service water-heating equipment performance efficiency
Updates efficiency requirements for electric water heaters (>12kW) and gas water heaters (<75Kbtu/h) based on the latest federal requirement effective in 2018.
x x x x
C405.1 General (Mandatory)
Increases efficacy requirements for lighting installed in dwelling units.
x x
C405.2.1.3 Occupant sensor control function in open plan office areas
Adds occupancy sensor requirements for open offices. x x x x x
C405.3.2 Interior lighting power allowance
Changes interior lighting power allowances including display lighting. x x x x x x x x x x x x x x x x
C405.4.2 Exterior lighting power allowance
Reduces exterior lighting power allowances. x x x x x x x x x x x x x x x x

A
.4
Section Number in the 2018 IECC Description of Code Changes
Smal
l Off
ice
Med
ium
Off
ice
Larg
e O
ffic
e
Stan
d-A
lone
Ret
ail
Strip
Mal
l
Prim
ary
Scho
ol
Seco
ndar
y Sc
hool
Out
patie
nt H
ealth
Car
e
Hos
pita
l
Smal
l Hot
el
Larg
e H
otel
Non
-ref
riger
ated
War
ehou
se
Qui
ck S
ervi
ce R
esta
uran
t
Full
Serv
ice
Rest
aura
nt
Mid
-Ris
e A
partm
ent
Hig
h-R
ise
Apa
rtmen
t
C405.6 Electrical transformers (Mandatory)
Updates transformer efficiency requirements. x x x x x x

Appendix B
Energy and Energy Cost Savings for the 2018 IECC and Corresponding Standard 90.1-2016

B.1
Appendix B
Energy and Energy Cost Savings for the 2018 IECC and Corresponding Standard 90.1-2016
Section 304(b) of the ECPA (Energy Conservation and Production Act), as amended, requires the Secretary of Energy to make a determination each time a revised edition of Standard 90.1 is published with respect to whether the revised standard would improve energy efficiency in commercial buildings. When DOE issues an affirmative determination on Standard 90.1, states are statutorily required to certify within two years that they have reviewed and updated the commercial provisions of their building energy code, with respect to energy efficiency, to meet or exceed the revised standard (42 U.S.C. 6833).
In support of DOE’s determination, PNNL conducted an energy savings analysis for Standard 90.1-2016 compared to Standard 90.1-2013 (DOE 2017). Based on that analysis, DOE issued a determination that Standard 90.1-2016 would achieve greater energy efficiency in buildings compared to the 2013 edition of the standard.
As many states have historically adopted the IECC for both residential and commercial buildings, PNNL has also compared energy performance of Standard 90.1-2016 with the 2018 IECC to help states and local jurisdictions make informed decisions regarding model code adoption. Of the 43 states with statewide commercial building energy codes currently, 35 use a version of the IECC (BECP 2018).
Table B.1 shows side-by-side comparisons of the site EUI and ECI for Standard 90.1-2016 and the 2018 IECC for each of 16 prototype buildings along with the percent difference between the two. The national weighted average of all prototypes combined is also shown. Negative percentage differences indicate higher energy usage or energy costs for buildings designed to the 2018 IECC compared to those designed to Standard 90.1-2016.

B.2
Table B.1. Site Energy and Energy Cost Savings between Standard 90.1-2016 and the 2018 IECC
Building Prototype
Site EUI ECI
Standard 90.1-2016 2018 IECC 2018 IECC
compared to 90.1-2016 (%)
Standard 90.1-2016
2018 IECC
2018 IECC compared to
90.1-2016 (%) (kBtu/ft²/yr) (kBtu/ft²/yr) ($/ft²/yr) ($/ft²/yr) Small Office 26.0 28.6 -10.0% $0.78 $0.85 -9.0% Medium Office 31.8 33.0 -3.8% $0.90 $0.93 -3.3% Large Office 67.0 67.9 -1.3% $1.95 $1.98 -1.5% Stand-Alone Retail 41.8 40.9 2.2% $1.07 $1.04 2.8% Strip Mall 52.1 51.5 1.2% $1.35 $1.32 2.2% Primary School 43.6 48.8 -11.9% $1.03 $1.20 -16.5% Secondary School 36.6 40.2 -9.8% $0.90 $1.03 -14.4% Outpatient Health Care 112.1 115.7 -3.2% $2.87 $2.96 -3.1% Hospital 120.1 124.3 -3.5% $2.74 $2.88 -5.1% Small Hotel 55.0 56.4 -2.5% $1.12 $1.17 -4.5% Large Hotel 85.2 85.4 -0.2% $1.73 $1.75 -1.2% Non-refrigerated Warehouse 14.8 14.4 2.7% $0.30 $0.30 0.0%
Quick Service Restaurant 564.6 572.2 -1.3% $8.27 $8.35 -1.0%
Full Service Restaurant 366.1 368.0 -0.5% $6.08 $6.14 -1.0% Mid-Rise Apartment 41.9 43.0 -2.6% $1.20 $1.23 -2.5% High-Rise Apartment 45.3 46.6 -2.9% $1.05 $1.10 -4.8% National Weighted Average 50.4 51.7 -2.6% $1.19 $1.24 -4.2%
Figures B.1 and B.2 show the same results graphically. For most prototypes, both EUIs and ECIs were lower using Standard 90.1-2016 except for Stand-alone Retail and Strip Mall prototypes where the 2018 IECC resulted in lower energy use and energy costs. The 2018 IECC results in lower energy use and energy cost than Standard 90.1-2016 in the two retail prototypes because of two main reasons: 1) the design lighting power density for Sales Area space type in the 2018 IECC (with reduced lighting power per C406.3, a selected Additional Efficiency Package Option for this analysis) is lower than that in Standard 90.1-2016; and 2) the 2018 IECC requires all buildings to have optimum start controls where Standard 90.1-2016 (Section 6.4.3.3.3) does not require them to do so because the two prototypes are assumed not to have DDC controls.
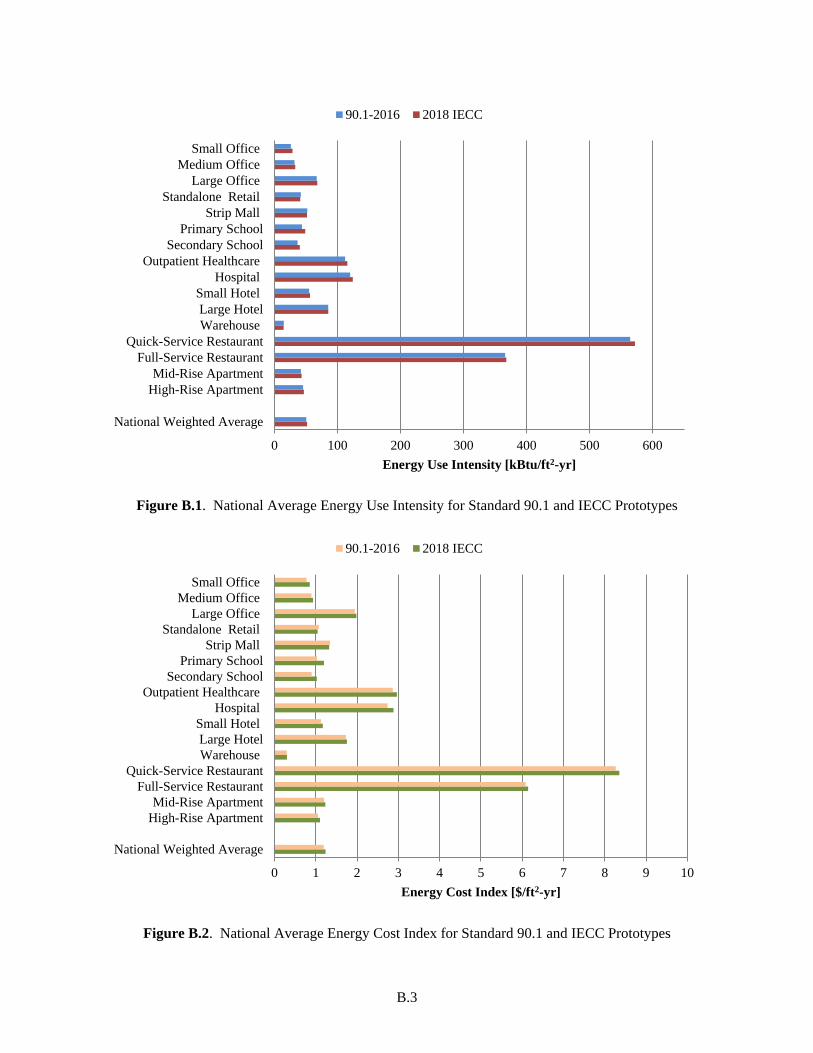
B.3
Figure B.1. National Average Energy Use Intensity for Standard 90.1 and IECC Prototypes
Figure B.2. National Average Energy Cost Index for Standard 90.1 and IECC Prototypes
0 100 200 300 400 500 600
National Weighted Average
High-Rise ApartmentMid-Rise Apartment
Full-Service RestaurantQuick-Service Restaurant
WarehouseLarge Hotel
Small HotelHospital
Outpatient HealthcareSecondary School
Primary SchoolStrip Mall
Standalone RetailLarge Office
Medium OfficeSmall Office
Energy Use Intensity [kBtu/ft2-yr]
90.1-2016 2018 IECC
0 1 2 3 4 5 6 7 8 9 10
National Weighted Average
High-Rise ApartmentMid-Rise Apartment
Full-Service RestaurantQuick-Service Restaurant
WarehouseLarge Hotel
Small HotelHospital
Outpatient HealthcareSecondary School
Primary SchoolStrip Mall
Standalone RetailLarge Office
Medium OfficeSmall Office
Energy Cost Index [$/ft2-yr]
90.1-2016 2018 IECC

B.4
The comparisons show the combined energy impacts of differences between the 2018 IECC and Standard 90.1-2016. Although the current analysis does not compare or rank the individual differences based on their energy savings, a few high impact differences by category can be identified as follows:
a. Envelope ○ Prescriptive window-to-wall ratio (WWR) limit: the 2018 IECC allows a WWR up to 30%
unless a significant portion of the building is equipped with daylight responsive controls, in which case up to 40% is allowed. Standard 90.1-2016 requires WWR less than 40%.
○ Semi-heated space envelope requirements: the 2018 IECC does not have separate envelope requirements for semi-heated spaces. Semi-heated spaces are required to follow conditioned space requirements. Standard 90.1-2016 has less stringent insulation requirements for semi-heated spaces.
○ Vertical fenestration U-factor independent of frame material: the U-factor requirements for vertical fenestration in the 2018 IECC are independent of the frame material. Standard 90.1-2016 has higher U-factors for metal-framed fenestration than for nonmetal-framed fenestration.
○ Vestibule exceptions: the 2018 IECC exempts building entrance doors that open up to a space less than 3,000 square feet; Standard 90.1-2016 does not. The 2018 IECC also includes an exception from vestibule requirements if an air curtain is installed instead; Standard 90.1-2016 does not have such an exception.
○ Fenestration orientation: the 2018 IECC does not limit the distribution of fenestration area. Standard 90.1-2016 limits the fenestration area on the east and west façades.
b. Building mechanical systems ○ Transfer air: the 2018 IECC requires the use of transfer air to kitchen exhaust systems.
Standard 90.1-2016 expands the requirement to more exhaust systems, including restroom and laundry exhaust.
○ Door switch connected to HVAC: Standard 90.1-2016 requires doors opening to the outside, which do not close automatically, to have switches that connect to the HVAC system, such that the HVAC system is put into deep setback (55°F for heating and 90°F for cooling) automatically 5 minutes after the door is opened. The requirement attempts to reduce the HVAC energy spent in satisfying the unintentional infiltration load from operable doors. The 2018 IECC does not have such a requirement.
c. Lighting ○ Dwelling unit (apartment) lighting power: the 2018 IECC requires 90% of all permanently
installed luminaires in dwelling units to be high efficacy. Standard 90.1-2016 requires 75%. ○ Controls for secondary daylight zone: the 2018 IECC does not require secondary daylight
zones to have daylight responsive controls; Standard 90.1-2016 does.
○ Egress lighting control: Standard 90.1-2016 requires lighting connected to emergency circuits to be turned off in spaces that comply with the automatic full off or scheduled off requirements when there are no occupants. It provides an exception to the automatic full off and scheduled off requirements for egress lighting by allowing 0.02 W/ft2 or less lighting power to remain on during the unoccupied period. The 2018 IECC does not have such a requirement.

B.5
○ Parking area luminaire control: Standard 90.1-2016 requires activity-sensing controls for pole-mounted lighting in parking lots with mounting heights lower than 24 feet and with lighting power greater than 78 W. The 2018 IECC does not have such a requirement.
d. Additional efficiency package options ○ The interior lighting power allowances in Tables C405.3.2(1) and C405.3.2(2) in the 2018
IECC are almost the same as the corresponding requirements in Standard 90.1-2016. As discussed in Section 3.5.3, of the six additional efficiency package options, PNNL selected the reduced lighting power option to develop the 2018 IECC prototypes. Standard 90.1-2016 does not have such a requirement and therefore the modeled lighting power in the 90.1-2016 prototypes is about 10% more than the 2018 IECC prototypes.
Table B2 show the comparison of the analysis results for Standard 90.1-2016 and the 2018 IECC by climate zone. The EUI and ECI shown in the table for each climate zone are weighted averages across the 16 prototypes within that climate zone in the United States. For all climate zones, the table shows buildings designed to the 2018 IECC have higher energy consumption and costs than those designed to Standard 90.1-2016 based on a weighted average.
Table B.2. Site Energy and Energy Cost Savings between Standard 90.1-2016 and the 2018 IECC by Climate Zone
Climate Zone
Site EUI ECI
Standard 90.1-2016 2018 IECC
2018 IECC compared to 90.1-2016 (%)
Standard 90.1-2016 2018 IECC
2018 IECC compared to 90.1-2016 (%) (kBtu/ft²/yr) (kBtu/ft²/yr) ($/ft²/yr) ($/ft²/yr)
1A 46.0 47.6 -3.5% 1.22 1.27 -4.1% 2A 47.6 48.9 -2.7% 1.23 1.28 -4.1% 2B 47.0 48.5 -3.2% 1.22 1.27 -4.1% 3A 48.4 49.2 -1.7% 1.17 1.21 -3.4% 3B 44.7 46.1 -3.1% 1.11 1.15 -3.6% 3C 44.0 45.3 -3.0% 1.11 1.16 -4.5% 4A 51.4 52.6 -2.3% 1.20 1.24 -3.3% 4B 52.5 54.2 -3.2% 1.21 1.26 -4.1% 4C 47.6 48.9 -2.7% 1.10 1.14 -3.6% 5A 55.9 57.1 -2.1% 1.20 1.24 -3.3% 5B 53.0 54.8 -3.4% 1.19 1.25 -5.0% 5C 48.9 50.3 -2.9% 1.16 1.20 -3.4% 6A 64.6 66.0 -2.2% 1.35 1.39 -3.0% 6B 59.3 61.8 -4.2% 1.28 1.35 -5.5% 7 71.8 73.8 -2.8% 1.44 1.50 -4.2% 8 67.2 69.5 -3.4% 1.26 1.31 -4.0%
National Weighted Average 50.4 51.7 -2.6% 1.19 1.24 -4.2%
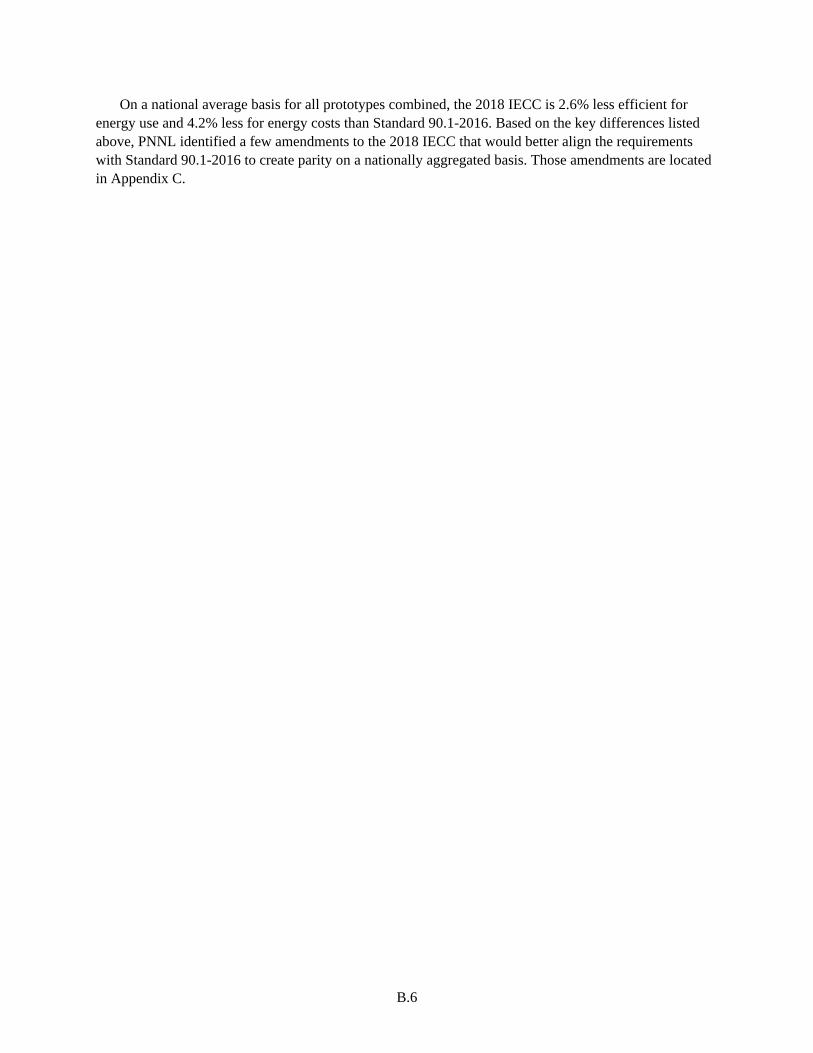
B.6
On a national average basis for all prototypes combined, the 2018 IECC is 2.6% less efficient for energy use and 4.2% less for energy costs than Standard 90.1-2016. Based on the key differences listed above, PNNL identified a few amendments to the 2018 IECC that would better align the requirements with Standard 90.1-2016 to create parity on a nationally aggregated basis. Those amendments are located in Appendix C.

Appendix C
Amendments to the 2018 IECC to Align with Standard 90.1-2016

C.1
Appendix C
Amendments to the 2018 IECC to Align with Standard 90.1-2016
C.1 Proposed Amendments to Align the 2018 IECC with Standard 90.1-2016
PNNL identified a few amendments to the 2018 IECC that would better align the requirements with Standard 90.1-2016 to create parity on a nationally aggregated basis. States can use these amendments as they engage individual processes to review and update their building codes with respect to energy efficiency. Amendments provided are a resource for each state’s consideration as they tailor their state building code to their individual needs. DOE provides the amendments to allow each state options and ease the burden of meeting the statutory requirement. A summary of each suggested amendment is provided below along with specific code change language to be applied to the 2018 IECC shown with inserted and deleted text. Tables C.1 and C.2 show the impact of adding these amendments to the 2018 IECC and the difference with Standard 90.1-2016 by building type and climate zone, respectively. The tables show that the addition of this package of amendments will result in both national weighted site energy cost and energy use for the 2018 IECC of within 1% of Standard 90.1-2016.

C.2
Table C.1. Site Energy Savings and Energy Cost Savings for the 2018 IECC with Amendments and Standard 90.1 2016 by Prototype
Building Prototype
Site Energy Use Site Energy Cost
Standard 90.1-2016
(kBtu/ft²/yr)
2018 IECC with
amendments (kBtu/ft²/yr)
2018 IECC with
amendments compared to
90.1 2016 (%)
Standard 90.1-2016
Cost ($/ft²/yr)
2018 IECC with
amendments Cost ($/ft²/yr)
2018 IECC with
amendments compared to
90.1 2016 (%) Small Office 26.0 25.7 1.2% $0.78 $0.77 1.3% Medium Office 31.8 31.4 1.3% $0.90 $0.89 1.1% Large Office 67.0 66.4 0.9% $1.95 $1.94 0.5% Stand-Alone Retail 41.8 40.2 3.8% $1.07 $1.02 4.7% Strip Mall 52.1 50.5 3.1% $1.35 $1.29 4.4% Primary School 43.6 44.2 -1.4% $1.03 $1.05 -1.9% Secondary School 36.6 36.9 -0.8% $0.90 $0.92 -2.2% Outpatient Health Care 112.1 114.6 -2.2% $2.87 $2.93 -2.1% Hospital 120.1 123.7 -3.0% $2.74 $2.86 -4.4% Small Hotel 55.0 56.4 -2.5% $1.12 $1.17 -4.5% Large Hotel 85.2 85.3 -0.1% $1.73 $1.75 -1.2% Non-refrigerated Warehouse 14.8 13.9 6.1% $0.30 $0.28 6.7%
Quick Service Restaurant 564.6 570.9 -1.1% $8.27 $8.32 -0.6%
Full Service Restaurant 366.1 366.9 -0.2% $6.08 $6.11 -0.5% Mid-rise Apartment 41.9 42.9 -2.4% $1.20 $1.23 -2.5% High-rise Apartment 45.3 46.6 -2.9% $1.05 $1.10 -4.8% National Weighted Average 50.4 50.5 -0.2% $1.19 $1.20 -0.8%

C.3
Table C.2. Site Energy Savings and Energy Cost Savings for the 2018 IECC with Amendments and Standard 90.1 2016 by Climate Zone
Climate Zone
Site Energy Use Site Energy Cost
Standard 90.1-2016
(kBtu/ft²/yr)
2018 IECC with
Amendments (kBtu/ft²/yr)
2018 IECC with
Amendments Compared to
90.1 2016 (%)
Standard 90.1-2016
Cost ($/ft²/yr)
2018 IECC with
Amendments Cost ($/ft²/yr)
2018 IECC with
Amendments Compared to
90.1 2016 (%) 1A 46.0 46.6 -1.3% 1.22 1.24 -1.6% 2A 47.6 47.5 0.2% 1.23 1.23 0.0% 2B 47.0 47.1 -0.2% 1.22 1.22 0.0% 3A 48.4 47.8 1.2% 1.17 1.16 0.9% 3B 44.7 44.9 -0.4% 1.11 1.12 -0.9% 3C 44.0 44.2 -0.5% 1.11 1.13 -1.8% 4A 51.4 51.5 -0.2% 1.20 1.20 0.0% 4B 52.5 52.8 -0.6% 1.21 1.22 -0.8% 4C 47.6 48.0 -0.8% 1.10 1.11 -0.9% 5A 55.9 56.0 -0.2% 1.20 1.20 0.0% 5B 53.0 53.5 -0.9% 1.19 1.21 -1.7% 5C 48.9 49.1 -0.4% 1.16 1.16 0.0% 6A 64.6 64.9 -0.5% 1.35 1.35 0.0% 6B 59.3 60.6 -2.2% 1.28 1.31 -2.3% 7 71.8 72.7 -1.3% 1.44 1.46 -1.4% 8 67.2 68.6 -2.1% 1.26 1.27 -0.8%
National Weighted Average 50.4 50.5 -0.2% 1.19 1.20 -0.8%
C.1.1 Exterior Lighting Controls
Purpose:
Require activity-sensing controls for parking lot lighting with low mounting heights (below 24 ft) and luminaire rated wattage greater than 78 W. These controls would reduce lighting power by at least 50% per luminaire when no activity is detected in the zone served by the lighting.
Specific Amendment to the 2018 IECC:
C405.2.6.3 Lighting setback. Lighting that is not controlled in accordance with Section C405.2.6.2 shall be controlled so that the total wattage of such lighting is automatically reduced by not less than 30 50 percent by selectively switching off or dimming luminaires at one of the following times:
1. From not later than midnight to not earlier than 6 a.m.
2. From not later than one hour after business closing to not earlier than one hour before business opening.

C.4
3. During any time where activity has not been detected for 15 minutes or more.
4. Luminaires serving outdoor parking areas and having a rated input wattage of greater than 78 W and a mounting height of 24 ft (7.3 m) or less above the ground, shall be controlled to automatically reduce the power of each luminaire by a minimum of 50% when no activity has been detected in the area illuminated by the controlled luminaires for a time of no longer than 15 minutes. No more than 1,500 W of lighting power shall be controlled together.
C.1.2 Egress Lighting Controls
Purpose:
Require interior lights to have scheduled shutoff control except for egress lighting, up to a maximum of 0.02 W/ft2 multiplied by the gross lighted area of the building.
Specific Amendment to the 2018 IECC:
C405.2 Lighting controls (Mandatory). Lighting systems shall be provided with controls that comply with one of the following.
1. Lighting controls as specified in Sections C405.2.1 through C405.2.76.
2. Luminaire level lighting controls (LLLC) and lighting controls as specified in Sections C405.2.1, C405.2.4, and C405.2.5, and C405.2.6. The LLLC luminaire shall be independently capable of:
2.1. Monitoring occupant activity to brighten or dim to off lighting when occupied or unoccupied, respectively.
2.2. Monitoring ambient light, both electric light and daylight, and brighten or dim artificial light to maintain desired light level.
2.3. For each control strategy, configuration and reconfiguration of performance parameters including: bright and dim setpoints, timeouts, dimming fade rates, sensor sensitivity adjustments, and wireless zoning configurations.
Exceptions: Lighting controls are not required for the following:
1. Areas designated as security or emergency areas that are required to be continuously lighted.
2. Interior exit stairways, interior exit ramps and exit passageways up to a maximum of 0.02 W/ft2 multiplied by the gross lighted area of the building.
3. Emergency egress lighting that is normally off.
C405.2.6 Scheduled shutoff. All lighting in the building not meeting requirements of C405.2.1, including lighting connected to emergency circuits, shall be automatically shut off during periods when the space is scheduled to be unoccupied using either (1) a time-of-day operated control device

C.5
that automatically turns the lighting off at specific programmed times or (2) a signal from another automatic control device or alarm/security system. The control device or system shall provide independent control sequences that (1) control the lighting for an area of no more than 25,000 square feet (2322 m2), (2) include no more than one floor, and (3) shall be programmed to account for weekends and holidays. Any manual control installed to provide override of the scheduled shutoff control shall not turn the lighting on for more than 2 hours per activation during scheduled off periods and shall not control more than 5000 square feet (465 m2).
Exceptions: Lighting controls are not required for the following:
1. Lighting in spaces where lighting is required for 24/7 continuous operation.
2. Lighting in spaces where patient care is rendered.
3. Lighting in spaces where automatic shutoff would endanger the safety or security of the room or building occupants.
4. Lighting load not exceeding 0.02 W/ft2 multiplied by the gross lighted area of the building.
C405.2.76 Exterior lighting controls. Exterior lighting systems shall be provided with controls that comply with Sections C405.2.67.1 through C405.2.6.4. Decorative lighting systems shall comply with Sections C405.2.67.1, C405.2.67.2 and C405.2.67.4.
RENUMBER ALL SUBSECTIONS UNDER C405.2.6.1, C405.2.6.2, C405.2.6.3, AND C405.2.6.4 TO C405.2.7.1, C405.2.7.2, C405.2.7.3, AND C405.2.7.4, RESPECTIVELY.
C.1.3 Automatic Receptacle Control
Purpose:
Require automatic receptacle controls to reduce previously unregulated plug and process loads consumed by electric equipment in offices and other smaller spaces.
Specific Amendment to the 2018 IECC:
C405.10 Automatic Receptacle Control (Mandatory)
The following shall be automatically controlled:
a. At least 50% of all 125 V, 15 and 20 amp receptacles in all private offices, conference rooms, rooms used primarily for printing and/or copying functions, break rooms, classrooms, and individual workstations.
b. At least 25% of branch circuit feeders installed for modular furniture not shown on the construction documents.
This control shall function on

C.6
a. a scheduled basis using a time-of-day operated control device that turns receptacles off at specific programmed times—an independent program schedule shall be provided for controlled areas of no more than 5000 square feet and not more than one floor (the occupant shall be able to manually override the control device for up to two hours);
b. an occupant sensor that shall turn receptacles off within 20 minutes of all occupants leaving a space; or
c. an automated signal from another control or alarm system that shall turn receptacles off within 20 minutes after determining that the area is unoccupied.
All controlled receptacles shall be permanently marked to visually differentiate them from uncontrolled receptacles and are to be uniformly distributed throughout the space. Plug-in devices shall not be used to comply with Section C405.10.
Exceptions to Section C405.10
Receptacles for the following shall not require an automatic control device: 1. Receptacles specifically designated for equipment requiring continuous operation (24/day, 365 days/year). 2. Spaces where an automatic control would endanger the safety or security of the room or building
occupants.