Lrlove2015 150128105212-conversion-gate01-150129034548-conversion-gate01
Upload
mark-francisCategory
view
69download
2
??
1
Storage Requirement Analysis

??
In 1980, an environmental think tank coined the notion Energiewende.
“growth and prosperity without petroleum and uranium”

??In this analysis, German solar photo-voltaic PV, wind & demand data for every hour between January 1st 2012 & December 31st 2013 is used to build an image of the grid today.PV & Wind power output is then increased by varying factors to build a realistic picture of a future German grid.
Hydro & Biomass power output is assumed to be constant at 500MW & 6000 MW throughout.
3

??
0
10000
20000
30000
40000
50000
60000
70000
80000
Biomass, Hydro, Wind, PV & DemandTitle
Max PVMax WindBiomassHydroMAX Load
This is how the grid looks today. Low points in the demand curve are weekends, and the larger troughs at the end each year correspond to Christmas. At no point in time was demand met by the renewable energy(RE) infrastructure.
In the summer, PV works well during daylight hours, but supplies no power after sunset. Similarly wind in the winter will blow strongly for a few days at a time, but then gives little output for days or weeks. For RE to be effective at replacing fossil fuels it needs to be increased dramatically and its variability somehow reduced or compensated.
MW
4

??
Even with a huge increase in the supply of RE, there will still be gaps between supply and demand. For Energiewende to succeed without the burning of fossil fuels, it is vital that a cost effective method is found to store energy for extended periods. This can then be released, to fill the gaps where no RE is available to meet demand.
5

??
This chart is wind, solar and exports for June 2013. Notice how exports coincide with solar output.
On Energiewende books this is marked as coal power exports, but the evidence is clear. Without a storage solution Germany exports large amounts of RE generated into Europe.
Often so much energy is generated that prices are driven negative, to save the grid from damage, recipients are paid to take unwanted energy, driving up costs for Germany

??
1 2 3 4 5 6 7 8
72%
56%
43%34%
28%24% 20% 17%
Energy From Storage
Currently 72% of German electricity demand is met by conventional sources, primarily coal and nuclear power. For the purposes of this analysis this should be thought of as “flexible backup”.
Each of these bars show how demand is met from this “flexible backup”. As more RE capacity is added to the system, so the reliance on flexible backup decreases and the energy available to be “stored” increases.
RE MultiplyingFactor
7

??
4 5 6 7 8 9 10 11 12 13 14 15 16 17 18 19 20 21 22 23 24 1 2 3-50000
0
50000
100000
150000
200000
250000
ddJune 2nd 2013
But Increasing RE output using factors of 1-8 has a price. The above shows the amount of excess energy generated on a summers day, currently this excess energy is exported into the EU.
But how much can the European market soak up? Already it is common place for prices to be driven negative, whereby German suppliers pay for the power to be taken off their hands.
German demand on 2nd June 2013 peaked at 43 GW, even using a factor of 3 x RE, the excess would be greater than 50GW. Is it realistic that there will be a market for so much power or is storage an absolute necessity?
MW
Hour

??
30/12/1899
02/03/1903
02/05/1906
02/07/1909
02/09/1912
02/11/1915
02/01/1919
02/03/1922
02/05/1925
02/07/1928
02/09/1931
02/11/1934
02/01/1938
02/03/1941
02/05/1944
02/07/1947
02/09/1950
02/11/1953
02/01/1957
02/03/1960
02/05/1963
02/07/1966
02/09/1969
02/11/1972
02/01/1976
02/03/1979
02/05/1982
02/07/1985
02/09/1988
02/11/1991
02/01/1995
02/03/1998
02/05/2001
02/07/2004
02/09/2007
02/11/2010-800.0
-700.0
-600.0
-500.0
-400.0
-300.0
-200.0
-100.0
0.0Shortfall From Storage
PV & Wind X8
PV & Wind X7
PV & Wind X6
PV & Wind X5
PV & Wind X4
PV & Wind X3
PV & Wind X2
PV & Wind X1
TWh
As the Energiewende rollout adds more RE so the returns will diminish, this can be clearly seen in this chart of contracting lines, representing energy taken from “storage” over time.
The takeaway here is that we get more bang per buck in the earlier stages of an RE rollout.
9

??
30/12/1899
02/07/1903
02/01/1907
02/07/1910
02/01/1914
02/07/1917
02/01/1921
02/07/1924
02/01/1928
02/07/1931
02/01/1935
02/07/1938
02/01/1942
02/07/1945
02/01/1949
02/07/1952
02/01/1956
02/07/1959
02/01/1963
02/07/1966
02/01/1970
02/07/1973
02/01/1977
02/07/1980
02/01/1984
02/07/1987
02/01/1991
02/07/1994
02/01/1998
02/07/2001
02/01/2005
02/07/2008
02/01/2012
0
100
200
300
400
500
600
Excess to storagePV & Wind X8
PV & Wind X7
PV & Wind X6
PV & Wind X5
PV & Wind X4
PV & Wind X3
PV & Wind X2
PV & Wind X1
At factors of 2 and above the peaks in supply start to satisfy demand (but only at the peaks). Anything over and above the immediate power requirement must either be stored, exported or discarded
As more RE is added to the system there is a greater amount of excess available for storage, this increase is relatively linear.
TWh
10

??
With a factor of RE x 8, we get spikes of power up to 200GW, meaning the German grid would have to cope with 270 GW of power. Economically, a more realistic scenario would be to cap the power at 200GW and discard anything over and above this level.
But this will require major upgrades to the grid or sufficient storage locally to the source such as P2G.
MW
-100000
-50000
0
50000
100000
150000
200000
250000
X8 To / From Storage
11

??
Power to Gas (P2G) uses electrolysis to split water into hydrogen and oxygen, then combines the hydrogen with carbon to produce methane. When power is required the methane is used to generate electricity via CHP.
But typically this process achieves only 30% efficiency, meaning for every 1,000MWh in we can expect 300MWh out.
http://www.edgar-program.com/news/gas-to-power-on-the-go

??Combined Heat & power (CHP)
While there is no doubt that CHP offers much greater efficiency, if the fuel it needs cannot be efficiently synthesised, this will not be a practicable low CO2 solution. In effect the synthesised methane fuel would have to be substituted with natural gas.
13

??
At pumped hydroelectric storage(PHS) power stations, water is pumped back into the reservoir when there is excess power. At night when there is no sun or wind power, the water can be allowed to flow back down to produce electricity just like a normal hydroelectric power station.
Unlike fossil fuelled based “flexible backup” such a system does not need to be “spinning”, it can be turned on very quickly when it is required to meet demand. PHS typically achieves 75% efficiency. But there are limited locations where they can be installed
(High RE output)

??
-50.0
0.0
50.0
100.0
150.0
200.0
250.0
Storage Performance Varying efficiency (Wind & PV X8) 70%
60%
50%
40%
30%
So the efficiency of any storage solution and the ability to locate it are major issues. There is plenty of excess power generated using a factor of RE x 8, but this is eaten up if a low efficiency storage solution is used. Power to gas(P2G) is the solution of choice, often voiced by Energiewende proponents, but it is only 30% efficient. As can be seen in the chart, (30% efficiency line) during the winter months any stored methane would soon be exhausted.
TWh
15
??
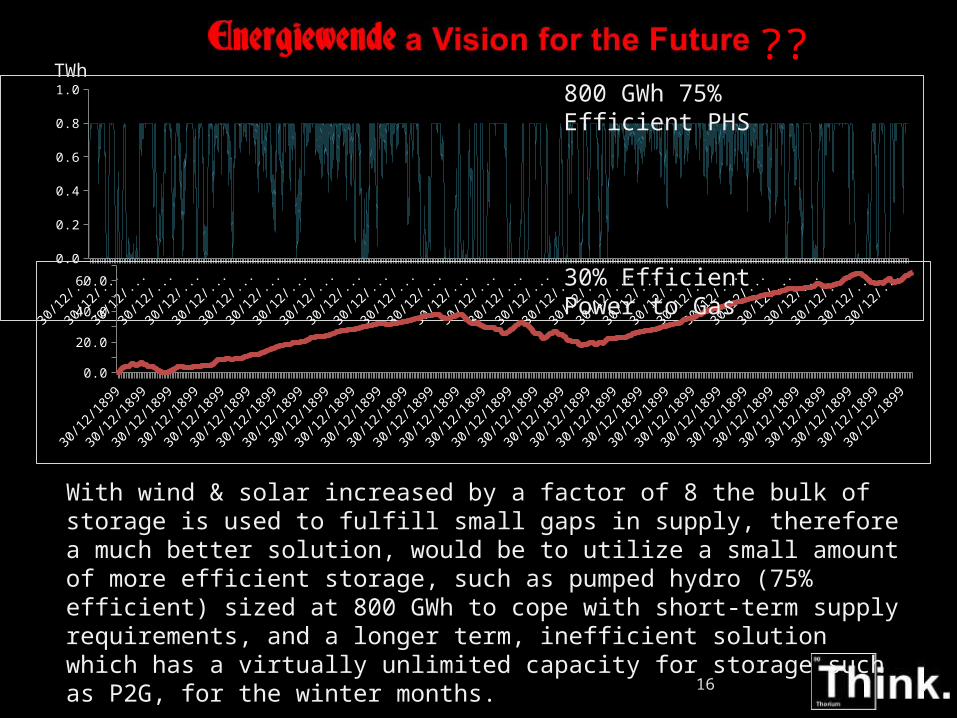
With wind & solar increased by a factor of 8 the bulk of storage is used to fulfill small gaps in supply, therefore a much better solution, would be to utilize a small amount of more efficient storage, such as pumped hydro (75% efficient) sized at 800 GWh to cope with short-term supply requirements, and a longer term, inefficient solution which has a virtually unlimited capacity for storage such as P2G, for the winter months.
TWh
16
0.00.10.20.30.40.50.60.70.80.91.0
30/12/1899
02/09/1902
02/05/1905
02/01/1908
02/09/1910
02/05/1913
02/01/1916
02/09/1918
02/05/1921
02/01/1924
02/09/1926
02/05/1929
02/01/1932
02/09/1934
02/05/1937
02/01/1940
02/09/1942
02/05/1945
02/01/1948
02/09/1950
02/05/1953
02/01/1956
02/09/1958
02/05/1961
02/01/1964
02/09/1966
02/05/1969
02/01/1972
02/09/1974
02/05/1977
02/01/1980
02/09/1982
02/05/1985
02/01/1988
02/09/1990
02/05/1993
02/01/1996
02/09/1998
02/05/2001
02/01/2004
02/09/2006
02/05/2009
02/01/20120.0
10.020.030.040.050.060.070.0
800 GWh 75% Efficient PHS
30% Efficient Power to Gas

??No conclusions will be drawn from this analysis that is up to the viewer.
However there are some questions that we should all be asking.
1. How much will it cost to increase the current RE by a factor of 8? 2. How much will it cost to upgrade the grid to cope with 4X or more the current
power rating (Systems LCOE studies indicate that generation costs could more than double even for onl;y a 2-3x factor)?
3. With such a massive infrastructure and limited lifespan for each component, how much will it cost to maintain the system?
4. If PHS is chosen as a storage solution will Germany’s topography be able to meet this requirement (in other words are there sufficient locations)?
5. If batteries are chosen as the storage solution how much will this cost and is this even possible (All of the batteries in the world can meet world electricity demand for 10 minutes. Are there enough resources available to manufacture batteries capable of backing up the German grid?)
6. The current plan is to use Combined Heat and Power(CHP) to cut CO2 emissions from heating, using gas synthesised using P2G, is this realistic?
7. Could the 30% efficiency of P2G be improved?8. Can the P2G process cope with the huge spikes in power, or will it need a
constant supply?9. Assuming P2G can cope with the spikes, it will mean a process working part time,
how does this impact on the costs? 17