Enel Finance International N.V. Interim condensed ... · 4 Directors’s report Enel Finance...
34
Interim Condensed Financial Statements of Enel Finance International N.V. at 30 June 2017
Transcript of Enel Finance International N.V. Interim condensed ... · 4 Directors’s report Enel Finance...

Interim Condensed Financial Statements of Enel Finance International N.V. at 30 June 2017

2
Contents
Director’s report 1
General information 4
Significant events in the firt half of 2017 4
Overview of the Company’s performance and financial position 5
Main Risks and uncertainties 7
Related Parties 7
Outlook 7
Board of Directors composition 7
Subsequent events 7
Personnel 7
Statement of the Board of Directors 7
Financial statements for the firt half of 2017
Statement of comprehensive income 10
Statement of financial position 11
Statement of changes in equity 12
Statement of cash flows 13
Notes to the financial statements 14
Other information 34

Director’s report
Interim Director’s Report

4
Directors’s report Enel Finance International NV
General information
The Management of the Company hereby presents its interim condensed financial statements for the
period ended on 30 June 2017.
Enel Finance International N.V. (“the Company”) is a public company with limited liability, where 100%
of the shares are held by Enel S.p.A., the ultimate parent company, having its seat in Rome, Italy.
The Company operates as a financing company for the Enel Group, raising funds through bond
issuances, loans and other facilities and on turn lending the funds so raised to the companies belonging
to the Enel Group.
Significant events in the 1st half of 2017
Green bond
On January 2017 the Company successfully placed on the European market its first green bond for
institutional investors, backed by a guarantee issued by Enel S.p.A. The issue totals 1,250 million
euros and provides for repayment in single instalment at maturity on 16 September 2024, as well as
the payment of a fixed-rate coupon of 1%, payable annually in arrears in the month of September, as
from September 2017. The issue price was set at 99.001% and the effective yield to maturity is equal
to 1.137%. The green bond is listed on regulated markets of the Irish and Luxembourg Stock
Exchanges and Borsa Italiana.
The net proceeds raised in the issue – carried out under the medium-term note program (EMTN) –
will be used to finance the Enel Group’s eligible green projects identified and/or to be identified with
the Green Bond Principles 2016 published by the International Capital Market Assosiation (ICMA).
Swiss franc-denominated bond
On 3 March 2017 the Company placed swiss franc-denominated bond with maturity 7.5 years. The
issue totaled 225 million.
US dollar-denominated bonds
On 23 May 2017 the Company launched a multi-tranche bond issue offered on the US and international
markets for institutional investors for a total of 5 billion US dollars
The transaction is structured in the following tranches:
- 2,000 million USD at a fixed rate of 2.875% maturing in 2022;
- 2,000 million USD at a fixed rate of 3.625% maturing in 2027; and
- 1,000 million USD at a fixed rate of 4.750% maturing in 2047.
BEG litigation
Please refer to the Annual report 2016 of the Company for the description of BEG case.

5
Directors’s report Enel Finance International NV
Overview of the Company’s performance and financial position
Analysis of the Company financial position
Millions of euro
at Jun. 30,
2017
at Dec. 31,
2016 Change
Net non-current assets:
-other non-current financial assets 541 760 (219)
-other non-current financial liabilities (729) (702) (27)
Total net non-current assets (188) 58 (246)
Net current assets:
-net tax receivable/ (payable) (28) - (28)
-other current financial assets 469 547 (78)
-other current activities - 212 (212)
-other current financial liabilities (508) (391) (117)
-other current liabilities (4) (2) (2)
Total net current assets (71) 366 (437)
Gross capital employed (259) 424 (683)
Sundry provisions:
-deferred tax assets/ (liabilities) 238 293 (55)
Total provisions 238 293
Net Capital Employed (21) 718 (739)
Total Shareholders' Equity 2,178 2,006 172
Net financial debt (2,199) (1,288) (911)
The net non-current assets/(liabilities), at 30 June 2017, decreased by Euro 246 million compared to
31 December 2016. The variation refers essentially to the decrease of non-current derivative assets
(Euro 213 million), to the increase of non-current derivative liability (Euro 26 million) and depreciation
of financial prepaid expenses (Euro 5 million).
Net current assets/(liabilities) came to a negative Euro 71 million with a decrease of Euro 437 million
compared to 31 December 2016. The variation is mainly due to decrease of receivables of Enel Green
Power S.p.A. (Euro 204 million) and receivebles of Enel Investment Holding B.V. (Eur 8 million), the
increase of interest payables (Euro 109 million) and increase of Euro 77 million fair value current
derivatives (Euro 69 million decrease of assets and Euro 8 million increase of liabilities) and increase
of payables for income tax (Euro 28 million), decrease of interest receivables (Euro 3 million) and
decrease of other financial assets (Euro 6 million) and increase of other current liabilities (Euro 3
million)
Deferred taxes totaled Euro 238 million decreased by Euro 55 million and followed movement of cash
flow hedge transaction accrued directly in other comprehensive income.
Net capital employed amounted negative 21 million at 30 June 2017, down Euro 739 million compared
to to 31 December 2016. The variation is due to the decrease of the Net Financial Debt (Euro 911
million) partly offset by increase of shareholders’ equity (Euro 172 million).
The debt-to-equity ratio at 30 June 2017 came to a negative 101% (negative 64% at 31 December
2016).

6
Directors’s report Enel Finance International NV
Net financial debt
Millions of euro
at Jun 30,
2017 at Dec. 31,
2016 Change
Long-term debt:
- bonds 20,908 16,099 4,809
Long-term debt 20,908 16,099 4,809
- loans to Group companies (19,777) (19,152) (625)
Long term financial receivables (19,777) (19,152) (625)
Net long-term financial debt 1,131 (3,053) 4,184
Short-term debt/(liquidity):
- bonds (short-term portion) 2,552 2,058 494
- l/t receivables due from Group companies (short-term portion) (773) (777) 4
Current amount of long-termt net financial debt 1,779 1,281 498
- commercial paper 430 2,127 (1,697)
- short-term loans from Group companies 4,386 5,070 (684)
- cash collateral on derivatives and other financing 8 0 8
Short-term loans 4,816 7,197 (2,381)
- short-term financial receivables due from Group companies (5,453) (4,519) (934)
- other sundry receivables (55) 0 (55)
- cash collateral (2) (6) 4
- financial Service Agreement with Enel S.p.A. (4,410) (2,096) (2,314)
- cash and cash equivalents (5) (92) 87
Cash and cash equivalents and short-term financial receivables (9,925) (6,713) (3,212)
Net short-term financial debt (3,330) 1,765 (5,095)
NET FINANCIAL DEBT (2,199) (1,288) (911)
Net financial debt amounting to negative Euro 2,199 million at 30 June 2017 showed a decrease
(Euro 911 million) compared with the year end 2016.
Net long-term financial debt stood at Euro 1,131 million, increased by Euro 4,184 million principally
as a result of issuing new bonds (Euro 5,924 million) and early repayment of loans by Enel Iberia S.A.
(Euro 668 million), reclassification of current portion to short-term assets (Eur 70 million) which partly
offset by new loan granted to Enel Green Power S.p.A (Eur 1,362 million) and positive foreign
exchange effect (Euro 586 million) on the outstanding bonds denominated in non-Euro currencies and
reclassification of current portion of bonds (Euro 494 million) and amortised costs loan-term bonds
totaled Euro 36 million.
Net short-term financial debt decreased by Euro 5,095 million to Euro negative 3,330 million with
the change principally referring to repayment of commercial papaers issued in euro (Euro 1,697
million), decrease of short-term loans from Group Companies (Euro 684 million) and increase of short-
term financing granted to Group Companies (Euro 934 million) and Enel SpA (Euro 2,314 million).
This effect was partly compensated by decrease of cash and cash equivalents (Euro 87 million) and
reclassification of current portion of bonds (Euro 494 million).

7
Directors’s report Enel Finance International NV
Main Risks and uncertainties
Significant risks, risk appetite which could have a material effect on financial position and results as
well as risk mitigation strategy have been described in the annual financial statements for 2016. Those
categories and risks remain valid and should be read in conjunction with this interim report.
Related Parties
The main activity of Enel Finance International N.V. is to operate as financing company of the Enel
Group, raising funds through bonds issuance, loans and other facilities and on turn lending the funds
so raised to the companies belonging to Enel Group; all the transactions are part of the ordinary
operations of the Company and are settled on the basis of Standard intra-Group contract market
prices.
Outlook
During the second half of 2017, the Company will continue to implement the liability management
strategy to optimize funding and lending portfolios, keeping on supporting Enel Group in its developing
and consolidation process.
Board of Directors composition
Taking into account the new legislation that entered into force in the Netherlands on 1 January 2013
and concerning the composition of the companies' Board of Directors, we highlight that the Board
members of the Company are currently all men. Nonetheless, the Company believes that the
composition of its Board of directors has a broad diversity of experience, expertise and backgrounds,
and that the backgrounds and qualifications of the directors, considered as a group, provide a
significant mix of experience, knowledge, abilities and independence that we believe will allow our
board of directors to fulfill its responsibilities and properly execute its duties.
Subsequent events
In accordance with the Liability Management Program the Company has decided to redeem the
USD 1,750 5,125% Notes due 2019 prior to maturity.
The notes carry a make whole call provision. The call price will be calculated based on present value
of principal payments and interests discounted at US treasury rate plus 30bps.
Relevant counterparties were notified about the transaction on 12 July 2017. The debt will be settled
on 2 August 2017
Personnel
At 30 June 2017 the Company employs ten people.
Statement of the Board of Directors
Statement ex Article 5:25c Paragraph 2 sub c Financial Markets Supervision Act (“Wet op net
Financieel Toezicht”).

8
Directors’s report Enel Finance International NV
To our knowledge,
the interim condensed financial statements give a true and fair view of the assets, liabilities, financial
position and result of Enel Finance International N.V.;
the Director’s Report gives a true and fair view of the Company’s position as per 30 June 2017 and
the developments during the financial period ended 30 June 2017;
the Director’s Report describes the principal risks the Company is facing.
These interim condensed financial statements are prepared according to International Financial
Reporting Standards as adopted by the European Union (“IFRS-EU”) and it is externally not audited.
Furthermore this interim report complies with the EU Transparency Directive enacted in the
Netherlands in 2008 and subsequently came into force as from 1 January 2009. The Company’s main
obligations under the aforementioned Transparency Directive can be summarized as follows:
filing its approved interim condensed financial statements electronically with the AFM (Autoriteit
Financiele Markten) in the Netherlands within five days after their approval;
making its interim condensed financial report generally available to the public by posting it on Enel
S.p.A. official website within 2 months after the end of first sixth months of the 2017 fiscal year (by
31 August 2017);
making its interim condensed financial report generally available to the public by issuing an
information notice on a financial newspaper or on a financial system at European level within 2 months
after the end of first sixth months of the 2017 fiscal year (by 31 August 2017).
Amsterdam, 26 July 2017
A.J.M. Nieuwenhuizen
H. Marseille
E. Di Giacomo
A. Canta

Financial statements for the year ended 30 June 2017
Interim Condensed Financial statements
for the period ended 30 June 2017 prepared in accordance with International Financial Reporting Standards as adopted by the European Union

10
Financial Statements Enel Finance International NV
Statement of comprehensive income Millions of euro Note 1st half
2017 2016
Costs
Services 1 (1) (1)
Personnel 1 - (1)
(Subtotal) (1) (2)
Operating income (1) (2)
Financial income
Financial income other that from derivatives 2 1,154 956
Financial income from derivatives 3 392 107
(Subtotal) 1,546 1,063
Financial expense
Financial expense other that from derivatives 2 (733) (531)
Financial expense from derivative 3 (789) (512)
(Subtotal) (1,522) (1,043)
Net financial income/ (expense) 24 20
Income/(Loss) before taxes 23 18
Income Taxes 4 15 4
Net income for the year 8 14
Other components of comprehensive income recyclable to profit or loss in future periods:
- Effective portion of change in the fair value of cash flow hedges net of deferred taxes
12 164 (555)
Total comprehensive income/(loss) for the period (attributable to the shareholder of the Company)
172 (541)

11
Financial Statements Enel Finance International NV
Statement of financial position Millions of Euro Note
ASSETS at Jun. 30,
2017 at Dec. 31,
2016
Non-current assets
Deferred tax assets 5 238 293
Long-term loans and financial receivables 6 19,776 19,152
Derivatives 7 515 729
Other non-current financial assets 8 26 31
(Subtotal) 20,555 20,205
Current assets
Current portion of long-term loans and financial receivables 6 773 777
Short-term loans and financial receivables 9 9,862 6,617
Derivatives 7 287 357
Other current financial assets 10 238 189
Other current assets 11 3 220
Cash and cash equivalents 12 5 92
(Subtotal) 11,168 8,252
TOTAL ASSETS 31,723 28,457
LIABILITIES AND SHAREHOLDER’S EQUITY
Share capital 13 1,479 1,479
Share premium reserve 13 1,026 1,026
Cash flow hedge reserve 13 (713) (877)
Retained earnings 13 378 334
Net income for the period 13 8 44
Total shareholder's equity 2,178 2,006
Non-current liabilities
Long-term loans and borrowings 14 20,908 16,099
Derivatives 7 729 702
(Subtotal) 21,637 16,801
Current liabilities
Current portion of long-term loans 14 2,552 2,058
Short-term loans and borrowings 15 4,816 7,197
Derivatives 7 24 17
Income tax payables 16 28 -
Other current financial liabilities 17 483 375
Other current liabilities 5 3
(Subtotal) 7,908 9,650
TOTAL EQUITY AND LIABILITIES 31,723 28,457

Enel Finance International N.V.
12
Financial Statements Enel Finance International NV
Statement of changes in equity Millions of euro
Share capital
Share premium
reserve
Cash flow hedge
reserve Retained earnings
Net income for the period
Equity attributable
to the shareholders
At 1 January 2016 1,479 43 (368) 302 31 1,487
Allocation of net income from the previous year - - - 31 (31) -
Comprehensive income for the year: - - (555) - (541)
of which:
- other comprehensive income (loss) for the period - - (555) - - (555)
- net income for period - - - 14 14
At 30 June 2016 1,479 43 (923) 333 946
At 1 January 2017 1,479 1,026 (877) 333 45 2,006
Allocation of net income from the previous year - - - 45 (45) -
Comprehensive income for the year: - - 164 - 164
of which:
- other comprehensive income (loss) for the period - - 164 - 164
- net income for period - - - - 8 8
At 30 June 2017 1,479 1,026 (713) 378 8 2,178
Enel Finance International N.V.
13
Financial Statements Enel Finance International NV
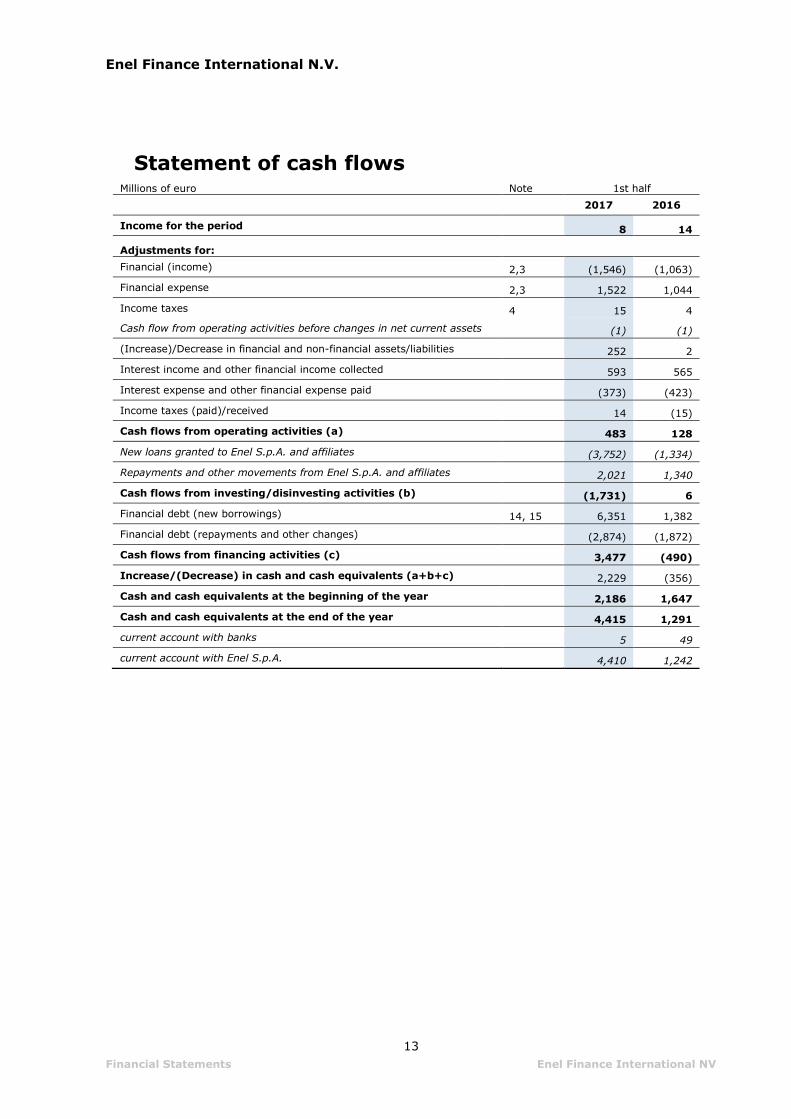
Statement of cash flows Millions of euro Note 1st half
2017 2016
Income for the period 8 14
Adjustments for:
Financial (income) 2,3 (1,546) (1,063)
Financial expense 2,3 1,522 1,044
Income taxes 4 15 4
Cash flow from operating activities before changes in net current assets (1) (1)
(Increase)/Decrease in financial and non-financial assets/liabilities 252 2
Interest income and other financial income collected 593 565
Interest expense and other financial expense paid (373) (423)
Income taxes (paid)/received 14 (15)
Cash flows from operating activities (a) 483 128
New loans granted to Enel S.p.A. and affiliates (3,752) (1,334)
Repayments and other movements from Enel S.p.A. and affiliates 2,021 1,340
Cash flows from investing/disinvesting activities (b) (1,731) 6
Financial debt (new borrowings) 14, 15 6,351 1,382
Financial debt (repayments and other changes) (2,874) (1,872)
Cash flows from financing activities (c) 3,477 (490)
Increase/(Decrease) in cash and cash equivalents (a+b+c) 2,229 (356)
Cash and cash equivalents at the beginning of the year 2,186 1,647
Cash and cash equivalents at the end of the year 4,415 1,291
current account with banks 5 49
current account with Enel S.p.A. 4,410 1,242

14
Financial Statements Enel Finance International NV
Notes to the financial statements
Form and content of the financial statement
Enel Finance International N.V. (“the Company”) was as a limited liability company under the laws of
the Netherlands on 26 September 2008. The Company is registered with the trade register of the
Dutch chamber of commerce under number 34313428 with business address at Herengracht 471,
1017 BS Amsterdam, the Netherlands. The Company is established for an indefinite duration.
The Company is a public company with limited liability, where 100% of the shares are held by Enel
S.p.A., the ultimate parent company, having its seat in Rome, Italy.
Company’s financial statements are included into the consolidated financial statements of Enel Group,
which can be obtained from the investor relations section of Enel official website
(http://www.enel.com).
Corporate purpose
The Company operates as a financing company for the Group, raising funds through bond issuances,
loans and other facilities and on turn lending the funds so raised to the companies belonging to the
Enel Group. The Company is also part of the centralising financial process and acts as the primary
reference for the management of financial needs or liquidity generated by the Enel Group companies.
The Company acts solely as a financing company for Enel Group and therefore is not engaged in
market competition in the energy sector with third parties.
The Company is managed by a management board composed of five members, appointed by the
general meeting of shareholders, which may dismiss them at any time. The management board has
the power to perform all acts of administration and disposition in compliance with the corporate objects
of the Company.
The joint signatures of any two members of the management board or the single signature of any
person to whom such signatory shall have been appointed by the management board may bind the
Company.
Compliance with IFRS/IAS
The interim condensed financial statements for the six months ended at 30 June 2017 have been
prepared in compliance with the international financial reporting standards (IFRS) issued by the
International Accounting Standards Board (IASB) recognized in the European Community pursuant to
Regulation (EC) no. 1606/2002 and in effect as of the close of the period, as well as theinterpretations
of the International Financial Reporting Interpretations Committee (IFRIC) and the Standing
Interpretations Committee (SIC) in effect at the same date. All of these standards and
interpretations are hereinafter referred to as “IFRS-EU”.
More specifically, the interim condensed financial statements have been drawn-up in compliance with
IAS 34 – Interim financial reporting and consist of the statement of comprehensive income, the
statement of financial position, the statement of changes in equity, the statement of cash flows and
the related notes.
Please note that the Company adopts the half-year as the reference interim period for the purposes
of applying IAS 34 and the definition of interim financial report specified therein.

15
Financial Statements Enel Finance International NV
The accounting standards adopted, the recognition and measurement criteria and methods used for
the condensed interim financial statements at 30 June 2017 are the same as those adopted for the
financial statements at 31 December 2016 (please see the related report for more information).
These condensed interim financial statements may therefore not include all the information required
to be reported in the annual financial statements and must be read together with the financial
statements for the year ended 31 December 2016. No impairment evaluation has been performed in
this half year financial statement.
Basis of presentation
The financial statements consist of the statement of comprehensive income, the statement of financial
position, the statement of changes in equity, the statement of cash flows, and the related notes.
The financial statements have been prepared on the historical costs basis except for the following
material items:
Derivative financial instruments, valued at fair value;
Loans and receivable and financial liabilities recognized at amortized cost.
The assets and liabilities reported in the financial position are classified on a “current/non-current
basis”. Current assets, which include cash and cash equivalents, are assets that are intended to be
used during the normal operating cycle of the Company or in the twelve months following the balance-
sheet date; current liabilities are liabilities that are expected to be settled during the normal operating
cycle of the Company or within the twelve months following the close of the financial year.
The income statement is classified on the basis of the nature of expenses, while the indirect method
is used for the cash flow statement.
The Group initially recognizes loans and receivables and deposits on the date that they are originated.
All other financial assets (including assets designated at fair value through profit or loss) are
recognized initially on the trade date at which the Group becomes a party to the contractual provisions
of the instrument.
The Group derecognizes a financial asset when the contractual rights to the cash flows from the asset
expire, or it transfers the rights to receive the contractual cash flows on the financial asset in a
transaction in which substantially all the risks and rewards of ownership of the financial asset are
transferred. Any interest in transferred financial assets that is created or retained by the Group is
recognized as a separate asset or liability.
Financial assets and liabilities are offset and the net amount presented in the statement of financial
position when, and only when, the Group has a legal right to offset the amounts and intends either to
settle on a net basis or to realize the asset and settle the liability simultaneously.
Functional and presentation currency
The financial statements are presented in euro, the functional currency of Enel Finance International
N.V.. All figures are shown in millions of euro unless stated otherwise.
The accounting policies set out below have been applied consistently to all periods presented in these
financial statements.

16
Financial Statements Enel Finance International NV
Going Concern
Enel S.p.A. has provided financial support to the Company should it not be able to meet its obligations.
This intent has been formally confirmed by Enel S.p.A. in a support letter issued on 14 February 2017
and valid until next year’s approval date of the Financial Statements should the company remain under
control of the Enel Group. Based upon this comfort letter received by the parent company, Company’s
management has prepared the financial statements on the basis of a positive going concern
assumption.
Solvency
Given the objectives of the company, the Company is strictly economically interrelated with Enel
S.p.A.. In assessing the solvency as well as the general risk profile of the Company, the solvency of
the Enel Group as a whole, headed by Enel S.p.A. should be considered.
Risk management
Market risk
Enel Finance International N.V., acting as a financial intermediary, provides the necessary resources
to foreign operating Entities of the Group; the funding activity comprises direct access to the
international capital markets. Therefore, Enel Finance International N.V. is exposed to interest rate
and exchange rates risks, due to its net financial position.
In order to hedge these exposures, the Company employs financial derivative instruments such as
interest rate swaps, currency forwards and cross currency interest rate swaps, that are negotiated
both with Enel S.p.A. and on the market.
The fair value of a financial derivative is the price that would be received to sell an asset or paid to
transfer a liability in an orderly transaction between market participants in the market in which the
reporting entity transacts.
The fair value of listed instruments is the market price at 30 June 2017. The fair value of over the
counter (OTC) instruments is calculated with standard pricing models for each instrument typology.
The expected future cash flows are discounted with market interest rate curves, while foreign currency
amounts are converted to Euro using the official European Central Bank exchange rates at 30 June
2017.
Moreover, according to the International Accounting Standards, the Company measures the credit risk
both of the counterparty (Credit Valuation Adjustment or CVA) and of its non-performance credit risk
(Debit Valuation Adjustment or DVA), in order to make the adjustment of the fair value of derivative
financial instruments for the corresponding value of counterparty risk.
In particular, the Company measures the CVA/DVA based on the net exposure taking into account any
existing arrangements that mitigate credit risk exposure in the event of default and, subsequently,
allocating the adjustment on each financial instrument that constitutes the portfolio. In order to
measure the CVA / DVA, the company uses a valuation technique based on the Potential Future
Exposure, whose inputs are observable on the market.
The notional amount of a financial derivative is the nominal on which payments are calculated. Foreign
currency amounts are converted to Euro at official European Central Bank exchange rates at 30 June
2017.
The transactions compliant with IAS 39 requirements can be designated as cash flow hedge, otherwise
are classified as trading.

17
Financial Statements Enel Finance International NV
Interest rate risk
Interest rate risk is the risk borne by an interest-bearing financial instrument due to variability of
interest rates. The optimal debt structure results from the trade-off between reducing the interest rate
exposure and minimizing the average cost of debt.
The Company is exposed to interest rate fluctuation both on liabilities and on assets.
Interest rate swaps are stipulated to mitigate the exposure to interest rates fluctuation, thus reducing
the volatility of economic results. Through an interest rate swap, the Company agrees with a
counterparty to exchange, with a specified periodicity, floating rate interest flows versus fixed rate
interest flows, both calculated on a reference notional amount. In order to ensure effectiveness, all
the contracts have notional amount, periodicity and expiry date matching the underlying financial
liability and its expected future cash flows.
Interest rate risk sensitivity analysis
The Company performs sensitivity analysis by estimating the effects of changes in the level of interest
rates on financial instruments portfolio. In particular sensitivity analysis measures the potential impact
of market scenarios both on equity, for the hedging component of derivatives in cash flow hedge, and
on income statement for all derivatives that do not qualify for hedge accounting and the portion of net
long term floating-rate debt not covered by derivatives.
These scenarios are represented by parallel translation, measured in basis points (bps) in the interest
rate yield curve at the reporting date. All other variables held constant, the Company’s income and
equity before tax is impacted as follows:
Thousands of euro
Interest rate risk sensitivity analysis
at Jun. 30, 2017
Pre-tax impact on income Pre-tax impact on
equity
Interest
Rates scenario
increase decrease
increase decrease
Change in interest expense related to long term gross floating-rate debt after hedging
25 bp 125 (125) - -
Change in Fair value of Derivative financial instruments not qualifying for hedge accounting
25 bp 33 (33) - -
Change in Fair value of Derivative Financial instruments designated as hedging instruments
25 bp - - 124,083 (124,083)
Exchange rate risk
Exchange rate risk is a type of risk that arises from the change in price of one currency against
another. Enel Finance International N.V. exposure to such risk is mainly due to foreign currencies
denominated flows, originated by financial assets and liabilities.
In order to mitigate this risk, the Company enters into plain vanilla transactions such as currency
forwards and cross currency interest rate swaps. In order to ensure effectiveness, all the contracts
have notional amount and expiry date matching the underlying expected future cash flows.
Cross currency interest rate swaps are used to transform a long-term fixed – or floating – rate liability
in foreign currency into an equivalent fixed – or floating – rate liability in euro, while currency forwards
are used to hedge commercial papers and intercompany loans.
Foreign exchange risk sensitivity analysis
The Company performs sensitivity analysis by estimating the effects on financial instruments portfolio
of changes in the level of exchange rates. In particular sensitivity analysis measures the potential

18
Financial Statements Enel Finance International NV
impact of market scenarios both on equity, for the hedging component of cash flow hedges derivatives,
and on income statement for those derivatives that do not qualify for hedge accounting and the portion
of gross long-term foreign denominated debt not covered by derivatives.
These scenarios are represented by the 10% Euro appreciation/depreciation towards all foreign
currencies in comparison with end of year level. All other variables held constant, the Company’s
income and equity before tax is impacted as follows:
Thousands of euro
Foreign exchange risk sensitivity analysis
at Jun.30, 2017
Pre-tax impact on income
Pre-tax impact on equity
Exchange
Rate scenario
Euro Appr.
Euro Depr.
Euro Appr.
Euro Depr.
Change in interest expense related to long term foreign denominated gross debt after hedging
10% - - - -
Change in Fair value of Derivative financial instruments not qualifying for hedge accounting
10% 195,061 (238,219) - -
Change in Fair value of Derivative Financial instruments designated as hedging instruments
10% - - (1,570,392) 1,919,437
Credit risk
Credit Risk is the risk that the Company will suffer losses when a counterparty defaults in meeting its
obligations on a trade or transaction of any kind when it is supposed to.
Credit risk from intercompany loans and other financial receivable is managed by the Company. Enel
Finance International N.V. is part of the centralising financial flow process and acts as the primary
reference for the management of financial needs or liquidity generated by Enel Group entities. The
Company manages its lending operations to minimise the concentration of risks and therefore mitigate
financial loss through a counterparty’s potential failure to make payments. The Group’s maximum
exposure to credit risk for the components of the statement of financial position at 30 June 2017 are
the carrying amounts.
Liquidity risk
Liquidity Risk is the risk that the Company will become unable to settle obligations with immediacy,
or will be able to meet them only at uneconomic conditions. In order to mitigate this risk Enel Finance
International N.V. meets liquidity requirements primarily through cash flows generated by ordinary
operations and drawing on a range of financing sources while managing any liquidity excess as
appropriate. The Company has an access to committed credit line with Mediobanca (Euro 4,720
million). The outstanding commercial paper programs with a maximum ceiling on 6,000 million, of
which only Euro 430 million drawn at 30 June 2017.
Furthermore Enel S.p.A. has confirmed through a letter dated 14 February 2017 its commitment to
explicitly provide the Company with the financial support until the date of approval of full year 2017
financial statements of the Company.

19
Financial Statements Enel Finance International NV
Notes to the financial statements
1 Result from operating activities – Euro (1) million
Result from operating activities is negative for Euro 1 million decreased by Euro 1 million comparing
to the same period of previous year.
2 Financial income/(expense) other than from derivatives – Euro 421 million
Millions of euro
1st half
2017 2016 Change
Financial income:
Interest income
- interest income on long-term financial assets 496 492 4
- interest income on short-term financial assets 49 34 15
Total interest income 545 526 19
Positive exchange rate differences 609 430 179
Total finance income other than from derivatives 1,154 956 198
Financial expense:
Interest expense
- interest expense on borrowings (39) (45) 6
- interest expense on bonds (482) (473) (9)
- interest expense on commercial papers 1 (1) 2
Total interest expense (520) (519) (1)
Negative exchange rate differences (213) (12) (201)
Total financial expense other than from derivatives (733) (531) (198)
Net financial income/ (expense) other than from derivatives 421 425 (4)
Interest income from financial assets increased to Euro 545 million, up Euro 19 million on
30 June 2017 with the variation mainly due to increase of interest income resulted of increase of
average loans and short-term revolving lines granted to Group companies. In first half of 2017 interest
income received from several counterparties was grossed-up by withholding tax (Euro 8 million).
Interests charges on financial debt totaled Euro 520 million having an increase of Euro 1 million maily
due to increase of interest accrued on bonds issued in 2017 (Euro 24 million) and increase of interest
paid to Group companies (Euro 1 million) partly offset by decrease of interests (Euro 22 million)
attributed to a bond repaid in September 2016 and decrease of interest charges paid for commercial
paper (Euro 2 million).
The net foreign exchange gain amount to Euro 396 million and they are mainly due to apreciation of
the bonds denominated in foreign currencies (Euro 586 million) and net exchange gains devoted to
revolving facility agreement and short term deposit agreement (Euro 190 million).
The amount of the foreign exchange gain arisen from bond revaluation was entirely covered with the
reversal of the Cash Flow Hedge equity reserve resulting in a financial loss.

20
Financial Statements Enel Finance International NV
3. Financial income/(expense) from derivatives –Euro (397) million
Millions of euro
1st half
2017 2016 Change
Financial income from derivatives:
- income from cash flow hedge derivatives 48 33 15
- income from derivatives at fair value through profit or loss 344 74 270
Total finance income from derivatives 392 107 285
Financial expense from derivatives:
- expense from cash flow hedge derivatives (598) (418) (180)
- expense from derivatives at fair value through profit or loss (191) (94) (97)
Total financial expense from derivatives (789) (512) (277)
Netl income/(expense) from derivatives (397) (405) 8
Net expenses from cash flow hedge derivatives totaled to Euro 550 million increased by
Euro 165 million comparing with the previous period mainly due to increase of financial loss transfer
to equity (Euro 176 million) partly offset by increase of interest income for swaps (Euro 11 million).
Net income from derivatives at fair value through profit and loss totaled to Euro 153 million increased
by Euro 173 million mainly as a result of roll over hedging strategy and fair value fluctuation.
For more detail about derivative financial instruments, please refer to the note 7
4 Income tax expense – Euro14 million
Millions of euro
1st half
2017 2016 Change
Profit before income taxes 23 18 5
Tax rate at nominal tax rate (25%) 6 4 1
Withholding tax on interests 8 - 8
Current Taxation 14 4 9
Income tax accrued based on estimated average income tax rate 25%.
5 Deferred tax assets – Euro 238 million
Deferred tax asset accrued for deductable temporary differences that arose due to revaluation of
derivative and relise to profit and loss forex revaluation of hedged items. The recorded deferred taxes
will be utilised in future periods.
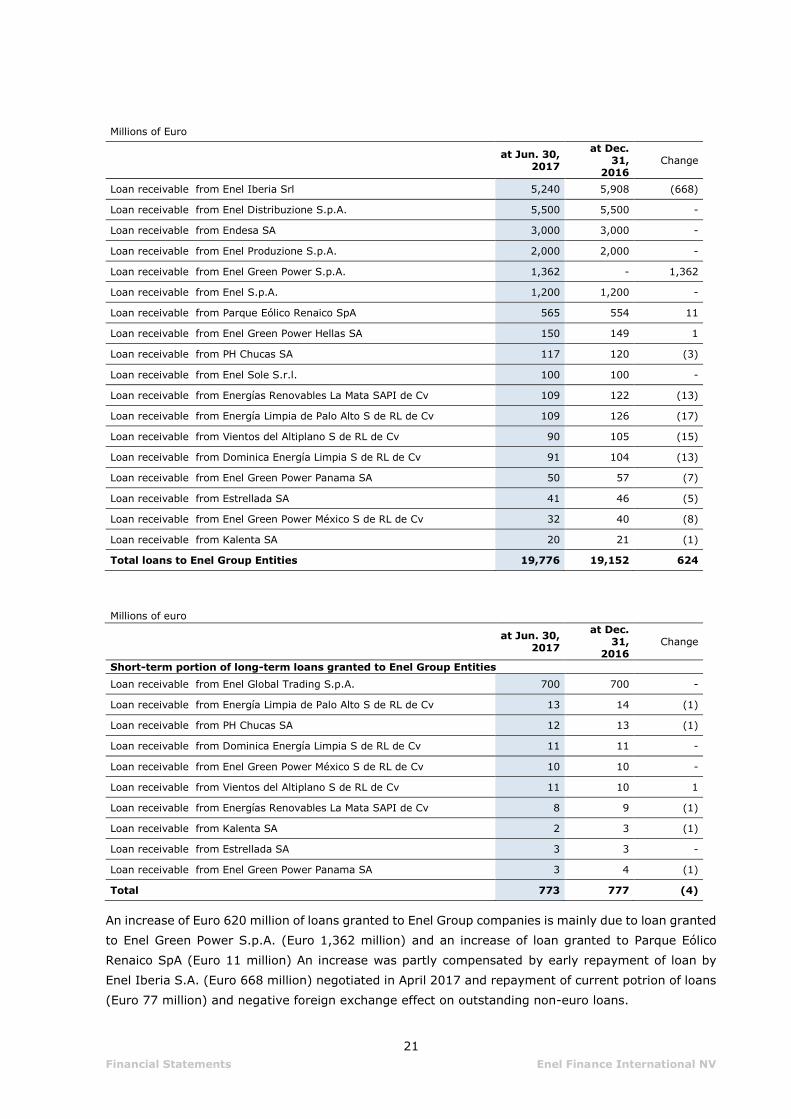
6 Long-term loans and financial receivables including portion falling due
withing twelve month – Euro 20,549 million
Following table represents to medium long-term loans granted to Enel Group companies:
21
Financial Statements Enel Finance International NV
Millions of Euro
at Jun. 30,
2017
at Dec. 31,
2016 Change
Loan receivable from Enel Iberia Srl 5,240 5,908 (668)
Loan receivable from Enel Distribuzione S.p.A. 5,500 5,500 -
Loan receivable from Endesa SA 3,000 3,000 -
Loan receivable from Enel Produzione S.p.A. 2,000 2,000 -
Loan receivable from Enel Green Power S.p.A. 1,362 - 1,362
Loan receivable from Enel S.p.A. 1,200 1,200 -
Loan receivable from Parque Eólico Renaico SpA 565 554 11
Loan receivable from Enel Green Power Hellas SA 150 149 1
Loan receivable from PH Chucas SA 117 120 (3)
Loan receivable from Enel Sole S.r.l. 100 100 -
Loan receivable from Energías Renovables La Mata SAPI de Cv 109 122 (13)
Loan receivable from Energía Limpia de Palo Alto S de RL de Cv 109 126 (17)
Loan receivable from Vientos del Altiplano S de RL de Cv 90 105 (15)
Loan receivable from Dominica Energía Limpia S de RL de Cv 91 104 (13)
Loan receivable from Enel Green Power Panama SA 50 57 (7)
Loan receivable from Estrellada SA 41 46 (5)
Loan receivable from Enel Green Power México S de RL de Cv 32 40 (8)
Loan receivable from Kalenta SA 20 21 (1)
Total loans to Enel Group Entities 19,776 19,152 624
Millions of euro
at Jun. 30,
2017
at Dec. 31,
2016 Change
Short-term portion of long-term loans granted to Enel Group Entities
Loan receivable from Enel Global Trading S.p.A. 700 700 -
Loan receivable from Energía Limpia de Palo Alto S de RL de Cv 13 14 (1)
Loan receivable from PH Chucas SA 12 13 (1)
Loan receivable from Dominica Energía Limpia S de RL de Cv 11 11 -
Loan receivable from Enel Green Power México S de RL de Cv 10 10 -
Loan receivable from Vientos del Altiplano S de RL de Cv 11 10 1
Loan receivable from Energías Renovables La Mata SAPI de Cv 8 9 (1)
Loan receivable from Kalenta SA 2 3 (1)
Loan receivable from Estrellada SA 3 3 -
Loan receivable from Enel Green Power Panama SA 3 4 (1)
Total 773 777 (4)
An increase of Euro 620 million of loans granted to Enel Group companies is mainly due to loan granted
to Enel Green Power S.p.A. (Euro 1,362 million) and an increase of loan granted to Parque Eólico
Renaico SpA (Euro 11 million) An increase was partly compensated by early repayment of loan by
Enel Iberia S.A. (Euro 668 million) negotiated in April 2017 and repayment of current potrion of loans
(Euro 77 million) and negative foreign exchange effect on outstanding non-euro loans.

22
Financial Statements Enel Finance International NV
7. Derivatives – Euro 49 million
Derivative instruments refer to: (i) Cash flow hedge derivatives used by the Company to hedge the
exchange rate and interest rate fluctuations of bonds and long-term loans or receivables; (ii)
derivatives at fair value through profit and loss used by the Company to hedge the loan interest rate
fluctuations. For further details see “Risk Management” section.
Milions of euro Non Current Current
Notional amount Fair value Notional amount Fair value
30 Jun
2017
31 Dec
2016
30 Jun
2017
31 Dec
2016
30 Jun
2017
31 Dec
2016
30 Jun
2017
31 Dec
2016
DERIVATIVE ASSETS
Cash flow hedge
on interest rate risk - - - - - - - -
on foreign exchange risk 4,411 4,734 512 725 1,314 1,423 232 344
Total 4,411 4,734 512 725 1,314 1,423 232 344
At fair value through profit or loss
on interest rate risk 50 50 3 3 - - - -
on foreign exchange risk - - - - 2,681 1,573 55 13
Total 50 50 3 3 2,681 1,573 55 13
TOTAL DERIVATIVE ASSETS 4,461 4,784 515 729 3,995 2,996 287 357
DERIVATIVE LIABILITIES
Cash flow hedge
on interest rate risk 8,091 8,400 157 266 - - - -
on foreign exchange risk 7,146 2,721 565 429 90.02 - 11.37 -
Total 15,237 11,121 722 695 90.02 - 11.37 -
At fair value through profit or loss
on interest rate risk 50 50 7 7 - - - -
on foreign exchange risk - - - - 526 2,682 13 17
Total 50 50 7 7 526 2,682 13 17
TOTAL DERIVATIVE LIABILITIES 15,287 11,171 729 702 616 2,682 24 17

23
Financial Statements Enel Finance International NV
The following table shows the amount of derivative contracts detailed on the basis of the hierarchy of
inputs used to determine fair value, as specified by IFRS 7:
Milions of euro Non Current Current
30 Jun
2017 Level1 Level2 Level3
30Jun
2017 Level1 Level2 Level3
DERIVATIVE ASSETS
Cash flow hedge
on interest rate risk 0 - 0 - - - - -
on foreign exchange risk 512 - 512 - - - - -
Total 512 - 512 - - - - -
At fair value through profit or loss
on interest rate risk 3 - 3 - - - - -
on foreign exchange risk - - - - 55 - 55 -
Total - - - - 55 - 55 -
TOTAL DERIVATIVE ASSETS 512 - 512 - 55 - 55 -
DERIVATIVE LIABILITIES
Cash flow hedge
on interest rate risk 157 - 157 - - - - -
on foreign exchange risk 565 - 565 - - - - -
Total 722 - 722 - - - - -
At fair value through profit or loss
on interest rate risk 7 - 7 - - - - -
on foreign exchange risk - - - - 13 - 13 -
Total 7 - 7 - 13 - 13 -
TOTAL DERIVATIVE LIABILITIES 729 - 729 - 13 - 13 -
8 Other non-current financial assets – Euro 26 million
Other non-current financial assets totaled Euro 26 million as t 30 June 2017 having a decrease of Euro
5 million of cost portion accrued in the period.
At 30 June 2017 non-current financial assets do not include neither past due nor impaired items.
9 Short-term loans and financial receivables – Euro 9,862 million
The following table shows the breakdown of the short-term loans granted to Enel Group affiliated
companies:

24
Financial Statements Enel Finance International NV
Millions of euro
at Jun
30, 2017
at Dec. 31,
2016 Change
Short-term loans granted to Enel Group Entities
Enel S.p.A. - Financial Services Agreement 4,410 2,096 2,314
Revolving short-term facility agreement with E-Distribuzione S.p.A 1,000 - 1,000
Revolving short-term facility agreement with Enel Produzione S.p.A. 1,500 1,000 500
Revolving short-term facility agreement with Enel Green Power S.p.A. 1,600 1,000 600
Revolving short-term facility agreement with Enel Green Power North
America 878 769 109
Revolving short-term facility agreement with Enel Green Power RSA 7 219 (212)
Revolving short-term facility agreement with Open Fiber 140 125 15
Revolving short-term facility agreement with EGP Hellas 121 122 (1)
Revolving short-term facility agreement with EGP Romania 11 52 (41)
Revolving short-term facility agreement with Villanueva Solar SA de Cv 36 - 36
Revolving short-term facility agreement with Proyecto Solar Villanueva
Tres SA de Cv 44 - 44
Revolving short-term facility agreement with Proyecto Solar Don José SA
de Cv 25 - 25
Revolving short-term facility agreement with Enel Green Power Peru 26 - 26
Revolving short-term facility agreement with EGP Bulgaria 19 23 (4)
Revolving short-term facility agreement with Enel Global Trading S.p.A. - 500 (500)
Revolving short-term facility agreement with Enel Green Power Chile - 705 (705)
Other short term loans granted to Enel Group affiliates 45 6 39
Total short term loans granted to Enel Group affiliates 9,862 6,617 3,245
The Euro 3,245 million increase of short-term loans principally refers to:
- an increase of financial receivables with Enel S.p.A.(Euro 2,314 million);
- an increase revolving line granted to E-Distribuzione SpA (Euro 1,000 million);
- an increase revolving line granted to Enel Produzione (Euro 500 million);
- an increase revolving line granted to Enel Green Power S.p.A. (Euro 600 million)
- an increase of relovling line granted to Enel Green Power North America (Euro 109 million)
This increase was partly compensated by:
- a decreased revolving short-term facility granted to Enel Global Trading S.p.A. (Euro 500 million);
- a decrease of relovling line granted to Enel Green Power Chile (Euro 705 million);
- a decrease of relovling line granted to Enel Green Power RSA (Euro 212 million)

25
Financial Statements Enel Finance International NV
The table below reports the short-term financial instruments granted to the Enel Group companies:
Millions of Euro
Financial relationship
Commitment amount as at 30 June 2017
Rate of Interest
Spread as at 30 June 2017
Commitment fee as at 30 Jun 2017
Enel Produzione S.p.A. Revolving credit facility 1,500 Euribor 0.62% 0.217%
Enel Global Trading S.p.A. Revolving credit facility 800 Euribor 1.20% 0.420%
e-distribuzione S.p.A. Revolving credit facility 1,000 Euribor 0.50% 0.175%
Enel Iberia S.r.l. Revolving credit facility 400 Euribor 0.40% 0.140%
Endesa S.A. Revolving credit facility 1,000
CP or
Alternative
Benchmak
0.06% N/A
Open Fiber S.p.A Revolving credit facility 250 1.50% N/A 0.525%
Enel Green Power Bulgaria
EAD Revolving credit facility 21 3M Euribor 2.10% 0.735%
Enel Green Power Chile Ltda Revolving credit facility 50 (1) 3M US
Libor 3.55% 0.200%
Enel Green Power Hellas SA Revolving credit facility 131.65 3M Euribor 4.43% 1.549%
Enel Green Power SpA Revolving credit facility 1,000 3M Euribor 0.96% 0.336%
Enel Green Power SpA Revolving credit facility 600 6M Euribor 1.17% 0.410%
Proveedora de Electricidad
de Occidente S de RL de Cv Revolving credit facility 15
(1) 6M US
Libor 0.40% 0.141%
Energía Limpia de Amistad,
S. De R.L. de C.V., Revolving credit facility 40
(1) 3M US
Libor 3.40% 1.190%
Parque Solar Don Jose, S.A.
De C.V., Revolving credit facility 80
(1) 3M US
Libor 3.40% 1.190%
Villanueva Solar, S.A. De
C.V. Revolving credit facility 80
(1) 3M US
Libor 3.40% 1.190%
Parque Solar Villanueva Tres,
S.A. De C.V. Revolving credit facility 100
(1) 3M US
Libor 3.40% 1.190%
Enel Green Power North
America Inc. Revolving credit facility
1.310
(1) 3M US
Libor 1.45% 0.507%
Enel Green Power Romania
Srl Revolving credit facility 270
(3)
3M Robor 1.81% 0.632%
Enel Green Power RSA (Pty)
Ltd Revolving credit facility 1,500
(2)
3M Jibar 4.91% 1.717%
Enel Green Power Panama
S.A. Revolving credit facility 15
(1) 3M US
Libor 1.4% 0.490%
Enel Green Power Turkey
Enerji Yatirimlari Anonim
Sirketi
Revolving credit facility
1.80
3M Euribor 2.18% 0.761%
Enel Green Power Peru S.A. Revolving credit facility 80 (1) 3M US
Libor 3% 1.050%
Estrellada SA Revolving credit facility 10 (1) 3M US
Libor 2.90% 1.015%
(1) Millions USD
(2) Millions ZAR
(3) Millions RON

26
Financial Statements Enel Finance International NV
10 Other current financial assets – Euro 283 million
Other current financial assets totaled to Euro 283 million increased by Euro 49 million due to cash
collaterals (Euro 56 million) partly offset by decrease of interest receivables (Euro 2 million) and
repayment of substitute tax (Euro 5 million). At 30 June 2017 current financial assets do not have
neither past due nor impaired items.
11 Other current assets – Euro 3 million
Other current assets totaled to Euro 3 million decreased by Euro 217 million due to decrease of
receivables of Enel Green Power S.p.A. (Euro 204 million) and Enel Investment Holding B.V.
(Euro 8 million)
At 30 June 2017 current financial assets do not have neither past due nor impaired items.
12 Cash and cash equivalents – Euro 5 million
Cash and cash equivalent represent the cash availabilty deriving by the turnover of lending porfolio of
the Company, temporary not invested in lending activities within Enel Group and placed in time
deposits operations with primary bank counterparties.
For the purpose of cash flows statement, cash and cash equivalents also includes the positive amount
of Financial Services Agreement held with the Parent Company. With reference to 30 June 2017, the
amount of the Financial Services Agreement is positive for Euro 4,410 million and it has been classified
as current financial assets in the statement of financial position.
13 Shareholder’s equity – Euro 1,479 million
Share capital – Euro 1.479 million
The authorized share capital of the company amounts to Euro 2.500 million, divided into 2.500 million
of shares, each share with a nominal value of Euro 1 each.
The issued and paid-up share capital amounts to Euro 1.478,8 million represented by 1.478.810.370
shares with nominal value of Euro 1,0 each.
Share premium reserve – Euro 1,026 million
The reserve arises from the cross-border merger finalized during 2010 between Enel Finance
International S.A. and Enel Trading RUS B.V. (Euro 43 million) and demerger of net assets from Enel
Green Power International B.V. in October 2016 (Euro 983 million).
Cash flow hedge reserve – Euro (713) million
The reserve includes the effective portion of the cumulative net change in the fair value of cash flow
hedging instruments related to hedged transactions. The variation over the period is detailed as
follows:
Millions of Euro
at Dec
31, 2016
Gain/(Losses) recognized in
equity for the year
Released to income statement
Deferred tax
asset
at Jun 30,
2016
Gains/Losses on change in fair value of the effective portion of CFH Derivatives on interest and exchange rates
(877) (367) 586 (55) (713)
Total gains/(losses) recognized in equity (877) (367) 586 (55) (713)

27
Financial Statements Enel Finance International NV
The increase of cash flow hedge is mainly due to increase of fair value measurement of cross
currency interest rate swap derivatives on bonds (Euro 472 million) partly offset by decrease of fair
value of interest rate swap derivatives on long-term floating rate loans (Euro 105 million) the
release (Euro 586 million) referred to positive variation of the underlying hedged financial liabilities
when the latter impact the Company income statement. Deferred tax asset related to the temporary
differences of stated above movements totaled Euro 55 million.
Capital Management
It is policy of the Company to maintain a strong capital structure to preserve creditors and market
confidence and so sustain future development of the business. The Board of Directors monitors the
return on capital.
The return of capital is calculated as a percentage of financial result on total equity net of cash flow
hedge reserve excluded in this key performance indicator because Company’s management preferred
to exclude evaluation equity reserves which might be quite volatile over the periods:
Millions of euro
at Jun.30 2017
at Jun. 30 2016
Total Equity 2,178 946
Cash flow hedge reserve (713) (923)
Adjusted equity 2,891 1,869
Net financial result 24 20
Return of capital (*) 1% 1%
* Key Performance Indicator determined on a yearly basis.
The Board’s objective is to maintain a balance between the higher returns that might be possible with
higher levels of borrowings and the advantages and security afforded by a sound capital position.
There were no changes in the Company’s approach to capital management during first six months of
2017. The Company is not subject to externally imposed capital requirements.
14 Long-term loans and borrowings (including the portion falling due within
twelve months) – Euro 23,460 million
This note provides information about the contractual terms of the Company’s interest bearing loans
and borrowings, which are measured at amortised cost. For more information about the Company’s
exposure to interest rate, foreign currency and liquidity risk see paragraph “Risk management”.
The aggregate includes long-term payables in respect of bonds, bank loans, revolving credit facility
and other loans in Euro and other currencies.
The following table shows long-term debt and repayment schedules at 30 June 2017, grouped by
loan and interest rate type:

28
Financial Statements Enel Finance International NV
Millions of Euro
Maturing Balance
Nominal
value Balance
Current
portion
Portion
falling
due after
more
than 12
months Maturing in
at Jun. 30,
2017
at Jun. 30,
2017
at Dec. 31,
2016 2018 2019 2020 2021 Beyond
Listed Bond (Fixed
rate)
2017-
2040 13,495 14,030 12,114
1,239 12,256 861 125 671 530 10,069
Listed Bond
(Floating rate)
2022-
2025 445 450 445
- 445 - - - - 445
Unlisted Bond
(Fixed rate)
2017-
2047 9,520 9,610 5,598
1,313 8,207 - 1,529 - - 6,678
Total Bond 2017-2047 23,460 24,090 18,157
2,552 20,908 861 1,654 671 530 17,192
The table below reports long-term financial debt by currency and interest rate.
Millions of Euro
at Jun 30,
2017
at Jun. 30,
2017
at Dec. 31,
2016 at Jun. 30, 2017
Balance Nominal value Balance Current average
interest rate
Effective interest rate
Total Euro 10,607 11,127 9,342 3.60% 4.32%
US dollar 9,340 9,420 5,421 4.83% 5.02%
British pound 2,532 2,559 2,599 5.70% 5.82%
Swiss Franc 735 737 540 2.37% 2.42%
Japanese yen 246 247 255 2.43% 2.46%
Total non-Euro currencies 12,853 12,963 8,815
Total 23,460 24,090 18,157
The table below reports the carrying amount and the fair value of long-term debt. For listed debt
instruments, the fair value is given by official prices while for unlisted instruments the fair value is
determined using appropriate valuation technique for each category of financial instrument and market
data at the closing date of the year.
Millions of Euro
at Jun. 30, 2017 at Dec. 31, 2016 2017 - 2016
Book
Value* Fair
value* Book
Value* Fair
value* Book Value
Fair value
Bonds in non-Euro currencies and Euro currency
23,460 26,895 18,157 21,528 5,302 5,367
Total long-term financial debt 23,460 26,895 18,157 21,528 5,302 5,367
* Fair value and Book Value of Bonds do not take in consideration the GMTN Internal Assumption
The table below reports changes in the nominal value of long-term debt during the year.
Millions of Euro
Nominal
value
New
financing Exchange Repayments
Exchange
rate
differences
Nominal
value
at Dec
31, 2016
at Jun.30,,
2017
Bonds in non-Euro currencies and Euro currency
18,752 5,924 0
(586) 24,090
Total long-term financial debt 18,752 5,924 0 0 (586) 24,090

29
Financial Statements Enel Finance International NV
Global Medium Term Programme
On January 2017 the Company placed on a green bond, backed by a guarantee issued by Enel S.p.A.
The issue totaled 1,250 million euros and provided for repayment in single instalment at maturity on
16 September 2024, as well as the payment of a fixed-rate coupon of 1%, payable annually in arrears
in the month of September, as from September 2017.
The green bond is listed on regulated markets of the Irish and Luxembourg Stock Exchanges and
Borsa Italiana.
On 3 March 2017 the Company placed swiss franc-denominated bond with maturity 7.5 years. The
issue totaled 225 million.
On 25 May 2017 the Company issued bonds on the US and international markets for institutional
investors.
The transaction is structured in the following tranches:
- 2,000 million USD at a fixed rate of 2.875% maturing in 2022;
- 2,000 million USD at a fixed rate of 3.625% maturing in 2027; and
- 1,000 million USD at a fixed rate of 4.750% maturing in 2047.
Revolving Facility Agreement
In February 2013 Enel S.p.A and the Company obtained and later in 2015 renegotiated the forward
starting revolving credit facility of about Euro 9,440 million with Mediobanca – Banca di Credito
Finanziario S.p.A. and a pool of banks leaded by Mediobanca, falling due 2020.
The facility was undrawn at June 30, 2017
Debt covenants
The main long-term financial debts of the Company are governed by covenants containing
undertakings by the borrowers (Enel S.p.A. and the Company) and by Enel S.p.A. as guarantor that
are commonly adopted in international business practice. The main covenants for the Company are
related to the bond issues carried out within the Global Medium-Term Notes Programme and the
Forward Start Facility. The Forward Start Facility was signed on 8 February 2013 by Enel and by the
Company with a pool of banks for a total amount of Euro 9.440 million. For more detailed description,
please see the 2016 financial statements
To date none of the covenants have been triggered.
15 Short-term loans and borrowings – Euro 4,816 million
Millions of Euro
at Jun. 30, 2017 at Dec. 31, 2016 Change
Book value Fair value
Book value Fair value
Book value Fair value
Short-term loans Enel Group companies 4,378 4,378 5,071 5,071 (693) (693)
Cash collateral 8 8 - - 8 8
Commercial papers 430 430 2,127 2,127 (1,697) (1,697)
Short-term financial debt 4,816 4,816 7,198 7,198 (2,382) (2,382)

30
Financial Statements Enel Finance International NV
Short-term loans
At 30 June 2017 short-term loans decreased by Euro 693 million from 31 December 2016.
Millions of Euro
Original
currency
Euro counterval
ue at Jun.30,
2017
Euro counterval
ue at Dec 31, 2016
Change
Intercompany Current Accounts denominated in Euro
Enel Servizio Elettrico S.p.A. Euro 2,524 2,744 (220)
Enel Investment Holding B.V. Euro 933 1,344 (411)
Enel IbeiaS.r.l. Euro 339 303 36
Enel Energia S.p.A Euro 500 500 0
Enel Green Power México S de RL de Cv Euro 1 73 (72)
Proveedora de Electricidad de Occidente S de RL de Cv USD 0 41 (41)
Generadora Montecristo SA USD, MXN 46 30 16
Enel Green Power Chile USD 17 - 17
Erdwärme Oberland Gm Euro 0 13 (13)
Kongul Energì Sanayive Tìcaret Anonìm S¸ìrket TRY 5 8 (3)
Enel Green Power Costa Rica SA USD 2 6 (4)
Enel Green Power Canada Inc CAD 7 5 2
Enel Green Power Development BV Euro 2 2 0
Kavachik TRY 1 1 0
Ovachik TRY 1 1 0
Total
4,378 5,071 (693)
Short-term loans are mainly composed by the following relashionships:
- The Long Term Deposit Agreement with Enel Servizio Elettrico S.p.A. signed on 27 December 2011.
The time deposits outstanding under the Agreement have a global balance of Euro 2,524 million;
- The deposit account agreement signed with Enel Investment Holding B.V. in November 2013 to
provide a financial instrument to deposit its excess of liquidity resulting from the disposal of some
assets and from the day by day activities; at 30 June 2017 the balance under this agreement is
equal to Euro 933 million;
- The deposit agreement signed with Enel Energia in 28 June 2016. At 30 June 2016 balance
remained Euro 500 million
- The financial agreement signed with Enel Iberia S.r.l. in December 2011 to provide inter alia a
financial instrument to deposit its excess of liquidity resulting from the day-by-day activities; at
30 June 2017 the balance under this agreement is equal to Euro 339 million.
Commercial Papers
The payables represented by commercial papers relate to outstanding issuances at 30 June 2016 in
the context of the Euro Commercial Paper Programme (hereinafter, also “ECP Programme”), launched
in 2005 by the Company and guaranteed by Enel S.p.A.
The total nominal value of commercial papers issued and not yet reimbursed as of 30 June 2016 was
Euro 430 million (Euro 2,217 million at 31 December 2016).

31
Financial Statements Enel Finance International NV
16 Income tax payable– Euro 28 million
Starting from 1 January 2015 the Company has formed a fiscal unity with Enel Investment Holding
B.V. After a consultation with the Dutch tax authority, Enel Finance Internationa N.V. has replaced
Enel Investment Holding B.V. as a head of fiscal unity.
Income tax payables totaled to an amount of Euro 28 million.
17 Other current financial liabilities – Euro 483 million
Other current financial liabilities mainly relate to interest expenses accrued on debt outstanding at 30
June 2017 mainly due to interests arising from GMTN Programme (Euro 447 million) and interest
arising from loans granded by Group and other intercompany transactions (Euro 35 million).
Related parties
Transactions between Enel Finance International N.V. and other companies of Enel Group involve
Financing and Treasury management.
The main activity of Enel Finance International N.V. is to operate as financing company of the Enel
Group, raising funds through bonds issuance, loans and other facilities and on turn lending the funds
so raised to the companies belonging to Enel Group.
Enel Finance International N.V. is also part of the centralising financial flow process and acts as the
primary reference for the management of financial needs or liquidity generated by the entities that
operate outside of Italy and are part of Enel Group.
The company enters into plain vanilla transaction with Enel S.p.A., such as currency forwards and
cross currency interest rate swaps in order to mitigate the interest and exchange rates risks.
These transactions are part of the ordinary operations of the Company and are settled on the basis of
Standard intra-Group contract market prices.
Enel Finance International N.V. has no business relations with Key management during the financial
year.
The following table summarizes the financial relationships between the Company and its related parties
at 30 June 2015 and respective period of previous year:

32
Financial Statements Enel Finance International NV
Millions of euro
Receivables Payables Income Cost
at Jun.30,
2017 1H2017
Shareholder
Enel S.p.A 6,388 595 74 33
(Subtotal) 6,388 595 74 33
Other affiliated companies
Enel Distribuzione S.p.A. 6,565 168
Enel Energia S.p.A. 500
Enel Iberia Srl 5,260 339 129 0
Enel Produzione S.p.A. 3,520 55
Enel Servizio Elettrico S.p.A. 2,525 0 6
Enel Sole S.r.l. 101 1
Enel Global Trading S.p.A. 706 11
Enel Investment Holding B.V. 1 937 1
EGP Bulgaria EAD 19 0
Enel Green Power S.p.A. 2,967 7 8
Enel Green Power Chile Ltda 0 17 10 11
Enel Green Power Costa Rica 2 0 0
P.H. Chucas SA 130 3 10
Generadora Montecristo SA 46 4 1
Enel Green Power Mexico 41 1 3 4
Proveedora de Electricidad de Occidente Srl de cv
13 1 1 3
Enel Green Power Panama SA 66 2 6
Enel Green Power Romania 11 1 0
EGP HELLAS 274 11
Enel Green Power Canada Inc. 7 0 0
Enel Green Power North America Inc. 879 25 80
ENDESA S.A. 3,016 45
Enel Green Power Peru S.A. 26 2 4
Enel Green Power Colombia SAS 0
Kalenta SA 24 1
Enel Green Power Development B.V. 2
Dominica Energia Limpia S. de R.L. de C.V. 102 4 9
Energias Renovables La Mata S.A.P.I. de C.V. 117 5 10
Enel Green Power Rsa (PTY) Ltd 8 14 1
Enel Green Power Turkey Enerji Yatirimlari AS 2
Estrellada S.A. 52 2 4
Kongul Enerji Sanayi Ve Ticaret Anonim Sirketi
5
PARQUE EOLICO RENAICO SPA 565 20 47
Energia Limpia de Palo Alto, S. de R.L. de C.V.
123 4 11
Vientos de Altiplano, S. de R.L. de C.V. 101 4 9
Enel OpEn Fiber S.p.A. 140 1
Villanueva Solar S.A. de C.V. 36 0 1
Proyecto Solar Villanueva Tres S.A. de C.V. 44 1 2
Proyecto Solar Don José S.A. de C.V. 26 1 1
Energia Limpia de Amistad, S. de R.L. de C.V.
12 0 0
(Subtotal) 24,945 4,390 537 220
Total 31,334 4,985 611 253

33
Financial Statements Enel Finance International NV
Millions of euro
Receivables Payables Income Cost
at Dec. 31,
2016 1H2016
Shareholder
Enel S.p.A 4,406 733 34 29
(Subtotal) 4,406 733 34 29
Other affiliated companies
Enel Distribuzione S.p.A. 5,566 - 169
Enel Iberia S.A. 5,931 303 144 0
Enel Produzione S.p.A. 3,020 - 61
Enel Energia S.p.A. - 500 6-
Enel Global Trading S.p.A. 1,205 - 16
Enel Servizio Elettrico S.p.A. - 2,744 - -
Enel Investment Holding B.V. 10 1,346 9
Enel Green Power International B.V. - - 108 12
ENDESA S.A. 3,018 - 46
EGP Bulgaria EAD 23 - - -
Enel Sole S.r.l. 101 - 1
Enel Green Power S.p.A. 1,204 - 3 -
Enel Green Power Chile Ltda 705 - - -
Enel Green Power Costa Rica 6 - -
P.H. Chucas SA 136 - - -
Generadora Montecristo SA 29 - -
Enel Green Power Mexico 50 73 - -
Proveedora de Electricidad de Occidente Srl de cv
- 41 - -
Enel Green Power Panama SA 61 - - -
Enel Green Power Romania 52 - - -
EGP HELLAS 275 - - -
Enel Green Power Canada Inc. 5 - -
Enel Green Power North America Inc. 769 - - -
Enel Green Power Colombia SAS 7 - - -
Kalenta SA 24 - - -
Enel Green Power Development B.V. - 2 - -
Dominica Energia Limpia S. de R.L. de C.V. 116 - - -
Energias Renovables La Mata S.A.P.I. de C.V. 131 - - -
Enel Green Power Rsa (PTY) Ltd 219 - 1 -
Estrellada S.A. 56 - - -
Kongul Enerji Sanayi Ve Ticaret Anonim Sirketi
2 8 - -
PARQUE EOLICO RENAICO SPA 554 - - -
Energia Limpia de Palo Alto, S. de R.L. de C.V.
140 - -
Vientos de Altiplano, S. de R.L. de C.V. 115 - -
Edwarme 13 - -
Enel OpEn Fiber S.p.A. 125 - - -
Endesa Latinoamérica S.A. - - - -
(Subtotal) 23,613 5,071 549 28
Total 28,019 5,804 583 56
For further details of the each relation with related parties please refer to relevant disclosures in these
financial statements.
Contractual commitments and guarantees
The notes issued by the Company under the GMTN programme are guaranteed by Enel
S.p.A. Commercial papers issued the context of the Euro Commercial Paper Programme launched
in 2005 by the Company are also guaranteed by Enel S.p.A. Furthermore, Enel S.p.A has confirmed
their commitment to provide the Company with support until next year's approval of the financial
statements, should the Company remain under control of the Enel S.p.A. The Company has not given
guarantees to third parties up to the reporting date.

34
Financial Statements Enel Finance International NV
Compensation of Directors
The emoluments of the Company Directors as intended in Section 2:383 (1) of the Dutch Civil Code,
which were charged in first six months of 2017, amounted to Euro 43.5 thousand and they are
summarized in the following table:
Thousands of euro
at Jun.30, 2017 Jun.30, 2016
A.J.M. Nieuwenhuizen 14.5 9
F. Mauritz - 9
H. Marseille 14.5 9
E. Di Giacomo 14.5 9
A. Canta - -
Total 43.5 36
Subsequent events
In accordance with the Liability Management Program the Company has decided to redeem the USD
1,750 5,125% Notes due 2019 prior to maturity.
The notes carry a make whole call provision. The call price will be calculated based on present value
of principal payments and interests discounted at US treasury rate plus 30bps.
Relevant counterparties were notified about transaction on 12 July 2017. The debt will be settled on
2 August 2017
Amsterdam, 26 July 2017
A.J.M. Nieuwenhuizen
H. Marseille
E. Di Giacomo
A. Canta