ENDWALL HEAT TRANSFER, TOTAL PRESSURE LOSS AND WAKE …
48
UZOL & CAMCI 1 ENDWALL HEAT TRANSFER, TOTAL PRESSURE LOSS AND WAKE FLOW FIELD CHARACTERISTICS OF CIRCULAR AND ELLIPTICAL PIN FIN ARRAYS Oguz Uzol and Cengiz Camci Turbomachinery Heat Transfer Laboratory Pennsylvania State University University Park, PA 16802 USA ABSTRACT The results of the endwall heat transfer, total pressure loss and wake flow field measurements for two different types of elliptical pin fin arrays and a typical circular fin array are presented. The experiments include Liquid Crystal Thermography, total pressure probe measurements in a Reynolds number range of 18,000 and 86,000 as well as Particle Image Velocimetry measurements at Re D =18,000. A two row arrangement is used with fins having H/D=1.5 and S/D=X/D=2. Two different types of elliptical pin fins are tested: One with a standard elliptical cross-section (SEF) and the other derived from NACA four digit symmetrical airfoil series (N Fin). The minor axis lengths for both types of elliptical fins are kept equal to the diameter of the Circular fins in order to obtain the same effective frontal area. It is found that the heat transfer enhancement levels for the Circular fin array are about 27% higher in average than the levels for the SEF and N fin arrays. Significant differences in the local enhancement patterns of the circular and elliptical pin fin arrays are observed. Furthermore, the SEFs and N fins have weaker Reynolds number dependency compared to the Circular pin fins. There is substantial reduction in the total pressure loss in the case of SEF and N fin arrays. The levels for the SEF and the N fin are close to each other, but N fin creates slightly less pressure loss inside the wake. The average loss levels for the Circular fin are 44% and 52% higher than the levels of the SEF and N fins, respectively, for the lowest Reynolds number. For the highest Reynolds number, the
Transcript of ENDWALL HEAT TRANSFER, TOTAL PRESSURE LOSS AND WAKE …

UZOL & CAMCI1
ENDWALL HEAT TRANSFER, TOTAL PRESSURE LOSS AND WAKE FLOW FIELD
CHARACTERISTICS OF CIRCULAR AND ELLIPTICAL PIN FIN ARRAYS
Oguz Uzol and Cengiz Camci
Turbomachinery Heat Transfer LaboratoryPennsylvania State University
University Park, PA 16802USA
ABSTRACT
The results of the endwall heat transfer, total pressure loss and wake flow field
measurements for two different types of elliptical pin fin arrays and a typical circular fin array
are presented. The experiments include Liquid Crystal Thermography, total pressure probe
measurements in a Reynolds number range of 18,000 and 86,000 as well as Particle Image
Velocimetry measurements at ReD=18,000. A two row arrangement is used with fins having
H/D=1.5 and S/D=X/D=2. Two different types of elliptical pin fins are tested: One with a
standard elliptical cross-section (SEF) and the other derived from NACA four digit symmetrical
airfoil series (N Fin). The minor axis lengths for both types of elliptical fins are kept equal to the
diameter of the Circular fins in order to obtain the same effective frontal area. It is found that the
heat transfer enhancement levels for the Circular fin array are about 27% higher in average than
the levels for the SEF and N fin arrays. Significant differences in the local enhancement patterns
of the circular and elliptical pin fin arrays are observed. Furthermore, the SEFs and N fins have
weaker Reynolds number dependency compared to the Circular pin fins. There is substantial
reduction in the total pressure loss in the case of SEF and N fin arrays. The levels for the SEF
and the N fin are close to each other, but N fin creates slightly less pressure loss inside the wake.
The average loss levels for the Circular fin are 44% and 52% higher than the levels of the SEF
and N fins, respectively, for the lowest Reynolds number. For the highest Reynolds number, the

UZOL & CAMCI2
Circular fin has 61% and 73% more loss with respect to the SEF and N fins, respectively. A
performance index, f/Nu D , representing the heat transfer per unit total pressure loss is used to
describe the overall performance of pin fin arrays with different pin shapes. The results show that
the SEF and the N fin have much higher performance indices than the circular fin. The
performance index for the Circular pins decreases relatively fast as the Reynolds number is
increased. The wake flow field measurements show that the Circular fin array creates a large low
momentum wake zone compared to the SEF and N fin arrays. A laminar separation occurs on the
fins in the second row. The wake trajectories of the 1st row fins for Circular, SEF and N fin
arrays are substantially different from each other. The turbulent kinetic energy levels within the
wake of the Circular fin array are higher than those for the SEF and the N fin arrays and the
transverse variations correlate well with the corresponding local heat transfer enhancement
variations.
KEYWORDS: Elliptical pin fins, Endwall Heat Transfer, Particle Image Velocimetry, Turbine
blade cooling, Pin fin arrays.
INTRODUCTION
Improvement in thrust levels and reduction in fuel consumption rates requires higher levels
of turbine inlet temperatures in gas turbine engines. Therefore effective internal heat transfer
enhancement for the high pressure turbine blades is necessary. In-line and staggered arrays of
short cylindrical pin fins with circular cross-sections are one of the most common types of
internal cooling devices used in turbine blades. These pin fin arrays enhance the heat transfer
levels both by increasing the wetted surface area and the passage thermal transport downstream

UZOL & CAMCI3
of the pin fin. However it is by no means clear that the circular cylinder is the most efficient
geometry in terms of heat transfer enhancement and pressure loss minimization.
Previous pin fin research is mostly based on the determination of heat transfer and pressure
loss characteristics of different array configurations with circular pin fins. Nevertheless, there has
also been some effort in investigating different pin fin shapes and concepts. Pin fins with oblong
cross-sections are investigated by Metzger et al. [1] for various pin orientations with respect to
the main flow. Their results indicate that the use of elongated pin fins (oblong shape) increases
endwall heat transfer but also causes higher levels of aerodynamic penalty than the circular pin
fins when the main flow direction deviates from the direction of the major axis of the oblong pin
fin. When the main flow approaches with zero incidence, the pressure loss levels become lower
than that of circular pin fins. Steuber and Metzger [2] investigated partial length circular pin fins
as an alternate to full circular pin fins. Their results showed that the partial length pin fins did not
out-perform the full length fins in terms of heat transfer but when the heat transfer and pressure
loss are both considered, some of their partial length pin fin arrays were superior. Arora and
Abdel-Messeh [3] also investigated the partial length circular pin fin concept and found that both
the array averaged heat transfer and friction factor decreases with increasing gap distance. Wang
and Ji [4] experimentally investigated the heat transfer and pressure loss characteristics of
tapered pin fin configurations and compared their results with full cross pin fins and shorter
round pin fins. This comparison showed that the tapered pin fins had the smallest specific
friction loss (f/Nu). A numerical investigation of the flow through diamond shaped pin fin arrays
is performed by Grannis and Sparrow [5] using a finite element based solution method. They
compared their predictions of per row pressure drop with the experimental data and achieved
satisfactory agreement. A flow visualization study along with heat transfer measurements for in-

UZOL & CAMCI4
line circular and square pin fins is conducted by Minakami et al. [6]. Test results showed that the
circular pin fin array had higher heat transfer levels and this was explained by wider flow mixing
area created in circular pin fin arrays than in case of the square pin fins. In terms of pressure loss
the square and circular pin fins had similar overall performances. Stepped diameter circular fin
arrays have been investigated by Goldstein et al. [7] in a Reynolds number range 3000 to 18000
based on the approach velocity and fin diameter and for a 10 row staggered array. It is found that
the stepped diameter circular fins have a smaller pressure loss and higher heat transfer rates
compared to the uniform diameter circular pin fin arrays. Chyu et al. [8] investigated the heat
transfer and pressure loss characteristics of cubic and diamond shaped pin fin arrays for both in-
line and staggered configurations. The arrays they have used had geometric parameters H/D=1,
S/D=X/D=2.5. They have found that the cubic pin fin arrays produced the highest heat transfer
rates than the diamond and circular fins and the diamond pin fin array induced the greatest
pressure loss. As a result of this study the cubical pin fin arrays were proposed as viable
alternatives to circular pin fins for internal cooling of the blade trailing edge. Li et al. [9]
investigated elliptical pin fin arrays for Reynolds numbers between 900 and 9000. In their study,
the major and minor axis of the elliptical fins is chosen such that their circumference is equal to
the circumference of a corresponding circular pin fin. This approach resulted in smaller effective
frontal areas for the elliptical fins, which naturally led to lower total pressure loss levels than the
circular pin fins. However this kind of approach was necessary since the heat transfer levels on
the pin itself were going to be measured and compared with that of a circular pin fin. They have
found that the heat transfer of a channel with elliptic pin fins is higher than that with circular pin
fins. Chen et al. [10] conducted similar experiments with drop-shaped pin fins, again using the
equal circumference diameter concept. They have also found much less pressure loss levels for
UZOL & CAMCI5
drop-shaped pin fins, but similar to Li et al. [9] this was mainly due to the smaller frontal area of
the drop-shaped fins in order to achieve the same surface area with the corresponding circular
fins. The heat transfer levels of drop-shaped pin fin arrays were found higher than the levels for
circular pin fin arrays as a result of this study.
This paper presents the results of the measurements that are performed for determining and
comparing the characteristics of the circular and elliptical pin fin arrays. Two different types of
elliptical pin fin arrays, i.e. Standard Elliptical Fin (SEF) and N fin that is derived from NACA
four digit symmetrical airfoil series, and a typical circular fin array are investigated. The
experiments are conducted in a Reynolds number range of 18,000 and 86,000 (based on the
maximum velocity and the circular fin diameter) and for 2-row staggered array configurations
with S/D=X/D=2.0 and H/D=1.5. The minor axis lengths for both types of elliptical fins are kept
equal to the diameter of the circular fins in order to obtain the same effective frontal area.
Experiments include measurements of convective heat transfer coefficients on the endwall within
the wakes using Liquid Crystal Thermography, total pressure loss measurements by Kiel probe
traverses and two-dimensional Particle Image Velocimetry (PIV) measurements within the
wakes at mid-plane of the test section. The heat transfer enhancement and pressure loss
characteristics as well as wake flow field structures of the SEF and N fin arrays are compared to
those of circular pin fin arrays.
EXPERIMENTAL SETUP
Facility
The experiments are conducted at the “Low Speed Heat Transfer Research Facility” at the
Turbomachinery Heat Transfer Laboratory of the Pennsylvania State University. This is an open-

UZOL & CAMCI6
loop wind tunnel which consists of an axial air blower, a diffuser with multiple screens, a plenum
chamber, a high area ratio circular nozzle, a circular to rectangular transition duct, a converging
nozzle, the test section, a diverging nozzle and a diffuser. The schematic of the facility is shown
in Figure 1.
An axial flow fan is used to draw the ambient air into the facility. A 0.66 m x 0.66 m x 0.39
m filter box encloses the inlet of the axial fan. A 7.5 kW electric motor drives the 0.457 m tip
diameter fan that has a potential to provide a pressure differential of 0.15 m of water over a range
of flow rates. The speed of the electric motor is controlled by using an adjustable frequency AC
drive. After the fan, the flow passes through a series of screens and enters a 1.73 m3 plenum
chamber. Downstream of the plenum the air accelerates through a circular nozzle of area ratio
8.65 then transitions to a 0.3667 m x 0.1524 m rectangular cross-section by a 1.37 m long duct.
The cross-section is further reduced to 0.3667 m x 0.0762 m by a converging nozzle that is 0.508
m long and also has a rectangular cross-section. After the converging nozzle there is the test
section which is a 1.27 m long straight rectangular duct made out of 0.0127 m thick clear acrylic
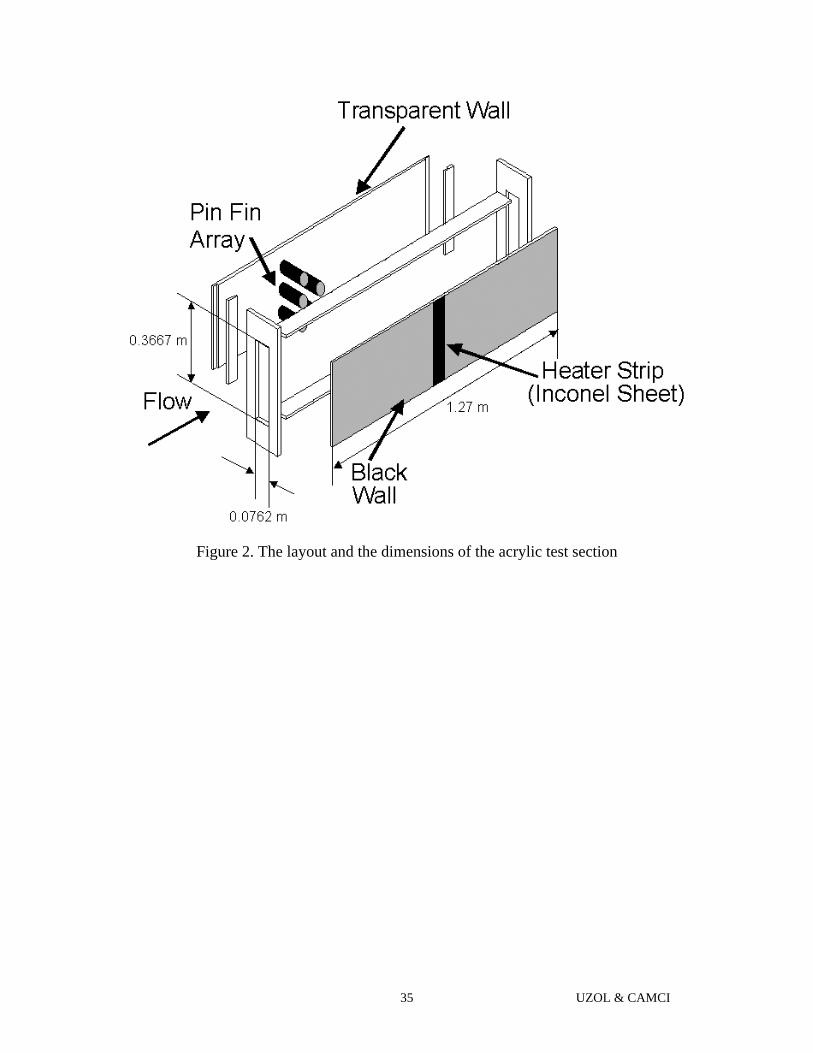
and has a 0.3667 m x 0.0762 m cross-section (Figure 2).
Pin Fin Geometries
One circular and two different elliptical pin fin shapes are investigated in the current study.
The geometries and the dimensions of these pin fins are presented in Figure 3 and are defined as
follows:
The Standard Elliptical Fin (SEF) This pin fin has a standard elliptical cross-section with the
minor axis length being equal to the circular fin diameter resulting in the same effective frontal
area as the circular fin (this is necessary in order to be able to make meaningful comparisons of
the aerodynamic penalty levels for those geometries). The major axis length is 1.67 times the

UZOL & CAMCI7
minor axis length. The surface area is 1.35 times the surface area of the circular fin (increased
surface area will result in increased heat transfer levels on the pin itself. However, measurement
on the pin itself is beyond the scope of this study). Only the endwall heat transfer enhancement
inside the wakes is considered.
The N Fin This fin shape is derived from the NACA four-digit symmetrical airfoil series. The
thickness distribution for the four-digit series of airfoils is given in Abbott and Von Doenhoff
[11] as
( )432 x1015.0x2843.0x3516.0x12600.0x29690.02.0
ty −+−−= (1)
where t is the maximum thickness as a fraction of the chord length. This distribution gives the
maximum thickness at 30% chord location. In order to obtain the N fin shape the NACA0024
airfoil is taken as a basis, which has 24% maximum thickness, and only the airfoil geometry up
to the maximum thickness location is used to construct the forward half of the fin. The backward
half is constructed by taking the mirror image of the forward half. Similar to SEF, the minor axis
length is equal to the diameter of the circular fin. The major axis length is 2.5 times the minor
axis length, and the surface area of the N fin is 1.85 times larger than the surface area of the
circular fin.
Experimental Setup
The pin fin arrays are placed approximately 4D downstream from the entrance of the test
section in which the flow properties are not fully developed but developing (D is the diameter of
a circular fin, D=0.0508 m). The duct continues up to 10D downstream of the arrays. The height
to diameter ratio (H/D) of the pin fins is 1.5, which is a typical value for turbine blade cooling
applications as reported in Armstrong and Winstanley [12]. The pin fin arrays are placed inside
the test section in a staggered array configuration consisting of 2 rows of fins, with 3 fins in the

UZOL & CAMCI8
first row and 2 fins in the second row, as presented in Figure 4. The transverse and streamwise
distance between each fin is taken equal to the diameter of the circular fin such that S/D=X/D=2.
Using only two rows of pin fins may not be enough to establish a fully developed pattern inside
the test section, however, it was sufficient for determining the relative endwall heat transfer
enhancement and total pressure loss minimization performances of arrays with different fin
shapes.
ENDWALL HEAT TRANSFER MEASUREMENTS
Procedure
Measurements for convective heat transfer coefficients on the endwall downstream of the
pin fin arrays are performed using Liquid Crystal Thermography. For this purpose a rectangular
heater strip, 0.0254 m wide (0.5D) and 0.419 m high (8.2D), is placed 2D downstream of the
arrays and attached on the tunnel sidewall. Although the width of the heater strip is small com-
pared to the pin fin diameter and tunnel dimensions, it was sufficient for obtaining line
distributions of the convective heat transfer coefficient along the centerline of the heater strip.
The heater strip height allowed 0.0127 m excess on either end of the strip for bus bar connections
to the DC power supply. Figure 4 shows the experimental setup for endwall heat transfer
measurements. The heater strip, made out of Inconel 600 foil, is attached to the sidewall using
double-sided tape. The Inconel 600 foil is a low resistivity steel foil (75% Ni, 15% Cr, 10% Fe),
which has a low temperature coefficient resistivity that restrained a change in the resistance of
the foil within the temperature range used in the experiments. The strip surface is then painted
black in order to obtain the best color contrast for the liquid crystals. A thin coat of liquid
crystals with an event temperature of approximately 45° and a bandwidth of 1° is sprayed onto
the heater strips after the black paint is applied. After the heater strip is prepared and the pin fin
array is placed inside the test section, the tunnel is started and a DC voltage is applied across the

UZOL & CAMCI9
heater strip. The applied DC voltage results in an increase in the surface temperatures on the
heater strip, which in turn results in the appearance of color bands on the surface due to the
thermochromic properties of the liquid crystal material. The DC voltage is started from zero and
slowly increased until the color bands started to appear. At this point steady state conditions are
allowed to be reached and then a 352x240 pixels2 color image of the heater strip is captured in
bitmap format through a video camera and a computer. The hue information on the heater strip is
directly related to the surface temperature through the calibration of the liquid crystals (Uzol
[13]). After the image is recorded the power to the heater strip is then increased causing a shift in
the position of the color bands. This process is repeated until the color bands have covered the
entire heater strip surface. The illumination during this procedure is supplied by two 150 Watts
incandescent light bulbs in reflectors positioned on either side of the test section. Direct radiative
heating of the liquid crystal coated surface is minimized by only illuminating the lights when
data were being taken.
Image Processing Technique
After the recording phase of the images is finished, the images are analyzed one by one to
obtain the hue, saturation and intensity information on the heater strip. The hue attribute is used
to determine the surface temperature at a given pixel location on the image using the calibration
curve, and intensity values are used for filtering. Intensities lower than 50 usually cause the hue
values to become unstable and the pixel cannot be used to obtain the accurate temperature
(Camci et al. [14]). Also if the intensity value of a pixel exceeds 200, the hue value becomes less
accurate due to the saturation of the sensor in the video camera. A typical image of the liquid
crystal sprayed heater strip is shown in Figure 5. The image processing procedure is as follows:
1. The RGB information at each pixel on the image is extracted from the bitmap file.

UZOL & CAMCI10
2. The extracted RGB information is converted to HSI values for the pixel columns
corresponding to the heater strip on the image (Figure 5). The RGB to HSI conversion is
performed using standard conversion formulas (Niblack [15] and Russ [16]).
3. For each pixel row on the column of pixels corresponding to the heater strip, hue values of
pixels around the centerline of the heater strip are determined. Then a filtering process using the
intensity values is performed for these pixels such that any pixels with intensity values less than
50 and higher than 200 are rejected. Also if the hue value for a pixel is outside the calibration
range, that pixel is not considered. Using this filtering procedure, the valid pixels around the
centerline are determined and the endwall temperature values for the valid pixels are calculated
using the calibration curve. These temperature values around the centerline are then used for
determining the average temperature on the centerline of the heater strip for each power setting.
The minimum number of valid pixels used in this averaging process is also controlled such that if
this number is below a certain value, that pixel row is skipped.
4. The convective heat transfer coefficient, h, at the centerline of the heater strip at each pixel
row is then calculated from Newton’s Law of Cooling,qqq
(2)
where Tq
is the total generated heat flux, Cq
is the conduction heat loss, Rq
is the radiation heat
loss, TW is the measured wall temperature and T∞ is the free stream temperature.
The total generated heat flux, Tq
, on the rectangular heater strip is calculated from Joulean
heating using,q
(3)

UZOL & CAMCI11
where VS is the voltage across the heater strip, RS is the resistance of the heater strip and AS is the
area of the heater strip. It must be kept in mind that equation 3 is valid only for rectangular heater
geometries with any aspect ratio. A more detailed technique to calculate the total generated heat
for arbitrarily shaped boundaries is explained in detail in Wiedner and Camci [17]. The
conduction heat loss term is obtained using,q
(4)
Here TA is the temperature on the ambient side of the wall, tW is the wall thickness and kW is
the thermal conductivity of acrylic wall. The temperature on the ambient side of the wall (TA) is
also measured using a K-type cement-on thermocouple attached on the wall surface on the
ambient side.
The radiation heat loss term is estimated by using a black body assumption. Hence,()q
(5)
where σ is the Stefan-Boltzmann constant, εW and ε∞ are the heater strip and tunnel wall surface
emissivities, respectively. The freestream static temperature, T∞, is taken equal to the total
temperature at the test section inlet, which was measured at that location. This is a valid
assumption since the Mach numbers in the test section are very low for the current experiments.
Measured convective heat transfer coefficient values are then used to calculate the Nusselt
numbers using,
airD k
hDNu = (6)
where D is the diameter of the circular fin. The thermal conductivity of air, kair , is determined
using the inlet static temperature.

UZOL & CAMCI12
Due to the nature of the measurement technique, there exists a developing thermal
boundary layer along the width of the heater strip. The character of this thermal boundary layer
will be similar for each pixel row on the heater strip such that the convective heat transfer
coefficients will start from a maximum and will decrease as the thermal boundary layer
develops. However the levels of heat transfer enhancement will be different along the length of
the heater strip depending on the relative location with respect to the wake of the pin fin array.
The main objective of the current experiments is to capture these differences in the levels of heat
transfer enhancement for pin fin arrays with different fin shapes that have different wake
characteristics. The uncertainty in the measurement of the temperature value from the hue value
is estimated as ±0.3°C and the uncertainty in the measured convective heat transfer coefficients
is estimated as ±4% using the root-sum-square method described in Moffat [18].
Results
The endwall heat transfer measurements for the Circular, SEF and N fin arrays are
conducted for six different Reynolds numbers varying between 18,000–86,000 based on the
maximum velocity and the fin diameter (or SEF/N fin minor axis length). The maximum velocity
changes between 5 m/s to 25 m/s in this Reynolds number range. The inlet turbulence intensity
level is about 2%.
The distributions of relative convective heat transfer coefficients for six different Reynolds
numbers are presented in Figure 6 for Circular, SEF and N fin arrays. The relative results are the
values over the baseline empty tunnel measurements. In case of the Circular fin array, the heat
transfer enhancement levels are higher than the levels for the SEF and N fin arrays, for all
Reynolds numbers. The levels for the SEF and N fin arrays are close to each other. Significant
differences between the local enhancement patterns of the circular and elliptical pin fin arrays are

UZOL & CAMCI13
observed. Local enhancements inside the wakes of the SEF and N fin arrays are clearly visible in
the form of two peaks in the line distributions. Although the local enhancements are not as
distinct in case of circular fins, they can still be depicted from the plots in Figure 6. For example
at ReD=18,000, there exists a local maximum around the centerline, y/D=0.0 whereas this
location shows a local minimum for SEFs and N fins. Furthermore, the levels show a local
minimum around y/D=±1.2, however, this location is the local maximum for SEFs and N fins.
Keep in mind that the centers of the two pin fins in the second row are located at y/D=±1.0. This
indicates that, for the circular pin fins, the local minimums in the heat transfer coefficients occur
within the wakes of the 2nd row fins around the wake centerline. However for the elliptical fins,
this region shows local maximums. Consequently, there must be substantial differences between
the wake characteristics of the circular fins and elliptical fins, which indeed is the case and will
be explained in detail in the coming sections from the results of the Particle Image Velocimetry
measurements. Similar differences in local heat transfer enhancement patterns are also observed
at the other Reynolds numbers. Note that the sudden drop in the h/h0 levels after y/D=3.4, for all
arrays and at all Reynolds numbers, is due to the presence of the corner boundary layer in that
region.
Figure 7 illustrates the variation of the average relative heat transfer enhancement (in terms
of relative Nusselt number) with Reynolds number. In this figure, 0Nu is determined from the
correlation obtained using the results of the empty tunnel measurements (see Table 1). Since
these correlation coefficients are determined using the hydraulic diameter, 0Nu is modified to
include the pin fin diameter instead of the hydraulic diameter to be compatible with the pin fin
Nusselt numbers in Figure 7. For all fin shapes, the relative enhancement levels decrease with
increasing Reynolds number. This is mainly due to the fact that the Reynolds number

UZOL & CAMCI14
dependency of the empty tunnel case is much stronger than the one for the pin fins (for the empty
tunnel, the Reynolds number exponent is 0.823 whereas it is 0.7, 0.678 and 0.661 for the
Circular, SEF and N fins, respectively, see Table 1). Therefore as the Reynolds number
increases, the Nusselt number levels of the pin fins do not increase as fast as the empty tunnel
values, hence resulting in a decreasing trend. Furthermore, the relative enhancement levels for
the SEF and N fins decrease more sharply than the levels for the circular fins. This is basically
because of the relatively weak Reynolds number dependency of the SEF and N fins, i.e. with
lower Reynolds number exponents.
Figure 8 shows the line averaged Nusselt number variation with Reynolds Number for the
circular pin fins and the comparison of the current data with the previously reported correlations
of Metzger et al. [19] and Zukauskas [20] for staggered circular pin fin arrays. The Metzger et al.
[19] correlation is given as,
0.690.34DDNu0.135Re(X/D) (7)
This correlation is evaluated and verified with the published data by Armstrong and
Winstanley [12] and is applicable for H/D≤ 3, 1.5≤X/D≤5, 2.0≤S/D≤ 4.0 and
10,000≤ReD≤100,000, which covers the range of the current experiments (H/D=1.5,
X/D=S/D=2.0, 18,000≤ReD≤86,000). For comparison purposes, the correlation further needs to
be modified to account for the number of pin rows tested (2 rows tested in the current
experiments). This modification can be performed, as suggested by Armstrong and Winstanley
[12], using the row-by-row variation curve presented in Metzger et al. [19]. The Metzger
correlation plotted in Figure 8 uses equation (7) and is modified for the 2-row measurements
obtained in the current experiments. It is evident that the current data is in close agreement with
UZOL & CAMCI15
the Metzger et al. [19] correlation. The Zukauskas [20] correlation for arrays of long circular
cylinders is also plotted in Figure 8 as a reference and comparison. It is given as,0.20.60.36DDNu0.35(S/X)RePr
(8)
The baseline empty tunnel data presented in Figure 8 is obtained using the results of the
current convective heat transfer coefficient measurements on the endwall with no pin fins present
in the channel. The correlation coefficients for the current measurements as well as the
mentioned previous experiments are summarized in Table 1.
Figure 9 shows the line-average Nusselt number variation with Reynolds number for the
current Circular, SEF and N fin arrays as well as for various other pin fin shapes investigated by
previous researchers. Before discussing the results presented in Figure 9, some issues on making
a consistent comparison with the previously published data will be addressed as follows:
1. In the current study, the Nusselt numbers and the Reynolds numbers are calculated using
the diameter of the Circular fins or the minor axis lengths of the SEF/N fins. These two are kept
equal in order to obtain the same effective frontal area that is needed to make consistent
comparisons of the pressure loss and wake flow field characteristics. However, different
definitions of pin fin diameters are used by previous researchers for different pin fin shapes in
the calculation of the Reynolds numbers and Nusselt numbers. For example, in their
investigation of elliptical and drop-shaped pin fins, Li et al. [9] and Chen et al. [10] used an
“equal circumference diameter” definition which gives diameters larger than the actual minor
axis lengths of the pin fins. Chyu et al [8] used one side length as the diameter definition both for
the cubic and diamond pin fins, but the actual effective frontal area for diamond fins corresponds
to the diagonal of the fins, not the side length. Therefore, in order to be able to make consistent
comparisons with the current study, necessary modifications are made to their correlations such
UZOL & CAMCI16
that the diameters corresponding to their actual effective frontal areas are used in the Nusselt
number and Reynolds number calculations.
2. Not all of the previously reported heat transfer data are obtained on the endwall. Some of
them are on the pins (e.g. Chyu et al [8]) and some are combined pin-endwall results (e.g. Li et
al. [9] and Chen et al. [10]). However, it is reported in Metzger and Haley [21] that the endwall
heat transfer coefficients are generally almost at the same level as the combined pin-endwall
averages.
Therefore, keeping in mind the points mentioned above, several observations can readily be
made:
a. Current measurements indicate that, as seen in Figure 9, the Nusselt number levels for
the Circular fin are higher than the levels for the SEF and N fin arrays. At the lowest Reynolds
number, the average Nusselt number for the circular fin array is 26% and 23% higher than the
average Nusselt numbers for the SEF and N fins, respectively. Similarly at the highest Reynolds
number the heat transfer level for the Circular fin array is 28.8% and 29.5% higher than the
respective values of the SEF and the N fin arrays.
b. The elliptical pin fin results of Li et al. [9] and the current results for SEF and N fins are
close to each other in the Reynolds number range of 30,000 and 90,000, but they deviate from
each other at Reynolds number below 30,000 (the experiments of Li et al [9] are actually
performed up to Reynolds numbers of 10,000. The curve fit equation given in their paper is used
for comparison at these higher Reynolds numbers). Note that the elliptical pin fins of Li et al. [9]
show a much weaker Reynolds number dependency than the SEF and N fins, as can be seen from
the exponents of the Reynolds numbers listed in Table 1.

UZOL & CAMCI17
c. It is also evident that the cubic and the diamond fins of Chyu et al. [8] have the highest
Nusselt numbers in the presented Reynolds number range whereas the elliptical fins (SEF, N and
Li et al. [9]) have the lowest values.
d. The variation of the oblong fins (at zero incidence angle, Metzger et al. [1]) and the
drop-shaped fins (Chen et al. [10]) are close to that of the current circular fins.
To summarize, the SEFs and the N fins seem to be the least effective devices in terms of
heat transfer enhancement among all other pin fin shapes. Particularly, the circular pin fins
perform about 27% better in average than the SEF and N fins in this Reynolds number range.
Furthermore, the elliptical pin fins, i.e. SEFs, N fins and elliptical fins of Li et al. [9], all seem to
have weaker Reynolds number dependency compared to the circular pin fins.
Table 1. Correlation coefficients for the current and previously published data for various pin finshapes. (NuD=aReD
b).
Pin Fin Shape a b
Circular – Current study 0.0776 0.7
SEF- Current Study 0.077 0.678
N – Current Study 0.0916 0.661
Circular - Metzger et al. [19], eqn. (7)(for x/d=2 and corrected for 2-rows using
Nu2/Nu10=0.9 as suggested inArmstrong and Winstanley [12])
0.096 0.69
Circular - Zukauskas [20]- eqn. (8)-long fins(for s/x=1 and Pr=0.707)
0.31 0.6
Cubic – Chyu et al. [8] 0.12 0.704
Diamond – Chyu et al. [8](modified using diagonal as D)
0.08 0.732
Oblong – Metzger et al. [1] 0.0479 0.752
Elliptical – Li et al. [9](modified using actual minor axis length as D)
0.392 0.53
Drop-shaped – Chen et al. [10](modified using actual minor axis length as D)
0.155 0.645
Empty Tunnel – Current study(based on the tunnel hydraulic diameter,
Dh=0.126 m)0.0239 0.823

UZOL & CAMCI18
TOTAL PRESSURE LOSS MEASUREMENTS
Procedure
Total pressure loss levels inside the wakes of the pin fin arrays are determined by
traversing a Kiel probe with 3.175 mm shield diameter across the test section 2D downstream of
the pin fin arrays and at the mid-plane. Measured total pressure data are used to calculate relative
total pressure loss created with respect to the inlet conditions. The per row total pressure drop (or
friction coefficient) is defined as,ρ
(9)
where ItP
is the inlet total pressure, WtP
is the total pressure in the wake, umax is the maximum
velocity in the test section and N is the number of pin fin rows in the array.
Results
The experiments are conducted in the same Reynolds number range as in the endwall heat
transfer measurements, i.e.18,000–86,000. Measured total pressure values inside the wake are
converted to friction coefficient values (Equation 9), which is an indication of the local pressure
loss created with respect to the inlet values. In previous pin fin research, the static pressure loss
across the pin fin array was used to calculate the friction coefficients (e.g. Metzger et al. [1],
Steuber and Metzger [2], Goldstein et al. [7], Chyu et al. [8], Li et al. [9], Chen et al. [10],
Metzger and Haley [21], Lau et al. [22], Chyu [23]), and the variation in the transverse direction
is not usually reported (i.e. static pressures are measured at a single point on the wall before and
after the pin fin arrays). In this study, however, complete transverse distributions of the total
pressure loss levels in the wakes of the pin fin arrays are measured, in order to be able to
compare the effects of the different wake structures of pin fins with different shapes. The total

UZOL & CAMCI19
pressure is a good indicator of the viscous losses generated by different pin fin geometries. Keep
in mind that all the pin fins used in the current experiments have the same effective frontal area.
Figure 10 shows the measured friction coefficient distributions inside the wakes of the
Circular, SEF and N fin arrays. It is evident that there is substantial reduction in the total
pressure loss in the case of SEF and N fin arrays. The levels for the SEF and the N fin are close
to each other, but N fin creates slightly less pressure loss inside the wake. In case of the circular
fin array, the wake region created by the two fins in the second-row of the array are clearly
visible in the form of two peaks in the friction coefficient distribution. Wakes of the first-row
fins are not distinctly visible in case of circular pin fins whereas they are clearly identifiable for
the SEFs for all Reynolds numbers in the form of two outer peaks in the distributions (the two
middle peaks are created due to the wakes of the two fins in the second-row for SEFs). In case of
N fins, the first-row wakes are identifiable up to Reynolds number 60,000. However, for higher
Reynolds numbers, the individual wake signatures become much less obvious, even for the two
second-row fins. The significant differences between the pressure loss distribution patterns of
Circular, SEF and N fin arrays indicate that the wake structures and mixing mechanisms must be
substantially different. As will be explained in detail in the next section from the results of the
two-dimensional PIV measurements, in case of SEFs and N fins, the wakes of the first row fins
do not mix or interact with each other or with the fins in the second-row, but instead, the
localized losses created inside the individual wakes are carried downstream separately. In case of
circular fins, however, the wakes of the first row fins interact with the second row pin fins,
resulting in an early separation from the second-row fins as well as bending of the first-row fin
wakes. These interactions generate a relatively large wake zone behind the second-row, which in
turn results in high levels of total pressure loss in this region.

UZOL & CAMCI20
Figure 11 shows the line-average friction coefficient variation with Reynolds number. It is
clear that the circular fin array generates substantially high total pressure loss. The N fin has the
lowest pressure loss generation and the SEF has slightly higher levels in the Reynolds number
range. The average loss levels for the circular fin are 44% and 52% higher than the levels of the
SEF and N fins, respectively, for the lowest Reynolds number. For the highest Reynolds number,
the circular fin has 61% and 73% more loss with respect to the SEF and N fins, respectively. In
case of circular pin fins, the relatively flat distribution of the average friction coefficient
indicates that it is almost Reynolds number independent in this range. However, for the SEFs and
the N fins there is a strong Reynolds number dependency. N fins have a higher dependency than
the SEFs. The loss levels decrease relatively fast with Reynolds number whereas they almost do
not change for the circular fins. This can also be seen by comparing the exponent of the ReD in
the curve fit line equations for each pin fin shape, as given below:
0155.0DRe321.0f −= (Circular Fin) (10)
2373.0DRe539.1f −= (SEF) (11)
3614.0DRe569.4f −= (N fin) (12)
The relation between the heat transfer enhancement and the total pressure loss is presented
in Figure 12. In this figure, 0Nu is determined from the empty tunnel correlation given in Table
1, as explained before. The friction coefficient, f0, is calculated from the Blasius power-law
correlation (Kays and Crawford [24]),
25.0D0 Re078.0f −= (13)
Figure 12 shows that, as the relative friction coefficient increases, the relative heat transfer
enhancement decreases sharply for the SEF and N fin arrays. The main reason is that as the
Reynolds number increases, the average friction coefficient levels decrease for the SEFs and N

UZOL & CAMCI21
fins. Since f0 also decreases, f/f0 remains almost constant while the heat transfer enhancement
levels are decreasing. However for the circular pin fins, since the average friction coefficient
almost stays constant in the current Reynolds number range, f/f0 also increases slowly with
increasing Reynolds number. This results in the relatively slow decrease in the heat transfer
levels for circular fins as f/f0 increases.
A performance index f/Nu D can be used, similar to Chyu [23], to describe the overall
performance of pin fin arrays with different pin shapes. This parameter basically represents heat
transfer per unit total pressure loss. Figure 13 shows the variation of this performance index
(normalized by the empty tunnel Nusselt number and the smooth channel friction coefficient,
00 f/Nu ) with Reynolds number for each pin fin shape. The results indicate that the SEF and the
N fin have much higher performance indices than the circular fin. At the lowest Reynolds
number, the performance indices of the SEF and the N fin are 28% and 40% higher than the
index for the circular fins, respectively. Similarly, at the highest Reynolds number, the
performance index increase is 49% and 64% for SEFs and N fins, respectively. It is also
interesting to note that the performance index for the circular pins decrease relatively fast as the
Reynolds number is increased, whereas for the SEFs and the N fins, the performance index
decrease is much slower. Furthermore, in the case of N fins, it almost stays constant in the
Reynolds number range. The main reason behind this is that, as the Reynolds number is
increased, the friction coefficient levels for the circular fins stay almost constant, whereas those
of the SEFs and the N fins keep decreasing. This results in the relatively small change of the
performance index for the SEFs and the N fins, while there exists a large drop in performance for
the circular fin arrays.

UZOL & CAMCI22
WAKE FLOW FIELD MEASUREMENTS
In order to better understand the wake flow field structure and loss mechanisms of the
Circular, SEF and N fin arrays, two-dimensional Particle Image Velocimetry (PIV)
measurements are performed inside the wake regions for a Reynolds number of, 18,000 and on
the mid-plane of the test section. Although the three dimensional effects may be significant for
these short (H/D=1.5) pin fins, these 2D measurements will provide invaluable information about
the turbulence and velocity field structures of the wakes of the elliptical and circular pin fin
arrays.
Procedure
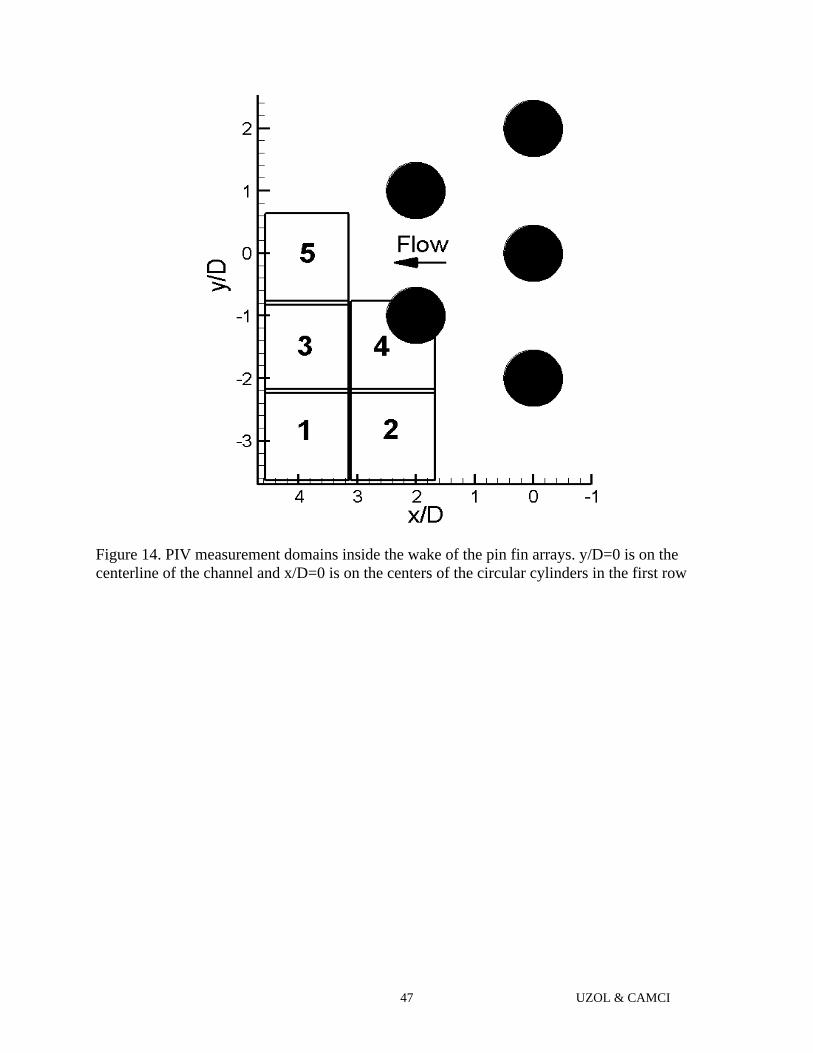
The wake flow field is divided into five separate PIV measurement domains in the mid-
plane, covering the half-width of the tunnel and up to 2D downstream of the second row (Figure
14). The flow field is seeded with fog particles using a commercial fog generator and is
illuminated using a 50 mJ/pulse Nd:YAG laser sheet with an emitted radiation wavelength of
532 nm. Pairs of particle images are captured using a 1k x 1k pixels2 Kodak Megaplus ES 1.0
digital camera which is fully synchronized with the pulsating laser sheet. After the camera and
the laser sheet are aligned normal to each other, 90 instantaneous image pairs are collected for
each PIV domain. The estimated level of uncertainty in using 90 instantaneous samples for
calculating the ensemble averages of u and v components of the velocity vector are about ±10%,
calculated using the theoretical standard error estimation procedures as described in Uzol [13]
and Ullum et al. [25]. The image maps are then divided into 32 x 32 pixels2 interrogation areas
and 25% overlap is used which generated 1722 vectors in each vector map. All 90 image pairs
are cross-correlated, peak-validated, moving averaged/filtered and then ensemble averaged in
order to obtain the true-mean flow field inside the wakes of the pin fin arrays. The ensemble-

UZOL & CAMCI23
averaged values for the x and y components of the velocity vector for each and every
interrogation area in the vector map are calculated using,( ,y) ( ,y)∑ ( ,y) ( ,y)∑
(15)
where M is the total number of samples used in the ensemble averaging process. The turbulent
kinetic energy is calculated using,
()()M22iii111k(x,y)u(x,y)u(x,y)v(x,y)v(x,y)2M +∑(16)
Results
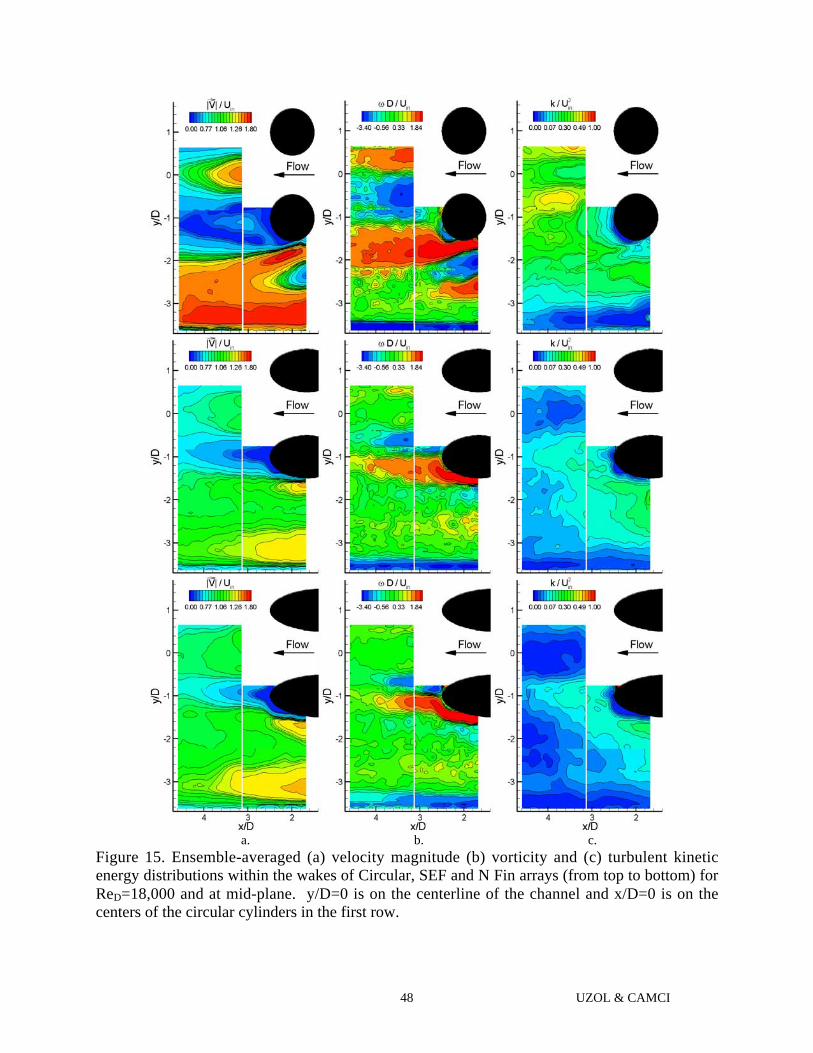
Figure 15 shows the ensemble averaged velocity magnitude, vorticity as well as turbulent
kinetic energy distributions within the wakes of the Circular, SEF and N fin arrays at
ReD=18,000. The Circular fin array creates a relatively large low momentum wake zone
compared to the SEF and N fin arrays. The separation on the Circular fins at the second row
occurs very early. In fact, close examination of the data reveals that the separation occurs around
80° point from the leading edge, indicating a laminar separation is occurring on the fins in the 2nd
row. The separation on the SEFs and N fins occur very close to their trailing edge because of the
relatively smooth acceleration and deceleration of the flow due to the shape of those fins. Hence
SEFs and N fins have a much smaller wake region compared to Circular fins. This is basically
the main reason that the SEF and N fin arrays have very low total pressure loss levels compared
to the Circular fin arrays.
The wake of the bottom fin in the 1st row is also clearly visible in Figure 15. This wake is
evident as a region with low velocity magnitude and opposite signs of vorticity around x/D=1.8
and y/D=-2.4. This wake region is most obvious in case of Circular pin fins. As is evident from
Figure 15, the trajectory of this wake shows substantial differences between the three pin fin

UZOL & CAMCI24
arrays. In case of Circular fins it is significantly bent towards the sidewall, for SEF array it is
relatively straight and for N fin array it is slightly bent towards the mid-channel. The bending
towards the sidewall in case of Circular fins is primarily due to the early laminar separation that
exists on the fins in the second row. This early separation pushes the upstream wake towards the
sidewall and as a result, after the second row of fins, a very wide area of the flow is occupied by
low momentum wakes. This interaction of the first row fin wakes with the second row fins and
wakes is probably the main reason behind the increased total pressure loss and turbulence levels
within the wake flow field. In case of SEFs and N fins, the wakes of the first row fins convect
downstream with minimal interaction with the second row fins and wakes. They get advected
separately while getting diffused. This is basically the main reason that the first row wakes are
visible in the friction coefficient distribution plots presented in Figure 10. Also, in case of N fins,
note that the peaks in the friction coefficient distributions corresponding to the second row of
pins (Figure 10, ReD=18,000, at y/D=±0.7) are much closer to each other compared to the SEF
and Circular fin distributions. This is consistent with the slight bending of the 1st row N fin
wakes towards the mid-channel as observed from the current PIV measurements.
The turbulent kinetic energy levels within the wake of the Circular fin array are higher than
those for the SEF and the N fin arrays. For all pin fin arrays, the turbulence is mainly generated
within the wakes of the 1st and 2nd row fins and then convected downstream. In case of Circular
fins however, an additional turbulence production mechanism exists which is due to the jet-like
flow in between the two fins in the second row. Because of this accelerated flow zone, very high
velocity gradients are present at the edges of this jet-like region that generate additional
turbulence around the centerline. This is probably the reason for the enhanced local heat transfer
levels around the centerline in case of Circular pin fins as discussed before. In case of SEFs and
UZOL & CAMCI25
N fins, the local heat transfer enhancement levels were a minimum around the centerline and this
correlates with the relatively low turbulent kinetic energy levels in this region. The turbulence
levels within the wakes of the SEF and N fin arrays are higher than those at the centerline. This
is also consistent with the heat transfer coefficient distributions in which two peaks in the wake
region of the SEFs and N fins were observed.
CONCLUSIONS
Endwall heat transfer, total pressure loss and wake flow field measurements are conducted
to determine the characteristics of the elliptical pin fins (Standard Elliptical Fin and the N fin) in
staggered array configurations and the results are compared to Circular pin fin arrays. A two row
arrangement is used with fins having H/D=1.5 and S/D=X/D=2. The experiments are conducted
in a Reynolds number range of ReD=18,000 to ReD=86,000.
The heat transfer enhancement levels for the Circular fin array are about 27% higher in
average than the levels for the SEF and N fin arrays. The levels for the SEF and N fin arrays are
close to each other. Significant differences between the local enhancement patterns of the
circular and elliptical pin fin arrays are observed. Furthermore, the SEFs and N fins have weaker
Reynolds number dependency compared to the Circular pin fins. It is determined that, in terms of
heat transfer enhancement performance, the SEFs and the N fins not only have lower
performance compared to the Circular fins but also they seem to be the least effective devices
among the other pin fin shapes investigated by previous researchers.
It is evident that there is substantial reduction in the total pressure loss in the case of SEF
and N fin arrays. The levels for the SEF and the N fin are close to each other, but N fin creates
slightly less pressure loss inside the wake. The average loss levels for the circular fin are 44%

UZOL & CAMCI26
and 52% higher than the levels of the SEF and N fins, respectively, for the lowest Reynolds
number. For the highest Reynolds number, the circular fin has 61% and 73% more loss with
respect to the SEF and N fins, respectively. In case of circular pin fins, the relatively flat
distribution of the average friction coefficient indicates that it is almost Reynolds number
independent in this range. However, for the SEFs and the N fins there is a strong Reynolds
number dependency. A performance index, f/Nu D , representing the heat transfer per unit total
pressure loss is used to describe the overall performance of pin fin arrays with different pin
shapes. The results show that the SEF and the N fin have much higher performance indices than
the circular fin. The performance index for the Circular pins decreases quite fast as the Reynolds
number is increased, whereas for the SEFs and the N fins, the performance index decrease is
much slower. In fact, in the case of N fins, it almost stays constant in the Reynolds number
range.
The wake flow field measurements show that the Circular fin array creates a relatively
large low momentum wake zone compared to the SEF and N fin arrays. A laminar separation
occurs on the fins in the second row. The wake trajectories of the 1st row fins for Circular, SEF
and N fin arrays are substantially different from each other. In case of Circular fins it is
significantly bent towards the sidewall, for SEF array it is relatively straight and for N fin array it
is slightly bent towards the mid-channel. The turbulent kinetic energy levels within the wake of
the Circular fin array are higher than those for the SEF and the N fin arrays. For all pin fin
arrays, the turbulence is mainly generated within the wakes of the 1st and 2nd row fins and then
convected downstream. In case of Circular fins however, an additional turbulence production
mechanism exists which is due to the jet-like flow in between the two fins in the second row.

UZOL & CAMCI27
NOMENCLATURE
A Surface area
D Circular fin diameter or SEF/N fin minor axis length
f Friction coefficient (total pressure loss coefficient)
h Convective heat transfer coefficient
H Pin fin height
k Turbulent kinetic energy
kair Thermal conductivity
N Number of pin fin rows
NuD Nusselt number, hD/kair
M Total number of instantaneous PIV vector maps
Pt Total pressure
Pr Prandtl Number
q ′′ Heat flux on the heater strip
R Resistance
ReD Reynolds number, umaxD/ν
S Pin fin array transverse spacing
SEF Standard Elliptical Fin
t Wall thickness
T Temperature
u Velocity in x-direction
v Velocity in y-direction
V Voltage

UZOL & CAMCI28
X Pin fin array streamwise spacing
Subscripts
∞ Free stream
A Wall ambient side
av Average
C Conduction heat loss
exit Inside the wake region
S Heater strip
in Inlet
max Maximum velocity in the test section
R Radiation heat loss
T Total generated
W Wall
Greek
ε Surface emissivity
σ Stefan-Boltzmann constant
REFERENCES
[1] Metzger, D.E., Fan C.S., Haley S.W., 1984, “Effects of Pin Shape and Array Orientation on
Heat Transfer and Pressure Loss in Pin Fin Arrays,” Journal of Engineering for Gas Turbines and
Power, Vol. 106, pp. 252-257.
[2] Steuber G.D. and Metzger D.E., 1986, “Heat Transfer and Pressure Loss Performance for
Families of Partial Length Pin Fin Arrays in High Aspect Ratio Rectangular Ducts,” Proc. of the
8th Int’l Heat Trans. Conf., Vol. 6, pp. 2915-2920.

UZOL & CAMCI29
[3] Arora S.C. and Abdel-Messeh W., 1990, “Characteristics of Partial Length Circular Pin Fins
As Heat Transfer Augmentors for Airfoil Internal Cooling Passages,” Journal of
Turbomachinery, Vol. 112, pp. 559-565.
[4] Wang B.G. and Ji H.H., 1987, “An Experimental Investigation of Heat Transfer and Friction
Loss in Taper Pin Fin Configurations of Air Cooled Turbine Blades,” Proc. of the ASME-JSME
Thermal Engineering Joint Conference, Vol. 4, pp.127-133.
[5] Grannis V.B. and Sparrow E.M., 1991, “Numerical Simulation of Fluid Flow through an
Array of Diamond Shaped Pin Fins,” Numerical Heat Transfer, Part A Vol. 19, pp. 381-403.
[6] Minakami K., Mochizuki S., Murata A., Yagi Y., Iwasaki H., 1992, “Visualization of Flow
Mixing Mechanisms in Pin Fin Arrays,” Proc. of the Int’l Symposium on Flow Visualization, pp.
504-508.
[7] Goldstein R. J., Jabbari M. Y., Chen S. B., 1994, “Convective Mass Transfer and Pressure
Loss Characteristics of Staggered Short Pin Fin Arrays,” International Journal of Heat and Mass
Transfer, Vol. 37, pp. 149-160.
[8] Chyu M.K., Hsing Y.C., Natarajan V., 1996, “Convective Heat Transfer of Cubic Pin Fin
Arrays in a Narrow Channel,” Proc. of the International Gas Turbine and Aeroengine Congress
and Exposition, Birmingham, UK, 96-GT-201.
[9] Li Q., Chen Z., Flechtner U., Warnecke H. J., 1998, “Heat Transfer and Pressure Drop
Characteristics in Rectangular Channels with Elliptic Pin Fins,” International Journal of Heat and
Fluid Flow, Vol. 19, pp. 245-250.
[10] Chen Z., Li Q., Meier D., Warnecke H. J., 1997, “Convective Heat Transfer and Pressure
Loss in Rectangular Ducts with Drop-shaped Pin Fins,” Heat and Mass Transfer, Vol. 33, pp.
219-224.

UZOL & CAMCI30
[11] Abbott I. H. and Von Doenhoff A. E., 1959, Theory of Wing Sections, Dover Publications.
[12] Armstrong J. and Winstanley D., 1988, “A Review of Staggered Array Pin Fin Heat
Transfer for Turbine Cooling Applications,” Journal of Turbomachinery, Vol. 110, pp. 94-103.
[13] Uzol O., 2000, “Novel Concepts and Geometries As Alternatives to Conventional Circular
Pin Fins for Gas Turbine Blade Cooling Applications,” Ph.D. Thesis, Pennsylvania State
University, University Park, PA.
[14] Camci C., Kim K., Hippensteele S. A., 1992, “A new Hue-Capturing Technique for the
Quantitative Interpretation of Liquid Crystal Images Used in Convective Heat Transfer Studies,”
Journal of Turbomachinery, Vol. 114, No. 4, pp. 765-775.
[15] Niblack W., 1986, An Introduction to Digital Image Processing, Prentice/Hall International.
[16] Russ J.C., 1995, The Image Processing Handbook, CRC Press.
[17] Wiedner B. G. and Camci C., 1996, “Determination of Convective Heat Flux on Steady-
State Heat Transfer Surfaces with Arbitrarily Specified Boundaries,” Journal of Heat Transfer,
Vol. 118, No. 4, pp. 1-8.
[18] Moffat R.J., 1988, “Describing the Uncertainties in Experimental Results,” Experimental
Thermal and Fluid Science, Vol. 1, pp. 3-17.
[19] Metzger D.E., Shepard W. B., Haley S.W., 1986, “Row Resolved Heat Transfer Variations
in Pin Fin Arrays Including Effects of Non-uniform Arrays and Flow Convergence,” Proc. of
Int’l Gas Turbine Conference and Exhibit, Dusseldorf, West Germany, 86-GT-132.
[20] Zukauskas A., 1972, “Heat Transfer from Tubes in Crossflow,” Advances in Heat Transfer,
Vol. 8 pp. 93-160.
[21] Metzger D.E., Haley S.W., 1982a, “Heat Transfer Experiments and Flow Visualization for
Arrays of Short Pin Fins,” ASME Paper No. 82-GT-138.

UZOL & CAMCI31
[22] Lau S.C., Han J.C., Batten T., 1989, “Heat Transfer, Pressure Drop and Mass Flow Rate in
Pin Fin Channels with Long and Short Trailing Edge Ejection Holes,” Journal of
Turbomachinery, Vol. 111, pp. 116-123
[23] Chyu M.K., 1990, “Heat Transfer and Pressure Drop for Short Pin-fin Arrays with Pin
Endwall Fillet,” Journal of Heat Transfer, Vol. 112, pp. 926-932.
[24] Kays W.M., Crawford M.E., 1980, Convective Heat and Mass Transfer, McGraw-Hill, New
York.
[25] Ullum U., Scmidt J.J., Larsen P.S., McCluskey D.R., 1998, “Statistical Analysis and
Accuracy of PIV Data,” Journal of Visualization, Vol. 1, pp. 205-216.

UZOL & CAMCI32
LIST OF FIGURE CAPTIONS
Figure 1. Low Speed Heat Transfer Research Facility at Pennsylvania State University
Figure 2. The layout and the dimensions of the acrylic test section
Figure 3. The relative dimensions of the Circular Fin, Standard Elliptical Fin (SEF) and the N fin
(D=0.0508 m)
Figure 4. Endwall heat transfer measurement setup using Liquid Crystal Thermography.
Figure 5. A typical image of the liquid crystal sprayed heater strip showing the pixel columns
and rows used for extracting the hue information along the centerline of the heater strip.
Figure 6. Relative convective heat transfer coefficient distribution on the endwall for circular
(O), SEF (∆) and N (+) fin arrays, 2D downstream (h0: baseline empty tunnel value). ReD is
calculated using the maximum velocity and the circular fin diameter, D=0.0508 m (or SEF/N fin
minor axis length which is equal to D).
Figure 7. Relative Nusselt number variation with Reynolds number. The Nusselt numbers are
calculated using the circular fin diameter, D=0.0508 m. is based on empty tunnel data.
Figure 8. Average Nusselt number vs. Reynolds number comparison of the current
measurements with previously reported correlations for staggered circular pin fin arrays. Empty
tunnel results are the current measured data with no pin fins.
Figure 9. Average Nusselt number vs. Reynolds number comparison of Circular, SEF and N fin
arrays. Results of previously reported measurements for various pin fin shapes are also plotted
for reference and comparison. Empty tunnel results are the current measured data with no pin
fins.
Figure 10. Friction coefficient distributions inside the wakes of circular (O), SEF (∆) and N (+)
fin arrays, 2D downstream.

UZOL & CAMCI33
Figure 11. Average friction coefficient vs. Reynolds number for Circular, SEF and N fin arrays.
Figure 12. Relative Nusselt number variation with relative total pressure loss. 0Nu is the baseline
empty tunnel Nusselt number obtained from the correlation listed in Table 1 and modified for
using the pin fin diameter instead of hydraulic diameter; f0 is calculated using the Blasius power-
law correlation (Kays and Crawford [24]).
Figure 13. Performance index ( f/Nu D ) variation with Reynolds number for Circular, SEF and
N fin arrays. Values are normalized by 00 f/Nu .
Figure 14. PIV measurement domains inside the wake of the pin fin arrays. y/D=0 is on the
centerline of the channel and x/D=0 is on the centers of the circular cylinders in the first row
Figure 15. Ensemble-averaged (a) velocity magnitude (b) vorticity and (c) turbulent kinetic
energy distributions within the wakes of Circular, SEF and N Fin arrays (from top to bottom) for
ReD=18,000 and at mid-plane. y/D=0 is on the centerline of the channel and x/D=0 is on the
centers of the circular cylinders in the first row.

UZOL & CAMCI34
Figure 1. Low Speed Heat Transfer Research Facility at Pennsylvania State University
UZOL & CAMCI35
Figure 2. The layout and the dimensions of the acrylic test section

UZOL & CAMCI36
Figure 3. The relative dimensions of the Circular Fin, Standard Elliptical Fin (SEF) and the N fin(D=0.0508 m)

UZOL & CAMCI37
Figure 4. Endwall heat transfer measurement setup using Liquid Crystal Thermography.

UZOL & CAMCI38
Figure 5. A typical image of the liquid crystal sprayed heater strip showing the pixel columnsand rows used for extracting the hue information along the centerline of the heater strip.

UZOL & CAMCI39
ReD=18,000 ReD=31,000
ReD=46,000 ReD=60,000
ReD=76,000 ReD=86,000
Figure 6. Relative convective heat transfer coefficient distribution on the endwall for circular(O), SEF (∆) and N (+) fin arrays, 2D downstream (h0: baseline empty tunnel value). ReD iscalculated using the maximum velocity and the circular fin diameter, D=0.0508 m (or SEF/N finminor axis length which is equal to D).

UZOL & CAMCI40
Figure 7. Relative Nusselt number variation with Reynolds number. The Nusselt numbers arecalculated using the circular fin diameter, D=0.0508 m. is based on empty tunnel data.

UZOL & CAMCI41
Figure 8. Average Nusselt number vs. Reynolds number comparison of the currentmeasurements with previously reported correlations for staggered circular pin fin arrays. Emptytunnel results are the current measured data with no pin fins.

UZOL & CAMCI42
Figure 9. Average Nusselt number vs. Reynolds number comparison of Circular, SEF and N finarrays. Results of previously reported measurements for various pin fin shapes are also plottedfor reference and comparison. Empty tunnel results are the current measured data with no pinfins.

UZOL & CAMCI43
ReD=18,000 ReD=31,000
ReD=46,000 ReD=60,000
ReD=76,000 ReD=86,000
Figure 10. Friction coefficient distributions inside the wakes of circular (O), SEF (∆) and N (+)fin arrays, 2D downstream.

UZOL & CAMCI44
Figure 11. Average friction coefficient vs. Reynolds number for Circular, SEF and N fin arrays.

UZOL & CAMCI45
Figure 12. Relative Nusselt number variation with relative total pressure loss. 0Nu is the baselineempty tunnel Nusselt number obtained from the correlation listed in Table 1 and modified forusing the pin fin diameter instead of hydraulic diameter; f0 is calculated using the Blasius power-law correlation (Kays and Crawford [24]).

UZOL & CAMCI46
Figure 13. Performance index ( f/Nu D ) variation with Reynolds number for Circular, SEF and
N fin arrays. Values are normalized by 00 f/Nu .
UZOL & CAMCI47
Figure 14. PIV measurement domains inside the wake of the pin fin arrays. y/D=0 is on thecenterline of the channel and x/D=0 is on the centers of the circular cylinders in the first row
UZOL & CAMCI48
a. b. c.Figure 15. Ensemble-averaged (a) velocity magnitude (b) vorticity and (c) turbulent kineticenergy distributions within the wakes of Circular, SEF and N Fin arrays (from top to bottom) forReD=18,000 and at mid-plane. y/D=0 is on the centerline of the channel and x/D=0 is on thecenters of the circular cylinders in the first row.