Ending the cheating and collusion: Using real-world CO ... the CO2... · 1 . a study by Ending the...
21
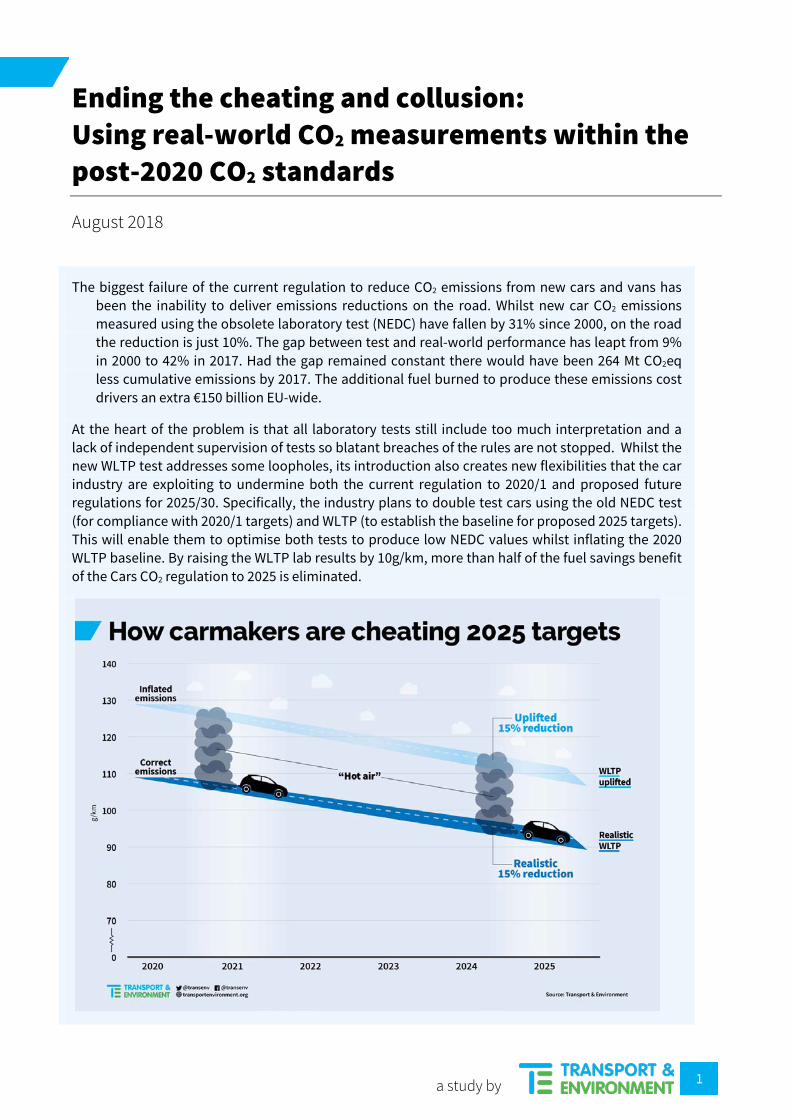
1 a study by Ending the cheating and collusion: Using real-world CO 2 measurements within the post-2020 CO 2 standards August 2018 The biggest failure of the current regulation to reduce CO2 emissions from new cars and vans has been the inability to deliver emissions reductions on the road. Whilst new car CO2 emissions measured using the obsolete laboratory test (NEDC) have fallen by 31% since 2000, on the road the reduction is just 10%. The gap between test and real-world performance has leapt from 9% in 2000 to 42% in 2017. Had the gap remained constant there would have been 264 Mt CO2eq less cumulative emissions by 2017. The additional fuel burned to produce these emissions cost drivers an extra €150 billion EU-wide. At the heart of the problem is that all laboratory tests still include too much interpretation and a lack of independent supervision of tests so blatant breaches of the rules are not stopped. Whilst the new WLTP test addresses some loopholes, its introduction also creates new flexibilities that the car industry are exploiting to undermine both the current regulation to 2020/1 and proposed future regulations for 2025/30. Specifically, the industry plans to double test cars using the old NEDC test (for compliance with 2020/1 targets) and WLTP (to establish the baseline for proposed 2025 targets). This will enable them to optimise both tests to produce low NEDC values whilst inflating the 2020 WLTP baseline. By raising the WLTP lab results by 10g/km, more than half of the fuel savings benefit of the Cars CO2 regulation to 2025 is eliminated.
Transcript of Ending the cheating and collusion: Using real-world CO ... the CO2... · 1 . a study by Ending the...
1
a study by
Ending the cheating and collusion: Using real-world CO2 measurements within the post-2020 CO2 standards August 2018
The biggest failure of the current regulation to reduce CO2 emissions from new cars and vans has been the inability to deliver emissions reductions on the road. Whilst new car CO2 emissions measured using the obsolete laboratory test (NEDC) have fallen by 31% since 2000, on the road the reduction is just 10%. The gap between test and real-world performance has leapt from 9% in 2000 to 42% in 2017. Had the gap remained constant there would have been 264 Mt CO2eq less cumulative emissions by 2017. The additional fuel burned to produce these emissions cost drivers an extra €150 billion EU-wide.
At the heart of the problem is that all laboratory tests still include too much interpretation and a lack of independent supervision of tests so blatant breaches of the rules are not stopped. Whilst the new WLTP test addresses some loopholes, its introduction also creates new flexibilities that the car industry are exploiting to undermine both the current regulation to 2020/1 and proposed future regulations for 2025/30. Specifically, the industry plans to double test cars using the old NEDC test (for compliance with 2020/1 targets) and WLTP (to establish the baseline for proposed 2025 targets). This will enable them to optimise both tests to produce low NEDC values whilst inflating the 2020 WLTP baseline. By raising the WLTP lab results by 10g/km, more than half of the fuel savings benefit of the Cars CO2 regulation to 2025 is eliminated.
2
a study by
The solution is to measure real-world fuel efficiency using fuel consumption meters or real-world tests, which will reduce the manipulation of regulations. The Commission’s own experts recommended such an approach but the Commission failed to follow through with effective proposals and are opposing strong controls. Co-decision makers in the European Parliament and Member States now need to finish the job by amending the post-2020 car and van proposals. If the WLTP loopholes in the regulation are closed, the EU will save an additional 108 Mt CO2eq in cumulative emissions between 2020 and 2030. If the loopholes are not closed, the fuel burned to produce these emissions would cost drivers an extra €57 billion and real-world emissions will only reduce by 12% between 2020/1 and 2030, which is a huge blow to the goal of tackling transport CO2 emissions. Raising the real-world CO2 reduction to 50% would increase those benefits to 507 Mt CO2eq and €220 billion respectively.
The manipulation of the WLTP test to uplift measured values is extremely unlikely to have happened without collusion between companies. Reporting higher CO2 emissions would be a competitive disadvantage as cars are taxed on the basis of their CO2 emissions. The evidence presented here, supported by a non-paper from the European Commission, shows that elevating CO2 emissions on the WLTP test is clearly happening. This strongly suggests there must have been agreement between carmakers that all would adopt similar practices. Ongoing cartel investigations must be extended to investigate this issue.
3
a study by
1. Background This paper updates a previous analysis (published in April 2018) examining the way carmakers have manipulated past CO2 regulations and the way they are trying to do so for future regulations. This briefing strengthens the analysis providing new evidence of the impact of the test manipulation in terms of additional CO2 emitted and higher fuel bills for drivers. It also presents new data further demonstrating how carmakers are seeking to reduce the stringency of the proposed 2025 and 2030 targets and complements the recent analysis by the European Commission. Finally the paper examines the effectiveness of the Commission's proposed solutions to prevent test manipulation and puts forward more effective solutions.
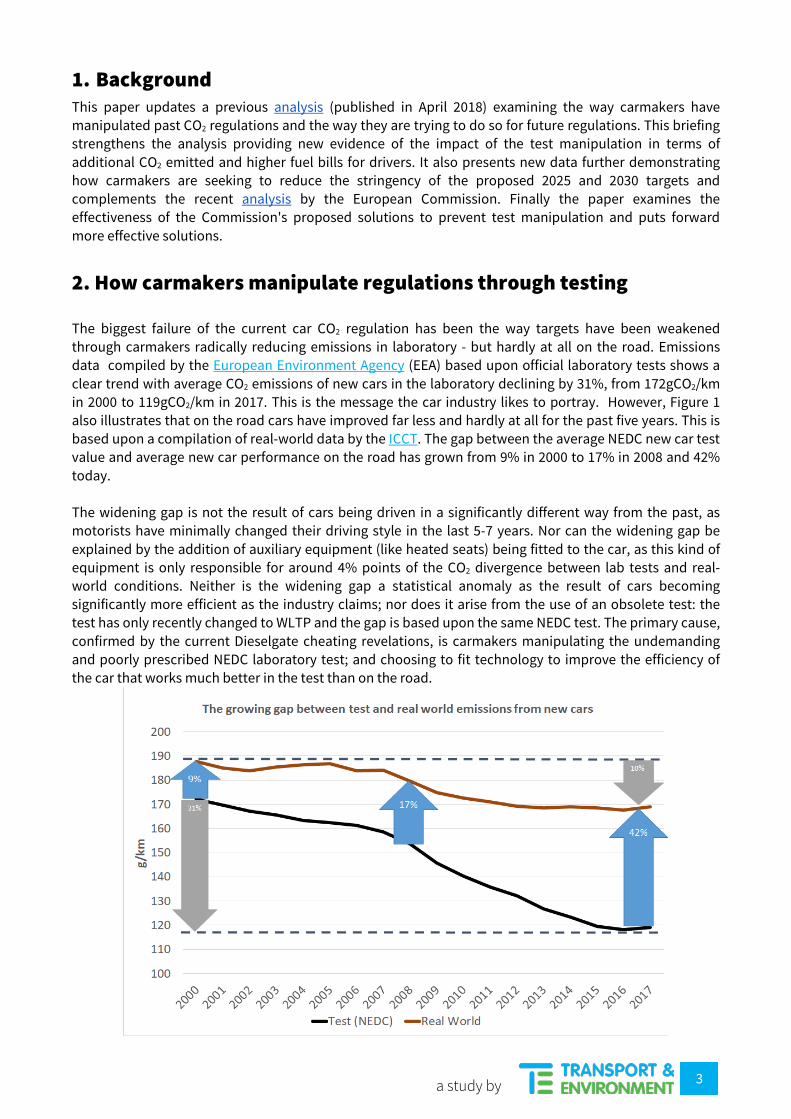
2. How carmakers manipulate regulations through testing The biggest failure of the current car CO2 regulation has been the way targets have been weakened through carmakers radically reducing emissions in laboratory - but hardly at all on the road. Emissions data compiled by the European Environment Agency (EEA) based upon official laboratory tests shows a clear trend with average CO2 emissions of new cars in the laboratory declining by 31%, from 172gCO2/km in 2000 to 119gCO2/km in 2017. This is the message the car industry likes to portray. However, Figure 1 also illustrates that on the road cars have improved far less and hardly at all for the past five years. This is based upon a compilation of real-world data by the ICCT. The gap between the average NEDC new car test value and average new car performance on the road has grown from 9% in 2000 to 17% in 2008 and 42% today. The widening gap is not the result of cars being driven in a significantly different way from the past, as motorists have minimally changed their driving style in the last 5-7 years. Nor can the widening gap be explained by the addition of auxiliary equipment (like heated seats) being fitted to the car, as this kind of equipment is only responsible for around 4% points of the CO2 divergence between lab tests and real-world conditions. Neither is the widening gap a statistical anomaly as the result of cars becoming significantly more efficient as the industry claims; nor does it arise from the use of an obsolete test: the test has only recently changed to WLTP and the gap is based upon the same NEDC test. The primary cause, confirmed by the current Dieselgate cheating revelations, is carmakers manipulating the undemanding and poorly prescribed NEDC laboratory test; and choosing to fit technology to improve the efficiency of the car that works much better in the test than on the road.
4
a study by
Figure 1
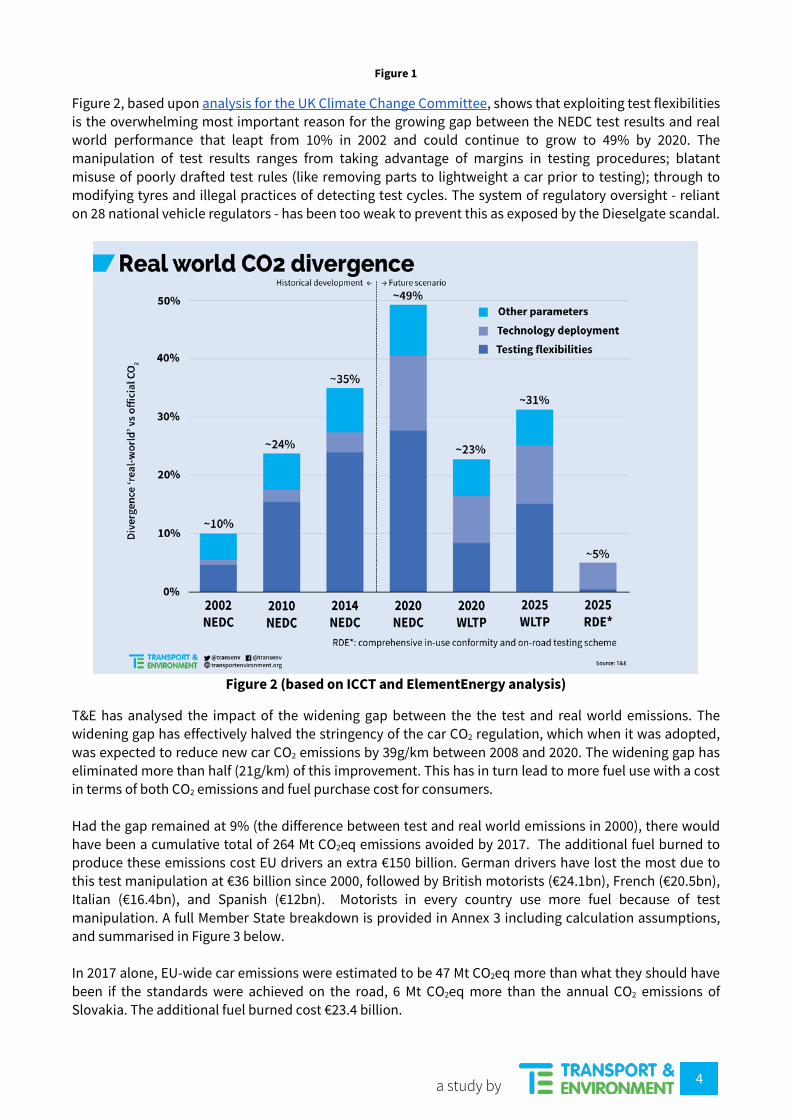
Figure 2, based upon analysis for the UK Climate Change Committee, shows that exploiting test flexibilities is the overwhelming most important reason for the growing gap between the NEDC test results and real world performance that leapt from 10% in 2002 and could continue to grow to 49% by 2020. The manipulation of test results ranges from taking advantage of margins in testing procedures; blatant misuse of poorly drafted test rules (like removing parts to lightweight a car prior to testing); through to modifying tyres and illegal practices of detecting test cycles. The system of regulatory oversight - reliant on 28 national vehicle regulators - has been too weak to prevent this as exposed by the Dieselgate scandal.
Figure 2 (based on ICCT and ElementEnergy analysis)
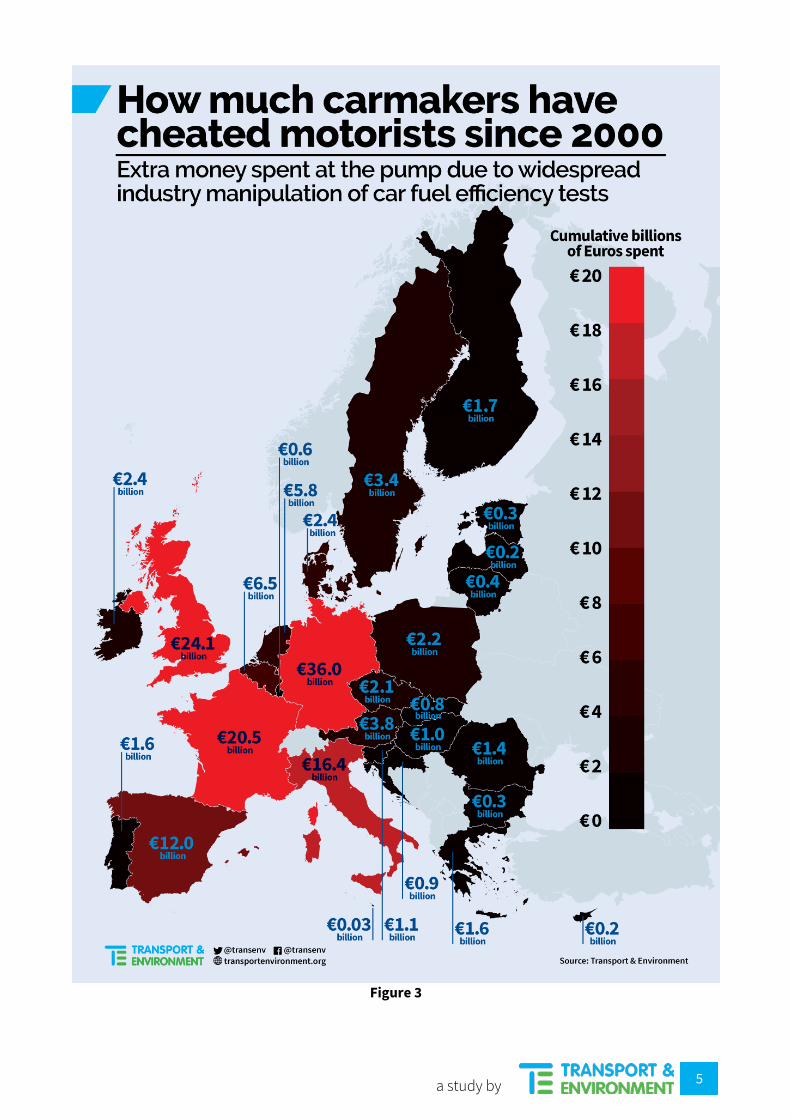
T&E has analysed the impact of the widening gap between the the test and real world emissions. The widening gap has effectively halved the stringency of the car CO2 regulation, which when it was adopted, was expected to reduce new car CO2 emissions by 39g/km between 2008 and 2020. The widening gap has eliminated more than half (21g/km) of this improvement. This has in turn lead to more fuel use with a cost in terms of both CO2 emissions and fuel purchase cost for consumers. Had the gap remained at 9% (the difference between test and real world emissions in 2000), there would have been a cumulative total of 264 Mt CO2eq emissions avoided by 2017. The additional fuel burned to produce these emissions cost EU drivers an extra €150 billion. German drivers have lost the most due to this test manipulation at €36 billion since 2000, followed by British motorists (€24.1bn), French (€20.5bn), Italian (€16.4bn), and Spanish (€12bn). Motorists in every country use more fuel because of test manipulation. A full Member State breakdown is provided in Annex 3 including calculation assumptions, and summarised in Figure 3 below. In 2017 alone, EU-wide car emissions were estimated to be 47 Mt CO2eq more than what they should have been if the standards were achieved on the road, 6 Mt CO2eq more than the annual CO2 emissions of Slovakia. The additional fuel burned cost €23.4 billion.
5
a study by
Figure 3
6
a study by
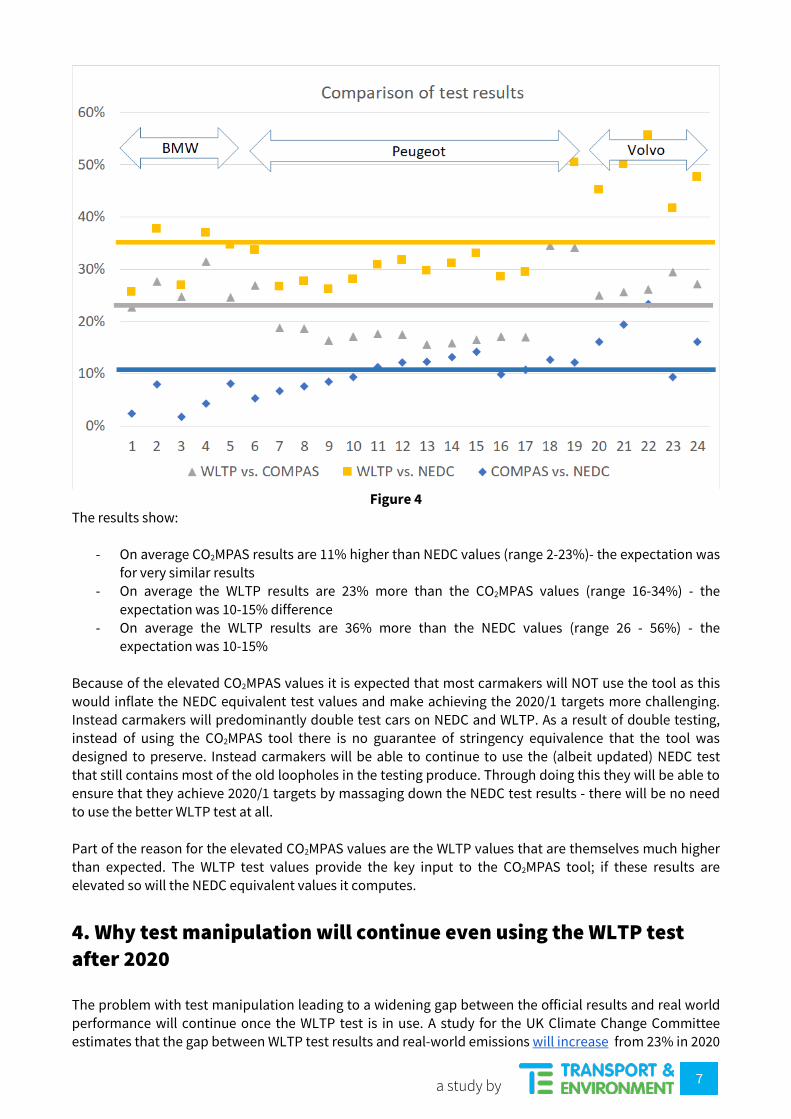
3. Why the introduction of the WLTP test has minimal benefits for emissions reductions in 2020 The new WLTP test will apply to all new cars sold from September 2018. It is an improvement over the NEDC, the obsolete test it replaces. The WLTP is much longer; the car driven much more dynamically (faster accelerations); the car idles for much less of the test; and the high speed section is more representative of highway driving. Crucially, the test procedures are much more robust and eliminate many, but not all, of the practices that carmakers have used to artificially lower NEDC test results, such as charging the battery before the test, over-inflating tyres, etc. It also requires cars to be tested at the maximum and minimum weight (depending on the level of optional equipment fitted to the vehicle). All of these developments make the WLTP test results more representative. However, research estimates that the gap between WLTP and real world emissions will still be about 23% in 2020, while analysis by T&E conducted with Peugeot-Citroen indicates much of this gap arises because the WLTP combined test result over-estimates the amount of high and very high speed driving on motorways and in rural areas and under-estimates low speed, stop-start driving in urban areas. The switch over from the NEDC to the WLTP creates a number of issues for assessing compliance against the 2020/1 target; and setting post-2020 targets. The 2020/1, 95g/km target is based upon the NEDC test but the new WLTP test is now being used to measure car CO2 emissions and set the post-2020 targets. To manage the transition it has been agreed to convert the WLTP test results into an NEDC equivalent value using a tool known as CO2MPAS that was developed by the Joint Research Centre of the European Commission. The CO2MPAS tool is designed to “maintain regulatory stringency” throughout the process of introducing the new test. T&E believes that, given the choices made in the design of the tool and which flexibilities in the testing procedure were incorporated into the correlation, that regulatory equivalence has been achieved. This means that the NEDC values computed using the CO2MPAS tool after 2017 should be broadly similar to those made using an NEDC test. The NEDC test has also been modified to correct an error in the methodology and clarify some of the testing procedures leading to slightly higher emissions (about 5%). However, data obtained by T&E (and reproduced in Annex 2), from 3 brands (Peugeot, BMW and Renault) on five models and 24 variants indicate the CO2MPAS tool is producing results much higher than expected and greater than those measured by the NEDC test (older version) as illustrated in Figure 4.
7
a study by
Figure 4
The results show:
- On average CO2MPAS results are 11% higher than NEDC values (range 2-23%)- the expectation was for very similar results
- On average the WLTP results are 23% more than the CO2MPAS values (range 16-34%) - the expectation was 10-15% difference
- On average the WLTP results are 36% more than the NEDC values (range 26 - 56%) - the expectation was 10-15%
Because of the elevated CO2MPAS values it is expected that most carmakers will NOT use the tool as this would inflate the NEDC equivalent test values and make achieving the 2020/1 targets more challenging. Instead carmakers will predominantly double test cars on NEDC and WLTP. As a result of double testing, instead of using the CO2MPAS tool there is no guarantee of stringency equivalence that the tool was designed to preserve. Instead carmakers will be able to continue to use the (albeit updated) NEDC test that still contains most of the old loopholes in the testing produce. Through doing this they will be able to ensure that they achieve 2020/1 targets by massaging down the NEDC test results - there will be no need to use the better WLTP test at all. Part of the reason for the elevated CO2MPAS values are the WLTP values that are themselves much higher than expected. The WLTP test values provide the key input to the CO2MPAS tool; if these results are elevated so will the NEDC equivalent values it computes.
4. Why test manipulation will continue even using the WLTP test after 2020 The problem with test manipulation leading to a widening gap between the official results and real world performance will continue once the WLTP test is in use. A study for the UK Climate Change Committee estimates that the gap between WLTP test results and real-world emissions will increase from 23% in 2020
8
a study by
to 31% by 2025 as illustrated in Figure 2. This will be driven by exploiting test flexibilities in the new WLTP test (that contributes 15% of the gap), technologies performing better in the test than on the road, like cylinder deactivation (that contribute 10%) and more equipment being fitted to cars (6%). Important drivers are the increasing sales of plug-in hybrids (that are not driven using electricity as much as the WLTP assumes); using special test drive modes to reduce emissions in the test but which will not be used much on the road; air conditioning (that is switched off during the test); transmission optimisation; using different tyres for testing than for real-world sales; etc. To stop the gap widening, monitoring as proposed by the Commission post-2020 is not sufficient – enforcement is required. As the WLTP test results can also be manipulated just as the NEDC ones have been this means carmakers will be able to reduce emissions mainly in the laboratory using the WLTP test and make much less improvement on the road. While providing short-term gain to carmakers as they will be able to fit less technology to improve efficiency, this would prolong the main failure of the current regulations, and result in missed fuel savings and CO2 improvement jeopardising EU effort to meet its 2030 climate targets.
5. Weakening the post 2020 targets through manipulating the 2021 baseline emissions The car industry is also seeking to weaken the 2025 and 2030 standards by manipulating the baseline emissions in 2021. Because of the absence of sufficient WLTP monitoring data the European Commission in its proposal for post-2020 standards proposed percentage reduction targets from 2021 of 15% by 2025 and 30% by 2030. They also failed to put in place mechanisms preventing carmakers for elevating the WLTP CO2 baseline values in 2021 despite being aware of the past history of test manipulation and ignoring the advice of their own experts. By double testing cars on the NEDC test and separately on the WLTP carmakers can not only produce very low test results on the NEDC version, but at the same time deliberately elevate WLTP values. They can do this in 3 ways:
1. Carmakers can fit devices to recognise when the car is being tested on the WLTP and alter how it operates to make the vehicle less efficient. For example the stop-start system (that switches off the engine when the car is stationary) can be deactivated as has been exposed in new analysis by the European Commission. This is almost certainly illegal and similar to the use of defeat devices found on diesel cars to lower NOx test results;
2. The WLTP regulation allows carmakers to declare a higher result than measured in the test. There are rules governing declaring a lower value (since this was one on the ways carmakers used to abuse the NEDC test). However the Commission did not regulate to prevent higher numbers being declared so it is presently legal. The Commission has recently suggested it will try to close this loophole;
3. Carmakers can conduct the test in a way that optimises the test vehicle to produce higher CO2 emission results. All tests have margins of tolerance that can be exploited to higher or lower results depending on how the tolerances are used. Such practices are unfair but not illegal.
The data and evidence in Section 4 above was presented to the European Commission that agreed to further investigate and published a non-paper explaining their findings. In the paper the Commission state that, there is, “ … evidence of manufacturers configuring their test vehicles in such a way that the measured WLTP emission values are inflated, while a different configuration is used for the NEDC test to achieve as low C02 emissions as possible on that test.” The Annex to the paper estimates the effect to be about 5% and also explains how the test was manipulated:
9
a study by
1. That the WLTP tests were carried out starting with a depleted car battery, so that additional fuel was consumed to charge the battery during the test (this is contrary to the provisions of the WLTP test)
2. The start-stop did not operate during the test (contrary to the requirements of testing cars in a manner in which they operate on the road
3. The engine speed was higher as a different gear shift strategy was deployed. This is a highly questionable practice.
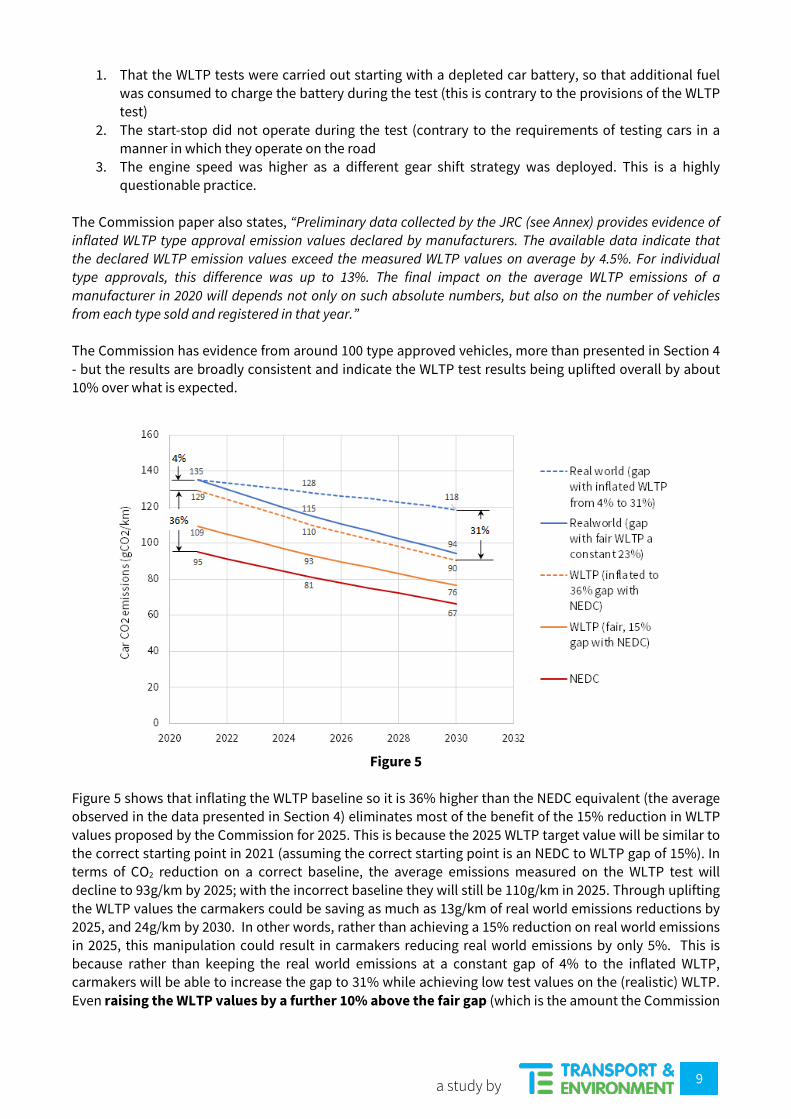
The Commission paper also states, “Preliminary data collected by the JRC (see Annex) provides evidence of inflated WLTP type approval emission values declared by manufacturers. The available data indicate that the declared WLTP emission values exceed the measured WLTP values on average by 4.5%. For individual type approvals, this difference was up to 13%. The final impact on the average WLTP emissions of a manufacturer in 2020 will depends not only on such absolute numbers, but also on the number of vehicles from each type sold and registered in that year.” The Commission has evidence from around 100 type approved vehicles, more than presented in Section 4 - but the results are broadly consistent and indicate the WLTP test results being uplifted overall by about 10% over what is expected.
Figure 5
Figure 5 shows that inflating the WLTP baseline so it is 36% higher than the NEDC equivalent (the average observed in the data presented in Section 4) eliminates most of the benefit of the 15% reduction in WLTP values proposed by the Commission for 2025. This is because the 2025 WLTP target value will be similar to the correct starting point in 2021 (assuming the correct starting point is an NEDC to WLTP gap of 15%). In terms of CO2 reduction on a correct baseline, the average emissions measured on the WLTP test will decline to 93g/km by 2025; with the incorrect baseline they will still be 110g/km in 2025. Through uplifting the WLTP values the carmakers could be saving as much as 13g/km of real world emissions reductions by 2025, and 24g/km by 2030. In other words, rather than achieving a 15% reduction on real world emissions in 2025, this manipulation could result in carmakers reducing real world emissions by only 5%. This is because rather than keeping the real world emissions at a constant gap of 4% to the inflated WLTP, carmakers will be able to increase the gap to 31% while achieving low test values on the (realistic) WLTP. Even raising the WLTP values by a further 10% above the fair gap (which is the amount the Commission
10
a study by
indicates they have measured for their non-paper) would still result in about 10g/km of hot air being created through the inflated baseline reducing the stringency of the proposal by more than half1. A further analysis has been conducted to compare the emissions reductions of two scenarios of 30% real-world reduction (Commission proposal) and 50% (EP Rapporteur proposal) versus the possibility of only a 12% real-world improvement by 2030 if the real-world gap is allowed to grow to 31%, as shown in Figure 5, or the worst-case scenario. Table 1 below summarises the additional improvement as regards the emissions savings and the fuel savings for motorists (assuming constant fuel prices from 2017). Assumptions are explained in Annex 4. Table 1. Impact of carmaker cheating from 2020 to 2030
Scenarios for 2020 to 2030 compared to worst-
case real-world improvement
Additional cumulative emissions savings in the EU if real-world emissions are fixed
Additional cumulative fuel savings to EU
drivers if real-world emissions are fixed
30% reduction by 2030 achieved in the real world thanks to NTE limits
108 Mt CO2 eq.
€57 billion
50% reduction by 2030 achieved in the real world thanks to NTE limits
507 Mt CO2 eq.
€220 billion
6. Stopping the cheating Given the failure of the current regulation to deliver the expected emissions reductions on the road, it was both extremely surprising, and disappointing, that the European Commission proposal for post-2020 standards missed its opportunity to finally tackle it. Particularly since the Commission’s own Scientific Advisory Mechanism recommended they do so. In its proposal, the Commission included provisions for in-service conformity tests, however these will only check that the initial type approval laboratory tests have been correctly performed and are unlikely to be able to prevent the gap between test and real-world emissions growing, as test manipulation is only part of the reason for the growing gap. ICCT analysis (Figure 2) indicates 10% of the 23% gap between WLTP and real-world emissions in 2021 is due to test manipulation; while 8% arise from technologies that perform better in the test than on the road; and 5% from disabling auxiliary equipment during the test (5%). The Commission also proposes to monitor the gap between the new test and real-world performance using fuel consumption meters, but will only consider the data in a 2025 review - too late to act to address any issues which emerge from the analysis. In addition, given the emerging evidence that the manipulation of the WLTP 2021 baseline could potentially halve the stringency of the 2025 target, a regulatory mechanism in the car CO2 regulation is clearly needed to fix both problems. In its non-paper the Commission proposes 3 further measures but these are only partial solutions at best. These include:
1 Adding 10g to a fair WLTP test in 2021, would set the baseline at 119 g/km. A 15% reduction brings this inflated 2025 target to 101 g/km. Assuming that rather than reducing real world emissions, carmakers reduce this inflation, the effective target will be 111 g/km, with only 8g of reduction needed. This represents a 6.6% reduction on 119 g/km, rather than a 15% reduction.

11
a study by
1. Basing the post-2020 car and van regulations on the measured and not declared WLTP values. This addresses the issue of manufacturers declaring higher values but not those associated with test procedure manipulation, e.g. the use of defeat devices to detect the test or deploying technologies that work better on the WLTP laboratory test than on the road.
2. Amending the correlation legislation to collect additional data. The Commission propose to do this to increase transparency and monitoring. But the Commission does not say in the non-paper how it will use the additional information to actually prevent test manipulation. Rather it seems to want to monitor but not reform how the legislation works in practice.
3. The Commission says it will monitor the correct implementation of the WLTP by member state type approval authorities . But it does not say how it will do this or what powers it will use to ensure correct interpretation. Judging from the consistent failure of national vehicle regulators to get the car industry to comply with emission rules, much more than monitoring is needed to solve the problem.
Instead, effective enforcement can be achieved through setting a not-to-exceed (NTE) limit between the WLTP test value and the real-world emissions. This would effectively prevent the gap between WLTP and real world emissions growing after 2021 and ensure emissions reductions measured in the test are matched by those on the road. Real-world emissions can be derived in one of two ways:
1. Using a real-world CO2 test, similar to that implemented for NOx emissions and separately developed by T&E, FNE and PSA Group. The European Commission is already developing a real world test for truck emissions but inexplicably claims it is impossible to develop one for cars. With a real world test the fleet average real-world emissions for each manufacturer could then be measured during type-approval along with the WLTP values and the gap between the real-world and WLTP values fixed in 2021. Setting the gap, or not-to-exceed (NTE) limit per manufacturer takes account of some divergences in vehicle segments and driving behaviours that different OEMs represent.
2. Alternatively, real-world fuel consumption data could be obtained from fuel consumption meters (FCMs). These can be used to accurately calculate real-time CO2 emissions and - if carmakers are mandated to report aggregated data annually - would provide detailed information on the gap between the new WLTP test and real-world performance of new cars sold to customers. The Commission intends that all new cars will be fitted with a FCM for this purpose as off 2021. These will then provide data, from 2021, on the real-world CO2 emissions and therefore average gap for each carmaker in the base year, based upon the aggregate and anonymous data compiled from individual models. The Commission plan only to monitor the gap so far but a simple amendment to control the gap can also be fixed.
In both cases carmakers would then be required to ensure the gap does not grow in the future – if it did, the 2025 (and future) targets would be adjusted accordingly to ensure the anticipated CO2 reductions remained constant. In the non-paper the Commission is dismissive of both approaches arguing that using NTE limit changes the nature of the regulatory system shifting the focus away from the WLTP lab based measurement system to real world emissions data. The Commission would rather patch up the flawed NEDC / WLTP laboratory testing system rather than shift to a system in which carmakers need to reduce emissions on the road.
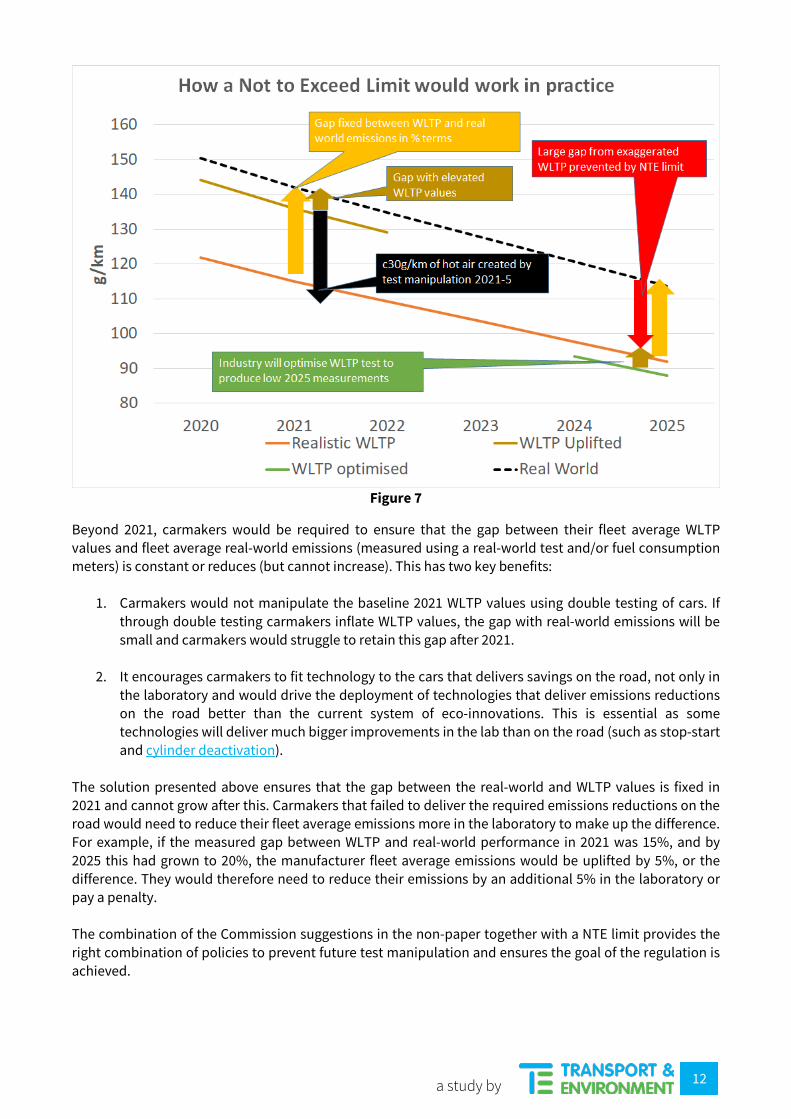
Figure 7 illustrates how in practice the system would operate.
12
a study by
Figure 7
Beyond 2021, carmakers would be required to ensure that the gap between their fleet average WLTP values and fleet average real-world emissions (measured using a real-world test and/or fuel consumption meters) is constant or reduces (but cannot increase). This has two key benefits:
1. Carmakers would not manipulate the baseline 2021 WLTP values using double testing of cars. If through double testing carmakers inflate WLTP values, the gap with real-world emissions will be small and carmakers would struggle to retain this gap after 2021.
2. It encourages carmakers to fit technology to the cars that delivers savings on the road, not only in
the laboratory and would drive the deployment of technologies that deliver emissions reductions on the road better than the current system of eco-innovations. This is essential as some technologies will deliver much bigger improvements in the lab than on the road (such as stop-start and cylinder deactivation).
The solution presented above ensures that the gap between the real-world and WLTP values is fixed in 2021 and cannot grow after this. Carmakers that failed to deliver the required emissions reductions on the road would need to reduce their fleet average emissions more in the laboratory to make up the difference. For example, if the measured gap between WLTP and real-world performance in 2021 was 15%, and by 2025 this had grown to 20%, the manufacturer fleet average emissions would be uplifted by 5%, or the difference. They would therefore need to reduce their emissions by an additional 5% in the laboratory or pay a penalty. The combination of the Commission suggestions in the non-paper together with a NTE limit provides the right combination of policies to prevent future test manipulation and ensures the goal of the regulation is achieved.
13
a study by
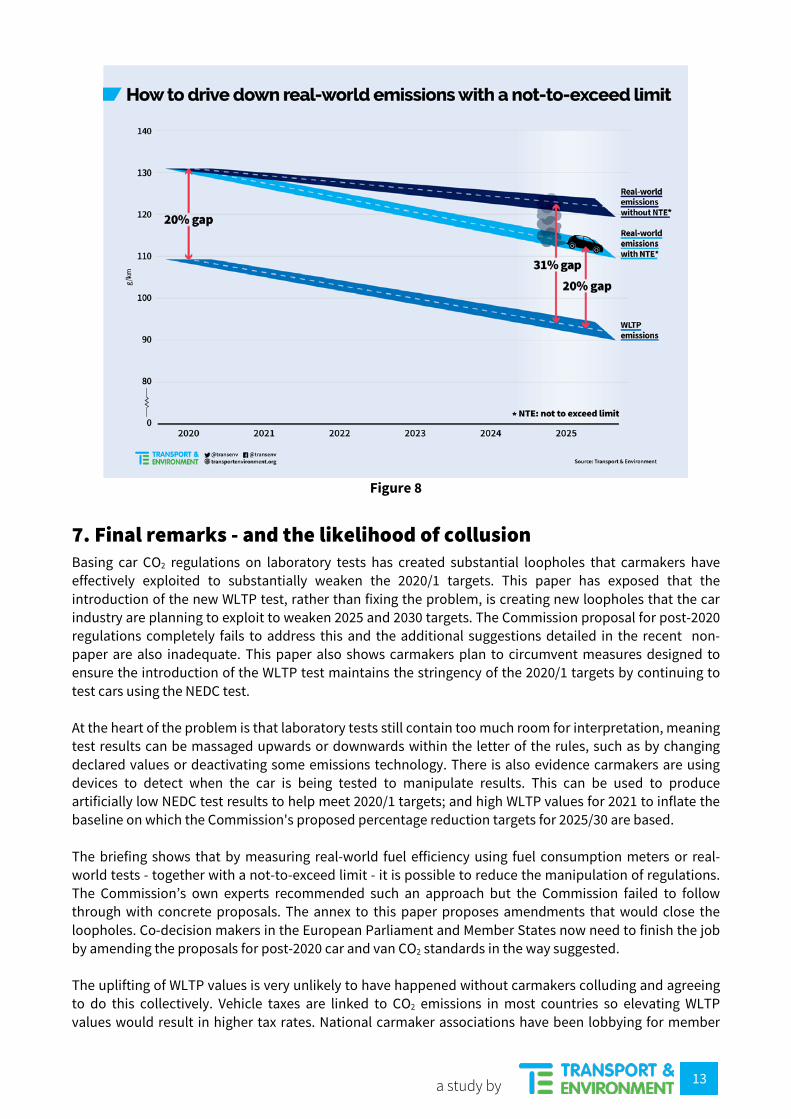
Figure 8
7. Final remarks - and the likelihood of collusion Basing car CO2 regulations on laboratory tests has created substantial loopholes that carmakers have effectively exploited to substantially weaken the 2020/1 targets. This paper has exposed that the introduction of the new WLTP test, rather than fixing the problem, is creating new loopholes that the car industry are planning to exploit to weaken 2025 and 2030 targets. The Commission proposal for post-2020 regulations completely fails to address this and the additional suggestions detailed in the recent non-paper are also inadequate. This paper also shows carmakers plan to circumvent measures designed to ensure the introduction of the WLTP test maintains the stringency of the 2020/1 targets by continuing to test cars using the NEDC test. At the heart of the problem is that laboratory tests still contain too much room for interpretation, meaning test results can be massaged upwards or downwards within the letter of the rules, such as by changing declared values or deactivating some emissions technology. There is also evidence carmakers are using devices to detect when the car is being tested to manipulate results. This can be used to produce artificially low NEDC test results to help meet 2020/1 targets; and high WLTP values for 2021 to inflate the baseline on which the Commission's proposed percentage reduction targets for 2025/30 are based. The briefing shows that by measuring real-world fuel efficiency using fuel consumption meters or real-world tests - together with a not-to-exceed limit - it is possible to reduce the manipulation of regulations. The Commission’s own experts recommended such an approach but the Commission failed to follow through with concrete proposals. The annex to this paper proposes amendments that would close the loopholes. Co-decision makers in the European Parliament and Member States now need to finish the job by amending the proposals for post-2020 car and van CO2 standards in the way suggested. The uplifting of WLTP values is very unlikely to have happened without carmakers colluding and agreeing to do this collectively. Vehicle taxes are linked to CO2 emissions in most countries so elevating WLTP values would result in higher tax rates. National carmaker associations have been lobbying for member
14
a study by
states to raise tax thresholds as a result of the introduction of the WLTP and the uplifted CO2 values. This is intended to ensure of the overall amount for tax paid per vehicle does not increase. But if only some carmakers uplifted WLTP values they would be at a competitive disadvantage as compared to those companies that did not, their models would be taxed at a higher rate. It is therefore highly likely that companies have colluded to all ensure that WLTP CO2 values are uplifted by similar amounts so there is no changes in relative competitiveness. Such behaviour is sadly remarkably common in the automotive sector. Last summer Der Spiegel broke news that carmakers had been colluding on the introduction of new technologies since the 1990’s - the investigation is continuing. This followed the European Commission fining EU truckmakers a record €2.9 billion for price fixing and collusion on emissions technology. The Commission needs to not only fix the regulations but extend the cartel investigation to look at this issue.
Further information Greg Archer, Clean Vehicles Director [email protected] Tel: +32 (0)2 851 02 25; +32 (0)490 400 447; +44 (0)7970 371224
15
a study by
Annex 1: Amendments to post 2020 CO2 legislation to introduce a not to exceed limit Article 12 of the proposed regulation for post-2020 CO2 standards for new passenger cars and light commercial vehicles should be amended as follows (in bold italics):
Article 12 Real world CO2 emissions and energy consumption
1. The Commission shall monitor and assess the real world representativeness of the CO2 emission and energy consumption values determined in accordance with Regulation (EU) 2017/1151. It shall ensure that the public is informed of how that representativeness evolves over time.
1.a In order to ensure the representativeness of the CO2 emissions and energy consumption values determined in accordance with Regulation (EU) 2017/1151, the Commission shall introduce a not-to-exceed (NTE) limit for each manufacturer to apply from 2025 onwards. The NTE limit shall be calculated as the average percentage difference between the manufacturer’s specific CO2 emissions measured at type approval and the average CO2 emissions measured in real-world driving conditions of their passenger cars and light commercial vehicles sold in 2021.
1.b For the purposes of measuring the real-world driving emissions in line with the above paragraph, the Commission shall develop a real-world CO2 emissions test by 31 December 2019 in order to supplement the procedures established under Regulation (EC) No 715/2007. Those measures shall be adopted by way of delegated acts in accordance with Article 16.
2. As an alternative to 1.b above, manufacturers may use the averaged CO2 emissions data from fuel consumption meters fitted to the passenger cars and light commercial vehicles in accordance with Regulation (EU) 2018/XXX (new WLTP 2nd act) and sold in 2021 in order to calculate the NTE limit to apply from 2025 onwards. the Commission shall ensure the availability, from manufacturers or national authorities, as the case may be, of robust non-personal data on real world CO2 emissions and energy consumption of passenger cars and light commercial vehicles.
2a. new The manufacturer shall ensure that the specific real-world CO2 emissions of their vehicle types from 2025 do not exceed the NTE limit set pursuant to paragraph 1.a.. If the NTE limit is exceeded, the specific CO2 emissions used for the purposes of compliance with this Regulation shall be adjusted upwards by the exceedance identified.
3. The Commission may adopt the measures referred to in this Article by means of implementing acts in accordance with the examination procedure referred to in Article 15(2).
16
a study by
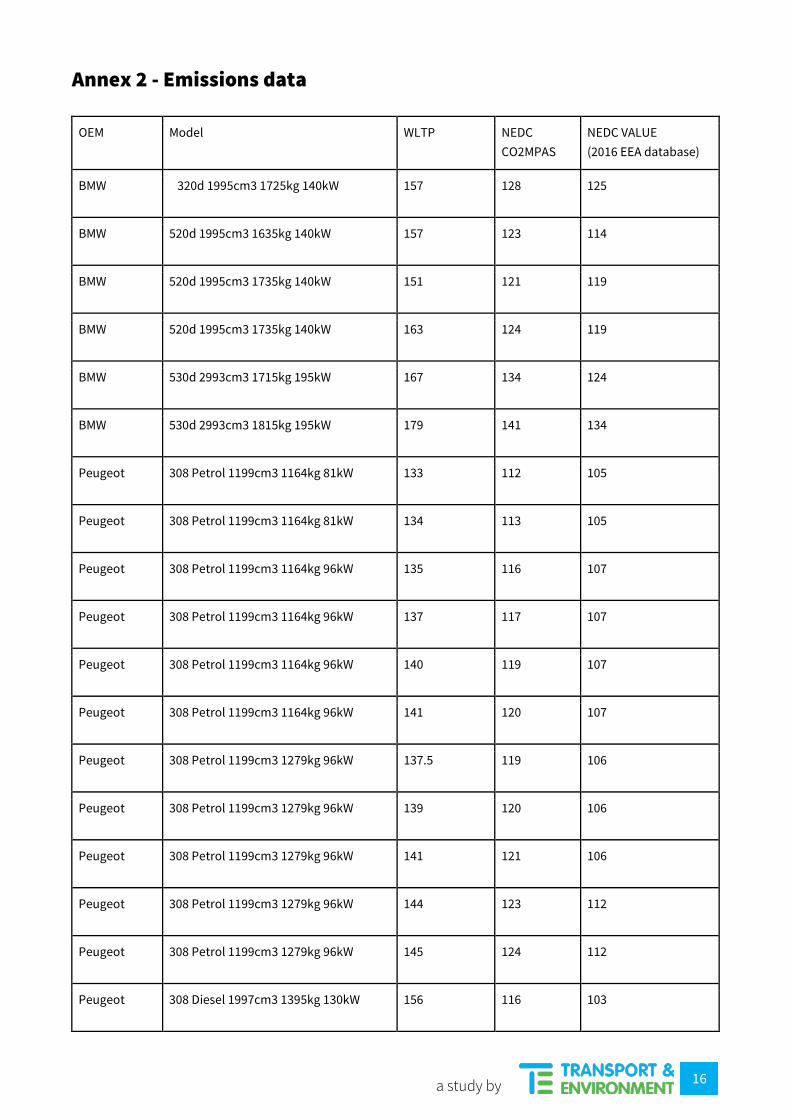
Annex 2 - Emissions data
OEM Model WLTP NEDC CO2MPAS
NEDC VALUE (2016 EEA database)
BMW 320d 1995cm3 1725kg 140kW 157 128 125
BMW 520d 1995cm3 1635kg 140kW 157 123 114
BMW 520d 1995cm3 1735kg 140kW 151 121 119
BMW 520d 1995cm3 1735kg 140kW 163 124 119
BMW 530d 2993cm3 1715kg 195kW 167 134 124
BMW 530d 2993cm3 1815kg 195kW 179 141 134
Peugeot 308 Petrol 1199cm3 1164kg 81kW 133 112 105
Peugeot 308 Petrol 1199cm3 1164kg 81kW 134 113 105
Peugeot 308 Petrol 1199cm3 1164kg 96kW 135 116 107
Peugeot 308 Petrol 1199cm3 1164kg 96kW 137 117 107
Peugeot 308 Petrol 1199cm3 1164kg 96kW 140 119 107
Peugeot 308 Petrol 1199cm3 1164kg 96kW 141 120 107
Peugeot 308 Petrol 1199cm3 1279kg 96kW 137.5 119 106
Peugeot 308 Petrol 1199cm3 1279kg 96kW 139 120 106
Peugeot 308 Petrol 1199cm3 1279kg 96kW 141 121 106
Peugeot 308 Petrol 1199cm3 1279kg 96kW 144 123 112
Peugeot 308 Petrol 1199cm3 1279kg 96kW 145 124 112
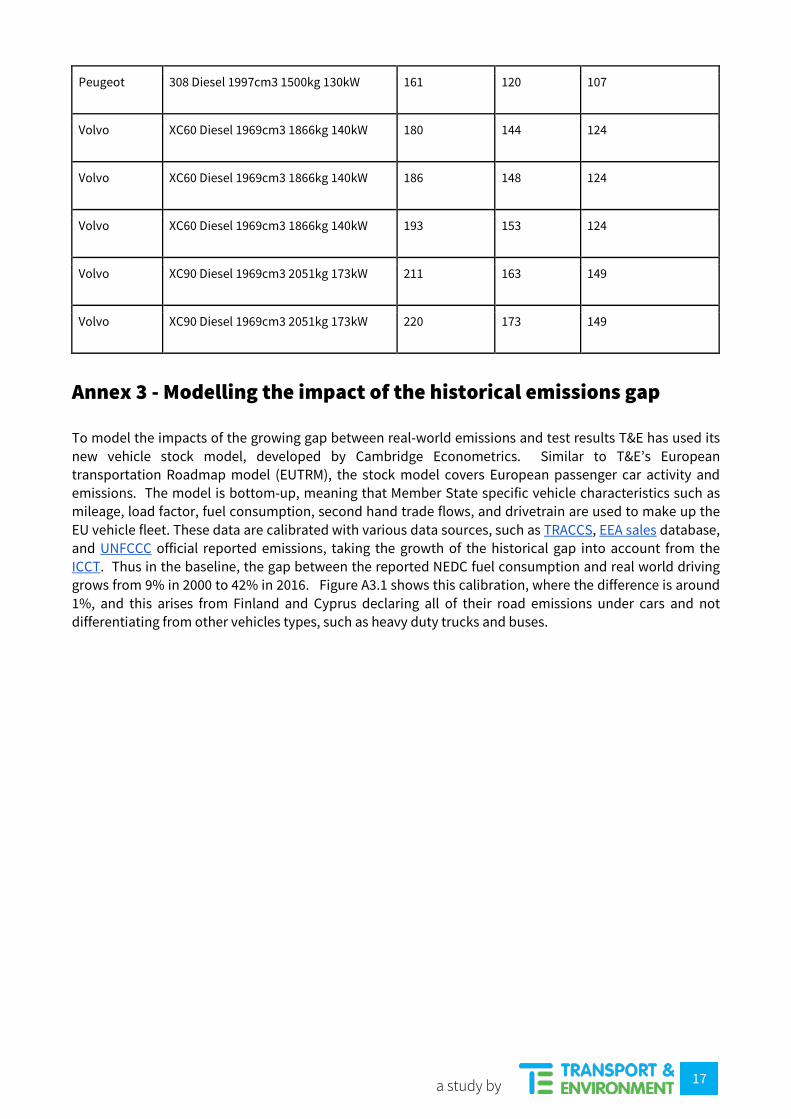
Peugeot 308 Diesel 1997cm3 1395kg 130kW 156 116 103
17
a study by
Peugeot 308 Diesel 1997cm3 1500kg 130kW 161 120 107
Volvo XC60 Diesel 1969cm3 1866kg 140kW 180 144 124
Volvo XC60 Diesel 1969cm3 1866kg 140kW 186 148 124
Volvo XC60 Diesel 1969cm3 1866kg 140kW 193 153 124
Volvo XC90 Diesel 1969cm3 2051kg 173kW 211 163 149
Volvo XC90 Diesel 1969cm3 2051kg 173kW 220 173 149
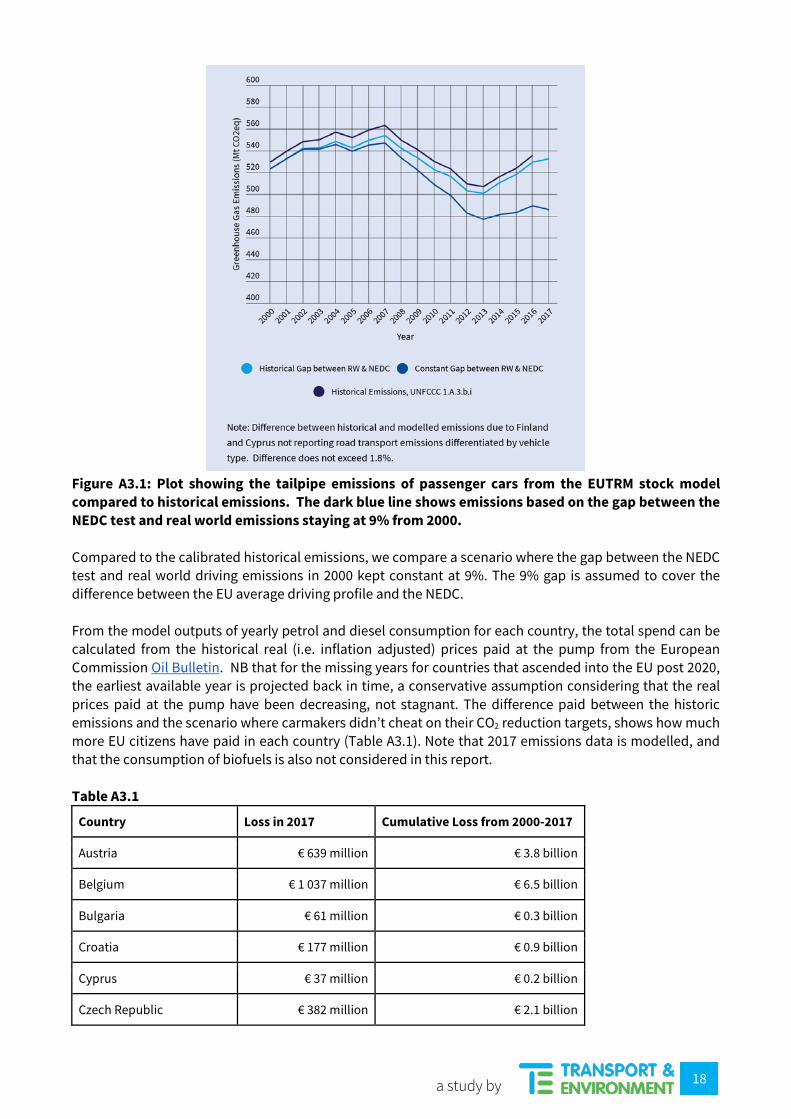
Annex 3 - Modelling the impact of the historical emissions gap To model the impacts of the growing gap between real-world emissions and test results T&E has used its new vehicle stock model, developed by Cambridge Econometrics. Similar to T&E’s European transportation Roadmap model (EUTRM), the stock model covers European passenger car activity and emissions. The model is bottom-up, meaning that Member State specific vehicle characteristics such as mileage, load factor, fuel consumption, second hand trade flows, and drivetrain are used to make up the EU vehicle fleet. These data are calibrated with various data sources, such as TRACCS, EEA sales database, and UNFCCC official reported emissions, taking the growth of the historical gap into account from the ICCT. Thus in the baseline, the gap between the reported NEDC fuel consumption and real world driving grows from 9% in 2000 to 42% in 2016. Figure A3.1 shows this calibration, where the difference is around 1%, and this arises from Finland and Cyprus declaring all of their road emissions under cars and not differentiating from other vehicles types, such as heavy duty trucks and buses.
18
a study by
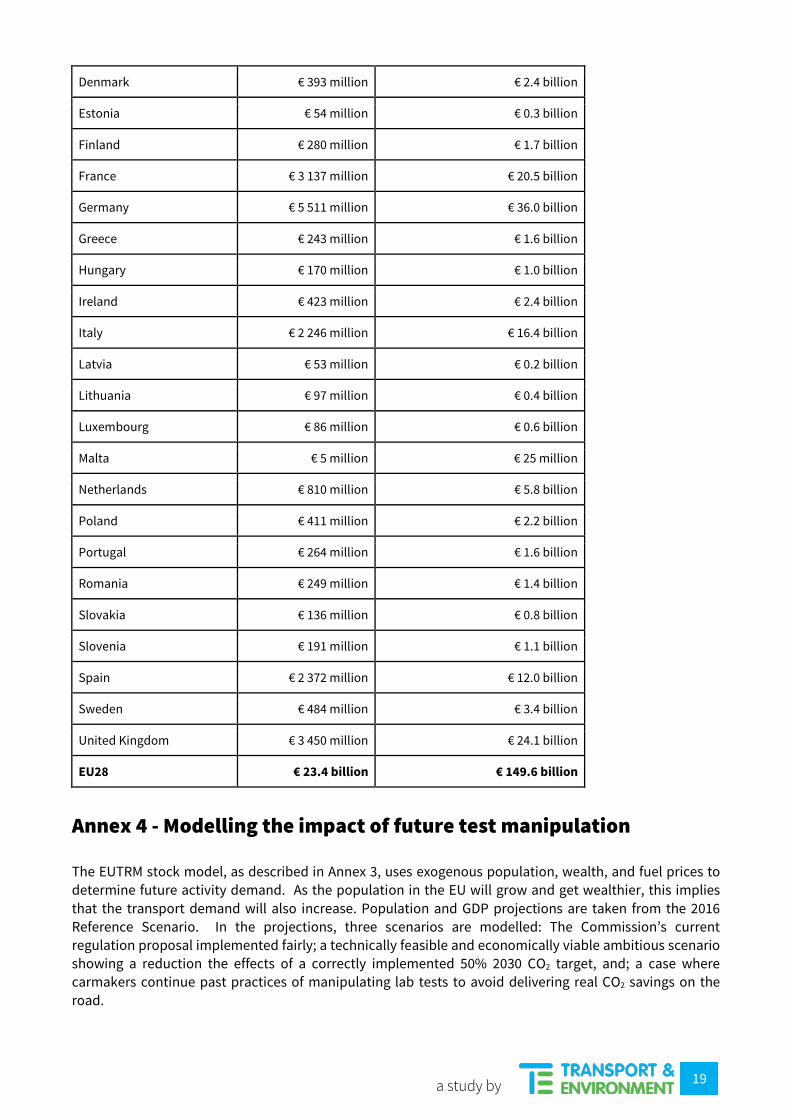
Figure A3.1: Plot showing the tailpipe emissions of passenger cars from the EUTRM stock model compared to historical emissions. The dark blue line shows emissions based on the gap between the NEDC test and real world emissions staying at 9% from 2000. Compared to the calibrated historical emissions, we compare a scenario where the gap between the NEDC test and real world driving emissions in 2000 kept constant at 9%. The 9% gap is assumed to cover the difference between the EU average driving profile and the NEDC. From the model outputs of yearly petrol and diesel consumption for each country, the total spend can be calculated from the historical real (i.e. inflation adjusted) prices paid at the pump from the European Commission Oil Bulletin. NB that for the missing years for countries that ascended into the EU post 2020, the earliest available year is projected back in time, a conservative assumption considering that the real prices paid at the pump have been decreasing, not stagnant. The difference paid between the historic emissions and the scenario where carmakers didn’t cheat on their CO2 reduction targets, shows how much more EU citizens have paid in each country (Table A3.1). Note that 2017 emissions data is modelled, and that the consumption of biofuels is also not considered in this report. Table A3.1
Country Loss in 2017 Cumulative Loss from 2000-2017
Austria € 639 million € 3.8 billion
Belgium € 1 037 million € 6.5 billion
Bulgaria € 61 million € 0.3 billion
Croatia € 177 million € 0.9 billion
Cyprus € 37 million € 0.2 billion
Czech Republic € 382 million € 2.1 billion
19
a study by
Denmark € 393 million € 2.4 billion
Estonia € 54 million € 0.3 billion
Finland € 280 million € 1.7 billion
France € 3 137 million € 20.5 billion
Germany € 5 511 million € 36.0 billion
Greece € 243 million € 1.6 billion
Hungary € 170 million € 1.0 billion
Ireland € 423 million € 2.4 billion
Italy € 2 246 million € 16.4 billion
Latvia € 53 million € 0.2 billion
Lithuania € 97 million € 0.4 billion
Luxembourg € 86 million € 0.6 billion
Malta € 5 million € 25 million
Netherlands € 810 million € 5.8 billion
Poland € 411 million € 2.2 billion
Portugal € 264 million € 1.6 billion
Romania € 249 million € 1.4 billion
Slovakia € 136 million € 0.8 billion
Slovenia € 191 million € 1.1 billion
Spain € 2 372 million € 12.0 billion
Sweden € 484 million € 3.4 billion
United Kingdom € 3 450 million € 24.1 billion
EU28 € 23.4 billion € 149.6 billion
Annex 4 - Modelling the impact of future test manipulation The EUTRM stock model, as described in Annex 3, uses exogenous population, wealth, and fuel prices to determine future activity demand. As the population in the EU will grow and get wealthier, this implies that the transport demand will also increase. Population and GDP projections are taken from the 2016 Reference Scenario. In the projections, three scenarios are modelled: The Commission’s current regulation proposal implemented fairly; a technically feasible and economically viable ambitious scenario showing a reduction the effects of a correctly implemented 50% 2030 CO2 target, and; a case where carmakers continue past practices of manipulating lab tests to avoid delivering real CO2 savings on the road.
20
a study by
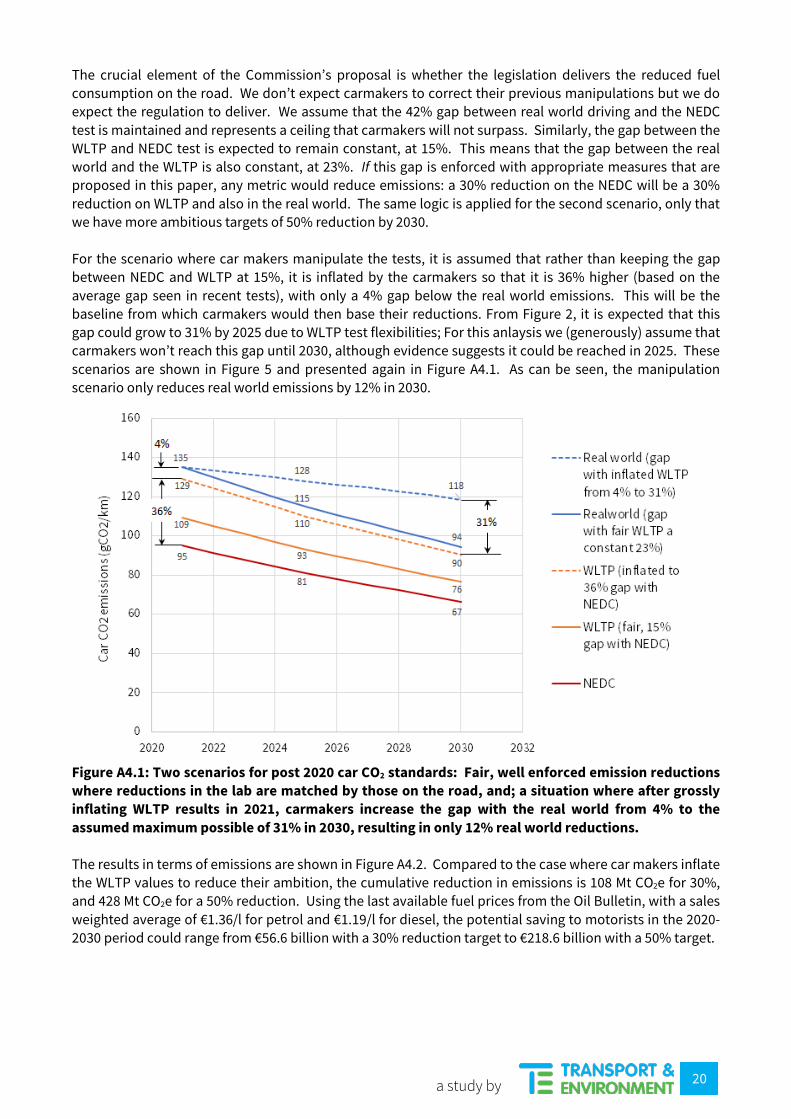
The crucial element of the Commission’s proposal is whether the legislation delivers the reduced fuel consumption on the road. We don’t expect carmakers to correct their previous manipulations but we do expect the regulation to deliver. We assume that the 42% gap between real world driving and the NEDC test is maintained and represents a ceiling that carmakers will not surpass. Similarly, the gap between the WLTP and NEDC test is expected to remain constant, at 15%. This means that the gap between the real world and the WLTP is also constant, at 23%. If this gap is enforced with appropriate measures that are proposed in this paper, any metric would reduce emissions: a 30% reduction on the NEDC will be a 30% reduction on WLTP and also in the real world. The same logic is applied for the second scenario, only that we have more ambitious targets of 50% reduction by 2030. For the scenario where car makers manipulate the tests, it is assumed that rather than keeping the gap between NEDC and WLTP at 15%, it is inflated by the carmakers so that it is 36% higher (based on the average gap seen in recent tests), with only a 4% gap below the real world emissions. This will be the baseline from which carmakers would then base their reductions. From Figure 2, it is expected that this gap could grow to 31% by 2025 due to WLTP test flexibilities; For this anlaysis we (generously) assume that carmakers won’t reach this gap until 2030, although evidence suggests it could be reached in 2025. These scenarios are shown in Figure 5 and presented again in Figure A4.1. As can be seen, the manipulation scenario only reduces real world emissions by 12% in 2030.
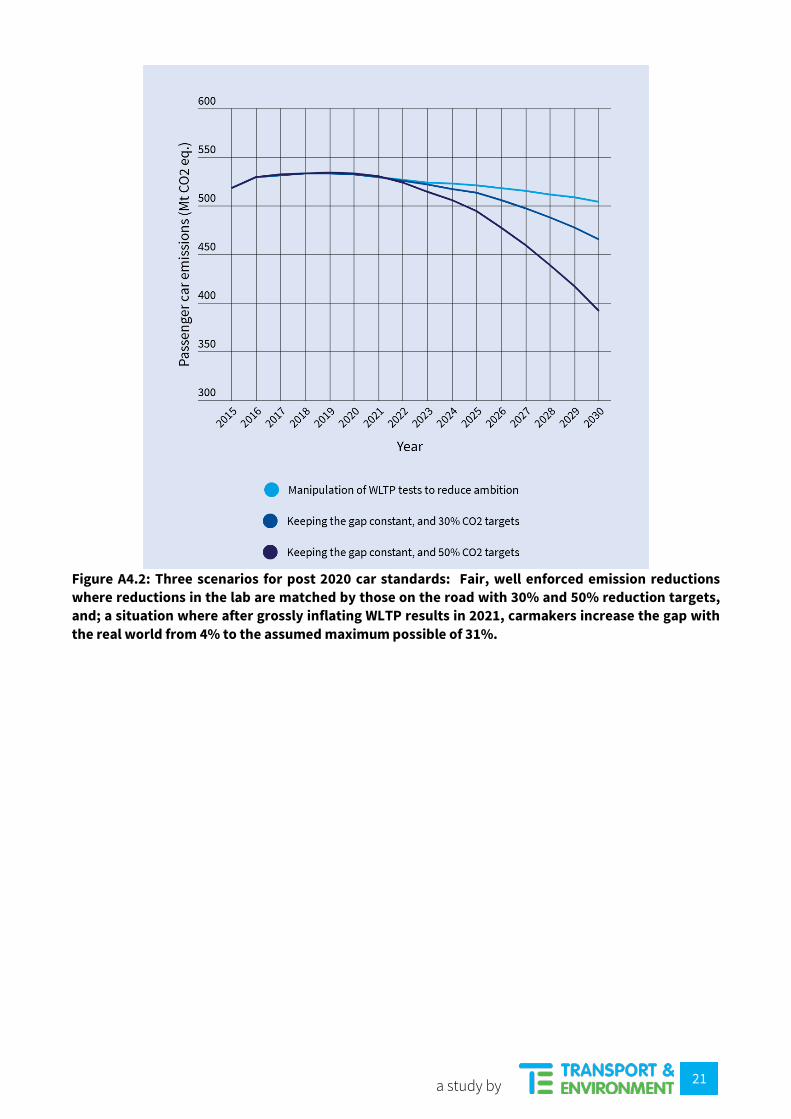
Figure A4.1: Two scenarios for post 2020 car CO2 standards: Fair, well enforced emission reductions where reductions in the lab are matched by those on the road, and; a situation where after grossly inflating WLTP results in 2021, carmakers increase the gap with the real world from 4% to the assumed maximum possible of 31% in 2030, resulting in only 12% real world reductions. The results in terms of emissions are shown in Figure A4.2. Compared to the case where car makers inflate the WLTP values to reduce their ambition, the cumulative reduction in emissions is 108 Mt CO2e for 30%, and 428 Mt CO2e for a 50% reduction. Using the last available fuel prices from the Oil Bulletin, with a sales weighted average of €1.36/l for petrol and €1.19/l for diesel, the potential saving to motorists in the 2020-2030 period could range from €56.6 billion with a 30% reduction target to €218.6 billion with a 50% target.
21
a study by
Figure A4.2: Three scenarios for post 2020 car standards: Fair, well enforced emission reductions where reductions in the lab are matched by those on the road with 30% and 50% reduction targets, and; a situation where after grossly inflating WLTP results in 2021, carmakers increase the gap with the real world from 4% to the assumed maximum possible of 31%.