endesa chile 1H 2012 results - Enel Generación Chile Cash Flow 2,248 (305) (564) (308) 1,070 (394)...
32
endesa chile 1H 2012 results 26 | 07 | 2012
Transcript of endesa chile 1H 2012 results - Enel Generación Chile Cash Flow 2,248 (305) (564) (308) 1,070 (394)...

endesa chile 1H 2012 results
26 | 07 | 2012

Endesa Chile consolidated results 1H 2012
2
Growth of 6% in electricity demand in the region
Growth of 1.9% in physical sales on a consolidated basis
Increase of 2.2% in operating costs, primarily as a consequence of higher fuel costs in Chile, Colombia and Peru, and higher transportation costs in
Chile
Non-recurring accounting effects in Colombia and Peru in the first half 2011
Highlights in 1H 2012
Growth of 3.1% in consolidated generation due to 13% more hydro generation in Colombia and Chile
Good results in Colombia, mainly related to higher hydro generation in the period.

Endesa Chile consolidated results 1H 2012
3
Results affected by the drought in Chile and high fuel costs
Million Ch$ 1H 2012 1H 2011 ChangeMM US$ *
1H 2012
Revenues 1,155,422 1,176,178 (2%) 2,345
Gross margin 469,037 504,733 (7%) 952
EBITDA 363,981 387,597 (6%) 739
EBIT 270,825 302,621 (11%) 550
Net financial expense (65,700) (62,080) (6%) (133)
Net income 174,419 211,772 (18%) 354
Net attibutable income 101,443 161,726 (37%) 206
• Higher physical sales in Colombia, Chile and Peru.
• Costs increased as a consequence of higher fuel costs in Chile, Colombia and Peru, and higher transportation costs in Chile.
• Non-recurrence of a one-time effect of the equity tax reform in Colombia which implied booking a total amount of US$87 million* during the first half of 2011.
• Non-recurrence of a one-time effect on payroll expenses recorded in June 2011, which implied booking a one-time benefit on payroll expenses of US$27 million*.
• Related company results decreased by 6.8% due to lower results in Endesa Brasil mainly related to higher net financial expenses.
*Amounts are expressed in US$, using the average exchange rate for each period

Endesa Chile consolidated results 1H 2012
Chile41%
Colombia21%
Peru12%
Argentina26%
Chile45%
Colombia37%
Peru15%
Argentina3%
Chile39%
Colombia24%
Peru17%
Argentina20%
4
EBITDA Generation
Total Installed Capacity: 13,845 MW
EBITDA 1H2012 TTM:
US$ 1.929 million
Total Generation (TTM): 53,564 GWh
Endesa Brasil
• Endesa Chile’s ownership: 40% (38.9%direct)
• Net Attributable Income (TTM): US$ 224million

Endesa Chile consolidated results 1H 2012
67%
30%
3%
54%
19%
27%
65%29%
6%
17%
83%
5
Conservative Commercial Policy
Regulated SpotUnregulated
Physical Sales as of June 2011
Chile Colombia Peru
Regulated SpotUnregulated
Argentina
Physical Sales as of June 2012
Chile Colombia Peru Argentina
66%
33%
1%
50%
20%
30%
65%26%
9% 17%
83%

Endesa Chile consolidated results 1H 2012
Correlation between Hydrology and Contribution Margin
Effective Commercial Policy in the long term
6
0
100
200
300
400
500
600
700
800
30% 40% 50% 60% 70% 80% 90% 100%
Co
ntr
ibu
tio
n M
arg
in (
MM
US
$)
Exceedance Probability
Contribution Margin (MMUSD) Endesa Chile; Consolidated Contribution Margin (MMUSD) Endesa Chile; Chile
Lineal (Contribution Margin (MMUSD) Endesa Chile; Consolidated) Lineal (Contribution Margin (MMUSD) Endesa Chile; Chile)
1Q10
2Q11
10% -13MMUS$
WET DRY
10% -3MMUS$
1Q10
4Q11
2Q11
3Q10
2Q12
2Q12
Endesa Chile consolidated results 1H 2012
7
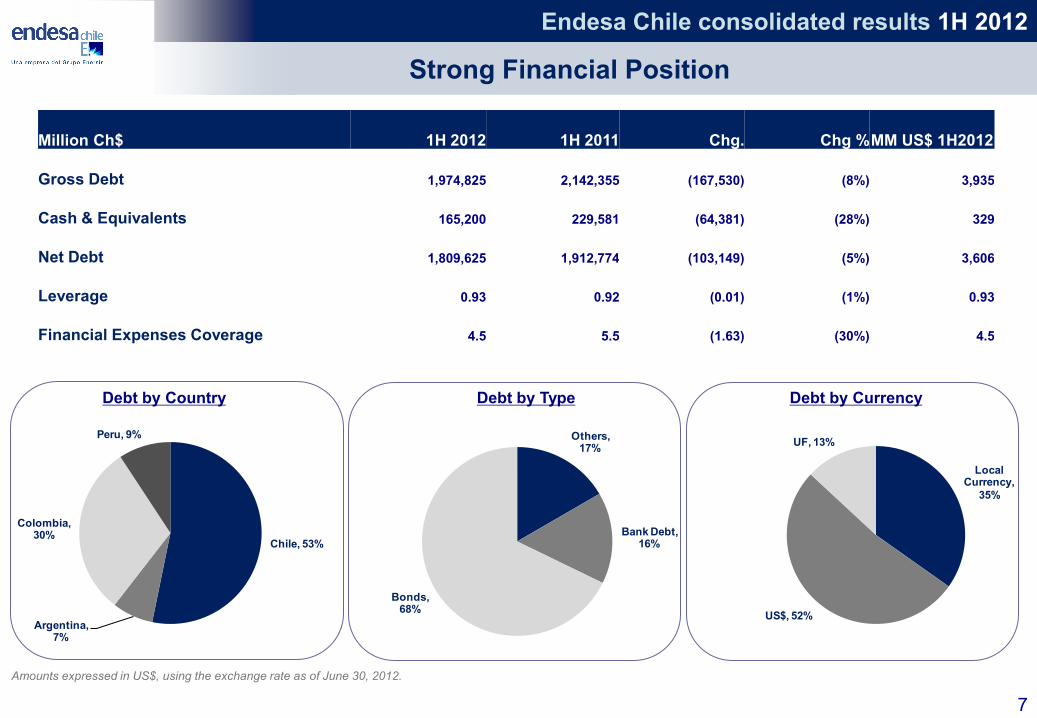
Debt by Type Debt by CurrencyDebt by Country
Amounts expressed in US$, using the exchange rate as of June 30, 2012.
Million Ch$ 1H 2012 1H 2011 Chg. Chg %MM US$ 1H2012
Gross Debt 1,974,825 2,142,355 (167,530) (8%) 3,935
Cash & Equivalents 165,200 229,581 (64,381) (28%) 329
Net Debt 1,809,625 1,912,774 (103,149) (5%) 3,606
Leverage 0.93 0.92 (0.01) (1%) 0.93
Financial Expenses Coverage 4.5 5.5 (1.63) (30%) 4.5
Strong Financial Position
Chile, 53%
Argentina, 7%
Colombia, 30%
Peru, 9%
Local Currency,
35%
US$, 52%
UF, 13%Others,
17%
Bank Debt, 16%
Bonds, 68%

Endesa Chile consolidated results 1H 2012
8
1
Amounts are expressed in US$, using the average exchange rate for each period.1 Over Twelve Trail Months
Free Cash Flow
2,248
(305)
(564)
(308)
1,070
(394)
2,098
(235)
(499)(353)
1,012
(523)
2,014
(251)
(549)(435)
779
(462)
1,929
(260)
(477) (416)
775
EBITDA Net Financial Result CAPEX Income Tax FCF Dividends
2009 2010 2011 1H2012 TTM

Endesa Chile consolidated results 1H 2012
9
Guavio: 1,213 MW
Betania: 541 MW
Río Bogotá: 716 MW
85% Hydro
2,471 MW
15% Thermal
444 MW
Cartagena: 208 MW
Termozipa: 236 MW
Installed Capacity: 2,914 MW
Market Share: 20%
Total Generation: 6,396 Gwh
EMGESA
Cartagena
Bogotá
Colombia
Million US$ 1H 2012 1H 2011 Change
Revenues 552 471 17%
EBITDA 360 235 53%
EBITDA Margin 65.3% 50.0% 31%
Physical Sales (Gwh) 7,719 7,224 7%
Endesa Chile consolidated results 1H 2012
10
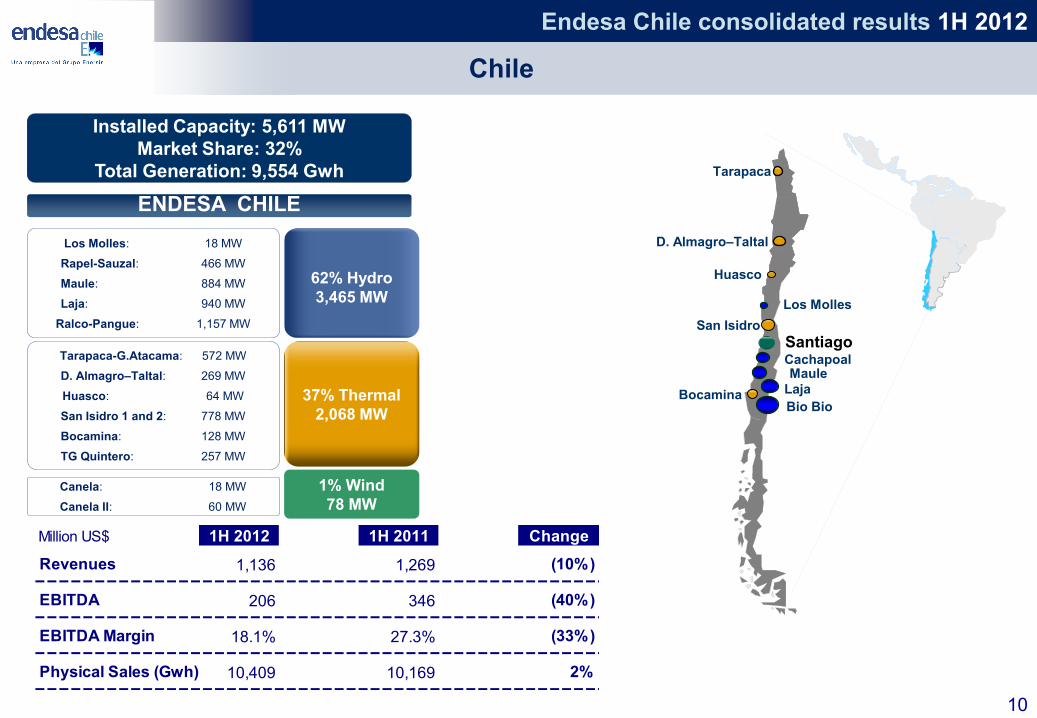
Installed Capacity: 5,611 MW
Market Share: 32%
Total Generation: 9,554 Gwh
ENDESA CHILE
D. Almagro–Taltal
Bocamina Laja
Maule
Bio Bio
Tarapaca
Huasco
San Isidro
Los Molles
Cachapoal
Santiago
Los Molles: 18 MW
Rapel-Sauzal: 466 MW
Maule: 884 MW
Laja: 940 MW
Ralco-Pangue: 1,157 MW
62% Hydro
3,465 MW
37% Thermal
2,068 MW
Tarapaca-G.Atacama: 572 MW
D. Almagro–Taltal: 269 MW
Huasco: 64 MW
San Isidro 1 and 2: 778 MW
Bocamina: 128 MW
TG Quintero: 257 MW
1% Wind
78 MW
Canela: 18 MW
Canela II: 60 MW
Chile
Million US$ 1H 2012 1H 2011 Change
Revenues 1,136 1,269 (10%)
EBITDA 206 346 (40%)
EBITDA Margin 18.1% 27.3% (33%)
Physical Sales (Gwh) 10,409 10,169 2%

Endesa Chile consolidated results 1H 2012
11
Lima:
• Edegel (Gx)
Ventanilla: 493 MW
Santa Rosa: 429 MW
55% Thermal
922 MW
Cuenca Río Rímac: 552 MW
Yanango: 43 MW
Chimay: 151 MW
45% Hydro
747 MW
Installed Capacity: 1,668 MW
Market Share: 26%
Total Generation: 4,463 Gwh
EDEGEL
Peru
Million US$ 1H 2012 1H 2011 Change
Revenues 288 234 23%
EBITDA 146 152 (4%)
EBITDA Margin 50.7% 65.0% (22%)
Physical Sales (Gwh) 4,835 4,746 2%

Endesa Chile consolidated results 1H 2012
12
Argentina
Costanera: 2,324 MW
El Chocon: 1,328 MWHydro
1,328 MW
Installed Capacity: 3,652 MW
Market Share: 12%
Total Generation: 5,758 Gwh
EL CHOCON
COSTANERA
Thermal
2,324 MW
El Chocon
Costanera
CIEN Line
(2x1.050 MW)
Interconnection
with Brazil
Million US$ 1H 2012 1H 2011 Change
Revenues 50 47 6%
EBITDA 28 25 15%
EBITDA Margin 56.0% 53.2% 5%
Physical Sales (Gwh) 1,498 1,395 7%
Million US$ 1H 2012 1H 2011 Change
Revenues 321 367 (13%)
EBITDA (2) 29 (105%)
EBITDA Margin (0%) 7.9% (106%)
Physical Sales (Gwh) 4,537 4,919 (8%)

Endesa Chile consolidated results 1H 2012
13
Fortaleza: 322 MWThermal
322 MW
Cachoeira: 665 MW Hydro
665 MW
Installed Capacity: 987 MW
Market Share: 1%
Total Generation: 2,371 Gwh
CACHOEIRA
FORTALEZA
Fortaleza
Rio de Janeiro
Two 500 Km lines
Total interconnection capacity: 2,100 MW
CIEN1: Transmission
Brazil-Argentina Interconnection
Brazil
Cachoeira
Million US$ 1H 2012 1H 2011 Change
Revenues 147 120 22%
EBITDA 102 89 15%
EBITDA Margin 69.4% 73.7% (6%)
Physical Sales (Gwh) 2,145 1,792 20%
Million $ 1H 2012 1H 2011 Change
Revenues 76 35 121%
EBITDA 53 22 138%
EBITDA Margin 69.2% 64.1% 8%
1Includes CIEN, CTM and TESA
Million US$ 1H 2012 1H 2011 Change
Revenues 133 124 7%
EBITDA 56 57 (1%)
EBITDA Margin 41.9% 46% (8%)
Physical Sales (Gwh) 1,399 1,334 5%

Endesa Chile consolidated results 1H 2012
14
Projects Under Construction
• Location: Next to the existing coal-fired
plant Bocamina, in Bío-Bío region.
• Installed capacity: 350 MW, coal fired.
• Estimated investment: US$ 841 million
• 1H 2012, Test on boiler burners and
blowing steam pipe finished.
• Commercial start-up in 2H 2012.
BOCAMINA II
• Location: Huila Department, upstream of
Emgesa’s Betania plant.
• Installed capacity: 400 MW, hydro.
• Estimated investment: US$ 837 million
• In 2009 the environmental license and
building permissions were granted
• River detour completed in March 2012
• Estimated start-up: December 2014
Vertedero
Presa
h = 151 m
Río
Mag
dale
na
Casa de
máquinas
400 MW
Túnel de
desviación
Bocatoma
Dique
Conducción
Embalse
720 msnm
Vertedero
Presa
h = 151 m
Río
Mag
dale
na
Casa de
máquinas
400 MW
Túnel de
desviación
Bocatoma
Dique
Conducción
Embalse
720 msnm
EL QUIMBO

Endesa Chile consolidated results 1H 2012
15
Projects Under Study
Neltume, hydro
run-of-the-river plant
Installed capacity:
490 MW
Los Cóndores, hydro
power plant
Installed capacity:
150 MW
Punta Alcalde, coal-steam
power plant
Installed capacity:
740 MW
Curibamba, hydro
power plant
Installed capacity:
188 MW
Hydroaysen, hydro
power plant
Installed capacity:
2,750 MW
1
1EIA rejected. On appeal to the Ministers Committee.

Endesa Chile consolidated results 1H 2012
16
312
144 134
81 81 75 69 65 54 54 53 45 4129 23 12 12 7
0
50
100
150
200
250
300
350
GW
h /
ye
ar-k
m2
Energy / Flooded Surface
• One of the most efficient hydroelectric
projects in the world.
• Renewable resources
• Average load factor: 77%
• Installed capacity: 2,750 MW.
• Endesa Chile owns 51% and Colbún 49%.
• CO2 emissions: Reduction of 16.2 million
tons/year
HidroAysén
• May 9, 2011: EIA was approved for the
Generation Plants.
• June 2011: Pto Montt Court of Appeals issued
an injunction, leaving the resolution in state of
abeyance.
• April 2012: The Supreme Court of Justice
rescinded seven protection requirements
presented to stop the construction of the project.
• The Chilean Government should present the
“Electric Highway project” on 2H 2012.

Endesa Chile consolidated results 1H 2012
1Amounts expressed in US$, using the average exchange rate for each period.2 Amounts expressed in US$, using the last exchange rate for each period.3As of June 30 , 2012
13.8
21.3
26.8
32.5
27.2
2007 2008 2009 2010 2011
17
Dividends
(Ch$ per Share)EBITDA
(US$ Millions)
Market Value
(US$ Millions)
Dividend Yield: 3.2%
Market Value and Dividends
1
1.503 1.671
2.033 2.248
2.098 2.014 1.929
2006 2007 2008 2009 2010 2011 1H 2012 TTM
Source: Intern using Bloomberg
2
3
10.072 10.393 9.428
13.963 15.364
12.102 13.878
2006 2007 2008 2009 2010 2011 1H 2012

Endesa Chile consolidated results 1H 2012
18
USA Stock Market Spain Stock Market
NYSE (US$)
Price 1H 2012 TTM (Avg) 49.3
Max 1H 2012 TTM 57.6
Min 1H 2012 TTM40.6
Daily Avg Trans Vol (million ADR) 0.14Avg Daily Trans (US$ millions
traded) 6.65
LATIBEX (€)
Price 1H 2012 TTM (Avg) 1.2
Max 1H 2012 TTM 1.4
Min 1H 2012 TTM1.0
Daily Avg Trans Vol (million shares) 0.01
Avg Daily Trans (€ millions traded) 0.02
Chilean Stock Market
BOLSA DE SANTIAGO (CLP)
Price 1H2012 TTM (Avg) 806.6
Max 1H2012 894.0
Min 1H2012700.5
Daily Avg Trans Vol (million shares) 5.15Avg Daily Trans (CLP millions
traded) 4,142.3
Relevant Stock Presence
Source: Intern, using Bloomberg

Endesa Chile consolidated results 1H 2012
19
Conclusions
Diversified portfolio
Revenues and Margin stability
Non-recurrent accounting effect
Difficult electric situation in Chile

Endesa Chile consolidated results 1H 2012
20
Contact us at:
Juan Pablo Vicuña
Investor Relations Executive
(56-2) 630 9585
Susana Rey
Investor Relations Director
(56-2) 630 96 06
Catalina Gonzalez
Head of Investor Relations
(56-2) 630 96 03
Guillermo Berguecio
Investor Relations Executive
(56-2) 630 9506
Endesa Chile’s Investor Relations Team

Endesa Chile consolidated results 1H 2012
21
EXHIBITS

Endesa Chile consolidated results 1H 2012
22
•COSTANERA, 70%
•EL CHOCON, 65%•EDEGEL, 62%•EMGESA, 27%
•ENDESA BRASIL, 39%
AMPLA
COELCE
FORTALEZA
CDSA
CIEN
61%
92%
60%
PEHUENCHE, 93%
CELTA, 100%
SAN ISIDRO, 96%
ENDESA ECO, 100%
CANELA, 75%
60%15%
4%
17%
4%
ENERSIS Chilean Pension Funds
ADR Holders Other Inst Shareholders
Minority Shareholders
Ownership Structure

Endesa Chile consolidated results 1H 2012
23
A unique portfolio in LATAM’s Generation business
Colombia
2,914 MW inst. capacity
20% market share
No. 2
5,612 MW inst. capacity
32% market share
Peru
1,668 MW inst. capacity
26% market share
Chile
Brazil
987 MW inst. capacity
1% market share in
generation
Market shares based on installed capacity
Figures as of June 2012
Consolidated installed capacity: 13,845 MW
Capacity including Brazil: 14,832 MW
Consolidated energy sales 2011: 58,012 GWh
Consolidated energy sales 1H2012: 28,541 GWh
3,652 MW inst. capacity
12% market share
Argentina
No. 1
No. 1
No. 1

Endesa Chile consolidated results 1H 2012
24
Customers Installed Capacity, Output
Installed
Capacity
Output
MW as of 1H 2012
Chile Brazil Peru Colombia Argentina Total
Total 5,611 987 1,668 2,914 3,652 14,832
Hydro 3,456 665 746 2,471 1,328 8,666
Nuclear - - - - - -
Coal 286 - - 236 - 522
Oil-Gas 1,783 322 922 208 2,324 5,559
CHP / Renewables 87 - - - - 87
GWh as of 1H 2012
chg. Vs. 1H 2011
Chile Brazil Peru Colombia Argentina Total
Total 9,554 4.0% 2,371 75.3% 4,463 -4.2% 6,396 16.1% 5,758 -4.3% 28,541 6.8%
Hydro 5,181 16.0% 1,880 65.3% 2,513 -1.3% 6,189 16.9% 1,295 14.4% 17,058 17.0%
Nuclear - - - - - - - - - - - -
Coal 880 -5.5% - - - - 111 -7.1% - - 991 -5.6%
Oil-Gas 3,392 -8.5% 491 128.1% 1,949 -7.6% 97 2.5% 4,462 -8.7% 10,391 -5.6%
CHP / Renewables 101 18.9% - - - - - - - - 101 18.9%

Endesa Chile consolidated results 1H 2012
25
Feb. 2010Jan. 2010 Apr. 2011
BBB+ Baa2 BBB+
Since:
Affirmed: Jan 2012 May 2012
Credit Risk RatingsCredit Risk Ratings
Financial DebtFinancial Debt
US$ Million 2012 2013 2014 2015 2016 Balance TOTAL
Chile 366 419 165 219 15 909 2,094
Argentina 89 69 59 35 34 - 287
Perú 40 52 50 34 57 129 363
Colombia - - 79 163 23 927 1,192
TOTAL 496 541 354 451 129 1,965 3,935
Jun 2012
Healthy Debt Profile

Endesa Chile consolidated results 1H 2012
26
Net debt/EBITDA1 EBITDA/Net financial expenses1
1 EBITDA“ and “Net Financial Expenses” are over Twelve Trail Months”2 EBITDA / (Financial expenses + Income (Loss) for indexed assets and liabilities + Foreign currency exchange differences, net)
Endesa Chile 1H 2012 1H 2011
Financial Expense Coverage2 4.5 5.5
ROE (%) 15.7% 21%
ROA (%) 8.6% 10%
5,6
7,4
8,9
8,0 7,4
2008 2009 2010 2011 1H 2012
Principal Financial Ratios
2,0
1,5 1,5 1,5
1,9
2008 2009 2010 2011 1H 2012
Net Debt/ EBITDA

Endesa Chile consolidated results 1H 2012
27
100%• Rainfall
• Growth in demand
• Fuel prices
• Exchange rates
• Inflation
Risk variables affecting marginsRisk variables affecting margins
Our goal is to ensure a 95% reliability with a
margin of at least 90% of budget even in the
following scenarios:
• Lower rainfall than historical levels
• Increases in fuel prices
• Higher growth in demand
Risk limit
Real margin ≥ 0.9x expected margin
Risk limit
Real margin ≥ 0.9x expected margin
Spot
Extreme
hydro
volatility
Thermal
Target
outputTarget sales
Output and sales targets
for future years
Hydro
Regulated
and
unregulated
contracts
75%
Rela
tive
Fre
qu
en
cy Results
MMUS$5%
MaR 95%
Integrated risk management capability

Endesa Chile consolidated results 1H 2012
28
Electricity demand Evolution in LATAM
146%
118%
162%
133%
161%
90%
100%
110%
120%
130%
140%
150%
160%
170%
2002 2003 2004 2005 2006 2007 2008 2009 2010 2011
To
tal S
ale
s in
GW
h (
%)
Year
Historic electricity demand growth
CHILE COLOMBIA PERU BRAZIL ARGENTINA
*: Estimated growth using 3Q2011 data
Endesa Chile consolidated results 1H 2012
29
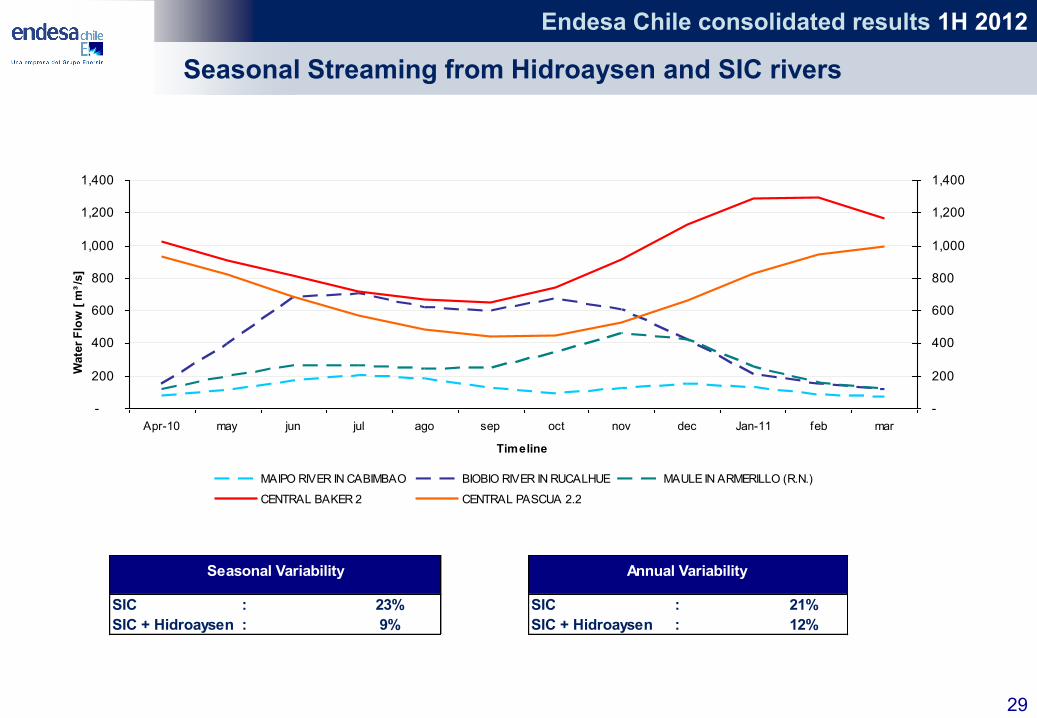
-
200
400
600
800
1,000
1,200
1,400
Apr-10 may jun jul ago sep oct nov dec Jan-11 feb mar
Timeline
Wate
r F
low
[m
³/s]
-
200
400
600
800
1,000
1,200
1,400
MAIPO RIVER IN CABIMBAO BIOBIO RIVER IN RUCALHUE MAULE IN ARMERILLO (R.N.)
CENTRAL BAKER 2 CENTRAL PASCUA 2.2
Seasonal Streaming from Hidroaysen and SIC rivers
SIC : 23% SIC : 21%
SIC + Hidroaysen : 9% SIC + Hidroaysen : 12%
Seasonal Variability Annual Variability

Endesa Chile consolidated results 1H 2012
30
Corporate Governance Excellence
LATIN AMERICA´S INVESTOR RELATIONS AWARDS – LIRA 2011
•Best Communication of Corporate Governance:
1st Place
•Best Communication of Financial Results:
1st Place
•Best Investor Relations Officer:
3rd Place
•Best Investor Relations Department:
3rd Place

Endesa Chile consolidated results 1H 2012
This presentation contains statements that could constitute forward-looking statements within the meaning of the
Private Securities Litigation Reform Act of 1995. These statements appear in a number of places in this
announcement and include statements regarding the intent, belief or current expectations of Endesa Chile and its
management with respect to, among other things: (1) Endesa Chile’ business plans; (2) Endesa Chile’ cost-
reduction plans; (3) trends affecting Endesa Chile’ financial condition or results of operations, including market
trends in the electricity sector in Chile or elsewhere; (4) supervision and regulation of the electricity sector in Chile
or elsewhere; and (5) the future effect of any changes in the laws and regulations applicable to Endesa Chile’ or
its subsidiaries. Such forward-looking statements are not guarantees of future performance and involve risks and
uncertainties. Actual results may differ materially from those in the forward-looking statements as a result of
various factors. These factors include a decline in the equity capital markets of the United States or Chile, an
increase in the market rates of interest in the United States or elsewhere, adverse decisions by government
regulators in Chile or elsewhere and other factors described in Endesa Chile’ Annual Report on Form 20-F.
Readers are cautioned not to place undue reliance on those forward-looking statements, which state only as of
their dates. Endesa while undertakes no obligation to release publicly the result of any revisions to these forward-
looking statements.
31
Disclaimer
Endesa Chile consolidated results 1H 2012
32


![Download presentation in MS PowerPoint [Size 2,248 KB]](https://static.fdocuments.net/doc/165x107/5455817eb1af9f39378b4901/download-presentation-in-ms-powerpoint-size-2248-kb.jpg)