End result for Both Online and Hardcopy survey
12
END RESULT for BOTH ONLINE AND HARDCOPY
-
Upload
ateekahamid -
Category
Technology
-
view
138 -
download
0
Transcript of End result for Both Online and Hardcopy survey
END RESULT for BOTH ONLINE AND HARDCOPY

35 % (39)
65% (74)
Gender
Male
Female
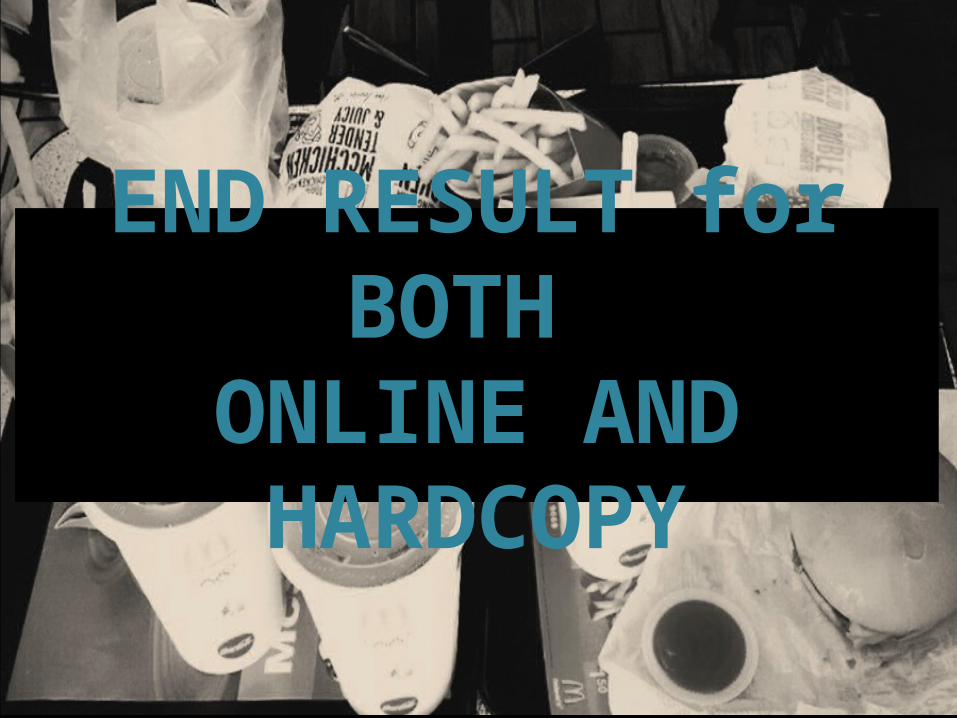
8% (9)
92% (104)
Marital Status
Single
Married
10 - 19 20 - 29 30 - 39 40 - 49 50 - 59 60 - 690
10
20
30
40
50
60
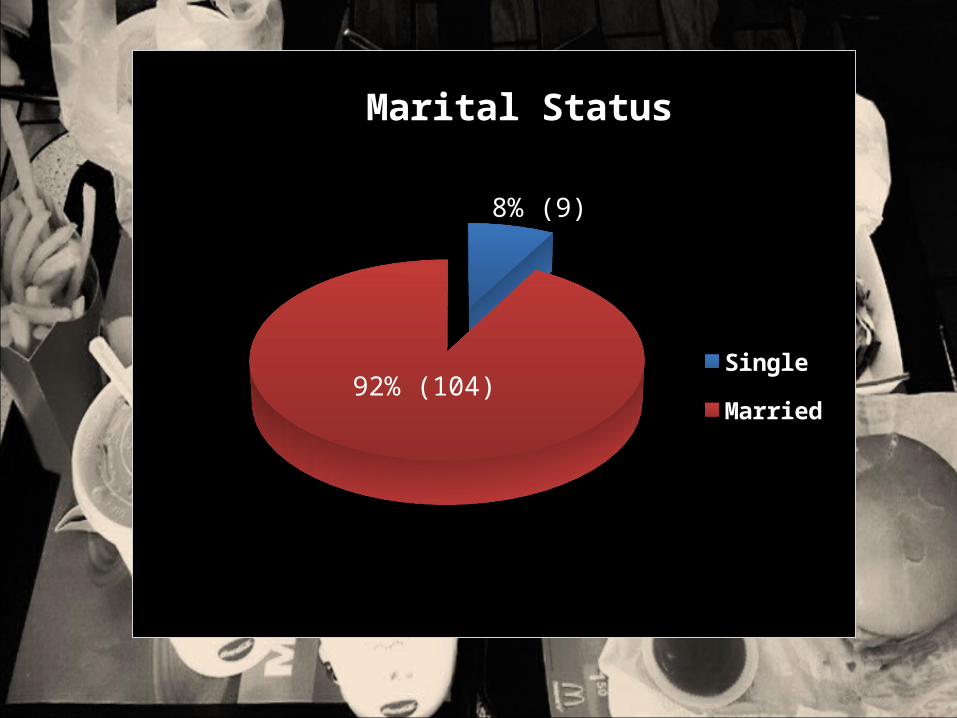
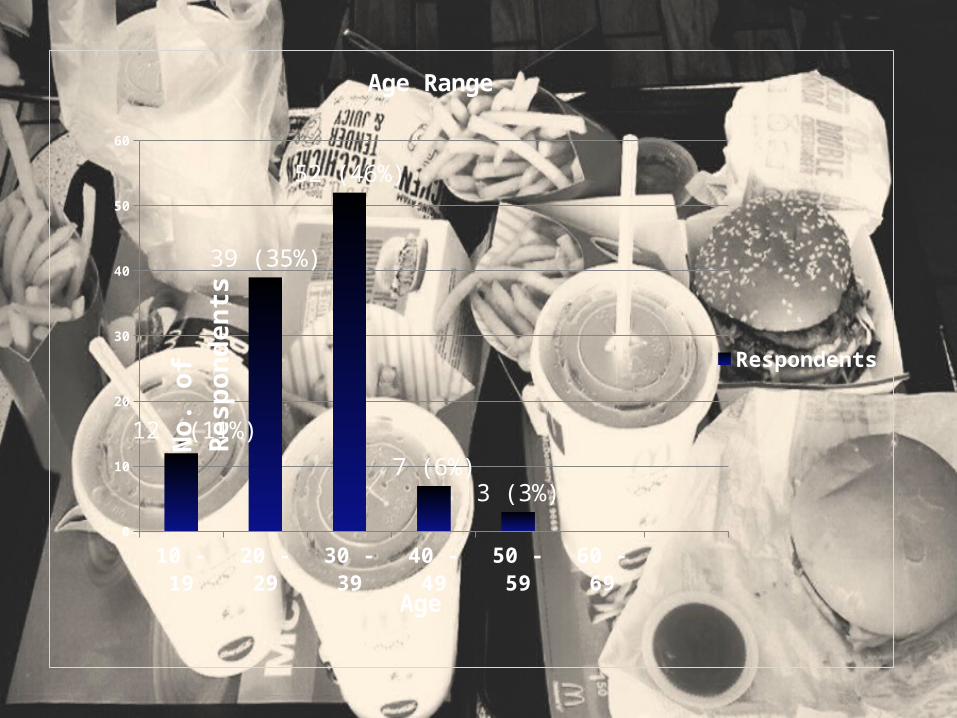
12 (11%)
39 (35%)
52 (46%)
7 (6%)3 (3%)
Respondents
Age Range
Age
No.
of
Res
pon
den
ts

8% (9)
92% (104)
Do you think Fast foods are healthy?
Yes No
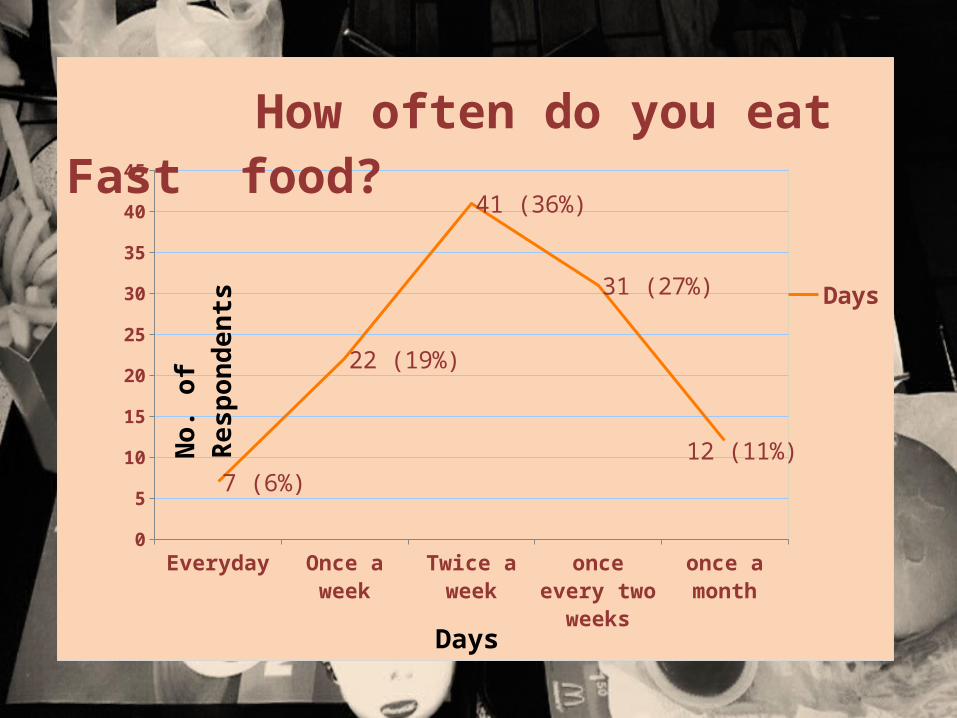
Everyday Once a week Twice a week once every two weeks
once a month0
5
10
15
20
25
30
35
40
45
7 (6%)
22 (19%)
41 (36%)
31 (27%)
12 (11%)
Days
How often do you eat Fast food?
Days
No.
of
Res
pon
den
ts
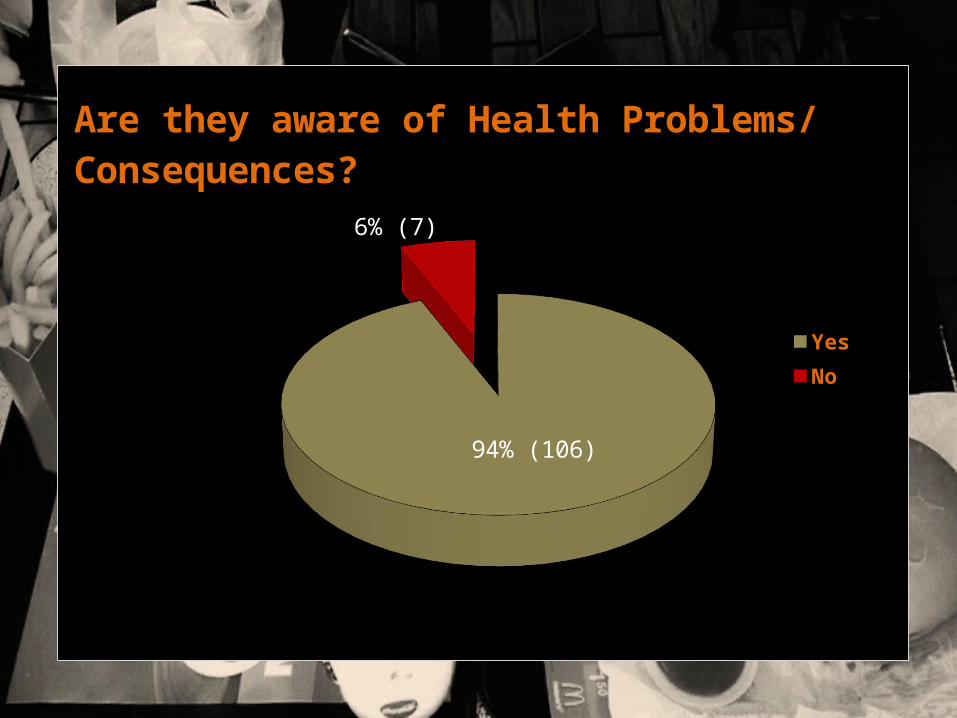
94% (106)
6% (7)
Yes No
Are they aware of Health Problems/ Consequences?
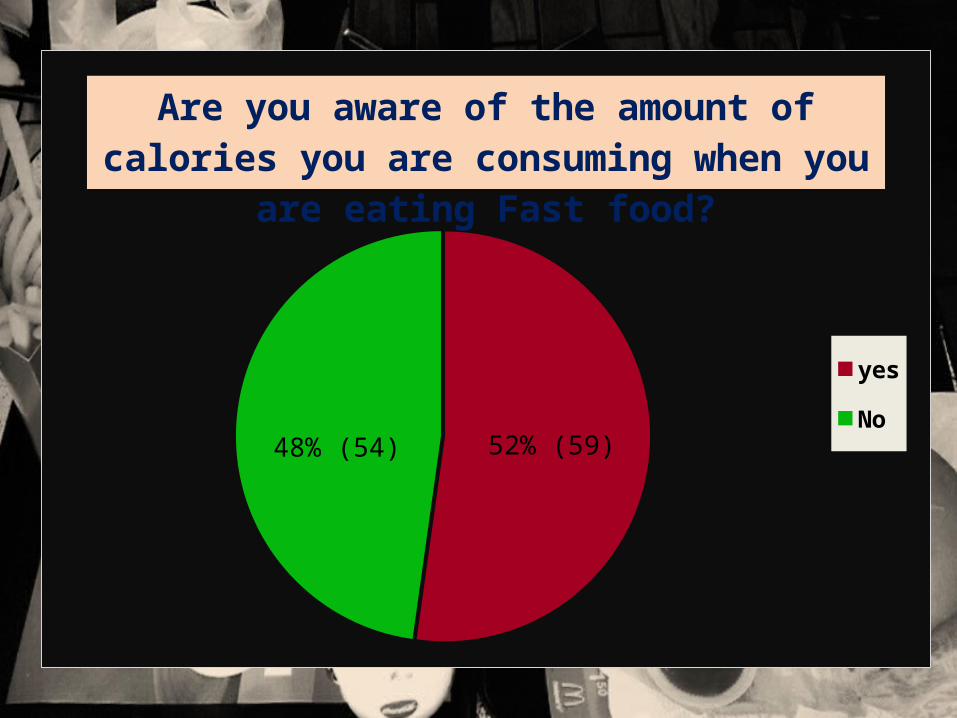
52% (59)48% (54)
yes
No
Are you aware of the amount of calories you are consuming when you are eating Fast food?

82% (93)
13% (15)
4% (5)
1 - 4 =
5 - 8 =
9 - 12 =
How many fast food restaurants are there around your neighbourhood?
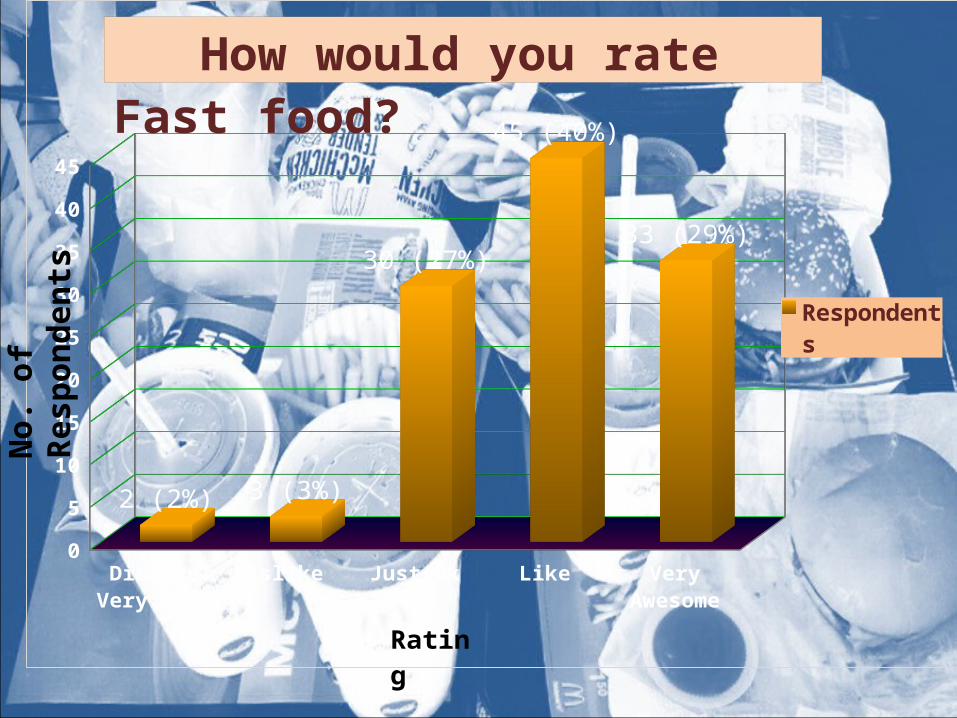
Dislike Very Much
Dislike Just Ok Like Very Awesome
0
5
10
15
20
25
30
35
40
45
2 (2%) 3 (3%)
30 (27%)
45 (40%)
33 (29%)
Respondents
How would you rate Fast food?
Rating
No.
of R
espo
nden
ts

Dislike Very Much
Dislike
Just Ok
Like
Very Awesome
0 5 10 15 20 25 30 35 40 45
2 (2%)
1 (1%)
44 (39%)
37 (33%)
29 (26%)
Respondents
How would you rate local traditional dishes?R
atin
g
No. of Respondents
YesNo
0
10
20
30
40
50
60
70
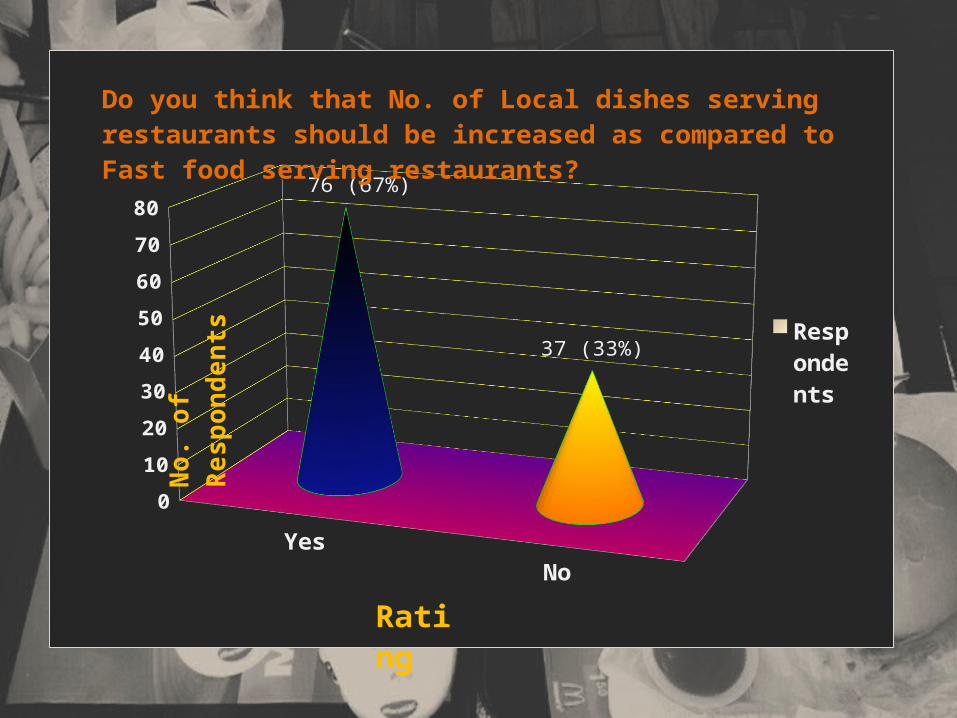
8076 (67%)
37 (33%) Re-spondents
Do you think that No. of Local dishes serving restaurants should be increased as compared to Fast food serving restaurants?
No.
of
Res
pon
den
ts
Rat-ing