End of Project Evaluation Report - United States Agency …pdf.usaid.gov/pdf_docs/pdacu697.pdf ·...
60
1 End of Project Evaluation Report Revitalisation of Smallholder Agricultural Production in Zimbabwe (RSAPZ) 2010-2012 Implemented By World Vision Zimbabwe In Honde Valley, Mutasa District (Manicaland Province) Evaluation Conducted By I.Chaipa, P.Jasi, D. Sango June 2012
Transcript of End of Project Evaluation Report - United States Agency …pdf.usaid.gov/pdf_docs/pdacu697.pdf ·...

1
End of Project Evaluation Report
Revitalisation of Smallholder
Agricultural Production in Zimbabwe
(RSAPZ) 2010-2012
Implemented By
World Vision Zimbabwe
In
Honde Valley, Mutasa District (Manicaland Province)
Evaluation Conducted
By
I.Chaipa, P.Jasi, D. Sango
June 2012
2
TABLE OF CONTENTS Acknowledgements ................................................................................................................................. 3
Executive Summary ................................................................................................................................. 4
1 Introduction .................................................................................................................................... 8
1.1 Background and Context ......................................................................................................... 8
1.1.1 Introduction ........................................................................................................................... 8
1.1.2 The Project ............................................................................................................................. 9
1.2 Evaluation Objectives ............................................................................................................ 11
1.3 Evaluation Methodology ....................................................................................................... 12
1.4 Study Limitations .................................................................................................................. 14
2 Findings and Analysis .................................................................................................................... 15
2.1 Socio-economic Characteristics of Survey Respondents ....................................................... 15
2.2 Key Livelihood Activities and Sources of Income .................................................................. 16
2.3 Household Expenditure ......................................................................................................... 17
2.4 Crop and Livestock Production.............................................................................................. 19
2.5 Overall Project Achievements by Strategic Objectives .......................................................... 22
2.5.1 Strategic Objective 1: High Value Agricultural Production and Productivity Increased22
2.5.2 Strategic Objective 2: Farmer Support Systems Enhanced .......................................... 28
2.6 Relevance .............................................................................................................................. 34
2.7 Effectiveness and Efficiency .................................................................................................. 35
2.8 Impact ................................................................................................................................... 36
2.9 Sustainability ......................................................................................................................... 37
3. Recommendations ........................................................................................................................ 37
4. Conclusion ..................................................................................................................................... 39
5. Annexes ......................................................................................................................................... 40
Annex 1. List of Key Informants ........................................................................................................ 40
Annex 2 Targets and Achievements Matrix ...................................................................................... 41
Annex 3 KEY INFORMANT GUIDE ...................................................................................................... 45
Annex 4 KEY INFORMANT GUIDE ...................................................................................................... 46
Annex 5 RSAPZ End of Project Evaluation : Focus Group Discussion Guide .................................... 47
Annex 6 Household Questionnaire ................................................................................................... 51

3
ACKNOWLEDGEMENTS The authors of this report would like to thank the World Vision International in Zimbabwe and
Partners’ staff for facilitating the evaluation exercise and their full cooperation in all activities and
requests. We would also like to thank all the WVZ partners who volunteered their time and views to
make the exercise a success. Most of all we thank the beneficiaries of the project who demonstrated
a tireless effort to make their own lives better and exemplary for all like-minded individuals who
believe in overcoming poverty.

4
EXECUTIVE SUMMARY World Vision Zimbabwe (WVZ) and its partners (SNV, ZCM, HVSDC) with support from USAID,
implemented the “Revitalization of Smallholder Agricultural Production in Zimbabwe” (RSAPZ)
project in 8 wards of Honde Valley in Mutasa District, Manicaland Province, Zimbabwe. The project
aimed to revitalise small holder agricultural production through increased financial viability of
commercially oriented tea and coffee farmers. The RSAPZ project had 2 strategic objectives (SO).
The first SO was to increase high value agricultural production and productivity and the second SO
was to enhance farmer support systems.
Through these objectives, the RSAPZ project aimed to promote dynamic integrated farming systems
in the Honde Valley targeting 2,000 smallholder farmers to produce high value perennial crops such
as tea and coffee, and annual cash crops such as sugar beans and maize. Farmers were supported
with inputs for summer crops and perennial crops in the 2010-2011 farming season.
The programme collaborated mainly with Honde Valley Smallholder Development Company (HVSDC),
Zimbabwe Coffee Mills (ZCM) and SNV and local stakeholders that included the District
Administration, Rural District council and district government departments such as, AGRITEX
(agriculture) and Irrigation Department (water). WVZ supports government departments with
training but not monetary payments.
In June 2012, WVZ commissioned an End of Project (EoP) Evaluation to assess whether the design,
process and impact of the programme were relevant, effective, efficient and sustainable. The
specific objectives of the evaluation were to;
a. Assess the impact of the programme by reviewing and verifying the data on log frame
indicators as presented in the RSAPZ M&E indicator tracking table (baseline/post
planting/mid-line/post planting comparisons of indicators should be made), and the quality
of M&E systems.
b. Demonstrate how much of the impact can be attributed to WVZ interventions.
c. Investigate what has been the impact of two cross-cutting themes of gender and
environment.
d. Highlight innovative approaches and best practices the programme has used for maximum
impact.
e. Ascertain the quality and sustainability of methods used.
Findings from the evaluation showed that crop sales have continued to be the main source of
income for both beneficiary (94%) and non-beneficiary (80%) households. The proportion of
beneficiary households relying on crop production as the main source of income has risen by 4.4% to
94%. There has been a notable rise in petty trading with 23% of beneficiary households considering
it as a main source of income. Petty trading is also prominent among non-beneficiaries with 40% of
respondents taking it as one of the main sources of income.
Project participants realised higher income levels compared to non-beneficiaries. The average
annual income for project beneficiaries was $1,231.00. On average project participants spent about
$23.00 per month on purchasing mealie-meal whilst non-beneficiaries spent approximately $10.00
per month on the same.

5
Over the last six months, project participants spent more than non-participants in all expenditure
items that include housing construction, school fees, agricultural inputs and clothing items. On
average $157.00 was spent on construction activities whilst non-beneficiaries spent $60.00 on the
same.
Project beneficiaries have more arable land than non-beneficiary households and on average
beneficiary households own 1.8 hectares of arable land whilst non beneficiary households have
access to 1.5 hectares.
More beneficiaries by the end of the project had acquired assets such as sprayers, sickles and
wheelbarrows which are critical in crop production activities, particularly tea. There has been
however a slight reduction in the proportion of households owning ploughs, axes and hand hoes.
The major source of maize meal for both beneficiaries and non-beneficiaries is own production.
About 91% of beneficiaries and 93% of non-beneficiaries rely on own production for maize meal. For
most on-farm foodstuffs most of the farmers rely on own production. More than 50% of project
beneficiaries and non-beneficiaries rely on own production for maize, root tubers, fruits, vegetables
and beans.
On average the last season’s harvest (2011/12) would last project beneficiaries 11.2 months whilst
for non-beneficiaries their harvest would last 12 months. About 75% of beneficiaries harvested
cereals that would last at least 12 months. This was a significant increase compared to the baseline
where 30.8% of beneficiary households harvested cereals that could last at least 12 months. In
focus group discussions, farmers attributed the good harvest in maize crop to the practice of
conservation agriculture.
For the farmers with inadequate cereals to last a season (69 farmers) the main reasons given were
poor rainfall patterns (52.2%), non-availability/affordability of fertiliser (40.6%), non-availability/
affordability of seed (2.9%) and other reasons such as shortage of labour and draught power.
A notable increase in area under cultivation was recorded for coffee and tea. Increasingly, farmers
have been committing more land to coffee production. The project has supported the recovery of
abandoned tea fields and the land committed to tea at the time of the evaluation was very high
(average of 2.4ha). The results indicated that there was an increase in yield for beans, maize and tea
over the 21 month period. However, coffee sales in 2011/12 season were lower than at baseline.
This however, stems from the fact that non-beneficiaries were included in the baseline survey.
Both project beneficiaries and non-beneficiaries had received training in conservation agriculture.
About 92% of RSAPZ beneficiaries and 87%of non-beneficiaries received training in conservation
agriculture. At baseline, 70% of the farmers were using planting basins whilst at evaluation the
proportion of farmers had increased to 83%. The increase in planting basins has also resulted in
marked reduction in the use of conventional hand hoe as a tillage method.
More than 90% of project participants and non-participants received or accessed extension support
services at least once per month. About 21% of project beneficiaries and 13% of non-beneficiaries
received extension services more than 4 times per month. About 77% of beneficiaries received
extension services from AGRITEX whilst 85% received extension services from Zimbabwe Coffee
Millers. Non beneficiaries received extension services entirely from AGRITEX.

6
About 72% of project beneficiaries indicated having encountered problems over the last season of
the project. The key problems encountered by farmers (project beneficiaries and non-beneficiaries)
in the 2011/2012 season relate to erratic rainfall patterns and accessibility of agricultural inputs.
About 52% of respondents (beneficiaries and non-beneficiaries) highlighted insufficient rainfall as
the key problem. This was followed by limited access to appropriate agricultural inputs as
experienced by 29% of project beneficiaries. The project availed summer crop inputs only in the
2010/11 season and the capacity of farmers to purchase adequate inputs for 2011/2012 was still
underdeveloped.
The project conducted trainings in farming as business and imparted marketing techniques and
market intelligence skills to beneficiaries. The results of the evaluation show that there was a
marked improvement in contract buying and open marketing while there were slight decreases in
farmer to farmer marketing as well as selling in cities and or towns.
However, the majority of farmers still do not advertise their produce that includes tea and coffee.
These two crops, tea and coffee have single buyers so advertising is essentially not necessary. A
total of 33.3% and 37.8% of non-beneficieries and beneficieries respectively do roadside marketing.
About 3.2% of beneficieries reported advertising in the local media. This is a marked change from
baseline level where noone advertised through the media and this is a departure from non-
beneficiery practices where noone advertise through the local media. About 20% of beneficieries
rely on contractors to look for customers for them. This is a decrease from the baseline level where
32.2% relied on contactors. This is a sign of empowerment as farmers explore their options in
marketing.
The project was relevant in that it promoted appropriate crops for the area. Honde Valley is a tea
and coffee producing area. Following the economic challenges and difficulties in accessing inputs, it
was necessary to have an intervention that would build production capacities of farmers as well as
establish market linkages and strengthen financial viability of commercially oriented farmers.
Through value chain analysis and enhancement, challenges associated with the shortage of inputs as
noted in the baseline survey report were addressed.
The evaluation makes the following recommendations;
• Crop sales have continued to be the main source of income for both beneficiary and non
beneficiary households in Mutasa. Therefore, the project should continue to focus on crop
production so as to sustain household income as opposed to livestock production. More
emphasis should be put on developing competitive markets for crops to guarantee income.
Whilst there are limited alternative markets for tea and coffee, the project should strive to
improve prices for the crops by strengthening farmers’ bargaining power.
• Agro-dealers should be linked directly to suppliers and a sustainable relationship should be
developed.
• The voucher system should be opened for farmers to access inputs that they value the most.
Farmers should be provided with advanced information on the available inputs and their
prices so as to improve agronomic planning, participation and ownership of the input
system.
• Intercropping food crops and coffee is a short-term solution to food security. As the coffee
plants grow the viability of intercropping especially with maize will become untenable.

7
Whilst promoting the production of cash crops, the project should ensure farmers do
continue to set aside land for food crops to enhance household food security through own
production.
• While the study showed that more farmers are ranking conservation agriculture as the first
choice agriculture production method, conventional hand hoeing came strongly as the
second choice. This therefore means that the gains made in conservation agriculture are not
irreversible. WVZ need to continue availing more information on the benefit of conservation
agriculture to the smallholder farmers as well as promote more user-friendly technologies
e.g. the Chinese hand planter, ripper tines and the jab planter.
• WVZ and its partners played a pivotal role in providing input loans to farmers. It is however
essential that private partners start to play a more leading role in the provision of loans to
farmers for sustainability’s sake.
• The potential for conflicts are high in the irrigation intervention as community level
structures for water management were in their formative stages of development. While the
governance structures that promote democratic processes in the committees are relatively
well developed, the conflict management and prevention structures are almost non-
existent. There is need to continue strengthening these structures to enhance sustainability.
• Through the support of SNV, the smallholder farmers have been able to meet buyers of their
crops. Whilst this is a positive development, the evaluation noted that farmer organisation
is still relatively weak for effective representation in the buyers markets. Further
institutional development, with a particular focus on strengthening commodity associations
to be able to effectively negotiate with input and output suppliers is therefore
recommended.
• Input loan repayments by the farmers were generally very poor with farmers highlighting
low crop production or poor market prices and ill-advised timing for repayment. Whilst
farmers appreciated the essence of the Revolving Loan Fund, its design and operation
modalities need to be clarified and agreed upon by all parties involved. Loan repayments
should have been deferred till a time when selling would have been profitable so as to
protect household incomes. The current situation guarantees business for the input supplier
but not income to the farmer. There is need to consider insuring the farmer against crop
failure as well as the supplier against default both from the farmer and the agro dealer.
1. The HVSDC still need institutional strengthening as farmers are disgruntled or suspicious
over its mandate in the marketing of tea. Its mandate should be on serving farmers’
interests. This also requires that its shareholding should be clarified and become more
transparent, at least to the farmers.
• Finally, the evaluation noted that there was no ample time for pre-start up activities leading
to less linear implementation of project activities. It is therefore recommended that future
programming takes this into consideration to avoid the loss of valuable project time. The
programme participants noted also that it was too early for WVZ to exit. Coffee farmers still
need support as inputs were only received in March 2012 and some of them have not even
signed contracts. A total of 106 farmers still had seedlings that will only be transplanted in
Aug/Sept 2012.
8
1 INTRODUCTION
1.1 Background and Context
1.1.1 Introduction
Smallholder agriculture is undeniably becoming important for developing economies despite fears
that it would be swallowed by the more viable and competitive large-scale and mechanized farming
systems (PS Baker, J Jackson, H Munyua 2008)1. Indeed investment in smallholder agriculture is an
investment in the whole economy. Smallholder agriculture promotes sustainable development and
the inclusion of rural communities, especially the poorest in macro or even global economic
activities. International Fund for Agricultural Development (IFAD) recognizes that smallholder
agriculture is the dominant agricultural activity in most developing countries, particularly in the least
developing countries. Globally, there are about 500 million smallholder farms in the developing
world and they are home to some 2 billion people, including half the world’s undernourished people
and the majority of people living in absolute poverty. In much of Africa and South Asia, small farms
still account for the largest share of agricultural output2.
Smallholder tea and coffee production is as important as any other agricultural activity. The
emphasis on smallholder development is recognised by many donors and development agencies
including the fact that it is in line with the Food and Agriculture Organization of the United Nations
(FAO's) strategic objectives and an important millennium development goal (MDG). The FAO
recognises that globally, smallholder farmers play an important role in the tea sub-sector. In Sri
Lanka for example, smallholder farmers account for 76% of tea production. In Kenya, smallholders
produce 62% of total tea production. In China and Vietnam, tea production is fundamentally
dominated by smallholders. About 43% of the area under tea in Indonesia is owned by smallholder
farmers. In India, an estimated 160 000 smallholders account for over 26% of tea production3
In Zimbabwe, smallholder agriculture has historically been very important for food security and
agricultural production. It has been recognized as one of the strongest and resilient element of
Zimbabwe’s national food security. The advent of the Land reform Program, that has affected large-
scale commercial agriculture, has thrown them back into the limelight. Smallholder farms contribute
between 15 and 20 percent to the national gross domestic product (GDP). However, smallholder
agriculture is under threat from climate change, poor land use approaches, inadequate research and
extension, distorted markets, shortage of farming inputs, economic uncertainty and fluid land rights.
It is not only low production which is a problem; there are also fears of over production without
regard for quality.
In the early 2000s Zimbabwe produced between 20-22 million kgs of tea per annum, of which
8million kgs were exported. Tanganda Tea was the largest producer, packer and exporter of tea
products in Zimbabwe, with four tea estates totaling some 2,000 hectares in the Eastern Highlands
1 PS Baker, J Jackson, H Munyua 2008: Towards an integrated knowledge systems for Smallholder Coffee
Farmers. CABI Commodities, Egham UK and African Regional Centre, Nairobi Kenya
2 http://www.ifad.org/events/agriculture/background.htm
3 http://www.smallholderagriculture.com/

9
around Chipinge near the Mozambique border. These plantations accounted for about half of
Zimbabwe’s tea production, and are rated amongst the world’s leaders in productivity (R Butler
2005)4.
In Zimbabwe tea and coffee production is still largely dominated by large scale estate corporations
like Tanganda Tea and Eastern Highlands Tea Company. However, smallholder farmers including the
Honde Valley Tea Producers Association and the Indigenous Tea Producer Association of Nyanga
have a substantial share in the production process through quality and volume of produce. In the
1990s, about 2000 smallholder farmers produced tea and coffee. In 1992 smallholder farmers
produced about 700MT of coffee but this had declined to only 2.5MT by 20095 .
Mutasa district is one of the tea and coffee producing districts in Zimbabwe. Farmers in Mutasa have
been making significant losses on perennial crops in recent years, which have led to a neglect of tea
and coffee fields. There is therefore a compelling case for revitalizing smallholder agriculture
production.
1.1.2 The Project
World Vision International in Zimbabwe (WVZ) has been implementing an 18 month USAID funded
Revitalization of Smallholder Agricultural Production in Zimbabwe (RSAPZ)The Project was
implemented from 1 October 2010 to 31 March 2012 and was extended to the 30th of June 2012.
Project Site and Location
4 Reg Butler. 2005 Africa Tea Faces Over-production. http://www.teaandcoffee.net/0305/special.htm
5 Project Proposal : 674-A-00-10-00087-00 Zim RSAPZ Signed

10
WVZ has been implementing the project in 8 wards (wards 1, 3, 5, 6, 7, 9, 28 and 30) of Mutasa
District in Manicaland Province of Zimbabwe. Mutasa is on the border of Zimbabwe and
Mozambique. The climate of Honde Valley falls within the Savannah sub –Tropics with an average
altitude of 900m. From late October to around the end of April, the weather is hot and humid.
Temperatures may rise up to 28 ˚C and this is the period where most of the rainfall is received. From
May to the beginning of July, the temperatures are very low and they may hover around minimums
of 2 ˚C while August is very windy. From September to October, it is very hot and the maximum
temperatures may average 30 ˚C Honde Valley falls within natural region 1 and 26. Most of the
rainfall experienced is of the convectional type. At times orographic rainfalls at various times of the
year, in addition to the normal convectional rainfall are also received. This portion of the country,
therefore, receives the highest rainfall in the country7. About 500 square kilometers in Honde Valley
is cultivated often with gravity fed irrigation.
Project Objectives
The overall goal of the project is to revitalize smallholder agricultural production in Honde Valley
through increased financial viability, of commercially-oriented tea and coffee farmers who have
sustained significant losses in recent years due to recent political and economic crisis that resulted in
the collapse of national markets.
The project promoted dynamic integrated farming systems in Honde Valley, directly supporting 1700
farmers to produce high-value perennial crops such as tea and coffee and annual food/cash crops
such as maize, sugar beans and groundnuts. A value-chain analysis approach was conceptualized
and the project envisaged that capacity building, demand-driven production and private-public
partnership would provide an enabling environment for increased participation, production and
income. It was believed that the project would generate increased employment and income for 6400
households (38 400 individuals), 6000 private sector employees. To achieve this, the project strove
to deliver on two strategic objectives and intermediate results as outlined in the table 1.
6 Mushunje 2008
7 http://en.wikipedia.org/wiki/Honde_Valley

11
Table 1: Project Objectives, Outcomes and Activities
Objectives KEY Outcomes Key Activities
SO1 –
Production
and
Productivity
Increased
IR1.1 Small scale farming
practices improved
1.1.1 Train specialized crop extension workers on tea & coffee production
1.1.2 Provision of specialized crop extension services
1.1.3 Train farmers on conservation farming, integrated farming systems
(intercropping, livestock management)
1.1.4 Conduct farmer field school days for all crops
IR1.2 Improved natural and
water resource
management
1.2.1 Farmers trained on water harvesting and water conservation, & soil
management
1.2.2 Small-scale gravity fed water harvesting pipes installed
IR1.3 Increased access and
availability of agricultural
inputs
1.3.1 Distribute maize, ground nuts & sugar bean inputs using a voucher-
based system (seed, fertilizer)
1.3.2 Quality control of agricultural inputs
1.3.3 Increase local nursery capacity and seedling production for tea and
coffee
1.3.4 Purchase and distribute tea and coffee seedlings to farmers
IR 1.4 Increased capacity for
farmers to develop business
oriented production and
marketing solutions
1.4.1 Mobilize farmers associations
1.4.2 Strengthen farmers associations
1.4.3 Develop and package training materials
1.4.4 Conduct ToT for extension staff on business mgmt training
1.4.5 Train farmers on market intelligence and business management
skills
1.4.6 Train farmers on crop quality aspects
SO2 – Farmer
Support
Systems
Enhanced
IR2.1 Increased capacity for
farmers to develop business
oriented production and
marketing solutions
2.1.1 Conduct value chain analysis for cash crops (maize, gnuts, sugar
beans, coffee, tea)
2.1.2 Facilitate dialogue among value chain actors
2.1.3 Compile and disseminate market intelligence information
2.1.4 Monitor implementation of agreements by actors
IR2.2 Improved linkages
between input and output
suppliers
2.2.1 Develop partners' capacity strengthening plans
2.2.2 Facilitate capacity building of partners on business management
2.2.3 Mentor partners on value chain analysis and market linkages
2.2.4 Implement the capacity strengthening plans of local partners
(training, coaching, mentoring)
2.2.5 Capacity building of partners on tea and coffee production &
processing
2.2.6 Facilitate access of extension staff to communities
1.2 Evaluation Objectives
The evaluation was commissioned by WVZ with the aim of providing WVZ and its partner
organizations a critical review of project performance as measured against project objectives.
According to the terms of reference, the evaluation intends to measure the extent to which the
project has met its objectives and the identification of key lessons that can be used in interventions
elsewhere.

12
The evaluation assessed whether the design, process and impact of the programme were relevant,
effective, efficient and sustainable. These findings demonstrate the overall impact of the
programme. In design and execution of the evaluation, the consultants bore in mind the fact that
the project was a pilot and thus was a learning process. Therefore the consultants dwelt more on the
processes that led to project outcomes so that they may inform future programming.
Specific objectives
a. Assess the impact of the programme by reviewing and verifying the data on log frame
indicators as presented in the RSAPZ M&E indicator tracking table (baseline/post
planting/mid-line/post planting comparisons of indicators should be made), and the quality
of M&E systems.
b. Demonstrate how much of the impact can be attributed to WVZ interventions.
c. Investigate what has been the impact of two cross cutting themes of gender and
environment.
d. Highlight innovative approaches and best practices the programme has used for maximum
impact.
e. Ascertain the quality and sustainability of methods used
The evaluation came up with lessons learnt, best practices, conclusions and recommendations. The
findings will inform the design and implementation of future programmes and will be used to
influence policy.
1.3 Evaluation Methodology
A holistic multi-method approach was used to evaluate the project. Qualitative, quantitative and
participatory evaluation techniques were employed to generate as much information as necessary
for assessing project performance as well as drawing lessons from the programme implementation.
The main methods used were Document Review, In-depth Key Informant Interviews, A Household
Questionnaire Survey, personal observations and Focused Group Discussions.
Review of Documents/ Desk Review
The consultants reviewed several organizational documents and other sector documents from FAO,
IFAD and other researchers. WVZ staff were extremely cooperative in providing project documents
like the Proposals/Contract, Log frame, Coverage and Target Matrixes, , the Baseline Report, Pre-
post harvest survey reports, Project Quarterly Progress Reports , Ward-based (Excel-based)
Databases, project review reports, Partner reports (SNV Feasibility Assessment report). Access was
also given to raw data for previous assessments. A careful review of these documents provides
background and valuable evaluative information on the program components and activities that
were implemented by WVZ and Partners under this Project in Honde Valley.
Field-Based Evaluation Activities
Field work employed a combination of four techniques. These were In-depth individual interviews, a
questionnaire survey method, group discussions and personal observations.

13
(a) In-depth Individual Interviews (III)
Twelve In-depth individual interviews (III) were conducted with lead project beneficiaries at ward
level, key WVZ and partners’ staff members and local community leaders in the respective wards.
Three III guides (Annex 3) were developed for the various key individuals that were interviewed. A
snowball sampling method was used to select key informants among partner staff. Key leaders were
selected using purposive sampling based on their knowledge of the subject matter and the fact that
he or she is an elected leader of a producer group or community. A list of Key Informants
interviewed is attached in the annexes (Annex 2).
(b) Community Workshops and Focus Group Discussions
Three ward level Community Workshops were held, one per ward for wards 1, 5 and 7. Each
workshop was attended by direct project beneficiaries, men and women from the target
communities and other local leaders. A total of 84 people (56 women and 28 men) attended the
workshops, 60 being project beneficiaries and 24 non-beneficiaries of comparative socio-economic
status. The wards were clustered according to tea producing, coffee producing and wards producing
both tea and coffee. One ward was purposively selected from each cluster for the community
workshops and FGDs. See Annex 4 for FGD Guide.
(c) Household Questionnaire Survey
A semi-structured questionnaire was developed and administered among a representative sample of
project beneficiaries. The questionnaires were administered by five trained enumerators under the
supervision of the consultants. A total of 239 questionnaires were administered (199 beneficiaries
and 40 non-beneficiaries). Respondents were randomly selected from the ward beneficiary database
and village household lists. The sample for beneficiaries was drawn from participants interviewed
during the post harvest survey as it was noted that some of the baseline respondents were not
eventual beneficiaries. Non beneficiaries were selected randomly from the village list.
(d) Observations
Five Site visits were made to smallholder plots in Wards 1, 5 and 7. The consultants toured tea and
coffee fields as well as the Irrigation pipeline in ward 7. The consultants also visited the coffee mill
and nursery at the HVSDC. These visits were meant to yield information on the state of
infrastructure development, suitability of sites and production issues as well as verifying agronomic
techniques.
Data Analysis and Reporting
Data collected using the various qualitative techniques were analysed using textual, gender,
contextual analysis. Quantitative data from activity reports, output data files and other sources were
reviewed, collated and verified during site visits. Once questionnaires were filled in they were then
coded and monitored for quality by the consultants. The questionnaires were entered into a
centralized SPSS record file for statistical computations. The responses were subjected to descriptive
analysis, frequency analysis, cross-tabulations and significance tests.
Comparisons of baseline, post harvest and end of project survey data was conducted to establish
trends that are attributable to the project. Although analysis of such variables as household

14
demographics was done across the three phases, it was noted that the change is very marginal to
establish any meaningful trends that can be attributed to the project. Hence, key focus on trend
analysis was on changes in crop production, income, expenditure, asset accumulation and area
under cultivation.
To address the issue of attribution, analysis was also done through comparison of conditions or
performance of beneficiaries versus non beneficiaries.
1.4 Study Limitations
The field study was conducted over a period of 6 days. With a limited time frame for field work the
evaluation team had to conduct key informant interviews, focus group discussions and household
interviews almost at the same time. This did not allow for ample time to follow up on some
emerging issues arising during the course of study. In addition, whilst every effort was made to
interview all planned key informants, it was not possible to further reschedule some interviews
beyond the allocated period of field work. In order to guard against drawing conclusions based on
individual perspectives, the researchers have ensured that the results presented in the report
received reasonable triangulation. This has been achieved through validation of data collected from
different sources and through the use of different research methods as highlighted.

15
2 FINDINGS AND ANALYSIS
2.1 Socio-economic Characteristics of Survey Respondents
The following demographic and socio-economic characteristics of interviewed households serve the
purpose of describing the key characteristics of participants that may have direct or indirect
implications on the impact of the programme interventions. On most occasions, these characteristics
are very much similar to the condition at the start of the project.
Marital Status and Sex of Household Head
Most heads of households from the interviewed sample were married. Table 2 shows that 77.7%
and 80% of household heads from project beneficiaries and non-beneficiaries, respectively, were
married. The widowed represented 19% and 13.3 % of beneficiary and non- beneficiary households
respectively.
Table 2: Marital status of household heads
Marital Status Beneficiary Non Beneficiary
Single/Never married 1.4% 6.7%
Married 77.7% 80.0%
Divorced/Separated 1.9% 0.0%
Widowed 19.0% 13.3%
Female headed households constituted 28.6% of beneficiary households and 25% among non-
beneficiary households. At baseline and post harvest survey periods, female headed households
constituted 30.7% and 31.3% of respondents interviewed. There is very little difference in the
proportion of female headed households across the three phases.
Level of Education of Household Head
Literacy levels for both beneficiary and non-beneficiary household heads were surveyed. Table 3
shows that 42.4% of household heads from project participants and 86.7% of non-beneficiary
households had completed Ordinary Levels.
Table 3: Level of education of household heads
Level of Education Beneficiary Non Beneficiary
No School 1.8% 6.7%
Some primary (but not completed grade 7) 11.5% 0.0%
Completed Primary 21.7% 6.7% Some Secondary (but not completed O Level) 19.8% 0.0%
Completed O Level 42.4% 86.7%
Completed A Level 0.5% 0.0%
Some/completed tertiary 1.8% 0.0%

16
Average Household Size
The household size is important in determining labour constrained households and labour endowed
households. Table 4 shows that on average, beneficiary households had 5 members whilst non-
beneficiary households had 6 members. Within each category, 2 members were economically active.
Table 4: Demographic Features of Households
Beneficiary Households Non-beneficiary Households
Mean Household Size 5 6
Average Number of
economically active members
2 2
Average number of children 3 4
2.2 Key Livelihood Activities and Sources of Income
Households in Honde Valley are engaged in a number of livelihood activities. The key activities
included crop production, livestock production, petty trading and provision of skilled and unskilled
labour services.
Main Sources of Income
Table 4 shows a multiple response analysis for the main sources of household income at baseline
and over the last year of the project. Crop sales have continued to be the main source of income for
both beneficiary and non-beneficiary households.
Table 5: Household Main Sources of Income (Before and After the Project)
Income source Beneficiary Non Beneficiary
Baseline After Project Baseline After Project
Rental of property 6.10% 1% 7.10% 0%
Crop sales 89.60% 94% 85.70% 80%
Animal sales/animal product sales 10.40% 4% 7.10% 0%
Unskilled wage labour 6.10% 6% 7.10% 33%
Skilled labour(artisan) 7.00% 2% 2.90% 7%
Petty trading 6.10% 23% 8.60% 40%
Small business 9.60% 10% 1.40% 7%
Remittances 16.50% 12% 20.00% 7%
Casual agric labour (maricho) 41.70% 14% 27.10% 7%
Government allowance/ Pension 2.6% 5% 2.9% 7%
The proportion of beneficiary households relying on crop production as the main source of income
has risen by 4.4% to 94%. This has been a result of increased tea production due to recovered fields,

17
according to respondents in all the three wards. An interview with the HVSDC CEO revealed that tea
yields and income has risen since the project started in Oct 2010.
There has been a notable rise in petty trading with 23% of beneficiary households considering it as a
main source of income. Petty trading is also prominent among non-beneficiaries with 40% of
respondents taking it as one of the main sources of income. Commodities mainly traded were
highlighted as yams, naartjies, bananas and small livestock by participants in FGDs in Ward 1 and 3.
It is also important to note that casual agricultural labour has declined significantly as the main
source of household income from 41.7% of the beneficiary households at the start of the project to
14% of beneficiary households at project end. Beneficiary households noted during FGDs that they
were now investing their labour towards improving own production in their tea fields vis-a-vis selling
their labour for income generation. With low market prices for tea and the need to repay input
loans, the participants pointed out that it was becoming difficult to pay casual labour, especially as
the loan amounts were being deducted at the point of sale. Some participants indicated getting
almost nothing after loan deductions.
Total Household Income
Project participants realised higher income levels compared to non-beneficiaries. Table 5 shows that
the average annual income for project beneficiaries was $1,231.00 ($3.37 per day) compared to
$866 for non-beneficiaries. Increased income was a result of crop sales, particularly tea sales as
confirmed through KII, focus group discussions and the household questionnaire survey.
Table 6: Average household income from main source
Beneficiary Status Average Annual Income (USD)
RSAPZ $1,231.00
Non Beneficiary $866.00
All $1,207.00
According to HVSDC CEO, the gross income from tea sales rose from $66,268.08 to $144,360.46
between 1st
December 2010 to April 2011 and 1st December 2011 to April 2012. This represents
more than 117% increase in gross income. However, after deductions of transport costs and loan
amounts, the final amount that gets to the farmer is significantly reduced.
2.3 Household Expenditure
An assessment of household expenditure patterns shows that project participants spent more than
non-participants on a monthly basis in purchasing household food and non-food items. Figure 1
shows that on average project participants spent about $23.00 per month on purchasing mealie
meal whilst non-beneficiaries spent approximately $10.00 per month on the same. This is correlated
to relatively higher disposable income levels accruing to project participants as compared to non-
participants and indicates that as HH income increases, families spend more money on food staples
such as mealie meal.
18
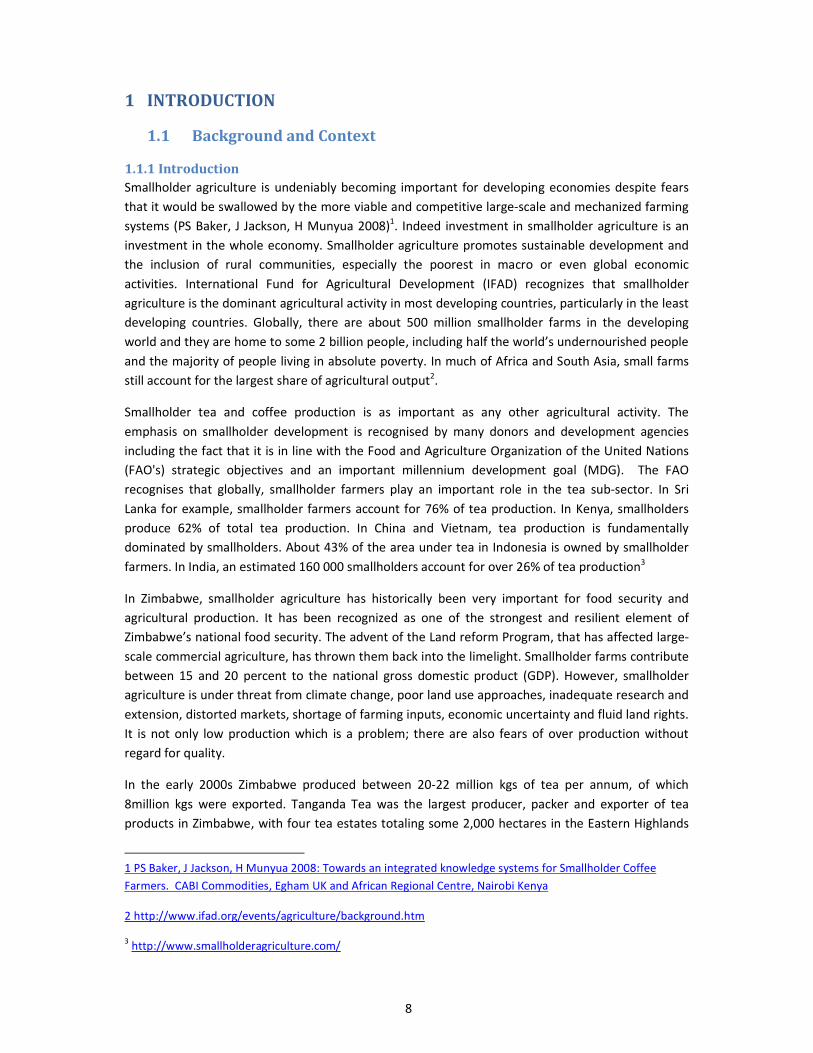
Figure 1: Average Amount spent on household food and non foodstuffs over the last month
Similarly project participants spent more (about $28.00 on average) on no- food items compared to
$17.00 spent by non-beneficiaries.
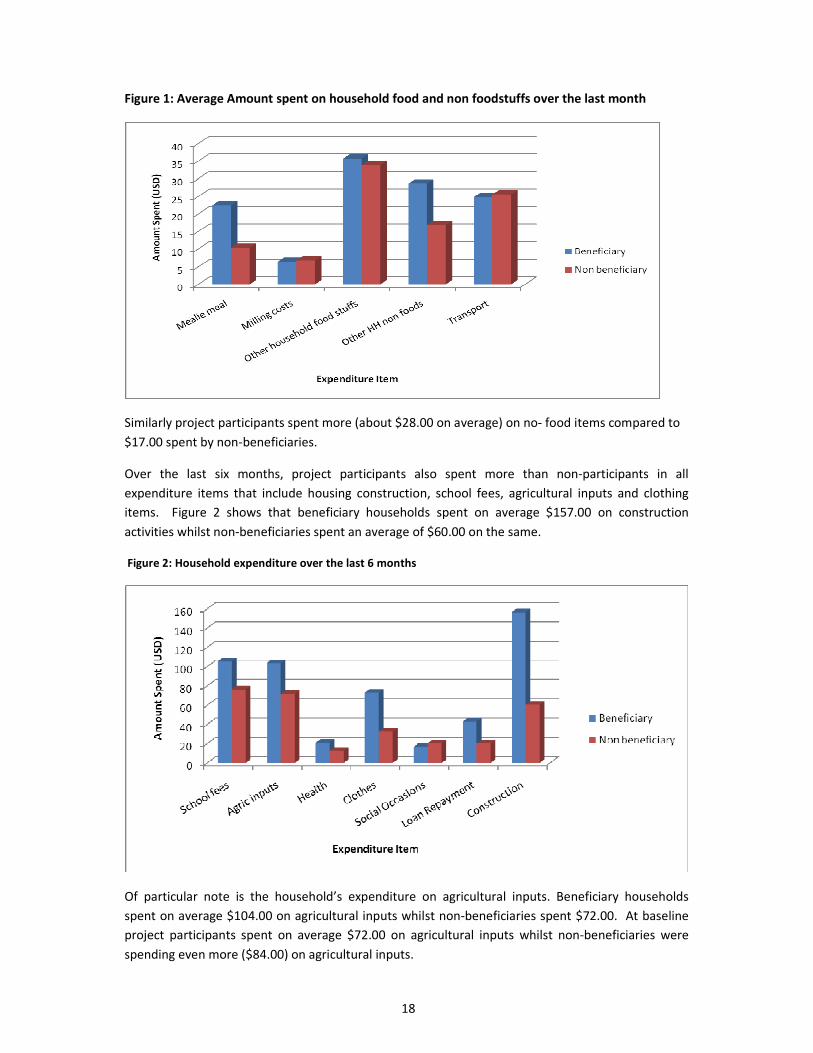
Over the last six months, project participants also spent more than non-participants in all
expenditure items that include housing construction, school fees, agricultural inputs and clothing
items. Figure 2 shows that beneficiary households spent on average $157.00 on construction
activities whilst non-beneficiaries spent an average of $60.00 on the same.
Figure 2: Household expenditure over the last 6 months
Of particular note is the household’s expenditure on agricultural inputs. Beneficiary households
spent on average $104.00 on agricultural inputs whilst non-beneficiaries spent $72.00. At baseline
project participants spent on average $72.00 on agricultural inputs whilst non-beneficiaries were
spending even more ($84.00) on agricultural inputs.

19
The higher expenditure levels by project participants on such items as school fees, clothing, health
and construction activities contributes towards improved living conditions for the beneficiary
households.
2.4 Crop and Livestock Production
Land Ownership
On average, project beneficiaries have more arable land than non beneficiary households. Table 7
shows that on average beneficiary households own 1.8 hectares of arable land whilst non-
beneficiary households have access to 1.5 hectares of arable land.
Table 7: Average size of arable land for project beneficiaries
Beneficiary Status Mean (ha) Minimum (ha) Maximum (ha)
Beneficiary 1.8 0.4 5
Non-beneficiary 1.5 0.8 3
Agricultural Asset Ownership
The ownership of agricultural assets is important for improved production. Figure 3 shows that more
beneficiaries at the end of the project have acquired assets such as sprayers, sickles and
wheelbarrows which are critical in crop production activities, particularly tea. There has been
however a slight reduction in the proportion of households owning ploughs, axes and hand hoes.
Figure 3: Ownership of productive assets by project beneficiaries
Livestock Ownership
Ownership of livestock is generally very low in Honde Valley. At baseline, the proportion of
households that own cattle was 6.3%. A slight increase was recorded at the end of the project with

20
10.6% of households in ownership of at least one cow. Ownership of cattle among non-beneficiaries
has continued to be low with 6.7% of non-beneficiaries interviewed at the end of the project
indicating ownership of cattle. Ownership of small livestock such as goats and poultry has fallen
down compared to the situation at the start of the project. At project start 64.7% of beneficiaries
owned goats whilst at the end of the project the proportion of goat owners has fallen to 53.5%.
Household Food Consumption
Survey data indicates that both beneficiary and non-beneficiary households had almost equal access
to different types of foodstuffs over the last seven days. Figure 4 shows that foodstuffs consumed
for at least 4 days in the week include maize meal (sadza), sugar, vegetables, fruits and milk. This
demonstrates that the smallholder farmers had good consumption of carbohydrates and vitamins
whilst protein rich foodstuffs (meat, beans and poultry) were consumed on average 2 times per
week.
Figure 4: Average number of days particular foodstuffs were consumed over the last week
Compared to the post harvest results, this pattern of consumption is not very different where both
beneficiaries and non-beneficiaries had similar consumption patterns. However, it is worthy to note
that there are some slight increases in the average number of days particular foodstuffs are
consumed by both beneficiaries and non-beneficiaries, especially eggs, fish and milk.
Source of foodstuffs
The major source of maize-meal for both beneficiaries and non-beneficiaries is own production.
About 91% of beneficiaries and 93% of non-beneficiaries rely on own production for maize-meal. For
most on-farm foodstuffs most of the farmers rely on own production. Figure 5 shows that more than
50% of project beneficiaries and non-beneficiaries rely on own production for maize, root tubers,
fruits, vegetables and beans.

21
Figure 5: Contribution of own production to household food by proportion of respondents
Most farmers rely on purchases for the following foodstuffs; other cereals, bread/flour, milk, sugar,
beef, fish and oils.
Household Food Security
It is also important to note that the survey was conducted during the period when farmers had just
harvested their crops and hence food was abundantly available in the household. Hence, the
quantities harvested become critical in determining the level of household food security over the
year.
On being asked how many months of cereal consumption the last season’s harvest would last,
project beneficiaries indicated an average of 11.2months whilst for non-beneficiaries the average is
12 months. About 75% of beneficiaries harvested cereals that would last at least 12 months. This
was a significant increase compared to the baseline where 30.8% of beneficiary households
harvested cereals that could last at least 12 months. In focus group discussions, farmers attributed
the good harvest in maize crop to the practice of conservation agriculture.
For the farmers with inadequate cereals to last a season (N = 69) the main reasons given were;
a. Poor rainfall patterns – 52.2% of respondents
b. Non-availability/affordability of fertiliser- 40.6% of respondents
c. Non availability/ affordability of seed- 2.9% of respondents
d. Other (Shortage of labour, draught power)- 4.2% of respondents
Household Hunger Scale
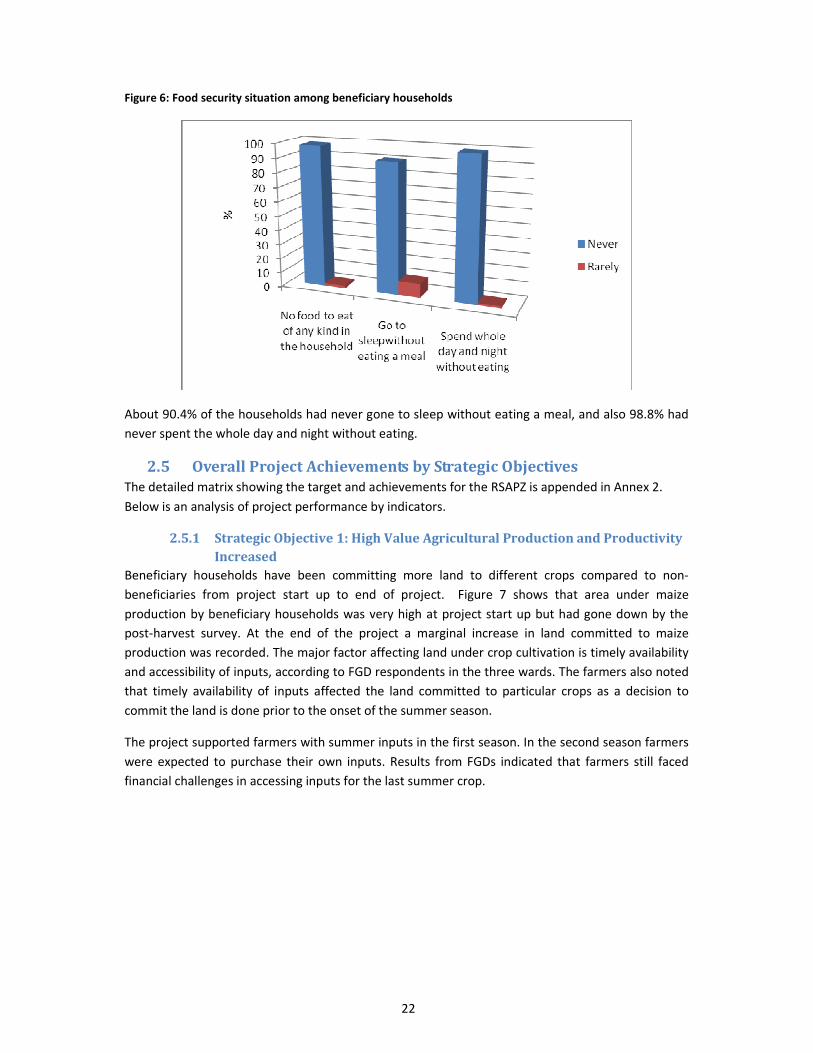
Figure 6 shows that project beneficiaries are generally food secure. About 98% of households had
never experienced a situation where there was no food in the household over the last 12 months.
22
Figure 6: Food security situation among beneficiary households
About 90.4% of the households had never gone to sleep without eating a meal, and also 98.8% had
never spent the whole day and night without eating.
2.5 Overall Project Achievements by Strategic Objectives
The detailed matrix showing the target and achievements for the RSAPZ is appended in Annex 2.
Below is an analysis of project performance by indicators.
2.5.1 Strategic Objective 1: High Value Agricultural Production and Productivity
Increased
Beneficiary households have been committing more land to different crops compared to non-
beneficiaries from project start up to end of project. Figure 7 shows that area under maize
production by beneficiary households was very high at project start up but had gone down by the
post-harvest survey. At the end of the project a marginal increase in land committed to maize
production was recorded. The major factor affecting land under crop cultivation is timely availability
and accessibility of inputs, according to FGD respondents in the three wards. The farmers also noted
that timely availability of inputs affected the land committed to particular crops as a decision to
commit the land is done prior to the onset of the summer season.
The project supported farmers with summer inputs in the first season. In the second season farmers
were expected to purchase their own inputs. Results from FGDs indicated that farmers still faced
financial challenges in accessing inputs for the last summer crop.

23
Figure 7: Area under crop cultivation in the different phases of the project8
A notable increase in area under cultivation was recorded for coffee and tea. Increasingly, farmers
have been committing more land to tea and coffee cultivation.
The project has supported the recovery of abandoned tea fields and the land committed to tea at
the time of the evaluation more than doubled and could sustain commercially viable production. The
recovery of abandoned tea fields was made possible through the facilitation of SNV in establishing
contract farming that saw the farmers being linked to HVSDC. As part of the linkage, HVSDC provided
pruning technology for reclamation of about 450 hectares of overgrown and abandoned tea fields.
On the other hand, non-beneficiaries were not able to recover their tea plantations. From group
discussions, it was pointed out that without external support it was not profitable to work on the
plantations largely due to depressed market prices.
Area under Cultivation, Yield and Sales
Table 8 shows that area under maize production decreased in the first season from 1.1ha to 0.63ha
as farmers committed some land to coffee.
Table 8: Project Period by Average Area Cultivated, Yield and Sales
Project
Period
Maize Sugar beans Coffee Tea Area
(ha)
Yield
(kg)
Sales
(kg)
Area
(ha)
Yield
(kg)
Sales
(kg)
Area
(ha)
Yield
(kg)
Sales
(kg)
Area
(ha)
Yield
(kg)
Sales
(kg)
Baseline 1.1 640.8 81.6 0.4 ND ND 0.55 166 140 0.9 3442 ND
Post Harvest
Survey 0.63 541.8 141 0.18 63.7 ND 0.68 ND ND ND ND ND
Evaluation 0.75 645 15 0.22 77.9 18 0.78 ND 403 2.4 4814 3614
8 Area under tea production is based on RSAPZ APS FY12 Q2.

24
In the 2011/2012 season, the practice of intercropping saw the area under maize production
increasing from 0.63ha to 0.75 ha. At baseline maize production per hectare was 0.583t and at
evaluation it increased to 0.86t/ha. The results indicated that there was an increase in yield for
beans, maize, coffee and tea over the project period.
IR 1.1 Small scale farming practices improved
The project intended to improve small scale farming practices through extension support,
conservation agriculture and farmer mentoring.
Conservation Agriculture
Both project beneficiaries and non-beneficiaries had received training in conservation agriculture by
the time of the evaluation. About 92% of RSAPZ beneficiaries and 87%of non-beneficiaries received
trainings in conservation agriculture from AGRITEX and SAT that started even prior to the inception
of the RSAPZ project. This shows that conservation agriculture was established in the area well
before the project, as confirmed by the AGRITEX key informants. In the last season, project
beneficiaries committed 1hectare, on average, to conservation agriculture whilst the average land
area under conservation agriculture for non-beneficiaries was 0.6 hectares. Specifically, farmers
received training from AGRITEX that included mulching, micro-dosing and crop rotation.
Tillage Methods by Proportion of Farmers
Figure 8 shows that planting basins has continued to be the main tillage method used by the
farmers. At baseline, 70% of the farmers were using planting basins whilst at evaluation the
proportion of farmers had increased to 83%. The increase in planting basins has also resulted in
marked reduction in the use of conventional hand hoe as a tillage method.
Figure 8: Tillage methods used by proportion (%) of farmers
The fact that a large proportion of farmers had been using planting basins at baseline shows that
conservation agriculture had been introduced and adopted by most farmers before the RSAPZ

25
project. The project has however further promoted conservation agriculture leading to the increased
number of farmers using planting basins, according to KIIs with AGRITEX officers.
While the study showed that more farmers ranked planting basins as the first choice agriculture
production method, conventional hand hoeing came strongly as the second choice. This therefore
means that the gains made in conservation agriculture are not irreversible. The project needs to
continue providing technical back-up support and conduct awareness raising sessions on the
benefits of different techniques of conservation agriculture to the beneficiary communities.
Promotion of more user-friendly technologies such as the Chinese hand planter, ripper tines and the
jab planter is recommended.
Rainwater Harvesting and Moisture Retention
The most common method of moisture retention practised by smallholder farmers is mulching.
Figure 9 shows that at project start up (baseline) about 58% of targeted project beneficiaries
practised mulching. By the end of the project, the proportion of project participants practising
mulching had risen to 86%. Almost an equal proportion of non-beneficiaries (87%) practise
mulching. This demonstrates a high adoption level of the technique by non-beneficiaries that can be
attributed to effectiveness of the technique in enhancing productivity. Non-beneficiaries, during
FGDs, indicated that they adopted the CA principles after having noted high yields accruing to
project participants.
Figure 9: Proportion of smallholder farmers practising particular water harvesting techniques
The use of furrows as a water harvesting technique rose from 3.6% at baseline to 15.2% by the end
of the project. The project has also seen an increased number of farmers (beneficiaries and non-
beneficiaries) using rivers/streams for irrigation purposes. This may be attributed to the irrigation
component of the project that has motivated more smallholder farmers to productively utilise

26
available water resources. At a community workshop in Samanga ward it was noted that some
farmers, with the anticipation of getting project assistance, had identified water sources for
irrigating their coffee fields. The farmers were now looking forward to WVZ to assist them in
establishing the irrigation schemes.
Extension Support
More than 90% of project participants and non-participants received or accessed extension support
services at least once per month. About 21% of project beneficiaries and 13% of non-beneficiaries
received extension services more than 4 times per month. About 77% of beneficiaries receive
extension services from AGRITEX whilst about 85% of coffee farmers received extension services
from Zimbabwe Coffee Millers. Non-beneficiaries received extension services entirely from AGRITEX.
Availability of extension services may have contributed to the high adoption levels of conservation
agriculture technologies.
Major Farming Problems in 2011/2012 Season
About 72% of project beneficiaries indicated having encountered problems over the last season of
the project. The key problems encountered by farmers (project beneficiaries and non-beneficiaries)
in the 2011/2012 season relate to erratic rainfall patterns and accessibility of agricultural inputs.
About 52% of respondents (beneficiaries and non-beneficiaries) highlighted insufficient rainfall due
to climatic change as the key problem. This is followed by limited access to appropriate agricultural
inputs (seeds and fertilisers) as experienced by 29% of project beneficiaries.
Compared to the baseline where 75% of farmers cited lack of adequate rains as the main challenge,
unreliable rainfall patterns continue to be a key problem affecting smallholder agricultural
production. The project’s irrigation component is yet to bear fruit as at the time of the evaluation
the infrastructure was yet to be completed for optimum results to be realised.
The project supported farmers with agricultural inputs in the first season (2010-2011). Whilst this
was important in revitalising a sector that had been adversely affected by economic problems
spanning over a decade, one season of project support would not restore the farmer’s capacity to
access own agricultural inputs without external support as evidenced by the failure by farmers to
acquire own summer crops inputs for the 2011/12 season. Moreover, optimum productivity was
also affected by the poor rainfall patterns experienced according to AGRITEX.
IR1.2 Improved natural and water resource management
The project sought to increase natural and water resources management through training farmers in
water harvesting and the installation of small-scale gravity–fed water harvesting pipes.
At the time of the evaluation, small-scale gravity fed water harvesting pipes installation was at an
advanced stage in Ward 7. However, this component of the project took long to complete as it was
not adequately budgeted for. It was only after budgetary realignment that planned activities were
carried out to completion right at the end of the project. This therefore leaves no time for
monitoring and supervision of the established systems.

27
The principles of Conservation Agriculture that were rolled out by Agritex with support from WVZ
emphasised on soil conservation issues, according to AGRITEX and WVZ key informant interviews.
Farmers were encouraged to use vertiva grass for contouring and the emphasis of mulching aims to
control soil erosion. Minimum soil disturbance was also part of the principles of CA that were
emphasised during the trainings done by AGRITEX. This had an overall effect of improving natural
and water resource management.
IR1.3 Increased access and availability of agricultural inputs
The project identified timely availability and affordability of agricultural inputs as critical in
improving productivity among smallholder farmers. Agro-inputs were made available to farmers
through contract farming arrangements with coffee and tea companies (ZCM and HVSDC
respectively).
The project distributed maize and sugar beans inputs to the farmers for the 2010/11 agricultural
season in October - November 2010. A total of 2000 farmers benefited from the summer crops
inputs. WVZ worked closely with HVSDC to raise coffee seedlings for coffee farmers under the
project. The detailed breakdown is in Annex 2. As the inputs were not locally available these were
supplied to the smallholder farmers through local agro-dealers.
In order to access the inputs SNV facilitated farmer organisation into small groups of 10 members
per group. As the inputs were being provided on credit basis, the group mechanism was intended to
serve as a guarantee mechanism for defaulters. The group approach was innovative development to
enhance access to credit in an environment where smallholder farmers had been excluded by
financial service providers due to absence of collateral security. However, results from focus group
discussions indicated that some farmers formed groups of convenience to be able to access the
inputs. With different production capacities among group members there was no unity and a shared
sense of responsibility to repay the input loans.
For the group approach to be effective, the groups should be made up of people who know each
other so well and have been used to saving and lending activities amongst themselves. In other
studies by CARE International in Zimbabwe9 on linking community group savings and lending
schemes to financial service providers, it was pointed out that for group loan guarantee
mechanisms to be effective, the groups need to have been operating for a period not less than a
year prior to accessing external loans.
IR1.4 Increased capacity for farmers to develop business oriented production and
marketing solutions
Farming as business trainings were conducted by SNV to all Tea and Coffee farmers. The trainings
conducted by locally based trainers that were first trained by SNV focused on product costing, profit
and loss calculations, product timing, credit management and contract farming.
In FGDs and KII that were conducted in wards 1, 3 and 7, farmers appreciated the value of the
trainings and their significance.
9 CARE International in Zimbabwe; The Innovative ISAL-Microfinance Linkage Project, 2011.

28
However coffee farmers noted that they are yet to put to practice what they learnt. There is
therefore need to continue with supervision and refresher trainings until sufficient production
started to enable the farmers to practise what they learnt. Tea farmers were selling their produce to
Eastern Highlands Tea Company and they were unhappy with the pricing structure and there were
calls by the farmers to have other buyers come onto the scene to enhance competition. Farmers also
felt that the price of freshly picked tea was too low compared to that of processed tea and they
were calling for significant reviews of the pricing structure. The farmers pointed out that in the past,
one kilogram of bananas fetched the same price as that of tea on the market. To date, bananas are
being sold for 30 cents per kg whilst tea farmers are getting 9c per kg.
Key informant discussions with WVZ personnel indicated that for tea farmers to realise reasonable
profits they have to produce significantly higher quantities and better quality tea than the average of
4.8t realised by the farmer at the time of evaluation. An average production of 15t of tea would be
economically viable.
2.5.2 Strategic Objective 2: Farmer Support Systems Enhanced
IR2.1 Improved linkages between input and output suppliers
WVZ engaged HVSDC to raise coffee seedlings for farmers under the project. This created a strong
linkage between the farmers and HVSDC and all the farmers that received the seedlings were
generally happy with their quality. The project also facilitated a linkage between agro dealers and
farmers for the supply of agric-inputs using the voucher based system. However, the linkage was
undermined by uncompetitive prices as some beneficiaries noted that the inputs bought under the
voucher system were comparatively of a higher price than those sold by other local dealers such as
fertilizer sold by Masamvu General Dealer. A bag of fertiliser was redeemable at $33.00 under the
project yet it was being sold in Masamvu General Dealer for $30.00, according to an FGD at Zindi
Primary school in ward 3.
About 98% of the beneficiaries indicated that they got loans for agricultural purposes compared to
none of the non-beneficiaries. There was no other lending institution as the main institution was
WVZ (referred to differently as RSAPZ, USAID by the farmers). Repayment rates by farmer varied
from 0% to 17.7% and none had paid any form of loan in full. Farmers were also linked to Eastern
Highlands, a buyer without a competitor and have been having the loans they owe WVZ deducted
through the buyer. Interviews with AGRITEX and FGDs with farmers in all the wards revealed that
this practice is not being appreciated by farmers as they felt they were only working to repay the
loans and the balance “sometimes is only enough to buy salt”, according to participants in Ward 3.
The following graph shows the percentage of farmers receiving loans by crop.

29
Figure 10: Percentage of farmers taking loans by crop
The value of the loan depended on the crop and the intended use by the farmer. The highest loan
value was for coffee production, followed by banana production among Coteba farmers. It is
interesting to note that the highest loan value is in most cases lower than the sales value meaning
that it will be very difficult for farmers to repay their loans. The following table shows the loan
values and the repayment values as at June 2012.
Table 7 Showing Loan Values and Repayment Values
N Minimum Maximum Mean Std.
Deviation
Loan Value Tea ($) 32 35 350 210.8 115.3
Amount Repaid Tea ($) 32 35 300 75.7 71.1
Loan Value Coffee ($) 129 65 800 425.6 91.1
Amount Repaid Coffee ($) 129 5 80 1.1 7.1
Loan Value Banana ($) 6 33 429.7 147.7 149.37
Amount Repaid Banana ($) 6 5 20 5.8 8
Loan Value Sugar beans ($) 158 30 80 70.6 19.0
Amount Repaid sugar
beans ($)
158 4 80 10.9 18.5
Loan Value Maize($) 87 8 80 66.6 17.0
Amount Repaid Maize ($) 87 5 80 10.4 19

30
The table shows that the average amount of money repaid for the tea ($75.7) was relatively higher
(about 36% of loan amount) than in other crops. This is largely due to the fact that the amounts
were being deducted at the marketing point before paying the farmers. In addition there are no
other markets accessible to farmers besides the Eastern Highlands Tea Company accessed through
HVSDC.
Various lending institutions made linkages with farmers. The following graph depicts the proportion
of farmers accessing loans from the various sources by crop in the past season. While WVI and its
partners played a pivotal role in providing loans it is essential that private partners start to play a
leading role in the provision of loans to farmers for sustainability’s sake.
Figure 11: Percentage of farmers accessing loans for particular crop by source of loan
The graph shows that for tea, coffee, sugar beans and maize was the almost the sole provider of
loans.
Employment Creation
The project was conceptualized on the belief that it would creat employment for many casual farm
labourers and downstream industries. The project was expected to generate income and
employemet for 6400 households, (38 400 individuals) through on farm casual labour and
approximately 6000 private sector employees reaching a total of 12 400 households (74 400
individuals).
On average 3 household members work permanently on the farm. The complement is made up of
female and male non-family memebers. On average 1.03 non-household members are employed on
the farm. This means for the 1700 beneficiery households on this project around 1760 direct
employment opportunities were created (910 for males and 850 for females). About 438 workers
are permantly employed on the farm (222 males and 215 females.). The following table illustrate the
employment patterns.

31
Table 8 showing emplyment patterns
Employment Category Min Max Mean Std.
Deviation
Males Employed On Farm 0 10 0.54 1.24
Males employed Off Farm 0 2 0.03 0.21
Females Employed On Farm 0 15 0.50 1.39
Females Employed Off Farm 0 1 0.00 0.06
Permanant Male Employees On Farm 0 6 0.13 0.59
Permanant Male Employees Off Farm 0 30 0.16 1.96
Permanant Femal Employees On Farm 0 6 0.13 0.62
Permanant Female Employees Off Farm 0 0 0.00 0.00
Males Employed On Farm for 22 days 0 6 0.10 0.56
Males employed Off Farm for 22 consective days 0 2 0.02 0.18
Females Employed On Farm 22 consective days 0 15 0.12 1.07
Females Employed Off Farm for 22 conserctive days 0 2 0.01 0.14
How many family members work on the farm 0 20 2.97 2.16
The majority (84.5%) of farm workers were paid a daily wage. Fig 12 illustrates the payment
schedule for farm employees.
Fig 12 showing payment modalities for employees
IR2.2 Improved Linkages between Input and Output Suppliers
Under this component the project intended to strengthen the capacity of partners in business
management, value chain analysis, marketing, production and processing.
Enhanced capacity of project partners to provide services to farmers
WVZ worked closely in building the capacity of partners in delivering the key objectives of the
project. Two of the partners, SNV and ZCM are experts in the areas they were partnered to deliver

32
and the farmers showed appreciation for the trainings done. A needs assessment was conducted for
the Honde Valley Smallholder Company by SNV and the results were followed upon. HVSDC was
capacitated in the areas of coffee seedlings production resulting in the coffee farmers getting their
seedlings locally. ZCM was supported to provide extension services to coffee farmers. Key
achievements under each target are in Annex 2.
Marketing
The project attempted to impart marketing techniques and market intelligence skills to beneficiaries.
The results of the evaluation show that there was a marked improvement in contract buying and
open marketing while there were slight decreases in Farmer to farmer marketing as well as selling in
cities and or towns. The following graph illustrates the findings.
Figure 12: Marketing Practices by Farmers Before and After Project
The project promoted agriculture as a business and farmers were taught several advertising
techniques. However, the majority of farmers still do not advertise their produce (Figure13). About
66.7% of non-beneficiaies do not advertise their produce while 64.1% of beneficiaries do not
advertise. A total of 33.3% and 37.8% of non-beneficieries and beneficieries respectively do roadside
marketing. Almost 3.2% beneficieries reported advertising in the local media. This is a marked
change from baseline level where noone advertised through the media and it is a departure from
non-beneficiery practices where noone advertise through the local media. About 20% of
beneficieries rely on contractors to look for customers for them. This is a slight decrease from the
baseline level where 32.2% relied on contactors. This may be a sign of empowerment as farmers
explore their options in marketing. The graph below illustrate the findings.
About 78.7% of beneficieris sell their produce in groups as they seek to exploit group dynamics.
However, 33.6% still sell some crops as individuals especially maize and sugar beans. The project was
promoting the group approach to marketing. The groups were still at the formative stages of
development.

33
Figure 13: Advertising Practices by Smallholder Farmers (Baseline vs Evaluation)
The evaluation sought to elicit information on capacity and attitude towards advertising farm
produce. While it was noted that farmers do advertise their produce, not all crops were advertised.
Some crops are rarely advertised. Bananas were being advertised by 63.2% of the farmers and 37.2%
advertised sugar beans and coffee was advertised by 18.6% of the farmers. The least advertised crop
is tea at 2.9%.
Distance to Market and Transport Services
Distance to market vary widely from just off the field to about 405km but the average distance is
52.1km with a standard deviation of 80.9. The transport mechanism to market vary from physically
carriying on one’s head to the use of motor vehicles. The bulk of produce (61%) is transported using
hired trucks and in case of roadside selling farmers carry the produce on their heads. Very few
farmers use buses. The pattern is consistent with the findings at baseline level with variations
attributable to changing volumes and number of people involved in marketing of produce. The pie
chart below illustrates these findings.

34
Figure 15: Farmer Transport Services Used to Market
Baseline After project
2.6 Relevance
The project was relevant in that it promoted appropriate crops for the area. Honde Valley is a tea
and coffee producing area. Following the economic challenges and difficulties in accessing inputs, it
was necessary to have an intervention that would build market linkages and strengthen financial
viability of commercially oriented farmers and address the challenges associated with the shortage
of inputs as revealed in the baseline survey done prior to project inception. The key challenges
highlighted at baseline included the following and under each is the description of the evidence on
what was done to address them;
1. Lack of adequate rains
WVZ inherited the irrigation scheme that had been started by STABEX and completed the
intervention in some areas. However, not all coffee farmers are connected to the irrigation
scheme.
Roll out and expansion of CA to conserve moisture through mulching and other water
harvesting techniques was a very relevant project intervention.
2. Illness in the home
HIV and AIDS were mainstreamed in the project to help in the management of the HIV-
infected and affected households.
3. Access to draught power
WVZ came to strengthen and expand CA principles to address the problem of lack of access
to draught power. CA has been taken up and adopted by most farmers in tea, coffee and
summer crops farming.

35
4. Access and affordability of Inputs
The project availed inputs using a voucher based system through agro dealers. Farmers
accessed the inputs on loan payable within agreed timeframes.
5. Soil conservation problems and natural resource management
CA principles were implemented to help conserve the natural resources especially soil
management.
Targeting and selection was mainly community driven and verified with WVZ providing the selection
criteria while community structures handled the group compositions. However, the project did not
exclusively target 100% commercially oriented farmers as it had a component that aimed to helping
support groups.
Appropriateness: Honde Valley traditionally has been a tea and coffee producing area and thus the
choice of crops was appropriate. The benefits of the project would accrue to children and men,
women and young people as they testified that they own plots of tea.
The project intended to revitalise smallholder agriculture by improving access to inputs. However,
farmers were given very limited choice through the voucher system. Repayment of farm inputs was
not synchronised with period of crop production.
Stakeholder participation: there was meaningful involvement of the majority of the stakeholders
from baseline to project evaluation. Stakeholders that confirmed involvement in the project
included the district administration, local councillors, Agritex, local leaders such as village heads.
However, some farmers felt they were being by-passed in decision making processes and not
properly represented by the Honde Valley Smallholder Development Company. The issue of
shareholding of the company was not clear among the farmers and even development partners such
as FAO. Some farmers thought HVSDC serves the interests of Eastern Highlands Tea Company
instead of representing the farmers. They pointed out that the CEO of HVSDC was also a former
employee of Eastern Highlands Tea Company which be an issue of conflicting interests.
Unexpected outcomes: Delays in the completion of the irrigation infrastructure in Ward 7 and the
fact that some farmers along the pipeline did not manage to be served has resulted in disharmony
among farmers. In an FGD done in Ward 7, one participant noted that:
“Fist fights have occurred between those who benefitted and those who didn’t. (Vamwe
vana vari kunwa zamu rine mukaka vamwe vari kupihwa musoro usina mukaka. Hazvisi
fair.)
2.7 Effectiveness and Efficiency Refer Annex 2 for an update of achievements and gaps.
The approach to work with partners HVSDC, ZCM and SNV and stakeholders such as government,
local council, Agritex and Out-growers association is a cost effective model compared to direct
implementation. Agritex officers were trained at ToT level on various areas such as CA, natural
resource management and water harvesting techniques. However, SNV trained farmers with the

36
assistance of locally based trainers on farming as business. ZCM was strengthened to provide
support to coffee farmers through extension officers.
The Conservation Farming technology and its principles were appropriate and adequate to achieve
the desired impact. This is demonstrated by the fact that average yield for maize increased from
0.583t/ha at baseline to 0.86t/ha. However Tea strategies were not enough to achieve impact and
the use of HVSDC to bargain for prices needs revisiting as there is general conflict of interest with
Eastern Highlands. Coffee farming strategies were not enough to achieve impact as there was a
problem associated with procurement of seedlings that caused a loss of almost 12 months project
time.
According to the farmers, the summer crops inputs, especially maize seeds, were distributed late, in
November 2010 and planting is traditionally done between September and October. Beans were on
time but there were no chemicals and the variety was not the proper one. The maximum bean yield
was 8 buckets in Ward 7 and even lower in other wards.
Cost Benefit analysis
Voucher system was not used in the best possible way. The voucher system was supposed to make
inputs accessible to farmers in an economically efficient way. It was also supposed to stimulate
economic activity in Honde valley. However, during FGDs farmers complained that the cost of some
of the voucher items was not competitive. Some Agro-dealers such as Masamvu General Dealers
were reportedly selling fertilizers at a cheaper price than the redeemable price of the voucher. Other
farmers complained about the quality of the fertilizer. They have a feeling that the fertilizer is of a
poorer quality than locally produced fertilizers. The farmers’ fear is that in the coming seasons non-
participating agro-dealers will be tempted to raise their prises to match the voucher price.
Timeframe was not adequate for some interventions such as irrigation and coffee farming to address
challenges noted at baseline. Distribution of inputs was delayed in the 2010/11 season. Project time
was lost in the first quarter due to delays in launching the project, hiring personnel and the
unexpected need to raise coffee seedlings. ZCM delayed recruiting 3 field extension officers until
January 2011 (2nd Quarter). HVSDC hired late 1 of the 2 FEOs, (in January 2011). As a result of delays
in hiring, training of FEOs and local agricultural extension officers on tea and coffee extension
support was delayed until Quarter 2.
2.8 Impact
The project, which ran for 18 months, has registered remarkable outcomes as highlighted under the
different strategic objectives and indicators described earlier on. However it is too early to talk of
impact as tea and coffee farms are not yet financially viable. In most instances the small-holder
farms will start to be viable in another 2 to 3 years.

37
2.9 Sustainability
Participants were asked during the FGDs done in the different wards on what they believe will
remain and continue or what will decline or stop if WVZ support fails to go beyond June 2012. Below
is a summary of the responses from the FGDs participants;
What will Remain and Continue What will Stop or decline
Knowledge of correct farming practices Tea price may revert to old levels
Agritex services Partnership activities which are fund dependent
Farming as a business approach Loan repayments into the Revolving Fund
Tea farming Access to inputs such as brush cutters and
harvesters
Teamwork and Group farming Coffee farming
Demo plots
Diversified farming approach
3. RECOMMENDATIONS The evaluation makes the following recommendations:
• Crop sales have continued to be the main source of income for both beneficiary and non
beneficiary households in Mutasa. Therefore, the project should continue to focus on crop
production so as to sustain household income as opposed to livestock production. More
emphasis should be put on developing competitive markets for crops to guarantee income.
Alternative tea and coffee markets may be difficult to come by but the project should strive
to improve prices for the crops by strengthening farmers’ bargaining power.
• Agro-dealers should be linked directly to suppliers and a sustainable relationship should be
developed.
• The voucher system should be opened for farmers to access inputs that they value the most.
Farmers should be provided with advanced information on the available inputs and their
prices so as to improve agronomic planning, participation and ownership of the input
system.
• Intercropping food crops and coffee is a short-term solution to food security. As the coffee
plants grow the viability of intercropping especially with maize will become inappropriate.
Thus WVZ should start thinking of other options lest they run the risk of compromising food
security from own production.
• While the study showed that more farmers are ranking conservation agriculture as the first
choice agriculture production method, conventional hand hoeing came strongly as the

38
second choice. This therefore means that the gains made in conservation agriculture are not
irreversible. WVZ need to continue availing more information on the benefit of conservation
agriculture to the beneficiary communities as well as promote more user-friendly
technologies e.g. the Chinese hand planter, ripper tines and the jab planter.
• While WVZ and its partners played a pivotal role in providing loans to farmers, it is essential
that private partners start to play a leading role in the provision of loans to farmers for
sustainability’s sake.
• The potential for conflicts are high in the irrigation intervention as community level
structures for water management were in their formative stages of development. While the
governance structure and democracy in the committees are relatively well developed, the
conflict management and prevention structures are almost non-existent. There is need to
continue strengthening these structures to enhance sustainability.
• Institutional development involving strengthening of commodity associations to be able to
effectively negotiate with input and output suppliers needs attention.
• The operation of the Revolving Fund needs to be revisited to provide a platform for a win-
win situation for farmers and its administrators. Loan repayment should have been deferred
till a time when selling would have been profitable so as to protect household incomes. The
current situation guarantees business for the input supplier but not income to the farmer.
The is need to consider insuring the farmer against crop failure as well as the supplier
against default both from the farmer and the agro dealer.
2. The HVSDC still need institutional strengthening as farmers are disgruntled or suspicious
over its mandate in the marketing of tea. Its mandate should be derived from farmers’
aspirations. Its shareholding should be clarified and become more transparent.
• Finally, the evaluation noted that there was no ample time for pre-start up activities leading
to less linear implementation of project activities. It is therefore recommended that future
programming takes this into consideration to avoid the loss of valuable project time. The
programme participants noted also that it was too early for WVZ to exit. Coffee farmers still
need support as inputs were only received in March 2012 and some of them have not even
signed Contracts. A total of 106 farmers still had seedlings that will only be transplanted in
Aug/Sept 2012.

39
4. CONCLUSION The RSAPZ project, which ran for 21 months, has registered remarkable outcomes as highlighted
under the different strategic objectives and indicators described earlier on. However, its impact is
still elusive. There are changes that have occurred that will have larger impacts in the society and
economy for example the increased tea and coffee hectare will enhance livelihoods and create more
employment in the long run. The irrigation scheme at completion will transform farming practices
and production to the benefit of the wider community.
The project was relevant in that it promoted appropriate crops for the area. Honde Valley is a tea
and coffee producing area. Following the economic challenges and difficulties in accessing inputs, it
was necessary to have an intervention that would build market linkages and strengthen financial
viability of commercially oriented farmers and address the challenges associated with the shortage
of inputs as revealed in the baseline survey done prior to project inception.. The RSAPZ largely
achieved its objectives and being a pilot project, it needs to be up-scaled and replicated over a
longer period of at least three years.

40
5. ANNEXES
Annex 1. List of Key Informants
Name Designation Date of Interview
Nigel Makwembere ADP Manager – Honde Valley 24 May 2012
Abraham Muzulu RSAPZ Project Coordinator 8 June 2012
Lloyd Masomera M & E Officer, WVZ 24 May 2012
Mr Muzvidzwa CEO, HVSDC 28 May 2012
Mr Mugayi Village Head 25 May 2012
Mr Mandiringana HV Coffee Growers Committee
Chairperson
24 May 2012
Mr Muzava Agritex Officer Supervisor 28 May 2012
Mr Chanaka Agritex Officer 28 May 2012
Mr Derera Agritex Officer 28 May 2012
Mr Mademutsa Agritex Officer 28 May 2012
Mr Simbarashe Kembo ZCM 28 May 2012
Ms Grace Nota ZCM 28 May 2012

41
Annex 2 Targets and Achievements Matrix
Strategic
Objectiv
es
Intermedi
ate
Results
Activities Output/Activity
Indicator
Responsib
le partner Project
Target
Project
Achieve
ments
%
Achiev
ement
SO 1
High-
value
Agricultu
ral
producti
on and
producti
vity
increase
d
IR 1.1
Small
scale
farming
practices
improved
Train
specialized
crop extension
workers on tea
& coffee
production
# of tea extension
workers trained
HVSDC
12 8 66.7
# of coffee extension
workers trained
ZCM
16 2 12.5
# of extension workers
trained on CF
WVZ
20 15 75.0
Provision of
specialized
crop extension
services
# of tea farmer field
discussion days
conducted
HVSDC
4 0 0.0
# of tea farmers
receiving contact
extension support
HVSDC
1200 926 77.2
# of hectares of
recovered tea fields
HVSDC
900 430.9 47.9
# of coffee farmer
field discussion days
conducted
ZCM
4 3 75.0
# of coffee farmers
receiving contact
extension support
ZCM
1600 1163 72.7
Train farmers
on
conservation
farming,
integrated
farming
systems
(intercropping,
livestock
management)
# of participants
attending training
sessions on CF and
integrated farming
systems
WVZ
6800 3503 51.5
Conduct
farmer field
school days for
all crops
# of tea farmer field
schools conducted (24
clusters * 50 farmers
per cluster per month)
HVSDC
96 59 61.5
# of coffee farmer
field schools
conducted
ZCM
144 105 72.9
# of summer crop
farmer field schools
conducted (40 clusters
of 50 farmers per
cluster meeting on a
bi-monthly basis)
WVZ
0 0 0
IR 1.2
Improved
natural
and water
resource
managem
Farmers
trained on
water
harvesting and
water
conservation,
# farmers trained *
ONE session
WVZ
0 0 0

42
ent & soil
management
Small-scale
gravity fed
water
harvesting
pipes installed
# of irrigation schemes
completed
area under irrigation
WVZ
12 6 50.0
IR 1.3
Increased
access
and
availabilit
y of
agricultur
al inputs
Distribute
maize, gnuts &
sugar bean
inputs using a
voucher-based
system (seed,
fertilizer)
Quantity of maize
seed distributed (MT)
0 0 0
# of farmers receiving
maize seed WVZ 2000 0 0.0
# of farmers receiving
sugar beans/ground
nut seed and top
dressing fertilizer
vouchers WVZ 2000 0 0.0
Quantity of sugar
beans seed accessed
through vouchers
(MT) WVZ 0 0 0
Quantity of top
dressing fertilizer
accessed through
vouchers (MT) WVZ 0 0 0
Quantity of basal
dressing fertilizer
distributed (MT) WVZ 0 0 0
# of farmers receiving
basal dressing
fertilizer WVZ 2000 0 0.0
# of vouchers
redeemed (2000
farmers * 9 vouchers
per pack) WVZ 0 0 0
Quality control
of agricultural
inputs
WVZ 0 0 0
Increase local
nursery
capacity and
seedling
production for
tea and coffee
Raising tea
nursery/propagation
(# of seedlings) HVSDC
20000
0 200000 100.0
Raising coffee nursery
(# of seedlings) HVSDC
48000
0 280000 58.3
# of tea farmers
receiving tea seedlings
(infilling physical
assessments - activity
will be done in Nov
2011) HVSDC 0 0 0
# tea seedlings
transplanted 0 0 0
# of farmers receiving
coffee seedlings ZCM 916 458 50.0
# of seedlings
distributed (250 pots
with 2 plants per ZCM
22900
0 114500 50.0

43
farmer)
IR 1.4
Increased
capacity
for
farmers
to
develop
business
oriented
productio
n and
marketing
solutions
Mobilize
farmers
associations
# of clusters formed
SNV 0 0 0
Strengthen
farmers
associations
# of associations
strengthened
SNV
4 4 100.0
Develop and
package
training
materials
Training materials
developed in market
intelligence and
business management
SNV
3 4 133.3
Conduct ToT
for extension
staff on
business mgmt
training
# of sessions of ToT
trainings
SNV 5 4 80.0
Train farmers
on market
intelligence
and business
management
skills
# of training sessions
held on market
intelligence
SNV
6 6 100.0
# of participants
attending market
intelligence training
SNV
3400 1719 50.6
# of training sessions
held on business
management skills
SNV
6 6 100.0
# of participants
trained on business
management skills
SNV
3400 1719 50.6
Train farmers
on crop quality
aspects
# of training sessions
held
WVZ
0 0 0.0
# of farmers trained
on crop quality
WVZ
0 0 0.0
SO 2
Farmer
support
systems
enhance
d
IR 2.1
Improved
linkages
between
input and
output
suppliers
Conduct
market
analysis for
cash crops
(maize, gnuts,
sugar beans,
coffee, tea)
Market analysis
completed
SNV
0 0 0.0
Market analysis report
released
SNV
0 0 0.0
Conduct value
chain analysis
for cash crops
(maize, gnuts,
sugar beans,
coffee, tea)
Value chain analysis
completed by crop
type
SNV
0 0 0.0
Facilitate
dialogue
among value
chain actors
# of meetings held
among value chain
actors
SNV
4 6 150.0
Compile and
disseminate
market
intelligence
Market intelligence
IEC material
developed SNV 4 4 100.0
Quantity or frequency SNV 106 53 50.0

44
information of IEC material
disseminated?
Monitor
implementatio
n of
agreements by
actors
# of visits/meetings
SNV 4 4 100.0
IR 2.2
Enhanced
capacity
of project
partners
to
provide
services
to
farmers
Develop
partners'
capacity
strengthening
plans
# of capacity
strengthening plans
developed
SNV 0 0 0.0
Facilitate
capacity
building of
partners on
business
management
# of trainings
SNV 6 4 66.7
Mentor
partners on
value chain
analysis and
market
linkages
# of coaching sessions
SNV 4 3 75.0
Monitor
implementatio
n of capacity
strengthening
plans of local
partners
(training,
coaching,
mentoring)
# of
coaching/mentoring/t
raining sessions
conducted
SNV 4 3 75.0
Capacity
building of
partners on
tea and coffee
production &
processing
# of
coaching/mentoring/t
raining sessions
conducted
SNV 4 0 0.0

45
Annex 3 KEY INFORMANT GUIDE
WVI STAFF and PARTNERS
1. Briefly describe your role in the project
2. What were/was the problem you were trying to address with the given project. Did the programme address the
problems cited by communities and stakeholders in the Baseline Survey report? Were the RSAPZ Project goals,
Objectives, Indicators, and activities aligned with local needs and priorities?
3. How was the targeting done and was it appropriate?
4. How appropriate were the chosen interventions and programme design to the situation of different groups (children,
young people, men, and women)?
5. How have target groups and stakeholders participated in different programme interventions?
6. Were there unexpected outcomes from the programme?
7. Were the methodologies used, especially conservation farming, agricultural input distributions through direct
distribution and agro dealers, recovery of overgrown tea, irrigation installations, value chain development,
information provision adequate (market intelligence information and IEC materials) to achieve impact? Were they
appropriate commercially oriented small holder farmers?
8. What difference has the programme made to commercially oriented small holder farmers?
9. How have the programme interventions impacted differently on children, young people, men and women.
10. What wider impacts did the project have on the farmers, partners, working environment and stakeholders, intended
or unintended, positive or negative (e.g. social capital, natural capital, human capital, financial capital, transparency,
environmental impact, gender, etc.)?
11. Is there evidence that initiatives begun under the project will last and spread without ongoing support from WVZ?
12. What are the prospects for the benefits of the project to continue until the completion of the project?
13. Are there comprehensive exit strategies in place? Are there additional measures that WVZ should do to improve
sustainability?
14. What was the relationship between WVZ and partners?
15. Was there capacity building of partners (ZCM, HVSDC, and SNV) and WVZ?
16. How has/could collaboration, partnership, networking and influencing of opinion support sustainability?
17. Are the businesses supported through the project continually engaged in highlighted business activities?
18. Are the systems and structures which were established through the project maintained and useful to the benefit of
the targeted communities e.g. irrigation infrastructure Are there water committees etc
19. Will benefits beyond the life of the existing programme have negative/positive effects on environment?
20. What are lessons or aspects of the project can be replicated in other contexts?
21. How can programme best practices be captured and spread to encourage replication? Is this programme positively
affecting other WVI programmes in Zimbabwe?
22. Revolving Loan Fund…Its performance and future…Repayment levels by input recipients

46
Annex 4 KEY INFORMANT GUIDE LOCAL LEADERSHIP
1. Briefly describe your role in the project
2. Do You feel that your needs and problems were addressed by this project
3. Do you feel that those who benefited from the project were the real people who were suppose to
benefit?
4. How appropriate were the chosen interventions and programme design to the situation of different
groups (children, young people, men, and women)?
5. How have target groups and stakeholders participated in different programme interventions?
6. Were there unexpected outcomes from the programme?
7. What difference has the programme made to commercially oriented small holder farmers?
8. How have the programme interventions impacted differently on children, young people, men and women.
9. What wider impacts did the project have on the farmers, partners, working environment and
stakeholders, intended or unintended, positive or negative (e.g. social capital, natural capital, human
capital, financial capital, transparency, environmental impact, gender, etc.)?
10. Is there evidence that initiatives begun under the project will last and spread without ongoing support
from WVZ?
11. Are there other players who can take over from where WVZ has left
12. What was your relationship with WVZ and partners?
13. Are the systems and structures which were established through the project maintained and useful to the
benefit of the targeted communities e.g. irrigation infrastructure Are there water committees etc
14. Will benefits beyond the life of the existing programme have negative/positive effects on environment?
15. What are lessons or aspects of the project can be replicated in other contexts?
16. How can programme best practices be captured and spread to encourage replication? Is this programme
positively affecting other development programs in your area?

Annex 5 RSAPZ End of Project Evaluation : Focus Group Discussion Guide
Key Concepts to be explored
Objectives of the key concepts
Key questions
1. Programme
goals and
objectives
• Assess beneficiary
understanding of
programme goals and
objectives
• Establish a basis for
measuring project
achievements
• Can you describe briefly prevailing conditions and problems that led to project
start up?
• What are the key objectives of the project?
• Who are the major stakeholders in the project and what are their roles and
responsibilities in the project?
• Can you highlight the key activities carried out by WVI, SNV, and other partners.
Which strategies were used by WVI and partners to achieve these objectives?
• To what extent were the project objectives realized?
2. Targetting
efficiency
To find out if targeting was
carried out efficiently
• How were the project beneficiaries selected (Tea, coffee and Summer Crop
only)
• Are you satisfied with the way the beneficiaries were selected for this
programme?
• Are there any deserving households that you feel were left out?
3. Market linkages To explore the extent
beneficiaries are linked to
stable markets where they
can sell their produce
• Briefly describe the location of the tea/Coffee plantations in relation to
marketing.
• If possible give numbers of Tea, coffee plantations that are linked to a stable
market.
• What is the distance to the nearest market?
• Is there reliable transport to ferry produce to the nearest market?
• What changes in marketing were brought about by the project?
• How do non project beneficiaries market their produce?
• What challenges have you faced with marketing your products?
• What is your current relationship with EHPL and ZCM?
• Do you see differences in your outputs with farmers farming for EHPL?

4. Tea and coffee
production
To find out change in the
area of land put to use
under, Tea and Coffee.
• What is the area (acres) of land dedicated to tea and coffee Production?
• Do you have enough resources to carry out tea and coffee production excluding
inputs?
• How much tea/coffee did you harvest from the land supported by the project?
(Average yield per hectare)?
• Have you ever produced first grade tea or coffee?
• What are the challenges that you faced in coffee and tea production over the
last season?
• What specific training did you receive on Tea and coffee production? What was
the effect of this on your operations?
• What types of inputs would have assisted you in a greater way to achieve
results?
• Are there buyers in the area that you could use for regular engagement if you
had the support?
• Could you expand production if you had greater level of inputs assistance?
• Are you producing enough to cover your costs?
• How has your income changed due to this program? On average, what is the
total annual income earned by a farmer from tea/ coffee production?
5. Water harvesting
technique
T o explore farmers
knowledge of water
harvesting techniques
• List water harvesting water that you use
• What new techniques of water harvesting did you adopt as a result of the
project?
• What are the challenges encountered during the water harvesting process?
• Have you been you been assisted with inputs for this agriculture season?
• If yes, which inputs were you given?
• Are the inputs enough to cover the land dedicated to the mentioned crops?
6. Conservation
Farming
To assess the uptake of
Conservation farming.
• If practicing CF which aspects of conservation farming are you applying?
• What do you think about the adoption of the CF technique in your area? What
proportion of people in your area practice CF? Compared to the period before
the project, what changes have happened in area under CF?

• Give reasons why adoption of CF is low /high?
• What are the benefits of practicing CF?
7. Extension
support
To explore if the farmers
have access to extension
services and knowledge of
intercropping
• Have you received training on Conservation farming/ Tea and coffee
production and from whom? (Include trainings facilitated by other NGOs and
Governmental departments)
• List the trainings that you received in the past twelve months.
• To what extent did you practice intercropping of coffee and maize with
legume crops?
• What benefits of intercropping with legumes have you experienced?
8. Community &
stakeholder
engagement/
Participation
• To explore if the
community is involved in
decision making
• To find out if there are
consulted on aspects of
including planning and
making changes during
project implementation
• Who makes decisions on choice of projects that you are currently benefiting
from?
• Are you consulted on any aspects of the project?
• Is there a complaint response mechanism?
• Do you get feedback after filling a complaint?
• Are you satisfied with the response mechanism available?
• What do you think should be done to improve the quality of programmes?
• Have you seen change in a way that benefits you due to this program in terms
of community engagement?
9. Revolving Loan • To establish the
operation &
effectiveness of Scheme
• On average, what is the average loan amount accessed by an individual
farmer?
• How did the loan scheme operate? Was it necessary?
• What is the level of repayment by farmers?
• What categories of farmers managed to repay all their loans?
• What challenges did farmers face in repayment?
• What needs to be done when designing future revolving loan schemes? What
needs to be done to ensure farmers repay their loans?
10. Project Outcomes
and impacts
• To assess the main changes
brought about by the • What changes (negative or positive) were brought about by the project at
community and household levels?

project • How did the program change your income?
• What is the impact of the project on youths, children, men and women?
• What impact did the project have on households affected by HIV and AIDS?
How did households affected by HIV and AIDS cope with project activities?
• Were there unexpected outcomes from the project?
• What proportion of non beneficiaries would you say have adopted project
techniques?
• What external factors may have affected the project’s overall performance?
11. Sustainability • To explore if project
interventions will be
sustainable in the event
of WVI and partners
pulling out.
• In the event of World vision and partners pulling out, do you think this project
will continue? What will stop and what will continue?
• How do you think you will proceed without assistance that World Vision and
Partners are offering you?
• In future what should World Vision and Partners do differently to improve the
impact and sustainability of the interventions?
• Can you describe the working relations between different stakeholders in the
project
12. HIV/AIDS
To determine the
knowledge of HIV/AIDS
among the community
• Have you ever been trained on HIV/AIDS issues?
• How prevalent is the disease in your neighborhood?
• In what way did the project incorporate HIV and AIDS issues in programming?
Was the project sensitive to the plight of households affected by HIV and AIDS?

51
Annex 6 Household Questionnaire
WORLD VISION AGRICULTURE PROJECT HOUSEHOLD SURVEY
APS EoP Questionnaire
HH Code (Eight digit code: Province District, Ward and Household number
(1-50). This number will be used for this HH throughout the season.
Circle 1 that applies: Beneficiary Non-Beneficiary
Section A: Site and Location
A1 Province A2 District A3 Enumerator’s name A4 Date
A5 Respondent Name A6 Village Name A7 Ward Name A8 Ward Number
Section B: Demographics ( write the appropriate response in the space provided)
B1. Sex of HH Head 1 = Male 2 = Female
B2. D.O.B of HH Head ( year of birth only )
B3. Marital Status of HH Head
1=Single/never married 2= Married
3= Divorced/ Separated 4= Widowed
B4. Household type 1=Male headed, with a wife/s, 2=Male headed, divorced, single or widowed, 3=Female headed, divorced, single or widowed, 4=Female headed, husband away, husband makes most
household/agricultural decisions,
Guidance for introducing yourself and the purpose of the interview: • My name is _____ and I work for World Vision. • You have been selected by chance as a farmer to participate in this interview. We are conducting an evaluation
looking at how you have been a part of the smallholder agricultural project implemented by World Vision. • The survey is voluntary and you can choose not to take part. The information that you give will be confidential. The
information will be used to prepare reports, but will not include any specific names. There will be no way to identify that you gave this information.
• Could you please spare some time (around 1 hour) for the interview? NB to enumerator: DO NOT suggest in any way that household entitlements could depend on the outcome of the interview, as this will prejudice the answers.
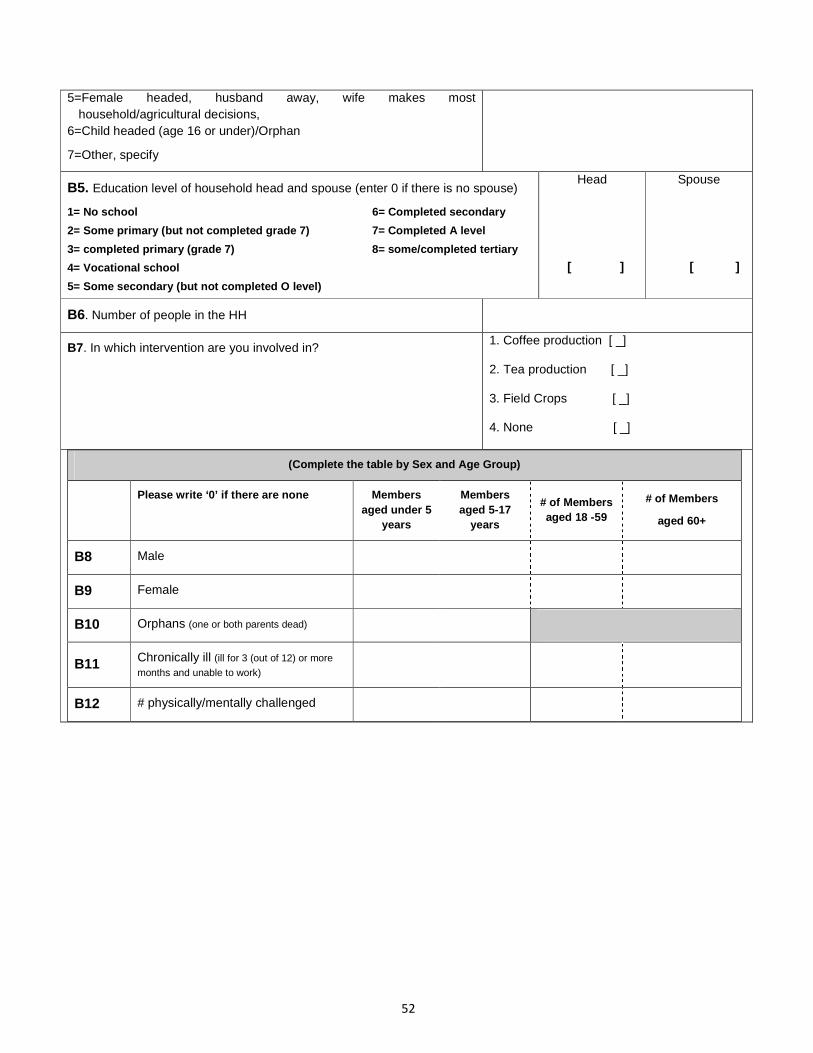
52
5=Female headed, husband away, wife makes most household/agricultural decisions,
6=Child headed (age 16 or under)/Orphan
7=Other, specify
B5. Education level of household head and spouse (enter 0 if there is no spouse)
1= No school 6= Completed secondary
2= Some primary (but not completed grade 7) 7= Completed A level
3= completed primary (grade 7) 8= some/completed tertiary
4= Vocational school
5= Some secondary (but not completed O level)
Head
[ ]
Spouse
[ ]
B6. Number of people in the HH
B7. In which intervention are you involved in? 1. Coffee production [ _]
2. Tea production [ _]
3. Field Crops [ _]
4. None [ _]
(Complete the table by Sex and Age Group)
Please write ‘0’ if there are none Members aged under 5
years
Members aged 5-17
years
# of Members aged 18 -59
# of Members
aged 60+
B8 Male
B9 Female
B10 Orphans (one or both parents dead)
B11 Chronically ill (ill for 3 (out of 12) or more
months and unable to work)
B12 # physically/mentally challenged

53
Section C. Household Assets ( Please tell us the number of assets or implements in working condition owned/kept by the household.)
C1. Total Arable Land ( Acres/Hectares) (Owned + Accessed)
Type of assets C1. Indicate by writing; if household own/keep any.....in working condition?
0=No
1=Yes
C2. How many are in working condition? Enter number and 0 if there is none
Productive assets Keep Own
a. Ox drawn ploughs
b. Ox drawn harrows
c. Cultivators
d. Rippers
e. Tractors
f. Scotch carts
g. Wheel barrows
h. Sprayers
i. Direct seeder
J. Hand hoes
K.Sickle
L.Axe
M. Other (specify)
Non productive assets
a.Cellphones
b. Bed
c.Radio
d.TV

54
e.Sofas
f. Other (specify)
Livestock ownership ( How many of each of the following animals do you own/keep?)
C3. Livestock type C4. Number C5. Livestock type
C6. Number
Keep own Keep Own
a. Cattle e. Goats
b.Draught cattle f. Pigs
c. Donkeys g. Poultry
d. Sheep

55
Section D: Income and Expenditure
D. Please complete the table one activity at a time, using codes below
D1. What are your household’s main income activities throughout the year?
(Use activity codes)
D2. Who participates in this activity
(Use codes below)
D3. What was the total income raised from
each source ( USD,ZAR,Meticais) in
a year
D4. Using proportional piling please estimate the
relative contribution to total income of each
activity (%)
Main
Second
Third
Fourth
Other activities
Income activity codes
1= Crop sales
2= Animals sales/ animal product sales
3= Fishing
4= Brewing
5= Unskilled wage labor
6= Skilled labor (artisan)
7= Petty trading
8= Small business
9= Remittances
10= Rental of property
11= begging
12= Government allowance(pension)
13 = Formal mining
14= Informal mining
15.Casual agric labor (maricho)
16. Selling of household assets ( hhld goods)
17. Formal employment
Member codes
1= Head of household only
2= Spouse of the head of the household only
3= men only
4= women only
5= adults only
6= children only
7= women and children
8= men and children
9= everybody
D6. Did you spend money on (item) last month for domestic consumption, also include the cash equivalence of bartered amounts
Currency Amount spent

56
1. Mealie meal/flour/staple cereal
2. Milling costs
3. Other household food stuffs (excluding mealie meal and staple cereal)
4. Other household non-food stuffs
5. Transport
D7. How much and with what currency did your household spend on the following items in the LAST 6 MONTHS? (Dec 2011 – May 2012)
6. School fees, uniform and other education costs
7. Agricultural inputs cost including dipping chemicals
8. Health/medical
9. Clothes/shoes
10. Social occasions/funeral expense
11. Loan Repayment
12. Construction and Building
13. Other items
Currency codes 1= USD 2= ZAR 3= Pula 4= Meticais
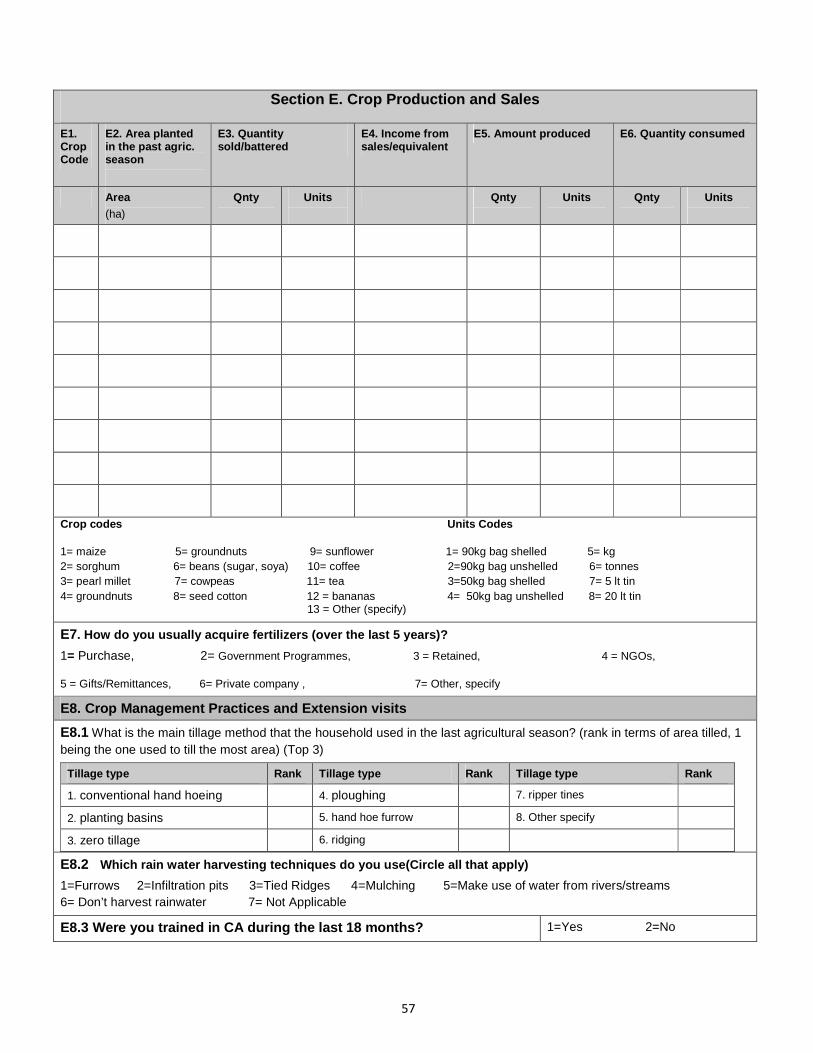
57
Section E. Crop Production and Sales
E1. Crop Code
E2. Area planted in the past agric. season
E3. Quantity sold/battered
E4. Income from sales/equivalent
E5. Amount produced E6. Quantity consumed
Area (ha)
Qnty
Units
Qnty
Units
Qnty
Units
Crop codes Units Codes
1= maize 5= groundnuts 9= sunflower 1= 90kg bag shelled 5= kg 2= sorghum 6= beans (sugar, soya) 10= coffee 2=90kg bag unshelled 6= tonnes 3= pearl millet 7= cowpeas 11= tea 3=50kg bag shelled 7= 5 lt tin 4= groundnuts 8= seed cotton 12 = bananas 4= 50kg bag unshelled 8= 20 lt tin 13 = Other (specify)
E7. How do you usually acquire fertilizers (over the last 5 years)?
1= Purchase, 2= Government Programmes, 3 = Retained, 4 = NGOs,
5 = Gifts/Remittances, 6= Private company , 7= Other, specify
E8. Crop Management Practices and Extension visits
E8.1 What is the main tillage method that the household used in the last agricultural season? (rank in terms of area tilled, 1 being the one used to till the most area) (Top 3)
Tillage type Rank Tillage type Rank Tillage type Rank
1. conventional hand hoeing 4. ploughing 7. ripper tines
2. planting basins 5. hand hoe furrow 8. Other specify
3. zero tillage 6. ridging
E8.2 Which rain water harvesting techniques do you use(Circle all that apply)
1=Furrows 2=Infiltration pits 3=Tied Ridges 4=Mulching 5=Make use of water from rivers/streams 6= Don’t harvest rainwater 7= Not Applicable
E8.3 Were you trained in CA during the last 18 months? 1=Yes 2=No
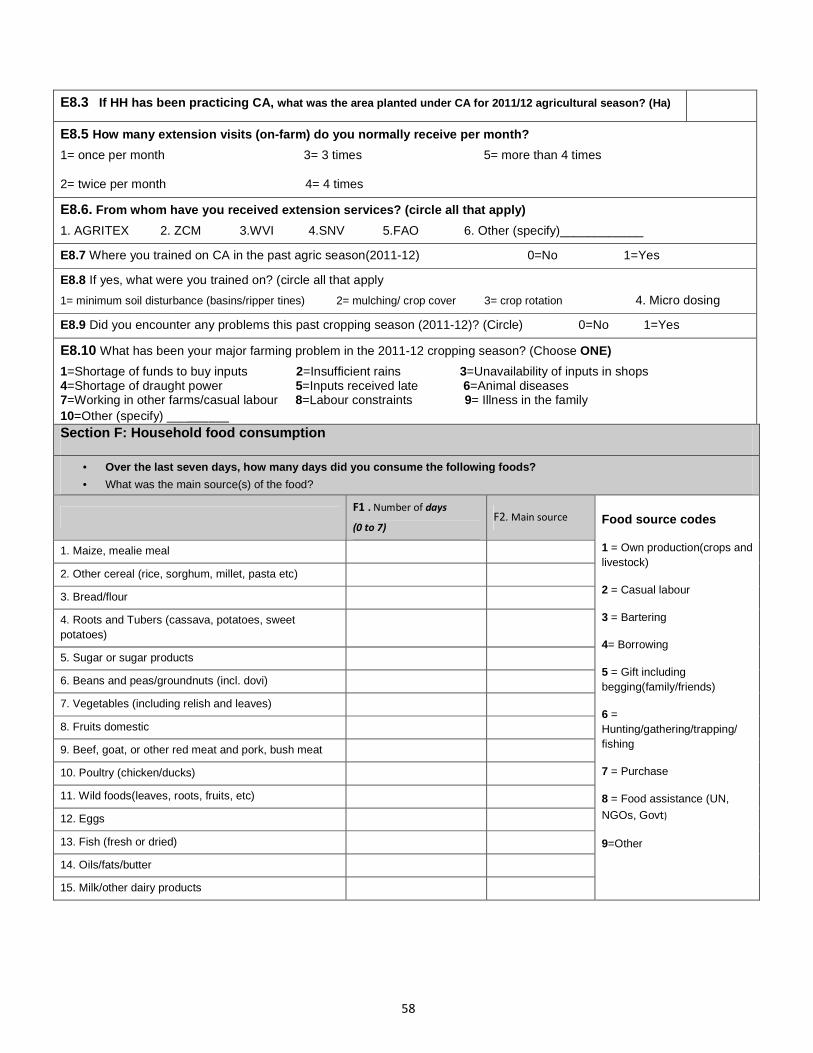
58
E8.3 If HH has been practicing CA, what was the area planted under CA for 2011/12 agricultural season? (Ha)
E8.5 How many extension visits (on-farm) do you normally receive per month?
1= once per month 3= 3 times 5= more than 4 times
2= twice per month 4= 4 times
E8.6. From whom have you received extension services? (circle all that apply)
1. AGRITEX 2. ZCM 3.WVI 4.SNV 5.FAO 6. Other (specify)____________
E8.7 Where you trained on CA in the past agric season(2011-12) 0=No 1=Yes
E8.8 If yes, what were you trained on? (circle all that apply
1= minimum soil disturbance (basins/ripper tines) 2= mulching/ crop cover 3= crop rotation 4. Micro dosing
E8.9 Did you encounter any problems this past cropping season (2011-12)? (Circle) 0=No 1=Yes
E8.10 What has been your major farming problem in the 2011-12 cropping season? (Choose ONE)
1=Shortage of funds to buy inputs 2=Insufficient rains 3=Unavailability of inputs in shops 4=Shortage of draught power 5=Inputs received late 6=Animal diseases 7=Working in other farms/casual labour 8=Labour constraints 9= Illness in the family 10=Other (specify) _________
Section F: Household food consumption
• Over the last seven days, how many days did you consume the following foods?
• What was the main source(s) of the food?
F1 . Number of days
(0 to 7) F2. Main source Food source codes
1 = Own production(crops and livestock)
2 = Casual labour
3 = Bartering
4= Borrowing
5 = Gift including begging(family/friends)
6 = Hunting/gathering/trapping/ fishing
7 = Purchase
8 = Food assistance (UN,
NGOs, Govt)
9=Other
1. Maize, mealie meal
2. Other cereal (rice, sorghum, millet, pasta etc)
3. Bread/flour
4. Roots and Tubers (cassava, potatoes, sweet potatoes)
5. Sugar or sugar products
6. Beans and peas/groundnuts (incl. dovi)
7. Vegetables (including relish and leaves)
8. Fruits domestic
9. Beef, goat, or other red meat and pork, bush meat
10. Poultry (chicken/ducks)
11. Wild foods(leaves, roots, fruits, etc)
12. Eggs
13. Fish (fresh or dried)
14. Oils/fats/butter
15. Milk/other dairy products

59
Section G: Household Food Security
G1. How many months of cereal consumption do you think this year’s harvest will last? [ ]
G3. If the household did not produce enough cereals to last a consumption year, what is the main reason?
1 = Non-availability/ non-affordability of seed, 2 = Non-availability/ non-affordability of fertilizer,
3 = Poor rainfall, 4 = Shortage of labour 5 = Lack of draught power 6 = Other specify
G4.If you did not produce enough this year, how would you obtain cereal ( rank , 1 being the major source)
Source Purchases Casual Labor
Food Aid (Gvt)
Food Aid (NGO)
Remittances and Gifts
Other, specify
Rank
Section H. Market linkages
H1. Where do you sell your produce? (circle all that apply)
1= Contract buying 2=Farmer to farmer 3=Open markets 4=Town/city markets
H2. How many km to do you travel to the market? |__| |__|
H3. How do you sell your produce? 1=As Individual 2=As Group
H4. If YES, when was the group formed? 1= In the last 20 months (since October 2010) 2= Before October 2010
H5. How is the produce ferried to the market?
1=Trucks 2= Buses 3=On head 4=Buyers come collect on their own 5=animal draft/scotch carts
H6.How do you advertise your produce? (circle all that apply)
1= I do not advertise my produce 2=Stand on the road side with it 3=Put it on local media (newspapers) 4=Contactor looks for customers
Section I: Financial viability and business development
I1. Have you taken an agricultural loan in the last 18 months?
I2. Crop type (1=Tea 2=Coffee 3=Bananas 4=Sugar beans 5=Maize)
Value (USD) Lending institution Cash Value (how much has been repaid)

60
I3. Do you keep records of all financial transactions you conduct? (Observe
– financial records)
Yes[ __ ] Partial [ __ ]
No[ __ ]
I4. If no, WHY?
1= Do not have the money to buy stationery 2= Cannot write 3=l Don’t know 4=l don’t perceive any benefit to it 5= l don’t understand 6=l have trouble with additions 7= Other (specify)
Section J. Employment Creation
J1. How many people do you employ on farm and off farm? On farm M [ __ ] Off farm M [ __ ]
On farm F [ __ ] Off farm F [ __ ]
J2. How many of the above are permanent employees On farm M [ __ ] Off farm M [ __ ]
On farm F [ __ ] Off farm F [ __ ]
J.3 How many have worked for at least one month (22 consecutive days since October 2010)
On farm M [ __ ] Off farm M [ __ ]
On farm F [ __ ] Off farm F [ __ ]
J4. How many family members also work on the farm?
J.5 How do you pay your workers?
1=Daily wage 2=Weekly wage 3=Monthly wage 4=Based on specific contract 5=Piece/task rate 6=Other (specify)…………………………………………………………………………………..
Section K: Household Hunger Scale
K1. No food to eat of any kind in your household? 1=Never 2=Rarely or sometimes 3=Often
K2. Go to sleep without eating a meal? 1=Never 2=Rarely or sometimes 3=Often
K3. Spend whole day and night without eating 1=Never 2=Rarely or sometimes 3=Often
The End