EnclosureNo.1ofRegionalOrderNo. ,s.2020 ... - DepED Caraga
48
DepEdRO13-REC-013/R3/02-18-2020 Document Control No: Enclosure No. 1 of Regional Order No. ____, s. 2020 REVISED SCHOOLS MONITORING, EVALUATION, AND ADJUSTMENTS (SMEA) TEMPLATES and MECHANICS ON DATA PRESENTATION Rationale Schools Monitoring, Evaluation, and Adjustment (SMEA) has been conducted quarterly in all 12 SDOs for the past two School Years. SMEA presentation in the Regional Level was conducted Quarterly also in order to evaluate data and obtain information that are the basis of the Regional Office for Technical Assistance (TA) to all schools in the 12 SDOs. However, in order to have a more comprehensive and complete picture of the situations in the 12 SDOs, some available templates of the SMEA were revised, and additional tables are newly introduced starting this school year 2020-2021. Moreover, one of the updates in the SMEA presentation starting this school year 2020-2021 is the comparison of data between the previous and current school years, and between two Quarters in order to completely understand its trends and determine the impact of the respective school-based initiated interventions for continuous improvement of the 12 SDOs in the region, particularly, in making adjustments in their plan, objectives, strategies, and activities. TABLE OF CONTENTS Section 1: Mechanics on Data Presentation Example 1: Enrolment by Gender in Quarter 4 Example 2: Number of Completers in Quarter 1 Section 2: KRA 1: ACCESS TEMPLATES Table A.1: Enrolment by Gender Table A.1.1: Data for Comparison and Presentation Table A.2: Nutritional Status Table A.2.1: Data for Comparison and Presentation Table A.3: Number of SARDOs/PARDOs Table A.3.1: Data for Comparison and Presentation Table A.4: Number of Dropouts Table A.4.1: Data for Comparison and Presentation Table A.5: Number of Completers Table A.5.1: Data for Comparison and Presentation Table A.6: Number of Graduates Table A.6.1: Data for Comparison and Presentation Table A.7: Failure Rate Table A.7.1: Data for Comparison and Presentation Table A.8: Retention Rate Table A.8.1: Data for Comparison and Presentation Table A.9: Repetition rate Table A.9.1: Data for Comparison and Comparison Table A.10: Number of Contact Days Used
Transcript of EnclosureNo.1ofRegionalOrderNo. ,s.2020 ... - DepED Caraga

DepEdRO13-REC-013/R3/02-18-2020Document Control No:
Enclosure No. 1 of Regional Order No. ____, s. 2020
REVISED SCHOOLS MONITORING, EVALUATION, AND ADJUSTMENTS (SMEA)TEMPLATES and MECHANICS ON DATA PRESENTATION
RationaleSchools Monitoring, Evaluation, and Adjustment (SMEA) has been
conducted quarterly in all 12 SDOs for the past two School Years. SMEApresentation in the Regional Level was conducted Quarterly also in order toevaluate data and obtain information that are the basis of the Regional Office forTechnical Assistance (TA) to all schools in the 12 SDOs. However, in order to have amore comprehensive and complete picture of the situations in the 12 SDOs, someavailable templates of the SMEA were revised, and additional tables are newlyintroduced starting this school year 2020-2021. Moreover, one of the updates inthe SMEA presentation starting this school year 2020-2021 is the comparison ofdata between the previous and current school years, and between two Quarters inorder to completely understand its trends and determine the impact of therespective school-based initiated interventions for continuous improvement of the12 SDOs in the region, particularly, in making adjustments in their plan, objectives,strategies, and activities.
TABLE OF CONTENTS
Section 1: Mechanics on Data Presentation
Example 1: Enrolment by Gender in Quarter 4Example 2: Number of Completers in Quarter 1
Section 2: KRA 1: ACCESS TEMPLATES
Table A.1: Enrolment by GenderTable A.1.1: Data for Comparison and Presentation
Table A.2: Nutritional StatusTable A.2.1: Data for Comparison and Presentation
Table A.3: Number of SARDOs/PARDOsTable A.3.1: Data for Comparison and Presentation
Table A.4: Number of DropoutsTable A.4.1: Data for Comparison and Presentation
Table A.5: Number of CompletersTable A.5.1: Data for Comparison and Presentation
Table A.6: Number of GraduatesTable A.6.1: Data for Comparison and Presentation
Table A.7: Failure RateTable A.7.1: Data for Comparison and Presentation
Table A.8: Retention RateTable A.8.1: Data for Comparison and Presentation
Table A.9: Repetition rateTable A.9.1: Data for Comparison and Comparison
Table A.10: Number of Contact Days Used
004
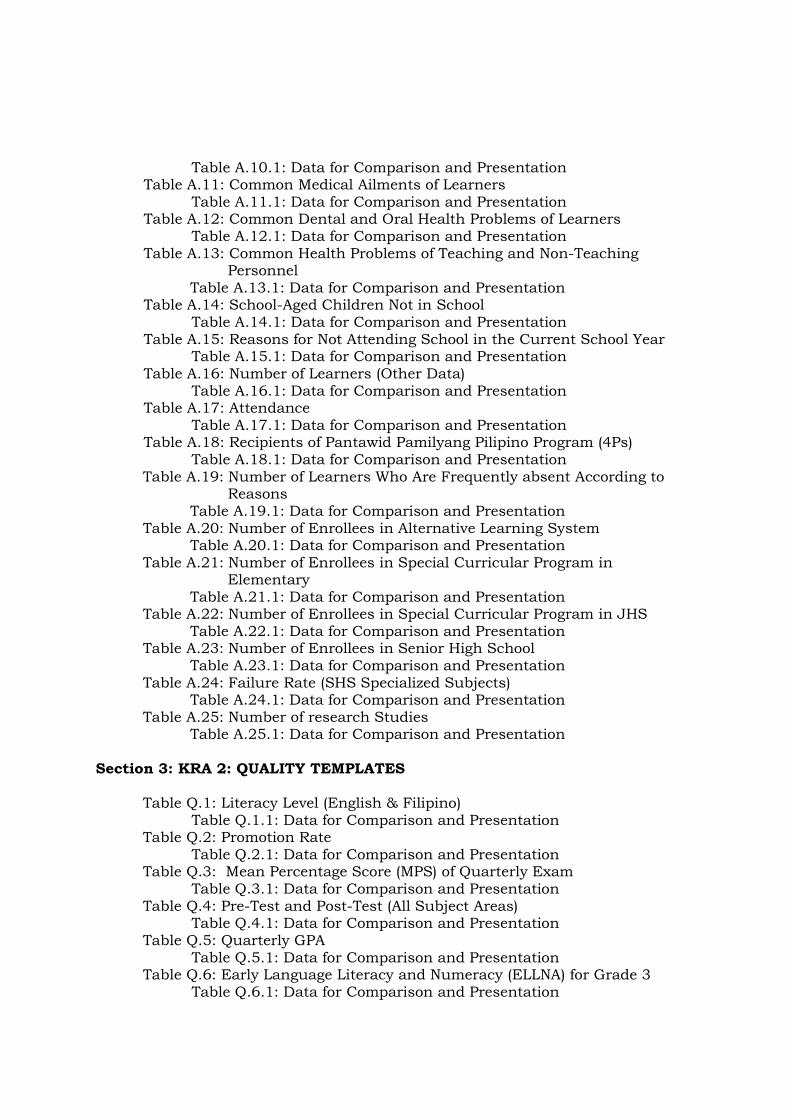
Table A.10.1: Data for Comparison and PresentationTable A.11: Common Medical Ailments of Learners
Table A.11.1: Data for Comparison and PresentationTable A.12: Common Dental and Oral Health Problems of Learners
Table A.12.1: Data for Comparison and PresentationTable A.13: Common Health Problems of Teaching and Non-Teaching
PersonnelTable A.13.1: Data for Comparison and Presentation
Table A.14: School-Aged Children Not in SchoolTable A.14.1: Data for Comparison and Presentation
Table A.15: Reasons for Not Attending School in the Current School YearTable A.15.1: Data for Comparison and Presentation
Table A.16: Number of Learners (Other Data)Table A.16.1: Data for Comparison and Presentation
Table A.17: AttendanceTable A.17.1: Data for Comparison and Presentation
Table A.18: Recipients of Pantawid Pamilyang Pilipino Program (4Ps)Table A.18.1: Data for Comparison and Presentation
Table A.19: Number of Learners Who Are Frequently absent According toReasons
Table A.19.1: Data for Comparison and PresentationTable A.20: Number of Enrollees in Alternative Learning System
Table A.20.1: Data for Comparison and PresentationTable A.21: Number of Enrollees in Special Curricular Program in
ElementaryTable A.21.1: Data for Comparison and Presentation
Table A.22: Number of Enrollees in Special Curricular Program in JHSTable A.22.1: Data for Comparison and Presentation
Table A.23: Number of Enrollees in Senior High SchoolTable A.23.1: Data for Comparison and Presentation
Table A.24: Failure Rate (SHS Specialized Subjects)Table A.24.1: Data for Comparison and Presentation
Table A.25: Number of research StudiesTable A.25.1: Data for Comparison and Presentation
Section 3: KRA 2: QUALITY TEMPLATES
Table Q.1: Literacy Level (English & Filipino)Table Q.1.1: Data for Comparison and Presentation
Table Q.2: Promotion RateTable Q.2.1: Data for Comparison and Presentation
Table Q.3: Mean Percentage Score (MPS) of Quarterly ExamTable Q.3.1: Data for Comparison and Presentation
Table Q.4: Pre-Test and Post-Test (All Subject Areas)Table Q.4.1: Data for Comparison and Presentation
Table Q.5: Quarterly GPATable Q.5.1: Data for Comparison and Presentation
Table Q.6: Early Language Literacy and Numeracy (ELLNA) for Grade 3Table Q.6.1: Data for Comparison and Presentation

Table Q.7: National Achievement Test (NAT) for Grade 6 and Grade 10Table Q.7.1: Data for Comparison and Presentation
Table Q.8: Basic Education Exit Assessment (BEEA)Table Q.8.1: Data for Comparison and Presentation
Table Q.9: Quarterly Least Mastered Competencies for KindergartenTable Q.9.1: Data for Comparison and Presentation
Table Q.10: Quarterly Least Mastered Competencies for ElementaryTable Q.10.1: Data for Comparison and Presentation
Table Q.11: Quarterly Least Mastered Competencies for JHSTable Q.11.1: Data for Comparison and Presentation
Table Q.12: Quarterly Least Mastered Competencies for SHSTable Q.12.1: Data for Comparison and Presentation
Section 4: KRA 3: GOVERNANCE TEMPLATES
Table G.1-6: Number of Classrooms, Comfort rooms, Armchairs, MonoblockChairs, Learners’ and Teachers’ tables and Chairs
Table G.1-6.1: Data for Comparison and PresentationTable G.7-10: Number of Functional Library, Science laboratories, TLE
Laboratories and ICT LaboratoriesTable G.7-10.1: Data for Comparison and Presentation
Table G.11: Number of Results-Based Performance Management System(IPCR/OPCR)
Table G.11.1: Data for Comparison and PresentationTable G.12: Number of Textbooks per Subject Areas
Table G.12.1: Data for Comparison and PresentationTable G.13: Funding Sources
Table G.13.1: Data for Comparison and PresentationTable G.14: Awards and Recognition
Table G.14.1: Data for Comparison and PresentationTable G.15: Stakeholders Support to Education
Table G.16.1: Data for Comparison and PresentationTable G.16: Learner-Teacher Ratio
Table G.16.1: Data for Comparison and PresentationTable G.17: Learner-Classroom Ratio
Table G.17.1: Data for Comparison and PresentationTable G.18: Learner-Toilet Ratio
Table G.18.1: Data for Comparison and PresentationTable G.19: Learner-Toilet Bowl Ratio
Table G.19.1: Data for Comparison and PresentationTable G.20: Teachers’ Professional Development
Table G.20.1: Data for Comparison and PresentationTable G.21: Rooms for Ancillary Services
Table G.21.1: Data for Comparison and PresentationTable G.22: Instructional Supervision
Table G.22.1: Data for Comparison and PresentationTable G.23: School Heads Professional Development
Table G.23.1: Data for Comparison and PresentationTable G.24: Water, Sanitation, and Hygiene (WASH)

Table G.24.1: Data for Comparison and PresentationTable G.25: Internet Connectivity
Table G.25.1: Data for Comparison and PresentationTable G.26: Electrical Supply
Table G.26.1: Data for Comparison and PresentationTable G.27: Number of Learning Action Cell (LAC) Sessions
Table G.27.1: Data for Comparison and PresentationTable G.28: Induction Program, Professional Learning and Development,
Employee Welfare, and Performance Management SystemTable G.28.1: Data for Comparison and Presentation
Table G.29: Reading Program Utilization of FundsTable G.29.1: Data for Comparison and Presentation
SECTION 1Mechanics on Data Presentation
The tables below are a guide for the SDOs on what data and what quartersor months they shall compare, in order to have a clear picture and understandingduring SMEA presentation of the trends of the data and the impact of therespective school-based intervention programs of each SDO. Each SDO shall usethe consolidated data as basis for comparison, and difference shall be used forpoint of discussion. Below, are examples on how to treat and discuss thecomparison of the data of two school years or two quarters.
Example 1: Enrolment by Gender in Quarter 4
Table A.1: Enrolment by Gender
Grade LevelQuarter 4 Enrolment by Gender
(As of October of Current School Year)Male Female Total
Grade 1 1035 2566 3601-
As can be gleaned in the table above, the data of enrolment by gender forGrade 1 Level in Quarter 4 is shown where there are 1035 male students and 2566female students, and with a total of 3601 students.
Table A.1.1: Data for Comparison and PresentationGradeLevel
JULY CURRENT SY OCTOBER CURRENT SY DifferenceM F T M F T M F T
Grade 1 1045 2353 3398 1035 2368 3403 -10 15 5- - - - - - - - -
As depicted from the table above, it can be gleaned that the difference in thenumber of male enrolment in July and October is -10, which means that the maleenrollees in the month of October is fewer than in the month of June by 10.However, as observed further, the female enrollees has a difference of 15 whichmeans that there is an increase in the number of female enrollees in the month of

October as compared to the month of June. Thus, for the total difference, it can beobserved that it increases by 5 students from the month of June to the month ofOctober.
Another example below is for percentage data.
Example 2: Number of Completers in Quarter 1
Table A.5: Number of Completers
GradeLevel
Enrolment of CurrentSY Total Completers %
M F T M F T M F TGrade 1 1045 2353 3398 1035 2332 3367 99.04% 99.11% 99.09%
- - - - - - - - -
As shown in the table above, there are 1,035 male completers whichcomprises 99.04% among the total male enrollees for the current school year.Moreover, there are 2,332 female completers which comprises 99.11% among thefemale enrollees in the current school year. In total, there are 3,367 Grade 1completers and it comprises 99.09% among the total enrolment.
Table A.5.1: Data for Comparison and Presentation
GradeLevel
PREVIOUS SY. CURRENT SY. DifferenceM F T M F T M F T
Grade 1 1028 2330 3358 1035 2332 3367 7 2 998.38% 98.43% 98.40% 99.04% 99.11% 99.09% 0.66% 0.68% 0.69%
- - - - - - - - -
As reflected in the table above, the results show that the difference of thenumber and percentage of male completers are 7 and 0.66 percentage points,respectively, which means that there is a slight increase in the number andpercentage points of male completers. While the number and percentage of femalecompleters have 2 and 0.68 difference, respectively, which means that the numberof female completers has also increased in the current school year. Over-all, it canbe gleaned from the table above that the total difference of the number andpercentage of completers have increased for about 9 and 0.69 percentage points,respectively, from the previous year to current school year.
The tables below are a guide for the SDOs as to what data to be gatheredand in what months or school years to be compared.

SECTION 2KRA1- ACCESS TEMPLATES
Table A.1: Enrolment by GenderThe data to be gathered is the number of enrollees by gender and to be
presented quarterly following the table A.1.1 as to what data to be compared duringpresentation.
Grade LevelEnrolment by Gender in a Quarter
(As of _________ of Current School Year)Male Female Total
KindergartenGrade 1Grade 2Grade 3Grade 4Grade 5Grade 6Grade 7Grade 8Grade 9Grade 10Grade 11Grade 12Total
Table A.1.1: Data for Comparison and PresentationAs observed from the table below that in Q2, the enrollment for June of the
Current school year shall be compared to the March enrollment of the previousschool year. For Q3, June of current school year is to be compared to theenrollment in July of current school year, while in Q4 data for July and Septemberof current school year are to be compared, and lastly, for Q1, data for July,September and March of current school year are to be compared in order tocomplete the trend of Enrolment data across all quarters.
Q1 Q2 Q3 Q4
JULY CURRENT SY
VS
OCTOBER CURRENT SY
VS
MARCH CURRENT SY
MARCH PREVIOUS SY
VS
JUNE CURRENT SY
JUNE CURRENT SY
VS
JULY CURRENT SY
JULY CURRENT SY
VS
OCTOBER CURRENT SY
Table A.2: Nutritional StatusThe data to be gathered when it comes to Nutritional Status of the learners
must follow the table below. Baseline shall be done in July of current school yearand the End line shall be done during the Month of January of the same schoolyear.

Table A.2.1: Data for Comparison and PresentationAs can be gleaned from the table below, Nutritional Status shall only be
presented in Q1 & Q3. In Q3, only the Baseline shall be presented, while in Q1, theBaseline in Q3 shall be compared to the End line which shall be taken in Januaryof Current SY.
Q1 Q2 Q3 Q4
JULY
CURRENT SYVS
JANUARY
CURRENT SYNONE
JULY CURRENT SY VS
JANUARY PREVIOUS SYNONE
Table A.3: Number of SARDOs/PARDOs

The main data to be gathered is the number of Students/Pupils at Risk ofDropping Out (SARDOs) in which they are the one who incur 5 or more consecutiveabsences during each Quarter of Current School Year. Moreover, Total Enrolmentfor the current SY shall be gathered so that percentage of the data will bedetermined.
Table A.3.1: Data for Comparison and PresentationData shall be firstly presented in Q3 which comprises the data from the
month of June to September of the current school year. In Q4, data fromSeptember shall be compared to the data in December which comprises data fromOctober to December. Lastly, in Q1, data to be compared are the data fromSeptember, December and March of the current School Year.
Q1 Q2 Q3 Q4SEPTEMBER CURRENT SY
VS
DECEMBER CURRENT SY
VS
MARCH CURRENT SY
NONESEPTEMBER
CURRENT SY
SEPTEMBER CURRENT SY
VS
DECEMBER CURRENT SY
Table A.4: Number of DropoutsThe main data to be gathered is the simple dropout which is the number of
students who did not finish or who drop out within the current school year due tosome reasons. Moreover, total enrolment shall still be gathered in order todetermine the percentage of those students who were not able to finish the schoolyear.
Table A.4.1: Data for Comparison and PresentationAs clearly stated in the table below, the data are to be presented only in Q4
and the data to be compared are the data of previous school year and the data ofthe current school year.
Q1 Q2 Q3 Q4
NONE NONE NONE
Number and % of students who did not finish the school
year as of MARCH of previous SY
VS
Number and % of students who did not finish the school
year as of MARCH of CURRENT SY
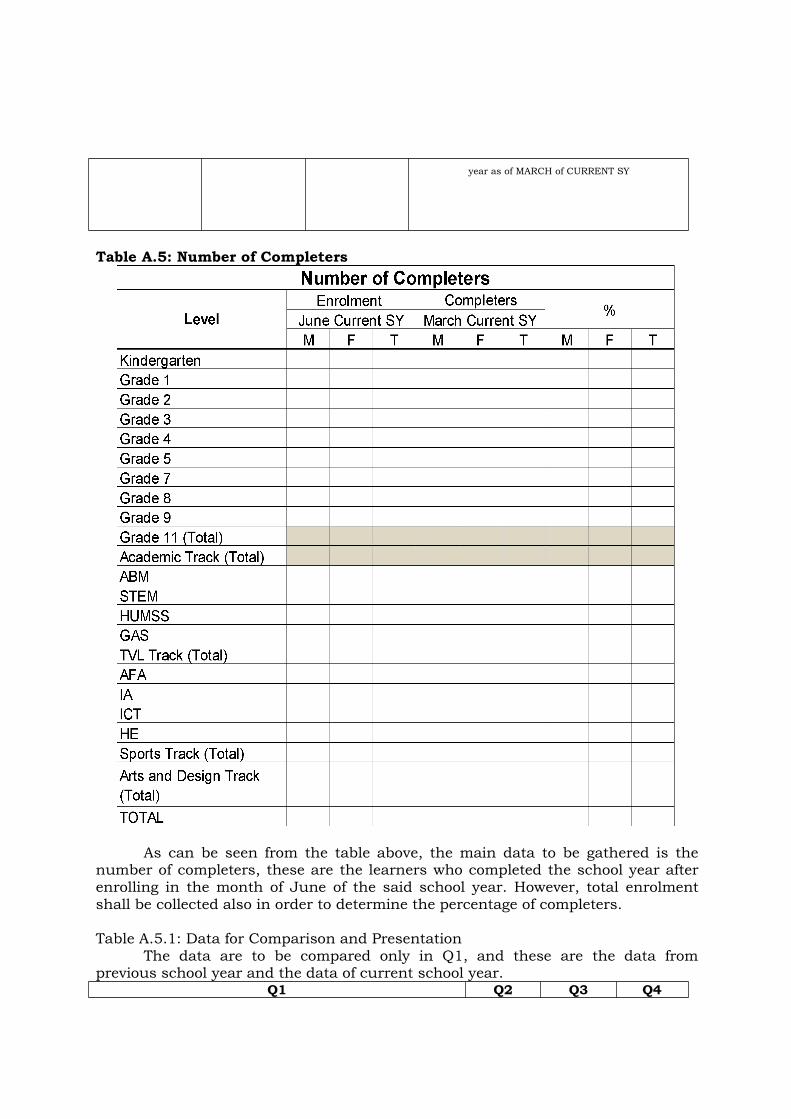
Table A.5: Number of Completers
As can be seen from the table above, the main data to be gathered is thenumber of completers, these are the learners who completed the school year afterenrolling in the month of June of the said school year. However, total enrolmentshall be collected also in order to determine the percentage of completers.
Table A.5.1: Data for Comparison and PresentationThe data are to be compared only in Q1, and these are the data from
previous school year and the data of current school year.Q1 Q2 Q3 Q4

NO. and % OF COMPLETERS
of PREVIOUS SYVS
NO. and % OF COMPLETERS
of CURRENT SYNONE NONE NONE
Table A.6: Number of Graduates
The main data to be gathered is the number of graduates of the currentschool year. As to the percentage of graduates, enrolment data shall be gathered inorder to determine and clearly understand the status of every SDO in the region asto their graduation rate.
Table A.6.1: Data for Comparison and PresentationThe data are to be presented and to be compared in Q1 which are the data
from previous school year and the data of the current school year.Q1 Q2 Q3 Q4
NO. and % OF GRADUATES
of PREVIOUS SYVS
NO. and % OF GRADUATES
of CURRENT SYNONE NONE NONE
Table A.7: Failure Rate

As can be gleaned from the table above, it can be noted that the maindata to be gathered is the failure rate of all subjects from Grade 1 to Grade 10.However, Enrolment data shall be gathered also in order to determine the failurerate of very subject.Table A.7.1: Data for Comparison and Presentation
As stated below, the data shall be presented in Q3, Q4, and Q1. Only 1stgrading results shall be presented in Q3 for we don’t have data to be compared with.Moreover, in Q4, 1st grading and 2nd grading results shall be compared, and lastly,in Q1, all grading periods shall be presented. However, only 3rd and 4th gradingperiods shall be compared and be computed for its data difference.
Q1 Q2 Q3 Q41ST GRADING PERIOD
VS
2ND GRADING PERIOD
VS
3RD GRADING PERIOD
VS
4TH GRADING PERIOD OF CURRENT
SY.
NONE1ST GRADING PERIOD
OF CURRENT SY.
1ST GRADING PERIOD OF
CURRENT SY.
VS
2ND GRADING PERIOD OF
CURRENT SY.
Table A.8: Retention RateAs shown in the table below, the main data to be gathered is the retention
rate of students from previous school year up to the current school year. As to theformula in getting the retention rate, for example in elementary, the total enrolmentfrom Grade 2 to Grade 6 of the current school year shall be divided by the totalenrolment from Grade 1 to Grade 5 of the previous school year then multiply by100. Same with the Junior High School in which the total enrolment from Grade 8to Grade 10 of the current school year shall be divided by the total enrolment fromGrade 7 to Grade 9 of previous school year then multiply by 100. Finally, for theSenior High School, the total enrolment of grade 12 of the current school year shallbe divided by the total enrolment of Grade 11 of previous school year then multiplyby 100.

Table A.8.1: Data for Comparison and PresentationAs can be observed from the table below, the data to be compared are the
number and retention rates of the previous and current school years and theseshall be presented in Quarter 2.
Q1 Q2 Q3 Q4
NONENO. AND RETENTION
RATE OF PREVIOUS SYVS
NO. AND RETENTION
RATE OF CURRENT SYNONE NONE
Table A.9: Repetition Rate
The table above shows the data to be gathered which is the repetition rateof the learners. Repetition rate means the percentage of the number of studentswho repeated the grade level of the current school year same as the previous schoolyear. In order to get the repetition rate, the total number of repeaters of every grade

level in the current school year shall be divided by the total enrolment of everygrade level of the previous school year then multiply by 100.
Table A.9.1: Data for Comparison and PresentationAs shown in the table below, the number and repetition rate of the
previous school year shall be compared to the number and repetition rate of thecurrent school year and shall be presented in Q2 since during this time all schoolshave already their data. However, during this time of the school year enrolmentdata are not yet final since enrolment data as of June of the current school year areconsidered quick count data but enough already to tell and support the wholepicture of the repetition rate of every SDO.
Q1 Q2 Q3 Q4
NONENO. AND REPETITION
RATE OF PREVIOUS SYVS
NO. AND REPETITION
RATE OF CURRENT SYNONE NONE
Table A.10: Number of Contact Days UsedAs observed from the table below, the main data to be gathered is the
average number of days used in a quarter. However, in order to determine suchdata, the number of schools is to be provided and the allotted number of days permonth in a quarter shall be reflected. Moreover, the very important variable whichis the actual total number of contact days used per month in a quarter. In order todetermine the said data, SDOs shall add up all the actual number of contact daysper month of each school in their respective divisions. Furthermore, to get theaverage number of contact days used per month, the actual total number of daysused per month shall be divided by the number of schools. Moreover, as to thepercentage of contact days used, the Average number of contact days shall bedivided by the allotted number of days then multiply by 100.
Table A.10.1: Data for Comparison and PresentationAs can be observed from the below above, the data are to be presented in
three quarters only, Q3, Q4, & Q1. In Q3 there is no comparison of data to bepresented, instead only the average and percentage of number of days used in the

months of June to September of the current school year are to be presented.Moreover, in Q4, data in Q3 shall be compared to the data from the month ofOctober to December, while in Q1, all data from June to September, October toDecember, and from the month of January to April of current school year shall becompared.
Q1 Q2 Q3 Q4AVERAGE & % OF NUMBER OF DAYS
USED IN JUNE-SEPT CURRENT SY
VS
AVERAGE & % OF NUMBER OF DAYS
USED IN OCT-DEC CURRENT SY
VS
AVERAGE & % OF NUMBER OF DAYS
USED IN JAN-APRIL CURRENT SY
NONE
AVERAGE &
% OF NUMBER OF
DAYS USED IN
JUNE-SEPT OF
CURRENT SY
AVERAGE & % OF NUMBER OF DAYS USED
IN JUNE-SEPT OF CURRENT SY
VS
AVERAGE & % OF NUMBER OF DAYS USED
IN OCT-DEC CURRENT SY
Table A.11: Common Medical Ailments of LearnersThe data to be gathered in the table below are the common type of
ailments identified among the students in the schools. These common ailments arethe following: Dental caries/Tooth Decay, Colds, Pediculosis, Abdominal Pain, TiniaFlava, Fever, Impacted Cerumen, Cough, Minor Injuries, Headache, and otherailments. SDOs shall only identify the number of students by gender who falls tothe type of ailments identified.
Table A.11.1: Data for Comparison and PresentationQ1 Q2 Q3 Q4
DATA FROM THE MONTH OF JUNE-
SEPT OF CURRENT SY
VS
DATA FROM THE MONTH OF OCT-DEC
OF CURRENT SY
VS
DATA FROM THE MONTH OF JAN-MAR
OF CURRENT SY
DATA FROM THE
MONTH OF JUNE OF
CURRENT SY
DATA FROM THE MONTH OF
JUNE OF CURRENT SY
VS
DATA FROM THE MONTH OF
JULY-SEP OF CURRENT SY
DATA FROM THE MONTH OF
JULY-SEP OF CURRENT SY
VS
DATA FROM THE MONTH OF
OCT-DEC OF CURRENT SY
The data are to be presented in all quarters. In Q2, only the data in themonth of June are to be presented without any comparison to a certain data. For
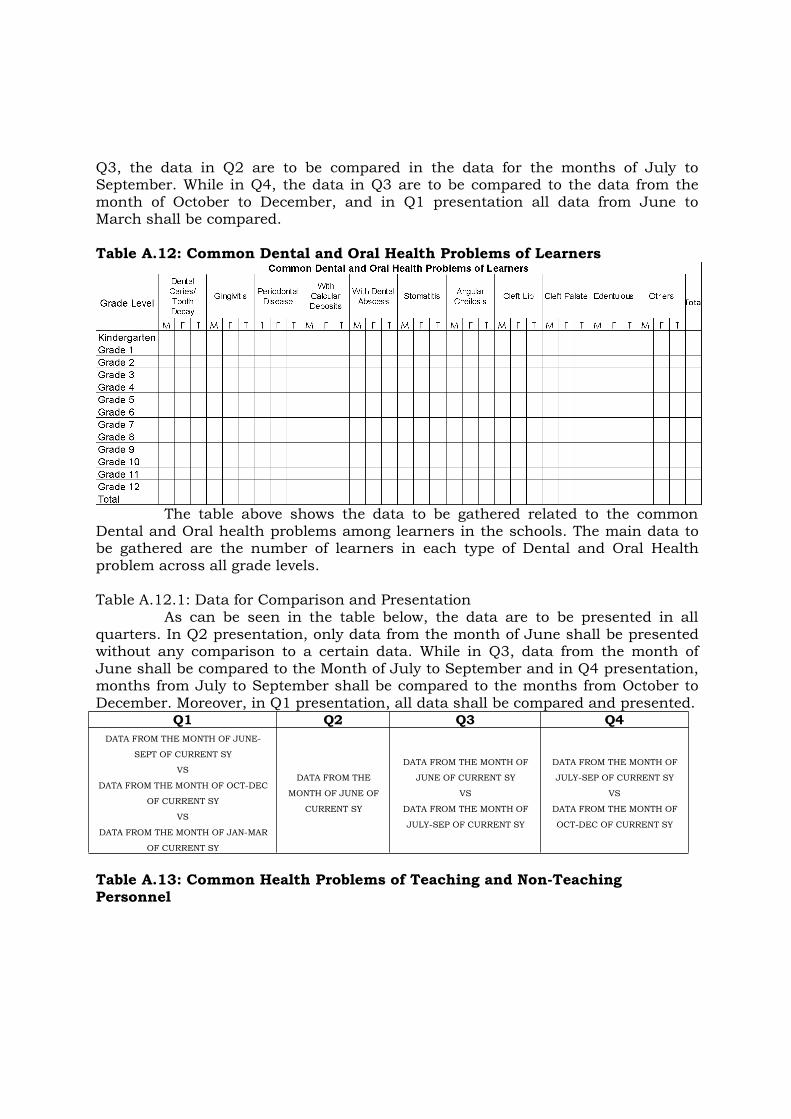
Q3, the data in Q2 are to be compared in the data for the months of July toSeptember. While in Q4, the data in Q3 are to be compared to the data from themonth of October to December, and in Q1 presentation all data from June toMarch shall be compared.
Table A.12: Common Dental and Oral Health Problems of Learners
The table above shows the data to be gathered related to the commonDental and Oral health problems among learners in the schools. The main data tobe gathered are the number of learners in each type of Dental and Oral Healthproblem across all grade levels.
Table A.12.1: Data for Comparison and PresentationAs can be seen in the table below, the data are to be presented in all
quarters. In Q2 presentation, only data from the month of June shall be presentedwithout any comparison to a certain data. While in Q3, data from the month ofJune shall be compared to the Month of July to September and in Q4 presentation,months from July to September shall be compared to the months from October toDecember. Moreover, in Q1 presentation, all data shall be compared and presented.
Q1 Q2 Q3 Q4DATA FROM THE MONTH OF JUNE-
SEPT OF CURRENT SY
VS
DATA FROM THE MONTH OF OCT-DEC
OF CURRENT SY
VS
DATA FROM THE MONTH OF JAN-MAR
OF CURRENT SY
DATA FROM THE
MONTH OF JUNE OF
CURRENT SY
DATA FROM THE MONTH OF
JUNE OF CURRENT SY
VS
DATA FROM THE MONTH OF
JULY-SEP OF CURRENT SY
DATA FROM THE MONTH OF
JULY-SEP OF CURRENT SY
VS
DATA FROM THE MONTH OF
OCT-DEC OF CURRENT SY
Table A.13: Common Health Problems of Teaching and Non-TeachingPersonnel

The table above shows the data on the common health problems ofteaching and non-teaching personnel in the 12 SDOs. The data to be gathered arethe number of teaching and non-teaching personnel who have the type of healthproblems mentioned or stated in the said table below. The basis of the data to begathered below is the annual medical checkup of the teaching and the non-teaching personnel in the 12 SDOs.
Table A.13.1: Data for Comparison and PresentationAs stated in the table below, the data shall be presented where the data of
previous school year shall be compared to the data in the current school year.Q1 Q2 Q3 Q4
NONE DATA OF PREVIOUS SY VS DATA OF CURRENT SY NONE NONE
Table A.14: School-Aged Children Not in SchoolAs shown in the table below, the main data to be gathered are the
number and percentage of school-aged children not in school. School-aged childrenare those children whose ages are 5-17 years old. To determine the total populationof school-aged children in the community, the school shall conduct mapping orsurvey within or nearby communities where their school is located. To determinethe percentage of school-aged children not in school, the number of school-agedchildren not in school shall be divided by the total population of school-agedchildren then multiply by 100.
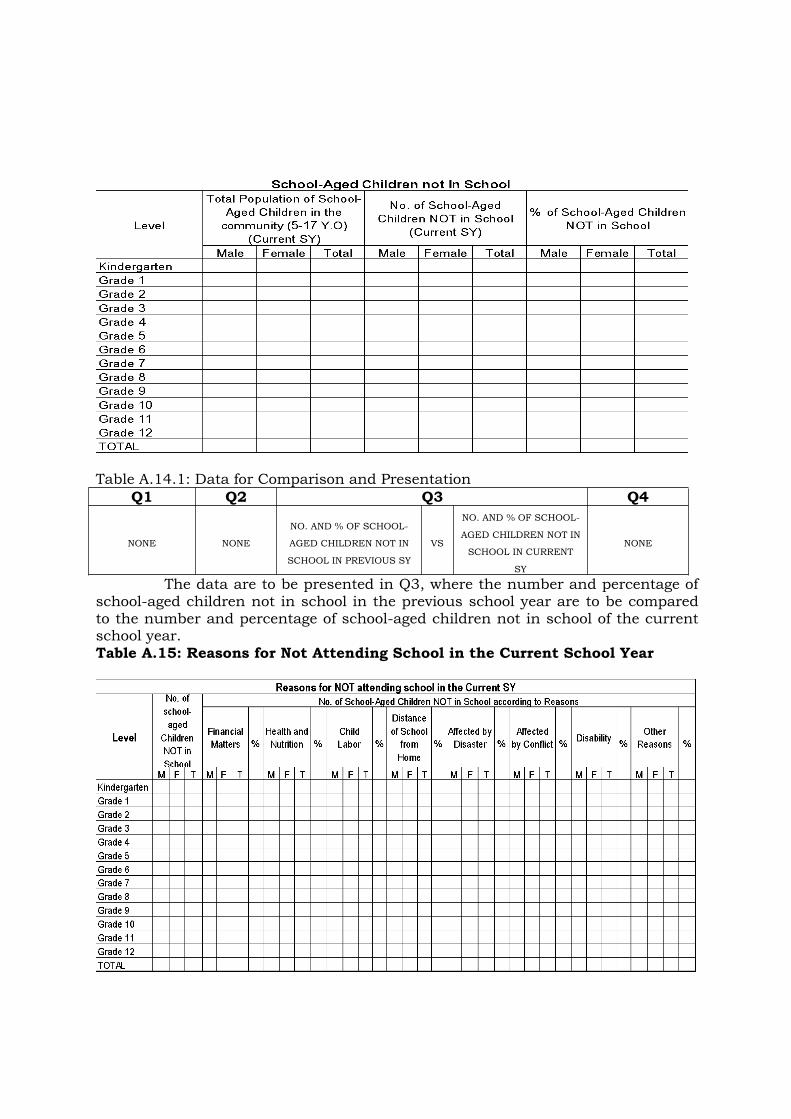
Table A.14.1: Data for Comparison and PresentationQ1 Q2 Q3 Q4
NONE NONE
NO. AND % OF SCHOOL-
AGED CHILDREN NOT IN
SCHOOL IN PREVIOUS SY
VS
NO. AND % OF SCHOOL-
AGED CHILDREN NOT IN
SCHOOL IN CURRENT
SY
NONE
The data are to be presented in Q3, where the number and percentage ofschool-aged children not in school in the previous school year are to be comparedto the number and percentage of school-aged children not in school of the currentschool year.Table A.15: Reasons for Not Attending School in the Current School Year
As can be seen in the table above, the data to be gathered are the reasonsof the school-aged children for not attending school in the current school year.Moreover, the number of school-aged children not in school from table A.14 andtheir reasons can be simultaneously gathered in the field through mapping orsurvey. As observed further in the said table, common reasons are alreadyidentified so that SDOs will only provide the number of school-aged children whofall to a certain reason for not attending school. As to the percentage, the totalpopulation of school-aged children not in school in the community shall bedetermined so that percentage of every reason can be accomplished.
Table A.15.1: Data for Comparison and PresentationThe data shall be presented only in Q3 where the number and percentage
of school-aged children not in school in the previous school year shall be comparedto the number and percentage of school-aged children not in school in the currentschool year.
Q1 Q2 Q3 Q4
NONE NONENUMBER OF LEARNERS IN
PREVIOUS SYVS
NUMBER OF LEARNERS IN
CURRENT SYNONE
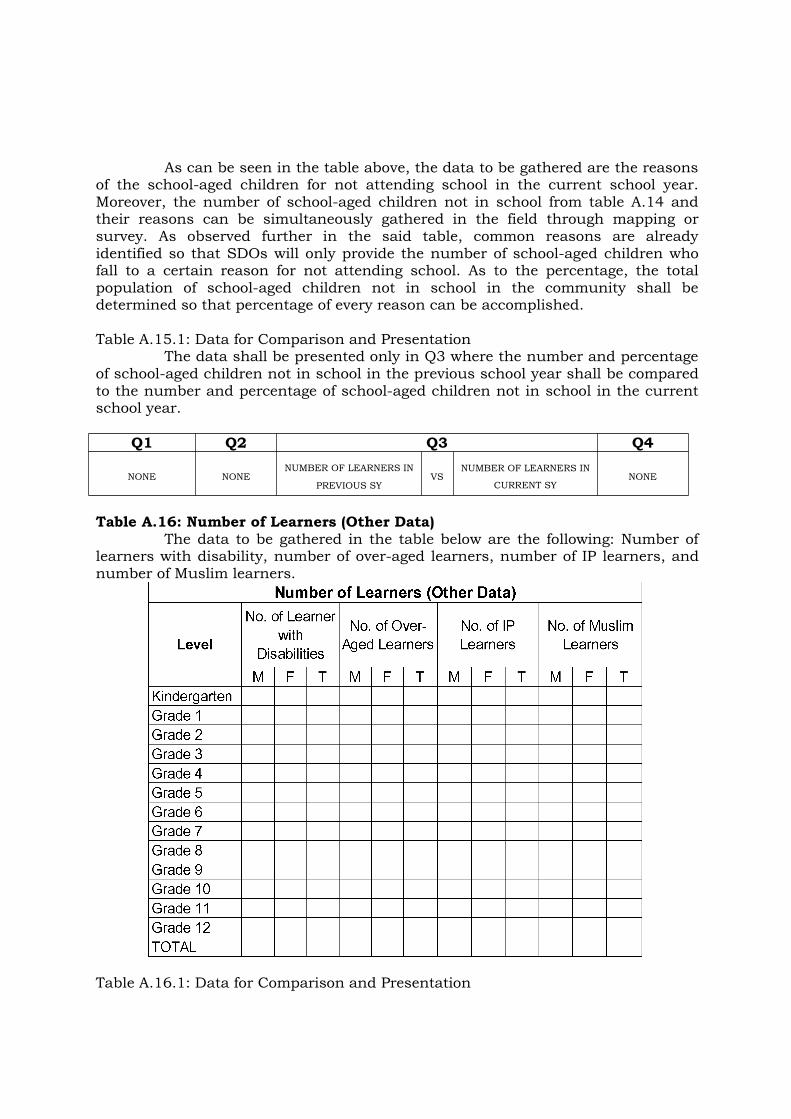
Table A.16: Number of Learners (Other Data)The data to be gathered in the table below are the following: Number of
learners with disability, number of over-aged learners, number of IP learners, andnumber of Muslim learners.
Table A.16.1: Data for Comparison and Presentation

The data to be compared are the data in the previous school year and thedata in the current school year.
Q1 Q2 Q3 Q4
NONE NONE
NUMBER OF
LEARNERS IN
PREVIOUS SY
VS
NUMBER OF
LEARNERS IN
CURRENT SY
NONE
Table A.17: Attendance
As can be seen in the table above that the main data to be gathered arethe number and percentage of learners with 80% or more attendance in the currentschool year. Moreover, enrolment of current school year shall be provided also inorder for the percentage of learners with 80% or more attendance in a school yearbe determined.
Table A.17.1: Data for Comparison and PresentationThe data for the attendance of the students are to be presented in
Quarter 2 in which the number and percentage of learners with 80% or moreattendance in the previous school year are to be compared to the number andpercentage of learners with 80% or more attendance in the current school year.
Q1 Q2 Q3 Q4
NONE
NUMBER AND PERCENTAGE OF
LEARNERS WITH 80% OR MORE
ATTENDANCE OF PREVIOUS SY
VS
NUMBER AND PERCENTAGE OF
LEARNERS WITH 80% OR MORE
ATTENDANCE OF CURRENT SY
NONE NONE
Table A.18: Recipients of Pantawid Pamilyang Pilipino Program (4Ps)

As shown in the table above, the main data to be gathered in this KPItable are the number of students who are recipients of Pantawid Pamilyang PilipinoProgram (4Ps) but incurred more than 10 cumulative absences in a given Quarter.Moreover, a number of students who are recipients of 4Ps shall be provided also inorder to determine the percentage of those recipients of 4Ps who incurred morethan 10 absences in a given Quarter.
Table A. 18.1: Data for Comparison and PresentationQ1 Q2 Q3 Q4
No. and % DATA FROM JUNE-SEPT OF CURRENT SY
VS
No. and % DATA FROM OCT-DEC OF CURRENT SY
VS
No. and % DATA FROM JAN-MAR OF CURRENT SY
NONE
No. and %
DATA FROM
JUNE-SEPT
OF CURRENT
SY
No. and % DATA FROM JUNE-SEPT
OF CURRENT SY
VS
No. and % DATA FROM OCT-DEC
OF CURRENT SY
The data as to the number and percentage of the students who arerecipients of 4Ps but incurred more than 10 absences in a quarter are to bepresented in three quarters only: Q3, Q4, and Q1.
Table A.19: Number of Learners Who Are Frequently Absent According toReasons

As can be shown from the table above, the main data to be gathered isthe number of learners who frequently absent according to reasons. Students willbe identified if they incurred 10 or more absences. Moreover, total enrolment forthe current school year shall be provided also so that the percentage of everyreason shall be determined and be explained in order to clearly understand thesituation of students in the schools.
Table A.19.1: Data for Comparison and PresentationThe data for the number of students who are frequently absent are to be
presented in Q4. Data from the month of June to December of previous school yearshall be compared to the data from the month of June to December of currentschool year.
Q1 Q2 Q3 Q4JUNE-SEPTEMBER OF CURRENT SY
VS
OCTOBER-DECEMBER OF CURRENT SY
VS
JANUARY-MARCH OF CURRENT SY
NONEJUNE-SEPTEMBER OF
CURRENT SY
JUNE-SEPTEMBER OF CURRENT SY
VS
OCTOBER-DECEMBER OF CURRENT
SY
Table A.20: Alternative Learning System (ALS)As can be gleaned from the table below, the main data to be gathered are
the frequency counts of both Elementary and Secondary Levels pertaining to thefollowing categories stated in the said table.

Table A.20.1: Data for Comparison and PresentationPresentation of data shall be done in Quarter 4. The data as of December
of Previous school year shall be compared to the data as of December of currentschool year.
Q1 Q2 Q3 Q4
NONE NONE NONE
DATA AS OF
DECEMBER OF
PREVIOUS SY
VS
DATA AS OF
DECEMBER OF
CURRENT SY
Table A.21: Number of Enrollees in the Special Curricular Program inElementary
The data to be gathered in the table below are the number of enrollees inthe special curricular program in elementary and these are the science curriculum,program in journalism, and SPED. Percentage of students enrolled in everyprogram shall be determined also through dividing the total of enrollees of everyprogram by the total number of enrolment in the current school year then multiplyby 100.

Table A.21.1: Data for Comparison and PresentationThe data are to be presented in Quarter 3 by comparing the data as of
September of previous school year and the data as of September of current schoolyear.
Q1 Q2 Q3 Q4
NONE NONE
DATA AS OF
SEPTEMBER OF
PREVIOUS SY
VS
DATA AS OF
SEPTEMBER OF
CURRENT SY
NONE
Table A.22: Number of Enrollees in the Special Curricular Program-JHS
As stated in the table above, the data to be gathered are the number andpercentages of enrollees in all special curricular programs in Junior High School.
Table A.22.1: Data for Comparison and PresentationThe data are to be presented in Quarter 3 by comparing the data as of
September of previous school year and the data as of September of current schoolyear.
Q1 Q2 Q3 Q4
NONE NONE
DATA AS OF
SEPTEMBER OF
PREVIOUS SY
VS
DATA AS OF
SEPTEMBER OF
CURRENT SY
NONE
Table A.23: Number of Enrollees in the Senior High School

The data to be gathered in the table above are the number andpercentages of enrollees in Senior High School which are classified into differenttracks: Academic Track, TVL Track, Arts and Design Track and the Sports Track.
Table A.23.1: Data for Comparison and PresentationThe data shall be presented in Quarter 3, Quarter 4, and Quarter 1.
However, the data to be presented in Q3 are only the data as of July of the currentschool year without any comparison to a certain data. While the data in Q4 shall bepresented through a comparison of data in Q3 and the data in Q4, and in Q1presentation, data in Q4 shall be compared to the data of Q1.
Q1 Q2 Q3 Q4NO. AND % OF ENROLLEES AS OF JULY
OF CURRENT SY
VS
NO. AND % OF ENROLLEES AS OF
OCTOBER OF CURRENT SY
VS
NO. AND % OF ENROLLEES AS OF
MARCH OF CURRENT SY
NONE
NO. AND % OF
ENROLLEES AS
OF JULY OF
CURRENT SY
NO. AND % OF ENROLLEES AS OF
JULY OF CURRENT SY
VS
NO. AND % OF ENROLLEES AS OF
OCTOBER OF CURRENT SY
Table A.24: Failure Rate in SHS Specialized SubjectsThe data to be gathered are the failure rate in the Senior High School
Specialized Subjects.

Table A.24.1: Data for Comparison and Presentation
Q1 Q2 Q3 Q4FAILURE RATE 1ST GRADING PERIOD OF CURRENT SY
VS
FAILURE RATE 2ND GRADING PERIOD OF CURRENT SY
VS
FAILURE RATE 3RD GRADING PERIOD OF CURRENT SY
VS
FAILURE RATE 4TH GRADING PERIOD OF CURRENT SY
NONE
FAILURE RATE
1ST GRADING
PERIOD OF
CURRENT SY
FAILURE RATE 1ST GRADING
PERIOD OF CURRENT SY
VS
FAILURE RATE 2ND GRADING
PERIOD OF CURRENT SY
The data are to be presented in three quarters: Quarter 3, Quarter 4, andQuarter 1. There is no comparison of data in Q3, while in Q4 and Q1 data shall becompared to its preceding quarter.Table A.25: Number of Research Studies

The table above shows the data to be gathered which are the number ofresearches conducted in a given school year. The researchers are classified intoteaching and non-teaching personnel and the type of research which are the ActionResearch and the Basic Research. Moreover, the number of research studies whichare funded by either Basic Education Research Fund (BERF) or by other Fundssuch as Special Education Fund (SEF), or No Funds at all are needed to begathered also in order to monitor the research studies of those researchers thatneed to be funded. Furthermore, number of researches that are presented in anyresearch forum shall also be gathered along with the number of research studiespublished in any publication.
Table A.25.1: Data for Comparison and PresentationAs shown in the table below, it can be gleaned that the data in previous
school year shall be compared to the data in the current school year, and the saidcomparison of data shall be presented in Quarter 1.
Q1 Q2 Q3 Q4NUMBER OF ACTION
RESEARCHES, BASIC
RESEARCHES, AND THE TOTAL
RESEARCH STUDIES OF
PREVIOUS SY
VS
NUMBER OF ACTION
RESEARCHES, BASIC
RESEARCHES, AND THE TOTAL
RESEARCH STUDIES OF
CURRENT SY
NONE NONE NONE
SECTION 3KRA2- QUALITY TEMPLATES
Table Q.1: Literacy Level for English & Filipino
The table above shows the data to be gathered in the field which are theliteracy level of students in both English and Filipino Subjects. Pre-test shall beconducted in early days of the current school year so that students will beclassified in three types of literacy level and these are the Frustration Level,

Instructional Level, and the Independent Level. Afterwards, Post-test shall be doneafter the intervention program has been conducted.
Table Q.1.1: Data for Comparison and PresentationThe data shall be presented in Quarter 3 and Quarter 1. Data which are
to be presented in Q3 are the pre-test reading results in both English and FilipinoSubjects. Lastly, Post-Test results shall be presented in Q1 and be compared to thePre-test results data of Q3 in order to determine the gained scores between thesetwo tests.
Q1 Q2 Q3 Q4JUNE OF
CURRENT SYVS
MARCH OF CURRENT
SYNONE
JUNE OF CURRENT
SCHOOL YEARNONE
Table Q.2: Promotion RateThe data to be gathered in the table below are the Promotion Rates.
Number of promoted students to another level and the total number of enrolleesshall be provided so that the percentage of promoted students be determined.Moreover, as can be further observed in the aforementioned table that total numberof promoted learners for Elementary, Junior High School, and Senior High Schoolshall be accomplished so that promotion rate for every level can be computed andbe clearly discussed during the SMEA presentation.

Table Q.2.1: Data for Comparison and PresentationThe data shall be presented only in Quarter 2 by comparing the
promotion rate of the previous school year and the promotion rate of the currentschool year.
Q1 Q2 Q3 Q4
NONE
PROMOTION RATE OF PREVIOUS SY
VS
PROMOTION RATE OF CURRENT SY
NONE NONE
Table Q.3: MPS of Quarterly Exam
The table above shows the Mean Percentage Score (MPS) of QuarterlyExams of all subjects per Grade level in Junior High School. It can be noted furtherthat Average MPS shall be gathered in order to assess the performance of thestudents for a quarter across all subjects and across all grade levels per subject.
Table Q.3.1: Data for Comparison and PresentationThe data shall be presented in Quarter 3, Quarter 4, and Quarter 1. For
Q3, only the MPS of 1st Grading Exam shall be presented without any comparisonto a certain data. While in Q4, 1st Grading Exam MPS shall be compared to theMPS of 2nd Grading Exam. Finally, presentation for the Q1 shall be a comparisonbetween the 1st Grading Exam, 2nd Grading Exam, 3rd Grading Exam, and the 4thGrading Exam. However, only the difference between the 3rd Grading Exam and 4thGrading Exam shall be computed.
Q1 Q2 Q3 Q41ST GRADING MPS OF CURRENT SY
VS
2ND GRADING MPS OF CURRENT SY
VS
3RD GRADING MPS OF CURRENT SY
VS
4TH GRADING MPS OF CURRENT SY
NONE1ST GRADING MPS OF
CURRENT SY
1ST GRADING MPS OF
CURRENT SY
VS
2ND GRADING MPS OF
CURRENT SY
Table Q.4: Pre-Test & Post-Test (All Subject Areas)

The data to be collected in the table above are the pre-test and post-test MPSto all subject areas. Pre-test shall be conducted earlier in the school year while thepost-test shall be conducted at the later part of the school year. After the conductof the post-test, gained score shall be computed by just getting the differencebetween the pre-test and post-test (Post-Pre = Gained Score). Moreover, averageMPS shall be computed also to assess the over-all performance of the studentsacross all subject areas and across all grade levels per subject area.
Table Q.4.1: Data for Comparison and PresentationThe data shall be presented in quarter 2 and Quarter 1. Pre-test MPS which
are to be conducted earlier of the school year shall be presented in Q2 without anycomparison to a certain data, while the said data shall be compared to the Post-Test MPS and be presented in Q1. Average Gained MPS shall be emphasized duringthe presentation.
Q1 Q2 Q3 Q4PRE-TEST MPS OF
CURRENT SYVS
POST-TEST MPS OF
CURRENT SY
PRE-TEST MPS OF
CURRENT SYNONE NONE
Table Q.5: Quarterly GPAThe data to be gathered in the table below are the Quarterly GPA of all
students across all grade levels. Moreover, the number and the percentage ofstudents in which their respective GPA fall to the stated grading Scale and itsrespective descriptors such as “Did Not Meet the Expectation, Fairly Satisfactory,Satisfactory, Very Satisfactory, or Outstanding” shall be computed and discussedduring the presentation.

Table Q.5.1: Data for Comparison and PresentationThe data shall be presented in Quarter 3, Quarter 4, and Quarter1. In
Quarter 3, 1st grading GPA shall be presented without any comparison to a certaindata. While in Q4, 1st Grading GPA shall be compared to 2nd Grading GPA. For Q1presentation, 1st Grading GPA, 2nd Grading GPA shall be presented along with thecomparison between the 3rd Grading GPA and 4th Grading GPA.
Q1 Q2 Q3 Q41ST GRADING GPA OF CURRENT SY
VS
2ND GRADING GPA OF CURRENT SY
VS
3RD GRADING GPA OF CURRENT SY
VS
4TH GRADING GPA OF CURRENT SY
NONE1ST GRADING GPA
OF CURRENT SY
1ST GRADING GPA OF CURRENT SY
VS
2ND GRADING GPA OF
CURRENT SY
Table Q.6: Early Language Literacy and Numeracy Assessment (ELLNA)The table below shows the data to be gathered which are the Mean,
Standard Deviation, and MPS in the five learning areas in the Early LanguageLiteracy and Numeracy Assessment (ELLNA) for Grade 3 Learners.
Table Q.6.1: Data for Comparison and Presentation

The data shall be presented in Quarter 4 where the Previous ELLNA MPSshall be compared to the Current ELLNA MPS.
Q1 Q2 Q3 Q4
NONE NONE NONE PREVIOUS ELLNA MPS VS CURRENT ELLNA MPS
Table Q.7: National Achievement Test (NAT) for Grade 6 and Grade 10As shown in the table below, National Achievement Test Mean, Standard
Deviation, and MPS for Grade 6 and Grade 10 shall be gathered as the main data.Moreover, Level of Proficiency shall be determined also to complete the informationregarding the performance of the learners in the said test.
Table Q.7.1: Data for Comparison and PresentationThe data shall be presented in Quarter 4 where the Previous NAT Mean,
Standard Deviation, MPS, and Proficiency Level shall be compared to the CurrentNAT Mean, Standard Deviation, MPS, and Proficiency Level.
Q1 Q2 Q3 Q4
NONE NONE NONEPREVIOUS NAT MEAN,
SD, MPS, AND PLVS
CURRENT NAT MEAN, SD,
MPS, AND PL
Table Q.8: Basic Education Exit Assessment (BEEA) for Grade 12As can be observed in the table below, the data to be gathered are the Mean,
Standard Deviation, MPS, and the Proficiency Level of the seven (7) learning areasto be assessed during the Basic Education Exit Assessment (BEEA) for Grade 12students. The results of the said test would give a clear indication on how far thestudents have learned during their stay in the Senior High School and would tellhow ready they are for College studies.

Table Q.8.1: Data for Comparison and PresentationThe data shall be presented in Quarter 4 where the Previous NAT Mean,
Standard Deviation, MPS, and Proficiency Level shall be compared to the CurrentNAT Mean, Standard Deviation, MPS, and Proficiency Level.
Q1 Q2 Q3 Q4
NONE NONE NONEPREVIOUS NAT MEAN,
SD, MPS, AND PLVS
CURRENT NAT MEAN, SD,
MPS, AND PL
Table Q.9: Quarterly Least-Mastered Competencies for KindergartenAs stated in the table below, it can be gleaned that three quarterly least
mastered competencies in the stated domains for Kindergarten shall be identifiedevery after Quarterly Examination. Intervention shall be specified also so thattechnical assistance will be given appropriately.
Domains Least Mastered Competencies Intervention ProgramsGross Motor
Fine Motor
Self Help
Receptive Language
Expressive Language
Cognitive
Socio Emotional
Table Q.9.1: Data for Comparison and PresentationThe data which are the three least mastered competencies shall be
presented in Quarter 3, Quarter 4, and Quarter 1 without any comparison to acertain data.
Q1 Q2 Q3 Q43RD AND 4TH GRADING LEAST
MASTERED COMPETENCIES OF
CURRENT SY
NONE
1ST GRADING LEAST
MASTERED COMPETENCIES
OF CURRENT SY
2ND GRADING LEAST
MASTERED COMPETENCIES
OF CURRENT SY

Table Q.10: Quarterly Least-Mastered Competencies for Elementary
Grade Level Least Mastered Competencies Intervention Programs1
2
3
4
5
6
Same as in Table Q.7 that the data be gathered are the three least masteredcompetencies of all subject areas and across all grade levels in Elementary.Interventions shall be identified also for a clear understanding of the students’performance across all subject areas.
Table Q.10.1: Data for Comparison and PresentationThe data which are the three least mastered competencies shall be presented
in Quarter 3, Quarter 4, and Quarter 1 without any comparison to a certain data.
Q1 Q2 Q3 Q43RD AND 4TH GRADING LEAST
MASTERED COMPETENCIES OF
CURRENT SY
NONE
1ST GRADING LEAST
MASTERED COMPETENCIES
OF CURRENT SY
2ND GRADING LEAST
MASTERED COMPETENCIES
OF CURRENT SY
Table Q.11: Quarterly Least-Mastered Competencies for JHSSame as the previous two tables above, the data to be gathered are the three
least mastered competencies across all subject areas in Junior High School alongwith specified intervention programs.
Grade Level Least Mastered Competencies Intervention Programs7
8
9
10
Table Q.11.1: Data for Comparison and PresentationThe data which are the three least mastered competencies shall be presented
in Quarter 3, Quarter 4, and Quarter 1 without any comparison to a certain data.Q1 Q2 Q3 Q4
3RD AND 4TH GRADING LEAST
MASTERED COMPETENCIES OF
CURRENT SY
NONE
1ST GRADING LEAST
MASTERED COMPETENCIES
OF CURRENT SY
2ND GRADING LEAST
MASTERED COMPETENCIES
OF CURRENT SY
Table Q.12: Quarterly Least Mastered Competencies for SHS
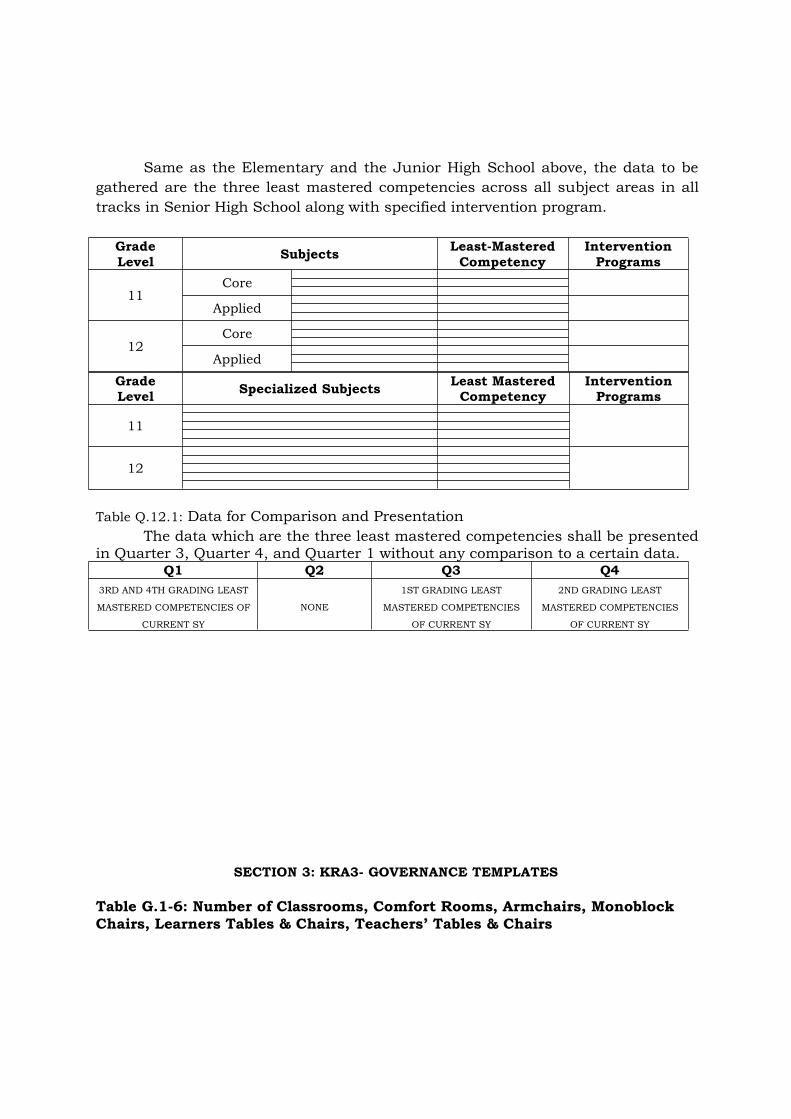
Same as the Elementary and the Junior High School above, the data to begathered are the three least mastered competencies across all subject areas in alltracks in Senior High School along with specified intervention program.
GradeLevel Subjects Least-Mastered
CompetencyInterventionPrograms
11Core
Applied
12Core
Applied
GradeLevel Specialized Subjects Least Mastered
CompetencyInterventionPrograms
11
12
Table Q.12.1: Data for Comparison and PresentationThe data which are the three least mastered competencies shall be presented
in Quarter 3, Quarter 4, and Quarter 1 without any comparison to a certain data.Q1 Q2 Q3 Q4
3RD AND 4TH GRADING LEAST
MASTERED COMPETENCIES OF
CURRENT SY
NONE
1ST GRADING LEAST
MASTERED COMPETENCIES
OF CURRENT SY
2ND GRADING LEAST
MASTERED COMPETENCIES
OF CURRENT SY
SECTION 3: KRA3- GOVERNANCE TEMPLATES
Table G.1-6: Number of Classrooms, Comfort Rooms, Armchairs, MonoblockChairs, Learners Tables & Chairs, Teachers’ Tables & Chairs

The table above shows the data to be collected which are the number andthe corresponding percentages of the Classrooms, Comfort rooms, Armchairs,Monoblock Chairs, Learners’ Tables and Chairs, and Teachers’ Tables and Chairs.The said data shall be diligently accomplished in order to know if resources areenough or not in the respective SDOs.
Table G.1-6.1. Data for Comparison and PresentationThe data shall be presented in Quarter 2 by comparing the data of
previous school year and the data of the current school year.Q1 Q2 Q3 Q4
NONEDATA OF
PREVIOUS SYVS
DATA OF
CURRENT SYNONE NONE
Table G.7-10: Number of Functional Library, Science Laboratories, TLELaboratories, ICT Laboratories
As stated in the table above, it can be seen that the following data are tobe gathered and these are the ratios between the learners/schools and thefunctional libraries, Science laboratories, TLE Laboratories, and ICT Laboratories.
Table G.7-10.1. Data for Comparison and PresentationThe data shall be presented in Quarter 3 by comparing the data of
previous school year and the data of current school year.

Q1 Q2 Q3 Q4
NONE NONEDATA OF PREVIOUS
SYVS
DATA OF CURRENT
SYNONE
Table G.11: Results-Based Performance Management System (IPCR/OPCR)
As can be observed from the table above, it can be seen that the maindata to be gathered are related to the Results-Based Performance ManagementSystem (RPMS) using the IPCR/OPCR of the Teaching, Non-Teaching, and SchoolHeads in all SDOs. Specifically, the said data are the frequency counts of eachadjectival rating in the RPMS namely Outstanding, Very Satisfactory, Satisfactory,Unsatisfactory, and Poor, where the personnel are classified. It can be notedfurther that total number of personnel in every adjectival rating shall beaccomplished for a clear and comprehensive presentation.
Table G.11.1. Data for Comparison and PresentationThe data shall be presented in Quarter 2 by comparing the data of
previous school year and the data of the current school year.
Q1 Q2 Q3 Q4
NONEDATA OF
PREVIOUS SYVS
DATA OF CURRENT
SYNONE NONE
Table G.12: Number of Textbooks Per Grade Level and SubjectThe data to be gathered in the table below are the frequency or number of
textbooks and the learner-textbook ratio across all subject areas. This is veryimportant data since we will be guided if SDOs have scarcity or abundance oftextbooks for our students.

Table G.12.1: Data for Comparison and PresentationThe data shall be presented in Quarter 2 by comparing the data of
previous school year and the data of current school year.Q1 Q2 Q3 Q4
NONEDATA OF
PREVIOUS SYVS
DATA OF
CURRENT SYNONE NONE
Table G.13: Fund Sources (Whole Year Round)The data to be gathered in the table below are the amount and the
percentages of fund sources of every SDO. The following sources are already listedin the said table and these are the MOOE, Subsidy of Special Programs, LocalGovernment Units Funds, Canteen funds, Donations, PTA, and others.
Table G.13.1: Data for Comparison and Presentation
Q1 Q2 Q3 Q4
NONEDATA OF
PREVIOUS SYVS
DATA OF
CURRENT SYNONE NONE
Table G.14: Awards and Recognition

The data to be gathered in the table below are the awards and recognitionsreceived by the Students, Teachers, School Heads, and School.
Table G.14.1: Data for Comparison and PresentationThe data shall be presented in Quarter 1 by comparing the data of
previous school year and the data of current school year.Q1 Q2 Q3 Q4
DATA OF PREVIOUS
SCHOOL YEARVS
DATA OF CURRENT
SCHOOL YEAR NONE NONE
Table G.15: Stakeholders Support to EducationThe table below shows the data to be collected which are the contribution
and attendance of the stakeholders in all Co-curricular, Extra-Curricular, andother major activities conducted by all schools in each SDO. Most importantly,attendance rate shall be accomplished in order to know how supportive are thestakeholders to all school activities.
Table G.15.1: Data for Comparison and PresentationThe data shall be presented in Quarter 3, Quarter 4, and Quarter1. In
Quarter 3, Stakeholders’ attendance rate shall be presented without anycomparison to a certain data. While in Q4, data presented in Q3 shall be compared

to the data gathered from October to December. For Q1 presentation, Data fromJune-September shall be presented and the Data presented in Q4 shall becompared to the data from January to March.
Q1 Q2 Q3 Q4STAKEHOLDERS’ ATTENDANCE RATE
JUNE-SEPT OF CURRENT SY
VS
STAKEHOLDERS’ ATTENDANCE RATE
OCT-DEC OF CURRENT SY
VS
STAKEHOLDERS’ ATTENDANCE RATE JAN-
MAR OF CURRENT SY
NONE
STAKEHOLDERS’
ATTENDANCE
RATE JUNE-SEPT
OF CURRENT SY
STAKEHOLDERS’ ATTENDANCE RATE
JUNE-SEPT OF CURRENT SY
VS
STAKEHOLDERS’ ATTENDANCE RATE
OCT-DEC OF CURRENT SY
Table 16: Learner-Teacher Ratio
As can be seen from the table above, it can be observed that the main datato be gathered is the Learner-Teacher ratio across all grade levels. The data wouldtell us if we have shortage or enough teachers to take good care of our ever growingnumber of students in our respective divisions.
Table G.16.1: Data for Comparison and Presentation
Q1 Q2 Q3 Q4
NONEDATA AS OF JUNE OF
CURRENT SY
DATA AS OF JUNE OF CURRENT SY
VS
DATA AS OF SEPTEMBER OF CURRENT
SY
NONE

The data shall be presented in Quarter 2 and Quarter 3 only. Data in Q2shall be presented without any comparison to a certain data, while presentation inQ3, data in Q2 shall be compared to the data in Q3.
Table G.17: Learner-Classroom RatioAs shown in the table below, it can be gleaned that the main data to be
gathered is the Learner-Classroom ratio across all grade levels. Number ofclassrooms is classified into Good Condition and for Repair/Rehabilitation.Condemnable classrooms shall not be classified or included for us to see the truepicture/situation of our schools.
Table G.17.1: Data for Comparison and PresentationThe data shall be presented in Quarter 2 by comparing the Learner-
Classroom ratio of previous school year and the Learner-Classroom ratio of thecurrent school year.
Q1 Q2 Q3 Q4
NONE
LEARNER-
CLASSROOM RATIO
OF PREVIOUS SY
VS
LEARNER-
CLASSROOM RATIO
OF CURRENT SY
NONE NONE
Table G.18: Learner-Toilet RatioThe data to be gathered in the table below are the number of toilets for
both male and female and the total enrolment for the current school year so thatthe main data which is the Learner-Toilet ratio can be determined.
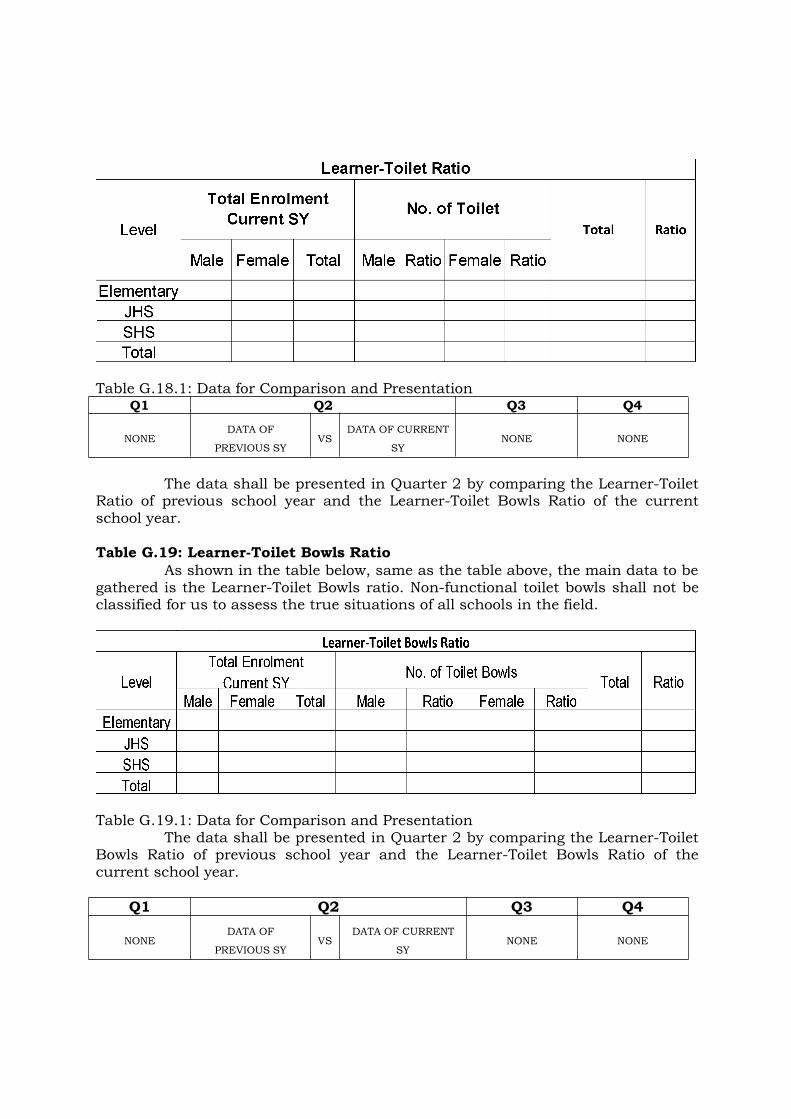
Table G.18.1: Data for Comparison and PresentationQ1 Q2 Q3 Q4
NONEDATA OF
PREVIOUS SYVS
DATA OF CURRENT
SYNONE NONE
The data shall be presented in Quarter 2 by comparing the Learner-ToiletRatio of previous school year and the Learner-Toilet Bowls Ratio of the currentschool year.
Table G.19: Learner-Toilet Bowls RatioAs shown in the table below, same as the table above, the main data to be
gathered is the Learner-Toilet Bowls ratio. Non-functional toilet bowls shall not beclassified for us to assess the true situations of all schools in the field.
Table G.19.1: Data for Comparison and PresentationThe data shall be presented in Quarter 2 by comparing the Learner-Toilet
Bowls Ratio of previous school year and the Learner-Toilet Bowls Ratio of thecurrent school year.
Q1 Q2 Q3 Q4
NONEDATA OF
PREVIOUS SYVS
DATA OF CURRENT
SYNONE NONE
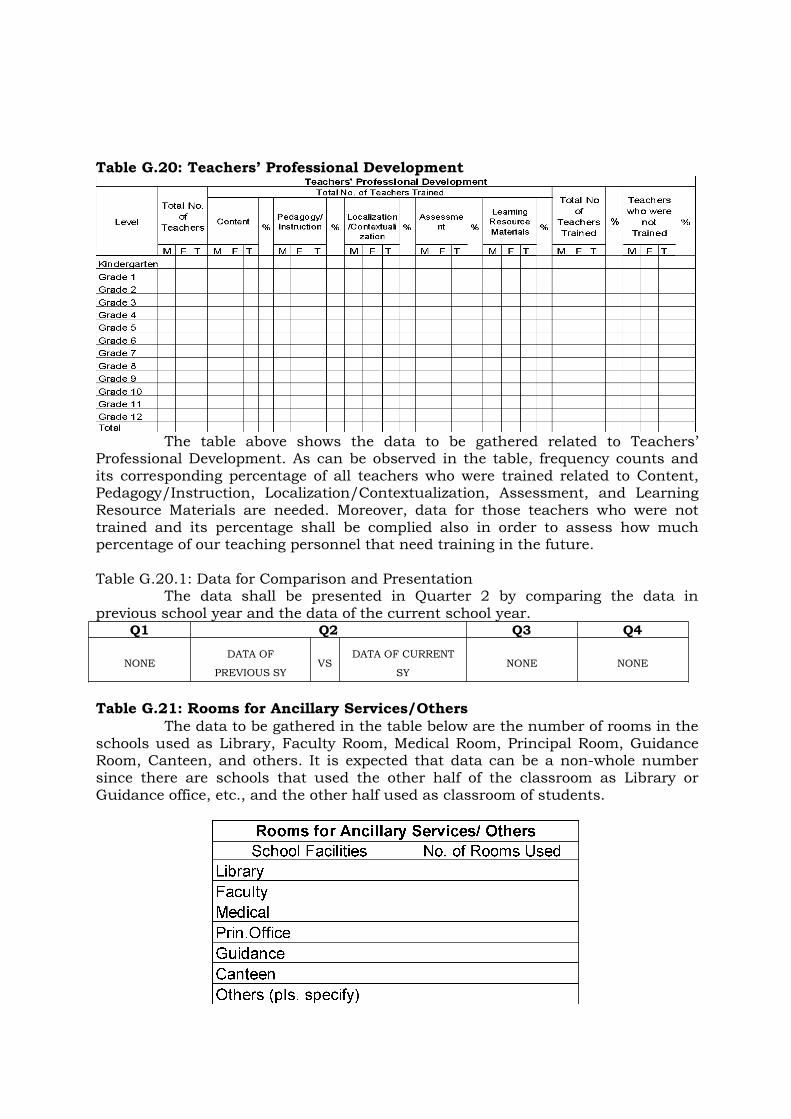
Table G.20: Teachers’ Professional Development
The table above shows the data to be gathered related to Teachers’Professional Development. As can be observed in the table, frequency counts andits corresponding percentage of all teachers who were trained related to Content,Pedagogy/Instruction, Localization/Contextualization, Assessment, and LearningResource Materials are needed. Moreover, data for those teachers who were nottrained and its percentage shall be complied also in order to assess how muchpercentage of our teaching personnel that need training in the future.
Table G.20.1: Data for Comparison and PresentationThe data shall be presented in Quarter 2 by comparing the data in
previous school year and the data of the current school year.Q1 Q2 Q3 Q4
NONEDATA OF
PREVIOUS SYVS
DATA OF CURRENT
SYNONE NONE
Table G.21: Rooms for Ancillary Services/OthersThe data to be gathered in the table below are the number of rooms in the
schools used as Library, Faculty Room, Medical Room, Principal Room, GuidanceRoom, Canteen, and others. It is expected that data can be a non-whole numbersince there are schools that used the other half of the classroom as Library orGuidance office, etc., and the other half used as classroom of students.

Table G.21.1: Data for Comparison and PresentationThe data shall be presented in Quarter 2 by comparing the data in
previous school year and the data of the current school year.
Q1 Q2 Q3 Q4
NONEDATA OF
PREVIOUS SYVS
DATA OF CURRENT
SYNONE NONE
Table G.22: Instructional SupervisionThe main data to be gathered in the table below are the averages and
percentages of Instructional Supervision Conducted by different school heads likePrincipals, Master Teachers, Head Teachers, and Teacher In-charge. Number ofSchools led by school heads shall be identified first, followed by the number ofInstructional Supervision required by SDO per school head. Moreover, to get theexpected number of IS to be conducted by the SHs, just get the product of thenumber of schools led by SHs and the number of IS required by SDO per SH.However, the actual number of IS conducted is the total of IS conducted by theschool heads in a quarter. To get the average, just divide the actual number of ISconducted by the number of schools led by SHs. Furthermore, to get the percentageof IS conducted, just divide the actual number of IS conducted by the expectednumber of IS to be conducted then multiply by 100.
Table G.22.1: Data for Comparison and PresentationThe data shall be presented in Quarter 3, Quarter 4, and Quarter 1. For
Q3 presentation, only the data for the month of June to September are to bepresented, while in Q4, data presented in Q3 shall be compared to that in Q4.Furthermore, data from June to September, October to December shall becompared to January to March in Q1 presentation.
Q1 Q2 Q3 Q4DATA FOR JUNE TO SEPT OF CURRENT SY
VS
DATA FOR OCT-DEC OF CURRENT SY
VS
DATA FOR JAN-MAR OF CURRENT SY
NONE
DATA FOR JUNE TO
SEPTEMBER OF
CURRENT SY
DATA FOR JUNE
TO SEPTEMBER
OF CURRENT SY
VS
DATA FOR
OCT-DEC OF
CURRENT SY

Table G.23: School Heads’ Professional Development
As can be observed from the table above, it can be gleaned that the data tobe gathered are the number and the percentages of the School Heads who weresent to trainings related to School Leadership, Personal and Professional Attributesand Interpersonal Effectiveness, Instructional Leadership, Student-CenteredLearning, Human Resource management and Professional Development, ParentInvolvement and Community partnership, School Management Operations, andOthers. School Heads are classified as Elementary School Heads, Junior HighSchool heads, and Senior High School Heads. Furthermore, data as to how manyand its percentages of school heads who were not sent to training shall also becomplied in order to assess how much left of our school heads that need training inthe future.
Table G.23.1: Data for Comparison and PresentationThe data shall be presented in Quarter 2 by comparing the data in
previous school year and the data of the current school year.Q1 Q2 Q3 Q4
NONEDATA OF
PREVIOUS SYVS
DATA OF CURRENT
SYNONE NONE
Table G.24: Water, Sanitation, And Hygiene (WASH) Facilities

The data to be gathered in the table above are the type of water sourcesand facilities in the schools. Water sources are listed already like the Local PipedWater Source, Water Well or Deep Well, rainwater catchments, Natural Source, NoWater Supply at all. Number of schools shall be determined also in order todetermine how much percentages of the schools with the following water supply. Ascan be observed further, the percentage of schools with Space for handwashingshall be determined also for it is very important for a school to have this facility.
Table G.24.1. Data for Comparison and PresentationData shall be presented in Quarter 3 by comparing the data of previous
school year and the data of current school year.Q1 Q2 Q3 Q4
NONE NONEDATA OF
PREVIOUS SYVS
DATA OF
CURRENT SYNONE
Table 25: Internet ConnectivityThe data to be gathered in the table below are the number of schools
which have internet connectivity using the following Internet Service Providers andthe total number of schools with Internet Connectivity.
Table G.25.1. Data for Comparison and PresentationData shall be presented in Quarter 3 by comparing the data of previous
school year and the data of current school year.Q1 Q2 Q3 Q4
NONE NONEDATA OF
PREVIOUS SYVS
DATA OF
CURRENT SYNONE

Table G.26: Electrical SupplyThe data to be gathered in the table below are the number of schools with
electrical supply and using the following type of electrical supply such as the GridSupply, Solar Supply, Generator, Other Sources, and No Electrical Supply at all.
Table G.26.1: Data for Comparison and Presentation
Q1 Q2 Q3 Q4
NONEDATA OF
PREVIOUS SYVS
DATA OF CURRENT
SYNONE NONE
Based from the table above, the data shall be presented in Quarter 2 wheredata of previous school year shall be compared to the data of the current schoolyear.
Table G.27: Number of Learning Action Cell (LAC) SessionsThe data to be gathered in the table below are the number of schools
conducting Learning Action Cell (LAC) Sessions and the number of schools whichconducted LAC Session related to the topics listed in the table. As can be furtherobserved, percentages of the number of schools conducted LAC Session related toevery topic listed in the table shall also be complied.
Table G.27.1: Data for Comparison and PresentationThe data shall be presented in Quarter 3, Quarter 4, and Quarter 1. For
Q3 presentation, only the data for the month of June to September are to bepresented, while in Q4, data presented in Q3 shall be compared to that in Q4.Furthermore, data from June to September, October to December shall becompared to January to March in Q1 presentation.

Q1 Q2 Q3 Q4DATA FOR JUNE TO SEPT OF CURRENT SY
VS
DATA FOR OCT-DEC OF CURRENT SY
VS
DATA FOR JAN-MAR OF CURRENT SY
NONE
DATA FOR JUNE TO
SEPTEMBER OF
CURRENT SY
DATA FOR JUNE
TO SEPTEMBER
OF CURRENT SY
VS
DATA FOR
OCT-DEC OF
CURRENT SY
Table G.28. Induction Program, Professional Learning & Development,Employee Welfare, Performance Management System
The table above shows the data to be gathered related to the TeacherInduction Program, Professional Learning and Development, Employee Welfare, andPerformance Management System. Under the Teacher Induction Program (TIP) dateof conduct shall be specified, then the number of Newly-Hired Teachers undergonethe said program, and the number of non-teaching personnel given the InductionProgram. Moreover, under the Professional Learning and Development are thenumber of Needs-based/Competency-based PDP developed and implemented bythe Division or School Non-teaching and Teaching-related Personnel. For theemployee welfare, number of persons with disability and the number of schoolsimplementing utilization of Financial Literacy Learning Resources in school datashall be complied also. As to the Performance Management System, the date of theConducted RPMS Orientation Rollout shall be accomplished for consolidation.
Table G.28.1: Data for Comparison and Presentation

Based from the table below, the data shall be presented in Quarter 2 wheredata of previous school year shall be compared to the data of the current schoolyear.
Q1 Q2 Q3 Q4
NONEDATA OF
PREVIOUS SYVS
DATA OF CURRENT
SYNONE NONE
Table G.29. Reading Program Fund Utilization ToolThe table below shows the data to be collected with regards to the utilization
of funds for the reading program. The data to be collected shall be a consolidateddata coming from different schools in every SDO. As depicted from the said table,MOOE allotment in all schools shall be consolidated and be reflected in the report.Same with the WFP Reading Program Fund Allocation. However, to compute theAllocation Rate, just divide the WFP Reading Program Fund Allocation by theMOOE allotment then multiply by 100. Same with the Obligation Rate, Divide theObligation Column by the WFP Reading Program Fund Allocation then multiply by100. Disbursement Rate shall be computed by dividing the Disbursement Columnby the Obligation column then multiply by 100.
Table G.29.1: Data for Comparison and PresentationBased from the table below, the data shall be presented in Quarter 2 where
data of previous school year shall be compared to the data of the current schoolyear.
Q1 Q2 Q3 Q4
NONE NONE NONEDATA OF PREVIOUS SCHOOL
YEAR
DATA OF CURRENT
SCHOOL YEAR