Enabling Millimeter Computing - IEEEewh.ieee.org/r5/central_texas/cas_ssc/meetings/2011/...Enabling...
42
1 1 1 University of Michigan 1 Enabling Millimeter Computing Dennis Sylvester University of Michigan Joint work with David Blaauw
Transcript of Enabling Millimeter Computing - IEEEewh.ieee.org/r5/central_texas/cas_ssc/meetings/2011/...Enabling...
1 1
1
University of Michigan 1
Enabling Millimeter Computing
Dennis Sylvester
University of Michigan
Joint work with David Blaauw
2 2
2
University of Michigan 2
1950 1960 1970 1980 1990 2000 2010 20200.01
0.1
1
10
100
1000
10000
100000
Infla
tion
Adju
sted
Pric
e (1
000s
of U
SD)
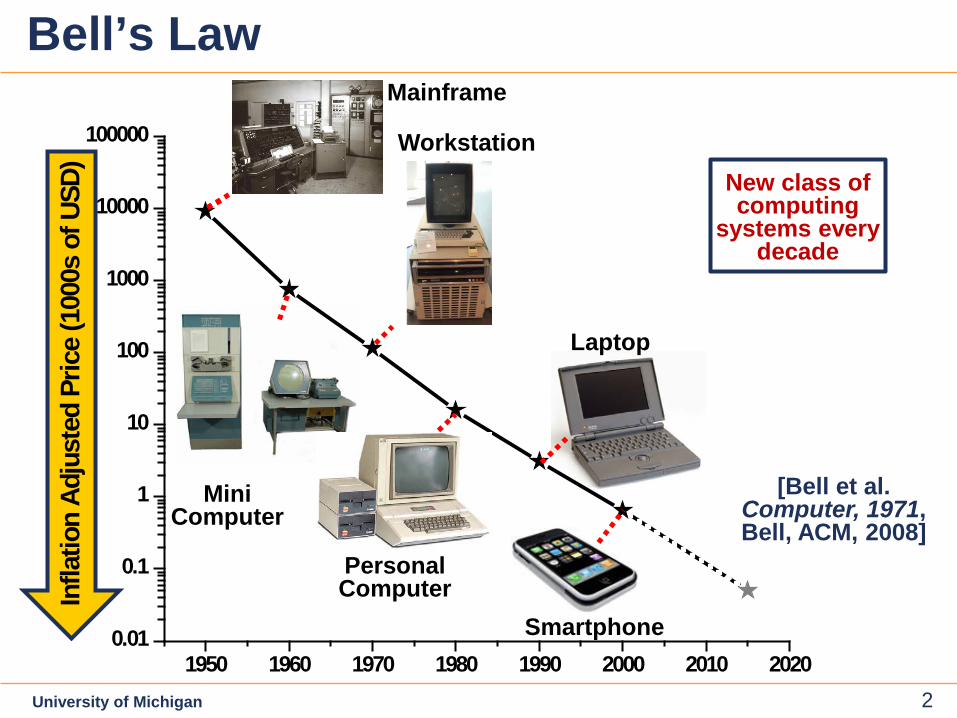
Bell’s Law Mainframe
Mini Computer
Personal Computer
Workstation
Smartphone
Laptop
[Bell et al. Computer, 1971, Bell, ACM, 2008]
New class of computing
systems every decade
3 3
3
University of Michigan 3
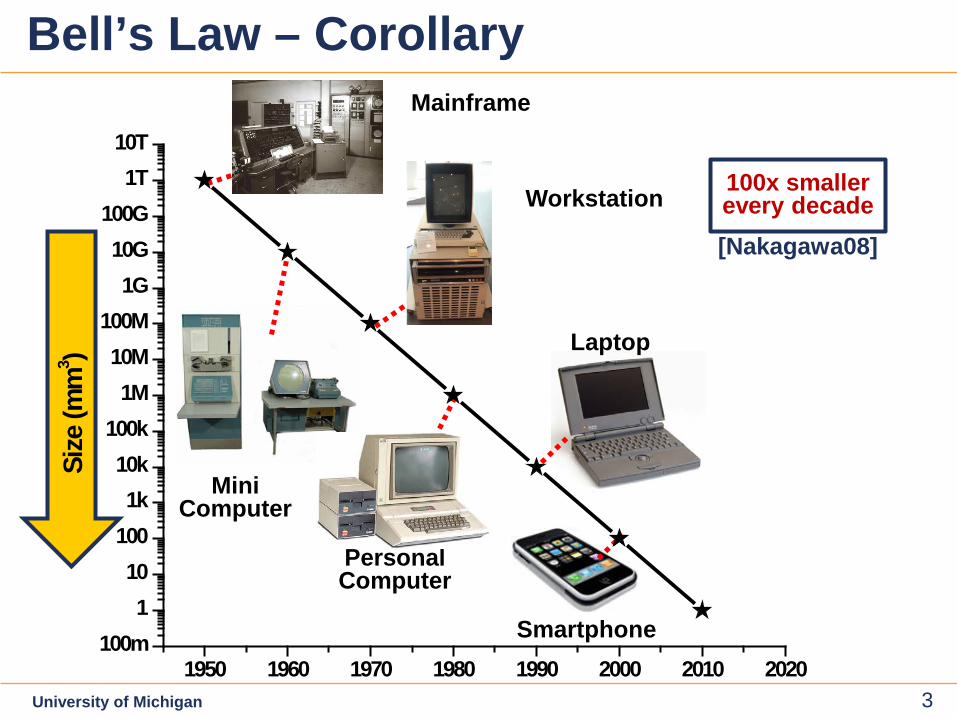
Bell’s Law – Corollary Mainframe
Mini Computer
Personal Computer
Workstation
Smartphone
100x smaller every decade [Nakagawa08]
Laptop
1950 1960 1970 1980 1990 2000 2010 2020100m
110
1001k
10k100k
1M10M
100M1G
10G100G
1T10T
Size
(mm
3 )
4 4
4
University of Michigan 4 1950 1960 1970 1980 1990 2000 2010 2020
100m1
101001k
10k100k
1M10M
100M1G
10G100G
1T10T
Size
(mm
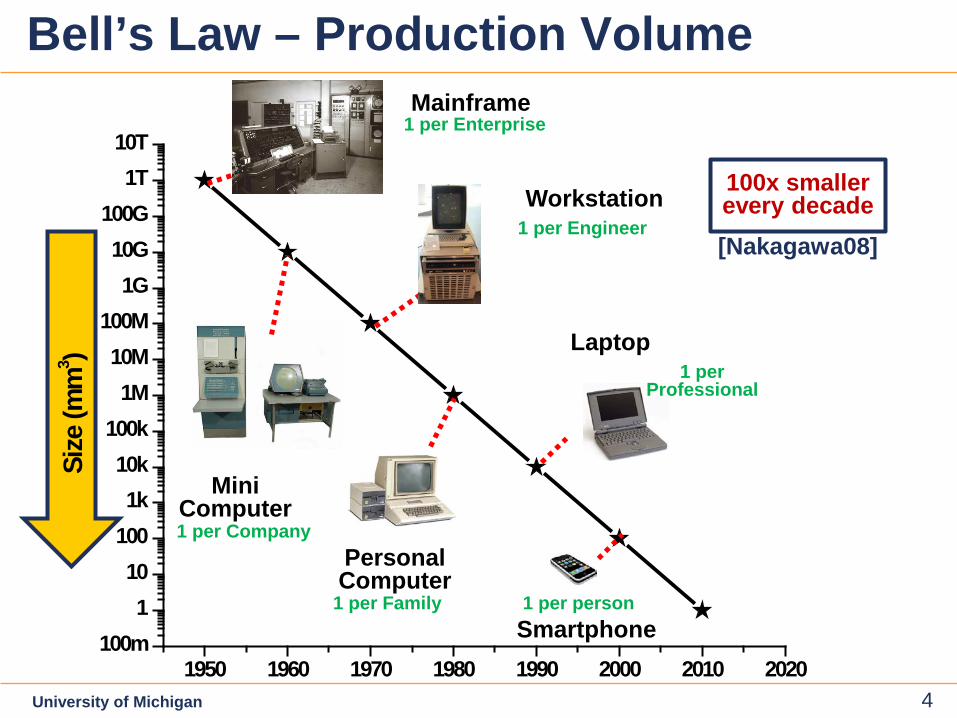
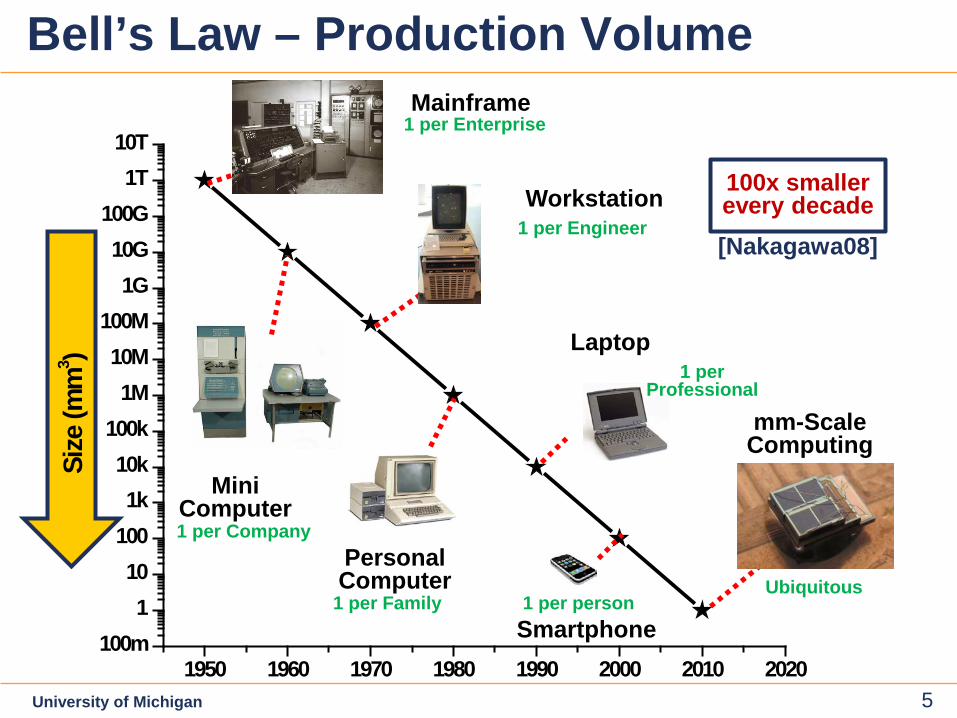
3 )Bell’s Law – Production Volume
Mainframe
Mini Computer
Personal Computer
Workstation
Smartphone
100x smaller every decade [Nakagawa08]
1 per Enterprise
1 per Company
1 per Professional
1 per person 1 per Family
1 per Engineer
Laptop
5 5
5
University of Michigan 5 1950 1960 1970 1980 1990 2000 2010 2020
100m1
101001k
10k100k
1M10M
100M1G
10G100G
1T10T
Size
(mm
3 )Bell’s Law – Production Volume
Mainframe
Mini Computer
Personal Computer
Workstation
Smartphone
100x smaller every decade [Nakagawa08]
mm-Scale Computing
1 per Enterprise
1 per Company
1 per Professional
1 per person
Ubiquitous
1 per Family
1 per Engineer
Laptop
Ubiquitous
6 6
6
University of Michigan 6
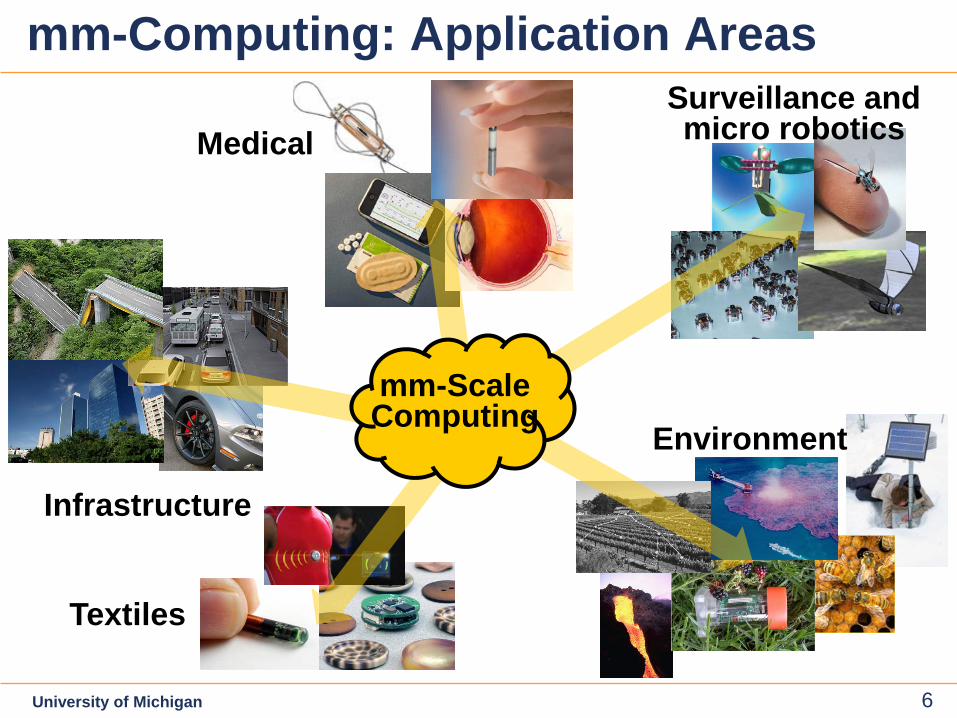
mm-Computing: Application Areas
Medical Surveillance and micro robotics
mm-Scale Computing
Infrastructure
Textiles
Environment
7 7
7
University of Michigan 7
1998 2000 2002 2004 2006 2008 2010 20120.1
1
10
100
1000
10000
100000Si
ze (m
m3 )
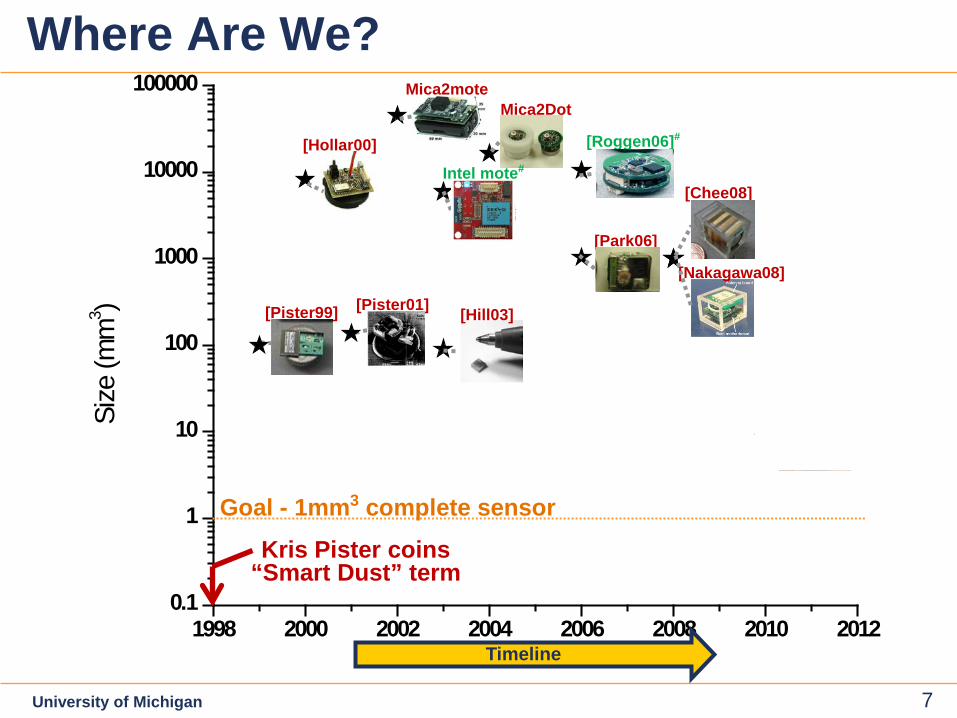
Where Are We?
[Pister99]
[Sylvester11]
[Blaauw10]
[Pister01]
Mica2Dot
[Park06]
[Roggen06]#
Timeline
[Nakagawa08]
[Hill03]
[Chee08]
Mica2mote
[Hollar00]
Goal - 1mm3 complete sensor
Kris Pister coins “Smart Dust” term
Intel mote#
8 8
8
University of Michigan 8
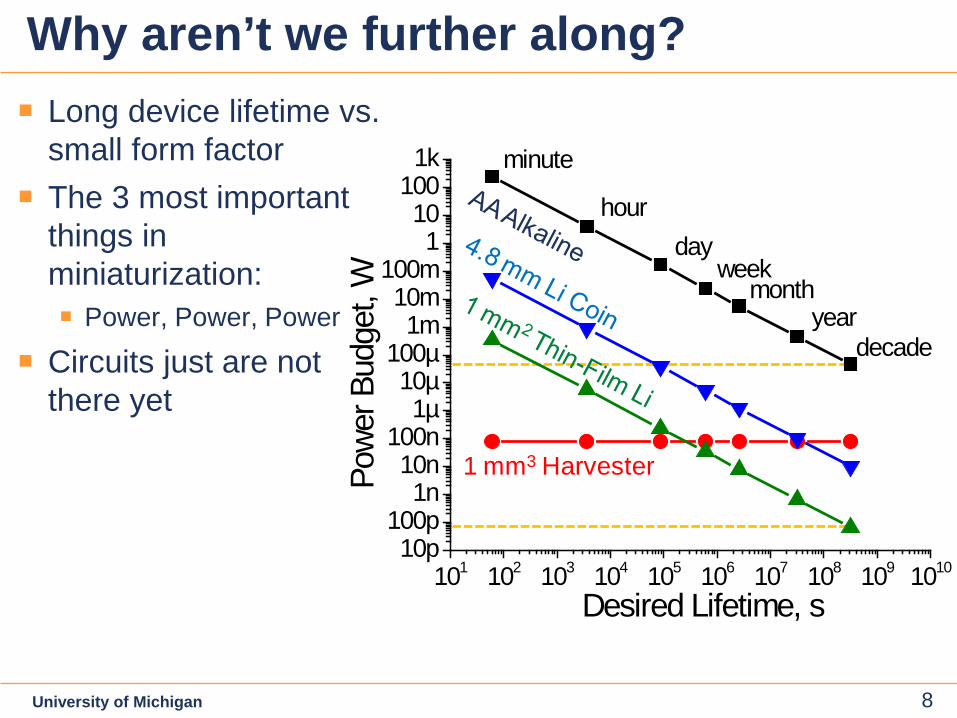
Why aren’t we further along? Long device lifetime vs.
small form factor The 3 most important
things in miniaturization: Power, Power, Power
Circuits just are not there yet
101 102 103 104 105 106 107 108 109 101010p
100p1n
10n100n
1µ10µ
100µ1m
10m100m
110
1001k
decade
hour
Powe
r Bud
get,
W
Desired Lifetime, s
minute
weekday
yearmonth
1 mm3 Harvester
9 9
9
University of Michigan 9
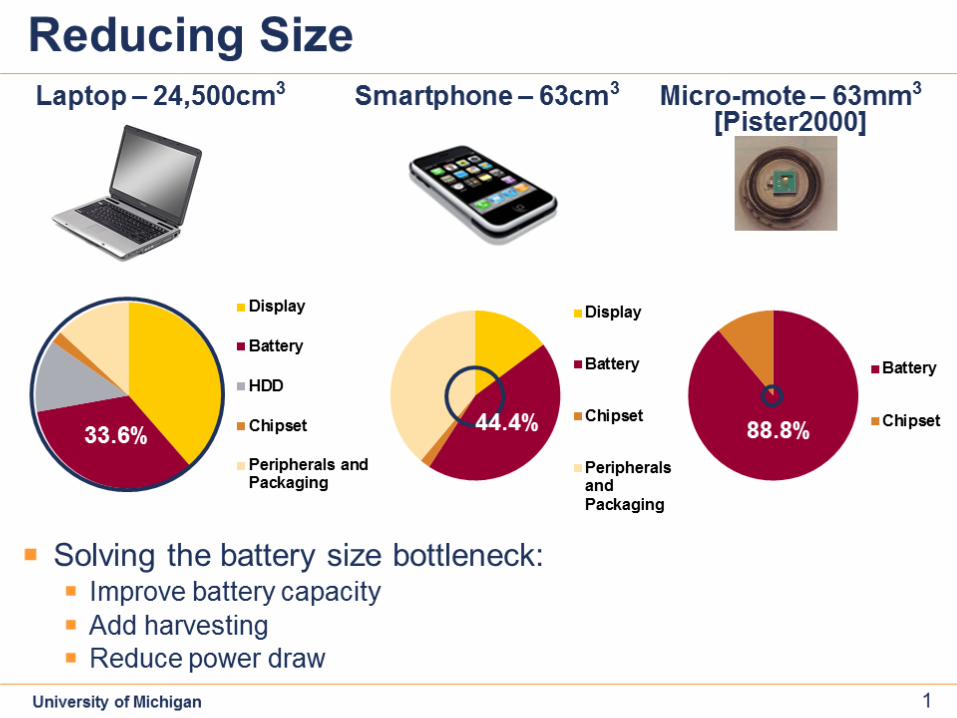
Status of Miniature Sensors Where are we now? 1cc in the research labs 30-50cc commercial motes
Goal: 1mm3 sensor node 1000x improvement Enables host of new applications Tiny wireless sensor nodes that
can be distributed anywhere and everywhere
Challenge: battery size
10,238:1 5hrs of lifetime
1:1 5 years of lifetime
~10,000x
10 10
10
University of Michigan 10
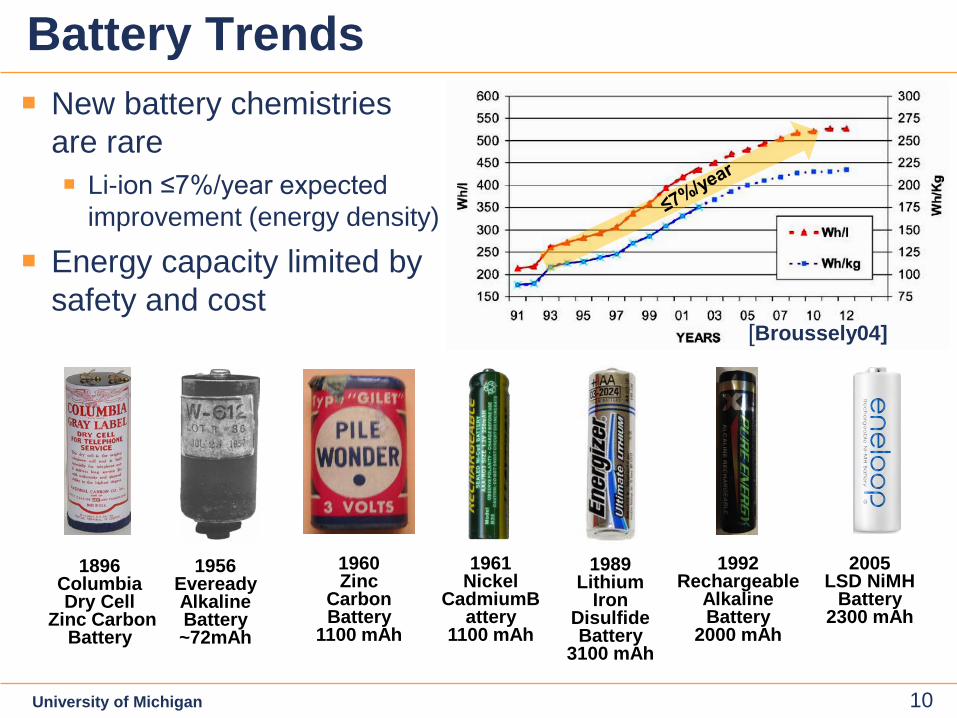
Battery Trends New battery chemistries
are rare Li-ion ≤7%/year expected
improvement (energy density)
Energy capacity limited by safety and cost
1956 Eveready Alkaline Battery ~72mAh
1992 Rechargeable
Alkaline Battery
2000 mAh
1989 Lithium
Iron Disulfide Battery
3100 mAh
1896 Columbia Dry Cell
Zinc Carbon Battery
2005 LSD NiMH
Battery 2300 mAh
1961 Nickel
CadmiumBattery
1100 mAh
1960 Zinc
Carbon Battery
1100 mAh
[Broussely04]
11 11
11
University of Michigan 11
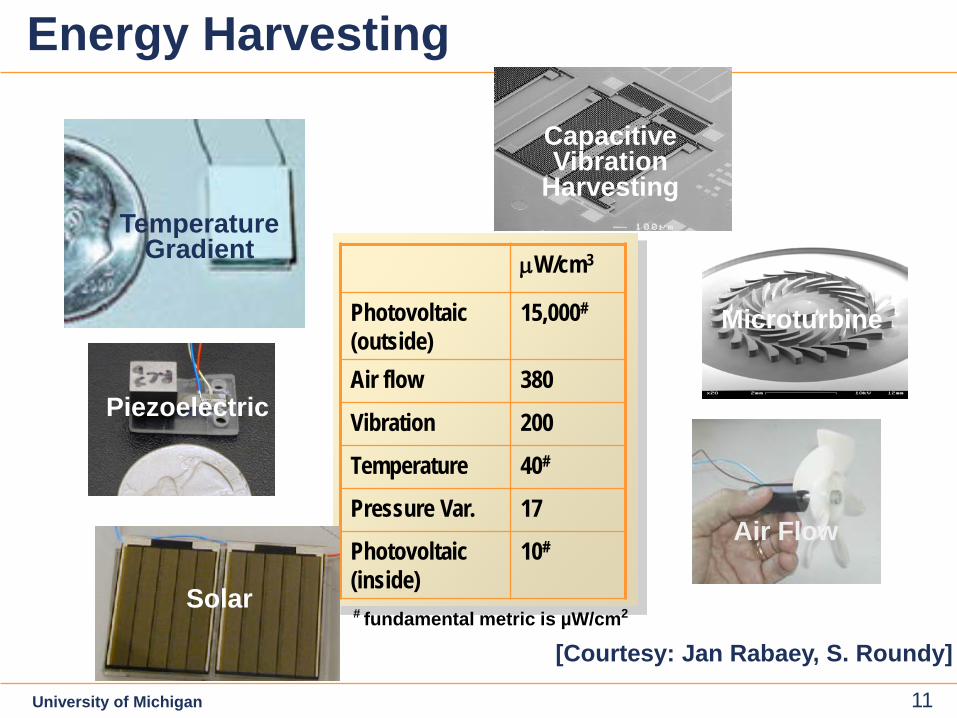
Energy Harvesting
µW/cm3
Photovoltaic (outside)
15,000#
Air flow 380
Vibration 200
Temperature 40#
Pressure Var. 17
Photovoltaic (inside)
10#
[Courtesy: Jan Rabaey, S. Roundy]
Microturbine
Air Flow
Solar
Capacitive Vibration
Harvesting
Capacitive Vibration
Harvesting
Temperature Gradient
Piezoelectric
# fundamental metric is µW/cm2
12 12
12
University of Michigan 12
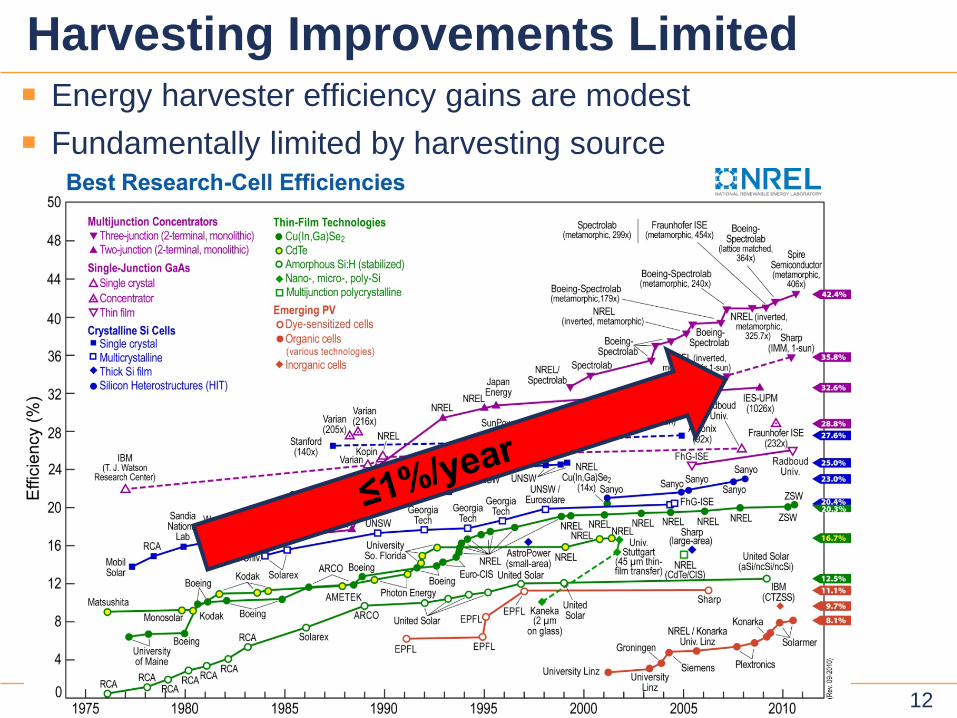
Harvesting Improvements Limited Energy harvester efficiency gains are modest Fundamentally limited by harvesting source
13 13
13
University of Michigan 13
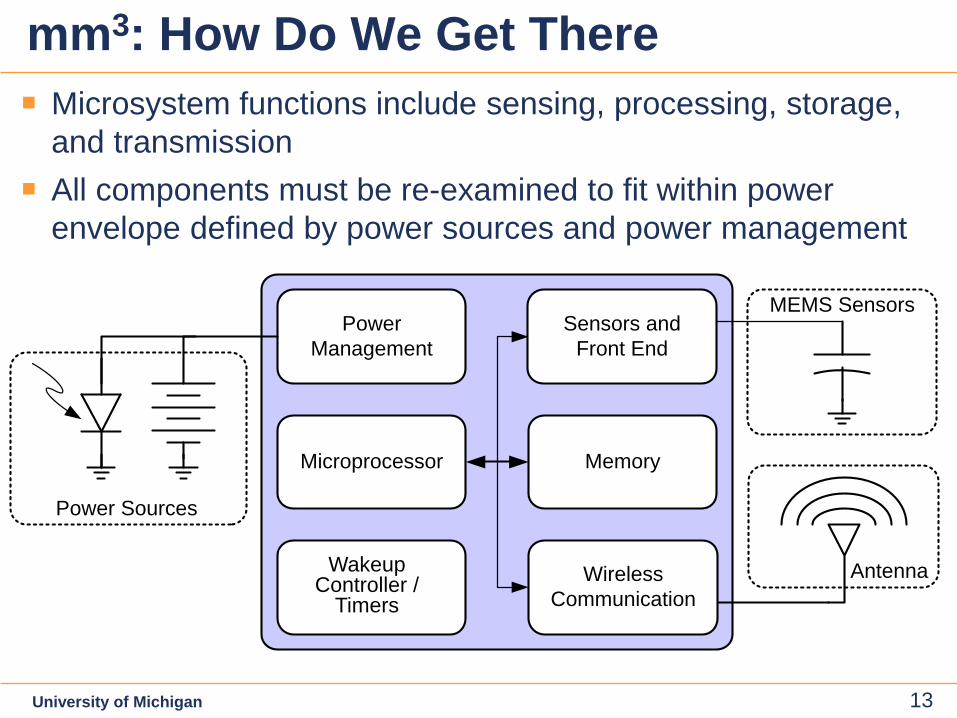
Microsystem functions include sensing, processing, storage, and transmission All components must be re-examined to fit within power
envelope defined by power sources and power management
mm3: How Do We Get There
Sensors and Front End
Microprocessor Memory
Wireless Communication
Power Management
Wakeup Controller
Antenna
Power Sources
MEMS Sensors
Wakeup Controller /
Timers
14 14
14
University of Michigan 14
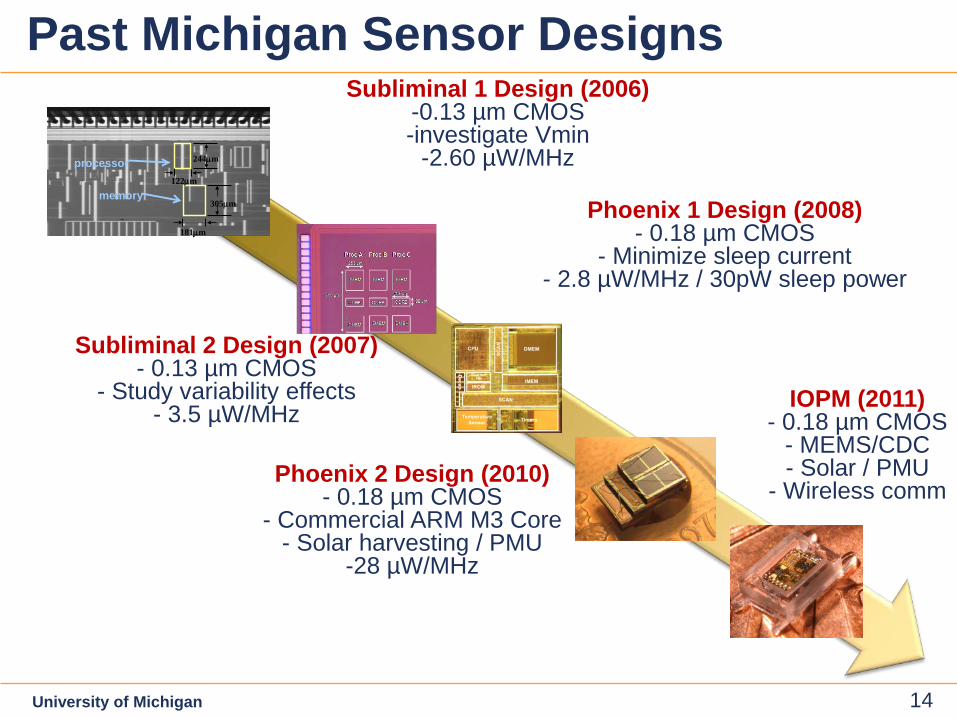
Past Michigan Sensor Designs
Phoenix 2 Design (2010) - 0.18 µm CMOS
- Commercial ARM M3 Core - Solar harvesting / PMU
-28 µW/MHz
Subliminal 2 Design (2007) - 0.13 µm CMOS
- Study variability effects - 3.5 µW/MHz
Subliminal 1 Design (2006) -0.13 µm CMOS -investigate Vmin
-2.60 µW/MHz
Phoenix 1 Design (2008) - 0.18 µm CMOS
- Minimize sleep current - 2.8 µW/MHz / 30pW sleep power
processor
memory
244µm
305µm
122µm
181µm
processor
memory
244µm
305µm
122µm
181µm
IOPM (2011) - 0.18 µm CMOS
- MEMS/CDC - Solar / PMU
- Wireless comm
15 15
15
University of Michigan 15
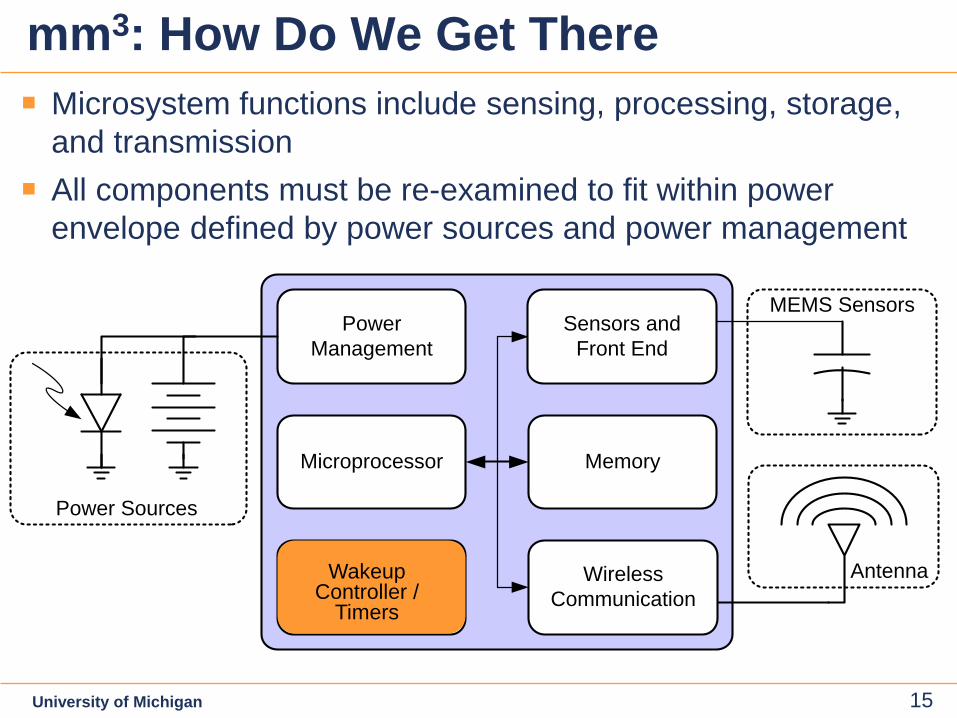
Microsystem functions include sensing, processing, storage, and transmission All components must be re-examined to fit within power
envelope defined by power sources and power management
mm3: How Do We Get There
Sensors and Front End
Microprocessor Memory
Wireless Communication
Power Management
Wakeup Controller
Antenna
Power Sources
MEMS Sensors
Wakeup Controller /
Timers
16 16
16
University of Michigan 16
100p
1n
10n
100n
1µ
10µ
100µ
1m
Powe
r Con
sum
ptio
n (W
)
Time (min)0 20 40 60
100 ms
1 ms
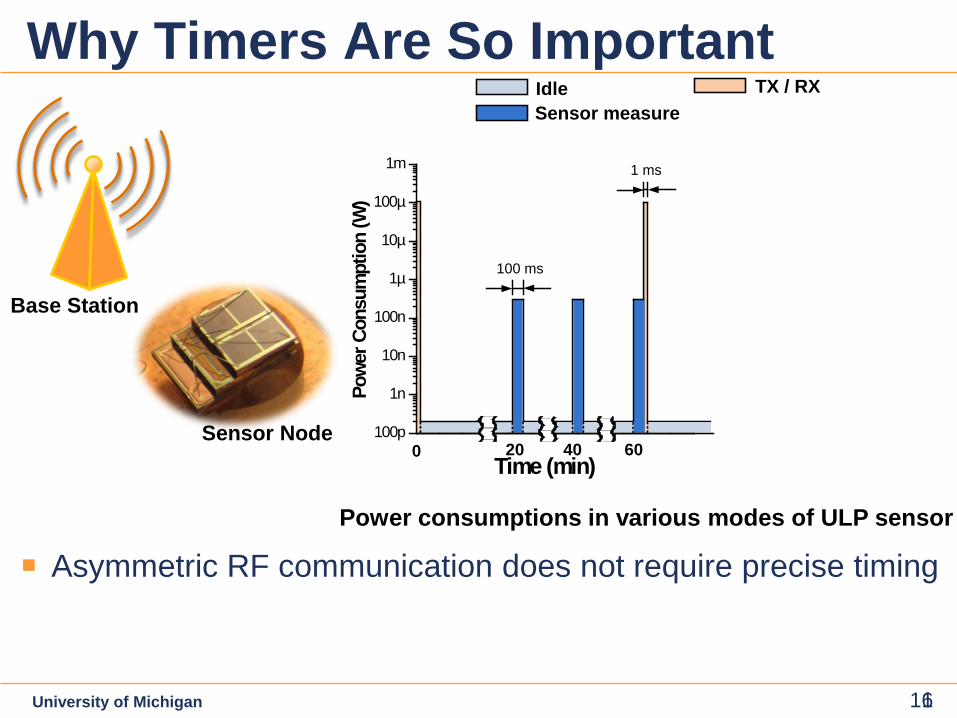
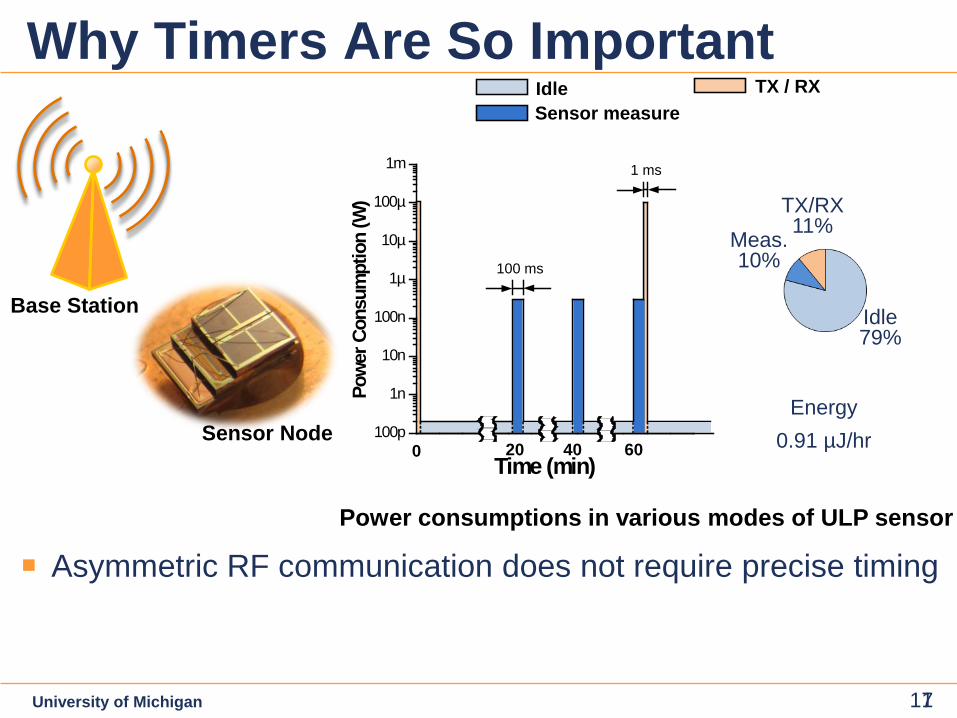
Why Timers Are So Important
Power consumptions in various modes of ULP sensor
1
Base Station
Sensor Node
IdleSensor measure
TX / RX
Asymmetric RF communication does not require precise timing
17 17
17
University of Michigan 17
100p
1n
10n
100n
1µ
10µ
100µ
1m
Powe
r Con
sum
ptio
n (W
)
Time (min)0 20 40 60
100 ms
1 ms
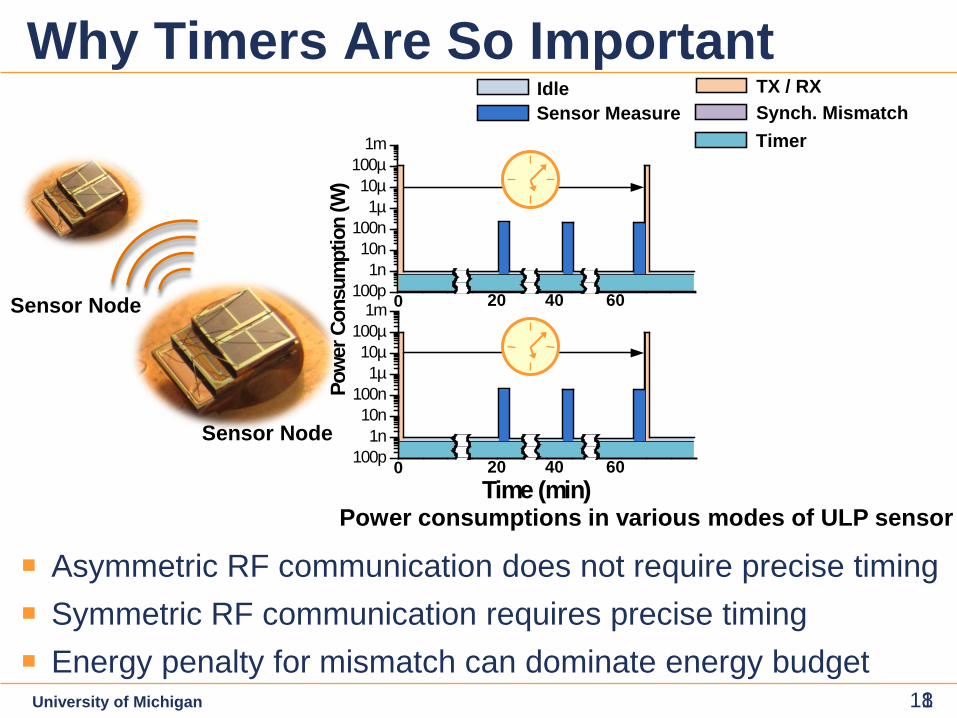
Why Timers Are So Important
Power consumptions in various modes of ULP sensor
1
Base Station
Sensor Node
IdleSensor measure
TX / RX
Meas. 10%
TX/RX 11%
Idle 79%
Energy 0.91 µJ/hr
Asymmetric RF communication does not require precise timing
18 18
18
University of Michigan 18
100p1n
10n100n
1µ10µ
100µ1m
Powe
r Con
sum
ptio
n (W
)
Time (min)
100p1n
10n100n
1µ10µ
100µ1m
0 20 40 60
0 20 40 60
IdleSensor Measure Synch. Mismatch
TX / RX
Timer
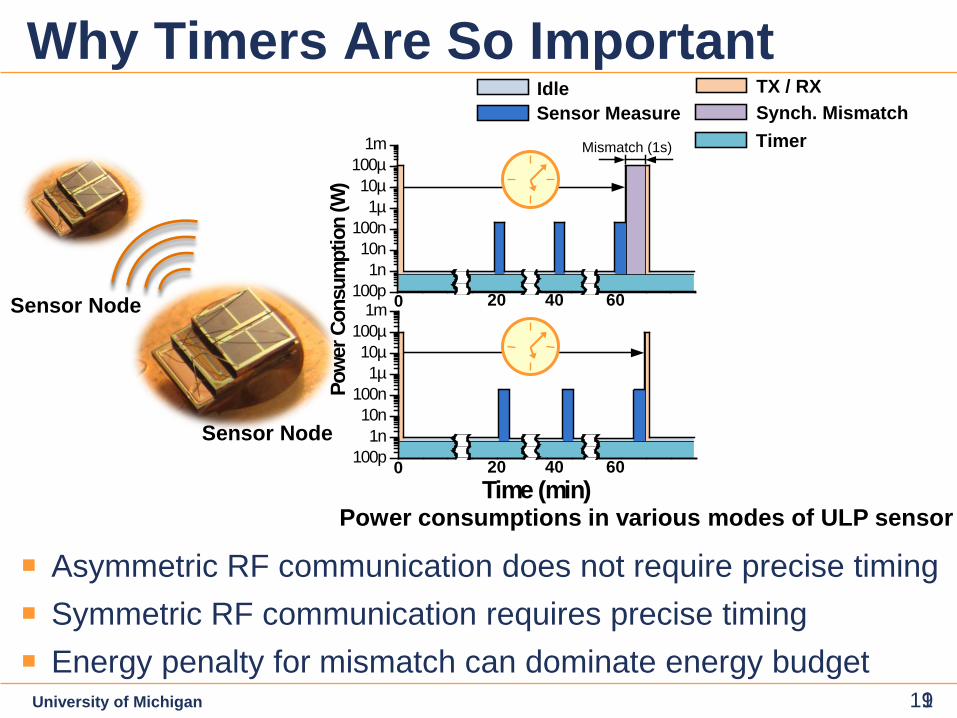
Why Timers Are So Important
Power consumptions in various modes of ULP sensor
1
Sensor Node
Sensor Node
Asymmetric RF communication does not require precise timing Symmetric RF communication requires precise timing Energy penalty for mismatch can dominate energy budget
19 19
19
University of Michigan 19
100p1n
10n100n
1µ10µ
100µ1m
Powe
r Con
sum
ptio
n (W
)
Time (min)
100p1n
10n100n
1µ10µ
100µ1m
0 20 40 60
20 40 60
Mismatch (1s)
0
IdleSensor Measure Synch. Mismatch
TX / RX
Timer
Why Timers Are So Important
Power consumptions in various modes of ULP sensor
1
Sensor Node
Sensor Node
Asymmetric RF communication does not require precise timing Symmetric RF communication requires precise timing Energy penalty for mismatch can dominate energy budget
20 20
20
University of Michigan 20
100p1n
10n100n
1µ10µ
100µ1m
Powe
r Con
sum
ptio
n (W
)
Time (min)
100p1n
10n100n
1µ10µ
100µ1m
0 20 40 60
20 40 60
Mismatch (1s)
0
IdleSensor Measure Synch. Mismatch
TX / RX
Timer
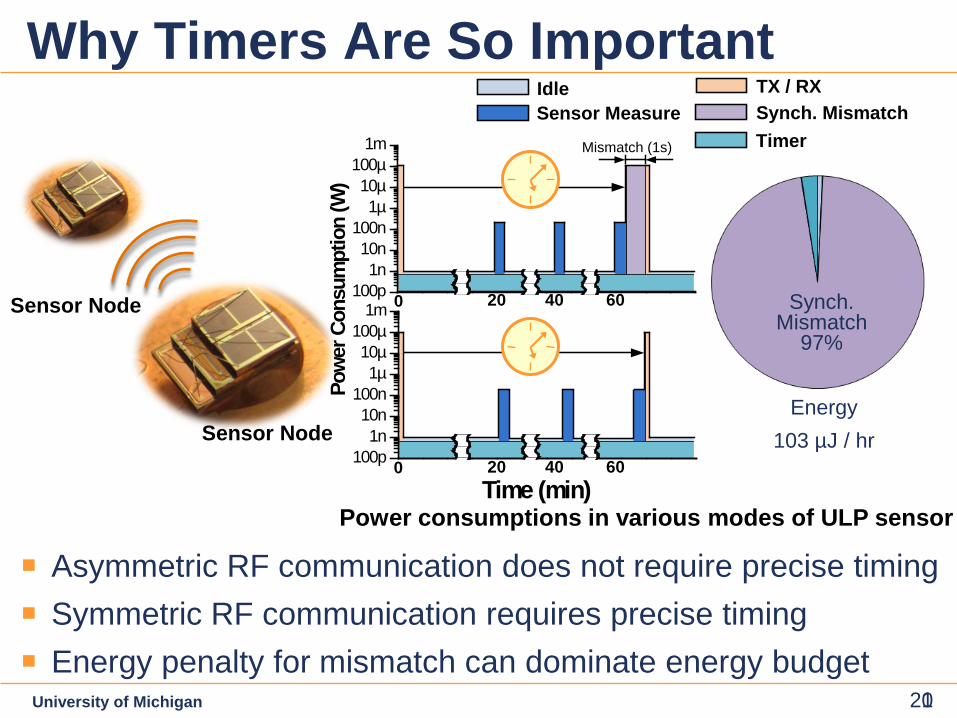
Why Timers Are So Important
Power consumptions in various modes of ULP sensor
Synch. Mismatch
97%
Energy 103 µJ / hr
1
Sensor Node
Sensor Node
Asymmetric RF communication does not require precise timing Symmetric RF communication requires precise timing Energy penalty for mismatch can dominate energy budget
21 21
21
University of Michigan 21
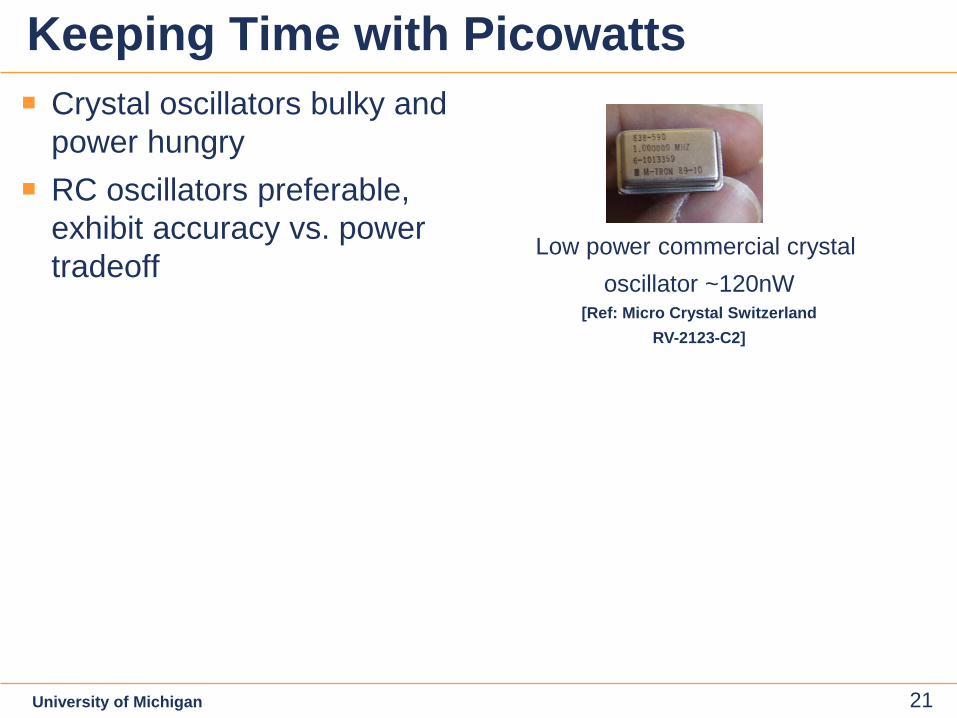
Keeping Time with Picowatts Crystal oscillators bulky and
power hungry RC oscillators preferable,
exhibit accuracy vs. power tradeoff
Low power commercial crystal oscillator ~120nW
[Ref: Micro Crystal Switzerland RV-2123-C2]
22 22
22
University of Michigan 22
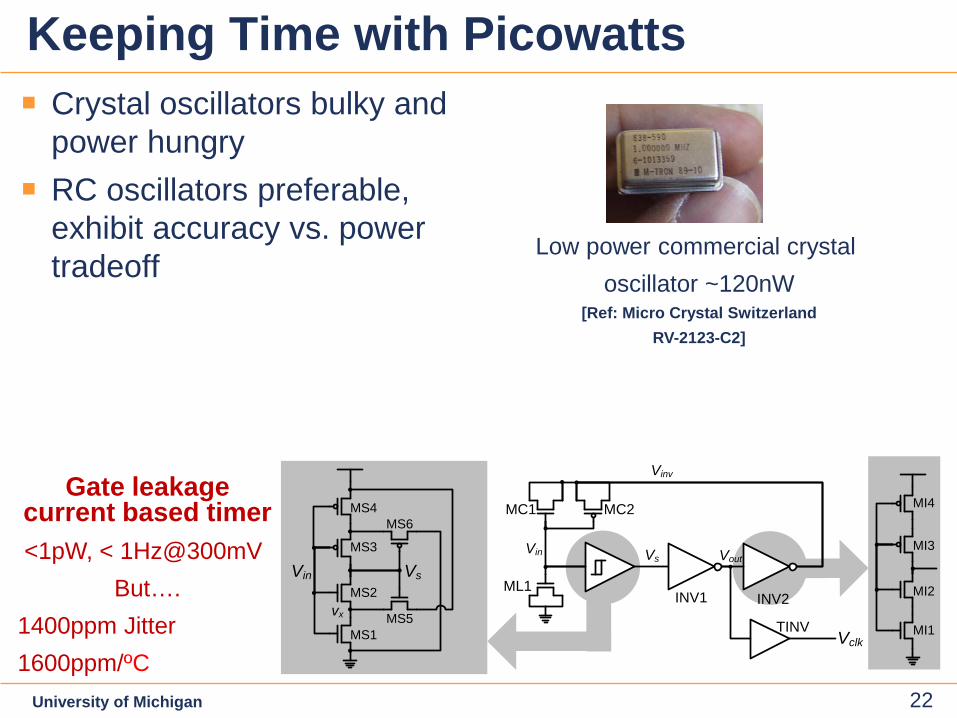
Keeping Time with Picowatts Crystal oscillators bulky and
power hungry RC oscillators preferable,
exhibit accuracy vs. power tradeoff
Vin Vs
Vclk
ML1
MS1
MS2
MS3
MS4
MS5
MS6MC1
INV1 INV2
TINV
Vinv
Vin Vs Vout
MC2
vx
MI1
MI2
MI3
MI4Gate leakage
current based timer <1pW, < 1Hz@300mV
But…. 1400ppm Jitter 1600ppm/ºC
Low power commercial crystal oscillator ~120nW
[Ref: Micro Crystal Switzerland RV-2123-C2]
23 23
23
University of Michigan 23
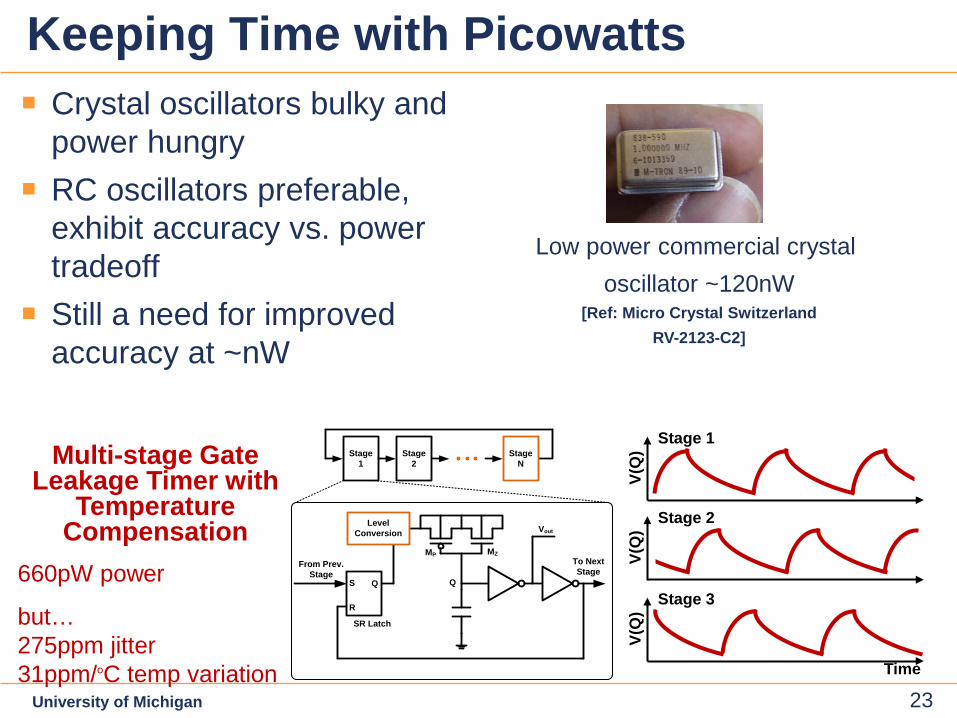
Keeping Time with Picowatts Crystal oscillators bulky and
power hungry RC oscillators preferable,
exhibit accuracy vs. power tradeoff Still a need for improved
accuracy at ~nW
Multi-stage Gate Leakage Timer with
Temperature Compensation
660pW power
but… 275ppm jitter 31ppm/ₒC temp variation
Low power commercial crystal oscillator ~120nW
[Ref: Micro Crystal Switzerland RV-2123-C2]
V(Q
)
Stage 1
Stage 2
V(Q
)
Stage 3
V(Q
)
Time
MP MZ
Q
Vout
To Next Stage
From Prev. Stage
Stage1
Stage2
S
R
Q
SR Latch
StageN
Level Conversion
24 24
24
University of Michigan 24
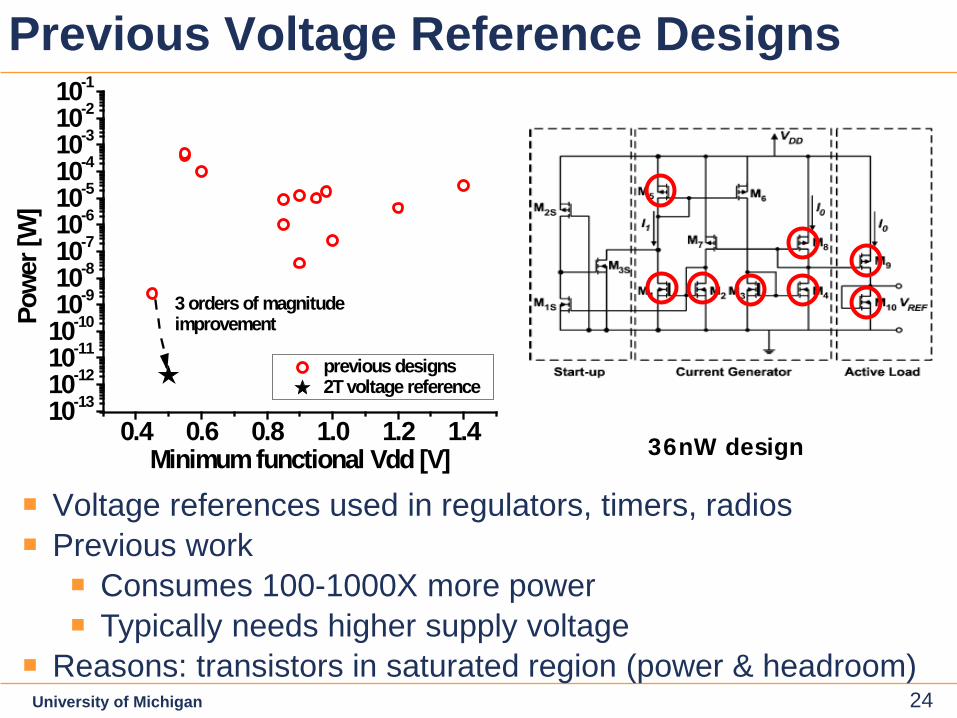
Previous Voltage Reference Designs
36nW design
Voltage references used in regulators, timers, radios Previous work Consumes 100-1000X more power Typically needs higher supply voltage
Reasons: transistors in saturated region (power & headroom)
0.4 0.6 0.8 1.0 1.2 1.410-1310-1210-1110-1010-910-810-710-610-510-410-310-210-1
previous designs 2T voltage reference
Powe
r [W
]
Minimum functional Vdd [V]
3 orders of magnitudeimprovement
25 25
25
University of Michigan 25
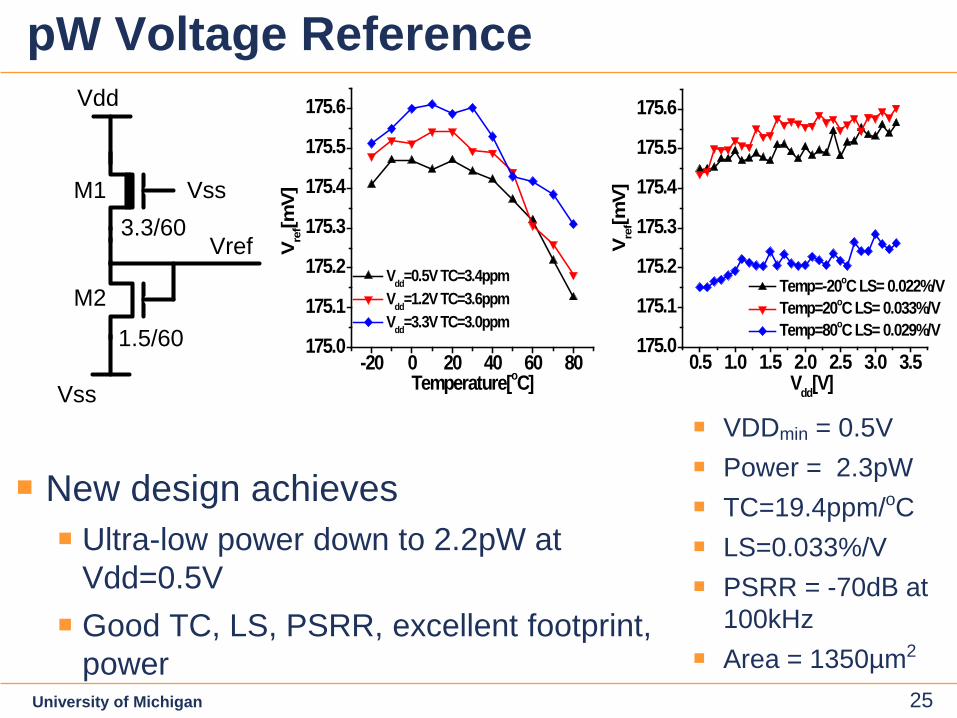
pW Voltage Reference
-20 0 20 40 60 80175.0
175.1
175.2
175.3
175.4
175.5
175.6
0.5 1.0 1.5 2.0 2.5 3.0 3.5175.0
175.1
175.2
175.3
175.4
175.5
175.6
Vdd=0.5V TC=3.4ppm Vdd=1.2V TC=3.6ppm Vdd=3.3V TC=3.0ppm
V ref[m
V]
Temperature[oC]
V ref[m
V]
Vdd[V]
Temp=-20oC LS= 0.022%/V Temp=20oC LS= 0.033%/V Temp=80oC LS= 0.029%/V
VDDmin = 0.5V Power = 2.3pW TC=19.4ppm/oC LS=0.033%/V PSRR = -70dB at
100kHz Area = 1350µm2
Vss
VssM1
M2
Vdd
Vref3.3/60
1.5/60
New design achieves Ultra-low power down to 2.2pW at
Vdd=0.5V Good TC, LS, PSRR, excellent footprint,
power
26 26
26
University of Michigan 26
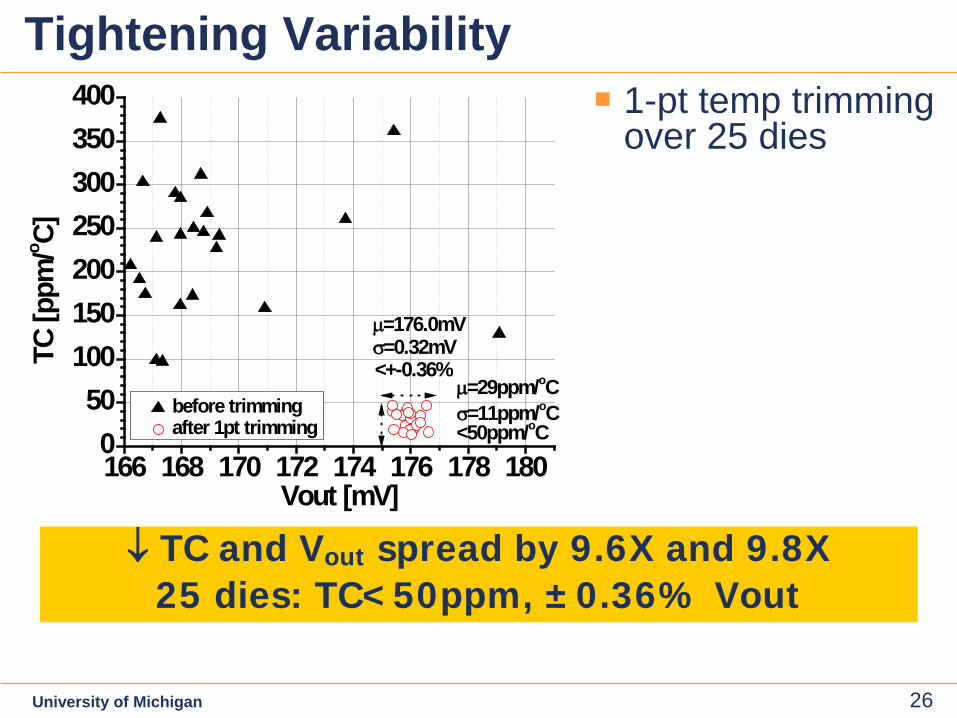
Tightening Variability
↓ TC and Vout spread by 9.6X and 9.8X 25 dies: TC<50ppm, ±0.36% Vout
166 168 170 172 174 176 178 1800
50100150200250300350400
µ=176.0mVσ=0.32mV<+-0.36%
before trimmingafter 1pt trimming
TC [p
pm/o C]
Vout [mV]
<50ppm/oC
µ=29ppm/oCσ=11ppm/oC
1-pt temp trimming over 25 dies
27 27
27
University of Michigan 27
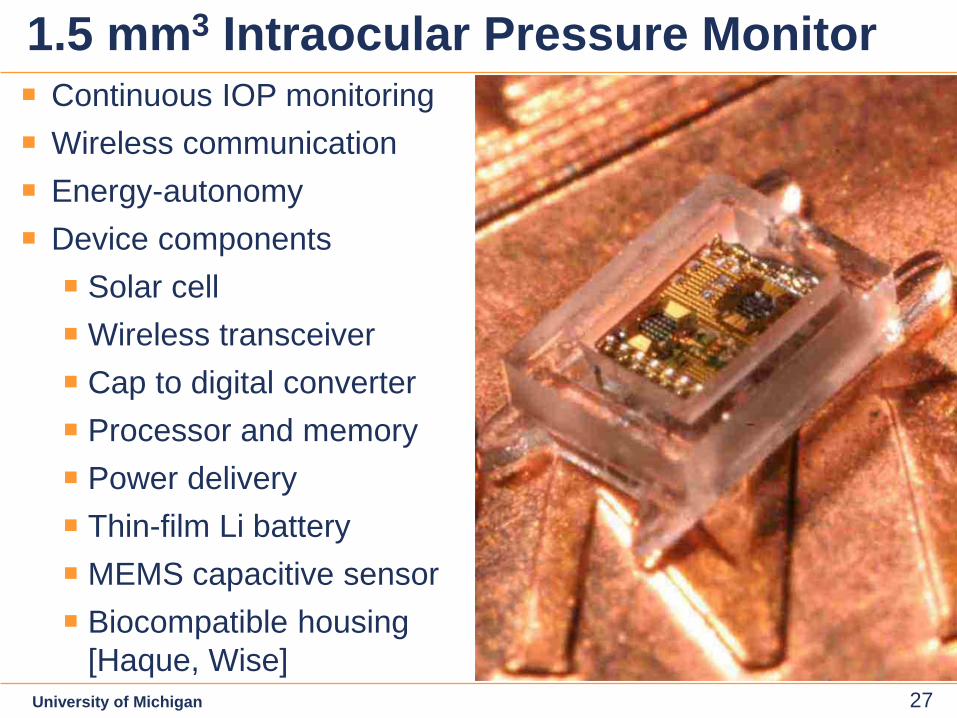
1.5 mm3 Intraocular Pressure Monitor Continuous IOP monitoring Wireless communication Energy-autonomy Device components Solar cell Wireless transceiver Cap to digital converter Processor and memory Power delivery Thin-film Li battery MEMS capacitive sensor Biocompatible housing
[Haque, Wise]
28 28
28
University of Michigan 28
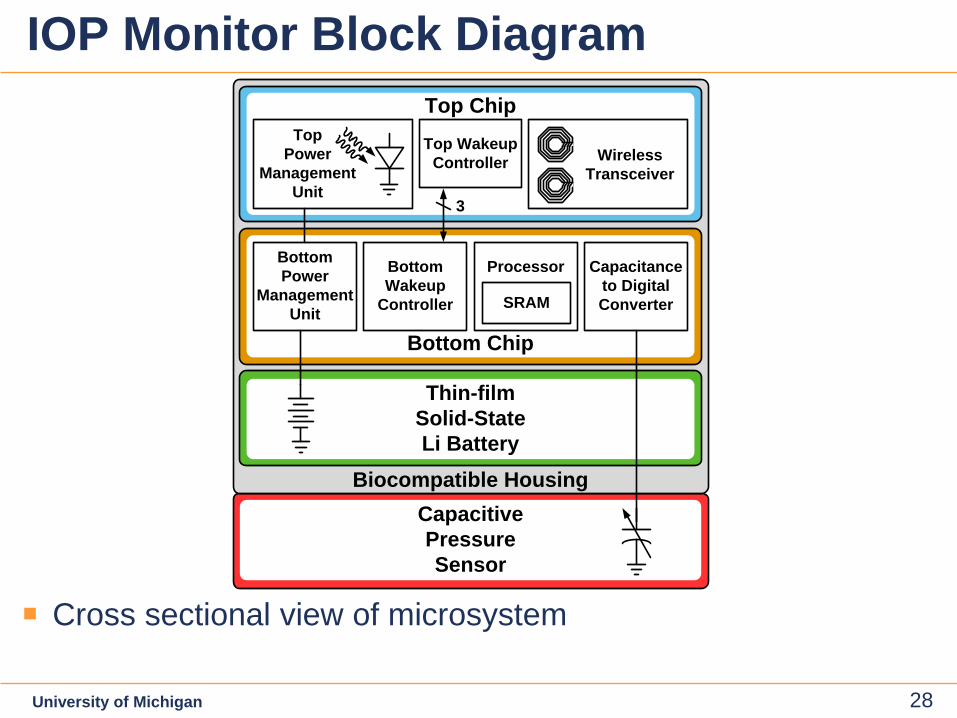
IOP Monitor Block Diagram
Cross sectional view of microsystem
Thin-filmSolid-StateLi Battery
CapacitivePressureSensor
Top Chip
3
Top Power
Management Unit
WirelessTransceiver
BottomPower
Management Unit
Bottom Chip
Bottom Wakeup
Controller
Processor Capacitance to Digital ConverterSRAM
Top WakeupController
Biocompatible Housing
29 29
29
University of Michigan 29
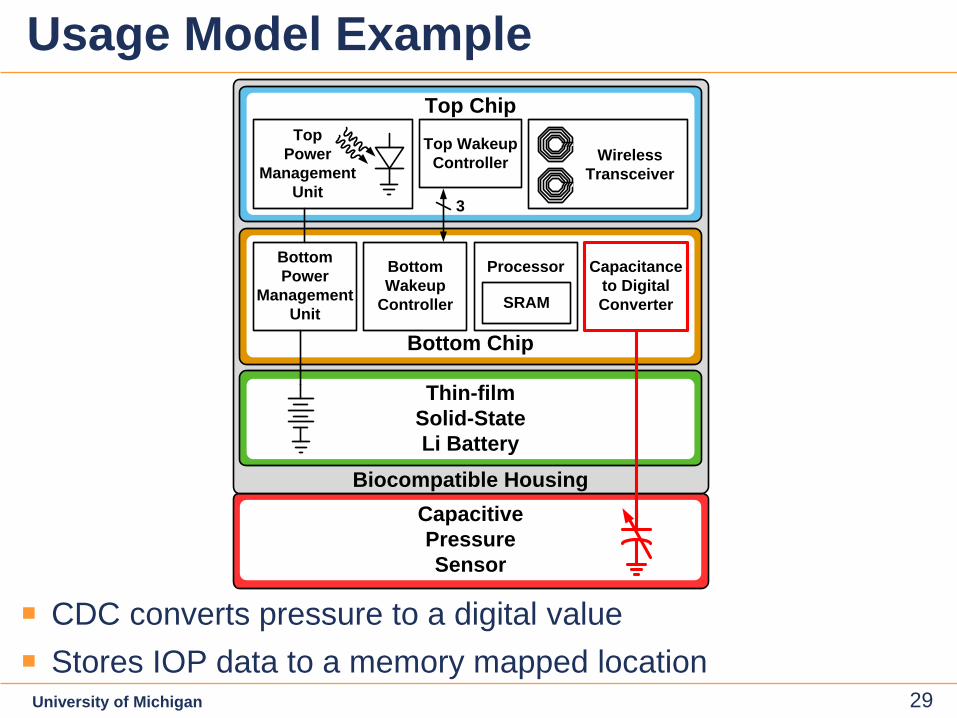
Usage Model Example
CDC converts pressure to a digital value Stores IOP data to a memory mapped location
Thin-filmSolid-StateLi Battery
CapacitivePressureSensor
Top Chip
3
Top Power
Management Unit
WirelessTransceiver
BottomPower
Management Unit
Bottom Chip
Bottom Wakeup
Controller
Processor Capacitance to Digital ConverterSRAM
Top WakeupController
Biocompatible Housing
30 30
30
University of Michigan 30
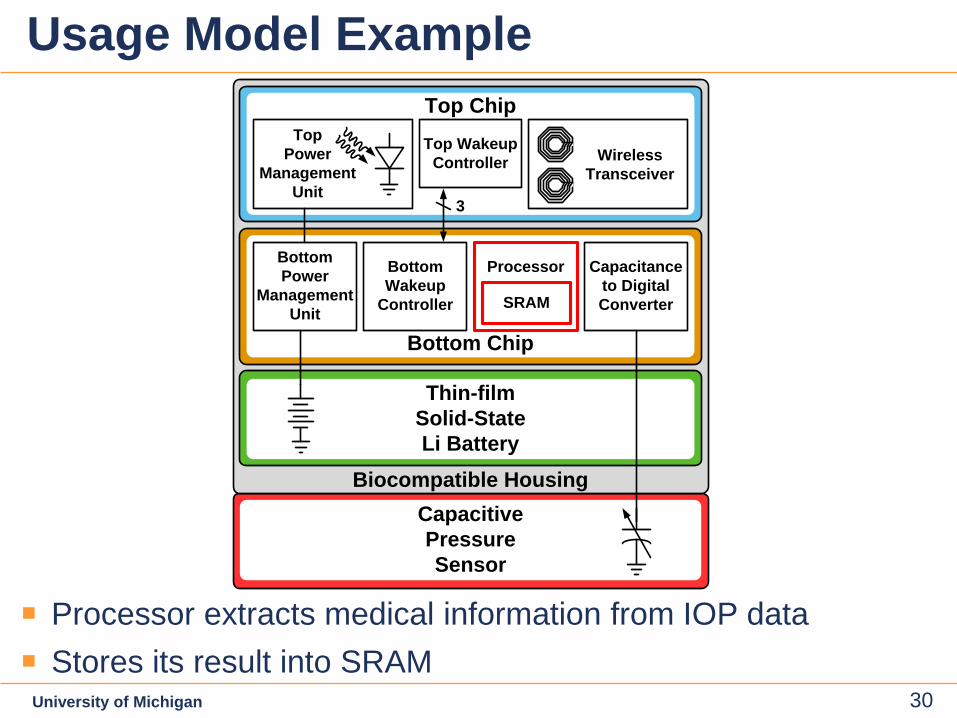
Usage Model Example
Processor extracts medical information from IOP data Stores its result into SRAM
Thin-filmSolid-StateLi Battery
CapacitivePressureSensor
Top Chip
3
Top Power
Management Unit
WirelessTransceiver
BottomPower
Management Unit
Bottom Chip
Bottom Wakeup
Controller
Processor Capacitance to Digital ConverterSRAM
Top WakeupController
Biocompatible Housing
31 31
31
University of Michigan 31
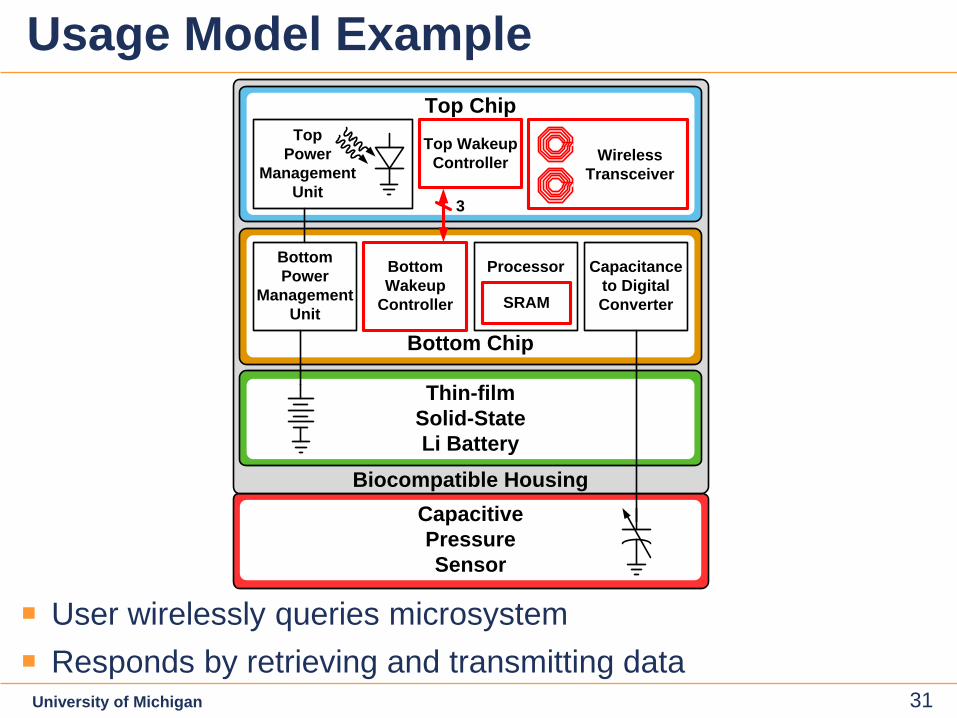
Usage Model Example
User wirelessly queries microsystem Responds by retrieving and transmitting data
Thin-filmSolid-StateLi Battery
CapacitivePressureSensor
Top Chip
3
Top Power
Management Unit
WirelessTransceiver
BottomPower
Management Unit
Bottom Chip
Bottom Wakeup
Controller
Processor Capacitance to Digital ConverterSRAM
Top WakeupController
Biocompatible Housing
32 32
32
University of Michigan 32
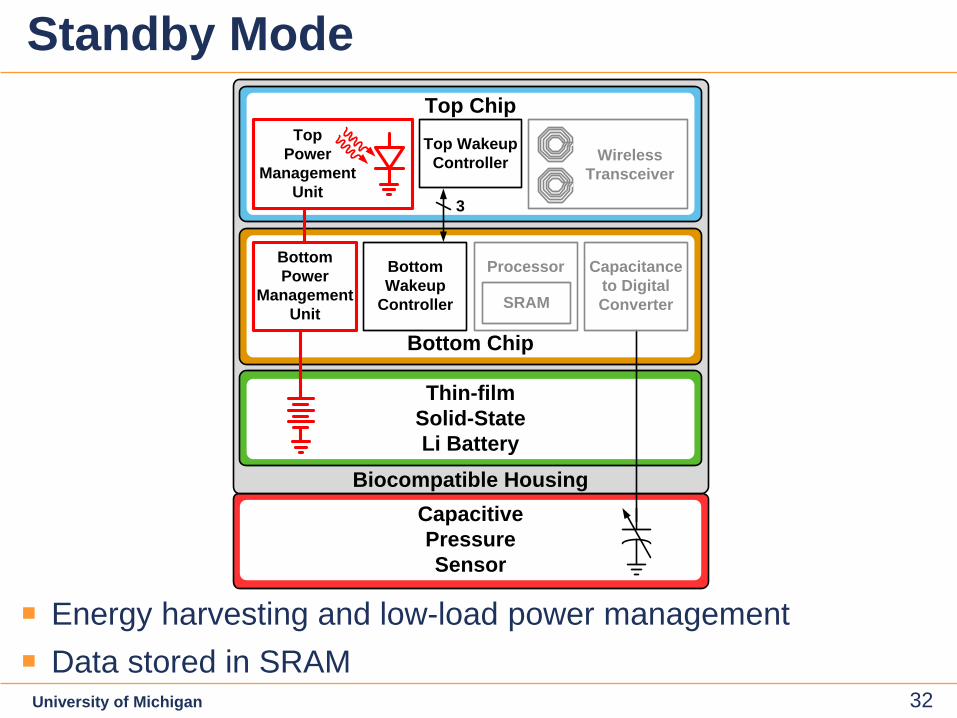
Standby Mode
Energy harvesting and low-load power management Data stored in SRAM
Thin-filmSolid-StateLi Battery
CapacitivePressureSensor
Top Chip
3
Top Power
Management Unit
WirelessTransceiver
BottomPower
Management Unit
Bottom Chip
Bottom Wakeup
Controller
Processor Capacitance to Digital ConverterSRAM
Top WakeupController
Biocompatible Housing
33 33
33
University of Michigan 33
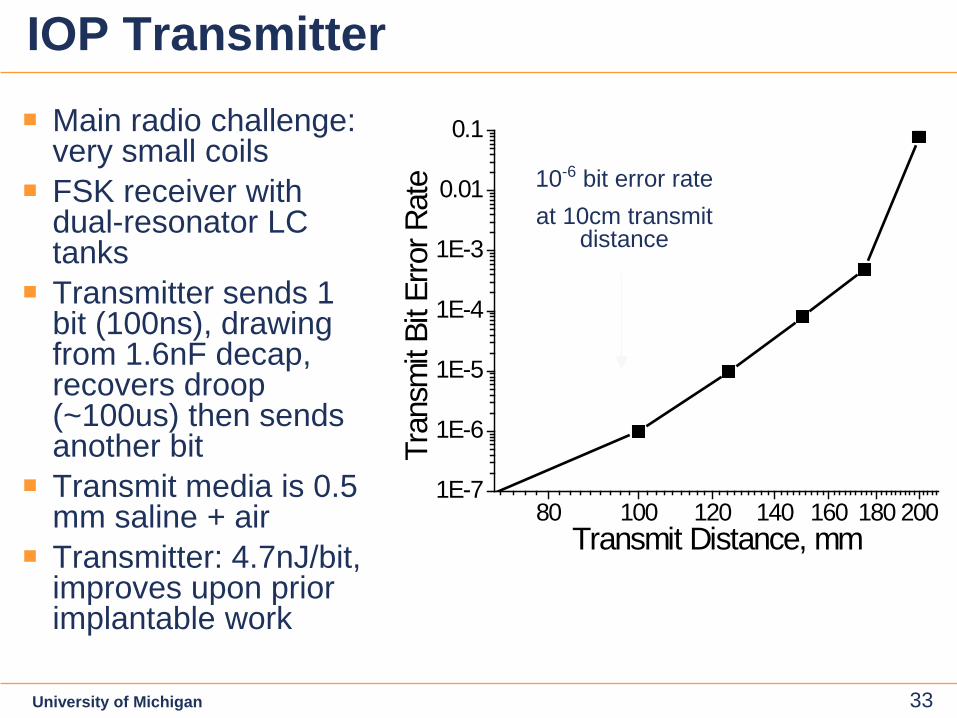
IOP Transmitter
80 100 120 140 160 180 2001E-7
1E-6
1E-5
1E-4
1E-3
0.01
0.1
Tran
smit
Bit E
rror R
ate
Transmit Distance, mm
Main radio challenge: very small coils FSK receiver with
dual-resonator LC tanks Transmitter sends 1
bit (100ns), drawing from 1.6nF decap, recovers droop (~100us) then sends another bit Transmit media is 0.5
mm saline + air Transmitter: 4.7nJ/bit,
improves upon prior implantable work
10-6 bit error rate at 10cm transmit
distance
34 34
34
University of Michigan 34
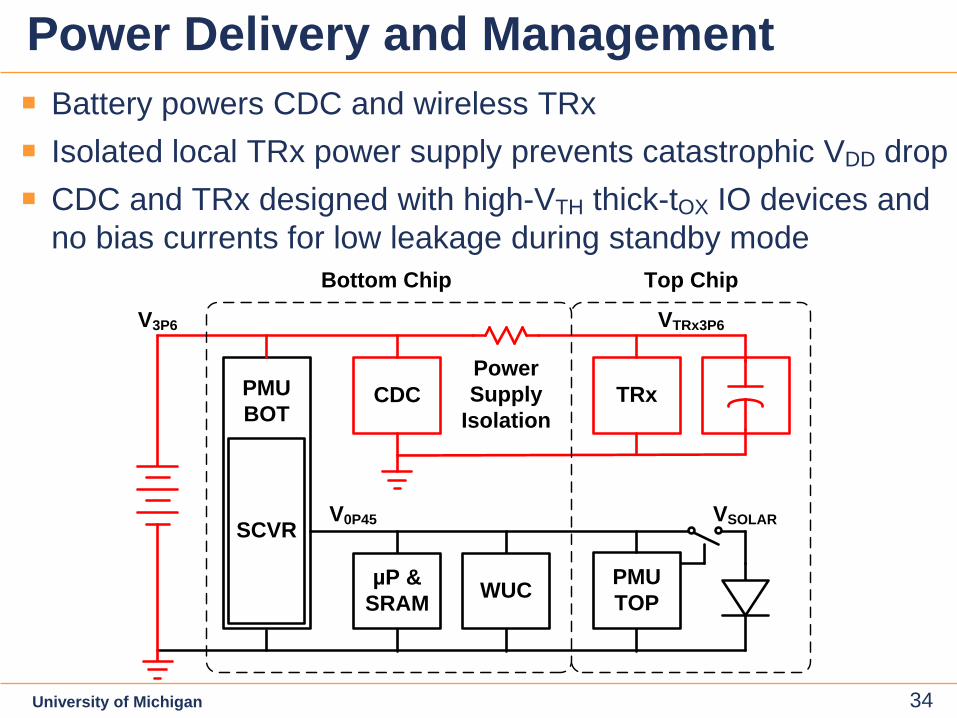
Power Delivery and Management Battery powers CDC and wireless TRx Isolated local TRx power supply prevents catastrophic VDD drop CDC and TRx designed with high-VTH thick-tOX IO devices and
no bias currents for low leakage during standby mode
VSOLARV0P45
µP &SRAM WUC
CDC TRx
V3P6
PMUBOT
SCVR
PMU TOP
Bottom Chip Top Chip
PowerSupply
Isolation
VTRx3P6
35 35
35
University of Michigan 35
VSOLARV0P45
µP &SRAM WUC
CDC TRx
V3P6
PMUBOT
SCVR
PMU TOP
Bottom Chip Top Chip
PowerSupply
Isolation
VTRx3P6
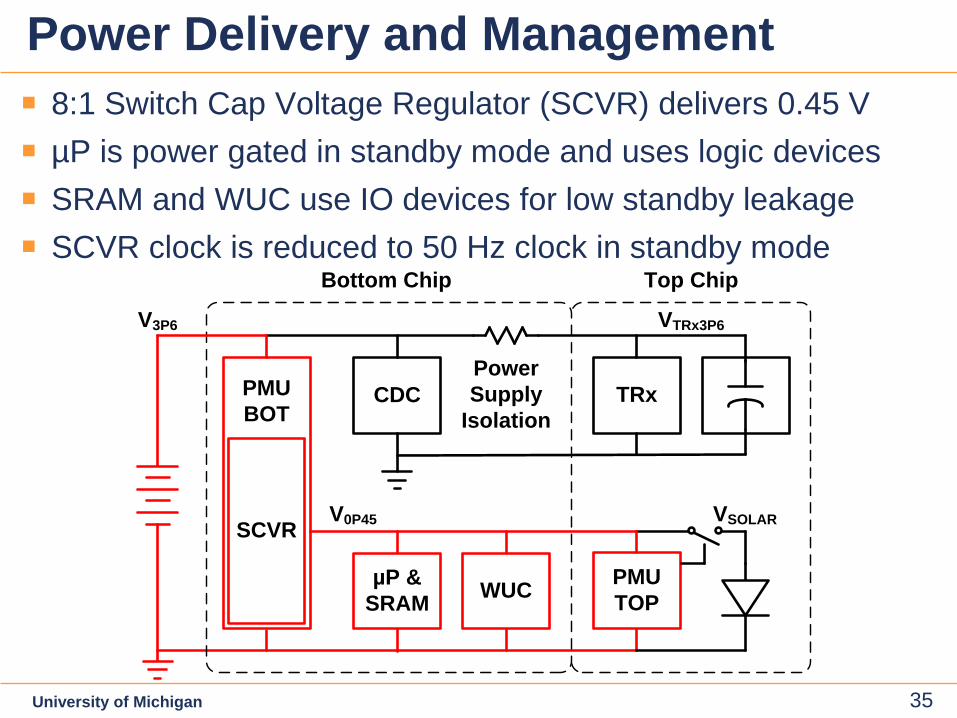
Power Delivery and Management 8:1 Switch Cap Voltage Regulator (SCVR) delivers 0.45 V µP is power gated in standby mode and uses logic devices SRAM and WUC use IO devices for low standby leakage SCVR clock is reduced to 50 Hz clock in standby mode
36 36
36
University of Michigan 36
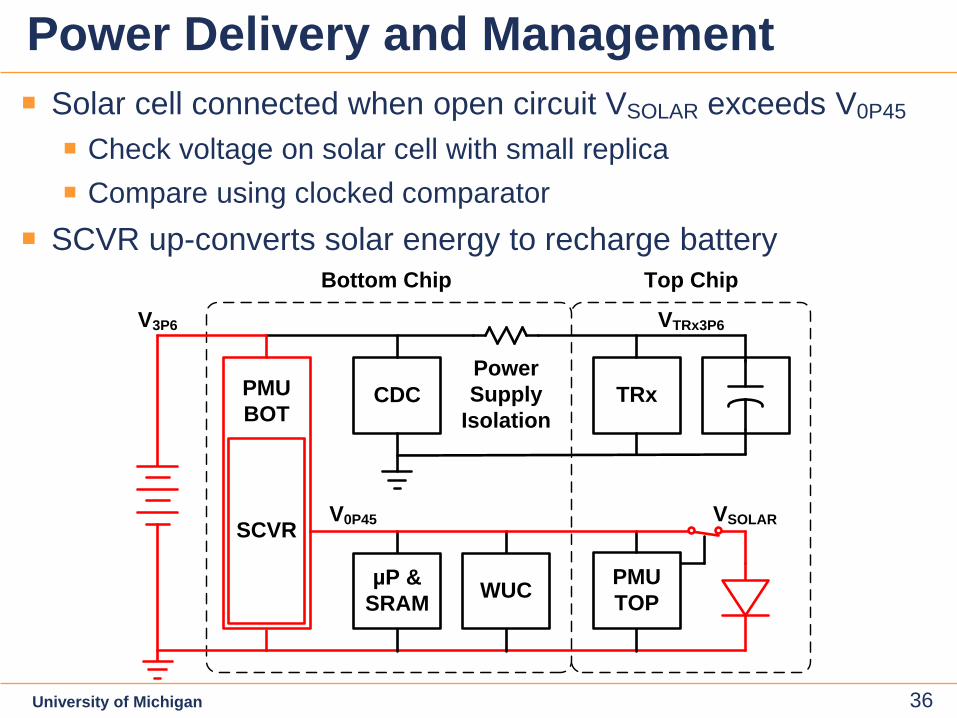
Power Delivery and Management Solar cell connected when open circuit VSOLAR exceeds V0P45
Check voltage on solar cell with small replica Compare using clocked comparator
SCVR up-converts solar energy to recharge battery
VSOLARV0P45
µP &SRAM WUC
CDC TRx
V3P6
PMUBOT
SCVR
PMU TOP
Bottom Chip Top Chip
PowerSupply
Isolation
VTRx3P6
37 37
37
University of Michigan 37
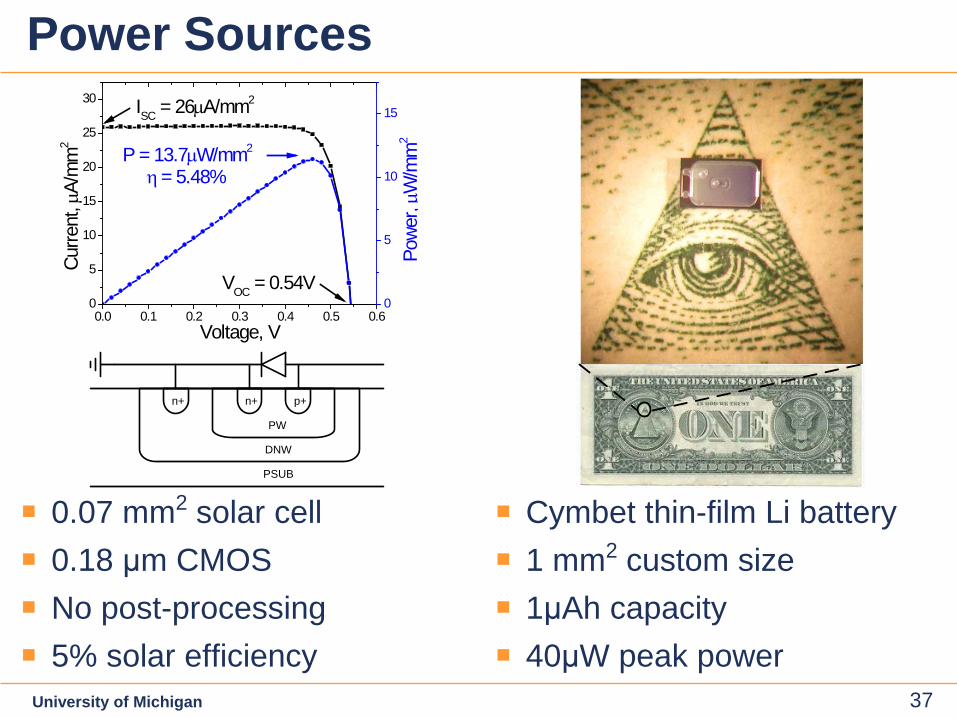
Power Sources
0.07 mm2 solar cell 0.18 μm CMOS No post-processing 5% solar efficiency
Cymbet thin-film Li battery 1 mm2 custom size 1μAh capacity 40μW peak power
PSUB
p+n+n+
DNW
PW
0.0 0.1 0.2 0.3 0.4 0.5 0.60
5
10
15
20
25
30
P = 13.7µW/mm2
η = 5.48%
VOC = 0.54V
Voltage, V
Curre
nt, µ
A/m
m2
ISC = 26µA/mm2
0
5
10
15
Powe
r, µW
/mm
2
38 38
38
University of Michigan 38
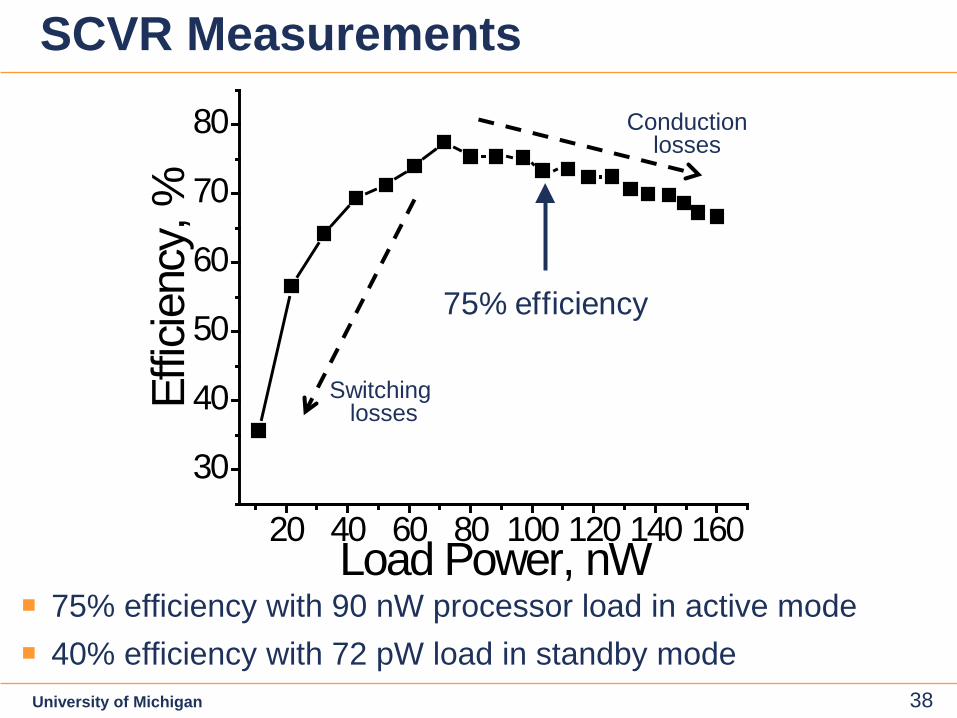
SCVR Measurements
75% efficiency with 90 nW processor load in active mode 40% efficiency with 72 pW load in standby mode
20 40 60 80 100 120 140 160
30
40
50
60
70
80Ef
ficie
ncy,
%
Load Power, nW
75% efficiency
Switching losses
Conduction losses
39 39
39
University of Michigan 39
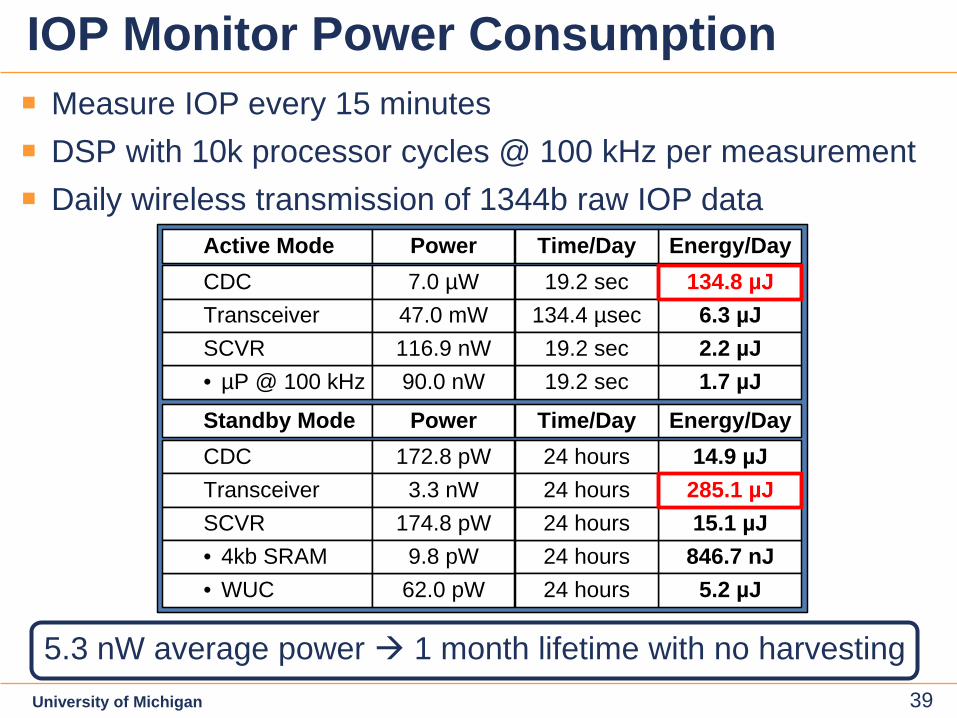
Active Mode PowerCDC 7.0 µWTransceiver 47.0 mW
• µP @ 100 kHz 90.0 nW
Energy/Day
6.3 µJ
1.7 µJSCVR 116.9 nW 2.2 µJ
Standby Mode PowerCDC 172.8 pWTransceiver 3.3 nW
• WUC 62.0 pW
SCVR 174.8 pW• 4kb SRAM 9.8 pW
Energy/Day14.9 µJ
846.7 nJ15.1 µJ
5.2 µJ
Time/Day19.2 sec
134.4 µsec
19.2 sec19.2 sec
Time/Day24 hours24 hours
24 hours24 hours
24 hours
134.8 µJ
285.1 µJ
IOP Monitor Power Consumption Measure IOP every 15 minutes DSP with 10k processor cycles @ 100 kHz per measurement Daily wireless transmission of 1344b raw IOP data
5.3 nW average power 1 month lifetime with no harvesting
40 40
40
University of Michigan 40
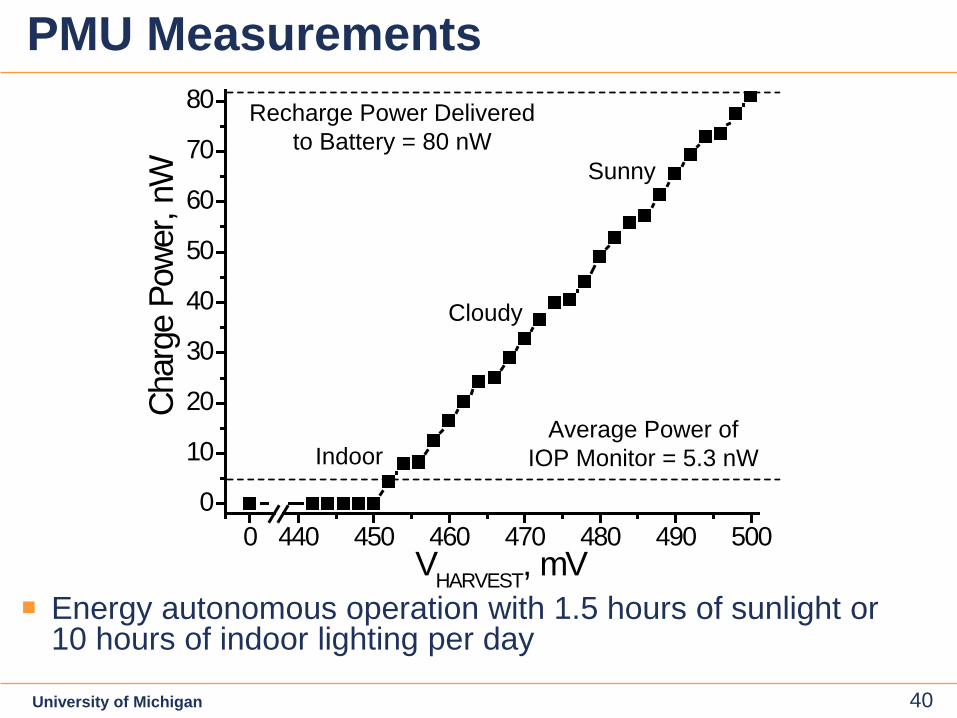
PMU Measurements
Energy autonomous operation with 1.5 hours of sunlight or 10 hours of indoor lighting per day
0 440 450 460 470 480 490 5000
10
20
30
40
50
60
70
80
Char
ge P
ower
, nW
VHARVEST, mV
IndoorAverage Power of
IOP Monitor = 5.3 nW
Sunny
Cloudy
Recharge Power Delivered to Battery = 80 nW
41 41
41
University of Michigan 41
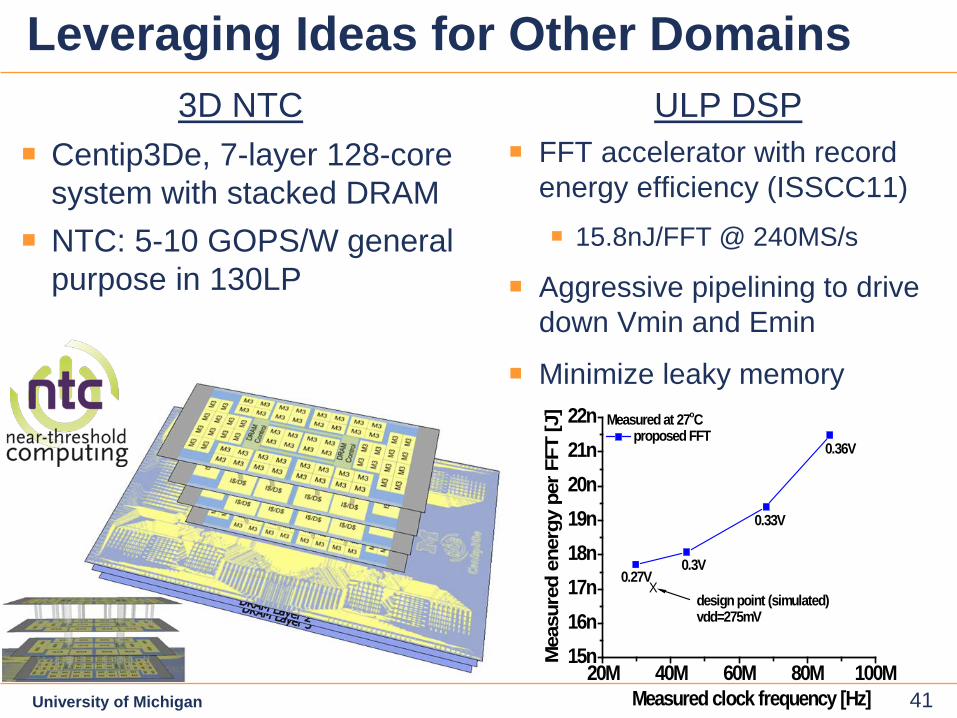
Leveraging Ideas for Other Domains 3D NTC
Centip3De, 7-layer 128-core system with stacked DRAM NTC: 5-10 GOPS/W general
purpose in 130LP
ULP DSP FFT accelerator with record
energy efficiency (ISSCC11)
15.8nJ/FFT @ 240MS/s
Aggressive pipelining to drive down Vmin and Emin
Minimize leaky memory
20M 40M 60M 80M 100M15n16n17n18n19n20n21n22n
0.36V
0.33V
0.3VM
easu
red
ener
gy p
er F
FT [J
]
Measured clock frequency [Hz]
Measured at 27oC proposed FFT
0.27Vdesign point (simulated)vdd=275mV
X
42 42
42
University of Michigan 42
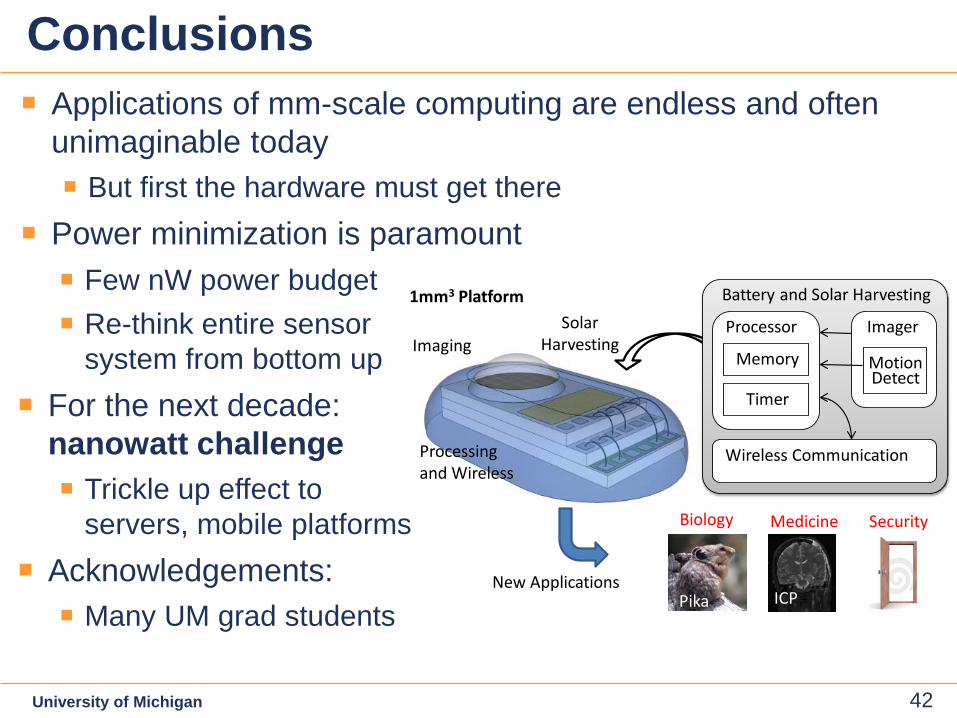
1mm3 Platform
Battery and Solar Harvesting
Processor
Memory
Timer
MotionDetect
Imager
Wireless Communication
ImagingSolar
Harvesting
Processingand Wireless
New Applications
Biology
Pika
Medicine
ICP
Security
Conclusions Applications of mm-scale computing are endless and often
unimaginable today But first the hardware must get there
Power minimization is paramount Few nW power budget Re-think entire sensor
system from bottom up
For the next decade: nanowatt challenge Trickle up effect to
servers, mobile platforms
Acknowledgements: Many UM grad students